Embed Size (px)
Citation preview
Massachusetts 2011 Air Quality Report
Department of Environmental ProtectionBureau of Waste Prevention
Division of Planning and Evaluation
Air Assessment BranchWall Experiment Station
37 Shattuck StreetLawrence, Massachusetts 01843
August 2012
ACKNOWLEDGEMENTS
This 2011Air Quality Report was prepared by the Massachusetts Department of Environmental Protection (MassDEP), Air Assessment Branch (AAB), which collects representative samples of ambient air for a number of pollutants at monitoring stations located throughout the Commonwealth. All samples are collected in a precise and scientifically sound manner in order to properly characterize the quality of the air in the state and to accurately assess the exposure of its citizens to airborne pollutants.
The following MassDEP AAB staff are acknowledged for their efforts in the operation and maintenance of air monitoring equipment and stations: Beena Chandy, Leslie Collyer, Diana Conti, Mark Ducomb, Kevin Dufour, Charlene Flynn, John Flynn, Frank Fothergill, Jose Kemperman, Mark Lally, John Lane, Dave Madden, Nicole Mercer, Kelly Michael, Iva Nesin, Jenmina Ojuka, Jenny Peet, Tony Pikul, Lisa Shore, Kathy E.Webber and Bradley Webber.
The following MassDEP staff contributed to the publication of this report: Glenn Keith, Thomas McGrath and Ann Sorensen.
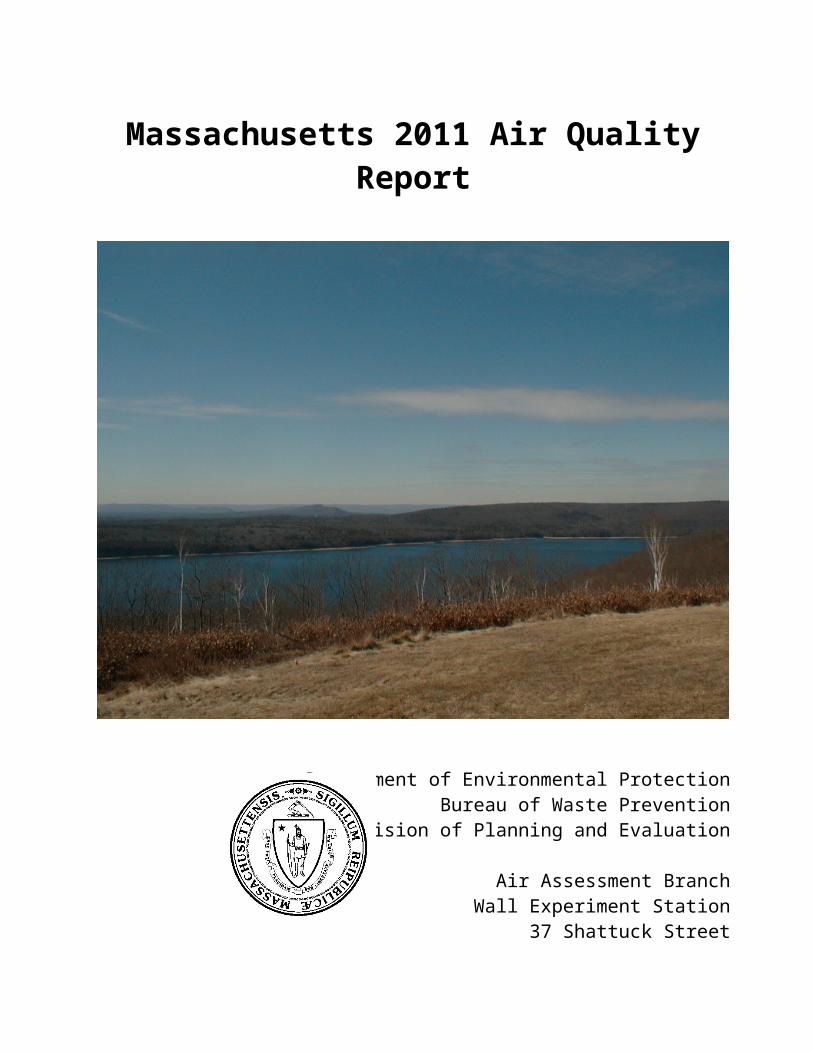
The photo on the cover is a view of the Quabbin Reservoir from the Ware monitoring station.
This report is available on MassDEP’s web site at www.mass.gov/dep/air/priorities/aqreports.htm
Questions about this report may be directed to:Thomas McGrath
Air Assessment BranchWall Experiment Station
Lawrence, MA 01843-1343(978) 975-1138
email: [email protected]
TABLE OF CONTENTS
LIST OF FIGURES...................................................................................................................ii
LIST OF ABBREVIATIONS..................................................................................................iii
SECTION I – AMBIENT AIR MONITORING PROGRAMProgram Overview.....................................................................................................................1National Ambient Air Quality Standards...................................................................................4Pollutant Health Effects and Sources.........................................................................................5Monitoring Network Description...............................................................................................7
SECTION II – ATTAINMENT AND EXCEEDANCES OF AIR QUALITY STANDARDSAttainment Status Summary......................................................................................................9Ozone Exceedances.................................................................................................................11Daily Ozone and PM Forecast.................................................................................................14
SECTION III – MASSACHUSETTS AIR QUALITY DATA SUMMARIESOzone Summary.......................................................................................................................15Sulfur Dioxide (SO2) Summary...............................................................................................18Nitrogen Dioxide (NO2) Summary..........................................................................................20Carbon Monoxide (CO) Summary...........................................................................................22Particulate Matter 10 Microns (PM10) Summary.....................................................................24Particulate Matter 2.5 Microns (PM2.5) Summary....................................................................26Lead (Pb) Summary.................................................................................................................29Private Monitoring Summary..................................................................................................30Quality Control and Quality Assurance...................................................................................32
SECTION IV – PAMS/AIR TOXICS MONITORINGPAMS Monitoring...................................................................................................................33Air Toxics Monitoring.............................................................................................................34
APPENDIX A – 2011 Monitoring Station Locations..............................................................36
i
List of Figures
Section II – Attainment and Exceedances of Air Quality Standards
Figure 1 1-hour Ozone Exceedance Days and Total Exceedances 1987-2011................................13Figure 2 8-hour Ozone Exceedance Days and Total Exceedances 1987-2011................................13
Section III – Massachusetts Air Quality Data Summaries
Figure 3 8-hour Ozone Exceedance Day Trends..............................................................................17Figure 4 Sulfur Dioxide Trends 1985-2011.....................................................................................19Figure 5 Nitrogen Dioxide Trends 1985-2011.................................................................................21Figure 6 Carbon Monoxide Trends 1985-2011................................................................................23Figure 7 Particulate Matter 10 Microns (PM10) Trends 1989-2011.................................................25Figure 8 Particulate Matter 2.5 Microns (PM2.5) Trends 2004-2011................................................26
Section IV – PAMS/Air Toxics Monitoring
Figure 9 Lynn Toxics VOC Summary 1994-2011...........................................................................35
ii

List of Abbreviations AAB................Air Assessment BranchAQS................Air Quality SystemAQI…….…....Air Quality IndexBAM...............Beta Attenuation MonitorBC...................Black CarbonBP...................Barometric PressureCAA................Clean Air ActCFR................Code of Federal RegulationsCO..................Carbon MonoxideCO2.................Carbon DioxideFEM................Federal Equivalent MethodFRM................Federal Reference MethodEPA................United States Environmental Protection AgencyIMPROVE .....Interagency Monitoring of Protected Visual EnvironmentsMassDEP........Massachusetts Department of Environmental ProtectionNAAQS..........National Ambient Air Quality Standards (for criteria pollutants)NATTS...........National Air Toxics Trends StationNCore………..National Core Monitoring NetworkNO..................Nitric OxideNOx.................Nitrogen OxidesNOy.................Total Reactive Oxidized NitrogenNO2.................Nitrogen DioxideNO3.................NitrateO3....................OzonePAH................Polycyclic Aromatic HydrocarbonPAMS.............Photochemical Assessment Monitoring StationsPb....................LeadpH...................Concentration of hydrogen cations (H+) in solution (an indicator of acidity)ppb..................parts per billion by volumeppm.................parts per million by volumePM2.5...............Particulate matter ≤ 2.5 microns aerodynamic diameterPM10................Particulate matter ≤ 10 microns aerodynamic diameterQA/QC............Quality Assurance and Quality ControlRASS..............Radio Acoustic Sounding SystemRH..................Relative HumiditySIP..................State Implementation PlanSO2..................Sulfur DioxideSO4..................SulfateSolar Rad…....Solar RadiationSVOC……….Semi-Volatile Organic CompoundsTSP.................Total Suspended Particulatesug/m3...............micrograms per cubic meterVOCs..............Volatile Organic CompoundsWS/WD..........Wind Speed/Wind Direction
iii
Section IAmbient Air Monitoring Program
Program Overview
Introduction
The Massachusetts Department of Environmental Protection (MassDEP) is the state agency responsible for monitoring outdoor air quality in Massachusetts and developing regulatory programs to reduce emissions of pollutants that adversely affect public health, welfare, and the environment.
MassDEP’s Air Assessment Branch (AAB) operates an extensive network of air monitoring stations throughout the Commonwealth. During 2011, MassDEP operated a network of 28 monitoring stations located in 20 cities and towns, and oversaw the operation of four source-oriented privately funded monitors in the Boston area. MassDEP also received data from the Wampanoag Tribe of Gay Head (Aquinnah), which operates an air monitoring station on Martha’s Vineyard, and from the U.S. Environmental Protection Agency, Region I Laboratory, which operates an air monitoring station in Chelmsford.
MassDEP submits all ambient air quality data to the national Air Quality System (AQS) database that is administered by the U.S. Environmental Protection Agency (EPA). In addition, MassDEP MassAir Online website allows users to point and click on a map of the state to find current, near real-time air quality data for any location in the MassDEP air monitoring network that has a continuous air monitor. MassAir Online is found at www.mass.gov/dep/air/index.htm
Why is Air Quality Data Collected?Ambient air quality data is used for a number of purposes, including to:
Provide information about air quality to the public; Provide short-term and long-term information regarding air pollution and public health; Verify compliance with National Ambient Air Quality Standards; Assess the effectiveness of current air pollution control regulations and initiatives; Support development of policies and regulations aimed at reducing air pollution; Support long-term trend analysis and special research; and Fulfill requirements to report ambient air quality data to EPA.
What is Monitored?MassDEP monitors parameters in the following categories:
Criteria pollutants are subject to National Ambient Air Quality Standards (NAAQS). The criteria pollutants monitored are:
sulfur dioxide (SO2) ozone (O3) carbon monoxide (CO) nitrogen dioxide (NO2) lead (Pb) particulate matter ≤10 microns (PM10) particulate matter ≤ 2.5 microns (PM2.5)
1

Non-criteria pollutants do not have National Ambient Air Quality Standards, but can contribute to the formation of ozone and particulate matter and/or be toxic. The non-criteria pollutants monitored include:
nitric oxide (NO) total nitrogen oxides (NOx) total reactive oxidized nitrogen (NOy) total suspended particulates (TSP) volatile organic compounds (VOCs) – ozone precursors and reaction product chemicals black carbon (i.e., soot) toxics – health-relevant VOCs, semi-volatile organic compounds (SVOCs), carbonyls and
metals
Meteorological parameters monitored include: wind speed/wind direction (WS/WD) relative humidity (RH) temperature (TEMP) barometric pressure (BP) solar radiation (Solar Rad) upper air wind and temperature (Profiler) total B band ultraviolet radiation (UVB) precipitation (PRECIP)
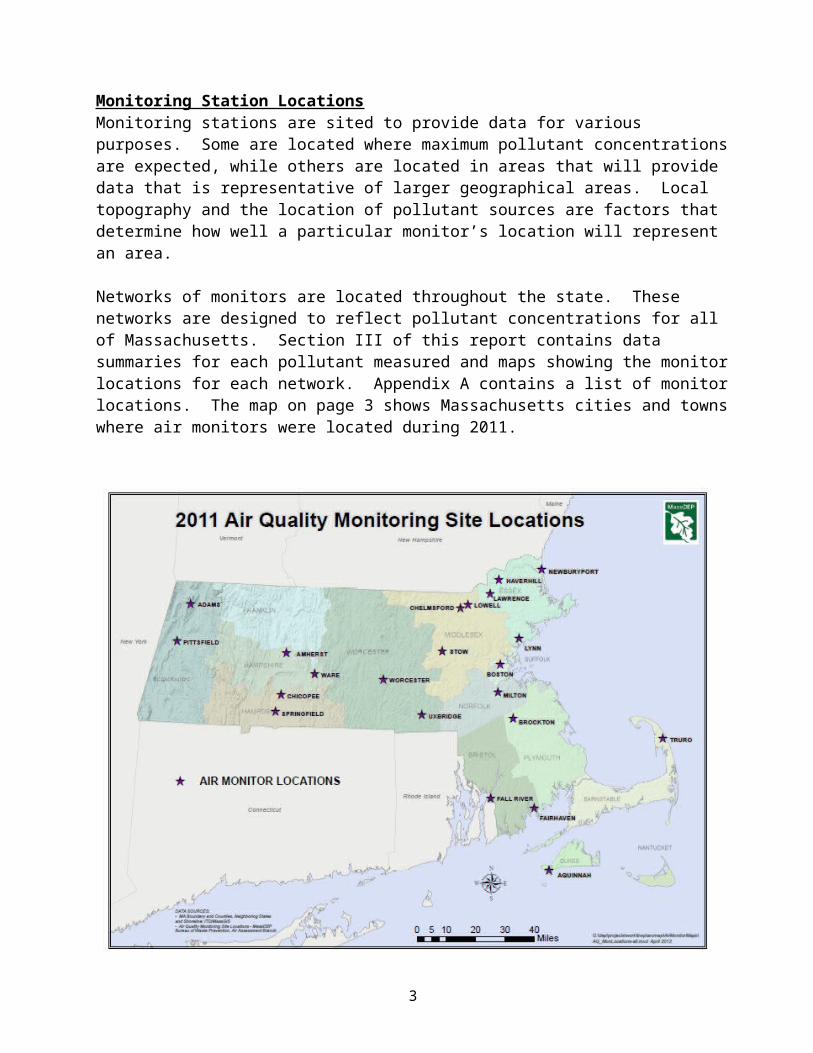
Monitoring Station LocationsMonitoring stations are sited to provide data for various purposes. Some are located where maximum pollutant concentrations are expected, while others are located in areas that will provide data that is representative of larger geographical areas. Local topography and the location of pollutant sources are factors that determine how well a particular monitor’s location will represent an area.
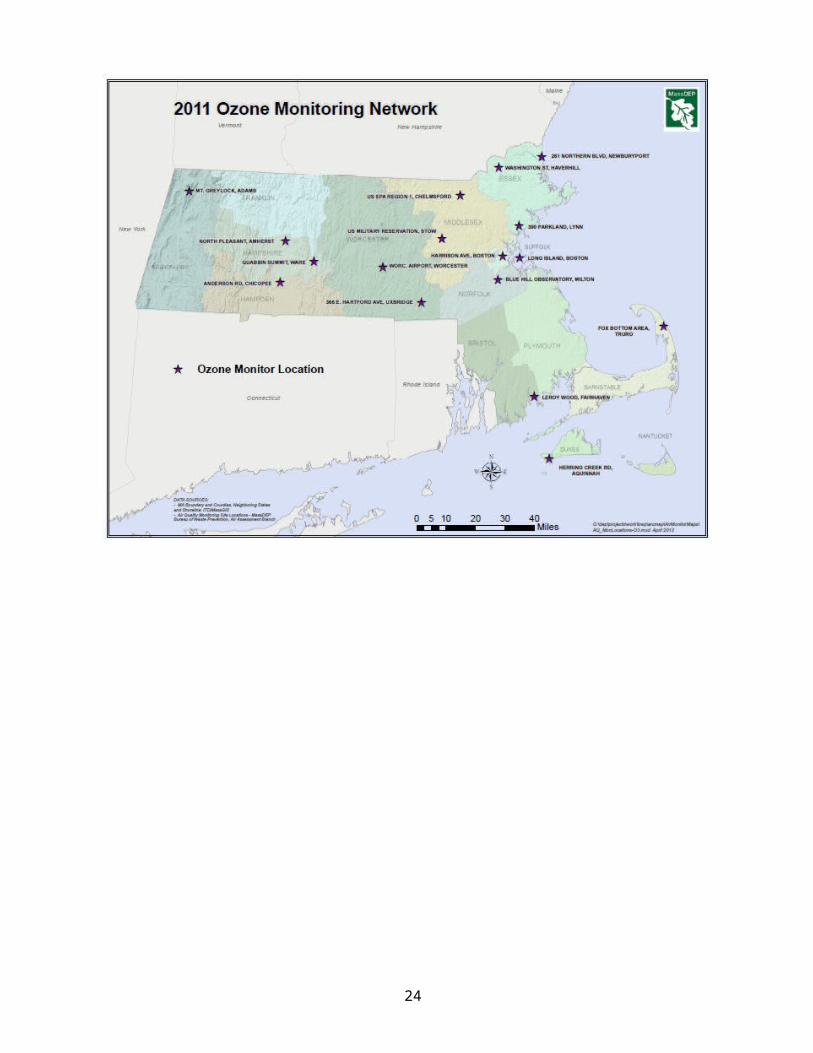
Networks of monitors are located throughout the state. These networks are designed to reflect pollutant concentrations for all of Massachusetts. Section III of this report contains data summaries for each pollutant measured and maps showing the monitor locations for each network. Appendix A contains a list of monitor locations. The map on page 3 shows Massachusetts cities and towns where air monitors were located during 2011.
2
3

National Ambient Air Quality Standards
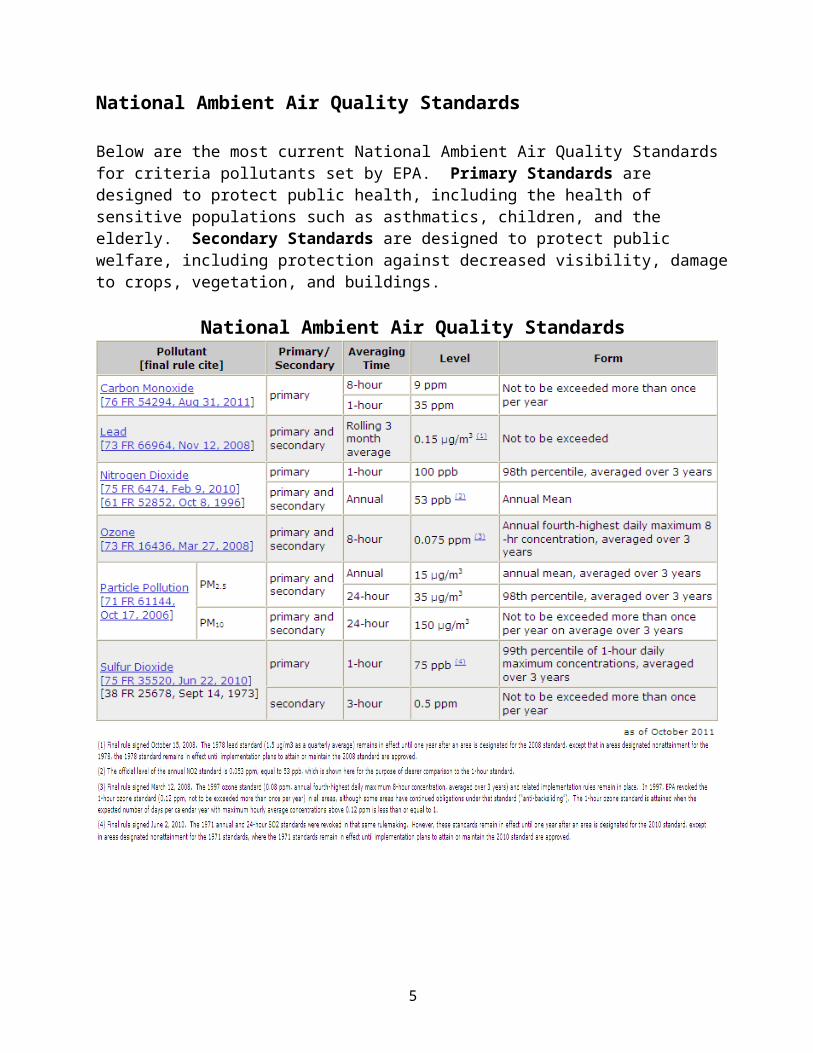
Below are the most current National Ambient Air Quality Standards for criteria pollutants set by EPA. Primary Standards are designed to protect public health, including the health of sensitive populations such as asthmatics, children, and the elderly. Secondary Standards are designed to protect public welfare, including protection against decreased visibility, damage to crops, vegetation, and buildings.
National Ambient Air Quality Standards
4
Pollutant Health Effects and Sources
Ozone (O3)
Ground-level, or Tropospheric O3 and Stratospheric O3 in the upper atmosphere are the same chemical compound, just found at different places in the atmosphere. Stratospheric O3 found at greater than 30,000 feet above the surface of the earth is beneficial to all life because it filters out the sun’s harmful UV radiation before it reaches the earth’s surface. Ground-Level O3 on the other hand is a health and environmental problem. This report pertains exclusively to ground-level O3.
O3 is a respiratory irritant and can reduce lung function and cause asthma attacks, nasal congestion, and throat irritation, and reduce resistance to infection. It can inflame and damage (possibly permanently) cells that line the lungs, and aggravate chronic lung diseases. In addition, a number of studies have found a strong link between increases in ground-level O3
and increased risk of premature death. O3 is toxic to vegetation, inhibiting growth and causing leaf damage. O3 deteriorates materials such as rubber and fabrics. Ground-level O3 is unique in that it is formed by the reactions that occur between certain
pollutants in the presence of intense, high-energy sunlight during the hot summer months. The complexity of the reactions and the amount of time needed to complete these reactions can result in the buildup of ground-level ozone concentrations far downwind from the original source of the precursors.
Sources of ground-level O3 precursors, i.e., nitrogen oxides and hydrocarbons, include motor vehicles, lawn and garden equipment, power plants and other industrial sources.
Carbon Monoxide (CO)
CO binds with hemoglobin in the blood, reducing the amount of oxygen carried to organs and tissues.
Symptoms of high CO exposure include shortness of breath, chest pain, headaches, confusion, and loss of coordination. The health threat is most severe for those with cardiovascular disease.
Motor vehicle emissions are the largest source of CO, which is produced from incomplete combustion of carbon in fuels.
Industrial processes and non-transportation fuel combustion (e.g., boilers, lawn and garden equipment) also are sources of CO.
Sulfur Dioxide (SO2)
SO2 combines with water vapor to form acidic aerosols harmful to the respiratory tract, aggravating symptoms associated with lung diseases such as asthma and bronchitis.
SO2 is a primary contributor to acid deposition. Impacts of acid deposition include: acidification of lakes and streams, damage to vegetation, damage to materials, and diminution of visibility.
SO2 is a product of fuel combustion (e.g., the burning of coal and oil that contains sulfur ). Sources include power plants and business and residential sources burning heating oil.
5
Nitrogen Dioxide (NO2)
NO2 lowers resistance to respiratory infections and aggravates symptoms associated with asthma and bronchitis.
NO2 contributes to acid deposition. Impacts of acid deposition include: acidification of lakes and streams, damage to vegetation, damage to materials, and diminution of visibility.
NO2 and NO contribute to the formation of ozone. NO2 is formed from the oxidation of nitric oxide (NO). Major sources of NO are fuel
combustion, space heating, power plants and motor vehicles.
Particulate Matter (PM10 and PM2.5)
Particulate matter is tiny airborne particles or aerosols, which include dust, dirt, soot, smoke, and liquid droplets. Fine particulate matter (mostly below 2.5 microns in size) are not only the result of direct emissions, but can be formed in the atmosphere by chemical reactions involving gaseous pollutants.
The numbers 2.5 and 10 refer to the particle size (actually the particles equal or less than that size), measured in microns, collected by the monitors. Several thousand PM2.5 particles could fit on the period at the end of this sentence.
The small size of these particles allows easy entry into the human respiratory system. Long-term exposure causes the particles to accumulate in the lungs and affects breathing and produces respiratory symptoms. The small particles can migrate through the lungs and into the circulatory system and potentially produce cardio-vascular symptoms, as well as impacts from toxic components contained in the particulate matter.
Particulate matter causes soiling and corrosion of materials. Particulate matter contributes to atmospheric haze that degrades visibility. Sources of particulates include industrial process emissions, motor vehicles, incinerators,
power plants, and other fuel combustion sources.
Lead (Pb)
Lead is an elemental metal that is found in nature. Exposure to lead can occur by inhalation or ingestion with food, water, soil or dust particles. Children, infants, and fetuses are the most susceptible to the effects of lead exposure. Lead causes mental retardation, brain damage, and liver disease. It may be a factor in high
blood pressure and damages the nervous system. Lead enters the atmosphere from the incineration of lead containing materials and from the
manufacture and processing of lead containing products or materials like storage batteries, smelting and removal of paint that contained lead.
6
Monitoring Network Description
The following describes the ambient air monitoring network MassDEP operated in 2011.
Network Size 28 monitoring stations 20 cities and towns with monitoring stations
Number of Continuous Monitors
Continuous monitors measure air quality 24 hours per day. The data are reported as hourly means.
Criteria pollutant monitors measure pollutants for which National Ambient Air Quality Standards (NAAQS) have been set. 7 – CO (carbon monoxide), which includes 3 trace-level CO monitors 11 – NO2 (nitrogen dioxide). NO (nitric oxide) and NOx (total
nitrogen oxides) also are measured by these monitors. 15 – O3 (ozone) 6 – SO2 (sulfur dioxide), which includes 2 trace-level SO2 monitors
Meteorological monitors track weather conditions. 13 – BP (barometric pressure) 13 – RH (relative humidity) 13 – Solar Rad (solar radiation) 13 – TEMP (temperature) 13– WS/WD (wind speed/wind direction) 1 – Profiler (this monitor measures WS/WD and TEMP at various
altitudes, which aids in the analysis of pollutant transport) 1 – UVB (B Band Ultra-violet Radiation) 2 – Precipitation
Other Monitors 3 – NOy (Total Reactive Oxidized Nitrogen) 4 – PAMS (photochemical assessment monitoring station). These
monitors measure VOCs (volatile organic compounds) using automated gas chromatographs (GCs) on an hourly basis during the summer.
10 – PM2.5 (particulate matter – 2.5 microns) Beta Attenuation Monitors (BAMs)
3 – Black Carbon
7

Number of Intermittent
Monitors
Intermittent monitors take discrete samples for a specific time period. The samples are taken every day, every third day, or every sixth day. The data is averaged in 3-hour or 24-hour intervals.
Criteria pollutant monitors measure pollutants that have National Ambient Air Quality Standards (NAAQS). 2 – Pb (Lead) 7 – PM10 (particulate matter – 10 microns) 18 – PM2.5 FRM (particulate matter – 2.5 microns Federal Reference
Method)
Non-criteria pollutant monitors measure pollutants that do not have NAAQS. 4 – PAMS (photochemical assessment monitoring station). These
monitors measure VOCs (volatile organic compounds) on a less intensive schedule than during the summer months.
2 – Toxics. These monitors measure health-relevant VOCs. 2 – Speciation. These monitors measure for PM2.5, nitrates, and
organics. 1 – PM10 (particles for toxic metals)
In addition to MassDEP’s monitoring network, MassDEP oversaw four private monitoring stations located in Boston that submit data to MassDEP. Three of the stations monitored SO2, SO4, TSP and wind speed/wind direction, and each closed in May 2011. The remaining station monitors SO2, SO4, TSP, and NO2 (as well as NOx and NO) and wind speed/wind direction.
8
Section IIAttainment and Exceedances of Air Quality Standards
Attainment Status Summary
The Clean Air Act (CAA) contains timeframes and milestones for states to meet and maintain National Ambient Air Quality Standards (NAAQS) for criteria pollutants. EPA sets NAAQS at levels to protect public health and the environment. EPA must review each NAAQS every five years and may update the standards based on new scientific information as well as establish new monitoring requirements. Each state is required to monitor the ambient air to determine whether it meets each standard.1 If monitoring shows that the air quality does not meet a standard, the state must develop and implement pollution control strategies to attain that standard. Once air quality meets a standard, a state must develop a plan to maintain that standard while accounting for future economic and emissions growth. Taken together, these plans and control strategies constitute the State Implementation Plan (SIP).
Massachusetts was designated as nonattainment with the 1997 8-hour ozone standard of 0.08 parts per million (ppm). However, all monitors now show that Massachusetts meets the 1997 ozone standard statewide. EPA updated the 8-hour ozone standard to 0.075 ppm in 2008, and designated Massachusetts as attainment statewide except for Dukes County in 2011. Massachusetts is designated as attainment or unclassifiable for the other criteria pollutants, including carbon monoxide, lead, nitrogen dioxide, particulate matter (including PM10 and PM2.5), and sulfur dioxide.
Carbon Monoxide
Prior to the mid-1980s, Massachusetts was in violation of the CO standards. However, with the adoption of numerous control programs, CO emissions have significantly decreased. The last violation in the state of the CO standards occurred in 1986. In 2000, MassDEP formally requested that the EPA re-designate the cities of Lowell, Springfield, Waltham, and Worcester as attainment for CO since the CO monitoring data for those cities had been below the standard for many years. Those cites were the re-designated to CO attainment in April 2002, and the entire state is in attainment. In 2011, EPA established new near-road monitoring requirements for CO beginning in January 2015.
Lead
In October 2008, EPA lowered the lead standard from 1.5 ug/m³ to 0.15 ug/m³ averagedover a rolling 3-month period and established new monitoring requirements. In October 2009, Massachusetts recommended to EPA that Suffolk County be designated in attainment of the 2008 lead standard based on historic lead monitoring in Boston showing levels below the new standard, and that the remainder of the state be designated unclassifiable (since there were no lead monitors outside of Boston). In November 2011, EPA designated all of Massachusetts as unclassifiable/ attainment for the 2008 standard. In January 2011, MassDEP began monitoring lead in Boston (Harrison Avenue) in accordance with the new monitoring requirements, and also in Springfield (Main Street). In January 2012, MassDEP also began 1 MassDEP develops an annual Ambient Air Monitoring Network Plan that describes recent and planned changes to the statewide monitoring network, available at www.mass.gov/dep/public/netplan.htm.
9

monitoring lead for a one year period at Nantucket Memorial Airport in accordance with the new monitoring requirements.
Nitrogen Dioxide
In January 2010, EPA established a new 1-hour NO2 standard of 100 parts per billion (ppb) and new near-road monitoring requirements beginning in January 2013. All eleven NO2 monitors show levels that meet the new standard, and in January 2012, EPA designated all of Massachusetts as unclassifiable/attainment. MassDEP plans to begin near-road NO2 monitoring in January 2013 in accordance with the new monitoring requirements.
Sulfur Dioxide
In June 2010, EPA established a new 1-hour SO2 standard of 75 ppb and new monitoring requirements beginning January 2013, as well as requirements to model SO2 emissions from significant sources. All six SO2 monitors show levels that meet the new standard. EPA extended by one year (until June 2013) its deadline for designating areas under the SO2 standard.
Particulate Matter
There are currently two NAAQS particulate matter standards: PM10 and PM2.5. Massachusetts has been in attainment of the PM10 standard for several years. The PM2.5 standards went into effect in 1997 and the daily PM2.5 standards were revised in 2006. Massachusetts is designated as unclassifiable/attainment for PM2.5 standards statewide. On June 14, 2012, EPA proposed to strengthen the annual PM2.5 standards, and to set a separate PM2.5 standard to improve visibility, mostly in urban areas, and also proposed updates to monitoring requirements (see http://epa.gov/airquality/particlepollution/actions.html#jun12)
Ozone
For decades, the NAAQS for ozone was based on the maximum 1-hour ozone concentration that occurred each day during the ozone monitoring season. 1-hour ozone concentrations are still tracked as an indicator but are no longer used for determining attainment.
In 1997, EPA promulgated a new 8-hour ozone standards that were designed to be more representative of exposure over time, rather than just the maximum concentration. Massachusetts is designated as nonattainment of these standards. However, ozone monitors currently show that Massachusetts meets the 1997 ozone standards statewide.
In 2008, EPA lowered the 8-hour ozone standards to 0.075 ppm. In April 2012, EPA designated Dukes County as nonattainment (marginal classification) of the 2008 ozone standards and designated the remainder of the state as unclassifiable/attainment.
10
Ozone Exceedances
What Determines an Exceedance?
An ozone exceedance occurs when monitored ozone concentrations exceed the National Ambient Air Quality Standards (NAAQS). Ozone is collected as an hourly average of continuous data which is then used to determine the highest 8-hour average value for the day. An exceedance of the 8-hour standard is an 8-hour averaged value that is greater than 0.075 ppm.
The Difference Between an Exceedance and a Violation
An ozone exceedance occurs when a monitor records ambient levels of ozone above the standard. A violation of an ozone standard (as opposed to an exceedance) is based on 3-year averages of data at each monitor, so monitoring an exceedance does not mean that a violation of the standard has occurred.
Violations of the 8-hour standard are determined using the annual 4th-highest daily maximum 8-hour ozone value at each monitor. A violation requires a 3-year average of the annual 4th-highest daily maximum 8-hour value that is greater than 0.075 ppm. In other words, the 8-hour values for each day during a year for a specific monitor are ranked from highest to lowest. Then, the 4th-highest value for 3 consecutive years is averaged. If the 3-year average is greater than 0.075 ppm, a violation of the 8-hour standard has occurred at that monitoring site.
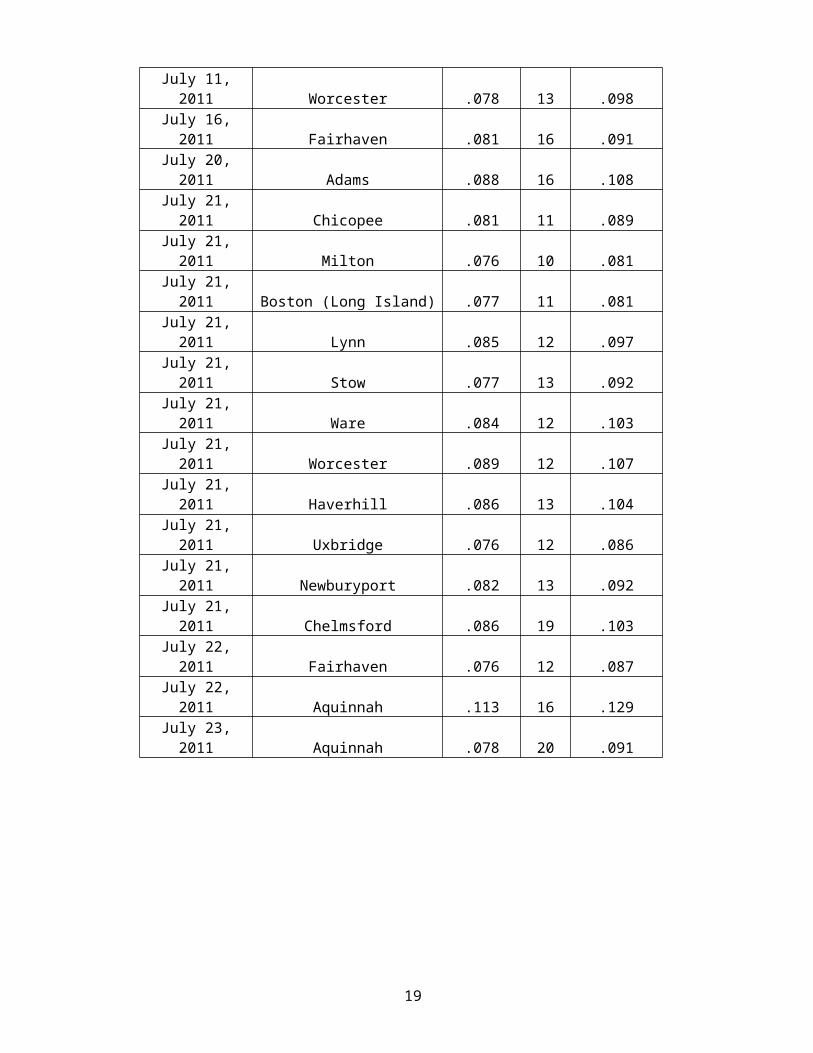
Ozone Exceedances and Violations During 2011
Exceedances
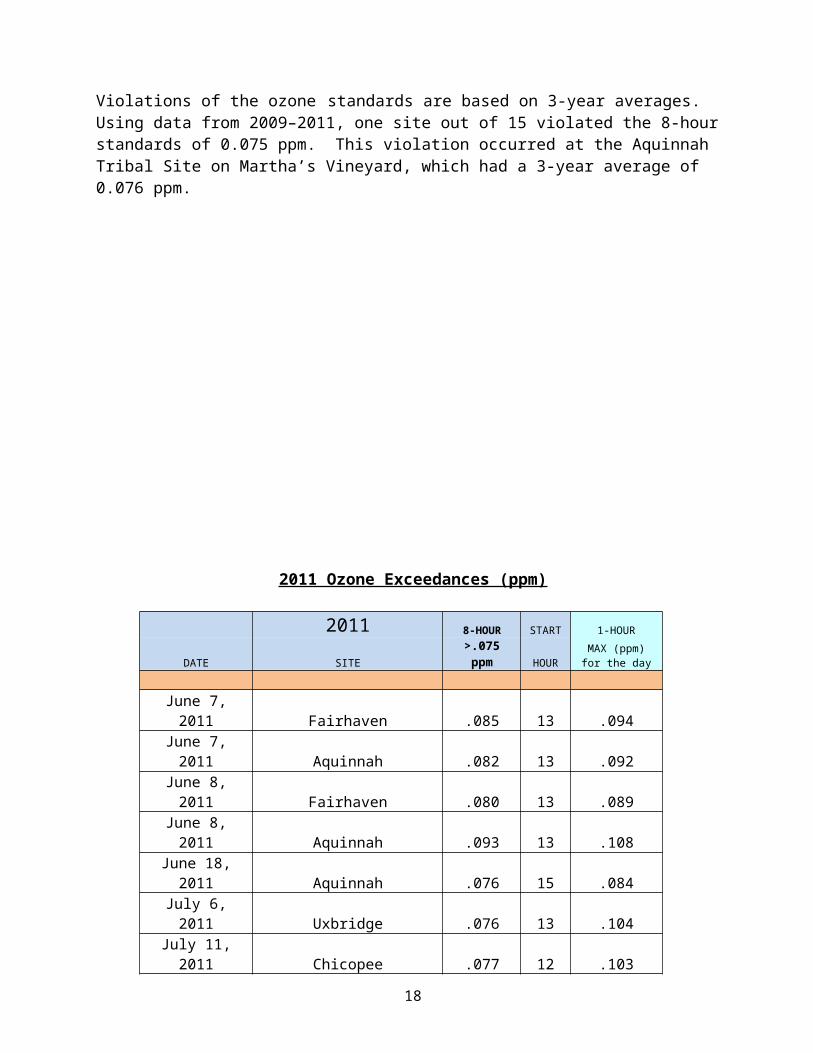
The Table below shows the 2011 ozone exceedances. There were 10 days when the 8-hour ozone
standards of 0.075 ppm were exceeded at one or more monitoring stations. There were 24 exceedances during those 10 days (i.e., multiple monitors exceeded the standards on the same day).
Violations
Violations of the ozone standards are based on 3-year averages. Using data from 2009–2011, one site out of 15 violated the 8-hour standards of 0.075 ppm. This violation occurred at the Aquinnah Tribal Site on Martha’s Vineyard, which had a 3-year average of 0.076 ppm.
11
2011 Ozone Exceedances (ppm)
2011 8-HOUR START 1-HOUR
DATE SITE >.075 ppm HOURMAX (ppm) for
the day
June 7, 2011 Fairhaven .085 13 .094June 7, 2011 Aquinnah .082 13 .092June 8, 2011 Fairhaven .080 13 .089June 8, 2011 Aquinnah .093 13 .108
June 18, 2011 Aquinnah .076 15 .084July 6, 2011 Uxbridge .076 13 .104
July 11, 2011 Chicopee .077 12 .103July 11, 2011 Worcester .078 13 .098July 16, 2011 Fairhaven .081 16 .091July 20, 2011 Adams .088 16 .108July 21, 2011 Chicopee .081 11 .089July 21, 2011 Milton .076 10 .081July 21, 2011 Boston (Long Island) .077 11 .081July 21, 2011 Lynn .085 12 .097July 21, 2011 Stow .077 13 .092July 21, 2011 Ware .084 12 .103July 21, 2011 Worcester .089 12 .107July 21, 2011 Haverhill .086 13 .104July 21, 2011 Uxbridge .076 12 .086July 21, 2011 Newburyport .082 13 .092July 21, 2011 Chelmsford .086 19 .103July 22, 2011 Fairhaven .076 12 .087July 22, 2011 Aquinnah .113 16 .129July 23, 2011 Aquinnah .078 20 .091
12
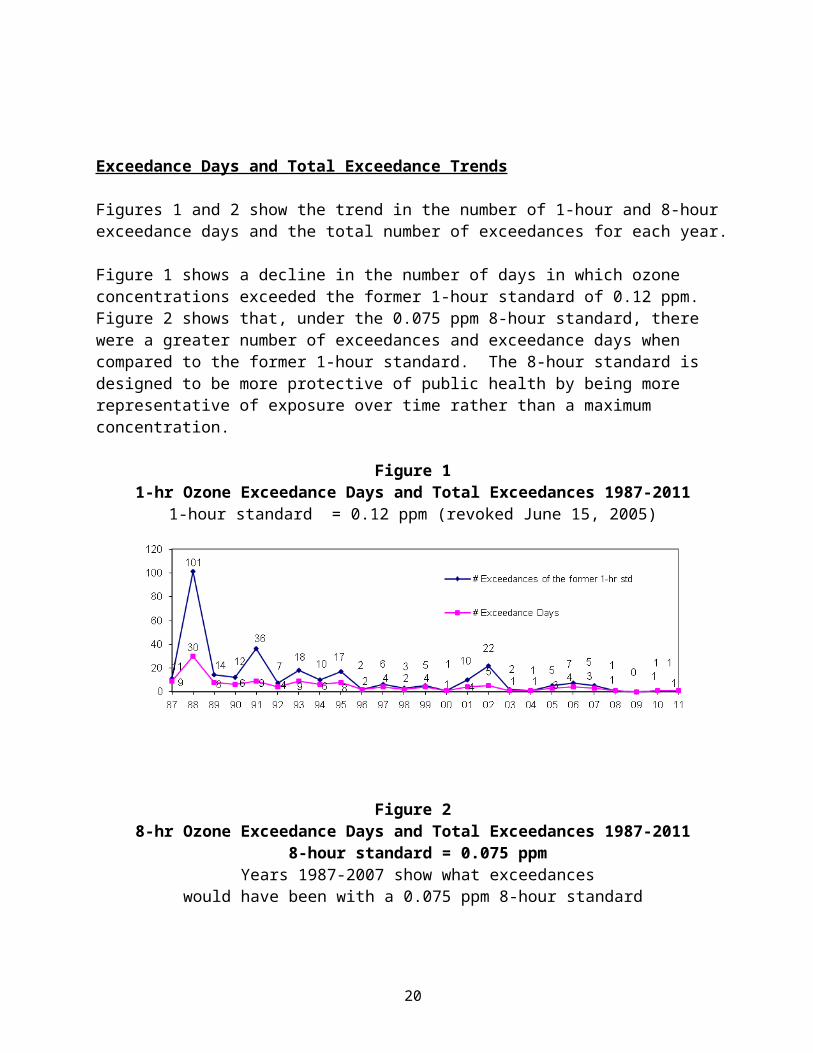
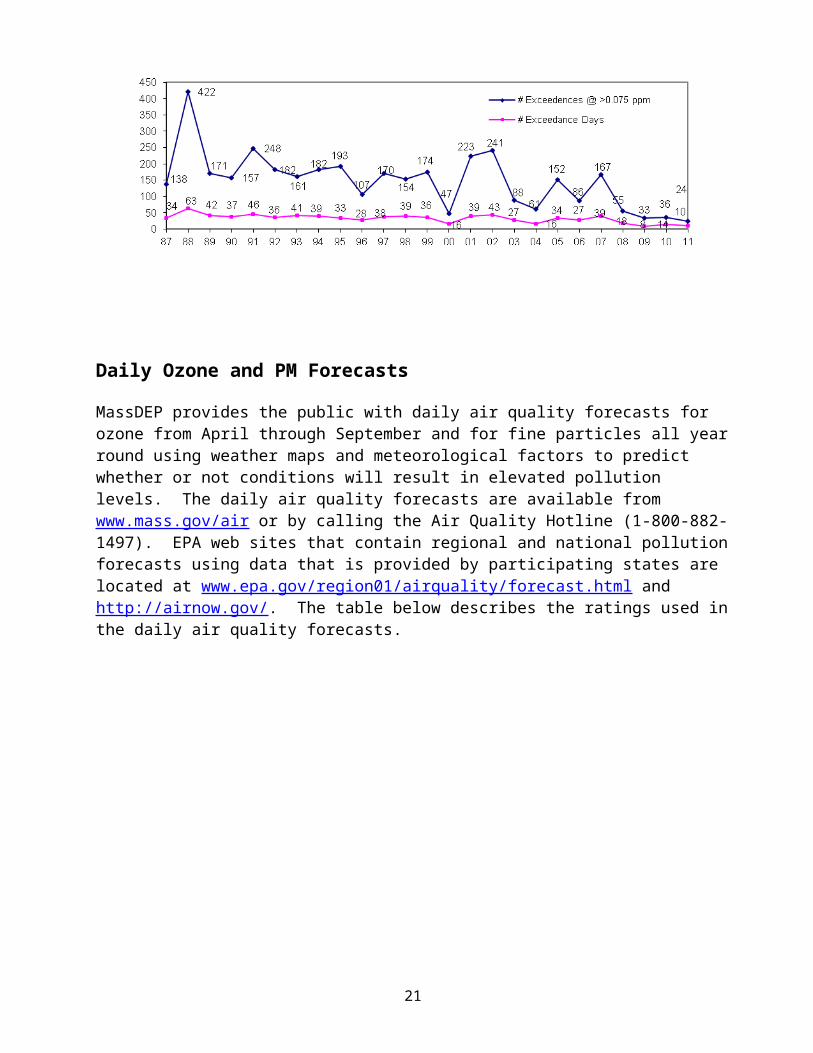
Exceedance Days and Total Exceedance Trends
Figures 1 and 2 show the trend in the number of 1-hour and 8-hour exceedance days and the total number of exceedances for each year.
Figure 1 shows a decline in the number of days in which ozone concentrations exceeded the former 1-hour standard of 0.12 ppm. Figure 2 shows that, under the 0.075 ppm 8-hour standard, there were a greater number of exceedances and exceedance days when compared to the former 1-hour standard. The 8-hour standard is designed to be more protective of public health by being more representative of exposure over time rather than a maximum concentration.
Figure 11-hr Ozone Exceedance Days and Total Exceedances 1987-2011
1-hour standard = 0.12 ppm (revoked June 15, 2005)
Figure 28-hr Ozone Exceedance Days and Total Exceedances 1987-2011
8-hour standard = 0.075 ppm Years 1987-2007 show what exceedances
would have been with a 0.075 ppm 8-hour standard
13
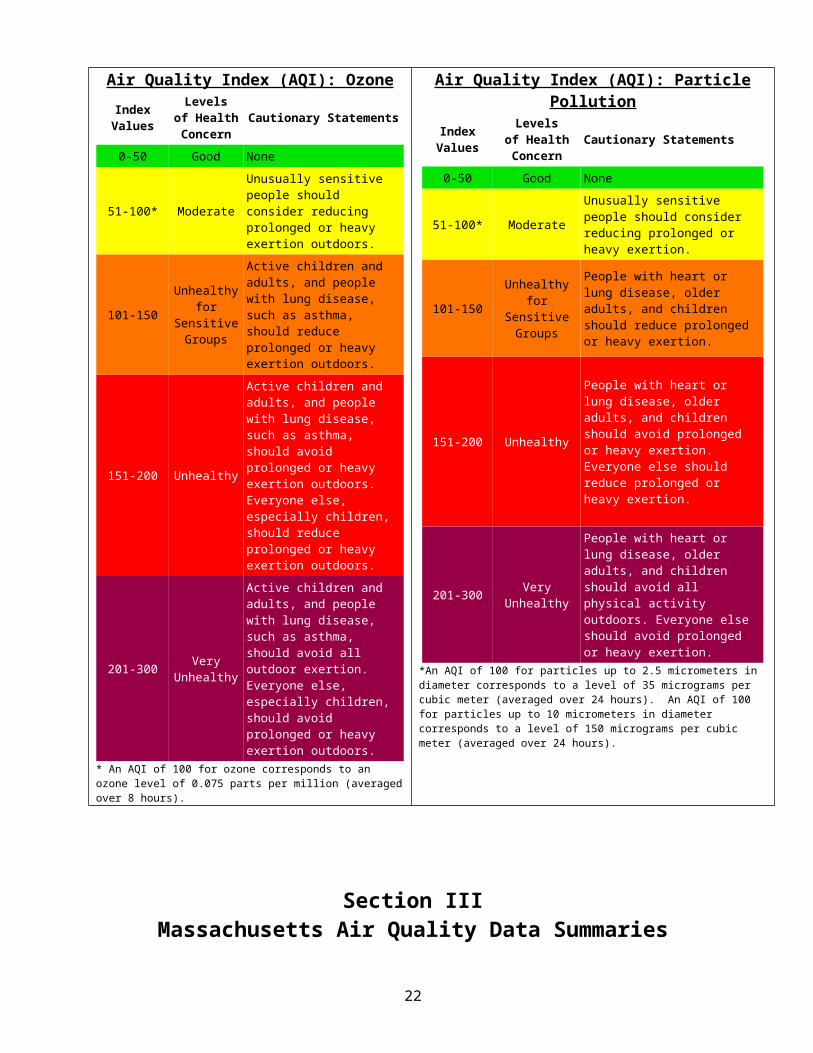
Daily Ozone and PM Forecasts
MassDEP provides the public with daily air quality forecasts for ozone from April through September and for fine particles all year round using weather maps and meteorological factors to predict whether or not conditions will result in elevated pollution levels. The daily air quality forecasts are available from www.mass.gov/air or by calling the Air Quality Hotline (1-800-882-1497). EPA web sites that contain regional and national pollution forecasts using data that is provided by participating states are located at www.epa.gov/region01/airquality/forecast.html and http://airnow.gov/. The table below describes the ratings used in the daily air quality forecasts.
Air Quality Index (AQI): OzoneIndex
ValuesLevels
of HealthConcern
Cautionary Statements
0-50 Good None
51-100* Moderate
Unusually sensitive people should consider reducing prolonged or heavy exertion outdoors.
101-150Unhealthy
for Sensitive Groups
Active children and adults, and people with lung disease, such as asthma, should reduce prolonged or heavy exertion outdoors.
151-200 Unhealthy
Active children and adults, and people with lung disease, such as asthma, should avoid prolonged or heavy exertion outdoors. Everyone else, especially children, should reduce prolonged or heavy exertion outdoors.
201-300 Very Unhealthy
Active children and adults, and people with lung disease, such as asthma, should avoid all outdoor exertion. Everyone else, especially children, should avoid prolonged or heavy exertion outdoors.
* An AQI of 100 for ozone corresponds to an ozone level of 0.075 parts per million (averaged over 8 hours).
Air Quality Index (AQI): Particle PollutionIndex
ValuesLevels
of HealthConcern
Cautionary Statements
0-50 Good None
51-100* ModerateUnusually sensitive people should consider reducing prolonged or heavy exertion.
101-150Unhealthy for
Sensitive Groups
People with heart or lung disease, older adults, and children should reduce prolonged or heavy exertion.
151-200 Unhealthy
People with heart or lung disease, older adults, and children should avoid prolonged or heavy exertion. Everyone else should reduce prolonged or heavy exertion.
201-300 Very Unhealthy
People with heart or lung disease, older adults, and children should avoid all physical activity outdoors. Everyone else should avoid prolonged or heavy exertion.
*An AQI of 100 for particles up to 2.5 micrometers in diameter corresponds to a level of 35 micrograms per cubic meter (averaged over 24 hours). An AQI of 100 for particles up to 10 micrometers in diameter corresponds to a level of 150 micrograms per cubic meter (averaged over 24 hours).
14
Section IIIMassachusetts Air Quality Data Summaries
Ozone Summary
2011 Ozone Data Summary
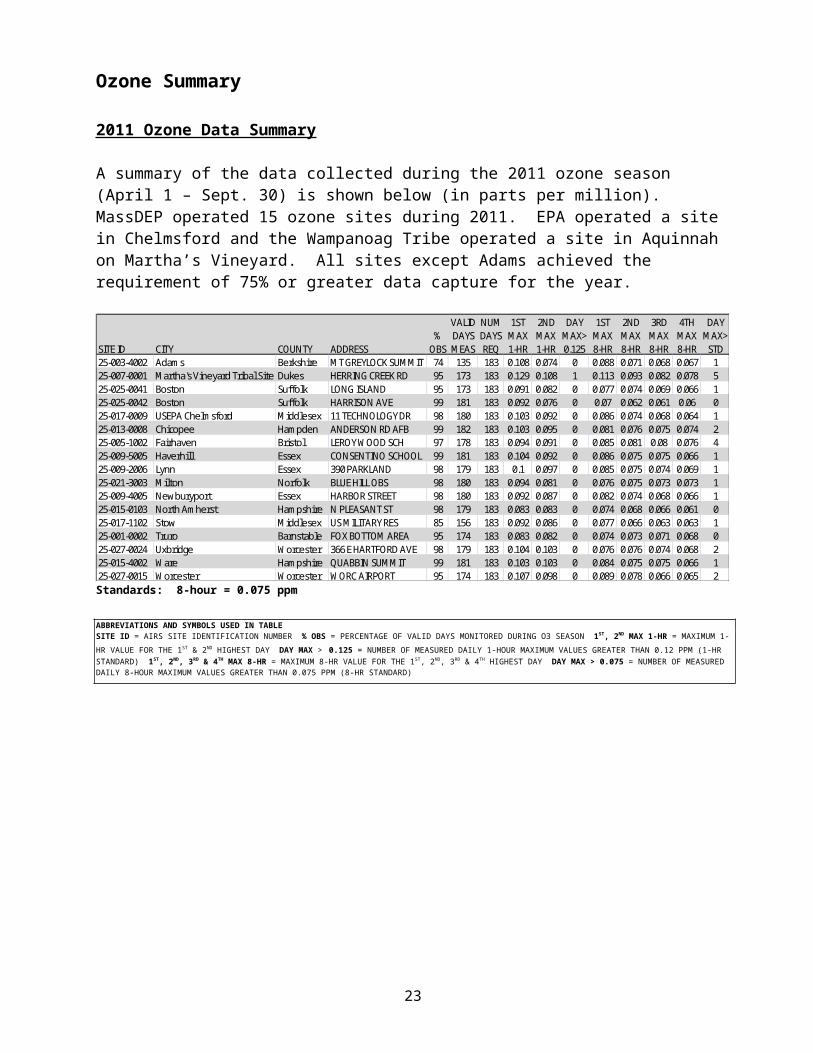
A summary of the data collected during the 2011 ozone season (April 1 – Sept. 30) is shown below (in parts per million). MassDEP operated 15 ozone sites during 2011. EPA operated a site in Chelmsford and the Wampanoag Tribe operated a site in Aquinnah on Martha’s Vineyard. All sites except Adams achieved the requirement of 75% or greater data capture for the year.
VALID NUM 1ST 2ND DAY 1ST 2ND 3RD 4TH DAY% DAYS DAYS MAX MAX MAX> MAX MAX MAX MAX MAX>
SITE ID CITY COUNTY ADDRESS OBS MEAS REQ 1-HR 1-HR 0.125 8-HR 8-HR 8-HR 8-HR STD25-003-4002 Adams Berkshire MT GREYLOCK SUMMIT 74 135 183 0.108 0.074 0 0.088 0.071 0.068 0.067 125-007-0001 Martha's Vineyard Tribal Site Dukes HERRING CREEK RD 95 173 183 0.129 0.108 1 0.113 0.093 0.082 0.078 525-025-0041 Boston Suffolk LONG ISLAND 95 173 183 0.091 0.082 0 0.077 0.074 0.069 0.066 125-025-0042 Boston Suffolk HARRISON AVE 99 181 183 0.092 0.076 0 0.07 0.062 0.061 0.06 025-017-0009 USEPA Chelmsford Middlesex 11 TECHNOLOGY DR 98 180 183 0.103 0.092 0 0.086 0.074 0.068 0.064 125-013-0008 Chicopee Hampden ANDERSON RD AFB 99 182 183 0.103 0.095 0 0.081 0.076 0.075 0.074 225-005-1002 Fairhaven Bristol LEROY WOOD SCH 97 178 183 0.094 0.091 0 0.085 0.081 0.08 0.076 425-009-5005 Haverhill Essex CONSENTINO SCHOOL 99 181 183 0.104 0.092 0 0.086 0.075 0.075 0.066 125-009-2006 Lynn Essex 390 PARKLAND 98 179 183 0.1 0.097 0 0.085 0.075 0.074 0.069 125-021-3003 Milton Norfolk BLUE HILL OBS 98 180 183 0.094 0.081 0 0.076 0.075 0.073 0.073 125-009-4005 Newburyport Essex HARBOR STREET 98 180 183 0.092 0.087 0 0.082 0.074 0.068 0.066 125-015-0103 North Amherst Hampshire N PLEASANT ST 98 179 183 0.083 0.083 0 0.074 0.068 0.066 0.061 025-017-1102 Stow Middlesex US MILITARY RES 85 156 183 0.092 0.086 0 0.077 0.066 0.063 0.063 125-001-0002 Truro Barnstable FOX BOTTOM AREA 95 174 183 0.083 0.082 0 0.074 0.073 0.071 0.068 025-027-0024 Uxbridge Worcester 366 E HARTFORD AVE 98 179 183 0.104 0.103 0 0.076 0.076 0.074 0.068 225-015-4002 Ware Hampshire QUABBIN SUMMIT 99 181 183 0.103 0.103 0 0.084 0.075 0.075 0.066 125-027-0015 Worcester Worcester WORC AIRPORT 95 174 183 0.107 0.098 0 0.089 0.078 0.066 0.065 2Standards: 8-hour = 0.075 ppm
ABBREVIATIONS AND SYMBOLS USED IN TABLE SITE ID = AIRS SITE IDENTIFICATION NUMBER % OBS = PERCENTAGE OF VALID DAYS MONITORED DURING O3 SEASON 1ST, 2ND MAX 1-HR = MAXIMUM 1-HR VALUE FOR THE 1ST & 2ND HIGHEST DAY DAY MAX > 0.125 = NUMBER OF MEASURED DAILY 1-HOUR MAXIMUM VALUES GREATER THAN 0.12 PPM (1-HR STANDARD) 1ST, 2ND, 3RD & 4TH MAX 8-HR = MAXIMUM 8-HR VALUE FOR THE 1ST, 2ND, 3RD & 4TH HIGHEST DAY DAY MAX > 0.075 = NUMBER OF MEASURED DAILY 8-HOUR MAXIMUM VALUES GREATER THAN 0.075 PPM (8-HR STANDARD)
15
16
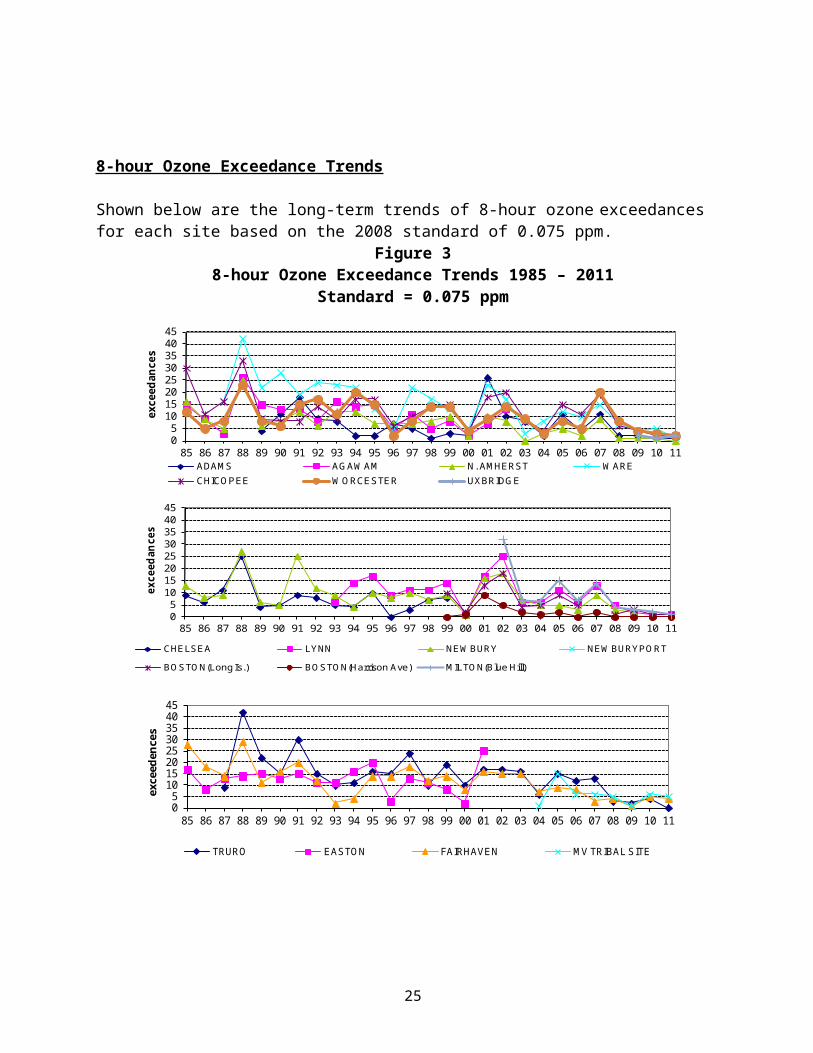
8-hour Ozone Exceedance Trends
Shown below are the long-term trends of 8-hour ozone exceedances for each site based on the 2008 standard of 0.075 ppm.
Figure 38-hour Ozone Exceedance Trends 1985 – 2011
Standard = 0.075 ppm
05
1015202530354045
85 86 87 88 89 90 91 92 93 94 95 96 97 98 99 00 01 02 03 04 05 06 07 08 09 10 11
exce
edan
ces
ADAMS AGAWAM N. AMHERST WARECHICOPEE WORCESTER UXBRIDGE
05
1015202530354045
85 86 87 88 89 90 91 92 93 94 95 96 97 98 99 00 01 02 03 04 05 06 07 08 09 10 11
exce
edan
ces
CHELSEA LYNN NEWBURY NEWBURYPORT
BOSTON(Long Is.) BOSTON(Harrison Ave) MILTON(Blue Hill)
05
1015202530354045
85 86 87 88 89 90 91 92 93 94 95 96 97 98 99 00 01 02 03 04 05 06 07 08 09 10 11
exce
eden
ces
TRURO EASTON FAIRHAVEN MV TRIBAL SITE
17
Sulfur Dioxide (SO2) Summary
2011 SO2 Data Summary
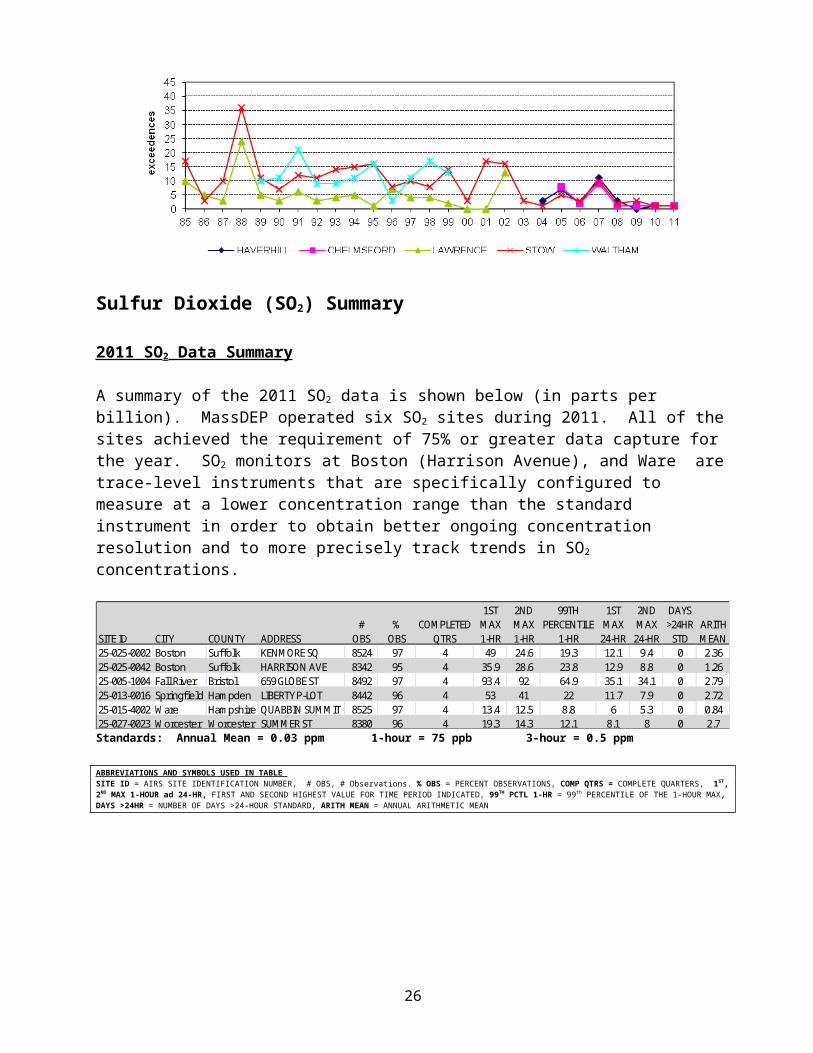
A summary of the 2011 SO2 data is shown below (in parts per billion). MassDEP operated six SO2
sites during 2011. All of the sites achieved the requirement of 75% or greater data capture for the year. SO2 monitors at Boston (Harrison Avenue), and Ware are trace-level instruments that are specifically configured to measure at a lower concentration range than the standard instrument in order to obtain better ongoing concentration resolution and to more precisely track trends in SO2 concentrations.
1ST 2ND 99TH 1ST 2ND DAYS# % COMPLETED MAX MAX PERCENTILE MAX MAX >24HR ARITH
SITE ID CITY COUNTY ADDRESS OBS OBS QTRS 1-HR 1-HR 1-HR 24-HR 24-HR STD MEAN25-025-0002 Boston Suffolk KENMORE SQ 8524 97 4 49 24.6 19.3 12.1 9.4 0 2.3625-025-0042 Boston Suffolk HARRISON AVE 8342 95 4 35.9 28.6 23.8 12.9 8.8 0 1.2625-005-1004 Fall River Bristol 659 GLOBE ST 8492 97 4 93.4 92 64.9 35.1 34.1 0 2.7925-013-0016 Springfield Hampden LIBERTY P-LOT 8442 96 4 53 41 22 11.7 7.9 0 2.7225-015-4002 Ware Hampshire QUABBIN SUMMIT 8525 97 4 13.4 12.5 8.8 6 5.3 0 0.8425-027-0023 Worcester Worcester SUMMER ST 8380 96 4 19.3 14.3 12.1 8.1 8 0 2.7Standards: Annual Mean = 0.03 ppm 1-hour = 75 ppb 3-hour = 0.5 ppm
ABBREVIATIONS AND SYMBOLS USED IN TABLE SITE ID = AIRS SITE IDENTIFICATION NUMBER, # OBS, # Observations. % OBS = PERCENT OBSERVATIONS, COMP QTRS = COMPLETE QUARTERS, 1ST, 2ND MAX 1-HOUR ad 24-HR, FIRST AND SECOND HIGHEST VALUE FOR TIME PERIOD INDICATED, 99TH PCTL 1-HR = 99th PERCENTILE OF THE 1-HOUR MAX, DAYS >24HR = NUMBER OF DAYS >24-HOUR STANDARD, ARITH MEAN = ANNUAL ARITHMETIC MEAN
18
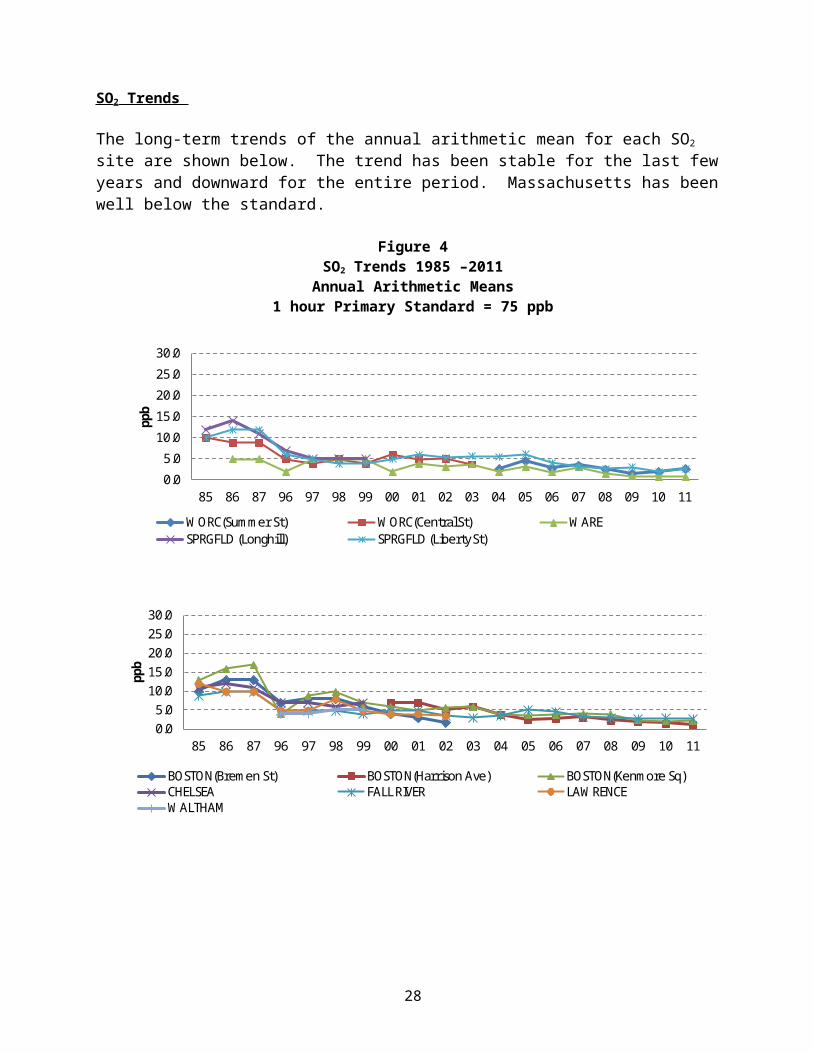
SO2 Trends
The long-term trends of the annual arithmetic mean for each SO2 site are shown below. The trend has been stable for the last few years and downward for the entire period. Massachusetts has been well below the standard.
Figure 4SO2 Trends 1985 –2011
Annual Arithmetic Means1 hour Primary Standard = 75 ppb
0.0
5.0
10.0
15.0
20.0
25.0
30.0
85 86 87 96 97 98 99 00 01 02 03 04 05 06 07 08 09 10 11
ppb
WORC(Summer St) WORC(Central St) WARESPRGFLD (Longhill) SPRGFLD (Liberty St)
0.05.0
10.015.020.025.030.0
85 86 87 96 97 98 99 00 01 02 03 04 05 06 07 08 09 10 11
ppb
BOSTON(Bremen St) BOSTON(Harrison Ave) BOSTON(Kenmore Sq)CHELSEA FALL RIVER LAWRENCEWALTHAM
19
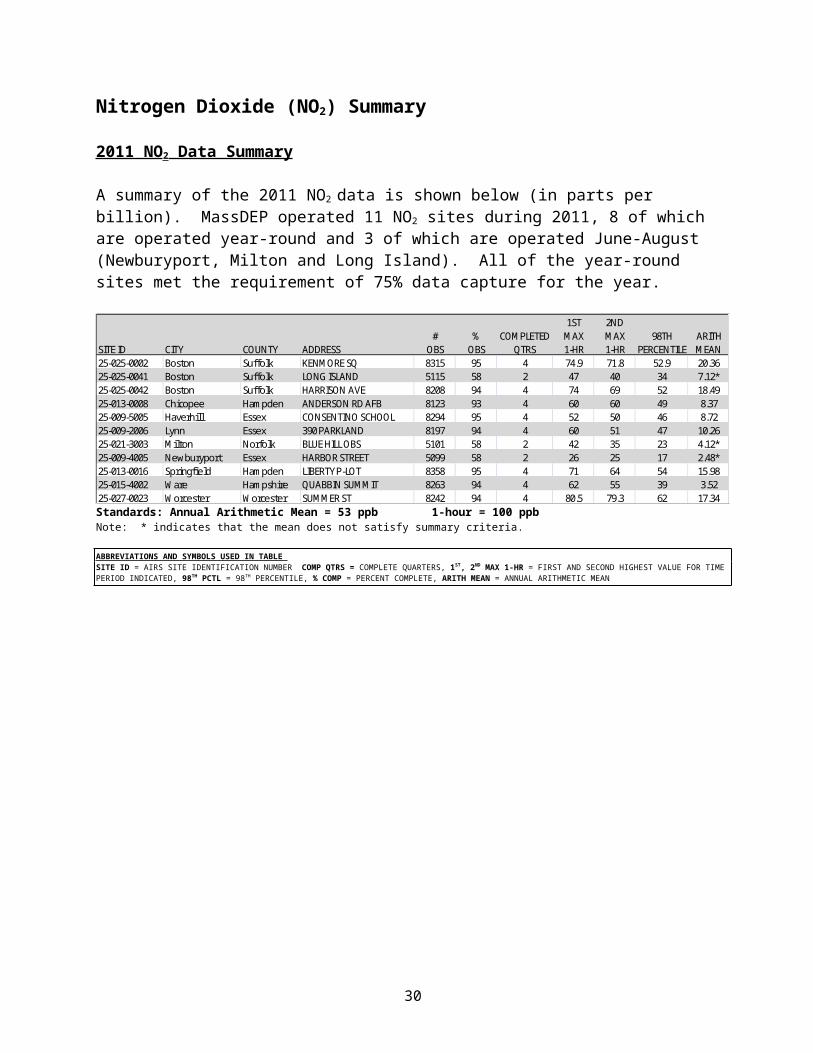
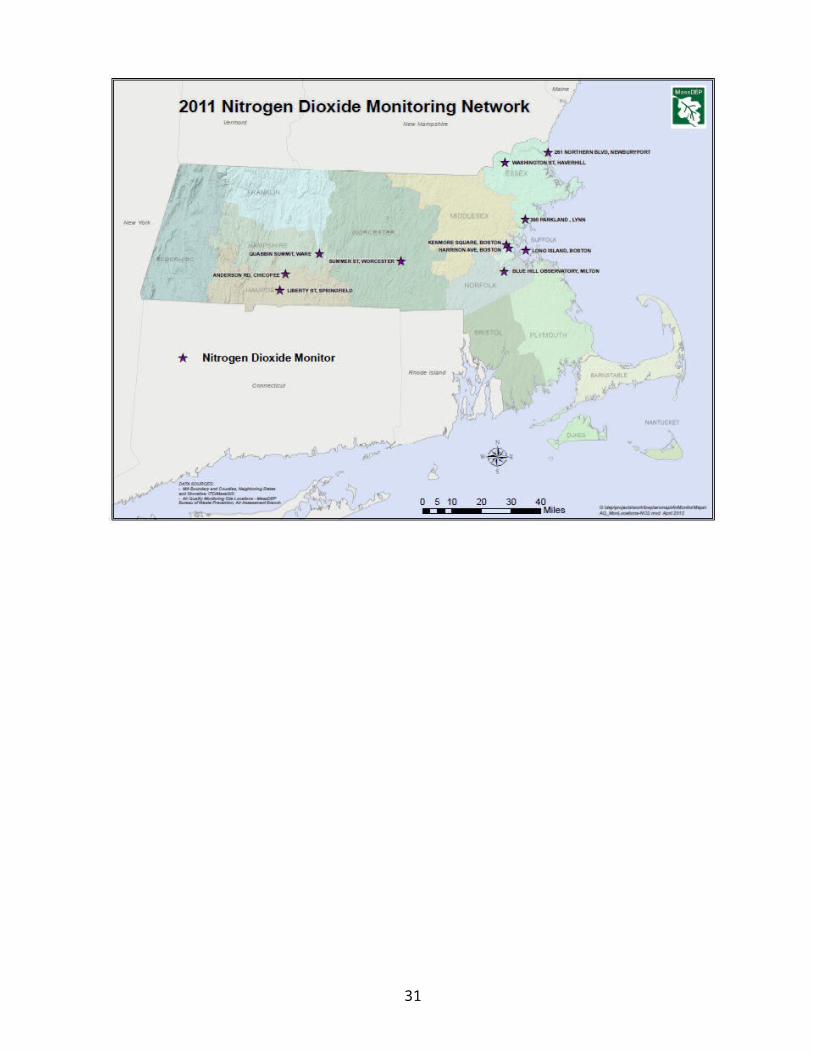
Nitrogen Dioxide (NO2) Summary
2011 NO2 Data Summary
A summary of the 2011 NO2 data is shown below (in parts per billion). MassDEP operated 11 NO2
sites during 2011, 8 of which are operated year-round and 3 of which are operated June-August (Newburyport, Milton and Long Island). All of the year-round sites met the requirement of 75% data capture for the year.
1ST 2ND# % COMPLETED MAX MAX 98TH ARITH
SITE ID CITY COUNTY ADDRESS OBS OBS QTRS 1-HR 1-HR PERCENTILE MEAN25-025-0002 Boston Suffolk KENMORE SQ 8315 95 4 74.9 71.8 52.9 20.3625-025-0041 Boston Suffolk LONG ISLAND 5115 58 2 47 40 34 7.12*25-025-0042 Boston Suffolk HARRISON AVE 8208 94 4 74 69 52 18.4925-013-0008 Chicopee Hampden ANDERSON RD AFB 8123 93 4 60 60 49 8.3725-009-5005 Haverhill Essex CONSENTINO SCHOOL 8294 95 4 52 50 46 8.7225-009-2006 Lynn Essex 390 PARKLAND 8197 94 4 60 51 47 10.2625-021-3003 Milton Norfolk BLUE HILL OBS 5101 58 2 42 35 23 4.12*25-009-4005 Newburyport Essex HARBOR STREET 5099 58 2 26 25 17 2.48*25-013-0016 Springfield Hampden LIBERTY P-LOT 8358 95 4 71 64 54 15.9825-015-4002 Ware Hampshire QUABBIN SUMMIT 8263 94 4 62 55 39 3.5225-027-0023 Worcester Worcester SUMMER ST 8242 94 4 80.5 79.3 62 17.34Standards: Annual Arithmetic Mean = 53 ppb 1-hour = 100 ppbNote: * indicates that the mean does not satisfy summary criteria.
ABBREVIATIONS AND SYMBOLS USED IN TABLE SITE ID = AIRS SITE IDENTIFICATION NUMBER COMP QTRS = COMPLETE QUARTERS, 1ST, 2ND MAX 1-HR = FIRST AND SECOND HIGHEST VALUE FOR TIME PERIOD INDICATED, 98TH PCTL = 98TH PERCENTILE, % COMP = PERCENT COMPLETE, ARITH MEAN = ANNUAL ARITHMETIC MEAN
20
21
NO2 Trends
The long-term trends of the annual arithmetic means for each NO2 site are shown below. The trend has been stable the last few years and downward for the entire period. Massachusetts is below the annual standard.
Figure 5NO2 Trends 1985 – 2011Annual Arithmetic Mean
Standard = 53 ppb
0.0
10.0
20.0
30.0
40.0
50.0
85 86 87 88 89 90 91 92 93 94 95 96 97 98 99 00 01 02 03 04 05 06 07 08 09 10 11
ppb
BOSTON(Bremen St) BOSTON(Harrison Ave) BOSTON(Kenmore Sq)BOSTON(Long Island) CHELSEA MILTON(Blue Hill)HAVERHILL LAWRENCE LYNN
0.0
10.0
20.0
30.0
40.0
50.0
85 86 87 88 89 90 91 92 93 94 95 96 97 98 99 00 01 02 03 04 05 06 07 08 09 10 11
ppb
AGAWAM CHICOPEE EASTONFAIRHAVEN SPRGFLD(Liberty St) TRUROWARE WORC(Central St) WORC(Summer St)
22
Carbon Monoxide (CO) Summary
2011 CO Data Summary
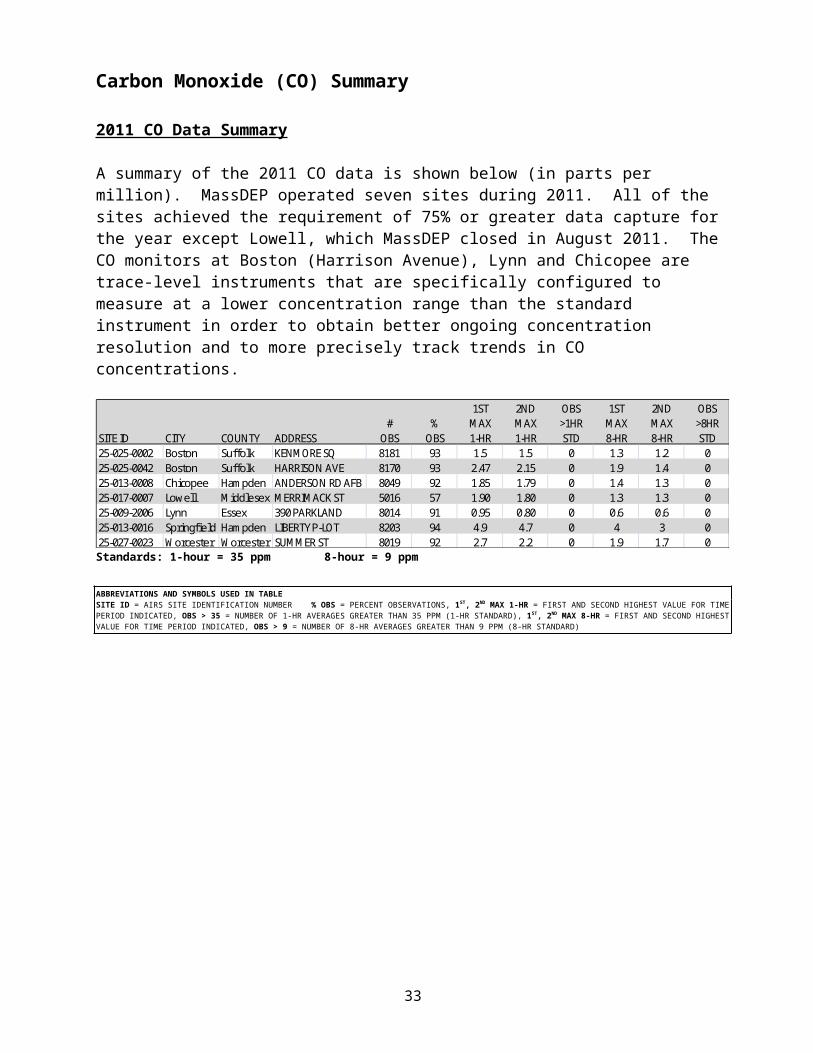
A summary of the 2011 CO data is shown below (in parts per million). MassDEP operated seven sites during 2011. All of the sites achieved the requirement of 75% or greater data capture for the year except Lowell, which MassDEP closed in August 2011. The CO monitors at Boston (Harrison Avenue), Lynn and Chicopee are trace-level instruments that are specifically configured to measure at a lower concentration range than the standard instrument in order to obtain better ongoing concentration resolution and to more precisely track trends in CO concentrations.
1ST 2ND OBS 1ST 2ND OBS# % MAX MAX >1HR MAX MAX >8HR
SITE ID CITY COUNTY ADDRESS OBS OBS 1-HR 1-HR STD 8-HR 8-HR STD25-025-0002 Boston Suffolk KENMORE SQ 8181 93 1.5 1.5 0 1.3 1.2 025-025-0042 Boston Suffolk HARRISON AVE 8170 93 2.47 2.15 0 1.9 1.4 025-013-0008 Chicopee Hampden ANDERSON RD AFB 8049 92 1.85 1.79 0 1.4 1.3 025-017-0007 Lowell Middlesex MERRIMACK ST 5016 57 1.90 1.80 0 1.3 1.3 025-009-2006 Lynn Essex 390 PARKLAND 8014 91 0.95 0.80 0 0.6 0.6 025-013-0016 Springfield Hampden LIBERTY P-LOT 8203 94 4.9 4.7 0 4 3 025-027-0023 Worcester Worcester SUMMER ST 8019 92 2.7 2.2 0 1.9 1.7 0Standards: 1-hour = 35 ppm 8-hour = 9 ppm
ABBREVIATIONS AND SYMBOLS USED IN TABLESITE ID = AIRS SITE IDENTIFICATION NUMBER % OBS = PERCENT OBSERVATIONS, 1ST, 2ND MAX 1-HR = FIRST AND SECOND HIGHEST VALUE FOR TIME PERIOD INDICATED, OBS > 35 = NUMBER OF 1-HR AVERAGES GREATER THAN 35 PPM (1-HR STANDARD), 1ST, 2ND MAX 8-HR = FIRST AND SECOND HIGHEST VALUE FOR TIME PERIOD INDICATED, OBS > 9 = NUMBER OF 8-HR AVERAGES GREATER THAN 9 PPM (8-HR STANDARD)
23
CO Trends
The long-term trends for each CO site are shown below. The 2nd maximum value is displayed because it is the value to which the standard applies. Massachusetts is well below the 1-hour and 8-hour standards.
Figure 6CO Trends 1985-2010
2nd Maximum 8-hour ValuesStandard = 9 ppm
0.02.04.06.08.0
10.012.0
85 86 87 88 89 90 91 92 93 94 95 96 97 98 99 00 01 02 03 04 05 06 07 08 09 10 11
ppm
CHICOPEE SPRGFLD(E Columbus) SPRGFLD(Liberty St)
WORC(Central St) WORC(Franklin St) WORC(Summer St)
0.02.04.06.08.0
10.012.0
85 86 87 88 89 90 91 92 93 94 95 96 97 98 99 00 01 02 03 04 05 06 07 08 09 10 11
ppm
LOWELL LYNN BOSTON(Kenmore Sq)BOSTON(Sumner) BOSTON(Bremen St) BOSTON(Post Office Sq)BOSTON(Harrison Ave)
24
Particulate Matter 10 Microns (PM10) Summary
2011 PM10 Data Summary
A summary of the 2011 PM10 data is shown below (in g/m3). MassDEP operated six PM10 sites in 2011. All of the sites achieved data capture requirements for the year.
DAY EST# NUM VALID % 1ST 2ND 3RD 4TH MAX DAYS ARITH
SITE ID CITY COUNTY ADDRESS OBS REQ DAYS OBS MAX MAX MAX MAX >STD >STD MEAN25-025-0002 Boston Suffolk KENMORE SQ 59 61 59 97 38 38 36 32 0 0 16.825-025-0027 Boston Suffolk ONE CITY SQ 57 61 57 93 39 34 33 29 0 0 15.925-025-0042 Boston Suffolk HARRISON AVE 58 61 57 93 37 35 28 24 0 0 13.225-025-0042 Boston Suffolk HARRISON AVE 60 61 59 97 35 30 27 24 0 0 13.225-025-0042 Boston Suffolk HARRISON AVE 119 61 60 98 42 41 33 32 0 0 14.825-025-0042 Boston Suffolk HARRISON AVE 105 61 61 100 40 34 33 27 0 0 14.525-013-2009 Springfield Hampden 1860 MAIN ST 59 61 59 97 33 30 29 26 0 0 14.425-015-4002 Ware Hampshire QUABBIN 61 61 61 100 26 25 22 18 0 0 8.825-027-0023 Worcester Worcester SUMMER ST 56 61 56 92 37 35 31 30 0 0 16.3
Standards: 24-hour = 150 g/m3
ABBREVIATIONS AND SYMBOLS USED IN TABLE SITE ID = AIRS SITE IDENTIFICATION NUMBER, % OBS = PERCENT OBSERVATIONS, 1ST, 2ND, 3RD, 4TH MAX = 1ST, 2ND, 3RD, AND 4TH HIGHEST 24-HOUR VALUES FOR THE YEAR, DAY MAX > 150 = DAILY MAXIMUM VALUE GREATER THAN STANDARD OF 150 g/m³, ARITH MEAN = ANNUAL ARITHMETIC MEAN
25
PM10 Trends
Long-term trends for each PM10 site are shown below using the annual arithmetic mean as an indicator. The data shows an overall downward trend.
Figure 7PM10 Trends 1989-2011
Annual Arithmetic Mean
0
10
20
30
40
50
97 98 99 00 01 02 03 04 05 06 07 08 09 10 11
ug/m
3
BOSTON(City Sq) BOSTON(Columbus Ave) BOSTON(Kenmore Sq)
BOSTON(Southhampton St) BOSTON(Harrison Ave)
0
10
20
30
40
50
97 98 99 00 01 02 03 04 05 06 07 08 09 10 11
ug/m
3
SPRGFLD(E Columbus Ave) SPRGFLD(1860 Main St) SPRGFLD(Howard St)
WORCESTER WARE
26
Particulate Matter 2.5 Microns (PM2.5) Summary
MassDEP operated 15 Federal Reference Method (FRM) filter-based PM2.5 sites during 2011 that are used for comparison to the NAAQS, and operated 10 Beta Attenuation Monitors (BAMs) PM2.5
samplers that are used to provide near real-time data on MassDEP’s MassAir Online website (www.mass.gov/dep/air) and on EPA’s AirNOW website (www.epa.gov/airnow/).
2011 PM2.5 FRM Data Summary
A summary of the 2011 FRM PM2.5 data is shown below (in g/m3). 98TH
# 1ST 2ND 3RD 4TH PERCENTILE ARITHSITE ID CITY COUNTY ADDRESS OBS MAX MAX MAX MAX VALUE MEAN25-025-0002 Boston Suffolk KENMORE SQ 119 23.7 22.2 21.2 19.3 21.2 9.3725-025-0027 Boston Suffolk ONE CITY SQ 116 22.6 21.5 21.3 17.6 21.3 8.6325-025-0042 Boston Suffolk HARRISON AVE 119 22.3 21 20.9 17 20.9 8.4825-025-0043 Boston Suffolk 174 NORTH ST 363 38.9 29.1 28.6 26.4 23.9 10.2625-025-0043 Co-Loc Boston Suffolk 174 NORTH ST 357 38.5 30.7 28.8 26.7 23.2 10.3225-023-0004 Brockton Plymouth COMMERCIAL ST 121 21.3 19 18.8 18 18.8 8.1825-023-0004 Co-Loc Brockton Plymouth COMMERCIAL ST 117 21 18.9 18.8 18.1 18.8 8.2225-013-0008 Chicopee Hampden ANDERSON RD 119 22.7 22.7 21.2 20.2 21.2 7.8425-013-0008 Co-Loc Chicopee Hampden ANDERSON RD 112 23.3 22.9 21.5 19.8 21.5 825-005-1004 Fall River Bristol 659 GLOBE ST 116 20.5 20.1 19 17 19 7.8825-009-5005 Haverhill Essex CONSENTINO SCHOOL 115 21.1 18.3 17.8 17.6 17.8 7.5325-009-6001 Lawrence Essex SHATTUCK ST 119 21.5 21.5 18.8 17.8 18.8 8.1725-009-2006 Lynn Essex 390 PARKLAND 116 19.7 18.7 18.6 18.1 18.6 7.4425-003-5001 Pittsfield Berkshire 78 CENTER ST 117 29.8 29.7 28.8 25.3 28.8 9.0825-013-0016 Springfield Hampden LIBERTY P-LOT 120 32.3 31.2 27.6 26.7 27.6 9.7325-013-2009 Springfield Hampden 1860 MAIN ST 120 33.5 27.3 26.7 24.5 26.7 9.2625-027-0016 Worcester Worcester WASHINGTON ST 121 24.7 24.2 22 21.7 22 8.5925-027-0023 Worcester Worcester SUMMER ST 120 26.8 26.1 23.7 21.1 23.7 9.01Standards: Annual = 15.0 g/m3 24-hour = 35 g/m3
PM2.5 Trends
Long-term trends for each PM2.5 site are shown below using the annual arithmetic mean as an indicator. The data shows an overall downward trend.
Figure 8PM2.5 Annual Arithmetic Mean
Standard = 15 g/m3
0
5
10
15
20
2004 2005 2006 2007 2008 2009 2010 2011
Pittsfield Fall River Lynn Haverhill
Lawrence Chicopee SPGFD(Liberty) SPGFD(1860 Main)
Brockton Boston(Kenmore) Boston(Charlestown) Boston(Harrison Ave)
Boston(174 North St) Worcester(Washington St) Worcester(Summer St)
27
2011 PM2.5 BAM Data Summary
A summary of the 2011 BAM PM2.5 data is shown below (in g/m3).
1ST 2ND 3RD 4THMAX MAX MAX MAX
# 24-HR BLK 24-HR BLK 24-HR BLK 24-HR BLK ARITHSITE ID CITY COUNTY ADDRESS DAYS AVERAGE AVERAGE AVERAGE AVERAGE MEAN25-025-0042 Boston Suffolk HARRISON AVE 352 37.8 26.9 26.5 24.3 8.6825-025-0043 Boston Suffolk 174 NORTH ST 349 44.3 31.9 31 30.3 12.2425-005-1004 Fall River Bristol 659 GLOBE ST 359 33.8 28.5 28.3 28 10.3625-009-5005 Haverhill Essex CONSENTINO SCHOOL 354 31.3 29.8 29.3 27.2 9.0125-009-2006 Lynn Essex 390 PARKLAND 354 33.2 28.9 28 25.5 9.2225-021-3003 Milton Norfolk BLUE HILL OBS 356 26.3 21.7 21.4 19.8 7.4525-003-0006 Pittsfield Berkshire BERKSHIRE COMMONS 363 45.1 38 35 34.2 11.0125-013-0016 Springfield Hampden LIBERTY P-LOT 357 70.5 56.1 54 44.1 10.7925-015-4002 Ware Hampshire QUABBIN SUMMIT 359 34.1 29.5 21.3 21.1 6.5625-027-0023 Worcester Worcester SUMMER ST 357 40.4 34.1 30.3 28.7 9.72
ABBREVIATIONS AND SYMBOLS USED IN TABLE SITE ID = AIRS SITE IDENTIFICATION TYPE = TYPE OF INSTRUMENT FRM = FEDERAL REFERENCE METHOD; COLOC = FED. REF. METH. COLOCATED 1ST, 2ND, 3RD, 4TH MAX = 1ST, 2ND, 3RD, AND 4TH HIGHEST 24-HOUR VALUES FOR THE YEAR ARITH MEAN = ANNUAL ARITHMETIC MEAN (STANDARD = 15.0 g/m³)
28
Speciation
MassDEP collects PM2.5 samples for speciation in Boston (Harrison Avenue) and Chicopee. Speciation involves analysis of particulate matter to determine its chemical composition and to identity air pollution sources that affect the area around the monitoring station. Pollutants analyzed include elements (e.g., metals), sulfates, nitrates, and carbon (total and organic).
IMPROVE (Interagency Monitoring of Protected Visual Environments)
IMPROVE is a nationwide program designed to assess air quality at rural locations where air pollution may affect visibility over long distances (e.g., mountain ranges or scenic vistas). Massachusetts currently has IMPROVE samplers at the Ware and Truro sites. The Wampanoag Tribe operates a third IMPROVE sampler at its Martha’s Vineyard monitoring site. These samplers acquire PM2.5 filter samples for speciation analysis to determine effects on visibility. Data can be viewed at the IMPROVE web site at http://vista.cira.colostate.edu/improve/Data/data.htm.
29
Lead (Pb) Summary
2011 Pb Data Summary
EPA’s 2008 lead monitoring requirements allow the use of a low-volume PM10-based methodology for measuring lead on particulates, which MassDEP began using at the beginning of 2011 in Boston (Harrison Avenue) and Springfield (Main Street). MassDEP also monitored lead in Boston (Harrison Avenue) using a Total Suspended Particulate (TSP) method, and discontinued use of this method at the end of 2011. A summary of 2011 lead data using the PM10-based method is shown in the first box below (in µ/m3) and using the TSP-based method in the second box (in µ/m3). All samples (including 3-month rolling averages) were below the lead standard of 0.15 µg/m3.
Lead from PM10-based Method
1st 2nd 3rd 4th# MAX MAX MAX MAX ARITH DURATION
SITE ID CITY COUNTY ADDRESS OBS VALUE VALUE VALUE VALUE MEAN25-025-0042 Boston Suffolk HARRISON AVE 121 0.017 0.015 0.010 0.010 0.0030 24 HOURS25-013-2009 Springfield Hampden MAIN STREET 59 0.012 0.012 0.011 0.010 0.0036 24 HOURSStandard: 0.15 g/m3 (Rolling 3-month Average)
ABBREVIATIONS AND SYMBOLS USED IN TABLESITE ID = AIRS SITE IDENTIFICATION % OBS = PERCENT OBSERVATIONS; 1ST, 2ND, 3rd, 4th MAX = THE 1ST, 2ND, 3rd, 4th MAXIMUM 24-HOUR VALUES ARITH MEAN = THE MEAN
Lead from TSP-based Method
QTR1 QTR2 QTR3 QTR4 ## ARITH ARITH ARITH ARITH MEANS 1ST 2ND DURATION
SITE ID CITY COUNTY ADDRESS OBS MEAN MEAN MEAN MEAN > STD MAX MAX25-025-0042 Boston Suffolk HARRISON AVE 59 0.0068 0.0091 0.0059 0.0063 0 0.021 0.017 24 HOURSStandard: 0.15 g/m3 (Rolling 3-month Average)
ABBREVIATIONS AND SYMBOLS USED IN TABLESITE ID = AIRS SITE IDENTIFICATION % OBS = PERCENT OBSERVATIONS QTR1, QTR2, QTR3, QTR4 ARITH MEAN = THE MEANS FOR THE 1ST, 2ND, 3RD AND 4TH CALENDAR QUARTERS # MEANS > STD = THE NUMBER OF CALENDAR QUARTER MEANS GREATER THAN THE STANDARD, 1ST, 2ND MAX = THE 1ST AND 2ND MAXIMUM 24-HOUR VALUES
30

Private Monitoring Summary
In 2011, MassDEP oversaw four monitoring stations operated by power generation companies that were originally sited to measure ambient air impacts from specific power plants in the Boston area. The data from these monitors was submitted to MassDEP, which submits the data to EPA after performing quality assurance. Constellation Energy applied for and received permission to close three of the four monitoring locations during 2011. Only the East First Street location continues to be operated.
Sulfur Dioxide (SO2) summary There were four private SO2 sites that operated during 2011; however, three of those sites closed in May 2011. There were no measured violations of the SO2 air quality standards. A summary of the 2011 SO2 data is shown below.
1ST 2ND 99TH 1ST 2ND DAYSCOMPLETED MAX MAX PERCENTILE MAX MAX >24-HR ARITH
QTRS 1-HR 1-HR 1-HR 24-HR 24-HR STD MEAN25-025-0020 Boston Suffolk DEWAR ST, DORCHESTER 1 25 24 24 11.7 9.6 0 2.49*25-025-0021 Boston Suffolk 340 BREMEN ST, E. BOSTON 1 32 31 31 13.1 11.5 0 2.83*25-025-0040 Boston Suffolk 531A EAST FIRST ST 4 16 15 11 6.3 5.4 0 1.7725-025-0019 Boston Suffolk LONG ISLAND 1 18 12 12 6.6 5.4 0 1.86*STANDARD: 1-Hour = 75 PPB
ABBREVIATIONS AND SYMBOLS USED IN TABLE SITE ID = AIRS SITE IDENTIFICATION NUMBER COMP QTRS = COMPLETED QUARTERS, 1ST & 2ND MAX 1-HR and MAX 24-HR = FIRST AND SECOND HIGHEST VALUE FOR TIME PERIOD INDICATED, 99th PCTL = 99th PERCENTILE OF THE 1-HOUR MAX, DAYS >24 HR STD = NUMBER OF DAYS ABOVE THE 24-HOUR STANDARD, ARITH MEAN = ARITHMETIC MEAN
Nitrogen Dioxide (NO2) summary
There was one private NO2 monitor that operated during 2011. There were no measured violations of the NO2 air quality standards. A summary of the 2011 NO2 data is shown below.
1ST 2NDCOMPLETED MAX MAX 98TH ARITH
QTRS 1-HR 1-HR PERCENTILE MEAN25-025-0040 Boston Suffolk 531A EAST FIRST ST 4 61 59 53 13.46
STANDARD: 1-HOUR = 100 PPB
ABBREVIATIONS AND SYMBOLS USED IN TABLE SITE ID = AIRS SITE IDENTIFICATION NUMBER, # COMP QTRS = NUMBER OF COMPLETED QUARTERS, 1ST AND 2ND MAX 1-HR = FIRST AND SECOND HIGHEST VALUE FOR TIME PERIOD INDICATED, 98th PCTL = 98th PERCENTILE OF 1 HOUR MAXIMUM, #OBS = OBSERVATIONS COMPLETED, % COMP = PERCENT COMPLETE, ARITH MEAN = ARITHMETIC MEAN (STANDARD = 0.053 PPM)
31
Total Suspended Particulates (TSP) summary
There were four private TSP sites that operated in 2011; however, three of the sites closed in May 2011. TSP is no longer a criteria pollutant (PM10 replaced it as the course particulate standard in 1987), so there is no longer a standard for it. A summary of the 2011 TSP data is shown below.
# 1ST 2ND 3RD 4TH ARITHSITE ID CITY COUNTY ADDRESS OBS MAX MAX MAX MAX MEAN DURATION25-025-0019 Boston Suffolk LONG ISLAND 24 61 29 28 27 21.0* 24 HOUR25-025-0020 Boston Suffolk DEWAR ST, DORCHESTER 24 187 152 84 67 52.7* 24 HOUR25-025-0021 Boston Suffolk 340 BREMEN ST, E. BOSTON 24 80 74 66 55 41.8* 24 HOUR25-025-0040 Boston Suffolk 531A EAST FIRST ST 61 92 66 54 52 28.9 24 HOUR25-025-0040 Co-Loc Boston Suffolk 531A EAST FIRST ST 61 78 65 53 51 28.2 24 HOUR
ABBREVIATIONS AND SYMBOLS USED IN TABLESITE ID = AIRS SITE IDENTIFICATION NUMBER, TYPE = TYPE OF MONITOR, CO-LOC = COLOCATED MONITOR, #OBS = NUMBER of OBSERVATIONS, 1ST, 2ND, 3RD, 4TH MAX = 1ST, 2ND, 3RD AND 4TH HIGHEST 24-HOUR VALUES FOR THE YEAR, ARITH MEAN = ARITHMETIC MEAN, DURATION = 24-24-HOUR SAMPLING PERIOD
Sulfate (SO4) summary
There were four private SO4 sites that operated during 2011; however, three of the sites closed in May 2011. SO4 is not a criteria pollutant so there are no ambient air quality standards for SO4. A summary of the 2011 SO4 data is shown below.
# 1ST 2ND 3RD 4TH ARITHSITE ID CITY COUNTY ADDRESS OBS MAX MAX MAX MAX MEAN DURATION25-025-0019 Boston Suffolk LONG ISLAND 24 7.6 7.6 6.9 6.5 3.63* 24 HOUR25-025-0020 Boston Suffolk DEWAR ST, DORCHESTER 24 9.2 8.7 7.7 6.5 4.75* 24 HOUR25-025-0021 Boston Suffolk 340 BREMEN ST, E BOSTON 24 10.2 10.1 8.4 7.7 5.49* 24 HOUR25-025-0040 Boston Suffolk 531A E FIRST ST 60 9.9 8.7 7.8 7.2 3.96 24 HOUR25-025-0040 Co-Loc Boston Suffolk 531A E FIRST ST 61 9.2 6.9 6.6 6.6 3.88 24 HOUR
ABBREVIATIONS AND SYMBOLS USED IN TABLE SITE ID = AIRS SITE IDENTIFICATION NUMBER , TYPE = TYPE OF MONITOR, CO-LOC = COLOCATED MONITOR, % OBS = % OBSERVATIONS, 1ST, 2ND, 3RD, 4TH MAX = 1ST, 2ND, 3RD AND 4TH HIGHEST 24-HOUR VALUES FOR THE YEAR, ARITH MEAN = ARITHMETIC MEAN, DURATION = 24-HOUR SAMPLING PERIOD
32

QUALITY CONTROL AND QUALITY ASSURANCE
Introduction
In order to ensure that all air quality data is of acceptable and consistent quality, MassDEP has developed standard operating procedures (SOPs) based on federal requirements that include quality control and quality assurance techniques that systematically assess the entire sample collection and data handling system on an ongoing basis. Quality Assurance requirements for ambient air monitoring are contained in the federal regulations at 40 CFR Part 58, Appendix A – E. Each year MassDEP certifies that it is in compliance with the federal requirements.
A few of the considerations that affect sample collection data quality are:
Site Placement Intake Probe Material Intake Probe Height Spacing from roadways and trees
For data processing there are quantitative statistics and qualitative descriptors used to interpret the degree of acceptability or utility of data. Examples of these data quality indicators are:
Representativeness Precision Bias Detectability Completeness Comparability
MassDEP’s Air Assessment Branch in Lawrence maintains an independent Quality Assurance/ Data Management Group that reviews the monitoring data for quality, ensures that samples are collected correctly, and conducts performance audits throughout the air monitoring network to verify data validity. Another function of the Data Group is to process and report all of the Massachusetts air quality data to the EPA database in a timely manner. Computer software tools, report queries and “eyes on” data reviews are all used to detect and correct problems in the data before it is submitted to EPA.
33
Section IVPAMS/Air Toxics Monitoring
PAMS Monitoring
Ground-level ozone is a secondary pollutant and is not discharged directly to the atmosphere from a stack or tailpipe, but rather forms in the atmosphere from the photochemical reactions of other pollutants such as volatile organic compounds (VOCs) and NOx. Ozone formation can occur many miles downwind from the source of the original emissions. These reactions occur in the presence of strong sunlight and are most pronounced during the hottest days of the summer. The PAMS (Photochemical Assessment Monitoring Stations) program established by the 1990 Clean Air Act Amendments as an accurate way to collect data for assessing NAAQS attainment progress independent of the meteorological variation that occurs between years and for identifying appropriate pollution control strategies.
PAMS is a special designation for enhanced monitoring stations that are designed to gather information on the ozone formation process. Instrumentation at these sites measures pollutants and meteorological parameters that are specific to the photochemical processes by which ozone is created in the atmosphere at ground level. In addition to the standard NAAQS pollutants (ozone, NO2, etc.) that are measured at other sites, non-criteria pollutants, including VOCs, are measured at PAMS stations on either an hourly basis or at regular intervals during the hottest part of the summer in June, July and August. Meteorology is a critical component of ozone formation and each PAMS site has a full complement of meteorological sensors including wind speed, wind direction, temperature, relative humidity, barometric pressure, solar radiation and at some sites, total ultraviolet light and precipitation.
MassDEP also operated a Doppler Radar atmospheric profiler in Stow, Massachusetts in support of the PAMS program. This instrument measured temperature and wind profiles at different levels of the atmosphere that provided valuable information on upper level conditions that contribute to ozone formation. The operation of this instrument was discontinued in September 2011, due to the loss of access to the monitoring site location.
Since the PAMS project started in 1993, Massachusetts has conducted enhanced ozone precursor measurements in the Boston and Springfield Metropolitan Areas and to assist Rhode Island in the measurement of ozone precursors and reactants at locations downwind of Providence, RI.
PAMS Monitoring AreasBoston Springfield ProvidenceBlue Hill (Milton) Chicopee Blue Hill (Milton)Lynn WareNewburyport Long Island
Note: Blue Hill provides data for Boston and Providence networks.
34
PAMS Site Descriptions:
Type 1 – Upwind Site. VOC samples are taken every third day, and eight 3-hour samples are taken per day during the summer season (June, July and August). Blue Hill is the current Type 1 site for Boston and Type 3 site (downwind) for Providence. There is no current Type 1 site for Springfield.
Type 2 - Urban (Downwind Edge site). Type 2 sites are the most intensive measurement sites in the PAMS program. VOCs are measured hourly by automated gas chromatographs during the summer season. Carbonyls (e.g., acetaldehyde and formaldehyde) samples are taken every third day, and eight 3-hour samples are taken per day during the summer season. 24-hour VOC samples are taken every sixth day throughout the year. Lynn is Boston’s Type 2 site and Chicopee is Springfield’s Type 2 site. Larger metropolitan areas were originally required to have Type 2 sites in the two most prevalent wind directions. Long Island (Boston) was designated as a second Boston Type 2 site in the late 1990s, but was subsequently scaled back and now is sampled on a Type 1 site schedule.
Type 3 – Downwind where highest ozone measurements are expected. Newburyport is Boston’s Type 3 site and Ware is Springfield’s Type 3 site. The required sampling schedule is the same as Type 1, but MassDEP has chosen to operate automated gas chromatographs for VOCs at these sites. No carbonyl measurements are taken at either Type 1 or Type 3 sites.
Air Toxics Monitoring
Toxic air pollutants are distinct from criteria air pollutants such as ozone and CO and are known or suspected to cause cancer or other serious health effects. Air toxics include certain volatile organic compounds (VOCs) and toxic metals (e.g., mercury).
MassDEP monitors VOCs as part of the PAMS monitoring program, some of which are classified as air toxics. MassDEP obtains health-relevant VOC concentration data throughout the year at the PAMS Type 2 sites.
The Boston (Harrison Avenue) monitoring site is designated as a National Air Toxics Trends Station (NATTS) designed to collect and quantify a number of toxic air pollutants, including VOCs, metals, carbonyls, black carbon and polycyclic aromatic hydrocarbons (PAHs). Data from this site is compared with data from a network of similar sites across the country to identify transport, trends and site-specific characteristics of these pollutants.
Figure 10 summarizes concentrations of 24-hour health-relevant target compounds for samples taken at the Lynn PAMS site from 1994 to 2011. Significant mean concentration decreases seen between 1994 and 1995 are likely due to the introduction of reformulated gasoline at the beginning of 1995. Allowable Ambient Limit (AAL) values are presented next to Figure 10 for reference. AALs are health-based air toxics guidelines developed by MassDEP based on known or suspected carcinogenic and toxic health properties of individual compounds. AAL concentrations were developed for a 70-year lifetime exposure, but are used for comparison with annual averages.
35
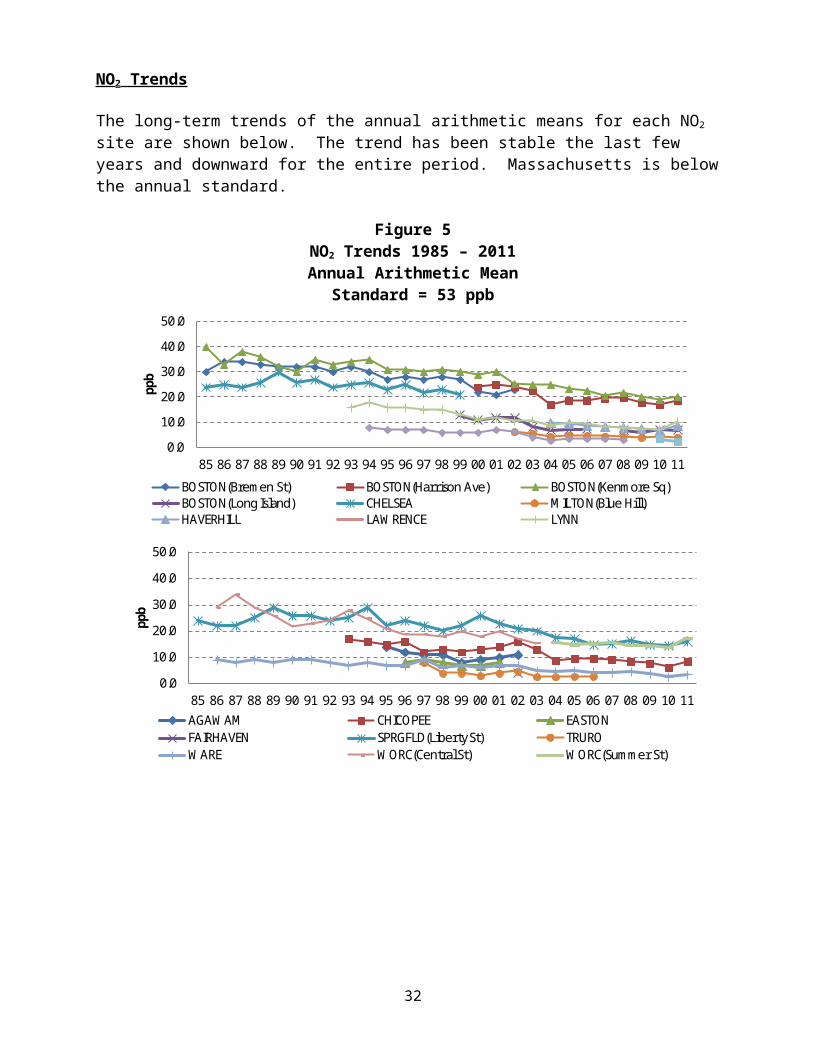
Figure 9
0.0
0.5
1.0
1.5
2.0
1994 1995 1996 1997 1998 1999 2000 2001 2002 2003 2004 2005 2006 2007 2008 2009 2010 2011
part
s pe
r bill
ion
volu
me
(ppb
v)
Year
Lynn Toxics Summary 1994 - 201124-hour samples Benzene
Toluene
Ethyl Benzene
Xylenes
AALs (ppbv)Benzene = .04Toluene = 5.3Ethyl benzene = 69.1Xylenes = 2.7
Below is a table that summarizes results from the analysis of 24-hour samples for target VOCs from the Boston (Harrison Ave) and Lynn sites for 2011. Harrison Avenue serves as the central city sampling location and Lynn serves as the area background site.
BOSTON (Harrison Ave) LYNN Compound Max Value Mean Max Value Mean
ppb ppb ppb ppb1,3-butadiene .062 .026 .028 .011
1,1,1-trichloroethane .019 .007 .012 .007trichloroethylene .012 .004 .032 .004
tetrachloroethylene .085 .020 .044 .014Benzene .350 .165 .190 .111Toluene 1.604 .362 .726 .178Xylenes .893 .166 .222 .077
Ethylbenzene .201 .048 .071 .025
Samples collected at the Harrison Avenue site are analyzed for a suite of metals that are known to be toxic in the environment. The table below summarizes the 2011 metals data.
# of Max Value MeanMetal Samples g/m3 g/m3
Chromium 59 .00323 .00226
Antimony 59 .00178 .00089Arsenic 59 .00126 .00042
Beryllium 59 .00012 .00001Cadmium 59 .00290 .00013
Cobalt 59 .00023 .00010
Lead 59 .01040 .00303Manganese 59 .00948 .00347
Nickel 59 .00432 .00141Mercury 59 .00002 .00001
Selenium 59 .00085 .00027
BOSTON (Harrison Ave)
36
Appendix A 2011 MassDEP Monitoring Station Locations
DATE SITE SITE ID CITY COUNTY ADDRESS ESTABLISHED MONITORED25-003-4002 ADAMS BERKSHIRE MT. GREYLOCK 5/1/1989 O325-015-0103 AMHERST HAMPSHIRE NORTH PLEASANT 4/1/1988 O3TT-030-0001 AQUINNAH DUKES HERRING CREEK RD 4/1/2004 O325-025-0002 BOSTON SUFFOLK KENMORE SQUARE 1/1/1965 SO2, NO, NO2, NOx, CO, PM2.5 FRM, PM1025-025-0027 BOSTON SUFFOLK ONE CITY SQUARE 1/1/1985 PM2.5 FRM, PM10
25-025-0041 BOSTON SUFFOLK LONG ISLAND 12/1/1998O3, NO, NO2, NOx, VOCs, WS/WD, TEMP, Solar Rad, RH, BP
25-025-0042 BOSTON SUFFOLK HARRISON AVENUE 12/15/1998
O3, SO2 trace, NO, NO2, NOx, CO trace, PM2.5 FRM, PM2.5 BAM, PM2.5 Speciation, PM10, Lead, Toxics, Black Carbon, WS/WD, TEMP, Solar Rad, RH, BP
25-025-0043 BOSTON SUFFOLK 174 NORTH ST 1/1/2000 PM2.5 FRM, PM2.5 BAM, Black Carbon25-023-0004 BROCKTON PLYMOUTH 120 COMMERCIAL ST 12/15/1998 PM2.5 FRM25-017-0009 CHELMSFORD MIDDLESEX 11 TECHNOLOGY DR 4/1/2005 O3
25-013-0008 CHICOPEE HAMPDEN ANDERSON RD 1/1/1983O3, NO, NO2, NOx, PM2.5 FRM, PM2.5 speciation, VOCs, TEMP, WS/WD, Solar Rad, RH, BP
25-005-1002 FAIRHAVEN BRISTOL LEROY WOOD 1/1/1982 O3, WS/WD, TEMP, Solar Rad, RH, BP25-005-1004 FALL RIVER BRISTOL GLOBE ST 2/1/1975 PM2.5 FRM, PM2.5 BAM, SO2
25-009-5005 HAVERHILL ESSEX WASHINGTON ST 7/19/1994O3, NO, NO2, NOx, PM2.5 FRM, PM2.5 BAM, WS/WD, TEMP, Solar Rad, RH, BP
25-009-6001 LAWRENCE ESSEX WALL EXPERIMENT STA. 4/3/1999 PM2.5 FRM25-017-0007 LOWELL MIDDLESEX OLD CITY HALL 7/17/1981 CO
25-009-2006 LYNN ESSEX 390 PARKLAND 1/1/1992
O3, NO, NO2, NOx, PM2.5 FRM, PM2.5 BAM, CO trace, VOCs, Toxics, WS/WD, TEMP, Solar Rad, RH, BP, UVB, PRECIP
25-021-3003 MILTON NORFOLK BLUE HILL 4/2/2002O3, NO, NO2, NOx, PM2.5 BAM, VOCs, WS/WD, TEMP, Solar Rad, RH, BP
25-009-4005 NEWBURYPORT ESSEX HARBOR STREET 7/6/2010O3, NO, NO2, NOx, NOy, VOCs, WS/WD, TEMP, Solar Rad, RH, BP
25-003-5001 PITTSFIELD BERKSHIRE 78 CENTER STREET 11/6//98 PM2.5 FRM25-003-0006 PITTSFIELD BERKSHIRE BERKSHIRE COMMONS 1/1/79 PM2.5 BAM
25-013-0016 SPRINGFIELD HAMPDEN LIBERTY STREET 4/1/1988SO2, NO, NO2, NOx, CO, Black Carbon, PM2.5 FRM, PM2.5 BAM
25-013-2009 SPRINGFIELD HAMPDEN 1860 MAIN STREET 1/1/2002 PM2.5 FRM, PM1025-017-1102 STOW MIDDLESEX US MILITARY 4/1/1998 O3, Profiler, WS/WD, TEMP, Solar Rad, RH, BP 25-001-0002 TRURO BARNSTABLE FOX BOTTOM AREA 4/1/1987 O3, IMPROVE, WS/WD, TEMP, Solar Rad, RH, BP25-027-0024 UXBRIDGE WORCESTER 366 E HARTFORD AVE 11/13/2008 O3, WS/WD, TEMP, Solar Rad, RH, BP
25-015-4002 WARE HAMPSHIRE QUABBIN SUMMIT 6/1/1985
O3, SO2 trace, NO, NO2, NOx, NOy, PM10, VOCs, PM2.5 BAM, IMPROVE, WS/WD, TEMP, Solar Rad, RH, BP, PRECIP
25-027-0015 WORCESTER WORCESTER WORC. AIRPORT 5/7/1979 O3, WS/WD, TEMP, Solar Rad, RH, BP,25-027-0016 WORCESTER WORCESTER 2 WASHINGTON ST 12/31/2002 PM2.5 FRM
25-027-0023 WORCESTER WORCESTER SUMMER STREET 1/1/2004SO2, NO, NO2, NOx, CO, PM2.5 FRM, PM2.5 BAM, PM10
2011 Private Monitoring Station Locations DATE SITE SITE ID CITY COUNTY ADDRESS ESTABLISHED MONITORED25-025-0019 BOSTON SUFFOLK LONG ISLAND 1/1/1978 SO2, TSP, SO4, WS/WD 25-025-0020 BOSTON SUFFOLK DEWAR STREET 1/1/1978 SO2, TSP, SO4, WS/WD 25-025-0021 BOSTON SUFFOLK BREMEN STREET 1/1/1979 SO2, TSP, SO4, WS/WD 25-025-0040 BOSTON SUFFOLK 531A EAST FIRST ST 1/1/1993 SO2, TSP, SO4, NO2, WS/WD
37