Embed Size (px)
Citation preview
Commonwealth Energy Biogas/PV Mini-Grid Renewable Resources Program
Making Renewables Part of an Affordable and
Diverse Electric System in California
Contract No. 500-00-036
Photovoltaic & Biogas Generation Profiles
Project No. 1.1 Program Planning and Analysis
Task 1.1.8 Final Report
Prepared For: California Energy Commission
Public Interest Energy Research Renewable Program
Prepared By:
1104 Main Street, Suite 630 Vancouver, WA 98660
April 2004
BI-PV Technical Potential Report – Task 1.1.5
Legal Notice
This report was prepared as a result of work sponsored by the California Energy Commission
(Commission). It does not necessarily represent the views of the Commission, its employees, or the
State of California. The Commission, the State of California, its employees, contractors, and
subcontractors, make no warranty, express or implied, and assume no legal liability for the information
in this report; nor does any party represent that the use of this information will not infringe upon
privately owned rights. This report has not been approved or disapproved by the Commission nor has
the Commission passed upon the accuracy or adequacy of the information in this report.

Table of Contents
Preface...................................................................................................................P-1
1 Introduction........................................................................................................ 1-1 1.1 Overview of Commonwealth Program Planning and Analysis Project .......... 1-1 1.2 Electric Generation Profiles .......................................................................... 1-2 1.3 Report Organization...................................................................................... 1-2
2 PV Generation Profiles ...................................................................................... 2-1 2.1 Overview....................................................................................................... 2-1 2.2 Data Sources................................................................................................ 2-2
TMY2 Weather Data .................................................................................................................2-2 Sandia PV System Performance Research ..............................................................................2-2 California Energy Commission PV Research ...........................................................................2-4
2.3 Analytic Methodology.................................................................................... 2-4 2.4 Results.......................................................................................................... 2-5
Flexibility of Generation Profiles..............................................................................................2-11 2.5 Discussion of Results ................................................................................. 2-12
Basis of Normalizing System Size ..........................................................................................2-12 Comparison to Other Findings ................................................................................................2-12 Simplifying Assumptions .........................................................................................................2-14
2.6 Conclusions ................................................................................................ 2-14 References..............................................................................................................................2-15
3 Biogas Generation Profiles............................................................................... 3-1 3.1 Overview....................................................................................................... 3-1 3.2 Biogas Resource Characteristics.................................................................. 3-1 3.3 Results.......................................................................................................... 3-3
Flexibility of Generation Profiles................................................................................................3-8 3.4 Discussion of Results ................................................................................. 3-10
Landfill Gas Production Lifecycle............................................................................................3-10 3.5 Conclusions ................................................................................................ 3-10
Appendix A Generation Profiles Database Guide ............................................. A-1
Table of Contents i
Photovoltaic & Biogas Generation Profiles Report
List of Tables Table 2-1: Summary of PV Generation Profile Characteristics ............................... 2-1 Table 2-2: Annual Energy Production for Typical Crystalline
Configurations.................................................................................................. 2-6 Table 2-3: Assumed System Characteristics - Mini-Grid Market
Potential........................................................................................................... 2-8 Table 2-4: Actual System Characteristics – PIER Commonwealth BI-
PV Program ................................................................................................... 2-10 Table 2-5: Comparison of Itron and PVWatts Results for L.A. TMY2
Weather Station (Per 1.0 kW AC-PTC).......................................................... 2-13 Table 2-6: Relative Annual PV Energy Production Versus
Configuration ................................................................................................. 2-13 Table 3-1: Annual Electric Energy Production versus Technology ......................... 3-4 Table 3-2: Characteristics of Biogas Composite ..................................................... 3-5 Table 3-3: System Characteristics – PIER Commonwealth Biogas
Progams .......................................................................................................... 3-7 Table A-1: Fields in the MS Access PV Generation Profiles Table ............................ 1 Table A-2: Fields in the MS Access Biogas Generation Profiles Table...................... 2
List of Figures Figure 2-1: Angle of Incidence Factor ..................................................................... 2-3 Figure 2-2: Air Mass Factor (Amorphous PV Material) ........................................... 2-3 Figure 2-3: Graphical Summary of PV Generation Profiles for Several
Typical Cases .................................................................................................. 2-6 Figure 2-4: Generation Profile (Normalized) – Mini-Grid BI-PV Market
Potential........................................................................................................... 2-8 Figure 2-5: Generation Profile Summary – Mini-Grid BI-PV Market
Potential........................................................................................................... 2-9 Figure 2-6: Generation Profile (Normalized) – PIER Commonwealth BI-
PV Program ................................................................................................... 2-10 Figure 2-7: Generation Profile Summary – PIER Commonwealth BI-PV
Program......................................................................................................... 2-11 Figure 3-1: Ambient Temperature Influence on Power Output................................ 3-3 Figure 3-2: Graphical Summary of Reciprocating Engine Generation
Profiles............................................................................................................. 3-4 Figure 3-3: Graphical Summary of Gas Turbine Generation Profiles...................... 3-5 Figure 3-4: Graphical Summary of Composite Biogas Generation
Profile............................................................................................................... 3-6 Figure 3-5: Generation Profile Summary – Chino Mini-grid Biogas
Market Potential ............................................................................................... 3-7 Figure 3-6: Generation Profile Summary – PIER Commonwealth
Biogas Projects................................................................................................ 3-8
ii Table of Contents
Preface
The Public Interest Energy Research (PIER) Program supports public interest energy research and development that will help improve the quality of life in California by bringing environmentally safe, affordable, and reliable energy services and products to the marketplace. The PIER Program, managed by the California Energy Commission (Commission), annually awards up to $62 million to conduct the most promising public interest energy research by partnering with Research, Development, and Demonstration (RD&D) organizations, including individuals, businesses, utilities, and public or private research institutions. PIER funding efforts are focused on the following six RD&D program areas:
Buildings End-Use Energy Efficiency Industrial/Agricultural/Water End-Use Energy Efficiency Renewable Energy Environmentally-Preferred Advanced Generation Energy-Related Environmental Research Strategic Energy Research
For more information on the PIER Program, please visit the Commission’s Website at: http://www.energy.ca.gov/research/index.html or contact the Commission’s Publications Unit at 916-654-5200. For Commonwealth Program-specific information, please visit: http: //www.pierminigrid.org. What follows is a comparison report for the California Energy Commission, Public Interest Energy Research Program, Contract Number 500-00-036, conducted by the Commonwealth Energy Team. The report is entitled, “Photovoltaic & Biogas Generation Profiles”. This project contributes to the Renewable Energy Component of the PIER Program.
Preface P-1

1 Introduction
This report summarizes methods and findings of a study of the electric generation profiles of building-integrated photovoltaics (BI-PV) and biogas-based energy systems in California. The study was conducted by Itron, Inc. (Itron) for the California Energy Commission (Commission) under Contract No. 500-00-036 Task 1.1.8. This task is one element of the broader Commonwealth Energy Biogas/PV Renewable Mini-Grid Program (Program) being administered through the Commission’s Public Interest Energy Research (PIER) group. The general, overall purpose of the broader Commonwealth Renewables Program is to increase the affordability of renewable energy in California through demonstration of new applications and quantification of energy and environmental benefits recognized by the market. 1.1 Overview of Commonwealth Program Planning and Analysis Project The primary objectives of the Commonwealth PIER Program Planning and Analysis Project are to:
Define the initial study area,
Inventory the study area’s potential photovoltaic and biogas resources to assess the potential of such resources and to identify potential demonstration projects,
Identify a mini-grid where the potential impact of the development of such
resources can be assessed,
Conduct power flow studies to identify and quantify the benefits of renewable energy projects on the local electric distribution system,
Identify and prioritize individual demonstration projects, and
Identify cost savings and benefits that would accrue by developing complementary resources.
A multidisciplinary team led by Itron and supported by CH2MHill and the Renewable Energy Development Institute (REDI), is responsible for meeting these program-planning objectives. CH2MHill is responsible for undertaking the various biogas resource inventory assessments. Itron and REDI jointly develop estimates of BI-PV technical potential. Power flow and other studies related to the mini-grid are being undertaken by Zaininger
Introduction 1-1

Photovoltaic & Biogas Generation Profiles Report
1-2 Introduction
Engineering Company (ZECO). As mentioned above, the electric generation profiles documented in this report were developed by Itron. 1.2 Electric Generation Profiles The purpose of this task is to develop electric generation profile information that will ultimately support estimation of possible impacts on the electric grid of BI-PV and biogas development in the mini-grid area. In addition to generation profiles, this report includes an assessment of the flexibility of each generation profile based upon: 1) proposed program, and 2) fully realized mini-grid market potential. The generation profiles presented in this report describe the shape of charts depicting power output versus time. Estimation of impacts on the electric grid will require combining the generation shape information with estimates of market potential yielded by Task 1.1.7, Assess Electricity Market Potential (MW’s) of biogas and commercial PV within the mini-grid region. This synthesis of sub-task results will be accomplished using power flow modeling that will be completed under Task 1.1.9 of the Program Planning and Analysis Project. 1.3 Report Organization Both hourly and seasonal average generation profiles were developed for BI-PV and Biogas resources. The BI-PV profiles are described in Section 2, while the Biogas profiles are covered in Section 3. Hourly generation profiles are saved electronically in a MS Access database. The structure and content of this database are summarized in Appendix A.
2 PV Generation Profiles
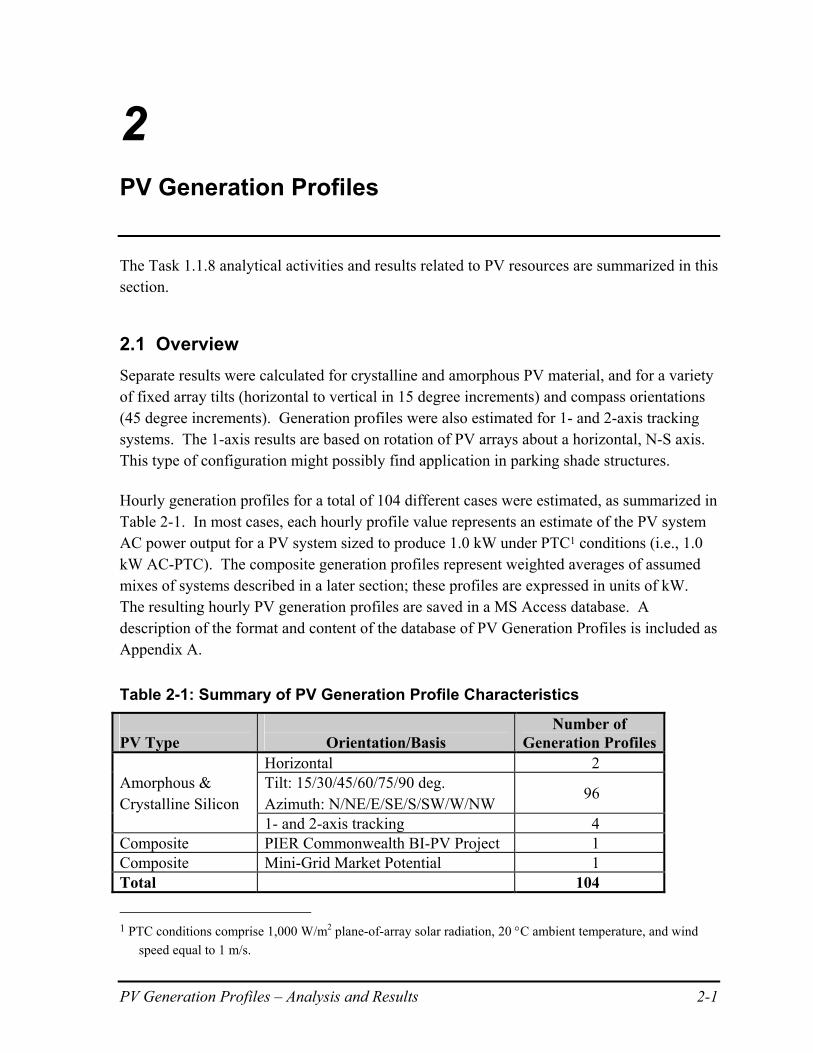
The Task 1.1.8 analytical activities and results related to PV resources are summarized in this section. 2.1 Overview Separate results were calculated for crystalline and amorphous PV material, and for a variety of fixed array tilts (horizontal to vertical in 15 degree increments) and compass orientations (45 degree increments). Generation profiles were also estimated for 1- and 2-axis tracking systems. The 1-axis results are based on rotation of PV arrays about a horizontal, N-S axis. This type of configuration might possibly find application in parking shade structures. Hourly generation profiles for a total of 104 different cases were estimated, as summarized in Table 2-1. In most cases, each hourly profile value represents an estimate of the PV system AC power output for a PV system sized to produce 1.0 kW under PTC1 conditions (i.e., 1.0 kW AC-PTC). The composite generation profiles represent weighted averages of assumed mixes of systems described in a later section; these profiles are expressed in units of kW. The resulting hourly PV generation profiles are saved in a MS Access database. A description of the format and content of the database of PV Generation Profiles is included as Appendix A.
Table 2-1: Summary of PV Generation Profile Characteristics
PV Type
Orientation/Basis
Number of Generation Profiles
Horizontal 2 Amorphous & Crystalline Silicon
Tilt: 15/30/45/60/75/90 deg. Azimuth: N/NE/E/SE/S/SW/W/NW
96
1- and 2-axis tracking 4 Composite PIER Commonwealth BI-PV Project 1 Composite Mini-Grid Market Potential 1 Total 104
1 PTC conditions comprise 1,000 W/m2 plane-of-array solar radiation, 20 °C ambient temperature, and wind
speed equal to 1 m/s.
PV Generation Profiles – Analysis and Results 2-1
Photovoltaic & Biogas Generation Profiles Report
2.2 Data Sources For a given PV system, the power output during any hour is sensitive to weather and to several key performance characteristics of the PV material and system. The several key data sources used in the PV generation profile analysis are identified below and described in the following sections.
TMY2 Weather Data, Sandia PV System Performance Research, and California Energy Commission PV Research.
TMY2 Weather Data
The U.S. Department of Energy's National Renewable Energy Laboratory has sponsored development of a National Solar Radiation Database. This database has been used to create hourly, typical-year weather data files for 239 locations throughout the United States. Typical meteorological year ambient temperature and solar radiation data for Los Angeles were used in this analysis. Beam and diffuse solar radiation data were used in calculations of plane-of-array solar radiation, while ambient temperature was used in the calculation of PV system performance adjustment factors. Sandia PV System Performance Research
PV module power output may be sensitive not only to geometric “cosine” effects2 that influence the intensity of beam radiation striking the module surface, but also to other angle of incidence (AOI) effects related to reflectivity or other factors. Sandia National Laboratories has studied these other angle of incidence effects and published results in terms of an AOI Factor that summarizes the influence of angle of incidence on PV power output. Data presented in a Sandia report (King, 2002) were used to fit a curve relating AOI Factor to angle of incidence, where the angle of incidence is the angle between the beam radiation on a surface and the normal to that surface. The result is depicted graphically in Figure 2-1. The AOI Factor values for crystalline and amorphous PV material are similar so a single AOI Factor curve is used in the analysis.
2 The term ‘geometric cosine effect’ refers to a relationship between the intensity of beam radiation striking PV
modules (and hence their power output) and the angle between that beam radiation and a line perpendicular to the PV module surface (i.e., angle of incidence). As the incidence angle increases above zero degrees (where the cosine is equal to 1), the intensity of beam radiation varies as the cosine of the angle of incidence.
2-2 PV Generation Profiles – Analysis and Results
Photovoltaic & Biogas Generation Profiles Report
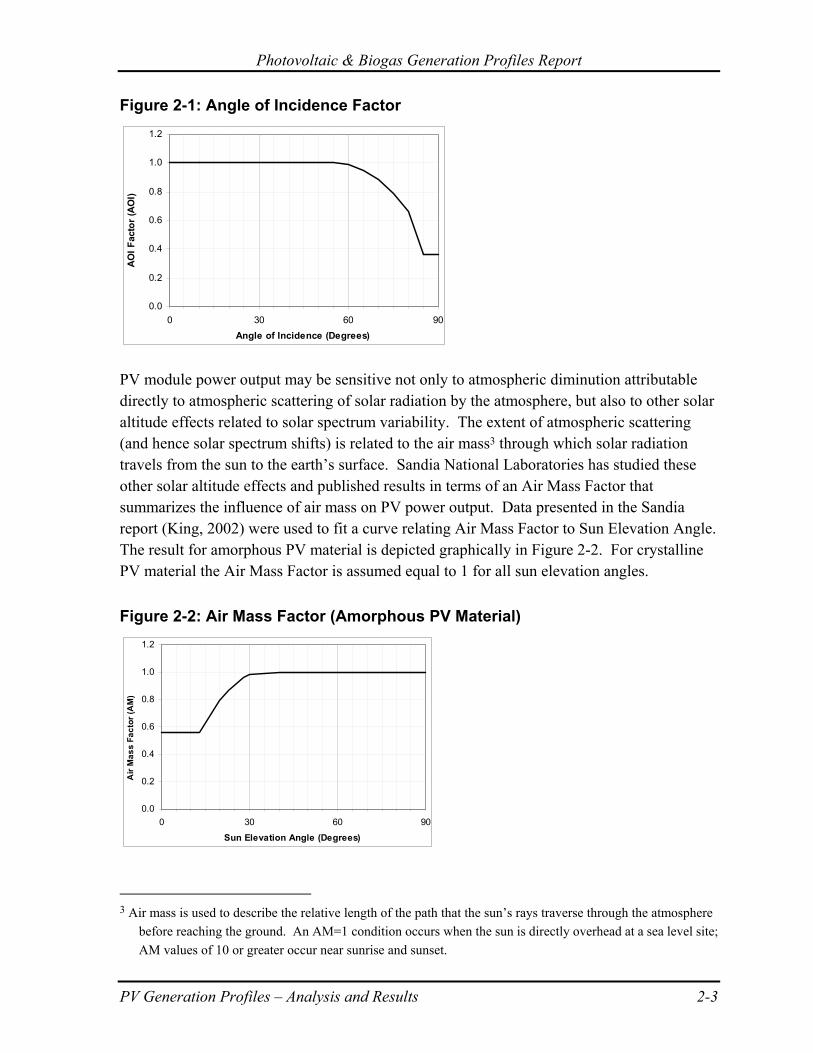
Figure 2-1: Angle of Incidence Factor
0.0
0.2
0.4
0.6
0.8
1.0
1.2
0 30 60Angle of Incidence (Degrees)
AO
I Fac
tor (
AO
I)
90
PV module power output may be sensitive not only to atmospheric diminution attributable directly to atmospheric scattering of solar radiation by the atmosphere, but also to other solar altitude effects related to solar spectrum variability. The extent of atmospheric scattering (and hence solar spectrum shifts) is related to the air mass3 through which solar radiation travels from the sun to the earth’s surface. Sandia National Laboratories has studied these other solar altitude effects and published results in terms of an Air Mass Factor that summarizes the influence of air mass on PV power output. Data presented in the Sandia report (King, 2002) were used to fit a curve relating Air Mass Factor to Sun Elevation Angle. The result for amorphous PV material is depicted graphically in Figure 2-2. For crystalline PV material the Air Mass Factor is assumed equal to 1 for all sun elevation angles.
Figure 2-2: Air Mass Factor (Amorphous PV Material)
0.0
0.2
0.4
0.6
0.8
1.0
1.2
0 30 60 9
Sun Elevation Angle (Degrees)
Air
Mas
s Fa
ctor
(AM
0
)
3 Air mass is used to describe the relative length of the path that the sun’s rays traverse through the atmosphere
before reaching the ground. An AM=1 condition occurs when the sun is directly overhead at a sea level site; AM values of 10 or greater occur near sunrise and sunset.
PV Generation Profiles – Analysis and Results 2-3
Photovoltaic & Biogas Generation Profiles Report
California Energy Commission PV Research
The California Energy Commission has supported recent research concerning the performance of PV systems installed in the residential sector. Included in this work was an investigation of relationships between ambient weather conditions and PV module temperature. Findings of this work were used in the calculation of adjustment factors used to incorporate temperature effects into the analysis. 2.3 Analytic Methodology The TMY2 data were used in combination with solar radiation models from a solar engineering textbook (Duffie & Beckman, 1991) to calculate hourly estimates of plane-of-array solar radiation. A ground reflectivity of 0.2 was assumed in the Perez diffuse solar radiation model calculations. Results of the solar geometry calculations were adjusted to incorporate angle-of-incidence and solar spectrum effects that influence photovoltaic system performance. Adjusted plane of array solar radiation results were used in PV module temperature and PV system power output calculations. The angle-of-incidence factor AOI from Figure 2-1 was applied to the beam component of solar radiation only. Strictly speaking, available data suggest use of different adjustment factors for crystalline silicon (c-Si) and amorphous silicon (a-Si) PV materials, but the difference is relatively small in the context of the other sources of uncertainty and variability in this analysis so a single AOI adjustment curve was used for both c-Si and a-Si. The air mass factor AM from Figure 2-2 was applied to both the beam and diffuse components of solar radiation. For c-Si the factor is relatively minor so is neglected. The estimate of total effective solar radiation on the tilted plane of the array was calculated as:
( )rdbe IIAOIIAMI ++××=
Where:
eI = Total effective solar radiation on the tilted plane of the array bI = Beam solar radiation on the tilted plane of the array
AOI = Angle-of-Incidence Factor AM = Air Mass Factor
dI = Diffuse solar radiation on the tilted plane of the array rI = Reflected solar radiation on the tilted plane of the array
Next, for each hour an initial estimate of power output was calculated for a 1.0 kW AC-PTC PV system. The initial estimate of power output accounted for the actual, effective solar
2-4 PV Generation Profiles – Analysis and Results
Photovoltaic & Biogas Generation Profiles Report
radiation during the hour, but did not account for temperature effects. The initial estimate of power output was calculated as:
PTC
ei I
IPV =
Where:
iPV = Initial estimate of PV system power output PTCI = Total solar radiation on the tilted plane of the array for PTC
conditions (i.e., 1,000 W/m2) The actual module temperature for each hour was estimated by adjusting from the PTC module temperature depending on ambient temperature and plane-of-array solar radiation, based on the following assumptions:
Power is produced only when solar radiation exceeds 30 W/m2,
Module temperature is 48.5 °C at PTC conditions (i.e., 20 °C ambient, 1,000 W/m2),
A drop from 1,000 to 900 W/m2 yields a drop in module temperature of 3.4 °C,
An increase in ambient temperature from 20 °C to 37.8 °C yields an increase in
module temperature of 20.2 °C,
PV module temperature is never less than ambient temperature,
1 °C increase in crystalline module temperature yields a 0.5% power output decrease, and
1 °C increase in amorphous module temperature yields a 0.25% power output
decrease. The final estimate of PV system power output was calculated as:
( )TEMPPVPV i +×= 1
Where:
PV = Final estimate of PV system power output TEMP = Power output factor accounting for module temperature effects 2.4 Results Hourly PV generation profiles are saved in the MS Access database accompanying this report. A description of the layout of the database is included as Appendix A. Annual
PV Generation Profiles – Analysis and Results 2-5
Photovoltaic & Biogas Generation Profiles Report
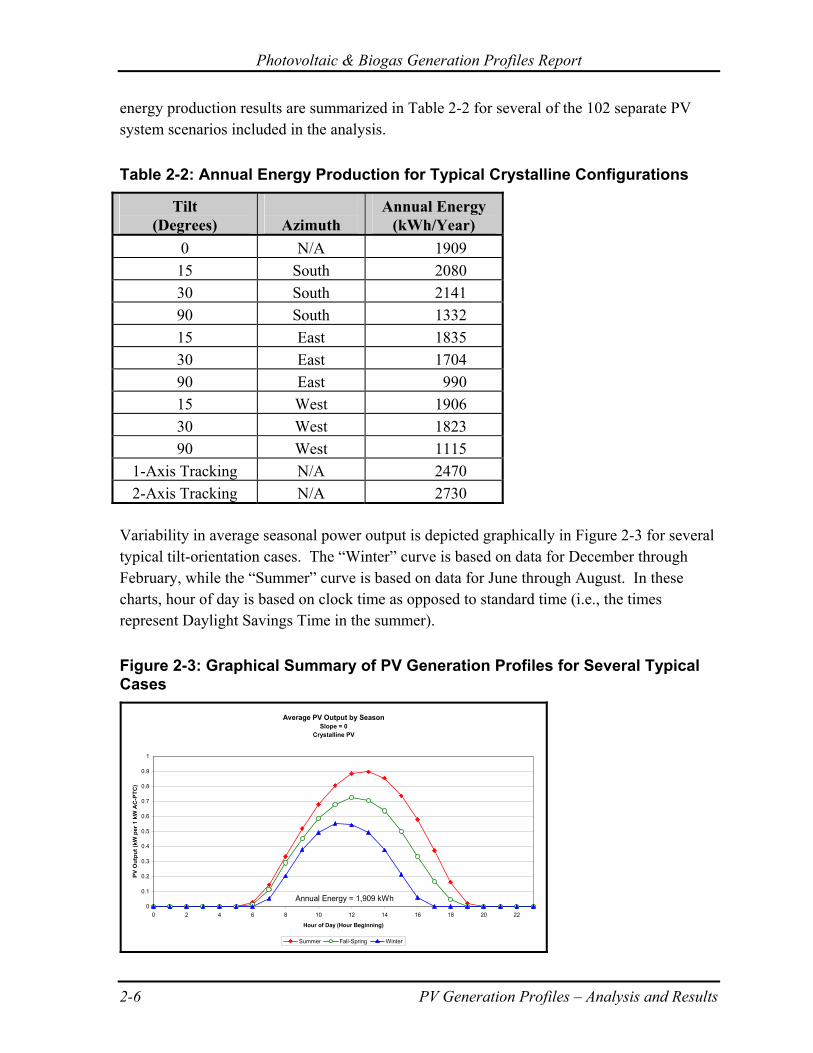
energy production results are summarized in Table 2-2 for several of the 102 separate PV system scenarios included in the analysis.
Table 2-2: Annual Energy Production for Typical Crystalline Configurations
Tilt (Degrees)
Azimuth
Annual Energy (kWh/Year)
0 N/A 1909 15 South 2080 30 South 2141 90 South 1332 15 East 1835 30 East 1704 90 East 990 15 West 1906 30 West 1823 90 West 1115
1-Axis Tracking N/A 2470 2-Axis Tracking N/A 2730
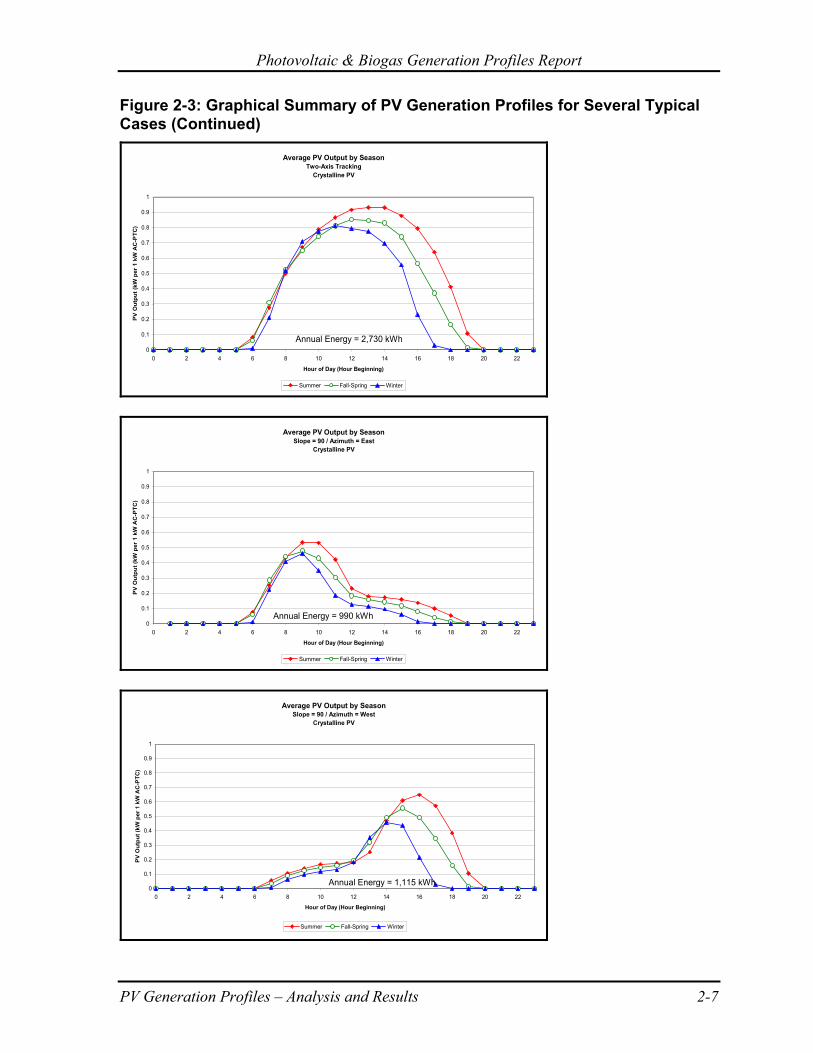
Variability in average seasonal power output is depicted graphically in Figure 2-3 for several typical tilt-orientation cases. The “Winter” curve is based on data for December through February, while the “Summer” curve is based on data for June through August. In these charts, hour of day is based on clock time as opposed to standard time (i.e., the times represent Daylight Savings Time in the summer).
Figure 2-3: Graphical Summary of PV Generation Profiles for Several Typical Cases
Average PV Output by SeasonSlope = 0
Crystalline PV
0
0.1
0.2
0.3
0.4
0.5
0.6
0.7
0.8
0.9
1
0 2 4 6 8 10 12 14 16 18 20 22
Hour of Day (Hour Beginning)
PV O
utpu
t (kW
per
1 k
W A
C-P
TC)
Summer Fall-Spring Winter
Annual Energy = 1,909 kWh
2-6 PV Generation Profiles – Analysis and Results
Photovoltaic & Biogas Generation Profiles Report
Figure 2-3: Graphical Summary of PV Generation Profiles for Several Typical Cases (Continued)
Average PV Output by SeasonTwo-Axis Tracking
Crystalline PV
0
0.1
0.2
0.3
0.4
0.5
0.6
0.7
0.8
0.9
1
0 2 4 6 8 10 12 14 16 18 20 22
Hour of Day (Hour Beginning)
PV
Out
put (
kW p
er 1
kW
AC
-PTC
)
Summer Fall-Spring Winter
Annual Energy = 2,730 kWh
Average PV Output by SeasonSlope = 90 / Azimuth = East
Crystalline PV
0
0.1
0.2
0.3
0.4
0.5
0.6
0.7
0.8
0.9
1
0 2 4 6 8 10 12 14 16 18 20 22
Hour of Day (Hour Beginning)
PV
Out
put (
kW p
er 1
kW
AC
-PTC
)
Summer Fall-Spring Winter
Annual Energy = 990 kWh
Average PV Output by SeasonSlope = 90 / Azimuth = West
Crystalline PV
0
0.1
0.2
0.3
0.4
0.5
0.6
0.7
0.8
0.9
1
0 2 4 6 8 10 12 14 16 18 20 22
Hour of Day (Hour Beginning)
PV O
utpu
t (kW
per
1 k
W A
C-P
TC)
Summer Fall-Spring Winter
Annual Energy = 1,115 kWh
PV Generation Profiles – Analysis and Results 2-7
Photovoltaic & Biogas Generation Profiles Report
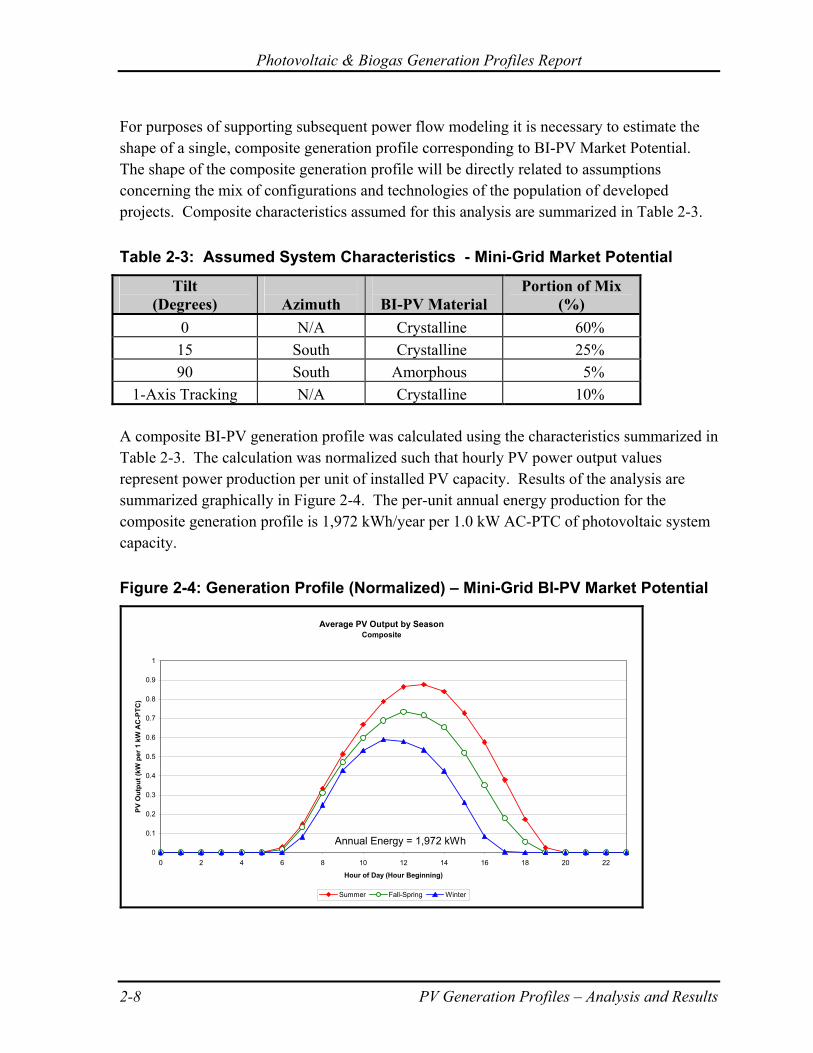
For purposes of supporting subsequent power flow modeling it is necessary to estimate the shape of a single, composite generation profile corresponding to BI-PV Market Potential. The shape of the composite generation profile will be directly related to assumptions concerning the mix of configurations and technologies of the population of developed projects. Composite characteristics assumed for this analysis are summarized in Table 2-3.
Table 2-3: Assumed System Characteristics - Mini-Grid Market Potential
Tilt (Degrees)
Azimuth
BI-PV Material
Portion of Mix (%)
0 N/A Crystalline 60% 15 South Crystalline 25% 90 South Amorphous 5%
1-Axis Tracking N/A Crystalline 10% A composite BI-PV generation profile was calculated using the characteristics summarized in Table 2-3. The calculation was normalized such that hourly PV power output values represent power production per unit of installed PV capacity. Results of the analysis are summarized graphically in Figure 2-4. The per-unit annual energy production for the composite generation profile is 1,972 kWh/year per 1.0 kW AC-PTC of photovoltaic system capacity.
Figure 2-4: Generation Profile (Normalized) – Mini-Grid BI-PV Market Potential
Average PV Output by SeasonComposite
0
0.1
0.2
0.3
0.4
0.5
0.6
0.7
0.8
0.9
1
0 2 4 6 8 10 12 14 16 18 20 22
Hour of Day (Hour Beginning)
PV O
utpu
t (kW
per
1 k
W A
C-P
TC)
Summer Fall-Spring Winter
Annual Energy = 1,972 kWh
2-8 PV Generation Profiles – Analysis and Results

Photovoltaic & Biogas Generation Profiles Report
To develop a market-potential composite BI-PV generation profile for the study period the shape information illustrated in Figure 2-4 was combined with results of the analysis of market potential magnitude. The cumulative mini-grid BI-PV market potential estimated for years 2003 through 2012 ranged from 685 kW to 19,460 kW. The estimate of annual energy production per unit of installed capacity is 1,972 kWh, as indicated in Figure 2-4. Resulting energy production and installed capacity trends for the Market Potential study period are summarized in Figure 2-5.
Figure 2-5: Generation Profile Summary – Mini-Grid BI-PV Market Potential
0
5,000
10,000
15,000
20,000
25,000
30,000
35,000
40,000
45,000
2003
2004
2005
2006
2007
2008
2009
2010
2011
2012
Ener
gy (M
Wh)
0.0
5.0
10.0
15.0
20.0
25.0
Cap
acity
(MW
)
Energy (MWh) Capacity Total (MW) Characteristics of BI-PV systems actually installed through the PIER Commonwealth BI-PV Program differ from those presented in Table 2-2. The characteristics of the five BI-PV systems, which are expected to be installed through the program, are summarized in Table 2-4 on the following page. None of the systems utilize tracking.
PV Generation Profiles – Analysis and Results 2-9
Photovoltaic & Biogas Generation Profiles Report
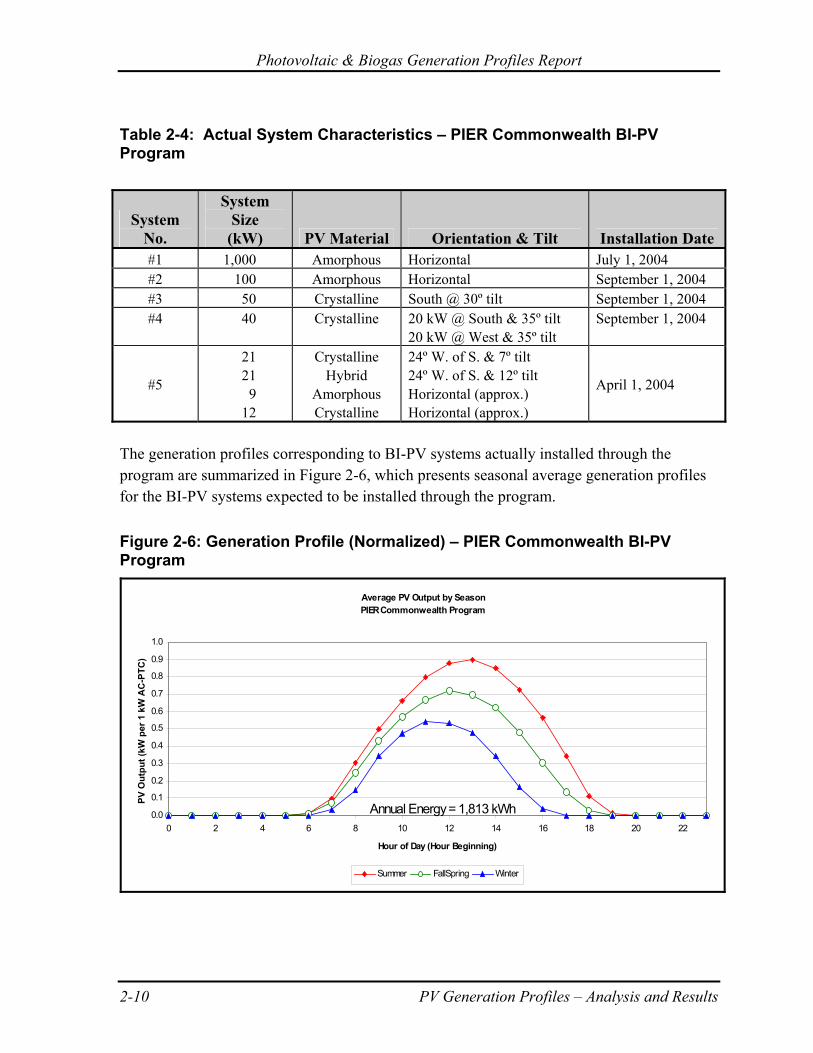
Table 2-4: Actual System Characteristics – PIER Commonwealth BI-PV Program
System No.
System Size
(kW) PV Material Orientation & Tilt Installation Date #1 1,000 Amorphous Horizontal July 1, 2004 #2 100 Amorphous Horizontal September 1, 2004 #3 50 Crystalline South @ 30º tilt September 1, 2004 #4 40 Crystalline 20 kW @ South & 35º tilt
20 kW @ West & 35º tilt September 1, 2004
#5
21 21
9 12
Crystalline Hybrid
Amorphous Crystalline
24º W. of S. & 7º tilt 24º W. of S. & 12º tilt Horizontal (approx.) Horizontal (approx.)
April 1, 2004
The generation profiles corresponding to BI-PV systems actually installed through the program are summarized in Figure 2-6, which presents seasonal average generation profiles for the BI-PV systems expected to be installed through the program.
Figure 2-6: Generation Profile (Normalized) – PIER Commonwealth BI-PV Program
Average PV Output by SeasonPIER Commonwealth Program
0.0
0.1
0.2
0.3
0.4
0.5
0.6
0.7
0.8
0.9
1.0
0 2 4 6 8 10 12 14 16 18 20 22
Hour of Day (Hour Beginning)
PV O
utpu
t (kW
per
1 k
W A
C-P
TC)
Summer FallSpring Winter
Annual Energy = 1,813 kWh
2-10 PV Generation Profiles – Analysis and Results
Photovoltaic & Biogas Generation Profiles Report
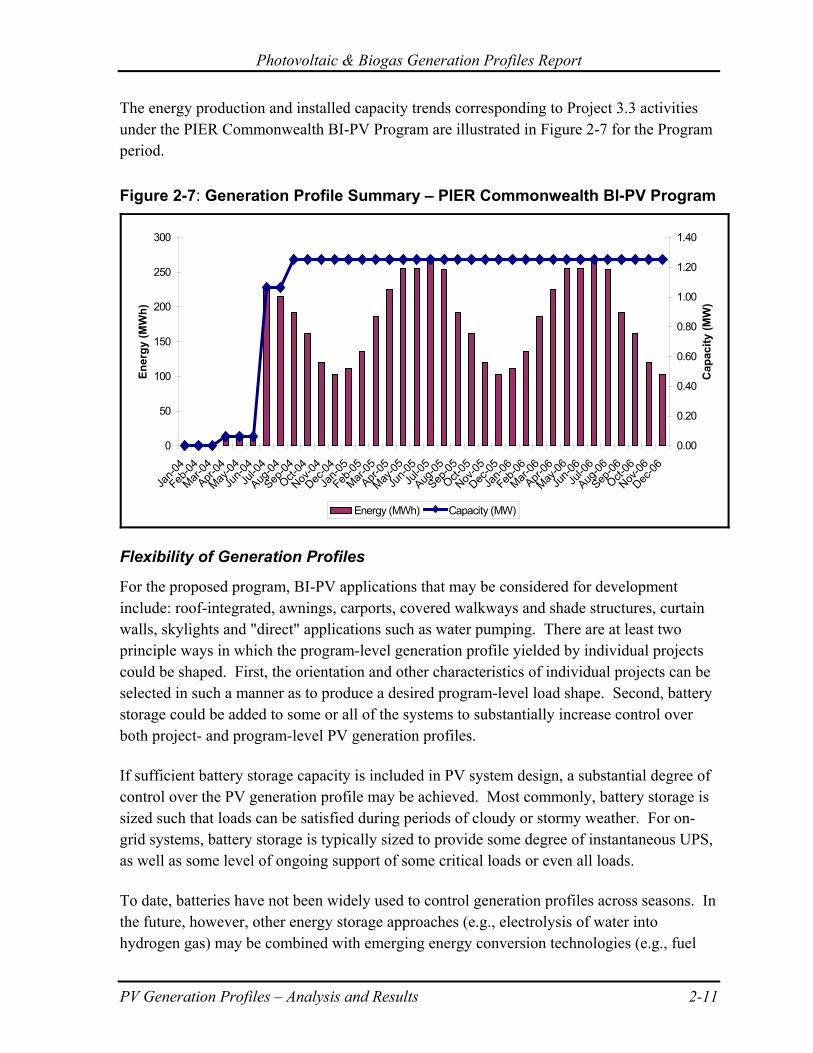
The energy production and installed capacity trends corresponding to Project 3.3 activities under the PIER Commonwealth BI-PV Program are illustrated in Figure 2-7 for the Program period.
Figure 2-7: Generation Profile Summary – PIER Commonwealth BI-PV Program
0
50
100
150
200
250
300
Jan-0
4
Feb-04
Mar-04
Apr-04
May-04
Jun-0
4Ju
l-04
Aug-04
Sep-04
Oct-04
Nov-04
Dec-04
Jan-0
5
Feb-05
Mar-05
Apr-05
May-05
Jun-0
5Ju
l-05
Aug-05
Sep-05
Oct-05
Nov-05
Dec-05
Jan-0
6
Feb-06
Mar-06
Apr-06
May-06
Jun-0
6Ju
l-06
Aug-06
Sep-06
Oct-06
Nov-06
Dec-06
Ener
gy (M
Wh)
0.00
0.20
0.40
0.60
0.80
1.00
1.20
1.40
Cap
acity
(MW
)
Energy (MWh) Capacity (MW)
Flexibility of Generation Profiles
For the proposed program, BI-PV applications that may be considered for development include: roof-integrated, awnings, carports, covered walkways and shade structures, curtain walls, skylights and "direct" applications such as water pumping. There are at least two principle ways in which the program-level generation profile yielded by individual projects could be shaped. First, the orientation and other characteristics of individual projects can be selected in such a manner as to produce a desired program-level load shape. Second, battery storage could be added to some or all of the systems to substantially increase control over both project- and program-level PV generation profiles. If sufficient battery storage capacity is included in PV system design, a substantial degree of control over the PV generation profile may be achieved. Most commonly, battery storage is sized such that loads can be satisfied during periods of cloudy or stormy weather. For on-grid systems, battery storage is typically sized to provide some degree of instantaneous UPS, as well as some level of ongoing support of some critical loads or even all loads. To date, batteries have not been widely used to control generation profiles across seasons. In the future, however, other energy storage approaches (e.g., electrolysis of water into hydrogen gas) may be combined with emerging energy conversion technologies (e.g., fuel
PV Generation Profiles – Analysis and Results 2-11
Photovoltaic & Biogas Generation Profiles Report
cells), to yield a considerable degree of control over PV generation profiles. These emerging technologies may even allow some degree of flexibility where storage of solar energy across seasons is concerned. For this program, PV systems that are strictly grid-tied and that do not include provisions for energy storage are envisioned. Therefore, the flexibility of PV generation profiles for both the program and the fully-realized mini-grid market potential are governed by the distribution of PV system capacity across the possible tilts, orientations, and PV material types. The assumed basis of the composite PV generation profile was summarized in Table 2-3. 2.5 Discussion of Results Key aspects of the basis, magnitude, and embedded assumptions are described briefly below. Basis of Normalizing System Size
These generation profiles do not provide guidance on estimating system losses necessary to translate cumulative nominal PV module direct current power output capacity under standard test conditions (DC-STC4) into PV system size (AC-PTC). This would be a critical step necessary to use the results of this analysis to predict the power output of any particular PV system. Information concerning the relationship between nominal PV module capacity and PV system size is available from a variety of sources (Wiese 2002, Scheuermann 2002). Comparison to Other Findings
In this section, results of the analysis are compared to PV system performance estimates yielded by the PVWatts on-line tool, and PV system performance estimates described in a previous BI-PV market potential assessment. PVWatts
Results estimated in this analysis are expressed in terms of PV system power output per unit of AC-PTC PV system size. When using PVWatts, the basis of system size entered into the program must be AC-STC PV system size. The question then becomes: What PVWatts system size corresponds with 1.0 kW of AC-PTC system size? A system sized to produce 1.0 kW AC-STC will produce less than 1.0 kW when the temperature warms up to PTC. Therefore, PVWatts must be used with a system size value somewhat larger than 1.0 kW if the resulting annual energy estimates are to be compared directly to results of this analysis. If PTC power output is assumed equal to 90% of STC power output then that system size is calculated as 1/0.9=1.11 kW. 4 STC conditions comprise 1,000 W/m2 plane-of-array solar radiation, 25 °C cell temperature, and solar spectral
irradiance per ASTM (air mass = 1.5).
2-12 PV Generation Profiles – Analysis and Results
Photovoltaic & Biogas Generation Profiles Report
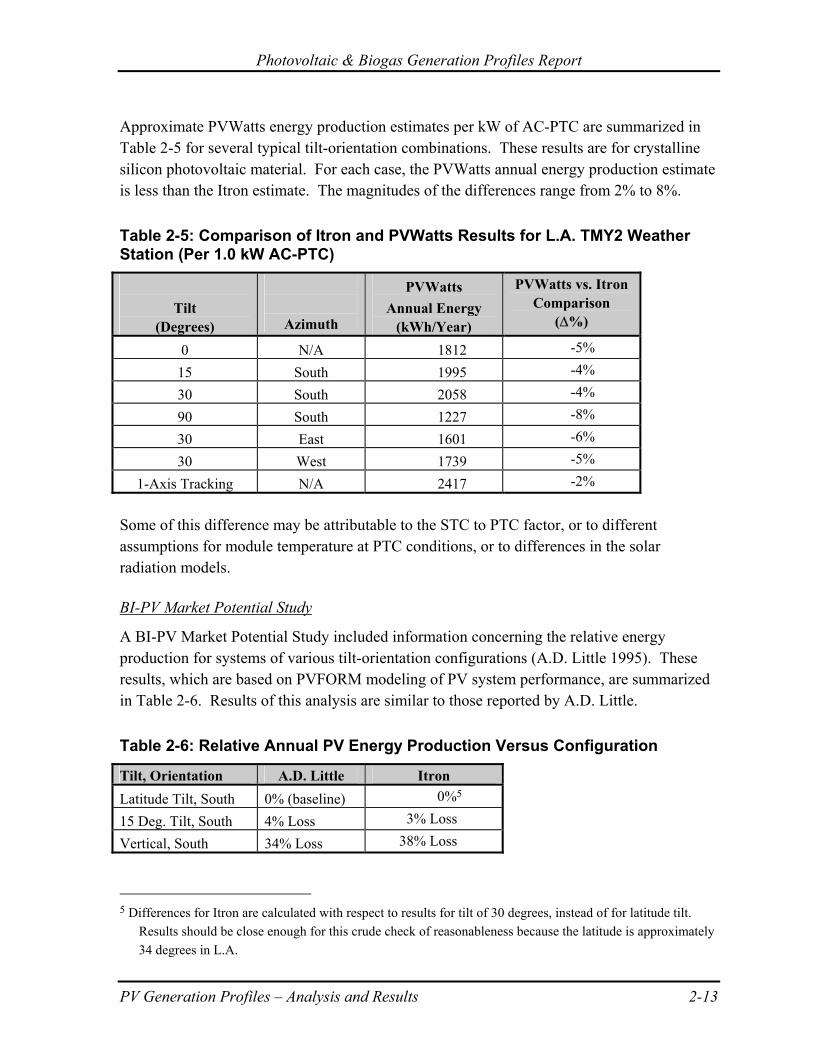
Approximate PVWatts energy production estimates per kW of AC-PTC are summarized in Table 2-5 for several typical tilt-orientation combinations. These results are for crystalline silicon photovoltaic material. For each case, the PVWatts annual energy production estimate is less than the Itron estimate. The magnitudes of the differences range from 2% to 8%.
Table 2-5: Comparison of Itron and PVWatts Results for L.A. TMY2 Weather Station (Per 1.0 kW AC-PTC)
Tilt
(Degrees)
Azimuth
PVWatts Annual Energy
(kWh/Year)
PVWatts vs. Itron Comparison
(∆%)
0 N/A 1812 -5%
15 South 1995 -4%
30 South 2058 -4%
90 South 1227 -8%
30 East 1601 -6%
30 West 1739 -5%
1-Axis Tracking N/A 2417 -2% Some of this difference may be attributable to the STC to PTC factor, or to different assumptions for module temperature at PTC conditions, or to differences in the solar radiation models. BI-PV Market Potential Study
A BI-PV Market Potential Study included information concerning the relative energy production for systems of various tilt-orientation configurations (A.D. Little 1995). These results, which are based on PVFORM modeling of PV system performance, are summarized in Table 2-6. Results of this analysis are similar to those reported by A.D. Little.
Table 2-6: Relative Annual PV Energy Production Versus Configuration
Tilt, Orientation A.D. Little Itron Latitude Tilt, South 0% (baseline) 0%5
15 Deg. Tilt, South 4% Loss 3% Loss
Vertical, South 34% Loss 38% Loss
5 Differences for Itron are calculated with respect to results for tilt of 30 degrees, instead of for latitude tilt.
Results should be close enough for this crude check of reasonableness because the latitude is approximately 34 degrees in L.A.
PV Generation Profiles – Analysis and Results 2-13
Photovoltaic & Biogas Generation Profiles Report
Simplifying Assumptions
Several simplifying assumptions that may limit the use of resulting load shapes or may require some measure of qualification or caveat are described below. Assumption of a Single Temperature for PTC Conditions.
The temperature adjustment factors are median results for a sample of 19 residential systems. For systems mounted flush to an existing roof the temperature effects would probably be more pronounced, and free standing arrays would probably operate somewhat cooler. Module temperatures at PTC conditions are likely to be sensitive to system design. Use of Los Angeles TMY2 data
Use of Los Angeles TMY2 data is a simplification because the mini-grid is located approximately 50 miles east of Los Angeles. Coastal weather effects influencing LAX ambient temperatures and solar insolation will cause the Mini-Grid and LAX generation profiles to be somewhat different. This difference represents one source of error in a broader project, one of the primary areas of emphasis of which is estimation of overall economic and environmental benefits attributable to BI-PV market potential in the Mini-Grid. Use of LAX weather may tend to overestimate demand-related benefits on the hottest days, and underestimate overall energy-related benefits. These effects tend to offset, and the magnitude of the net difference is substantially smaller than the magnitudes of error corresponding to other elements of the project. Other sources of project uncertainty include:
Uncertainty in market penetration rates Uncertainty in forecasts of economic conditions Uncertainty in estimates of the distribution of PV system orientations
Given the magnitude of weather-related error in comparison to other sources of uncertainty, LAX TMY2 weather data yield sufficiently accurate results for this project. Other projects under the PIER Commonwealth BI-PV Program involve assessment of economic feasibility of particular BI-PV systems. For these analyses more accurate weather data will be required. Mini-Grid TMY data will be developed in the future to support these technical and economic analyses of particular BI-PV systems. 2.6 Conclusions Hourly PV generation profiles were estimated for 104 tilt-orientation-material combinations and two additional composites, and the data were saved in a MS Access database. The method used to develop the profiles was relatively simple, however results are in general agreement with information available from other sources. Finally, use of the generation
2-14 PV Generation Profiles – Analysis and Results
Photovoltaic & Biogas Generation Profiles Report
PV Generation Profiles – Analysis and Results 2-15
profiles to estimate power output for a particular system would require estimation of the AC-PTC “size” of the system. The composite PV generation profile could be used in subsequent power flow analyses. This profile is based on the assumed mix of PV system designs summarized in Table 2-3. References
Building-Integrated Photovoltaics (BI-PV)—Analysis and US Market Potential, Prepared by Arthur D. Little, Inc. for the US Department of Energy Office of Building Technologies, NREL/TP-472-7850, DE95004055, February 1995.
David L. King, Jay A. Kratochvil, and William E. Boyson, Analysis of Factors Influencing
the annual Energy Production of Photovoltaic Systems, Presented at the 29th IEEE Photovoltaic Specialists Conference, May 20-24, 2002, New Orleans, Louisiana.
Steve Wiese, John Hoffner, and Jaya Pichumani, Performance Data on 19 School Solar
Energy Systems, Presented at the 2002 ASES Annual Conference, June 15-20, 2002, Reno, Nevada.
Kurt Scheuermann, Douglas R. Boleyn, Patrick Lilly, and Sanford Miller, Measured
Performance of California Buydown Program Residential PV Systems, Presented at the 2002 ACEEE Summer Study on Energy Efficiency in Buildings, August 18-23, 2002, Pacific Grove, California.
John A. Duffie, William A. Beckman, Solar Engineering of Thermal Processes, John Wiley
& Sons, Inc., New York, 1991.
3 Biogas Generation Profiles
The Task 1.1.8 analytical activities and results related to biogas generation resources are summarized in this section. 3.1 Overview Biogas resources slated for development in the program include landfill bioreactors, animal manure digesters, and enhancement of wastewater treatment plant digesters. The generation profiles estimated for biogas and PV are fundamentally different. Whereas the PV generation profiles described in Section 2 include considerable diurnal and seasonal variation and are sensitive to installation orientation, biogas generation profiles tend to be much flatter. The principal biogas resource characteristics that influence generation profile shapes are summarized below. 3.2 Biogas Resource Characteristics In the case of all four biogas resources covered by this analysis – landfilled refuse, wastewater treatment plant sludge, cow manure and food processing waste – the gas production rate is relatively constant. The per-kWh cost of generating electric energy is therefore minimized by also producing electricity at a constant rate. This operating relationship yields lowest per-kWh electric generating costs because it minimizes or eliminates gas storage costs and costs associated with under-utilized engine-genset capacity. This operating strategy may also tend to minimize costs if steady-state operation maximizes conversion efficiencies, or if constant operation minimizes costs associated with corrosion produced by condensation of acids when biogas-fueled engines are shut down. Minimizing per-kWh electric generating costs is just one factor contributing to overall project economics. Maximizing per-kWh electric generating benefits is equally important, and may be substantially more complicated. Fundamental to this side of the equation is the per-kWh rate of compensation received for the electric energy production of the biogas system. This compensation may vary considerably depending on the structure of the agreement the biogas system owner has with power purchasers, and depending on the
Biogas Generation Profiles – Analysis and Results 3-1

Photovoltaic & Biogas Generation Profiles Report
magnitude of electric generating capacity relative to nearby electric loads the biogas system could supply directly. If nearby loads are small relative to biogas electric generating capacity (e.g., landfill gas applications) the majority of the electric power is likely to be sold under terms of a traditional power purchase agreement (PPA). To date, the economics of landfill gas projects marketing their power output through PPA have not justified the extra expense associated with gas storage and extra engine-genset capacity necessary to yield highly variable generation profiles. If nearby electric loads are substantial in comparison to biogas system power output then project economics may be optimized by operating the generator and loads in parallel with the grid. The way this is done may be different for wastewater treatment plants and dairies, because biogas digester facilities utilizing manure may be eligible for a net-metering pilot program signed into law (AB 2228) in September 2002. In the case of wastewater treatment plants, if on-site loads exceed generation then power output of the biogas system is valued at the retail rate of electricity, which is generally higher than the terms that typical power purchase agreements could offer. Biogas systems at wastewater treatment plants are not eligible for net metering. Consequently, if biogas system power output exceeds electric load then excess power sent back to the grid is valued at less than the retail rate for electricity. If the profile of electric loads on the billing meter shared with the biogas system is highly variable or is skewed toward the utility’s higher cost on-peak periods, or if a digester is sited at a dairy and is eligible for net-metering, then investment in gas storage and additional generator capacity may be justified. The economics of gas storage are site-specific and depend on numerous factors, including: the cost of biogas storage, the cost of generator capacity, the retail tariff structure, and the compensation (if any) for net power deliveries to the grid. In the absence of site-specific design and cost data it is not possible to determine whether or not financial considerations justify the additional expense of biogas storage and additional generator capacity. Therefore, the electric generation profiles for all four biogas digester applications are assumed to be relatively flat. One factor that will contribute a modest measure of variability into the profiles is the influence of ambient temperature on engine or turbine power output. Typical temperature sensitivity relationships for engines and turbines are depicted graphically in Figure 3-1 (EPA 2002). The data in Figure 3-1 illustrate an important point related to the basis of engine and turbine power output capacities. Namely, they are variable, and manufacturers may quote system sizes based on different ambient temperature conditions. The typical performance characteristics in Figure 3-1 assume that engine size is rated at 77 °F while microturbine size
3-2 Biogas Generation Profiles – Analysis and Results

Photovoltaic & Biogas Generation Profiles Report
is rated at 59 °F. The power output of the turbine diminishes from the nominal, rated size more quickly (i.e., 1%/2°F versus 1%/10°F for the reciprocating engine).
Figure 3-1: Ambient Temperature Influence on Power Output
0%
20%
40%
60%
80%
100%
120%
0 10 20 30 40 50 60 70 80 90 100 110Ambient Temperature (F)
Pow
er O
utpu
t (%
of r
ated
)
Gas Turbine
Engine
3.3 Results The generation profiles for all four biogas resources are assumed to vary only as a function of prime mover technology (i.e., engine or turbine). The electric generator systems are assumed to be sized to consume the available biogas flow rate when operating at the ambient temperature used by manufacturers for equipment rating purposes. At elevated ambient temperatures, power output falls according to the relationships summarized in Figure 3-11. Hourly Biogas generation profiles are saved in the MS Access database accompanying this report. A description of the layout of the database is included as Appendix A.
1 This assumed design could require flaring of biogas during periods of elevated ambient temperature. An
alternate design could entail oversizing of gas turbines. This approach would decrease or eliminate the need for flaring, but would also increase capital costs and require part-load operation during periods of lower ambient temperature.
Biogas Generation Profiles – Analysis and Results 3-3
Photovoltaic & Biogas Generation Profiles Report
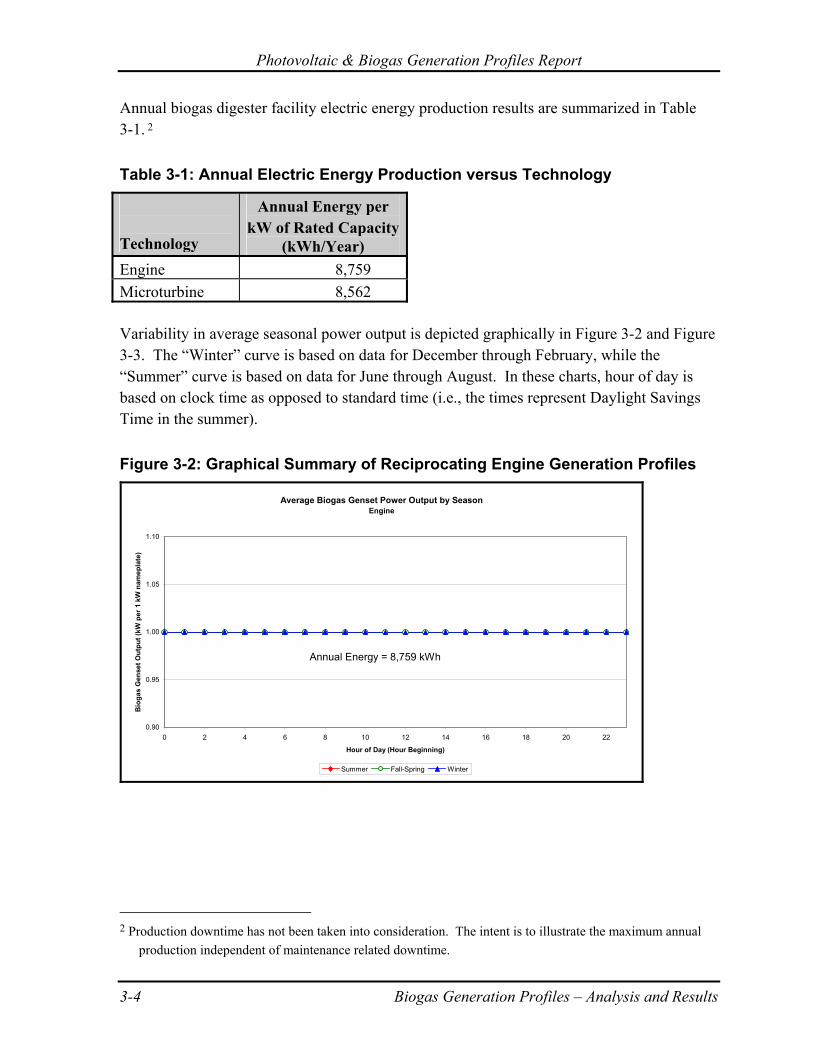
Annual biogas digester facility electric energy production results are summarized in Table 3-1. 2
Table 3-1: Annual Electric Energy Production versus Technology
Technology
Annual Energy per kW of Rated Capacity
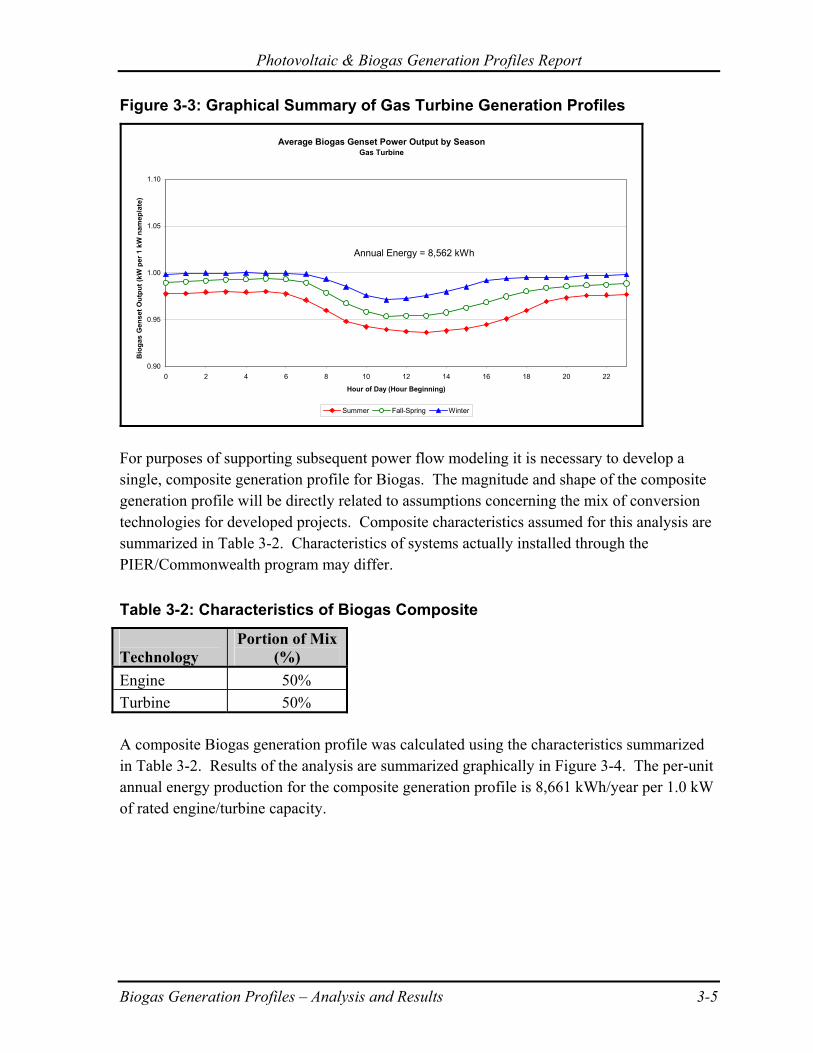
(kWh/Year) Engine 8,759 Microturbine 8,562 Variability in average seasonal power output is depicted graphically in Figure 3-2 and Figure 3-3. The “Winter” curve is based on data for December through February, while the “Summer” curve is based on data for June through August. In these charts, hour of day is based on clock time as opposed to standard time (i.e., the times represent Daylight Savings Time in the summer).
Figure 3-2: Graphical Summary of Reciprocating Engine Generation Profiles
Average Biogas Genset Power Output by SeasonEngine
0.90
0.95
1.00
1.05
1.10
0 2 4 6 8 10 12 14 16 18 20 22
Hour of Day (Hour Beginning)
Bio
gas
Gen
set O
utpu
t (kW
per
1 k
W n
amep
late
)
Summer Fall-Spring Winter
Annual Energy = 8,759 kWh
2 Production downtime has not been taken into consideration. The intent is to illustrate the maximum annual
production independent of maintenance related downtime.
3-4 Biogas Generation Profiles – Analysis and Results
Photovoltaic & Biogas Generation Profiles Report
Figure 3-3: Graphical Summary of Gas Turbine Generation Profiles
Average Biogas Genset Power Output by SeasonGas Turbine
0.90
0.95
1.00
1.05
1.10
0 2 4 6 8 10 12 14 16 18 20 22
Hour of Day (Hour Beginning)
Bio
gas
Gen
set O
utpu
t (kW
per
1 k
W n
amep
late
)
Summer Fall-Spring Winter
Annual Energy = 8,562 kWh
For purposes of supporting subsequent power flow modeling it is necessary to develop a single, composite generation profile for Biogas. The magnitude and shape of the composite generation profile will be directly related to assumptions concerning the mix of conversion technologies for developed projects. Composite characteristics assumed for this analysis are summarized in Table 3-2. Characteristics of systems actually installed through the PIER/Commonwealth program may differ.
Table 3-2: Characteristics of Biogas Composite
Technology
Portion of Mix (%)
Engine 50% Turbine 50% A composite Biogas generation profile was calculated using the characteristics summarized in Table 3-2. Results of the analysis are summarized graphically in Figure 3-4. The per-unit annual energy production for the composite generation profile is 8,661 kWh/year per 1.0 kW of rated engine/turbine capacity.
Biogas Generation Profiles – Analysis and Results 3-5

Photovoltaic & Biogas Generation Profiles Report
Figure 3-4: Graphical Summary of Composite Biogas Generation Profile
Average Biogas Genset Power Output by SeasonBiogas Composite
0.90
0.95
1.00
1.05
1.10
0 2 4 6 8 10 12 14 16 18 20 22
Hour of Day (Hour Beginning)
Bio
gas
Gen
set O
utpu
t (kW
per
1 k
W n
amep
late
)
Summer Fall-Spring Winter
Annual Energy = 8,661 kWh
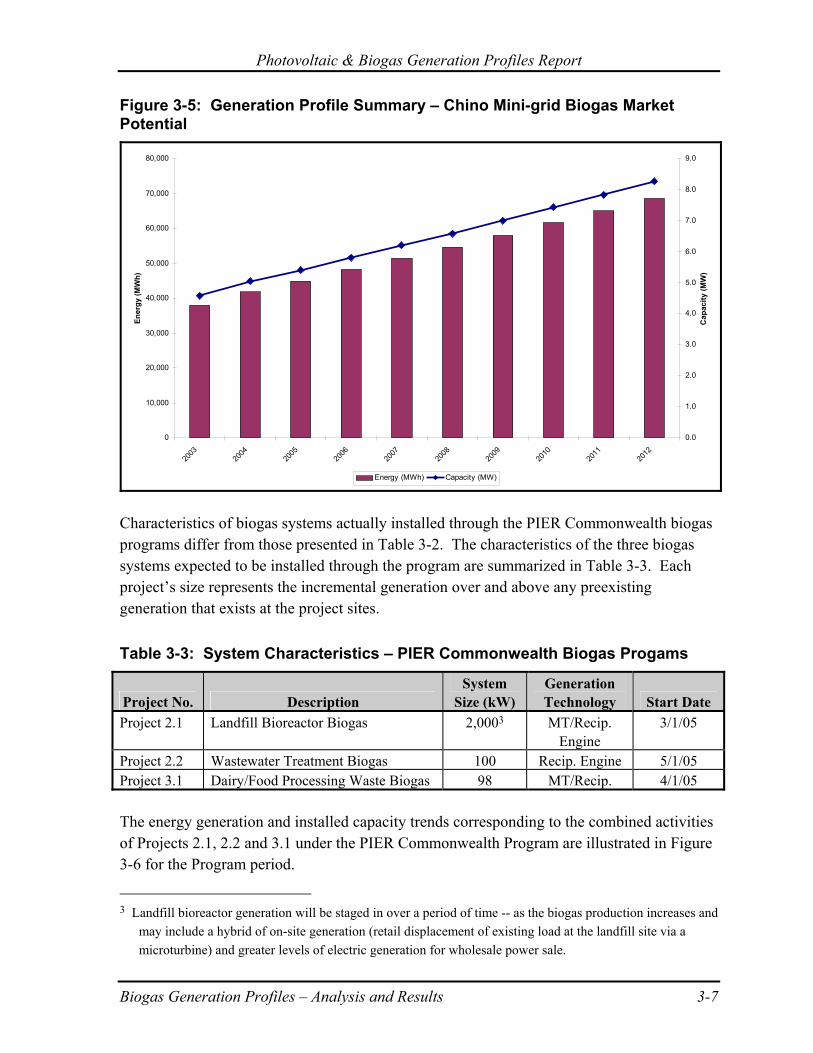
To develop a market-potential composite biogas generation profile for the study period, the shape information illustrated in Figure 3-2 and Figure 3-3 was combined with results of the analysis of market potential magnitude. The combined mini-grid biogas market potential estimated for years 2003 through 2012 ranged from 4.6 MW to 8.3 MW in capacity and from 37,984 MWh to 68,542 MWh in energy generation. Resulting energy production and installed capacity trends for the Market Potential study period are summarized in Figure 3-5.
3-6 Biogas Generation Profiles – Analysis and Results
Photovoltaic & Biogas Generation Profiles Report
Figure 3-5: Generation Profile Summary – Chino Mini-grid Biogas Market Potential
0
10,000
20,000
30,000
40,000
50,000
60,000
70,000
80,000
2003
2004
2005
2006
2007
2008
2009
2010
2011
2012
Ener
gy (M
Wh)
0.0
1.0
2.0
3.0
4.0
5.0
6.0
7.0
8.0
9.0
Cap
acity
(MW
)
Energy (MWh) Capacity (MW)
Characteristics of biogas systems actually installed through the PIER Commonwealth biogas programs differ from those presented in Table 3-2. The characteristics of the three biogas systems expected to be installed through the program are summarized in Table 3-3. Each project’s size represents the incremental generation over and above any preexisting generation that exists at the project sites.
Table 3-3: System Characteristics – PIER Commonwealth Biogas Progams
Project No. Description System
Size (kW) Generation Technology Start Date
Project 2.1 Landfill Bioreactor Biogas 2,0003 MT/Recip. Engine
3/1/05
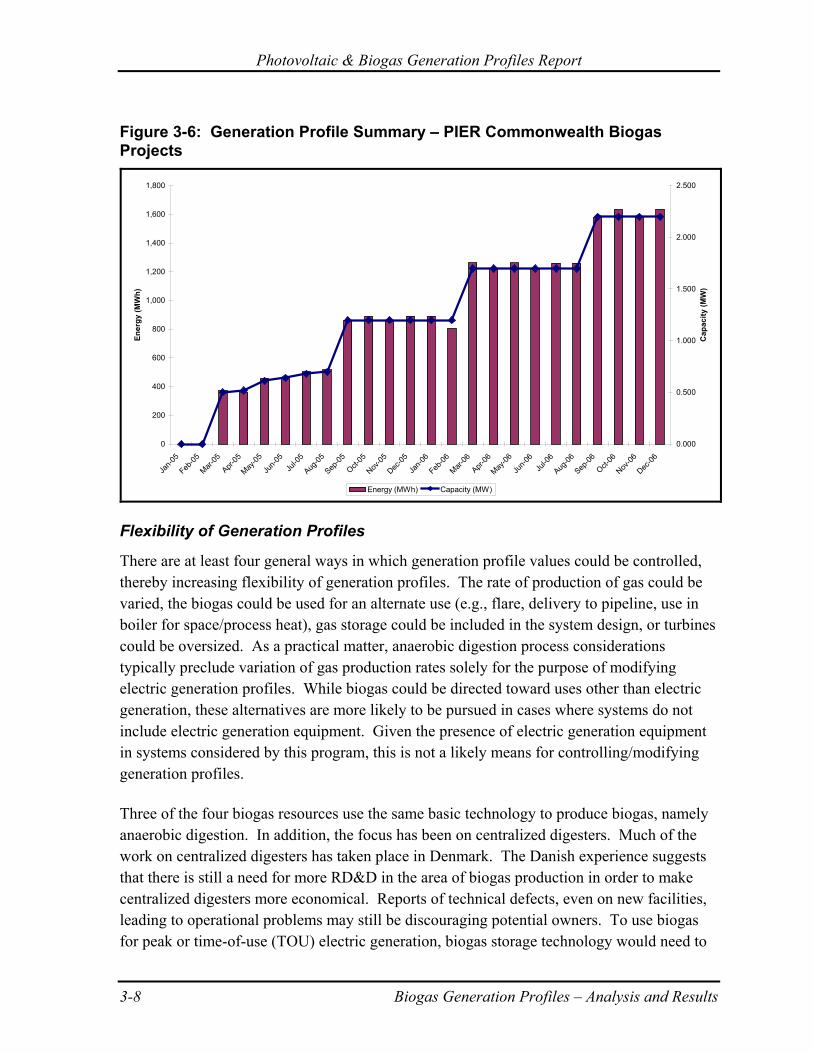
Project 2.2 Wastewater Treatment Biogas 100 Recip. Engine 5/1/05 Project 3.1 Dairy/Food Processing Waste Biogas 98 MT/Recip. 4/1/05 The energy generation and installed capacity trends corresponding to the combined activities of Projects 2.1, 2.2 and 3.1 under the PIER Commonwealth Program are illustrated in Figure 3-6 for the Program period.
3 Landfill bioreactor generation will be staged in over a period of time -- as the biogas production increases and
may include a hybrid of on-site generation (retail displacement of existing load at the landfill site via a microturbine) and greater levels of electric generation for wholesale power sale.
Biogas Generation Profiles – Analysis and Results 3-7
Photovoltaic & Biogas Generation Profiles Report
Figure 3-6: Generation Profile Summary – PIER Commonwealth Biogas Projects
0
200
400
600
800
1,000
1,200
1,400
1,600
1,800
Jan-0
5
Feb-05
Mar-05
Apr-05
May-05
Jun-0
5Ju
l-05
Aug-05
Sep-05
Oct-05
Nov-05
Dec-05
Jan-0
6
Feb-06
Mar-06
Apr-06
May-06
Jun-0
6Ju
l-06
Aug-06
Sep-06
Oct-06
Nov-06
Dec-06
Ener
gy (M
Wh)
0.000
0.500
1.000
1.500
2.000
2.500
Cap
acity
(MW
)
Energy (MWh) Capacity (MW)
Flexibility of Generation Profiles
There are at least four general ways in which generation profile values could be controlled, thereby increasing flexibility of generation profiles. The rate of production of gas could be varied, the biogas could be used for an alternate use (e.g., flare, delivery to pipeline, use in boiler for space/process heat), gas storage could be included in the system design, or turbines could be oversized. As a practical matter, anaerobic digestion process considerations typically preclude variation of gas production rates solely for the purpose of modifying electric generation profiles. While biogas could be directed toward uses other than electric generation, these alternatives are more likely to be pursued in cases where systems do not include electric generation equipment. Given the presence of electric generation equipment in systems considered by this program, this is not a likely means for controlling/modifying generation profiles. Three of the four biogas resources use the same basic technology to produce biogas, namely anaerobic digestion. In addition, the focus has been on centralized digesters. Much of the work on centralized digesters has taken place in Denmark. The Danish experience suggests that there is still a need for more RD&D in the area of biogas production in order to make centralized digesters more economical. Reports of technical defects, even on new facilities, leading to operational problems may still be discouraging potential owners. To use biogas for peak or time-of-use (TOU) electric generation, biogas storage technology would need to
3-8 Biogas Generation Profiles – Analysis and Results
Photovoltaic & Biogas Generation Profiles Report
be employed. At present, storage of biogas for TOU generation purposes does not appear to have been considered anywhere. That is not to say that biogas storage is not practiced. Storage is utilized as part of the gas collection system more than anything else. Low-pressure storage is common, but high-pressure storage is not. It is not known if economical TOU generation would require or benefit from high-pressure biogas storage. The uncertainties with centralized digester technology for biogas production, not to mention biogas cleaning technology, appear to be great enough that consideration of biogas storage and TOU generation is likely to be beyond the planning horizon of the Commonwealth Program. Landfill biogas may be a different case when it comes to TOU generation. Landfill gas production is reliable enough where an initial engineering assessment would reveal whether or not this has any possibility of being economical. Such an assessment would be required to answer whether low-pressure storage of biogas would be suitable for TOU generation. However, given the potential biogas production benefits associated with bioreactor technology, RD&D efforts would appear to be better spent here than on biogas storage and TOU generation. A larger market consideration to the flexibility of all these resources has to due with the dispatchability of the generation. To take advantage of TOU pricing, the generation needs to function in one of two ways. The first is that nearly all the generation be supplied back to the grid and that it be dispatchable by the Independent System Operator (ISO). Currently, generation contracts for renewable resources are fixed price contracts. Historically, the structure of power purchase agreements has been a limiting factor. Only if the technology has proven itself to be reliably dispatched will that technology be able to take advantage of hourly system prices. Generally, fossil fueled generators are hundreds of megawatts or larger in size where as renewable generators are much smaller. It is uncertain that small generators would be desirable as a dispatchable resource for anything other than emergency conditions. The economics from a system dispatch perspective are not likely to be favorable in the near future. The second method of operation is that the electricity produced not exceed the owner’s load at the same premises as the generator. In this instance, the generator power output does not need to be variable to take advantage of TOU pricing. As long as the renewable generation is offsetting a portion of the customer load at peak hours then it is effectively being priced at TOU rates. It is generally not economic for PV generated electricity to be stored to serve load at low priced off-peak hours. It is not known whether biogas generation would be economic under this arrangement since the generation would likely be small and not able to take advantage of economies of scale. The generation profiles for turbine based facilities could be flattened by increasing turbine size. This approach would require operation at
Biogas Generation Profiles – Analysis and Results 3-9
Photovoltaic & Biogas Generation Profiles Report
partial load during many cooler hours of the year, however, which could decrease average conversion efficiency, and would increase operationg costs. Given the naturally occurring load following nature of PV electric generation, it may be more economical to pursue the ancillary benefits associated with biogas production (e.g., reduced ground water contamination, reduced GHG, fertilizer by-products, etc.) and the improvement of biogas production before pursuing any enhancements generation profile enhancements. The PV technical potential in the mini-grid is larger than the entire load in the area. As far as a fully realized mini-grid, utilizing a mix of resources whose least cost implementation provides base load (biogas) on the one hand and load following (BI-PV) on the other would appear to be the most logical approach. 3.4 Discussion of Results Key aspects of the assumptions, analytic methods, and results are described briefly below. Landfill Gas Production Lifecycle
Landfill gas generation is estimated to begin from six months to two years after waste is placed in a landfill. Gas generation rates vary depending on moisture content and other site-specific factors. The basic pattern is that landfill gas generation rates are highest in the two years after waste has been filled. During this time, anaerobic digestion of most of the degradable content of food wastes occurs. LFG generation continues after this time but at slowly decreasing rates. While gas generation rates can extend for periods of up to fifty years, in most cases primary gas release occurs within the first 10 years. Storage of landfill gas on a large scale is not generally considered economically practicable. The generation profile for landfill gas applications is therefore a function of gas collection/conversion equipment size relative to gas generation rates. Landfill gas collection systems are typically sized to satisfy gas collection and combustion requirements when gas generation rates are at their highest. Energy conversion equipment (e.g., engines, gas turbines) used for landfill gas applications is typically sized such that it can operate continuously for 10 years without having to increase or decrease power output due to changes in landfill gas generation rates. Operation in this manner dictates that during some periods of power plant life some of the landfill gas must bypass the energy conversion system. Landfill gas that is bypassed in this manner is typically flared. 3.5 Conclusions Biogas generation profiles impacting the electric distribution system are intertwined with a variety of economic factors influencing biogas system design and operation. As a first-order
3-10 Biogas Generation Profiles – Analysis and Results

Photovoltaic & Biogas Generation Profiles Report
Biogas Generation Profiles – Analysis and Results 3-11
approximation, the generation profiles for all four biogas resources – landfill refuse, wastewater treatment sludge, dairy cow manure and food processing waste – are relatively flat. Refinement of these current generation profiles is contingent upon refinement of available information related to technology implementation and these biogas resource utilization drivers in the Chino basin. References Technology Characterization: Microturbines, Prepared by Energy Nexus Group for the US
Environmental Protection Agency, Climate Protection Partnership Division, March 2002. Technology Characterization: Reciprocating Engines, Prepared by Energy Nexus Group for
the US Environmental Protection Agency, Climate Protection Partnership Division, February 2002.

Appendix A Generation Profiles Database Guide
The MS Access database accompanying this report contains hourly PV and biogas generation profile values. Generation profiles for 104 different tilt-orientation-material-tracking combinations are included in the ‘PV’ table. Fields in the PV table are described in Table A-1.
Table A-1: Fields in the MS Access PV Generation Profiles Table
Field Name
Values
Description
ProfType Flat, Fixed, 1-axis, 2-axis, Program, Market
Generation Profile Type. ‘Program’ refers to BI-PV capacity installed under the Commonwealth program through 2006. ‘Market’ refers to BI-PV market potential in 2012; these data express both the shape and magnitude of BI-PV generation profiles.
Material Crystal, Amorph PV Material Type. ‘Crystal’ for crystalline silicon PV, ‘Amorph’ for amorphous silicon PV. ‘N/A’ for composite generation profiles.
M_LDT 1 to 12 Month of year, local daylight time. D_LDT 1 to 31 Day of month, local daylight time. H_LDT 0 to 23 by 1 Hour of day (hour beginning), local daylight time. Tilt 0 to 90 by 30 Array tilt in degrees from horizontal. Azimuth 0 to 315 by 15 Array azimuth in degrees, South 0, West positive, East
negative. DBT 4.4 to 35.0 Ambient Dry Bulb Temperature, ºC GHR 0 to 1024 Global Horizontal Radiation, Watts/m2 I_t 0 to 1114 Total Plane-of-Array Radiation, Watts/m2 PWR 0 to Hourly average power output. Units kW, kW/kW ‘kW/kW’ is used to express the shape element of
generation profiles (i.e., hourly average kW produced by a 1.0 kW AC-PTC PV system).
Appendix A: Generation Profiles Database Guide A-1

Photovoltaic & Biogas Generation Profiles Report
A-2 Appendix A: Generation Profiles Database Guide
Generation profiles for biogas engine- and turbine-gensets are included in the ‘BIOGAS’ table. Fields in the BIOGAS table are described in Table A-2.
Table A-2: Fields in the MS Access Biogas Generation Profiles Table
Field Name
Values
Description
ProfType ICE, Turbine, Program, Market
Generation Profile Type. ‘Program’ refers to biogas capacity installed under the Commonwealth program through 2006. ‘Market’ refers to biogas market potential in 2012; these data express both the shape and magnitude of BI-PV generation profiles.
M_LDT 1 to 12 Month of year, local daylight time D_LDT 1 to 31 Day of month, local daylight time H_LDT 0 to 23 Hour of day (hour beginning), local daylight time DBT 4.4 to 35.0 Ambient Dry Bulb Temperature, ºC PWR 0 to 1.0 Hourly average power output for a 1.0 kW AC Biogas
system (Basis: nameplate system size) Units kW, kW/kW ‘kW/kW’ is used to express the shape element of ICE
and Turbine generation profiles (i.e., hourly average kW produced by a 1.0 kW system).