Embed Size (px)
Citation preview
Commonality in Liquidity: A Global Perspective∗
Paul BROCKMAN University of Missouri - Columbia
Dennis Y. CHUNG
Simon Fraser University
Christophe PÉRIGNON Simon Fraser University
First Draft: March 15, 2006 This Draft: April 18, 2006
Abstract: We conduct the first comprehensive study of commonality in liquidity using intraday spread and depth data from 47 stock exchanges. We show that commonality is a widespread, global phenomenon. Firm-level changes in spreads and depths are significantly influenced by exchange-wide changes in liquidity on the majority of the world’s stock exchanges. Emerging Asian exchanges have exceptionally strong commonality, while those of Latin America exhibit little if any commonality. In contrast to previous NYSE-based results, we find that commonality in bid-ask spreads is most prevalent among small firms while commonality in depths increases monotonically with firm size. After documenting the pervasive role of commonality within individual exchanges, we examine commonality across exchanges. We extend the empirical model of Chordia, Roll, and Subrahmanyam (2000) and find the first empirical evidence of a distinct, global component in bid-ask spreads and depths. Changes in global spreads and depths have a significant effect on changes in liquidity at the exchange level. We show that while exchange size (total market capitalization) plays an influential role in the liquidity transmission process, global commonality is not driven by a subset of large exchanges. JEL Classification: G10, G15 Keywords: Liquidity, Commonality, Bid-Ask Spreads, Depths
∗ Contact author: Paul Brockman, Department of Finance, College of Business, University of Missouri-Columbia, Columbia, MO 65211; phone: 573-884-1562, fax: 573-884-6296, email: [email protected].
1
Commonality in Liquidity: A Global Perspective 1. Introduction
Commonality in liquidity refers to the impact of a common or market-wide
liquidity factor on an individual firm, both in terms of bid-ask spreads and depths.
Previous empirical research has shown that there exists a significant common component
that influences firm-level liquidity. Simply stated, liquidity is subject to a spillover effect
that influences other firms trading in the same market. Although there is some evidence
of commonality on non-US exchanges (Fabre and Frino (2004) and Brockman and Chung
(2002)), most previous studies investigate firms trading in the US (Chordia, Roll, and
Subrahmanyam (2000), Hasbrouck and Seppi (2001), and Huberman and Halka (2001)).
But regardless of the particular market investigated, all previous studies using intraday
bid-ask spreads and depths are single-exchange studies. The purpose of our paper is
twofold. First, we conduct a comprehensive investigation of commonality in liquidity for
47 stock exchanges using intraday spread and depth data. Second, we examine the
impact of a global liquidity factor on spread and depth commonality at the level of the
exchange. The size, scope, and cross-sectional variation of our database allow us to
analyze several aspects of commonality that previous, single-exchange studies could not
address.
It is important to understand secondary-market liquidity because of the various
roles it plays in the capital markets. Liquidity encourages trading by reducing transaction
costs. A market participant’s ability to capture potential gains of trade depends directly
on liquidity levels. There is an economic welfare benefit from liquid markets because
trading is the mechanism through which information is impounded into prices. More
2
informative prices lead to more efficient allocations of capital across competing
investments (Wurgler (2000)). Liquidity also plays a significant role in determining the
firm’s cost of capital. The more liquid the firm’s stock, the lower the cost of capital
(Amihud and Mendelson (1986), Brennan and Subrahmanyam (1996), Datar, Naik, and
Radcliffe (1998), and Easley, Hvidkjaer, and O’Hara (2002)); and the lower the firm’s
cost of capital, the higher the market capitalization. For all of these reasons, there is
considerable interest among managers, investors, exchange members, and regulators in
understanding the determinants of secondary-market liquidity.
Most of the early liquidity studies analyze firm-specific determinants of liquidity.
This line of research has shown that variations in price, volume, and volatility explain
much of the cross-sectional variation in bid-ask spreads (Benston and Hagerman (1974),
Stoll (1978), Barclay and Smith (1988), Franz, Rao, and Tripathy (1995), and Noronha,
Sarin, and Saudagaran (1996)) and depths (Brockman and Chung (1999)). More recent
research focuses on the common components of firm liquidity (i.e., changes in firm-level
bid-ask spreads and depths caused by changes in market-level spreads and depths). This
line of research has shown that individual firm liquidity is sensitive to changes in
aggregate liquidity movements (Chordia, Roll, and Subrahmanyam (2000), Coughenour
and Saad (2004), and Chordia, Sarkar, and Subrahmanyam (2005)). One implication of
these findings is that sensitivity to aggregate liquidity movements might represent a
systematic risk factor (Pastor and Stambaugh (2003), Acharya and Pedersen (2005), and
Stahel (2003)).
Over the past three decades, capital markets have become increasingly globalized
because of lower information technology costs and a movement toward deregulation and
3
free trade on the part of national governments. Concomitant with globalized capital
movements are globalized liquidity movements. Commenting on these global
movements, Peter Weinberg, former chief executive officer of Goldman Sachs
International (2006), states that “liquidity and the movement of capital around the world
have become so ubiquitous and pervasive that it is hard to know where London or New
York begins and where Tokyo, Shanghai or Hong Kong leaves off.” A primary objective
of our study is to examine the relation between liquidity changes in London or New
York, for instance, and liquidity movements in Tokyo, Shanghai, Hong Kong, and the
rest of the world.
To date, our knowledge of spread and depth co-movements is limited to empirical
evidence from only a handful of individual stock exchanges (US, Hong Kong, and
Australia).1 This limitation means that many important questions remain unanswered. Is
commonality in spreads and depths widespread across the world’s stock exchanges? Is
commonality a more serious problem for emerging or developed markets? Does firm
size or industry play a significant role in transmitting liquidity shocks across firms? Is
there a global component to commonality in liquidity? We address these and related
questions by accessing a global Bloomberg database that encompasses 1.47 billion
transactions across 47 stock exchanges, 38 countries, and the six major regions as defined
by Morgan Stanley Capital International (MSCI).
We divide our empirical investigation into two main sections. In the first section,
we use the methodology of Chordia, Roll, and Subrahmanyam (2000) to measure
1 Stahel (2003) uses monthly returns and turnover to investigate co-movement among the US, Japanese, and the UK stock markets. Stahel (2005) uses a weekly illiquidity measure to examine liquidity across 18 developed and emerging markets. No previous study, however, analyzes global commonality in bid-ask spreads or depths.
4
commonality in spreads and depths for each of our 47 stock exchanges. Our results
verify that exchange-level commonality is a pervasive phenomenon across the globe. On
most, but not all, exchanges individual firms’ spreads and depths are significantly
influenced by changes in the aggregate market’s spreads and depths. Although most
exchanges have a significant commonality component, there are also large cross-sectional
variations among exchanges and geographic regions. The stock exchanges of Emerging
Asia, for example, exhibit the strongest commonality in spreads, while the exchanges of
North America have the strongest commonality in depths. Latin American stock
exchanges exhibit very little commonality at the exchange level.
We also investigate the roles of firm size and industry within each of our
exchanges. In contrast to Chordia, Roll, and Subrahmanyam’s (2000) NYSE-based
results, we find that commonality in bid-ask spreads is most prevalent among smaller
firms. Depth commonality, on the other hand, exhibits a positive relation with firm size.
Our industry results show that while commonality is significant in each of our ten global
industries, there is considerable variation across industries. The Utilities industry, for
example, is much less susceptible to commonality in spreads than the Consumer Cyclical
industry. Comparing our global results to Chordia, Roll, and Subrahmanyam’s (2000)
NYSE findings, we find that the industry effect is much more prominent for NYSE firms
than for the typical global firm.
Our global evidence shows definitively that commonality in liquidity is
widespread within individual stock exchanges. In our second section, we examine the
possible existence of commonality in liquidity across stock exchanges. Is exchange-level
liquidity influenced by regional or global liquidity movements? Does the sensitivity of
5
exchange-level liquidity to global commonality depend on the size of the exchange? Are
emerging markets more or less susceptible to global commonality than developed
markets? To answer these and related questions, we extend the empirical model of
Chordia, Roll, and Subrahmanyam (2000) in order to measure the impact of changes in
global liquidity on changes in aggregate exchange-level liquidity. To the best of our
knowledge, no previous study has examined global commonality in spreads and depths.
Our empirical tests generate several new findings. We find unambiguous support
for the hypothesis that commonality in liquidity spills across national borders.
Movements in aggregate bid-ask spreads and depths on an individual exchange are
significantly influenced by movements in spreads and depths at the global scale. We
show that both developed and emerging markets are susceptible to global commonality,
although developed markets are more sensitive to liquidity spillover effects than
emerging markets. We also show that global commonality is not driven solely by
regional co-movements. For developed markets, a larger portion of spread and depth
commonality is attributable to regional as opposed to global (i.e., non-regional) sources.
For emerging markets, the global source dominates the regional source. Finally, we show
that the total market capitalization of the exchange plays a significant role in the liquidity
transmission process.
In summary, our results verify that neither firm- nor exchange-level liquidity can
be understood in isolation. Individual firm liquidity is significantly influenced by co-
movements in the liquidity of all other firms traded on the same exchange. This result is
widespread across most exchanges in the world. In a parallel manner, exchange-level
liquidity is significantly influenced by co-movements in the global liquidity of all other
6
exchanges. This global commonality result holds even in the absence of the large,
influential exchanges located in New York, London, and Tokyo.
In the next section, we discuss our database and method of analysis. In section
three, we present and interpret our empirical findings. In section four, we summarize and
conclude our study.
2. Data and Method of Analysis
We obtain trade and quote data from the Bloomberg financial information
network. Bloomberg receives real-time bid and ask quotes and transaction data for stocks
traded on global markets through a live feed directly from the exchanges. Intra-day data
on the US exchanges, not available from Bloomberg due to data licensing restrictions, are
obtained from the NYSE’s Trade and Quote (TAQ) database. We compile intra-day bid-
ask spread and depth measures over a 21-month period from October 1, 2002 to June 30,
2004 (i.e., 455 trading days). We require a minimum of 200 days with at least one trade
during the sample period in order to eliminate inactively traded firms. Firms with market
capitalization less than $100 million and exchanges with less than ten sample firms are
also excluded from our analysis. Our final sample contains 1.47 billion transactions
across 47 stock exchanges, 38 countries, and the six major regions as defined by MSCI.2
After calculating daily averages, we have 3,838,241 daily observations representing the
number of firm-days with trades for all of our 9,427 firms.
2 These 1.47 billion transactions are extracted from roughly 15 billion quote and trade observations over our 21-month sample period.
7
2.1. Descriptive Statistics
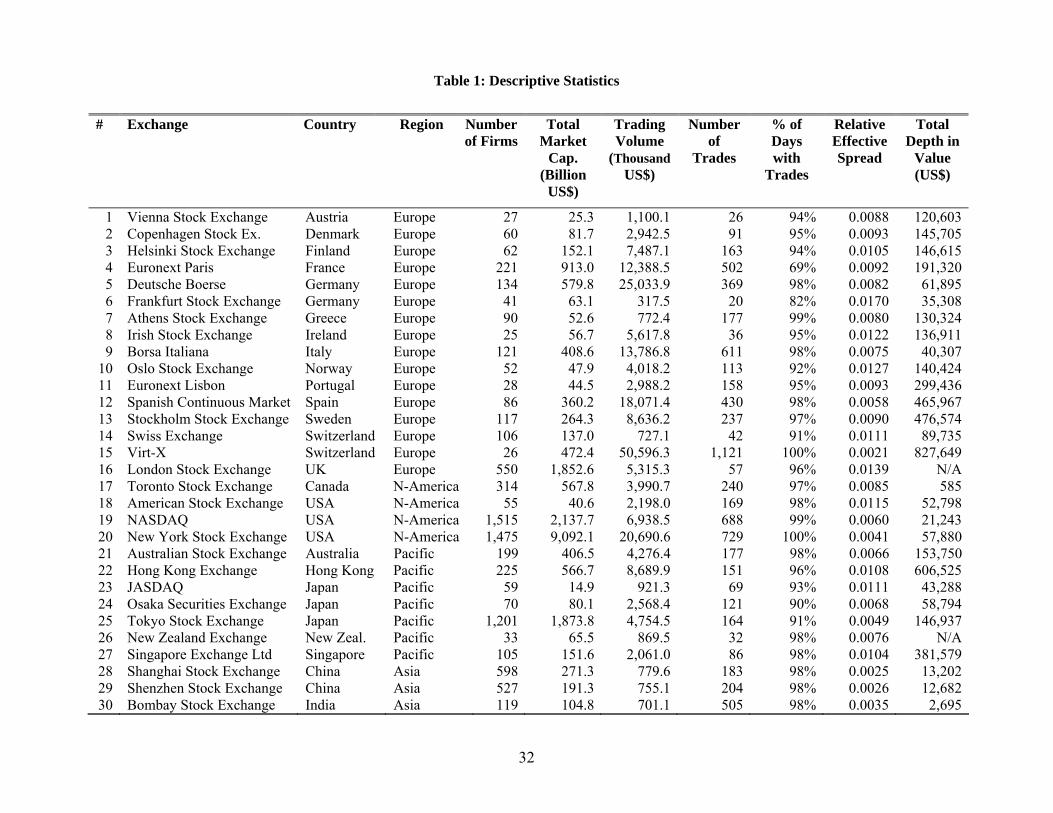
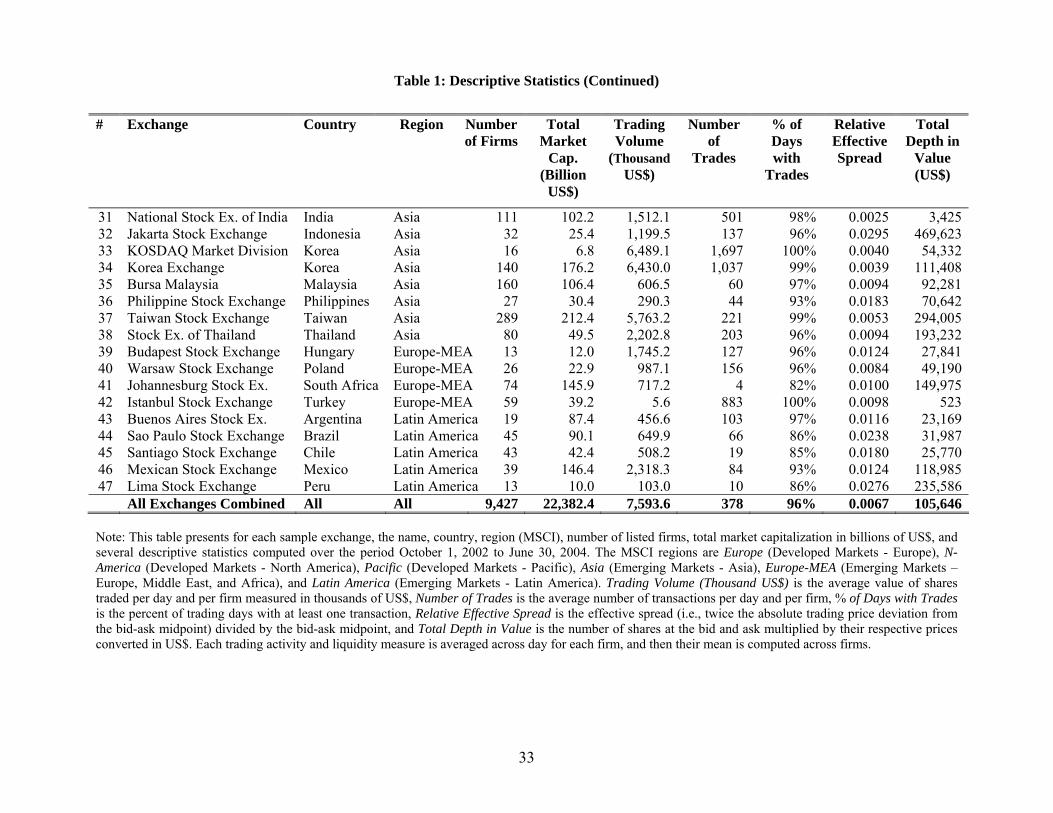
We present descriptive statistics for our global database in Table 1. We report the
exchange, country, MSCI region, number of firms, total market capitalization, average
dollar trading volume, average number of trades, percentage of days with trades, average
relative effective spreads, and average dollar value depths.3 All averages are calculated
on a per firm, per day basis. The developed-market group includes 16 European
exchanges, four North American exchanges, and seven Pacific exchanges; the emerging-
market group includes 11 Asian exchanges, four European, Middle Eastern, and African
exchanges, and five Latin American exchanges.
Our descriptive statistics reveal considerable cross-sectional variation both within
the six regions and (especially) across these regions. The number of actively traded firms
varies from a low of 13 for the Budapest and Lima Stock Exchanges to a high of 1,515
for Nasdaq; total market capitalization ranges from $6.8 billion for Korea’s KOSDAQ to
$9,092.1 billion for the NYSE; average trading volume ranges from $5.6 thousand on the
Istanbul Stock Exchange to $50,596.3 thousand on Switzerland’s Virt-X; and the average
number of daily trades varies from four on the Johannesburg Stock Exchange to 1,697 on
KOSDAQ. Most exchanges have a large percent of days with active trades.
In the last two columns of Table 1, we report average relative effective spreads
and average dollar depths. We define relative effective spreads as twice the absolute
value of the transaction price deviation from the bid-ask midpoint, divided by the bid-ask
midpoint. We define dollar depths (or depth in value) as the number of shares at the bid
3 We convert local currency amounts into US dollars using the daily historical spot exchange rates obtained from Bloomberg.
8
and ask prices multiplied by their corresponding prices (in US dollar terms).4 Over half
of the exchanges in our sample have relative spreads that are less than one percent of the
bid-ask midpoint. Only three stock exchanges (Jakarta, Sao Paulo, and Lima) have
relative spreads that exceed two percent. Of the nine exchanges with relative spreads less
than 0.5 percent, seven are located in Asia (Shanghai, Shenzhen, Bombay, National Stock
Exchange of India, Tokyo, KOSDAQ, and the Korea Exchange), one in Europe (Virt-X),
and one in North America (NYSE). Our dollar depth figures vary from a low of $523 for
the Istanbul Stock Exchange to $827,649 for the electronic Virt-X.5
2.2. Method of Analysis
In the first section of our analysis, we apply the methodology of Chordia, Roll,
and Subrahmanyam (2000) to our 47 stock exchanges. For each exchange, we test for
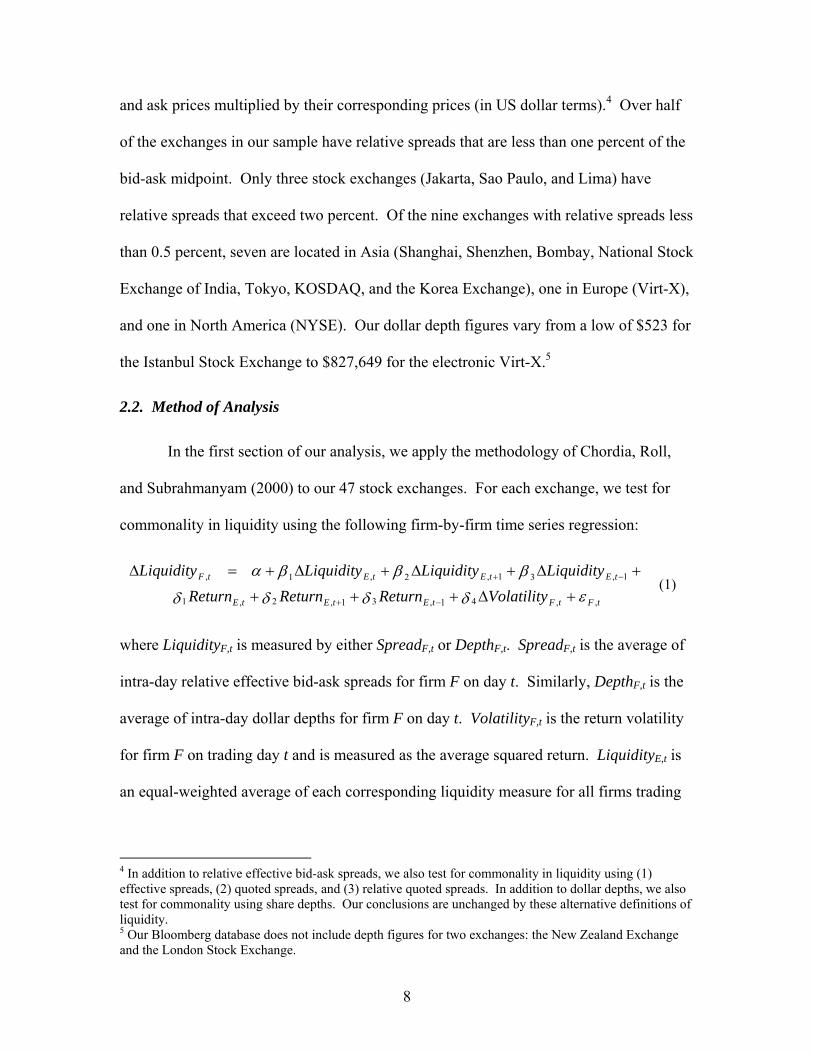
commonality in liquidity using the following firm-by-firm time series regression:
tFtFtEtEtE
tEtEtEtF
VolatilityReturnReturnReturnLiquidityLiquidityLiquidityLiquidity
,,41,31,2,1
1,31,2,1,
εδδδδ
βββα+∆+++
+∆+∆+∆+=∆
−+
−+ (1)
where LiquidityF,t is measured by either SpreadF,t or DepthF,t. SpreadF,t is the average of
intra-day relative effective bid-ask spreads for firm F on day t. Similarly, DepthF,t is the
average of intra-day dollar depths for firm F on day t. VolatilityF,t is the return volatility
for firm F on trading day t and is measured as the average squared return. LiquidityE,t is
an equal-weighted average of each corresponding liquidity measure for all firms trading
4 In addition to relative effective bid-ask spreads, we also test for commonality in liquidity using (1) effective spreads, (2) quoted spreads, and (3) relative quoted spreads. In addition to dollar depths, we also test for commonality using share depths. Our conclusions are unchanged by these alternative definitions of liquidity. 5 Our Bloomberg database does not include depth figures for two exchanges: the New Zealand Exchange and the London Stock Exchange.
9
on the same stock market.6 ReturnE,t is the equal-weighted average of the daily return for
all firms trading on the same stock market. All dependent and independent variables are
expressed in terms of proportional changes (denoted as ∆) in the variable across
successive trading days. All exchange averages exclude the dependent-variable firm; that
is, LiquidityE,t and ReturnE,t are calculated using all firms on the exchange except firm F.
Our primary variable of interest is the contemporaneous coefficient on tELiquidity ,∆
(i.e., β1 ). A positive and significant β1 would mean that exchange-level liquidity
changes exert a substantial influence on firm F’s liquidity.
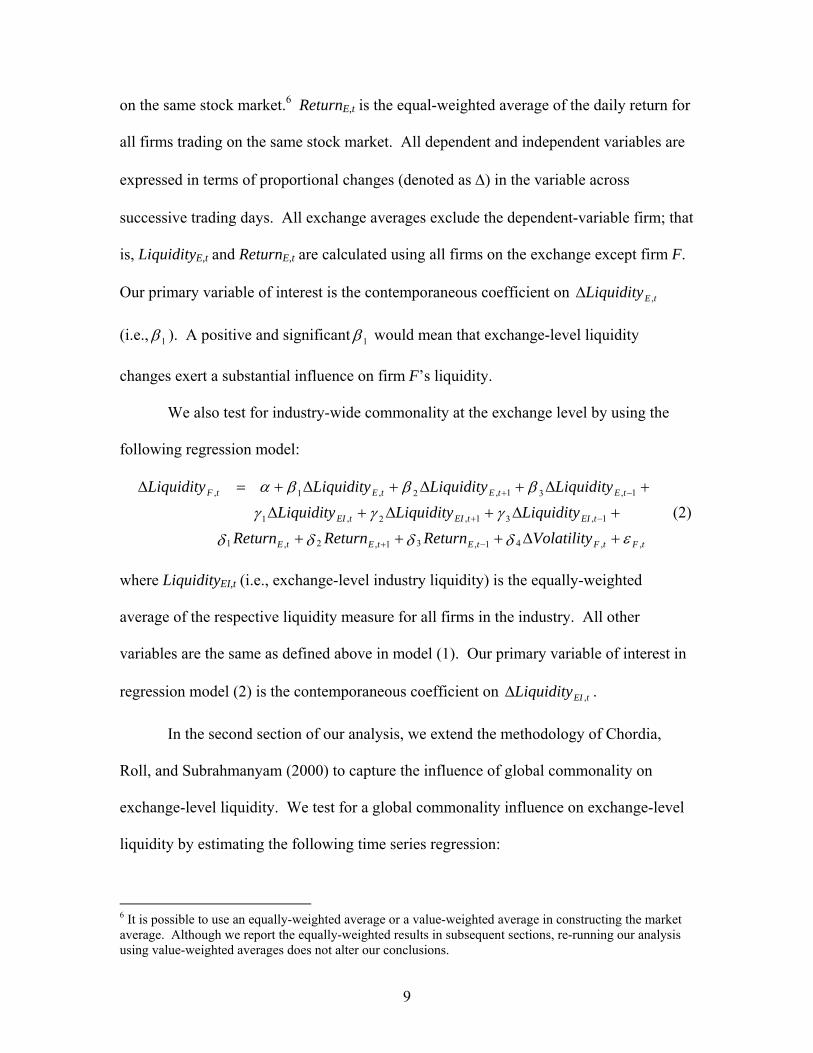
We also test for industry-wide commonality at the exchange level by using the
following regression model:
tFtFtEtEtE
tEItEItEI
tEtEtEtF
VolatilityReturnReturnReturnLiquidityLiquidityLiquidity
LiquidityLiquidityLiquidityLiquidity
,,41,31,2,1
1,31,2,1
1,31,2,1,
εδδδδ
γγγβββα
+∆+++
+∆+∆+∆
+∆+∆+∆+=∆
−+
−+
−+
(2)
where LiquidityEI,t (i.e., exchange-level industry liquidity) is the equally-weighted
average of the respective liquidity measure for all firms in the industry. All other
variables are the same as defined above in model (1). Our primary variable of interest in
regression model (2) is the contemporaneous coefficient on tEILiquidity ,∆ .
In the second section of our analysis, we extend the methodology of Chordia,
Roll, and Subrahmanyam (2000) to capture the influence of global commonality on
exchange-level liquidity. We test for a global commonality influence on exchange-level
liquidity by estimating the following time series regression:
6 It is possible to use an equally-weighted average or a value-weighted average in constructing the market average. Although we report the equally-weighted results in subsequent sections, re-running our analysis using value-weighted averages does not alter our conclusions.
10
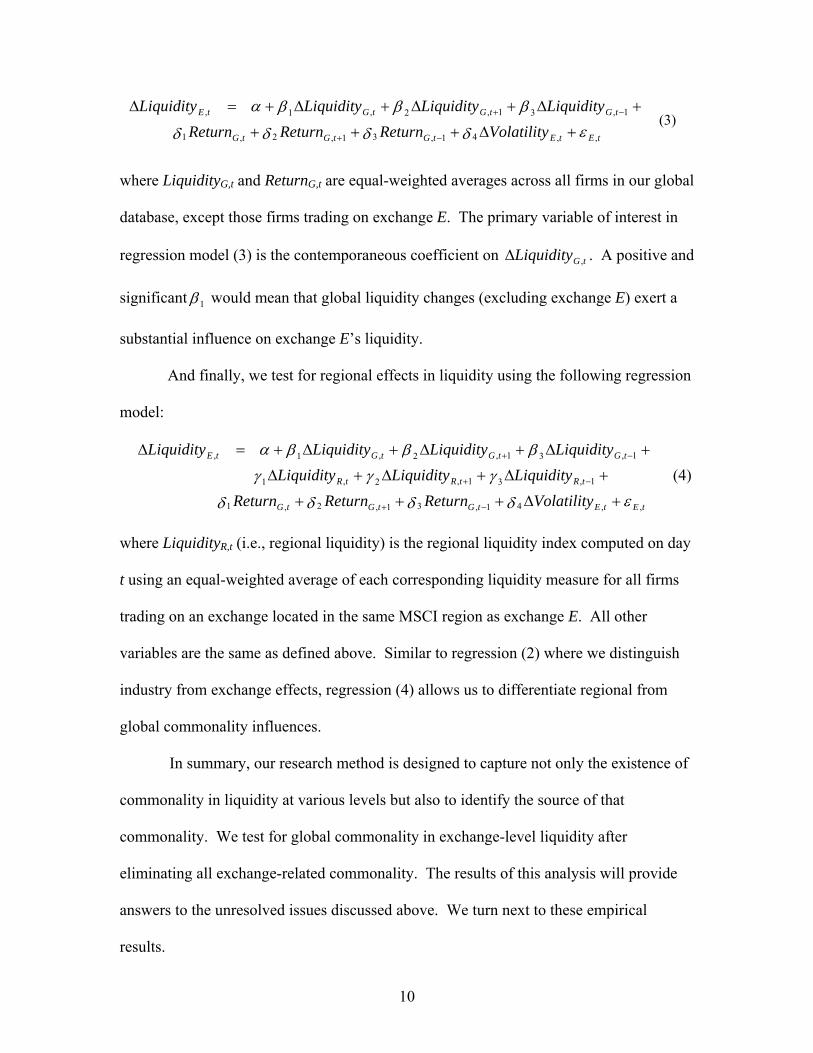
tEtEtGtGtG
tGtGtGtE
VolatilityReturnReturnReturnLiquidityLiquidityLiquidityLiquidity
,,41,31,2,1
1,31,2,1,
εδδδδ
βββα+∆+++
+∆+∆+∆+=∆
−+
−+ (3)
where LiquidityG,t and ReturnG,t are equal-weighted averages across all firms in our global
database, except those firms trading on exchange E. The primary variable of interest in
regression model (3) is the contemporaneous coefficient on tGLiquidity ,∆ . A positive and
significant β1 would mean that global liquidity changes (excluding exchange E) exert a
substantial influence on exchange E’s liquidity.
And finally, we test for regional effects in liquidity using the following regression
model:
tEtEtGtGtG
tRtRtR
tGtGtGtE
VolatilityReturnReturnReturnLiquidityLiquidityLiquidity
LiquidityLiquidityLiquidityLiquidity
,,41,31,2,1
1,31,2,1
1,31,2,1,
εδδδδ
γγγβββα
+∆+++
+∆+∆+∆
+∆+∆+∆+=∆
−+
−+
−+
(4)
where LiquidityR,t (i.e., regional liquidity) is the regional liquidity index computed on day
t using an equal-weighted average of each corresponding liquidity measure for all firms
trading on an exchange located in the same MSCI region as exchange E. All other
variables are the same as defined above. Similar to regression (2) where we distinguish
industry from exchange effects, regression (4) allows us to differentiate regional from
global commonality influences.
In summary, our research method is designed to capture not only the existence of
commonality in liquidity at various levels but also to identify the source of that
commonality. We test for global commonality in exchange-level liquidity after
eliminating all exchange-related commonality. The results of this analysis will provide
answers to the unresolved issues discussed above. We turn next to these empirical
results.
11
3. Empirical Results
We divide our empirical findings into two main sections. The first section
investigates the pervasiveness of co-movements in liquidity by estimating Chordia, Roll,
and Subrahmanyam’s (2000) commonality measures for each of our 47 exchanges
(regression models (1) and (2)). The second section examines commonality in liquidity
at the global scale. We estimate global and regional commonality measures for aggregate
exchange-level liquidity (regression models (3) and (4)). In both sections, we investigate
the influence of size and industry on commonality.
3.1. Exchange-Level Commonality
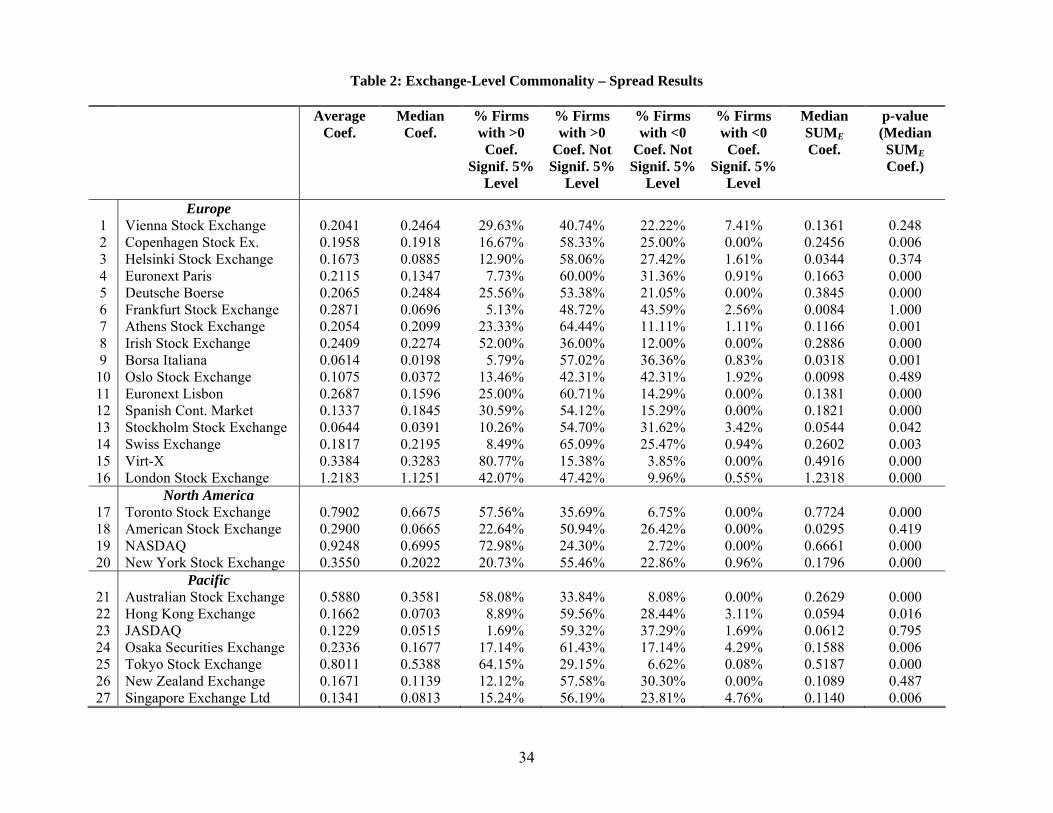
In Table 2, we report the following relative effective bid-ask spread results for
each of our 47 stock exchanges: average and median contemporaneous liquidity
coefficients from regression model (1); the percent of firms with positive and significant
coefficients, positive and insignificant coefficients, negative and insignificant
coefficients, negative and significant coefficients; median sum of lead, lag, and
contemporaneous coefficients; and the p-value of this sum. Unless otherwise stated, we
use a significance level of five percent to differentiate significant from insignificant
results.
Our findings in Table 2 provide strong support for the postulation that changes in
the individual firm’s bid-ask spreads are significantly influenced by a common
(exchange-wide) liquidity factor. These results confirm that commonality in liquidity is
ubiquitous across the world’s stock exchanges. Forty-three of the 47 exchanges have a
positive average contemporaneous coefficient, and 46 of the 47 exchanges have a
12
positive median coefficient.7 Forty-four exchanges have positive and significant
coefficients that exceed the null hypothesis of five percent, 33 exchanges have ten
percent or more of their firms with positive and significant coefficients, and 23 exchanges
have 20 percent or more of their firms with positive and significant coefficients.8
Turning to the percent of firms with negative and significant contemporaneous
coefficients, we find that only four exchanges (Vienna, Jakarta, Budapest, and Buenos
Aires) exceed the null hypothesis of five percent. The Buenos Aires Stock Exchange is
the only exchange with 10 percent or more of its firms (10.53%) exhibiting negative and
significant coefficients. In addition to the asymmetry in significant coefficients, there is
also a strong positive skewness in the percent of firms with insignificant coefficients. All
exchanges but one (Santiago) have a higher proportion of firms with positive and
insignificant coefficients relative to negative and significant coefficients. For well over
half of the exchanges, the percent of firms with positive and insignificant coefficients is
more than double the percent of firms with negative and insignificant coefficients.
The median values for the sum of lead, lag, and contemporaneous coefficients are
overwhelmingly positive. The Santiago Stock Exchange is the only exchange with a
negative median value (-0.1415), and it is insignificant at the five percent level (p-value =
0.222). Twenty-nine of the 46 exchanges with positive combined (SUM) coefficients are
statistically significant at the five percent level, with 26 exchanges significant at the one
percent level.
7 The four exchanges with negative average coefficients include the Stock Exchange of Thailand, Buenos Aires Stock Exchange, Sao Paulo Stock Exchange, and Santiago Stock Exchange. The only exchange with a negative median coefficient is the Santiago Stock Exchange. 8 The Budapest Stock Exchange, Santiago Stock Exchange, and JASDAQ are the only three exchanges on which less than five percent of firms have positive and significant contemporaneous coefficients.
13
Our global data and research design also enable us to identify cross-sectional
differences in spread commonality across stock exchanges. Median contemporaneous
coefficients range from a low of -0.1123 for the Santiago Stock Exchange to a high of
1.1251 for the London Stock Exchange. Besides London, there are eight other exchanges
with contemporaneous coefficients greater than 0.50; these include the stock exchanges
of Toronto, Nasdaq, Tokyo, Shanghai, Shenzhen, Bombay, Taiwan, and the National
Stock Exchange of India. Several of these same exchanges also have a high percent of
firms with significant coefficients. The stock exchanges of Shanghai, Shenzhen,
Bombay, Taiwan, Virt-X, Istanbul, and the National Stock Exchange of India all have 80
percent or more of their firms with positive and significant coefficients. It is interesting
to note that some of the strongest commonality-in-liquidity patterns appear in the
emerging Asian markets.
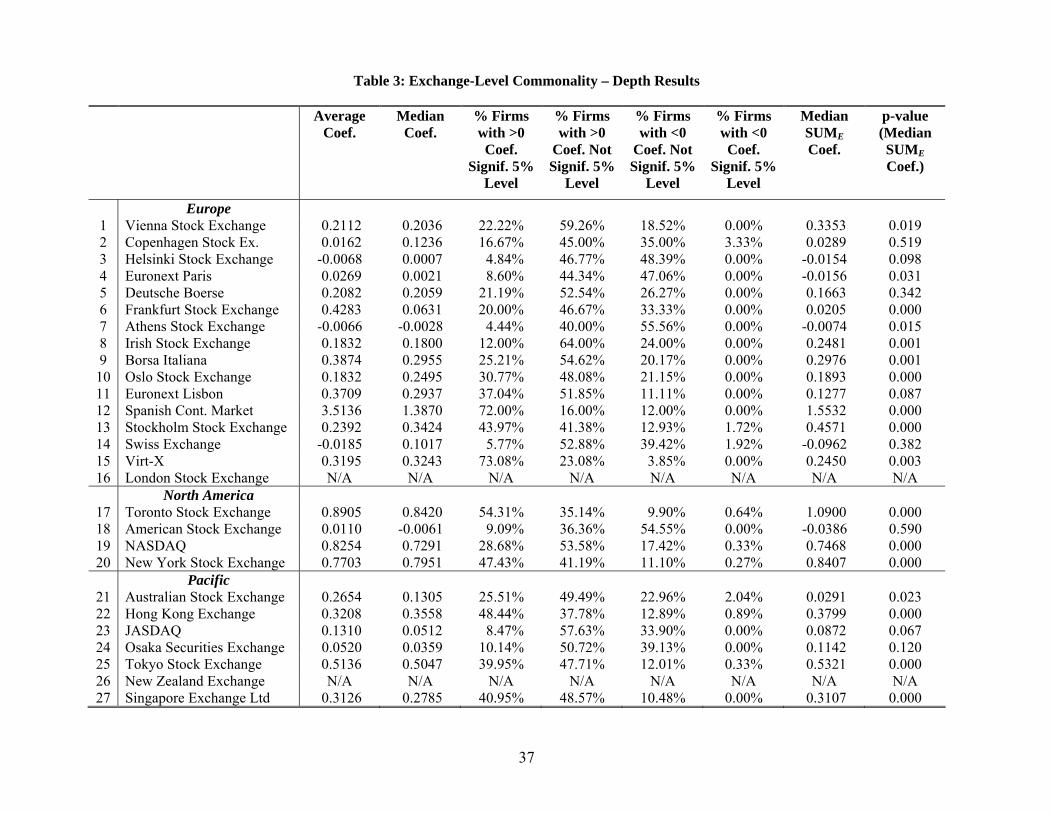
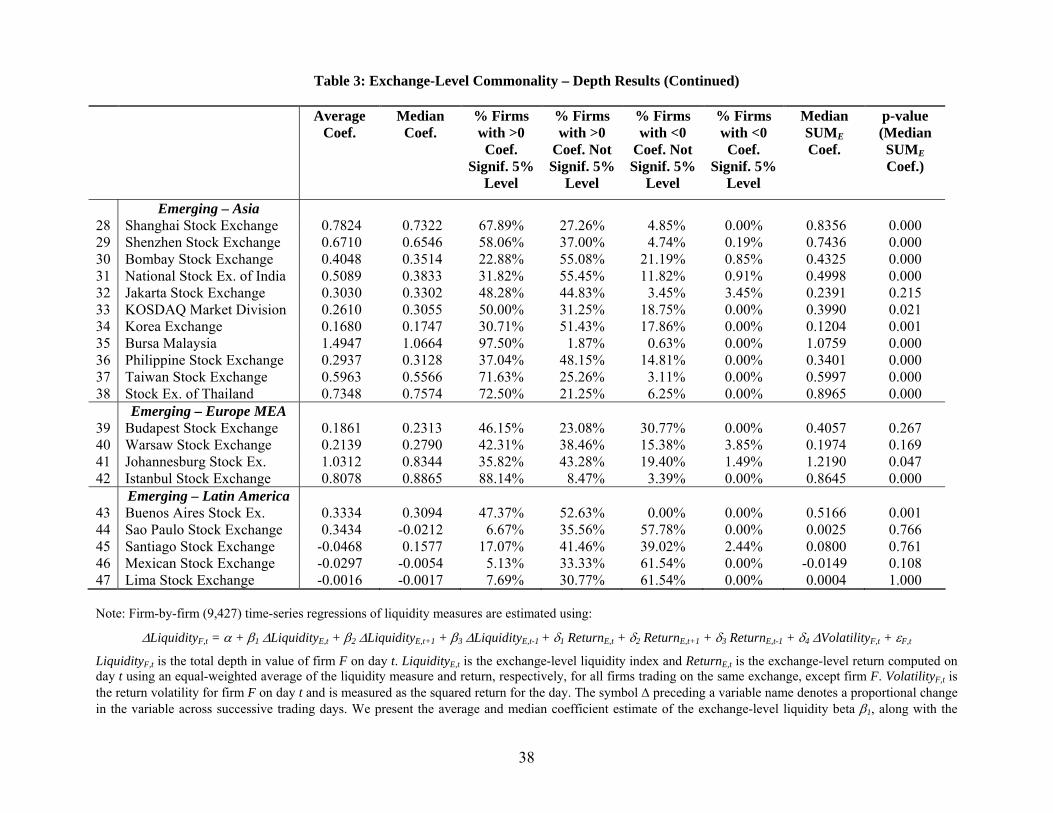
In Table 3, we examine commonality in depth across 45 stock exchanges. These
empirical results also provide strong support for the claim that changes in the individual
firm’s depths are significantly influenced by a common liquidity factor. Thirty-eight of
the 45 exchanges have a positive average contemporaneous coefficient; 40 exchanges
have a positive median coefficient. Forty-two exchanges have positive and significant
coefficients that exceed the null hypothesis of five percent, while 36 exchanges have ten
percent or more of their firms with positive and significant coefficients. Unlike our
commonality-in-spreads findings, no stock exchange has negative and significant
commonality coefficients exceeding five percent. The highest percent of negative and
significant coefficients is only 3.85 percent from the Warsaw Stock Exchange. Similar to

14
our commonality-in-spreads findings, the weakest evidence for commonality is
concentrated on the Emerging Latin American exchanges.
The median values for the sum of lead, lag, and contemporaneous depth
coefficients are mostly positive and significant. Twenty-eight of the 39 exchanges with
positive combined (SUM) coefficients are statistically significant at the five percent level,
with 24 exchanges significant at the one percent level. Only two exchanges, Euronext
Paris and the Athens Stock Exchange, have median SUM values (-0.0156, and -0.0074,
respectively) that are significant at the five percent level.
Similar to the cross-sectional differences in spread commonality, we find
considerable variation in depth commonality across stock exchanges. Median
contemporaneous coefficients vary from a low of -0.0212 for the Sao Paulo Stock
Exchange to a high of 1.3870 for the Spanish Continuous Market. In addition to the
Spanish exchange, there are 11 other exchanges with contemporaneous median
coefficients greater than 0.50; six of these 11 exchanges are located in Emerging Asia.9
In Table 4, we aggregate our spread and depth findings by geographic region and
by emerging versus developed markets. Panel A reports the bid-ask spread results at the
global, developed, and emerging market levels. We use the MSCI categories to further
divide our developed markets into European, North American, and Pacific regions; and
our emerging markets into Asian, Latin American, and Europe, Middle East, and Africa
regions. Panel B follows the same format for depths.
9 As a robustness check, Chordia, Roll, and Subrahmanyam (2000) test for cross-equation dependencies by running time series regressions on the residuals of paired companies. They report that the mean level of dependency is insufficient to significantly affect their overall results. We apply the same method and run time series regressions on the residuals of randomly arranged adjacent companies. At the 5% level, the proportion of significant t-values are 4.32 and 4.27 percent for our spread and depth residual regressions, respectively. These figures are lower than the comparable numbers, 12.33 and 11.73 percent, reported by Chordia, Roll, and Subrahmanyam (2000).
15
Turning to the results in Panel A, we find that the average (median)
contemporaneous spread coefficient is 0.5986 (0.4271). These positive coefficients are
significant at the five percent level for 48.78 percent of the firms in our global database.
The median of the combined lead, lag, and contemporaneous coefficient is 0.4327 and
highly significant. We find this same general pattern in the developed markets, where the
average (median) contemporaneous spread coefficient is 0.6036 (0.3733). Almost 43
percent of the developed market firms have positive and significant coefficients. Among
the three regions, North American firms are more susceptible to commonality in liquidity
than their European counterparts.
For the emerging markets, the average (median) contemporaneous spread
coefficient is 0.5845 (0.5677). Over 66 percent of the emerging market firms have
positive and significant coefficients. In sharp contrast to the developed markets,
emerging markets exhibit large variations in spread commonality. There is no evidence
of spread commonality in the Latin American region, whether one looks at the average or
median contemporaneous coefficients, percent of firms with significant coefficients, or
the combined lead, lag, and contemporaneous coefficient. The Asian emerging market,
on the other hand, has the largest commonality coefficients (average, median, and
combined) and the highest percent of significant coefficients across all regions including
the developed markets.
In Panel B, we report parallel results for our depth measures. The average
(median) contemporaneous depth coefficient is 0.6205 (0.5204), and these coefficients
are significant for 41.54 percent of global firms. The median of the combined lead, lag,
and contemporaneous coefficient is 0.5343 and highly significant. Similar to the spread
16
results in Panel A, the developed market’s contemporaneous and combined coefficients
are positive and highly significant. Again, the North American firms appear to be more
susceptible to commonality in liquidity than their European counterparts. Unlike the
spread results in Panel A, all emerging markets display significant commonality in depth
liquidity, with the exception of Latin America’s combined coefficient. The emerging
areas of Europe, Middle East, and Africa, in particular, have large and highly significant
contemporaneous depth coefficients.
3.1.1. Exchange-Level Commonality: Size Effects
In Table 5, we examine the relation between firm size (i.e., market capitalization)
and commonality. Our spread results in Panel A show that average, median, and
combined (SUM) coefficients are overwhelmingly positive and significant across all size
quintiles. Firms in second-smallest size quintile (Quintile 2) have the highest mean and
median coefficients (0.7231 and 0.6164, respectively), while firms in the largest size
quintile (Quintile 5) have the smallest mean and median coefficients (0.3986 and 0.2142,
respectively). These global findings are in stark contrast to previous size-based results
looking at NYSE firms. Chordia, Roll, and Subrahmanyam’s (2000) find that large
NYSE firms have the highest commonality-in-spread coefficients. On the other hand,
these global commonality-in-spread coefficients are consistent with the size-based
findings for an order-driven, non-US stock exchange (e.g., the Stock Exchange of Hong
Kong) in Brockman and Chung (2002).
Our Panel B depth results show that average, median, and combined (SUM)
coefficients are positive and significant across all size quintiles. Firms in the largest size
quintile have the highest mean and median coefficients (0.7416 and 0.6876, respectively),
17
while firms in the smallest size quintile have the smallest mean and median coefficients
(0.5016 and 0.3339, respectively). Unlike the spreads results in Panel A, our depth
results show a clear, monotonically-increasing relation between firm size and
commonality in depths.
Overall, these findings show that commonality is prevalent across all firm sizes;
small firms are more susceptible to commonality in spreads than large firms, but large
firms experience more commonality in depths than small firms.
3.1.2. Exchange-Level Commonality: Industry Effects
We report exchange-level commonality by industry (regression model (2)) in
Table 6. The spread results in Panel A reveal positive and highly significant mean,
median, and SUM coefficients. The percent of firms with positive and significant
contemporaneous spread coefficients (at the five percent level) varies from a low of 32.51
percent for Utilities to a high of 58.65 percent for Consumer Non-Cyclicals. Every
industry has a highly significant and positive median sum of lead, lag, and
contemporaneous coefficients (all p-values less than 0.001). The Consumer Cyclical
industry has the highest mean, median, and SUM coefficients (0.7532, 0.6164, and
0.6103, respectively), while the Utilities industry has the lowest mean, median, and SUM
coefficients (0.2932, 0.1216, and 0.1345, respectively).
In Panel B, we report commonality in depth by industry. Similar to the Panel A
results, the mean and median contemporaneous depth coefficients are all positive and
highly significant. The percent of firms with positive and significant contemporaneous
depth coefficients varies from a low of 23.44 percent for the Basic Material industry to a
18
high of 74.23 percent for Utilities. All of the combined SUM coefficients are positive
and significant at the five percent level.
Looking across the results in Panels A and B, we find some evidence of
substitution between spread and depth commonalities. That is, the Utilities industry
exhibits the weakest commonality in spreads, but also shows the strongest commonality
in depths. The Consumer-related industries (both Cyclical and Non-Cyclical) have the
strongest commonality in spreads, and relatively weak commonality in depths. This same
pattern is also apparent in our Table 5 size-based results. The smallest (largest) firms are
subject to the strongest (weakest) commonality-in-spread liquidity, while the largest
(smallest) firms are susceptible to the strongest (weakest) commonality-in-depth
liquidity. We are not aware of any market microstructure theory that would predict this
empirical pattern.
In addition to categorizing our commonality results by industry, we also estimate
commonality in liquidity at the industry level while controlling for commonality in
liquidity at the exchange level (i.e., regression model (2)). We report the spread
coefficients in Panel A of Table 7, and the depth coefficients in Panel B. For the global
spreads results in Panel A, our average (median) contemporaneous coefficient related to
industry commonality is 0.1064 (0.0334). Over ten percent of all firms have positive and
significant contemporaneous coefficients, and the SUM coefficient of 0.0344 is highly
significant. We find similar results for both the 27 developed and 20 emerging markets.
The median coefficients are 0.0340 and 0.0304, respectively, and they are significant for
10.07 and 11.73 percent of all in-sample firms.
19
For the global depth results in Panel B, our average (median) contemporaneous
coefficient related to industry commonality is 0.1315 (0.0749). Over 13 percent of all
firms have positive and significant contemporaneous coefficients, and the SUM
coefficient of 0.0799 is highly significant. Again, we find similar results for both the
developed and emerging markets. The median coefficients are 0.0787 and 0.0662,
respectively, and they are significant for 12.80 and 14.42 percent of in-sample firms.
Overall, the results in Table 7 demonstrate that there is a significant industry
component in firm-level liquidity. The industry component is present in spreads and
depths, as well as in developed and emerging markets. However, industry-level
commonality is not as influential as the exchange-level component in terms of average,
median, or SUM coefficient magnitudes or significance levels. Comparing our global
findings to Chordia, Roll, and Subrahmanyam’s (2000) NYSE findings, we note that the
industry effect is much more prominent for NYSE firms than for the typical global firm.
For three of their five liquidity measures, Chordia, Roll, and Subrahmanyam (2000) find
that contemporaneous and SUM industry coefficients are larger than the respective
exchange-level (i.e., NYSE) coefficients. The industry coefficients for NYSE firms are
also much larger than for our global firms.10 Although these differences could be related
to the specialist market structure (Coughenour and Saad (2004)), further research is
certainly warranted.
10 Their industry-related spread (SUM) coefficients for NYSE firms range from a low of 0.259 for relative effective spreads to a high of 0.527 for quoted spreads. Their industry-related depth (SUM) coefficient for NYSE firms is 0.480. In contrast, none of our comparable spread coefficients is larger than 0.0375, and none of our depth (SUM) coefficients is larger than 0.0854.
20
3.2. Global Commonality
Our exchange-level results provide direct evidence that the commonality in
liquidity found in previous studies for the NYSE is in fact a pervasive phenomenon
across most of the world’s stock exchanges. We also document cross-sectional variations
in commonality at the level of the individual exchange, geographic region (e.g., Pacific,
Latin America), developed versus emerging market, size-based quintiles, and industry.
We turn now to examining commonality at the global scale. Our primary objective in
this section is to determine whether commonality in liquidity has a natural boundary at
the exchange’s frontier, or whether it spills over onto other exchanges.
3.2.1. Global Commonality: Comovement across Exchanges
In Table 8, we investigate the global scope of commonality in liquidity. We use
regression model (3) to estimate changes in aggregate exchange liquidity attributable to
changes in global liquidity (i.e., excluding the exchange of interest). Panel A reports our
spread results and Panel B provides our depth results. The average (median)
contemporaneous spread coefficient is 0.1753 (0.1764) across all stock exchanges. This
coefficient is positive and significant at the five percent level for 44.68 percent of our
exchanges. It is negative and significant for 2.13 percent of exchanges. The median sum
of lead, lagged, and contemporaneous coefficients is 0.2275, and it is highly significant.
These findings represent unambiguous evidence of global commonality in bid-ask
spreads.
We investigate global commonality in more detail by dividing our 47 exchanges
into 27 developed markets and 20 emerging markets. This partition allows us to analyze
separately the global components in developed versus emerging markets, although it also
21
reduces the power of our tests by creating two small samples. The developed markets
average (median) contemporaneous spread coefficient is 0.2494 (0.2440). Almost 60
percent of these coefficients are positive and significant, and none is negative and
significant. The SUM coefficient (0.2546) is significant at the one percent level. Our
emerging markets results are similar in significance, if smaller in magnitude. The
emerging markets average (median) contemporaneous spread coefficient is 0.0752
(0.1296). Twenty-five percent of these coefficients are positive and significant, and five
percent are negative and significant. The median SUM coefficient (0.1234) is significant
at the five percent level. Overall, we find that changes in bid-ask spreads strongly co-
vary across both developed and emerging markets.
Turning to the depth results in Panel B, we see that the average (median)
contemporaneous depth coefficient is 0.0674 (0.0352) across all stock exchanges. This
coefficient is positive and significant for 26.67 percent of our exchanges, and negative
and significant for 4.44 percent of our exchanges. The median SUM coefficient is
0.0750, and it is significant at the one percent level.
The developed markets average (median) contemporaneous depth coefficient is
0.0711 (0.0404). Thirty-two percent of these coefficients are positive and significant,
while only four percent are negative and significant. The SUM coefficient (0.1055) is
positive and significant at the 5.2 percent level. The emerging-markets average (median)
contemporaneous depth coefficient is 0.0628 (0.0325). Twenty percent of these
coefficients are positive and significant, and five percent are negative and significant.
The median SUM coefficient (0.0614) is positive but insignificant at conventional levels
(p-value = 0.115).
22
Overall, our Table 8 findings represent the first empirical evidence of global
commonality in spreads and depths. Global commonality in spreads and depths
significantly affects both developed and emerging markets, with some evidence that its
impact is strongest on the developed market exchanges.11
3.2.2. Global Commonality: Size Effects
In Table 9, we report global commonality coefficients by exchange size in order
to test whether commonality is restricted to exchanges of a given size. We divide all 47
exchanges into small, medium, and large categories based on their total market
capitalizations. The spread results in Panel A demonstrate that while spread
commonality is significant across all exchange sizes, larger exchanges are more sensitive
to liquidity spillover than small exchanges. The average (median) contemporaneous
coefficient increases from 0.1664 (0.1296) for small exchanges to 0.2011 (0.2075) for
large exchanges. Similarly, the percent of exchanges with positive and significant
coefficients is 31.25 percent for small exchanges and 68.7 percent for large exchanges,
with medium size exchanges somewhere in between. In contrast to Table 5’s firm-size
results where spread commonality decreases with size, our exchange-based results show
that spread commonality increases with size.
The depth results in Panel B reveal that depth commonality is significant across
all exchange sizes. Small exchanges are relatively more sensitive to depth-related
liquidity spillover than large exchanges. The average (median) contemporaneous
coefficient decreases from 0.0926 (0.0812) for small exchanges to 0.0329 (0.0348) for
11 Following Chordia, Roll, and Subrahmanyam (2000), we test for cross-equation dependencies by running time series regressions on the residuals of paired exchanges. At the 5% level, the proportion of significant t-values are 6.52 and 9.09 percent for our spread and depth residual regressions, respectively. These figures are lower than the firm-level NYSE results reported in Chordia, Roll, and Subrahmanyam (2000).
23
large exchanges. Similarly, the percent of exchanges with positive and significant
coefficients is 31.25 percent for small exchanges and 20.00 percent for large exchanges,
with medium exchanges in between. Again, in contrast to Table 5’s firm-size results
where depth commonality increases with size, our exchange-based results show that
depth commonality decreases with size.
The size of the exchange, in terms of market capitalization, appears to play a
significant role in liquidity transmission. Larger exchanges experience greater spillover
effects in the spread dimension, while smaller exchanges experience greater spillover
effects in the depth dimension. The main finding in Table 9, however, is that all
exchange sizes are susceptible to global commonality in liquidity.
3.2.3. Global Commonality: Regional Effects
In Table 10, we apply regression model (4) in order to measure any regional
effects on commonality. Similar to our analysis of clusters of firms (by industry) on
exchange-level commonality in Table 7, we examine clusters of exchanges (by MSCI
region) on global commonality in Table 10. We report separate global and regional
coefficients for all world exchanges, developed markets, and emerging markets. For the
global (regional) spread results in Panel A, our average contemporaneous coefficient is
0.1231 (0.1142), and our median coefficient is 0.1135 (0.0475). The regional
contemporaneous coefficients are smaller and less significant than their global
counterparts. The regional SUM coefficient is 0.0540 with a p-value of 0.243, while the
global SUM coefficient is 0.1852 with a p-value of 0.001. For all exchanges combined,
regional commonality plays a smaller (though still significant) role than global
commonality.
24
We find very different results, however, when we compare the developed market
mix of regional versus global commonality to the emerging market mix. The regional
component in developed markets is larger and equally significant as the global
component. The average global (regional) contemporaneous coefficient is 0.1553
(0.1934), and the median global (regional) coefficient is 0.1553 (0.1873). The global
SUM coefficient is larger (0.2327 versus 0.1837) but less significant (p-values = 0.052
versus 0.006) than the regional SUM coefficient. In contrast, we find only weak
evidence for regional commonality in spreads for the emerging markets. The average
(median) contemporaneous coefficient is 0.0073 (0.0003), while the SUM coefficient is
negative and insignificant. Developed markets are clearly more affected by changes in
regional markets’ spreads than emerging markets.
In Panel B, we analyze the separate impacts of global and regional liquidity on
depth commonality. For global (regional) depth across all exchanges, we find an average
contemporaneous coefficient of 0.0479 (0.0751), and a median coefficient of 0.0344
(0.0398). The regional contemporaneous coefficients are larger and more significant than
their global counterparts, although this relation does not hold for the SUM coefficients.
Turning to the developed-versus-emerging market coefficients, we find a similar pattern
to the spread results in Panel A. The regional source of commonality is larger and more
significant than the global source of commonality for the developed markets. The
average global contemporaneous coefficient for developed markets is 0.0398, compared
to an average regional coefficient of 0.1234. Similarly, the median global coefficient is
0.0248 and the median regional coefficient is 0.0546. While 12 percent of the global
coefficients are positive and significant at the five percent level, 32 percent of the
25
regional coefficients are positive and significant. The SUM coefficients give mixed
results, with a smaller but more significant regional SUM coefficient.
In the emerging markets, the regional source of commonality is smaller than the
global source of commonality. The average global contemporaneous coefficient for
emerging markets is 0.0580, compared to an average regional coefficient of 0.0147; the
median global coefficient is 0.0482 and the median regional coefficient is only 0.0035.
The regional SUM coefficient is negative and insignificant, while the global SUM
coefficient is positive and insignificant.
Overall, these results demonstrate that a significant source of commonality in
liquidity among exchanges is attributable to regional effects. This regional effect, while
significant for spreads and depths across developed and emerging markets, does not fully
account for global commonality. That is, there is a separate and distinct source of
commonality in liquidity that spills over from exchanges outside of one’s MSCI region.
For developed markets, a larger portion of commonality in both spreads and depths
comes from regional sources. For emerging markets, the global (non-regional) source
dominates.
3.2.4. Global Commonality: Robustness
In Table 11, we test the robustness of our global commonality results by
redefining the global liquidity portfolio.12 We rerun the results in Table 8 after excluding
the effect of several influential exchanges; NYSE, Nasdaq, the London Stock Exchange,
and the Tokyo Stock Exchange. It is possible that the significant global commonality
reported in Table 8 is due to the influence of one or more of these large exchanges. We
12 In addition to analyzing various definitions of global liquidity portfolios, we also test the robustness of our global commonality findings after controlling for industry effects. There remains a significant global commonality component in exchange-level liquidity after accounting for industry effects.
26
select the four largest exchanges in the world; the smallest of the four, the London Stock
Exchange, has more than twice the market capitalization of the fifth largest exchange,
Euronext Paris.
In Panel A of Table 11, we show that excluding the NYSE, Nasdaq, or London
Stock Exchange from the global liquidity portfolio (on an individual basis) has little
impact on the magnitude or significance of the average, median, or SUM liquidity
coefficients. Excluding the Tokyo Stock Exchange, on the other hand, reduces
substantially the magnitude and significance of all liquidity coefficients. After excluding
all four exchanges, the average (median) contemporaneous coefficient falls to 0.0987
(0.0864) from a value of 0.1705 (0.1745) with all exchanges included. We find a similar
reduction in the SUM coefficient from 0.2275 to 0.0907.
Our Panel B results mirror those in Panel A. Although there is more variation in
the depth effects of individual exchange exclusions, the largest change from any single
exchange continues to be from the Tokyo Stock Exchange. The average (median)
contemporaneous coefficient changes from 0.0899 (0.0277) with all exchanges included
to 0.0154 (0.0488) with the four large exchanges excluded. The SUM coefficient
changes from 0.0623 to 0.0744.
In summary, there is a clear reduction in the magnitudes and significance levels
for spread commonality after excluding the four largest exchanges. There is some
reduction in magnitudes and significance levels for depth commonality as well, although
this pattern is not as regular (e.g., the average coefficient increases, while the median
coefficient decreases). The main point, however, is that commonality in global liquidity
remains significant for both spreads and depths after excluding any influence from the
27
largest global exchanges. Global commonality is not driven solely from New York,
London, or Tokyo.
4. Summary and Conclusions
Previous empirical research finds a common exchange-level component that
influences firm-level liquidity, both in terms of bid-ask spreads and depths. Although
most of the empirical evidence is restricted to firms trading on a US exchange (Chordia,
Roll, and Subrahmanyam (2000), Hasbrouck and Seppi (2001), and Huberman and Halka
(2001)), there is limited evidence of commonality on non-US exchanges (Fabre and Frino
(2004) and Brockman and Chung (2002)). All previous studies that examine
commonality in intraday spreads and depths are single-exchange studies.
Our study contributes to this literature in two primary ways. First, we conduct the
first comprehensive investigation of commonality in liquidity using intraday spread and
depth data from 47 stock exchanges. Second, we examine the impact of a global liquidity
factor on spread and depth commonality. Given the size and scope of our Bloomberg
database, we are able to analyze several aspects of commonality that previous, single-
exchange studies could not address. These unresolved issues include the pervasiveness
of spread and depth commonality, the cross-sectional variation in commonality among
exchanges and regions, and the possible existence of a global liquidity factor.
Our empirical results confirm that exchange-level commonality is a widespread
phenomenon across the globe. For most exchanges in our sample, the individual firm’s
bid-ask spreads are significantly influenced by changes in the aggregate market’s bid-ask
spreads. Similarly, changes in the individual firm’s depths are significantly influenced by
28
changes in exchange-level depths. Our cross-sectional results show that the Emerging
Asia stock exchanges exhibit exceptionally strong commonality in spreads and depths,
while the stock exchanges of Latin American have little, if any, commonality at the
exchange level.
We investigate the importance of firm size and industry within each of our 47
stock exchanges. We find that commonality in bid-ask spreads is strongest among small
firms, in contrast to previous NYSE-based results. Depth commonality, on the other
hand, exhibits a positive and monotonic relation with firm size. Our industry results
show that while commonality is significant in each industry, there is considerable
variation across industries. Utilities, for example, tend to have less commonality in
spreads than other industries, while the basic materials industry is less sensitive to
commonality in depths. We also show that industry-level commonality is significantly
weaker than exchange-level commonality across our 47 exchanges. This finding is
different from previously-reported NYSE results showing that industry effects often
dominate exchange effects.
After documenting the pervasive role of commonality within individual stock
exchanges, we turn our attention to examining commonality across stock exchanges.
We extend the empirical model of Chordia, Roll, and Subrahmanyam (2000) in order to
measure the impact of changes in intraday global liquidity on changes in aggregate
exchange-level liquidity. Our findings represent the first empirical evidence for the
existence of global commonality in spreads and depths.
We find unambiguous support for the hypothesis that commonality in liquidity
spills over the national border. Movements in aggregate bid-ask spreads and depths on
29
an individual exchange are significantly influenced by movements in spreads and depths
at the global scale. The global commonality in liquidity component that we find for
spreads and depths is significant in both developed and emerging markets. Comparing
the two market categories, we show that developed markets experience more liquidity
spillover than emerging market. We also find that liquidity spillover extends beyond the
regional level. Again, developed markets appear to be more susceptible to regional
commonality influences than emerging markets. For developed markets, a larger portion
of depth and spread commonality comes from regional sources. For emerging markets,
the non-regional (i.e., global) source dominates. Finally, we show that the total market
capitalization of the exchange plays a significant role in the liquidity transmission
process.
In summary, our results verify that neither firm- nor exchange-level liquidity can
be understood in isolation. Individual firm liquidity is partly determined by an exchange-
level commonality component, and aggregate exchange liquidity is partly determined by
a global commonality component. Future research is needed to understand the causes of
global liquidity co-movements, as well as to identify the channels through which liquidity
changes on one exchange affect the liquidity on another.

30
References
Acharya, V.V., and L.H. Pedersen, 2005, Asset pricing and liquidity risk, Journal of Financial Economics 77, 375-410.
Amihud, Y., and H. Mendelson, 1986, Asset pricing and the bid-ask spread, Journal of
Financial Economics 17, 223-249. Barclay, M., and C. Smith, Jr., 1988, Corporate payout policy: Cash dividends versus
open-market repurchases, Journal of Financial Economics 22, 61-82. Benston, G., and R. Hagerman, 1974, Determinants of bid-ask spreads in the over-the-
counter market, Journal of Financial Economics 1, 353-364. Brennan, M.J., and A. Subrahmanyam, 1996, Market microstructure and asset pricing:
On the compensation for illiquidity in stock returns, Journal of Financial Economics 41, 441-464.
Brockman, P., and D.Y. Chung, 1999, An analysis of depth behavior in an electronic,
order-driven environment, Journal of Banking and Finance 23, 1861-1886. Brockman, P., and D.Y. Chung, 2002, Commonality in liquidity: Evidence from an
order-driven market structure, Journal of Financial Research 25, 521-539. Chordia, T., R. Roll, and A. Subrahmanyam, 2000, Commonality in liquidity, Journal of
Financial Economics 56, 3-28. Chordia, T., A. Sarkar, and A. Subrahmanyam, 2005, An empirical analysis of stock and
bond market liquidity, Review of Financial Studies 18, 85-129. Coughenour, J.F., and M.M. Saad, 2004, Common market makers and commonality in
liquidity, Journal of Financial Economics 73, 37-69. Datar, V.T., N.Y. Naik, and R. Radcliffe, 1998, Liquidity and stock returns: An
alternative test, Journal of Financial Markets 1, 203-219. Easley, D., S. Hvidkjaer, and M. O’Hara, 2002, Is information risk a determinant of asset
returns?, Journal of Finance 62, 2185-2221. Fabre, J., and A. Frino, 2004, Commonality in liquidity: Evidence from the Australian
Stock Exchange, Accounting and Finance 44, 357-368. Franz, D.R., R.P. Rao, and N. Tripathy, 1995, Informed trading risk and bid-ask spread
changes around open market stock repurchases in the NASDAQ market, Journal of Financial Research 18, 311-327.
31
Hasbrouck, J., and D.J. Seppi, 2001, Common factors in prices, order flows, and liquidity, Journal of Financial Economics 59, 383-411.
Huberman, G., and D. Halka, 2001, Systematic liquidity, Journal of Financial Research
24, 161-178. Noronha, G., A. Sarin, and S. Saudagaran, 1996, Testing for liquidity effects of
international dual listings using intraday data, Journal of Banking and Finance 20, 965-983.
Pastor, L., and R. Stambaugh, 2003, Liquidity risk and expected stock returns, Journal of
Political Economy 113, 642-685. Stahel, C.W., 2003, Is there a global liquidity factor? Working Paper, George Mason
University. Stahel, C.W., 2005, Liquidity across developed and emerging markets? Working Paper,
George Mason University. Stoll, H.R., 1978, The supply of dealer services in securities markets, Journal of Finance
33, 1133-1151. Weinberg, P., 2006, How London can close gap on Wall Street, Financial Times, internet
edition, March 29. Wurgler, J., 2000, Financial markets and the allocation of capital, Journal of Financial
Economics 58, 187-214.
32
Table 1: Descriptive Statistics
# Exchange Country Region Number of Firms
Total Market
Cap. (Billion
US$)
Trading Volume
(Thousand US$)
Number of
Trades
% of Days with
Trades
Relative Effective Spread
Total Depth in
Value (US$)
1 Vienna Stock Exchange Austria Europe 27 25.3 1,100.1 26 94% 0.0088 120,6032 Copenhagen Stock Ex. Denmark Europe 60 81.7 2,942.5 91 95% 0.0093 145,7053 Helsinki Stock Exchange Finland Europe 62 152.1 7,487.1 163 94% 0.0105 146,6154 Euronext Paris France Europe 221 913.0 12,388.5 502 69% 0.0092 191,3205 Deutsche Boerse Germany Europe 134 579.8 25,033.9 369 98% 0.0082 61,8956 Frankfurt Stock Exchange Germany Europe 41 63.1 317.5 20 82% 0.0170 35,3087 Athens Stock Exchange Greece Europe 90 52.6 772.4 177 99% 0.0080 130,3248 Irish Stock Exchange Ireland Europe 25 56.7 5,617.8 36 95% 0.0122 136,9119 Borsa Italiana Italy Europe 121 408.6 13,786.8 611 98% 0.0075 40,307
10 Oslo Stock Exchange Norway Europe 52 47.9 4,018.2 113 92% 0.0127 140,42411 Euronext Lisbon Portugal Europe 28 44.5 2,988.2 158 95% 0.0093 299,43612 Spanish Continuous Market Spain Europe 86 360.2 18,071.4 430 98% 0.0058 465,96713 Stockholm Stock Exchange Sweden Europe 117 264.3 8,636.2 237 97% 0.0090 476,57414 Swiss Exchange Switzerland Europe 106 137.0 727.1 42 91% 0.0111 89,73515 Virt-X Switzerland Europe 26 472.4 50,596.3 1,121 100% 0.0021 827,64916 London Stock Exchange UK Europe 550 1,852.6 5,315.3 57 96% 0.0139 N/A17 Toronto Stock Exchange Canada N-America 314 567.8 3,990.7 240 97% 0.0085 58518 American Stock Exchange USA N-America 55 40.6 2,198.0 169 98% 0.0115 52,79819 NASDAQ USA N-America 1,515 2,137.7 6,938.5 688 99% 0.0060 21,24320 New York Stock Exchange USA N-America 1,475 9,092.1 20,690.6 729 100% 0.0041 57,88021 Australian Stock Exchange Australia Pacific 199 406.5 4,276.4 177 98% 0.0066 153,75022 Hong Kong Exchange Hong Kong Pacific 225 566.7 8,689.9 151 96% 0.0108 606,52523 JASDAQ Japan Pacific 59 14.9 921.3 69 93% 0.0111 43,28824 Osaka Securities Exchange Japan Pacific 70 80.1 2,568.4 121 90% 0.0068 58,79425 Tokyo Stock Exchange Japan Pacific 1,201 1,873.8 4,754.5 164 91% 0.0049 146,93726 New Zealand Exchange New Zeal. Pacific 33 65.5 869.5 32 98% 0.0076 N/A27 Singapore Exchange Ltd Singapore Pacific 105 151.6 2,061.0 86 98% 0.0104 381,57928 Shanghai Stock Exchange China Asia 598 271.3 779.6 183 98% 0.0025 13,20229 Shenzhen Stock Exchange China Asia 527 191.3 755.1 204 98% 0.0026 12,68230 Bombay Stock Exchange India Asia 119 104.8 701.1 505 98% 0.0035 2,695
33
Table 1: Descriptive Statistics (Continued)
# Exchange Country Region Number of Firms
Total Market
Cap. (Billion
US$)
Trading Volume
(Thousand US$)
Number of
Trades
% of Days with
Trades
Relative Effective Spread
Total Depth in
Value (US$)
31 National Stock Ex. of India India Asia 111 102.2 1,512.1 501 98% 0.0025 3,42532 Jakarta Stock Exchange Indonesia Asia 32 25.4 1,199.5 137 96% 0.0295 469,62333 KOSDAQ Market Division Korea Asia 16 6.8 6,489.1 1,697 100% 0.0040 54,33234 Korea Exchange Korea Asia 140 176.2 6,430.0 1,037 99% 0.0039 111,40835 Bursa Malaysia Malaysia Asia 160 106.4 606.5 60 97% 0.0094 92,28136 Philippine Stock Exchange Philippines Asia 27 30.4 290.3 44 93% 0.0183 70,64237 Taiwan Stock Exchange Taiwan Asia 289 212.4 5,763.2 221 99% 0.0053 294,00538 Stock Ex. of Thailand Thailand Asia 80 49.5 2,202.8 203 96% 0.0094 193,23239 Budapest Stock Exchange Hungary Europe-MEA 13 12.0 1,745.2 127 96% 0.0124 27,84140 Warsaw Stock Exchange Poland Europe-MEA 26 22.9 987.1 156 96% 0.0084 49,19041 Johannesburg Stock Ex. South Africa Europe-MEA 74 145.9 717.2 4 82% 0.0100 149,97542 Istanbul Stock Exchange Turkey Europe-MEA 59 39.2 5.6 883 100% 0.0098 52343 Buenos Aires Stock Ex. Argentina Latin America 19 87.4 456.6 103 97% 0.0116 23,16944 Sao Paulo Stock Exchange Brazil Latin America 45 90.1 649.9 66 86% 0.0238 31,98745 Santiago Stock Exchange Chile Latin America 43 42.4 508.2 19 85% 0.0180 25,77046 Mexican Stock Exchange Mexico Latin America 39 146.4 2,318.3 84 93% 0.0124 118,98547 Lima Stock Exchange Peru Latin America 13 10.0 103.0 10 86% 0.0276 235,586 All Exchanges Combined All All 9,427 22,382.4 7,593.6 378 96% 0.0067 105,646 Note: This table presents for each sample exchange, the name, country, region (MSCI), number of listed firms, total market capitalization in billions of US$, and several descriptive statistics computed over the period October 1, 2002 to June 30, 2004. The MSCI regions are Europe (Developed Markets - Europe), N-America (Developed Markets - North America), Pacific (Developed Markets - Pacific), Asia (Emerging Markets - Asia), Europe-MEA (Emerging Markets – Europe, Middle East, and Africa), and Latin America (Emerging Markets - Latin America). Trading Volume (Thousand US$) is the average value of shares traded per day and per firm measured in thousands of US$, Number of Trades is the average number of transactions per day and per firm, % of Days with Trades is the percent of trading days with at least one transaction, Relative Effective Spread is the effective spread (i.e., twice the absolute trading price deviation from the bid-ask midpoint) divided by the bid-ask midpoint, and Total Depth in Value is the number of shares at the bid and ask multiplied by their respective prices converted in US$. Each trading activity and liquidity measure is averaged across day for each firm, and then their mean is computed across firms.
34
Table 2: Exchange-Level Commonality – Spread Results
Average Coef.
Median Coef.
% Firms with >0 Coef.
Signif. 5% Level
% Firms with >0
Coef. Not Signif. 5%
Level
% Firms with <0
Coef. Not Signif. 5%
Level
% Firms with <0 Coef.
Signif. 5% Level
Median SUME Coef.
p-value (Median SUME Coef.)
Europe 1 Vienna Stock Exchange 0.2041 0.2464 29.63% 40.74% 22.22% 7.41% 0.1361 0.248 2 Copenhagen Stock Ex. 0.1958 0.1918 16.67% 58.33% 25.00% 0.00% 0.2456 0.006 3 Helsinki Stock Exchange 0.1673 0.0885 12.90% 58.06% 27.42% 1.61% 0.0344 0.374 4 Euronext Paris 0.2115 0.1347 7.73% 60.00% 31.36% 0.91% 0.1663 0.000 5 Deutsche Boerse 0.2065 0.2484 25.56% 53.38% 21.05% 0.00% 0.3845 0.000 6 Frankfurt Stock Exchange 0.2871 0.0696 5.13% 48.72% 43.59% 2.56% 0.0084 1.000 7 Athens Stock Exchange 0.2054 0.2099 23.33% 64.44% 11.11% 1.11% 0.1166 0.001 8 Irish Stock Exchange 0.2409 0.2274 52.00% 36.00% 12.00% 0.00% 0.2886 0.000 9 Borsa Italiana 0.0614 0.0198 5.79% 57.02% 36.36% 0.83% 0.0318 0.001
10 Oslo Stock Exchange 0.1075 0.0372 13.46% 42.31% 42.31% 1.92% 0.0098 0.489 11 Euronext Lisbon 0.2687 0.1596 25.00% 60.71% 14.29% 0.00% 0.1381 0.000 12 Spanish Cont. Market 0.1337 0.1845 30.59% 54.12% 15.29% 0.00% 0.1821 0.000 13 Stockholm Stock Exchange 0.0644 0.0391 10.26% 54.70% 31.62% 3.42% 0.0544 0.042 14 Swiss Exchange 0.1817 0.2195 8.49% 65.09% 25.47% 0.94% 0.2602 0.003 15 Virt-X 0.3384 0.3283 80.77% 15.38% 3.85% 0.00% 0.4916 0.000 16 London Stock Exchange 1.2183 1.1251 42.07% 47.42% 9.96% 0.55% 1.2318 0.000
North America 17 Toronto Stock Exchange 0.7902 0.6675 57.56% 35.69% 6.75% 0.00% 0.7724 0.000 18 American Stock Exchange 0.2900 0.0665 22.64% 50.94% 26.42% 0.00% 0.0295 0.419 19 NASDAQ 0.9248 0.6995 72.98% 24.30% 2.72% 0.00% 0.6661 0.000 20 New York Stock Exchange 0.3550 0.2022 20.73% 55.46% 22.86% 0.96% 0.1796 0.000
Pacific 21 Australian Stock Exchange 0.5880 0.3581 58.08% 33.84% 8.08% 0.00% 0.2629 0.000 22 Hong Kong Exchange 0.1662 0.0703 8.89% 59.56% 28.44% 3.11% 0.0594 0.016 23 JASDAQ 0.1229 0.0515 1.69% 59.32% 37.29% 1.69% 0.0612 0.795 24 Osaka Securities Exchange 0.2336 0.1677 17.14% 61.43% 17.14% 4.29% 0.1588 0.006 25 Tokyo Stock Exchange 0.8011 0.5388 64.15% 29.15% 6.62% 0.08% 0.5187 0.000 26 New Zealand Exchange 0.1671 0.1139 12.12% 57.58% 30.30% 0.00% 0.1089 0.487 27 Singapore Exchange Ltd 0.1341 0.0813 15.24% 56.19% 23.81% 4.76% 0.1140 0.006

35
Table 2: Exchange-Level Commonality – Spread Results (Continued)
Average Coef.
Median Coef.
% Firms with >0 Coef.
Signif. 5% Level
% Firms with >0
Coef. Not Signif. 5%
Level
% Firms with <0
Coef. Not Signif. 5%
Level
% Firms with <0 Coef.
Signif. 5% Level
Median SUME Coef.
p-value (Median SUME Coef.)
Emerging – Asia 28 Shanghai Stock Exchange 0.7586 0.7273 82.61% 14.38% 3.01% 0.00% 0.6746 0.000 29 Shenzhen Stock Exchange 0.7472 0.6996 86.91% 11.20% 1.90% 0.00% 0.6492 0.000 30 Bombay Stock Exchange 0.5414 0.5608 80.67% 16.81% 2.52% 0.00% 0.8396 0.000 31 National Stock Ex. of India 0.6590 0.6679 91.89% 8.11% 0.00% 0.00% 0.7834 0.000 32 Jakarta Stock Exchange 0.2293 0.0571 18.75% 53.13% 21.88% 6.25% 0.0431 0.597 33 KOSDAQ Market Division 0.1620 0.1339 62.50% 31.25% 6.25% 0.00% 0.1551 0.021 34 Korea Exchange 0.4534 0.3993 63.57% 31.43% 5.00% 0.00% 0.3597 0.000 35 Bursa Malaysia 0.3290 0.1755 22.50% 55.63% 21.25% 0.63% 0.2371 0.000 36 Philippine Stock Exchange 0.2803 0.0121 11.11% 48.15% 37.04% 3.70% 0.0477 0.248 37 Taiwan Stock Exchange 0.9136 0.8789 84.78% 13.15% 1.73% 0.35% 0.8345 0.000 38 Stock Ex. of Thailand -0.0031 0.0150 7.50% 61.25% 30.00% 1.25% 0.0093 0.314
Emerging – Europe MEA 39 Budapest Stock Exchange 0.0455 0.0322 0.00% 69.23% 23.08% 7.69% 0.0648 0.581 40 Warsaw Stock Exchange 0.2055 0.1287 11.54% 73.08% 15.38% 0.00% 0.1365 0.076 41 Johannesburg Stock Ex. 0.0792 0.2116 9.59% 54.79% 34.25% 1.37% 0.2936 0.416 42 Istanbul Stock Exchange 0.4611 0.4747 83.05% 15.25% 1.69% 0.00% 0.7464 0.000
Emerging – Latin America 43 Buenos Aires Stock Ex. -0.1441 0.0077 5.26% 47.37% 36.84% 10.53% 0.0160 1.000 44 Sao Paulo Stock Exchange -0.0599 0.0670 6.98% 51.16% 39.53% 2.33% 0.0376 1.000 45 Santiago Stock Exchange -0.1196 -0.1123 2.44% 31.71% 63.41% 2.44% -0.1415 0.222 46 Mexican Stock Exchange 0.1013 0.0506 7.69% 61.54% 30.77% 0.00% 0.0213 0.337 47 Lima Stock Exchange 0.1774 0.0003 7.69% 46.15% 46.15% 0.00% 0.0940 0.581 Note: Firm-by-firm (9,427) time-series regressions of liquidity measures are estimated using:
∆LiquidityF,t = α + β1 ∆LiquidityE,t + β2 ∆LiquidityE,t+1 + β3 ∆LiquidityE,t-1 + δ1 ReturnE,t + δ2 ReturnE,t+1 + δ3 ReturnE,t-1 + δ4 ∆VolatilityF,t + εF,t
LiquidityF,t is the relative effective spread of firm F on day t. LiquidityE,t is the exchange-level liquidity index and ReturnE,t is the exchange-level return computed on day t using an equal-weighted average of the liquidity measure and return, respectively, for all firms trading on the same exchange, except firm F. VolatilityF,t is the return volatility for firm F on day t and is measured as the squared return for the day. The symbol ∆ preceding a variable name denotes a proportional change in the variable across successive trading days. We present the average and median coefficient estimate of the exchange-level liquidity beta β1, along with
36
the percent of firms for which β1 is positive and significant at the 5% confidence level (t-statistic > 1.645), positive and not significant at the 5% confidence level, negative and not significant at the 5% confidence level, and negative and significant at the 5% confidence level, respectively. We report in the last two columns the median of the sum of the concurrent, lead and lag coefficient estimates (SUME = β1 + β2 + β3) and the p-value of a sign test testing whether Median (SUME) = 0.
37
Table 3: Exchange-Level Commonality – Depth Results
Average Coef.
Median Coef.
% Firms with >0 Coef.
Signif. 5% Level
% Firms with >0
Coef. Not Signif. 5%
Level
% Firms with <0
Coef. Not Signif. 5%
Level
% Firms with <0 Coef.
Signif. 5% Level
Median SUME Coef.
p-value (Median SUME Coef.)
Europe 1 Vienna Stock Exchange 0.2112 0.2036 22.22% 59.26% 18.52% 0.00% 0.3353 0.019 2 Copenhagen Stock Ex. 0.0162 0.1236 16.67% 45.00% 35.00% 3.33% 0.0289 0.519 3 Helsinki Stock Exchange -0.0068 0.0007 4.84% 46.77% 48.39% 0.00% -0.0154 0.098 4 Euronext Paris 0.0269 0.0021 8.60% 44.34% 47.06% 0.00% -0.0156 0.031 5 Deutsche Boerse 0.2082 0.2059 21.19% 52.54% 26.27% 0.00% 0.1663 0.342 6 Frankfurt Stock Exchange 0.4283 0.0631 20.00% 46.67% 33.33% 0.00% 0.0205 0.000 7 Athens Stock Exchange -0.0066 -0.0028 4.44% 40.00% 55.56% 0.00% -0.0074 0.015 8 Irish Stock Exchange 0.1832 0.1800 12.00% 64.00% 24.00% 0.00% 0.2481 0.001 9 Borsa Italiana 0.3874 0.2955 25.21% 54.62% 20.17% 0.00% 0.2976 0.001
10 Oslo Stock Exchange 0.1832 0.2495 30.77% 48.08% 21.15% 0.00% 0.1893 0.000 11 Euronext Lisbon 0.3709 0.2937 37.04% 51.85% 11.11% 0.00% 0.1277 0.087 12 Spanish Cont. Market 3.5136 1.3870 72.00% 16.00% 12.00% 0.00% 1.5532 0.000 13 Stockholm Stock Exchange 0.2392 0.3424 43.97% 41.38% 12.93% 1.72% 0.4571 0.000 14 Swiss Exchange -0.0185 0.1017 5.77% 52.88% 39.42% 1.92% -0.0962 0.382 15 Virt-X 0.3195 0.3243 73.08% 23.08% 3.85% 0.00% 0.2450 0.003 16 London Stock Exchange N/A N/A N/A N/A N/A N/A N/A N/A
North America 17 Toronto Stock Exchange 0.8905 0.8420 54.31% 35.14% 9.90% 0.64% 1.0900 0.000 18 American Stock Exchange 0.0110 -0.0061 9.09% 36.36% 54.55% 0.00% -0.0386 0.590 19 NASDAQ 0.8254 0.7291 28.68% 53.58% 17.42% 0.33% 0.7468 0.000 20 New York Stock Exchange 0.7703 0.7951 47.43% 41.19% 11.10% 0.27% 0.8407 0.000
Pacific 21 Australian Stock Exchange 0.2654 0.1305 25.51% 49.49% 22.96% 2.04% 0.0291 0.023 22 Hong Kong Exchange 0.3208 0.3558 48.44% 37.78% 12.89% 0.89% 0.3799 0.000 23 JASDAQ 0.1310 0.0512 8.47% 57.63% 33.90% 0.00% 0.0872 0.067 24 Osaka Securities Exchange 0.0520 0.0359 10.14% 50.72% 39.13% 0.00% 0.1142 0.120 25 Tokyo Stock Exchange 0.5136 0.5047 39.95% 47.71% 12.01% 0.33% 0.5321 0.000 26 New Zealand Exchange N/A N/A N/A N/A N/A N/A N/A N/A 27 Singapore Exchange Ltd 0.3126 0.2785 40.95% 48.57% 10.48% 0.00% 0.3107 0.000
38
Table 3: Exchange-Level Commonality – Depth Results (Continued)
Average Coef.
Median Coef.
% Firms with >0 Coef.
Signif. 5% Level
% Firms with >0
Coef. Not Signif. 5%
Level
% Firms with <0
Coef. Not Signif. 5%
Level
% Firms with <0 Coef.
Signif. 5% Level
Median SUME Coef.
p-value (Median SUME Coef.)
Emerging – Asia 28 Shanghai Stock Exchange 0.7824 0.7322 67.89% 27.26% 4.85% 0.00% 0.8356 0.000 29 Shenzhen Stock Exchange 0.6710 0.6546 58.06% 37.00% 4.74% 0.19% 0.7436 0.000 30 Bombay Stock Exchange 0.4048 0.3514 22.88% 55.08% 21.19% 0.85% 0.4325 0.000 31 National Stock Ex. of India 0.5089 0.3833 31.82% 55.45% 11.82% 0.91% 0.4998 0.000 32 Jakarta Stock Exchange 0.3030 0.3302 48.28% 44.83% 3.45% 3.45% 0.2391 0.215 33 KOSDAQ Market Division 0.2610 0.3055 50.00% 31.25% 18.75% 0.00% 0.3990 0.021 34 Korea Exchange 0.1680 0.1747 30.71% 51.43% 17.86% 0.00% 0.1204 0.001 35 Bursa Malaysia 1.4947 1.0664 97.50% 1.87% 0.63% 0.00% 1.0759 0.000 36 Philippine Stock Exchange 0.2937 0.3128 37.04% 48.15% 14.81% 0.00% 0.3401 0.000 37 Taiwan Stock Exchange 0.5963 0.5566 71.63% 25.26% 3.11% 0.00% 0.5997 0.000 38 Stock Ex. of Thailand 0.7348 0.7574 72.50% 21.25% 6.25% 0.00% 0.8965 0.000
Emerging – Europe MEA 39 Budapest Stock Exchange 0.1861 0.2313 46.15% 23.08% 30.77% 0.00% 0.4057 0.267 40 Warsaw Stock Exchange 0.2139 0.2790 42.31% 38.46% 15.38% 3.85% 0.1974 0.169 41 Johannesburg Stock Ex. 1.0312 0.8344 35.82% 43.28% 19.40% 1.49% 1.2190 0.047 42 Istanbul Stock Exchange 0.8078 0.8865 88.14% 8.47% 3.39% 0.00% 0.8645 0.000
Emerging – Latin America 43 Buenos Aires Stock Ex. 0.3334 0.3094 47.37% 52.63% 0.00% 0.00% 0.5166 0.001 44 Sao Paulo Stock Exchange 0.3434 -0.0212 6.67% 35.56% 57.78% 0.00% 0.0025 0.766 45 Santiago Stock Exchange -0.0468 0.1577 17.07% 41.46% 39.02% 2.44% 0.0800 0.761 46 Mexican Stock Exchange -0.0297 -0.0054 5.13% 33.33% 61.54% 0.00% -0.0149 0.108 47 Lima Stock Exchange -0.0016 -0.0017 7.69% 30.77% 61.54% 0.00% 0.0004 1.000 Note: Firm-by-firm (9,427) time-series regressions of liquidity measures are estimated using:
∆LiquidityF,t = α + β1 ∆LiquidityE,t + β2 ∆LiquidityE,t+1 + β3 ∆LiquidityE,t-1 + δ1 ReturnE,t + δ2 ReturnE,t+1 + δ3 ReturnE,t-1 + δ4 ∆VolatilityF,t + εF,t
LiquidityF,t is the total depth in value of firm F on day t. LiquidityE,t is the exchange-level liquidity index and ReturnE,t is the exchange-level return computed on day t using an equal-weighted average of the liquidity measure and return, respectively, for all firms trading on the same exchange, except firm F. VolatilityF,t is the return volatility for firm F on day t and is measured as the squared return for the day. The symbol ∆ preceding a variable name denotes a proportional change in the variable across successive trading days. We present the average and median coefficient estimate of the exchange-level liquidity beta β1, along with the
39
percent of firms for which β1 is positive and significant at the 5% confidence level (t-statistic > 1.645), positive and not significant at the 5% confidence level, negative and not significant at the 5% confidence level, and negative and significant at the 5% confidence level, respectively. We report in the last two columns the median of the sum of the concurrent, lead and lag coefficient estimates (SUME = β1 + β2 + β3) and the p-value of a sign test testing whether Median (SUME) = 0.
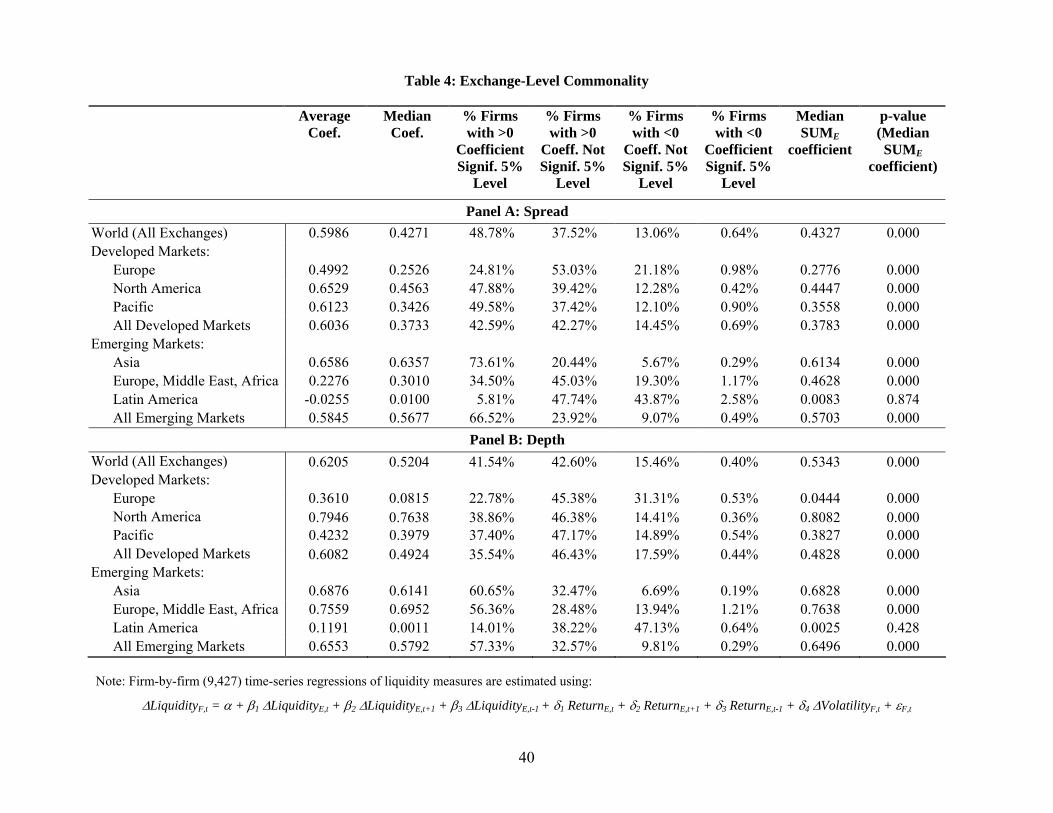
40
Table 4: Exchange-Level Commonality
Average Coef.
Median Coef.
% Firms with >0
Coefficient Signif. 5%
Level
% Firms with >0
Coeff. Not Signif. 5%
Level
% Firms with <0
Coeff. Not Signif. 5%
Level
% Firms with <0
Coefficient Signif. 5%
Level
Median SUME
coefficient
p-value (Median SUME
coefficient)
Panel A: Spread World (All Exchanges) 0.5986 0.4271 48.78% 37.52% 13.06% 0.64% 0.4327 0.000 Developed Markets: Europe 0.4992 0.2526 24.81% 53.03% 21.18% 0.98% 0.2776 0.000 North America 0.6529 0.4563 47.88% 39.42% 12.28% 0.42% 0.4447 0.000 Pacific 0.6123 0.3426 49.58% 37.42% 12.10% 0.90% 0.3558 0.000 All Developed Markets 0.6036 0.3733 42.59% 42.27% 14.45% 0.69% 0.3783 0.000 Emerging Markets: Asia 0.6586 0.6357 73.61% 20.44% 5.67% 0.29% 0.6134 0.000 Europe, Middle East, Africa 0.2276 0.3010 34.50% 45.03% 19.30% 1.17% 0.4628 0.000 Latin America -0.0255 0.0100 5.81% 47.74% 43.87% 2.58% 0.0083 0.874 All Emerging Markets 0.5845 0.5677 66.52% 23.92% 9.07% 0.49% 0.5703 0.000
Panel B: Depth World (All Exchanges) 0.6205 0.5204 41.54% 42.60% 15.46% 0.40% 0.5343 0.000 Developed Markets: Europe 0.3610 0.0815 22.78% 45.38% 31.31% 0.53% 0.0444 0.000 North America 0.7946 0.7638 38.86% 46.38% 14.41% 0.36% 0.8082 0.000 Pacific 0.4232 0.3979 37.40% 47.17% 14.89% 0.54% 0.3827 0.000 All Developed Markets 0.6082 0.4924 35.54% 46.43% 17.59% 0.44% 0.4828 0.000 Emerging Markets: Asia 0.6876 0.6141 60.65% 32.47% 6.69% 0.19% 0.6828 0.000 Europe, Middle East, Africa 0.7559 0.6952 56.36% 28.48% 13.94% 1.21% 0.7638 0.000 Latin America 0.1191 0.0011 14.01% 38.22% 47.13% 0.64% 0.0025 0.428 All Emerging Markets 0.6553 0.5792 57.33% 32.57% 9.81% 0.29% 0.6496 0.000 Note: Firm-by-firm (9,427) time-series regressions of liquidity measures are estimated using:
∆LiquidityF,t = α + β1 ∆LiquidityE,t + β2 ∆LiquidityE,t+1 + β3 ∆LiquidityE,t-1 + δ1 ReturnE,t + δ2 ReturnE,t+1 + δ3 ReturnE,t-1 + δ4 ∆VolatilityF,t + εF,t
41
LiquidityF,t is the relative effective spread (Panel A) and the total depth in value (Panel B) of firm F on day t. LiquidityE,t is the exchange-level liquidity index and ReturnE,t is the exchange-level return computed on day t using an equal-weighted average of each corresponding liquidity measure and return, respectively, for all firms trading on the same exchange, except firm F. VolatilityF,t is the return volatility for firm F on day t and is measured as the squared return for the day. The symbol ∆ preceding a variable name denotes a proportional change in the variable across successive trading days. We present the average and median coefficient estimate of the exchange-level liquidity beta β1, along with the percent of firms for which β1 is positive and significant at the 5% confidence level (t-statistic > 1.645), positive and not significant at the 5% confidence level, negative and not significant at the 5% confidence level, and negative and significant at the 5% confidence level, respectively. We report in the last two columns the median of the sum of the concurrent, lead and lag coefficient estimates (SUME = β1 + β2 + β3) and the p-value of a sign test testing whether Median (SUME) = 0.
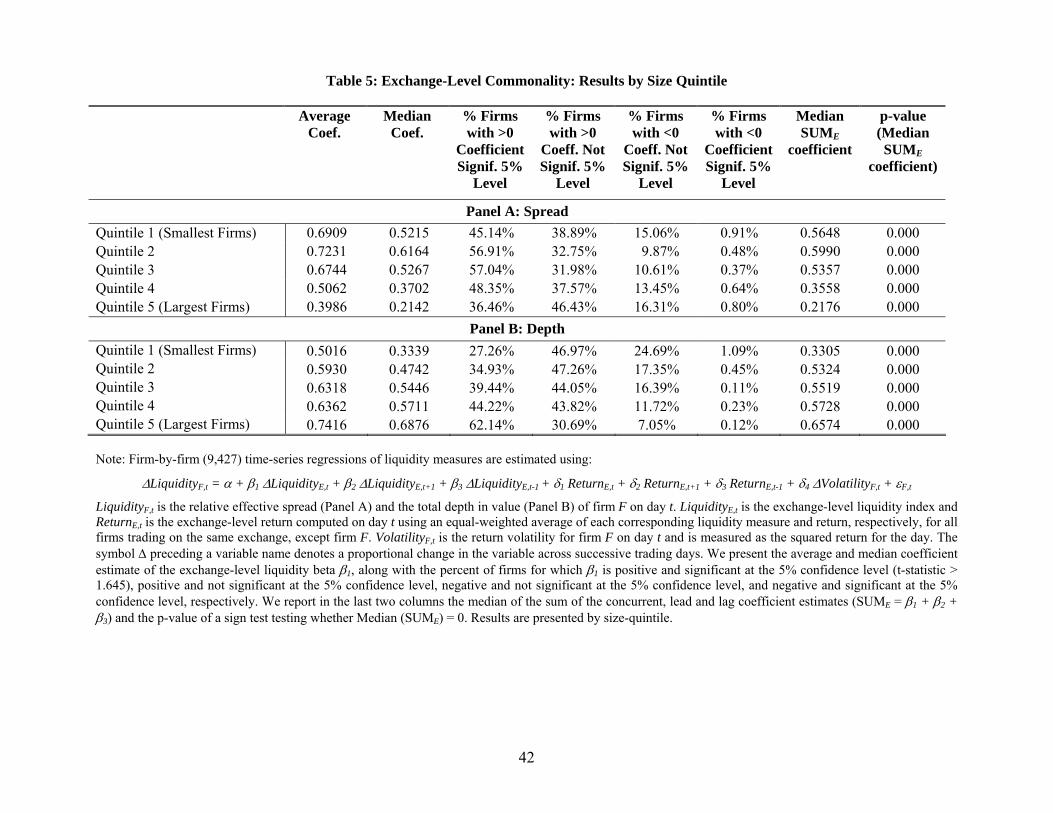
42
Table 5: Exchange-Level Commonality: Results by Size Quintile
Average Coef.
Median Coef.
% Firms with >0
Coefficient Signif. 5%
Level
% Firms with >0
Coeff. Not Signif. 5%
Level
% Firms with <0
Coeff. Not Signif. 5%
Level
% Firms with <0
Coefficient Signif. 5%
Level
Median SUME
coefficient
p-value (Median SUME
coefficient)
Panel A: Spread Quintile 1 (Smallest Firms) 0.6909 0.5215 45.14% 38.89% 15.06% 0.91% 0.5648 0.000 Quintile 2 0.7231 0.6164 56.91% 32.75% 9.87% 0.48% 0.5990 0.000 Quintile 3 0.6744 0.5267 57.04% 31.98% 10.61% 0.37% 0.5357 0.000 Quintile 4 0.5062 0.3702 48.35% 37.57% 13.45% 0.64% 0.3558 0.000 Quintile 5 (Largest Firms) 0.3986 0.2142 36.46% 46.43% 16.31% 0.80% 0.2176 0.000
Panel B: Depth Quintile 1 (Smallest Firms) 0.5016 0.3339 27.26% 46.97% 24.69% 1.09% 0.3305 0.000 Quintile 2 0.5930 0.4742 34.93% 47.26% 17.35% 0.45% 0.5324 0.000 Quintile 3 0.6318 0.5446 39.44% 44.05% 16.39% 0.11% 0.5519 0.000 Quintile 4 0.6362 0.5711 44.22% 43.82% 11.72% 0.23% 0.5728 0.000 Quintile 5 (Largest Firms) 0.7416 0.6876 62.14% 30.69% 7.05% 0.12% 0.6574 0.000 Note: Firm-by-firm (9,427) time-series regressions of liquidity measures are estimated using:
∆LiquidityF,t = α + β1 ∆LiquidityE,t + β2 ∆LiquidityE,t+1 + β3 ∆LiquidityE,t-1 + δ1 ReturnE,t + δ2 ReturnE,t+1 + δ3 ReturnE,t-1 + δ4 ∆VolatilityF,t + εF,t
LiquidityF,t is the relative effective spread (Panel A) and the total depth in value (Panel B) of firm F on day t. LiquidityE,t is the exchange-level liquidity index and ReturnE,t is the exchange-level return computed on day t using an equal-weighted average of each corresponding liquidity measure and return, respectively, for all firms trading on the same exchange, except firm F. VolatilityF,t is the return volatility for firm F on day t and is measured as the squared return for the day. The symbol ∆ preceding a variable name denotes a proportional change in the variable across successive trading days. We present the average and median coefficient estimate of the exchange-level liquidity beta β1, along with the percent of firms for which β1 is positive and significant at the 5% confidence level (t-statistic > 1.645), positive and not significant at the 5% confidence level, negative and not significant at the 5% confidence level, and negative and significant at the 5% confidence level, respectively. We report in the last two columns the median of the sum of the concurrent, lead and lag coefficient estimates (SUME = β1 + β2 + β3) and the p-value of a sign test testing whether Median (SUME) = 0. Results are presented by size-quintile.
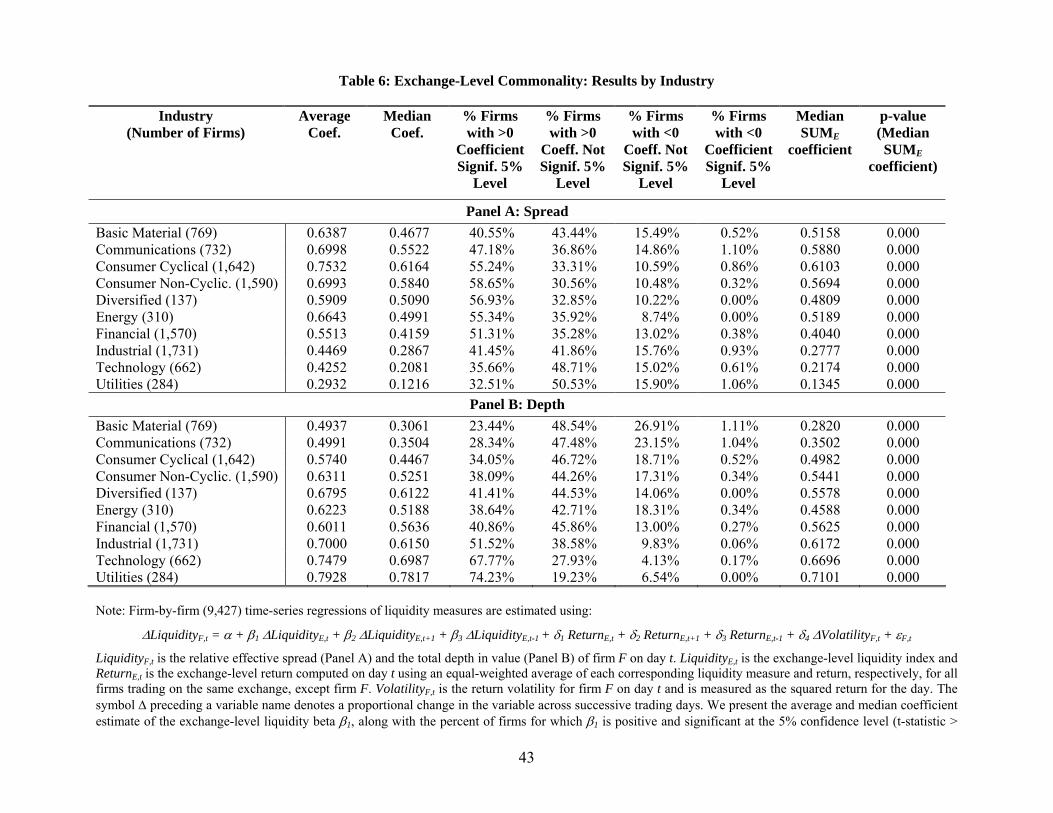
43
Table 6: Exchange-Level Commonality: Results by Industry
Industry (Number of Firms)
Average Coef.
Median Coef.
% Firms with >0
Coefficient Signif. 5%
Level
% Firms with >0
Coeff. Not Signif. 5%
Level
% Firms with <0
Coeff. Not Signif. 5%
Level
% Firms with <0
Coefficient Signif. 5%
Level
Median SUME
coefficient
p-value (Median SUME
coefficient)
Panel A: Spread Basic Material (769) 0.6387 0.4677 40.55% 43.44% 15.49% 0.52% 0.5158 0.000 Communications (732) 0.6998 0.5522 47.18% 36.86% 14.86% 1.10% 0.5880 0.000 Consumer Cyclical (1,642) 0.7532 0.6164 55.24% 33.31% 10.59% 0.86% 0.6103 0.000 Consumer Non-Cyclic. (1,590) 0.6993 0.5840 58.65% 30.56% 10.48% 0.32% 0.5694 0.000 Diversified (137) 0.5909 0.5090 56.93% 32.85% 10.22% 0.00% 0.4809 0.000 Energy (310) 0.6643 0.4991 55.34% 35.92% 8.74% 0.00% 0.5189 0.000 Financial (1,570) 0.5513 0.4159 51.31% 35.28% 13.02% 0.38% 0.4040 0.000 Industrial (1,731) 0.4469 0.2867 41.45% 41.86% 15.76% 0.93% 0.2777 0.000 Technology (662) 0.4252 0.2081 35.66% 48.71% 15.02% 0.61% 0.2174 0.000 Utilities (284) 0.2932 0.1216 32.51% 50.53% 15.90% 1.06% 0.1345 0.000
Panel B: Depth Basic Material (769) 0.4937 0.3061 23.44% 48.54% 26.91% 1.11% 0.2820 0.000 Communications (732) 0.4991 0.3504 28.34% 47.48% 23.15% 1.04% 0.3502 0.000 Consumer Cyclical (1,642) 0.5740 0.4467 34.05% 46.72% 18.71% 0.52% 0.4982 0.000 Consumer Non-Cyclic. (1,590) 0.6311 0.5251 38.09% 44.26% 17.31% 0.34% 0.5441 0.000 Diversified (137) 0.6795 0.6122 41.41% 44.53% 14.06% 0.00% 0.5578 0.000 Energy (310) 0.6223 0.5188 38.64% 42.71% 18.31% 0.34% 0.4588 0.000 Financial (1,570) 0.6011 0.5636 40.86% 45.86% 13.00% 0.27% 0.5625 0.000 Industrial (1,731) 0.7000 0.6150 51.52% 38.58% 9.83% 0.06% 0.6172 0.000 Technology (662) 0.7479 0.6987 67.77% 27.93% 4.13% 0.17% 0.6696 0.000 Utilities (284) 0.7928 0.7817 74.23% 19.23% 6.54% 0.00% 0.7101 0.000 Note: Firm-by-firm (9,427) time-series regressions of liquidity measures are estimated using:
∆LiquidityF,t = α + β1 ∆LiquidityE,t + β2 ∆LiquidityE,t+1 + β3 ∆LiquidityE,t-1 + δ1 ReturnE,t + δ2 ReturnE,t+1 + δ3 ReturnE,t-1 + δ4 ∆VolatilityF,t + εF,t
LiquidityF,t is the relative effective spread (Panel A) and the total depth in value (Panel B) of firm F on day t. LiquidityE,t is the exchange-level liquidity index and ReturnE,t is the exchange-level return computed on day t using an equal-weighted average of each corresponding liquidity measure and return, respectively, for all firms trading on the same exchange, except firm F. VolatilityF,t is the return volatility for firm F on day t and is measured as the squared return for the day. The symbol ∆ preceding a variable name denotes a proportional change in the variable across successive trading days. We present the average and median coefficient estimate of the exchange-level liquidity beta β1, along with the percent of firms for which β1 is positive and significant at the 5% confidence level (t-statistic >
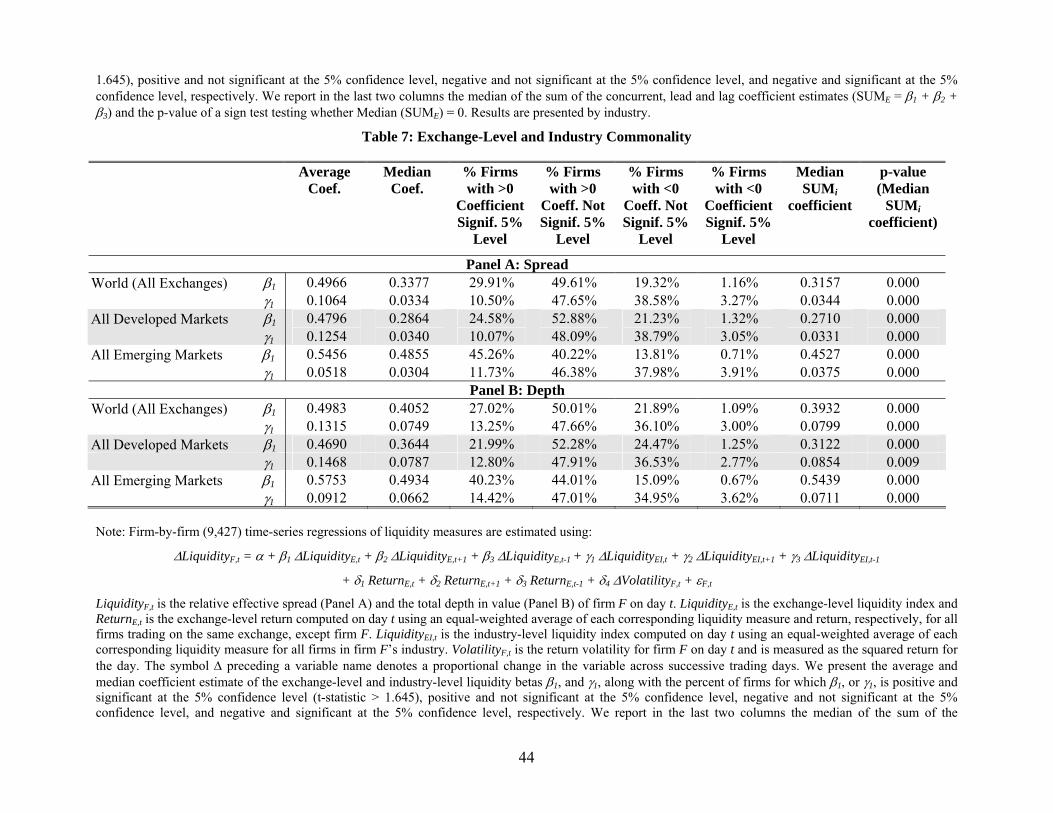
44
1.645), positive and not significant at the 5% confidence level, negative and not significant at the 5% confidence level, and negative and significant at the 5% confidence level, respectively. We report in the last two columns the median of the sum of the concurrent, lead and lag coefficient estimates (SUME = β1 + β2 + β3) and the p-value of a sign test testing whether Median (SUME) = 0. Results are presented by industry.
Table 7: Exchange-Level and Industry Commonality
Average Coef.
Median Coef.
% Firms with >0
Coefficient Signif. 5%
Level
% Firms with >0
Coeff. Not Signif. 5%
Level
% Firms with <0
Coeff. Not Signif. 5%
Level
% Firms with <0
Coefficient Signif. 5%
Level
Median SUMi
coefficient
p-value (Median
SUMi coefficient)
Panel A: Spread World (All Exchanges) β1 0.4966 0.3377 29.91% 49.61% 19.32% 1.16% 0.3157 0.000 γ1 0.1064 0.0334 10.50% 47.65% 38.58% 3.27% 0.0344 0.000
All Developed Markets β1 0.4796 0.2864 24.58% 52.88% 21.23% 1.32% 0.2710 0.000 γ1 0.1254 0.0340 10.07% 48.09% 38.79% 3.05% 0.0331 0.000
All Emerging Markets β1 0.5456 0.4855 45.26% 40.22% 13.81% 0.71% 0.4527 0.000 γ1 0.0518 0.0304 11.73% 46.38% 37.98% 3.91% 0.0375 0.000
Panel B: Depth World (All Exchanges) β1 0.4983 0.4052 27.02% 50.01% 21.89% 1.09% 0.3932 0.000 γ1 0.1315 0.0749 13.25% 47.66% 36.10% 3.00% 0.0799 0.000
All Developed Markets β1 0.4690 0.3644 21.99% 52.28% 24.47% 1.25% 0.3122 0.000 γ1 0.1468 0.0787 12.80% 47.91% 36.53% 2.77% 0.0854 0.009
All Emerging Markets β1 0.5753 0.4934 40.23% 44.01% 15.09% 0.67% 0.5439 0.000 γ1 0.0912 0.0662 14.42% 47.01% 34.95% 3.62% 0.0711 0.000 Note: Firm-by-firm (9,427) time-series regressions of liquidity measures are estimated using:
∆LiquidityF,t = α + β1 ∆LiquidityE,t + β2 ∆LiquidityE,t+1 + β3 ∆LiquidityE,t-1 + γ1 ∆LiquidityEI,t + γ2 ∆LiquidityEI,t+1 + γ3 ∆LiquidityEI,t-1
+ δ1 ReturnE,t + δ2 ReturnE,t+1 + δ3 ReturnE,t-1 + δ4 ∆VolatilityF,t + εF,t
LiquidityF,t is the relative effective spread (Panel A) and the total depth in value (Panel B) of firm F on day t. LiquidityE,t is the exchange-level liquidity index and ReturnE,t is the exchange-level return computed on day t using an equal-weighted average of each corresponding liquidity measure and return, respectively, for all firms trading on the same exchange, except firm F. LiquidityEI,t is the industry-level liquidity index computed on day t using an equal-weighted average of each corresponding liquidity measure for all firms in firm F’s industry. VolatilityF,t is the return volatility for firm F on day t and is measured as the squared return for the day. The symbol ∆ preceding a variable name denotes a proportional change in the variable across successive trading days. We present the average and median coefficient estimate of the exchange-level and industry-level liquidity betas β1, and γ1, along with the percent of firms for which β1, or γ1, is positive and significant at the 5% confidence level (t-statistic > 1.645), positive and not significant at the 5% confidence level, negative and not significant at the 5% confidence level, and negative and significant at the 5% confidence level, respectively. We report in the last two columns the median of the sum of the
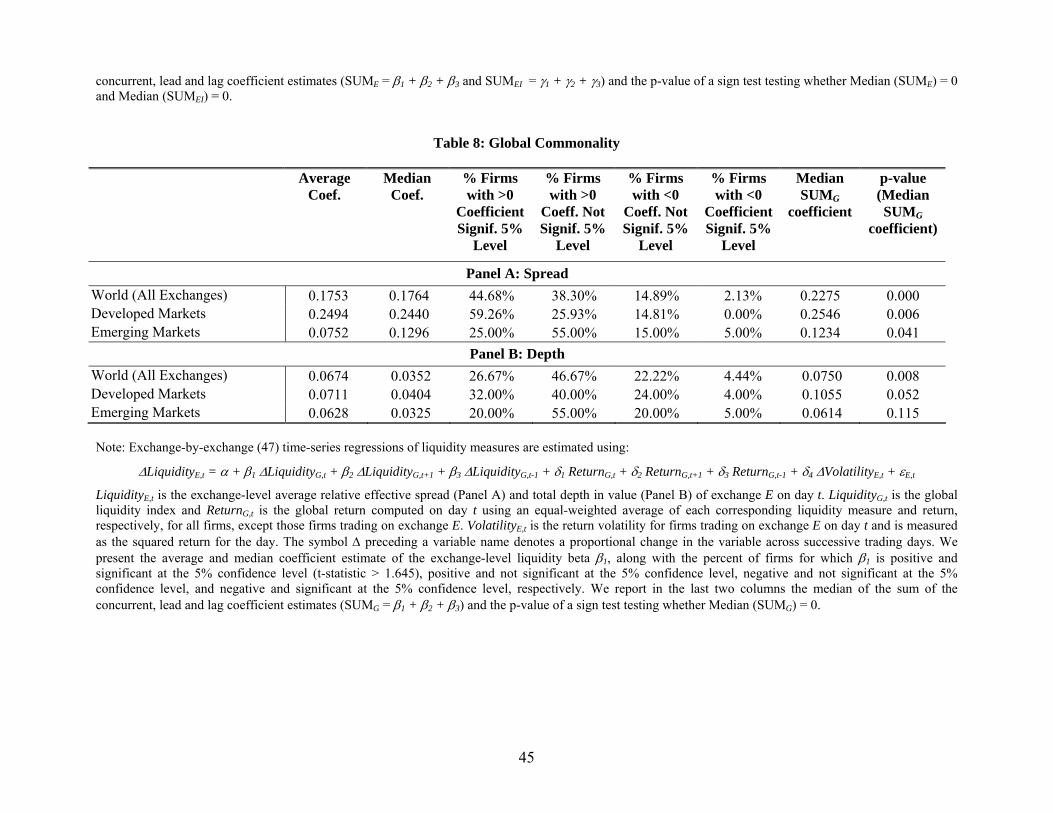
45
concurrent, lead and lag coefficient estimates (SUME = β1 + β2 + β3 and SUMEI = γ1 + γ2 + γ3) and the p-value of a sign test testing whether Median (SUME) = 0 and Median (SUMEI) = 0.
Table 8: Global Commonality
Average Coef.
Median Coef.
% Firms with >0
Coefficient Signif. 5%
Level
% Firms with >0
Coeff. Not Signif. 5%
Level
% Firms with <0
Coeff. Not Signif. 5%
Level
% Firms with <0
Coefficient Signif. 5%
Level
Median SUMG
coefficient
p-value (Median SUMG
coefficient)
Panel A: Spread World (All Exchanges) 0.1753 0.1764 44.68% 38.30% 14.89% 2.13% 0.2275 0.000 Developed Markets 0.2494 0.2440 59.26% 25.93% 14.81% 0.00% 0.2546 0.006 Emerging Markets 0.0752 0.1296 25.00% 55.00% 15.00% 5.00% 0.1234 0.041
Panel B: Depth World (All Exchanges) 0.0674 0.0352 26.67% 46.67% 22.22% 4.44% 0.0750 0.008 Developed Markets 0.0711 0.0404 32.00% 40.00% 24.00% 4.00% 0.1055 0.052 Emerging Markets 0.0628 0.0325 20.00% 55.00% 20.00% 5.00% 0.0614 0.115 Note: Exchange-by-exchange (47) time-series regressions of liquidity measures are estimated using:
∆LiquidityE,t = α + β1 ∆LiquidityG,t + β2 ∆LiquidityG,t+1 + β3 ∆LiquidityG,t-1 + δ1 ReturnG,t + δ2 ReturnG,t+1 + δ3 ReturnG,t-1 + δ4 ∆VolatilityE,t + εE,t
LiquidityE,t is the exchange-level average relative effective spread (Panel A) and total depth in value (Panel B) of exchange E on day t. LiquidityG,t is the global liquidity index and ReturnG,t is the global return computed on day t using an equal-weighted average of each corresponding liquidity measure and return, respectively, for all firms, except those firms trading on exchange E. VolatilityE,t is the return volatility for firms trading on exchange E on day t and is measured as the squared return for the day. The symbol ∆ preceding a variable name denotes a proportional change in the variable across successive trading days. We present the average and median coefficient estimate of the exchange-level liquidity beta β1, along with the percent of firms for which β1 is positive and significant at the 5% confidence level (t-statistic > 1.645), positive and not significant at the 5% confidence level, negative and not significant at the 5% confidence level, and negative and significant at the 5% confidence level, respectively. We report in the last two columns the median of the sum of the concurrent, lead and lag coefficient estimates (SUMG = β1 + β2 + β3) and the p-value of a sign test testing whether Median (SUMG) = 0.
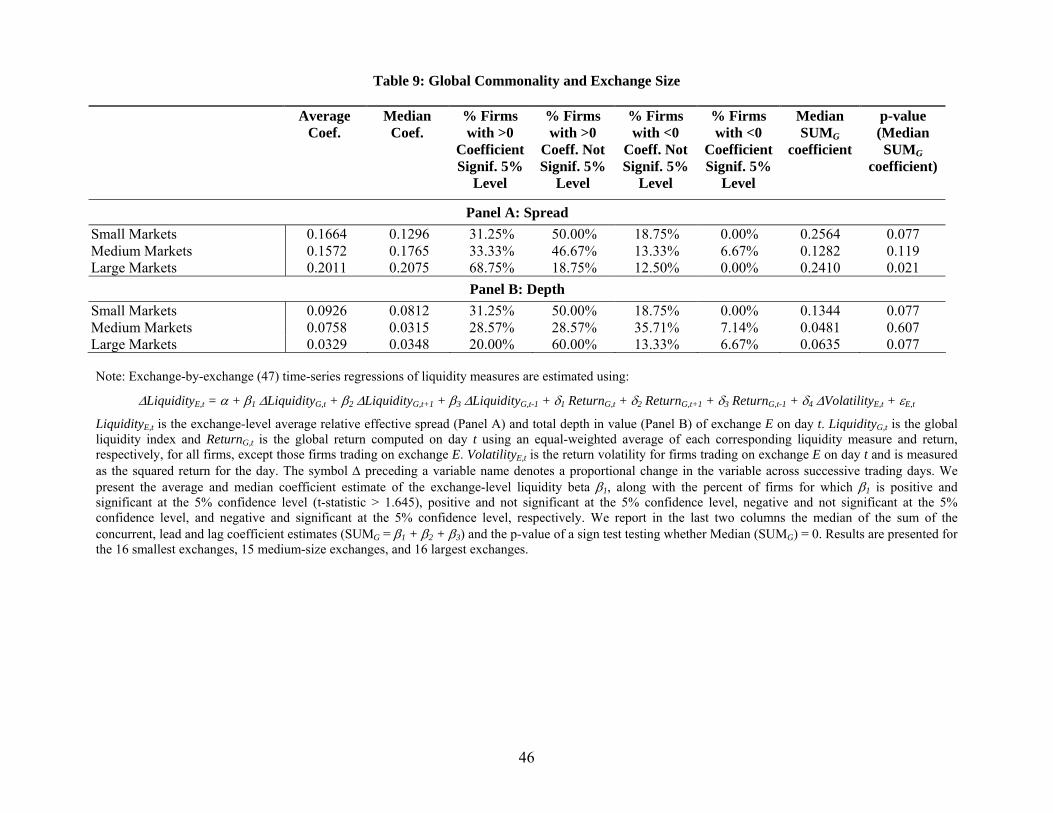
46
Table 9: Global Commonality and Exchange Size
Average Coef.
Median Coef.
% Firms with >0
Coefficient Signif. 5%
Level
% Firms with >0
Coeff. Not Signif. 5%
Level
% Firms with <0
Coeff. Not Signif. 5%
Level
% Firms with <0
Coefficient Signif. 5%
Level
Median SUMG
coefficient
p-value (Median SUMG
coefficient)
Panel A: Spread Small Markets 0.1664 0.1296 31.25% 50.00% 18.75% 0.00% 0.2564 0.077 Medium Markets 0.1572 0.1765 33.33% 46.67% 13.33% 6.67% 0.1282 0.119 Large Markets 0.2011 0.2075 68.75% 18.75% 12.50% 0.00% 0.2410 0.021
Panel B: Depth Small Markets 0.0926 0.0812 31.25% 50.00% 18.75% 0.00% 0.1344 0.077 Medium Markets 0.0758 0.0315 28.57% 28.57% 35.71% 7.14% 0.0481 0.607 Large Markets 0.0329 0.0348 20.00% 60.00% 13.33% 6.67% 0.0635 0.077 Note: Exchange-by-exchange (47) time-series regressions of liquidity measures are estimated using:
∆LiquidityE,t = α + β1 ∆LiquidityG,t + β2 ∆LiquidityG,t+1 + β3 ∆LiquidityG,t-1 + δ1 ReturnG,t + δ2 ReturnG,t+1 + δ3 ReturnG,t-1 + δ4 ∆VolatilityE,t + εE,t
LiquidityE,t is the exchange-level average relative effective spread (Panel A) and total depth in value (Panel B) of exchange E on day t. LiquidityG,t is the global liquidity index and ReturnG,t is the global return computed on day t using an equal-weighted average of each corresponding liquidity measure and return, respectively, for all firms, except those firms trading on exchange E. VolatilityE,t is the return volatility for firms trading on exchange E on day t and is measured as the squared return for the day. The symbol ∆ preceding a variable name denotes a proportional change in the variable across successive trading days. We present the average and median coefficient estimate of the exchange-level liquidity beta β1, along with the percent of firms for which β1 is positive and significant at the 5% confidence level (t-statistic > 1.645), positive and not significant at the 5% confidence level, negative and not significant at the 5% confidence level, and negative and significant at the 5% confidence level, respectively. We report in the last two columns the median of the sum of the concurrent, lead and lag coefficient estimates (SUMG = β1 + β2 + β3) and the p-value of a sign test testing whether Median (SUMG) = 0. Results are presented for the 16 smallest exchanges, 15 medium-size exchanges, and 16 largest exchanges.
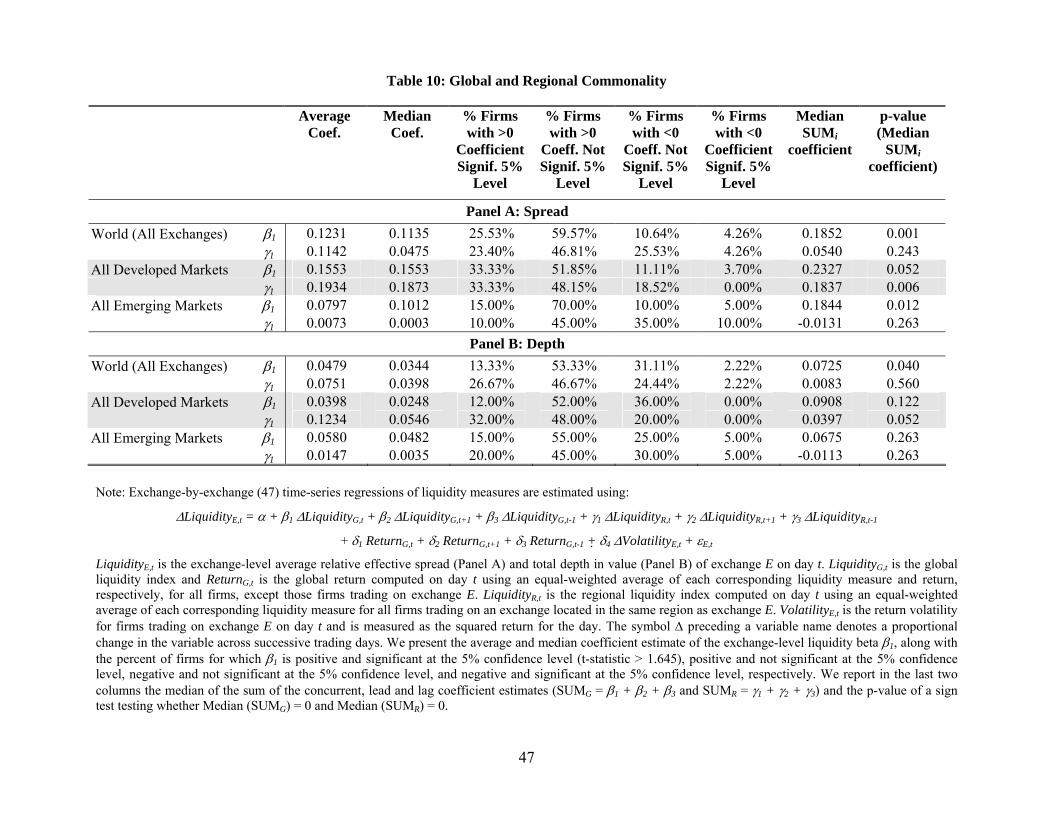
47
Table 10: Global and Regional Commonality
Average Coef.
Median Coef.
% Firms with >0
Coefficient Signif. 5%
Level
% Firms with >0
Coeff. Not Signif. 5%
Level
% Firms with <0
Coeff. Not Signif. 5%
Level
% Firms with <0
Coefficient Signif. 5%
Level
Median SUMi
coefficient
p-value (Median
SUMi coefficient)
Panel A: Spread World (All Exchanges) β1 0.1231 0.1135 25.53% 59.57% 10.64% 4.26% 0.1852 0.001 γ1 0.1142 0.0475 23.40% 46.81% 25.53% 4.26% 0.0540 0.243
All Developed Markets β1 0.1553 0.1553 33.33% 51.85% 11.11% 3.70% 0.2327 0.052 γ1 0.1934 0.1873 33.33% 48.15% 18.52% 0.00% 0.1837 0.006
All Emerging Markets β1 0.0797 0.1012 15.00% 70.00% 10.00% 5.00% 0.1844 0.012 γ1 0.0073 0.0003 10.00% 45.00% 35.00% 10.00% -0.0131 0.263
Panel B: Depth World (All Exchanges) β1 0.0479 0.0344 13.33% 53.33% 31.11% 2.22% 0.0725 0.040 γ1 0.0751 0.0398 26.67% 46.67% 24.44% 2.22% 0.0083 0.560
All Developed Markets β1 0.0398 0.0248 12.00% 52.00% 36.00% 0.00% 0.0908 0.122 γ1 0.1234 0.0546 32.00% 48.00% 20.00% 0.00% 0.0397 0.052
All Emerging Markets β1 0.0580 0.0482 15.00% 55.00% 25.00% 5.00% 0.0675 0.263 γ1 0.0147 0.0035 20.00% 45.00% 30.00% 5.00% -0.0113 0.263 Note: Exchange-by-exchange (47) time-series regressions of liquidity measures are estimated using:
∆LiquidityE,t = α + β1 ∆LiquidityG,t + β2 ∆LiquidityG,t+1 + β3 ∆LiquidityG,t-1 + γ1 ∆LiquidityR,t + γ2 ∆LiquidityR,t+1 + γ3 ∆LiquidityR,t-1
+ δ1 ReturnG,t + δ2 ReturnG,t+1 + δ3 ReturnG,t-1 + δ4 ∆VolatilityE,t + εE,t
LiquidityE,t is the exchange-level average relative effective spread (Panel A) and total depth in value (Panel B) of exchange E on day t. LiquidityG,t is the global liquidity index and ReturnG,t is the global return computed on day t using an equal-weighted average of each corresponding liquidity measure and return, respectively, for all firms, except those firms trading on exchange E. LiquidityR,t is the regional liquidity index computed on day t using an equal-weighted average of each corresponding liquidity measure for all firms trading on an exchange located in the same region as exchange E. VolatilityE,t is the return volatility for firms trading on exchange E on day t and is measured as the squared return for the day. The symbol ∆ preceding a variable name denotes a proportional change in the variable across successive trading days. We present the average and median coefficient estimate of the exchange-level liquidity beta β1, along with the percent of firms for which β1 is positive and significant at the 5% confidence level (t-statistic > 1.645), positive and not significant at the 5% confidence level, negative and not significant at the 5% confidence level, and negative and significant at the 5% confidence level, respectively. We report in the last two columns the median of the sum of the concurrent, lead and lag coefficient estimates (SUMG = β1 + β2 + β3 and SUMR = γ1 + γ2 + γ3) and the p-value of a sign test testing whether Median (SUMG) = 0 and Median (SUMR) = 0.
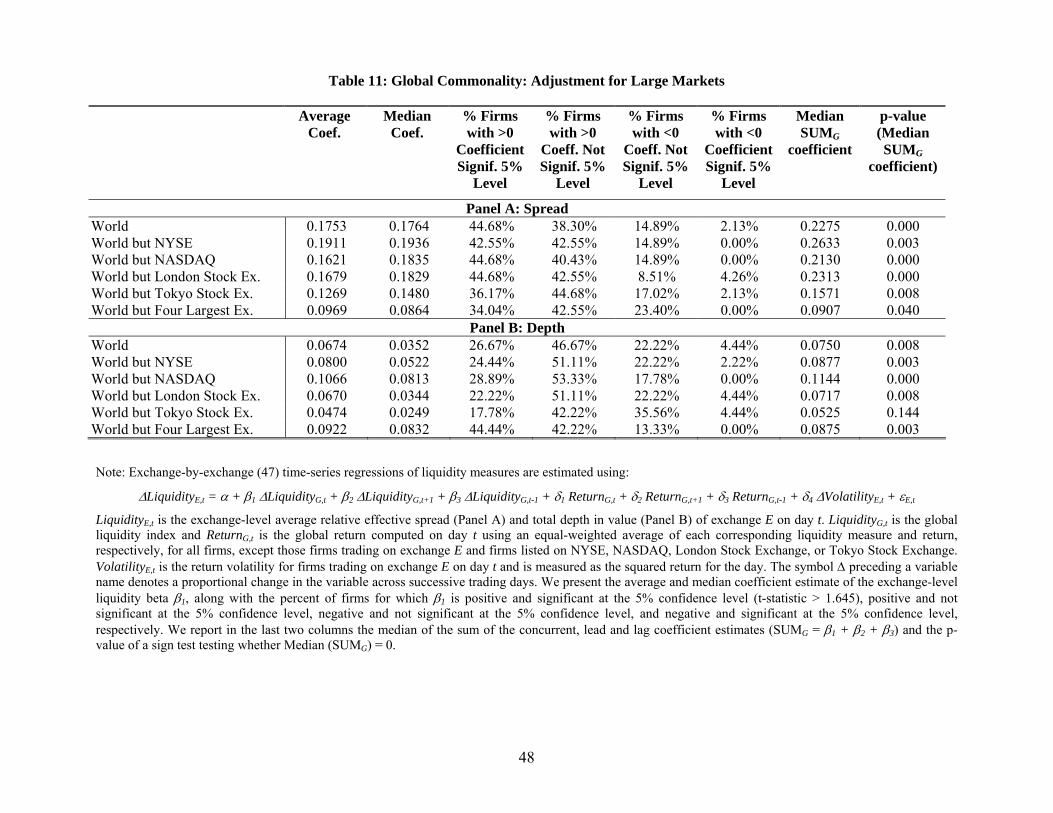
48
Table 11: Global Commonality: Adjustment for Large Markets
Average Coef.
Median Coef.
% Firms with >0
Coefficient Signif. 5%
Level
% Firms with >0
Coeff. Not Signif. 5%
Level
% Firms with <0
Coeff. Not Signif. 5%
Level
% Firms with <0
Coefficient Signif. 5%
Level
Median SUMG
coefficient
p-value (Median SUMG
coefficient)
Panel A: Spread World 0.1753 0.1764 44.68% 38.30% 14.89% 2.13% 0.2275 0.000 World but NYSE 0.1911 0.1936 42.55% 42.55% 14.89% 0.00% 0.2633 0.003 World but NASDAQ 0.1621 0.1835 44.68% 40.43% 14.89% 0.00% 0.2130 0.000 World but London Stock Ex. 0.1679 0.1829 44.68% 42.55% 8.51% 4.26% 0.2313 0.000 World but Tokyo Stock Ex. 0.1269 0.1480 36.17% 44.68% 17.02% 2.13% 0.1571 0.008 World but Four Largest Ex. 0.0969 0.0864 34.04% 42.55% 23.40% 0.00% 0.0907 0.040
Panel B: Depth World 0.0674 0.0352 26.67% 46.67% 22.22% 4.44% 0.0750 0.008 World but NYSE 0.0800 0.0522 24.44% 51.11% 22.22% 2.22% 0.0877 0.003 World but NASDAQ 0.1066 0.0813 28.89% 53.33% 17.78% 0.00% 0.1144 0.000 World but London Stock Ex. 0.0670 0.0344 22.22% 51.11% 22.22% 4.44% 0.0717 0.008 World but Tokyo Stock Ex. 0.0474 0.0249 17.78% 42.22% 35.56% 4.44% 0.0525 0.144 World but Four Largest Ex. 0.0922 0.0832 44.44% 42.22% 13.33% 0.00% 0.0875 0.003 Note: Exchange-by-exchange (47) time-series regressions of liquidity measures are estimated using:
∆LiquidityE,t = α + β1 ∆LiquidityG,t + β2 ∆LiquidityG,t+1 + β3 ∆LiquidityG,t-1 + δ1 ReturnG,t + δ2 ReturnG,t+1 + δ3 ReturnG,t-1 + δ4 ∆VolatilityE,t + εE,t
LiquidityE,t is the exchange-level average relative effective spread (Panel A) and total depth in value (Panel B) of exchange E on day t. LiquidityG,t is the global liquidity index and ReturnG,t is the global return computed on day t using an equal-weighted average of each corresponding liquidity measure and return, respectively, for all firms, except those firms trading on exchange E and firms listed on NYSE, NASDAQ, London Stock Exchange, or Tokyo Stock Exchange. VolatilityE,t is the return volatility for firms trading on exchange E on day t and is measured as the squared return for the day. The symbol ∆ preceding a variable name denotes a proportional change in the variable across successive trading days. We present the average and median coefficient estimate of the exchange-level liquidity beta β1, along with the percent of firms for which β1 is positive and significant at the 5% confidence level (t-statistic > 1.645), positive and not significant at the 5% confidence level, negative and not significant at the 5% confidence level, and negative and significant at the 5% confidence level, respectively. We report in the last two columns the median of the sum of the concurrent, lead and lag coefficient estimates (SUMG = β1 + β2 + β3) and the p-value of a sign test testing whether Median (SUMG) = 0.


![Commonality and Individuality in Writing[1]](https://img.pdfslide.us/doc/110x75/577ce72f1a28abf1039487c6/commonality-and-individuality-in-writing1.jpg)