Embed Size (px)
Citation preview

UNITED STATESSECURITIES AND EXCHANGE COMMISSION
Washington, D.C. 20549
Form 10-Q(Mark One)x QUARTERLY REPORT PURSUANT TO SECTION 13 OR 15(d) OF THE SECURITIES EXCHANGE ACT OF 1934
For the quarterly period ended June 30, 2019
OR
¨ TRANSITION REPORT PURSUANT TO SECTION 13 OR 15(d) OF THE SECURITIES EXCHANGE ACT OF 1934For the transition period from to
Commission File Number 001-38735
CONTURA ENERGY, INC.(Exact name of registrant as specified in its charter)
Delaware 81-3015061(State or other jurisdiction of incorporation or organization) (I.R.S. Employer Identification Number)
340 Martin Luther King Jr. Blvd.
Bristol, Tennessee 37620(Address of principal executive offices, zip code)
(423) 573-0300(Registrant’s telephone number, including area code)
Indicate by check mark whether the registrant (1) has filed all reports required to be filed by Section 13 or 15(d) of the Securities Exchange Act of 1934 duringthe preceding 12 months (or for such shorter period that the registrant was required to file such reports), and (2) has been subject to such filing requirements for thepast 90 days. xYes ¨No
Indicate by check mark whether the registrant has submitted electronically and posted on its corporate Web site, if any, every Interactive Data File required tobe submitted and posted pursuant to Rule 405 of Regulation S-T (Sec.232.405 of this chapter) during the preceding 12 months (or for such shorter period that theregistrant was required to submit and post such files). xYes ¨No
Indicate by check mark whether the registrant is a large accelerated filer, an accelerated filer, a non-accelerated filer, a smaller reporting company or anemerging growth company. See the definitions of “large accelerated filer,” “accelerated filer,” “smaller reporting company,” and “emerging growth company” inRule 12b-2 of the Exchange Act.
Large accelerated filer ¨ Accelerated filer ¨
Non-accelerated filer x Smaller reporting company ¨
Emerging growth company ¨
If an emerging growth company, indicate by check mark if the registrant has elected not to use the extended transition period for complying with any new orrevised financial accounting standards provided pursuant to Section 13(a) of the Exchange Act. ¨
Indicate by check mark whether the registrant is a shell company (as defined in Rule 12b-2 of the Exchange Act) ¨Yes x No

Securities registered pursuant to Section 12(b) of the Act:
Title of each class Trading Symbol(s) Name of each exchange on which registeredCommon Stock CTRA New York Stock Exchange
Number of shares of the registrant’s Common Stock, $0.01 par value, outstanding as of July 31, 2019: 19,218,122

TABLE OF CONTENTS
Cautionary Note Regarding Forward Looking Statements 5 Part I - Financial Information Item 1. Financial Statements Condensed Consolidated Statements of Operations for the Three and Six Months Ended June 30, 2019 and June 30, 2018 (Unaudited) 7
Condensed Consolidated Statements of Comprehensive Income (Loss) for the Three and Six Months Ended June 30, 2019 and June 30, 2018(Unaudited) 9
Condensed Consolidated Balance Sheets as of June 30, 2019 and December 31, 2018 (Unaudited) 10 Condensed Consolidated Statements of Cash Flows for the Six Months Ended June 30, 2019 and June 30, 2018 (Unaudited) 12
Condensed Consolidated Statements of Stockholders’ Equity for the Three and Six Months Ended June 30, 2019 and June 30, 2018(Unaudited) 14
Notes to Condensed Consolidated Financial Statements (Unaudited) 15 (1) Business and Basis of Presentation 15 (2) Mergers and Acquisitions 16 (3) Discontinued Operations 18 (4) Revenue 20 (5) Accumulated Other Comprehensive Income (Loss) 21 (6) Net Income (Loss) Per Share 21 (7) Inventories, net 23 (8) Goodwill and Acquired Intangibles 23 (9) Leases 24 (10) Long-Term Debt 26 (11) Acquisition-Related Obligations 27 (12) Asset Retirement Obligations 28 (13) Fair Value of Financial Instruments and Fair Value Measurements 28 (14) Income Taxes 30 (15) Employee Benefit Plans 31 (16) Related Party Transactions 32 (17) Commitments and Contingencies 32 (18) Segment Information 35 (19) Subsequent Events 41 Glossary 42Item 2. Management’s Discussion and Analysis of Financial Condition and Results of Operations 44 Results of Operations 48 Liquidity and Capital Resources 61 Contractual Obligations 64 Critical Accounting Policies and Estimates 64Item 3. Quantitative and Qualitative Disclosures about Market Risk 65Item 4. Controls and Procedures 66
Part II - Other Information Item 1. Legal Proceedings 66Item 1A. Risk Factors 66
3

Item 2. Unregistered Sales of Equity Securities and Use of Proceeds 66Item 4. Mine Safety Disclosures 67Item 6. Exhibits 67
4

Table of Contents
CAUTIONARY NOTE REGARDING FORWARD LOOKING STATEMENTS
This report includes statements of our expectations, intentions, plans and beliefs that constitute “forward-looking statements”. These statements, which involverisks and uncertainties, relate to analyses and other information that are based on forecasts of future results and estimates of amounts not yet determinable and mayalso relate to our future prospects, developments and business strategies. We have used the words “anticipate”, “believe”, “could”, “estimate”, “expect”, “intend”,“may”, “plan”, “predict”, “project”, “should” and similar terms and phrases, including references to assumptions, in this report to identify forward-lookingstatements. These forward-looking statements are made based on expectations and beliefs concerning future events affecting us and are subject to uncertainties andfactors relating to our operations and business environment, all of which are difficult to predict and many of which are beyond our control, that could cause ouractual results to differ materially from those matters expressed in or implied by these forward-looking statements.
The following factors are among those that may cause actual results to differ materially from our forward-looking statements:
• the financial performance of the company following the Merger with Alpha Natural Resources Holdings, Inc. and ANR, Inc. (the “Merger” or the “AlphaMerger”);
• our liquidity, results of operations and financial condition;• depressed levels or declines in coal prices;• worldwide market demand for coal, steel, and electricity, including demand for U.S. coal exports, and competition in coal markets;• the imposition or continuation of barriers to trade, such as tariffs;• utilities switching to alternative energy sources such as natural gas, renewables and coal from basins where we do not operate;• reductions or increases in customer coal inventories and the timing of those changes;• our production capabilities and costs;• inherent risks of coal mining beyond our control;• changes in, interpretations of, or implementations of domestic or international tax or other laws and regulations, including the Tax Cuts and Jobs Act and
its related regulations;• changes in domestic or international environmental laws and regulations, and court decisions, including those directly affecting our coal mining and
production, and those affecting our customers’ coal usage, including potential climate change initiatives;• our relationships with, and other conditions affecting, our customers, including the inability to collect payments from our customers if their
creditworthiness declines;• changes in, renewal or acquisition of, terms of and performance of customers under coal supply arrangements and the refusal by our customers to receive
coal under agreed contract terms;• our ability to obtain, maintain or renew any necessary permits or rights, and our ability to mine properties due to defects in title on leasehold interests;• attracting and retaining key personnel and other employee workforce factors, such as labor relations;• funding for and changes in employee benefit obligations;• any new or increased liabilities, including reclamation obligations, that we may incur in connection with the recent Chapter 11 bankruptcy filing by
Blackjewel L.L.C.;• cybersecurity attacks or failures, threats to physical security, extreme weather conditions or other natural disasters;• reclamation and mine closure obligations;• our assumptions concerning economically recoverable coal reserve estimates;• our ability to negotiate new United Mine Workers of America wage agreements on terms acceptable to us, increased unionization of our workforce in the
future, and any strikes by our workforce;• disruptions in delivery or changes in pricing from third party vendors of key equipment and materials that are necessary for our operations, such as diesel
fuel, steel products, explosives, tires and purchased coal;• inflationary pressures on supplies and labor and significant or rapid increases in commodity prices;• railroad, barge, truck and other transportation availability, performance and costs;• disruption in third party coal supplies;• the consummation of financing or refinancing transactions, acquisitions or dispositions and the related effects on our business and financial position;• our indebtedness and potential future indebtedness;• our ability to generate sufficient cash or obtain financing to fund our business operations; and• our ability to obtain or renew surety bonds on acceptable terms or maintain our current bonding status; and• other factors, including the other factors discussed in the “Management’s Discussion and Analysis of Financial Condition and Results of Operations” and
“Risk Factors” sections of this Report and the “ Management’s Discussion
5

Table of Contents
and Analysis of Financial Condition and Results of Operations ” and “ Risk Factors ” sections of our Annual Report on Form 10-K for the year endedDecember 31, 2018.
The factors identified above are not exhaustive. We caution readers not to place undue reliance on any forward-looking statements, which are based only oninformation currently available to us and speak only as of the dates on which they are made. When considering these forward-looking statements, you should keepin mind the cautionary statements in this report. We do not undertake any responsibility to release publicly any revisions to these forward-looking statements totake into account events or circumstances that occur after the date of this report. Additionally, we do not undertake any responsibility to update you on theoccurrence of any unanticipated events, which may cause actual results to differ from those expressed or implied by the forward-looking statements contained inthis report.
6

Table of Contents
Part I - Financial Information
Item 1. Financial StatementsCONTURA ENERGY, INC. AND SUBSIDIARIES
CONDENSED CONSOLIDATED STATEMENTS OF OPERATIONS (Unaudited)(Amounts in thousands, except share and per share data)
Three Months Ended June 30, Six Months Ended June 30,
2019 2018 2019 2018Revenues:
Coal revenues $ 653,828 $ 525,168 $ 1,260,788 $ 1,003,533Other revenues 2,378 3,750 4,532 7,717
Total revenues 656,206 528,918 1,265,320 1,011,250Costs and expenses:
Cost of coal sales (exclusive of items shown separately below) 496,746 431,304 1,012,440 802,048Depreciation, depletion and amortization 62,814 11,222 124,085 22,810Accretion on asset retirement obligations 6,847 1,596 13,079 4,056Amortization of acquired intangibles, net (343) 1,104 (7,026) 11,310Asset impairment 5,826 — 5,826 —Selling, general and administrative expenses (exclusive ofdepreciation, depletion and amortization shown separately above) 14,783 11,951 35,734 31,108Merger related costs 156 3,423 987 3,883Total other operating (income) loss:
Mark-to-market adjustment for acquisition-related obligations 1,014 — 2,950 —Other expenses (income) 1,414 (16,407) (7,485) (16,506)
Total costs and expenses 589,257 444,193 1,180,590 858,709Income from operations 66,949 84,725 84,730 152,541Other income (expense):
Interest expense (16,077) (8,779) (31,232) (17,984)Interest income 1,885 191 3,821 322Loss on modification and extinguishment of debt (26,459) — (26,459) —Equity loss in affiliates (2,475) (1,170) (2,959) (1,233)Miscellaneous loss, net (523) (270) (1,389) (583)
Total other expense, net (43,649) (10,028) (58,218) (19,478)Income from continuing operations before income taxes 23,300 74,697 26,512 133,063Income tax benefit (expense) 1,000 (55) 5,778 (121)Net income from continuing operations 24,300 74,642 32,290 132,942Discontinued operations:
Loss from discontinued operations before income taxes (163,867) (854) (165,457) (2,213)Income tax benefit from discontinued operations 25,906 — 26,321 —Loss from discontinued operations (137,961) (854) (139,136) (2,213)
Net (loss) income $ (113,661) $ 73,788 $ (106,846) $ 130,729
Basic income (loss) per common share:
Income from continuing operations $ 1.27 $ 7.75 $ 1.70 $ 13.87Loss from discontinued operations (7.21) (0.08) (7.32) (0.23)
7

Table of Contents
Net (loss) income $ (5.94) $ 7.67 $ (5.62) $ 13.64
Diluted income (loss) per common share Income from continuing operations $ 1.25 $ 7.24 $ 1.66 $ 12.91Loss from discontinued operations (7.10) (0.08) (7.14) (0.22)Net (loss) income $ (5.85) $ 7.16 $ (5.48) $ 12.69
Weighted average shares - basic 19,123,705 9,625,874 19,009,643 9,587,457Weighted average shares - diluted 19,420,471 10,306,043 19,480,183 10,299,539
Refer to accompanying Notes to Condensed Consolidated Financial Statements.
8

Table of Contents
CONTURA ENERGY, INC. AND SUBSIDIARIESCONDENSED CONSOLIDATED STATEMENTS OF COMPREHENSIVE INCOME (LOSS) (Unaudited)
(Amounts in thousands)
Three Months Ended June 30, Six Months Ended June 30,
2019 2018 2019 2018
Net (loss) income $ (113,661) $ 73,788 $ (106,846) $ 130,729Other comprehensive income (loss), net of tax: Employee benefit plans:
Amortization of and adjustments to employee benefit costs $ 1,187 $ (87) $ 1,426 $ (50)Income tax expense (310) — (372) —
Total other comprehensive income (loss), net of tax $ 877 $ (87) $ 1,054 $ (50)
Total comprehensive (loss) income $ (112,784) $ 73,701 $ (105,792) $ 130,679
Refer to accompanying Notes to Condensed Consolidated Financial Statements.
9

Table of Contents
CONTURA ENERGY, INC. AND SUBSIDIARIESCONDENSED CONSOLIDATED BALANCE SHEETS (Unaudited)
(Amounts in thousands, except share and per share data)
June 30, 2019 December 31, 2018Assets
Current assets:
Cash and cash equivalents $ 249,597 $ 233,599Trade accounts receivable, net of allowance for doubtful accounts of $0 as of June 30, 2019 and December 31,2018 280,025 292,617Inventories, net 164,303 121,965Prepaid expenses and other current assets 166,702 158,945Current assets - discontinued operations 2,059 22,475Total current assets 862,686 829,601Property, plant, and equipment, net of accumulated depreciation and amortization of $220,260 and $106,766 as ofJune 30, 2019 and December 31, 2018 630,654 699,990Owned and leased mineral rights, net of accumulated depletion and amortization of $18,769 and $11,390 as of June30, 2019 and December 31, 2018 569,394 528,232Goodwill 101,019 95,624Other acquired intangibles, net of accumulated amortization of $32,634 and $20,267 as of June 30, 2019 andDecember 31, 2018 146,554 154,584Long-term restricted cash 216,568 227,173Deferred income taxes 54,466 27,179Other non-current assets 198,449 183,675Total assets $ 2,779,790 $ 2,746,058
Liabilities and Stockholders’ Equity
Current liabilities:
Current portion of long-term debt $ 28,885 $ 42,743Acquisition-related obligations - current 33,060 27,334Trade accounts payable 89,214 114,568Accrued expenses and other current liabilities 157,948 148,699Current liabilities - discontinued operations 17,298 21,892Total current liabilities 326,405 355,236Long-term debt 580,519 545,269Acquisition-related obligations - long-term 67,049 72,996Workers’ compensation and black lung obligations 245,972 249,294Pension obligations 180,274 180,802Asset retirement obligations 217,830 203,694Deferred income taxes 6,908 15,118Other non-current liabilities 40,596 52,415Non-current liabilities - discontinued operations 147,016 94Total liabilities 1,812,569 1,674,918Commitments and Contingencies (Note 17)
Stockholders’ Equity Preferred stock - par value $0.01, 5.0 million shares authorized, none issued — —Common stock - par value $0.01, 50.0 million shares authorized, 20.4 million issued and 19.2 million outstandingat June 30, 2019 and 20.2 million issued and 19.1 million outstanding at December 31, 2018 204 202Additional paid-in capital 768,046 761,301Accumulated other comprehensive loss (22,076) (23,130)
10

Table of Contents
Treasury stock, at cost: 1.2 million shares at June 30, 2019 and 1.1 million shares at December 31, 2018 (75,236) (70,362)Retained earnings 296,283 403,129Total stockholders’ equity 967,221 1,071,140Total liabilities and stockholders’ equity $ 2,779,790 $ 2,746,058
Refer to accompanying Notes to Condensed Consolidated Financial Statements.
11

Table of Contents
CONTURA ENERGY, INC. AND SUBSIDIARIESCONDENSED CONSOLIDATED STATEMENTS OF CASH FLOWS (Unaudited)
(Amounts in thousands)
Six Months Ended June 30,
2019 2018
Operating activities: Net (loss) income $ (106,846) $ 130,729Adjustments to reconcile net income to net cash provided by (used in) operating activities:
Depreciation, depletion and amortization 269,997 22,810Amortization of acquired intangibles, net (7,026) 11,310Accretion of acquisition-related obligations discount 3,220 3,020Amortization of debt issuance costs and accretion of debt discount 6,724 1,499Mark-to-market adjustment for acquisition-related obligations 2,950 —Loss (gain) on disposal of assets 1,372 (16,502)Gain on assets acquired in an exchange transaction (9,083) —Loss on modification and extinguishment of debt 26,459 —Asset impairment 22,294 —Accretion on asset retirement obligations 13,079 4,056Employee benefit plans, net 9,564 5,324Deferred income taxes (33,623) —Stock-based compensation 4,774 7,125Equity loss in affiliates 2,959 1,233Other, net 405 (292)Changes in operating assets and liabilities (90,086) (54,706)Net cash provided by operating activities 117,133 115,606
Investing activities: Capital expenditures (83,882) (38,349)Payments on disposal of assets — (10,250)Proceeds on disposal of assets 1,048 464Purchases of investment securities - held to maturity (9,899) (1,446)Maturity of investment securities - held to maturity 21,316 —Capital contributions to equity affiliates (4,807) (525)Other, net 93 —Net cash used in investing activities (76,131) (50,106)
Financing activities: Proceeds from borrowings on debt 544,946 —Principal repayments of debt (550,000) (5,323)Principal repayments of notes payable (821) (2,939)Principal repayments of financing lease obligations (2,100) (139)Debt issuance costs (5,839) —Common stock repurchases and related expenses (4,874) (4,838)Other, net 914 (49)Net cash used in financing activities (17,774) (13,288)Net increase in cash and cash equivalents and restricted cash 23,228 52,212Cash and cash equivalents and restricted cash at beginning of period 477,246 193,960
Cash and cash equivalents and restricted cash at end of period $ 500,474 $ 246,172
12

Table of Contents
The following table provides a reconciliation of cash and cash equivalents and restricted cash reported within the Condensed Consolidated Balance Sheets thatsum to the total of the same such amounts shown in the Condensed Consolidated Statements of Cash Flows.
As of June 30,
2019 2018
Cash and cash equivalents $ 249,597 $ 199,252Short-term restricted cash (included in Prepaid expenses and other current assets) 34,309 11,680Long-term restricted cash 216,568 35,240
Total cash and cash equivalents and restricted cash shown in the Condensed Consolidated Statementsof Cash Flows $ 500,474 $ 246,172
Refer to accompanying Notes to Condensed Consolidated Financial Statements.
13
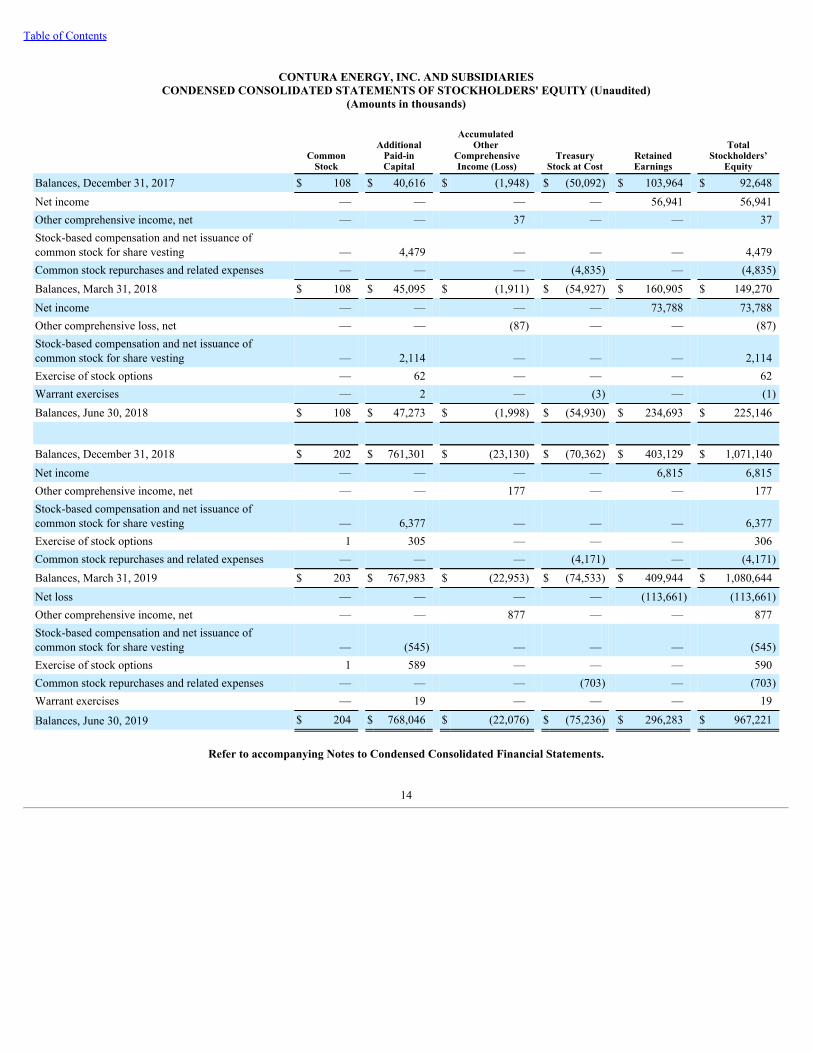
Table of Contents
CONTURA ENERGY, INC. AND SUBSIDIARIESCONDENSED CONSOLIDATED STATEMENTS OF STOCKHOLDERS' EQUITY (Unaudited)
(Amounts in thousands)
CommonStock
AdditionalPaid-inCapital
Accumulated Other
ComprehensiveIncome (Loss)
TreasuryStock at Cost
RetainedEarnings
TotalStockholders’
Equity
Balances, December 31, 2017 $ 108 $ 40,616 $ (1,948) $ (50,092) $ 103,964 $ 92,648Net income — — — — 56,941 56,941Other comprehensive income, net — — 37 — — 37Stock-based compensation and net issuance ofcommon stock for share vesting — 4,479 — — — 4,479Common stock repurchases and related expenses — — — (4,835) — (4,835)Balances, March 31, 2018 $ 108 $ 45,095 $ (1,911) $ (54,927) $ 160,905 $ 149,270Net income — — — — 73,788 73,788Other comprehensive loss, net — — (87) — — (87)Stock-based compensation and net issuance ofcommon stock for share vesting — 2,114 — — — 2,114Exercise of stock options — 62 — — — 62Warrant exercises — 2 — (3) — (1)Balances, June 30, 2018 $ 108 $ 47,273 $ (1,998) $ (54,930) $ 234,693 $ 225,146
Balances, December 31, 2018 $ 202 $ 761,301 $ (23,130) $ (70,362) $ 403,129 $ 1,071,140Net income — — — — 6,815 6,815Other comprehensive income, net — — 177 — — 177Stock-based compensation and net issuance ofcommon stock for share vesting — 6,377 — — — 6,377Exercise of stock options 1 305 — — — 306Common stock repurchases and related expenses — — — (4,171) — (4,171)Balances, March 31, 2019 $ 203 $ 767,983 $ (22,953) $ (74,533) $ 409,944 $ 1,080,644Net loss — — — — (113,661) (113,661)Other comprehensive income, net — — 877 — — 877Stock-based compensation and net issuance ofcommon stock for share vesting — (545) — — — (545)Exercise of stock options 1 589 — — — 590Common stock repurchases and related expenses — — — (703) — (703)Warrant exercises — 19 — — — 19
Balances, June 30, 2019 $ 204 $ 768,046 $ (22,076) $ (75,236) $ 296,283 $ 967,221
Refer to accompanying Notes to Condensed Consolidated Financial Statements.
14

Table of ContentsCONTURA ENERGY, INC. AND SUBSIDIARIES
Notes to Condensed Consolidated Financial Statements(Unaudited, amounts in thousands except share and per share data)
( 1 ) Business and Basis of Presentation
Basis of Presentation
Together, the condensed consolidated statements of operations, comprehensive (loss) income, balance sheet, cash flows and stockholders’ equity for theCompany are referred to as the “Condensed Consolidated Financial Statements.” The Condensed Consolidated Financial Statements are also referenced acrossperiods as “Condensed Consolidated Balance Sheets,” “Condensed Consolidated Statements of Operations,” and “Condensed Consolidated Statements of CashFlows.”
The Condensed Consolidated Financial Statements include all wholly-owned subsidiaries’ results of operations for the three and six months ended June 30,2019 and 2018 . All significant intercompany transactions have been eliminated in consolidation.
The accompanying interim Condensed Consolidated Financial Statements are unaudited and have been prepared in accordance with accounting principlesgenerally accepted in the United States (“U.S. GAAP”) and in accordance with the rules and regulations of the United States Securities and Exchange Commission(“SEC”) for Form 10-Q. Such rules and regulations allow the omission of certain information and footnote disclosures normally included in the financialstatements prepared in accordance with U.S. GAAP as long as the financial statements are not misleading. In the opinion of management, these interim CondensedConsolidated Financial Statements reflect all normal and recurring adjustments necessary for a fair presentation of the results for the periods presented. Results ofoperations for the three and six months ended June 30, 2019 are not necessarily indicative of the results to be expected for the year ending December 31, 2019 orany other period. These interim Condensed Consolidated Financial Statements should be read in conjunction with the Company’s Consolidated FinancialStatements and related notes included in the Company’s Annual Report on Form 10-K for the year ended December 31, 2018.
Reclassifications
Accretion on asset retirement obligations has been reclassified in the prior year from cost of coal sales to a separate line item in the Condensed ConsolidatedStatements of Operations to conform to the current year presentation. Freight and handling costs has been reclassified in the prior year from a separate line iteminto cost of coal sales in the Condensed Consolidated Statements of Operations to conform to the current year presentation.
New Accounting Pronouncements
Leases: In February 2016, the Financial Accounting Standards Board (the “FASB”) issued Accounting Standards Update (“ASU”) 2016-02 , Leases (“ASU2016-02”) . ASU 2016-02, along with related amendments issued from 2017 to 2019 (collectively, the “New Leases Standard”), requires a lessee to recognize aright-of-use asset and a lease liability on the balance sheet. The Company adopted ASU 2016-02 effective January 1, 2019 and elected the option to not restatecomparative periods in transition and also elected the package of practical expedients for all leases within the standard, which permits the Company not to reassessits prior conclusions about lease identification, lease classification and initial direct costs. Additionally, the Company elected the transition practical expedient tocontinue to account for existing and expired land easements at transition as executory contracts. Only land easements entered into or modified after the effectivedate of Accounting Standards Codification (“ASC”) 842 are accounted for as leases by the Company.
As a result of the adoption, the Company recorded operating lease right-of-use assets and lease liabilities on our Condensed Consolidated Balance Sheet. Thefollowing table summarizes the impact of the adoption of ASC 842 to the Company’s Condensed Consolidated Balance Sheet:
15

Table of ContentsCONTURA ENERGY, INC. AND SUBSIDIARIES
Notes to Condensed Consolidated Financial Statements(Unaudited, amounts in thousands except share and per share data)
Balance at
December 31, 2018(1) Adjustments
Balance at January1, 2019
Assets Balance Sheet Classification
Operating lease right-of-use assets Other non-current assets $ — $ 11,845 $ 11,845Financing lease assets Property, plant, and equipment, net 9,786 — 9,786Total lease assets $ 9,786 $ 11,845 $ 21,631
Liabilities Balance Sheet Classification Operating lease liabilities - current Accrued expenses and other current liabilities $ — $ 3,624 $ 3,624Financing lease liabilities - current Current portion of long-term debt 2,110 — 2,110Operating lease liabilities - long-term Other non-current liabilities — 8,221 8,221Financing lease liabilities - long-term Long-term debt 4,313 — 4,313Total lease liabilities $ 6,423 $ 11,845 $ 18,268
(1) Balances do not include measurement-period adjustments recorded during the three months ended June 30, 2019. Refer to Note 2 for further details onmeasurement-period adjustments recorded during the period.
The adoption of ASC 842 did not have an impact on our Condensed Consolidated Statements of Operations, Condensed Consolidated Statements ofComprehensive Income, or Condensed Consolidated Statements of Cash Flows. Refer to Note 9 for further disclosure requirements under the new standard.
Credit Losses: In June 2016, the Financial Accounting Standards Board (the “FASB”) issued Accounting Standards Update (“ASU”) 2016-13, Credit Losses(“ASU 2016-13”). ASU 2016-13, along with related amendments and improvements issued in 2018 and 2019, replaces the incurred loss impairment methodologyin current GAAP with a methodology that reflects expected credit losses and requires consideration of a broader range of reasonable supportable information toinform credit loss estimates. Management is currently evaluating the impact on the Company’s Condensed Consolidated Financial Statements and relateddisclosures.
Stock Compensation : In June 2018, the FASB issued ASU 2018-07, Compensation - Stock Compensation (Topic 718): Improvements to Nonemployee Share-Based Payment Accounting (“ASU 2018-07”). The amendments in this update expand the scope of Topic 718 to include share-based payment transactions foracquiring goods and services from nonemployees. The Company adopted ASU 2018-07 during the first quarter of 2019. The adoption of this ASU did not have amaterial impact on the Company's Condensed Consolidated Financial Statements and related disclosures.
( 2 ) Mergers and Acquisitions
A Merger with ANR, Inc. (“ANR”) and Alpha Natural Resources Holdings, Inc. (“Holdings”, and, together with ANR, the "Alpha Companies”) wascompleted on November 9, 2018 (the “Merger” or the “Alpha Merger”).
Preliminary Allocation of Purchase Price
There were no measurement-period adjustments recorded during the period from the acquisition date to June 30, 2019 that impacted the preliminary purchaseprice of $688,534 . As of June 30, 2019 , the fair value allocation for the acquisition is preliminary and will be finalized when the valuation and the related internalcontrols over financial reporting are completed. Differences between the preliminary and final allocation could be material. The Company’s estimates andassumptions are subject to change during the measurement period (up to one year from the closing of the acquisition), as the Company finalizes the accounting forthe purchase price of the assets acquired and liabilities assumed. The primary areas of the purchase price allocation that are not yet finalized relate to the areas ofproperty plant and equipment, owned and leased mineral rights, acquired intangibles, goodwill, asset retirement obligations, taxes, accounts payable, and othercontingencies. The Company continues to review the significant amount of data and assumptions used in these areas which could cause a reallocation of thepurchase price. The below table is a preliminary allocation of the assets acquired and the liabilities the Company assumed in the acquisition as of December 31,2018, along with adjustments through the second quarter of 2019 resulting in the preliminary allocation as of June 30, 2019 .
16

Table of ContentsCONTURA ENERGY, INC. AND SUBSIDIARIES
Notes to Condensed Consolidated Financial Statements(Unaudited, amounts in thousands except share and per share data)
The total purchase price has been preliminarily allocated to the net tangible and intangible assets of Alpha Companies as follows:
Provisional as of December31, 2018 Adjustments
Provisional as of June 30,2019
Cash and cash equivalents $ 29,939 $ — $ 29,939Trade and other receivables 60,714 — 60,714Inventories 85,635 — 85,635Short-term restricted cash 10,592 — 10,592Other current assets 38,495 7,929 46,424Property, plant, and equipment 504,852 (33,930) 470,922Owned and leased mineral rights 516,201 39,031 555,232Other intangible assets 154,041 4,453 158,494Long-term restricted cash 182,049 — 182,049Long-term restricted investments 28,809 — 28,809Other non-current assets 68,022 (3,915) 64,107
Total assets $ 1,679,349 $ 13,568 $ 1,692,917
Accounts payable $ 69,049 $ (2,711) $ 66,338Accrued expenses and other current liabilities 76,774 2,139 78,913Long-term debt, including current portion 144,832 3,618 148,450Acquisition related obligations 74,346 5,738 80,084Pension obligations 158,005 3,596 161,601Asset retirement obligation, including current portion 163,636 12,718 176,354Deferred income taxes, including current portion 134,924 (2,246) 132,678Other intangible liabilities 57,219 — 57,219Other non-current liabilities 207,654 (3,889) 203,765
Total liabilities $ 1,086,439 $ 18,963 $ 1,105,402
Goodwill $ 95,624 $ 5,395 $ 101,019
Allocation of purchase price $ 688,534 $ — $ 688,534
During the six months ended June 30, 2019 , the Company recorded measurement-period adjustments to the provisional opening balance sheet as shown in thetable above. Adjustments were made primarily to property, plant and equipment, owned and leased mineral rights and asset retirement obligations. There were nomaterial measurement-period adjustments impacting current-period earnings that would have been recorded in the previous reporting period if the adjustments tothe provisional amounts had been recognized as of the acquisition date.
In connection with the Merger, the Company originally recorded provisional goodwill of $95,624 , which represents the excess of the purchase price over theestimated fair value of tangible and intangible asset acquired, net of liabilities assumed. As a result of measurement-period adjustments recorded during the sixmonths ended June 30, 2019 , the provisional amount of goodwill increased by $5,395 resulting in provisional goodwill of $101,019 as of June 30, 2019 . Thegoodwill is attributed primarily to the following factors: (i) anticipated operating and administrative synergies, and (ii) deferred income taxes arising from thedifferences between the preliminary purchase price allocated to the assets and liabilities acquired based on fair value and the tax basis of these assets and liabilities.The goodwill is not deductible for tax purposes. The Company’s provisional estimate of goodwill is not yet finalized and has been allocated to the Company’sCAPP-Met reportable segment.
17

Table of ContentsCONTURA ENERGY, INC. AND SUBSIDIARIES
Notes to Condensed Consolidated Financial Statements(Unaudited, amounts in thousands except share and per share data)
The following table represents the intangible assets and the weighted-average amortization periods as of the acquisition date:
Provisional as of June30, 2019
Weighted-AverageAmortization Period
( In Years )Mining permits $ 157,645 12.62Above-market coal supply agreements 849 1.03Below-market coal supply agreements (57,219) 2.10
Total acquired intangibles: $ 101,275 10.46
The Condensed Consolidated Statements of Operations include acquisition related expenses (on a pre-tax basis) of $156 and $3,423 in Merger related costs forthe three months ended June 30, 2019 and 2018, respectively. The Condensed Consolidated Statements of Operations include acquisition related expenses (on apre-tax basis) of $987 and $3,883 in Merger related costs for the six months ended June 30, 2019 and 2018, respectively. Acquisition related expenses includeprofessional fees related to legal, tax, advisory integration services and contract related matters.
The following unaudited pro forma information has been prepared for illustrative purposes only and assumes the Merger occurred on January 1, 2017. Theunaudited pro forma results have been prepared based on estimates and assumptions, which the Company believes are reasonable; however, they are notnecessarily indicative of the consolidated results of operations had the Merger occurred on January 1, 2017, or of future results of operations.
Three Months Ended June 30, 2018 Six Months Ended June 30, 2018
As reported Pro forma As reported Pro formaTotal revenues $ 528,918 $ 712,204 $ 1,011,250 $ 1,338,953Income from continuing operations $ 74,642 $ 105,117 $ 132,942 $ 179,646
Basic income per common share: Income from continuing operations $ 7.75 $ 5.53 $ 13.87 $ 9.47
Diluted income per common share: Income from continuing operations $ 7.24 $ 5.34 $ 12.91 $ 9.13
Weighted average shares - basic 9,625,874 19,004,073 9,587,457 18,965,656Weighted average shares - diluted 10,306,043 19,684,242 10,299,539 19,677,738
These amounts have been calculated after applying the Company's accounting policies and adjusting the results of ANR to reflect the additional depreciation,amortization, depletion, and cost of coal sales that would have been charged assuming the fair value adjustments to property, plant and equipment, as well asintangibles, asset retirement obligations, and inventory had been applied at January 1, 2017, together with the consequential tax effects.
The pro forma results for the three and six months ended June 30, 2018 include $3,423 and $3,883 , respectively, of merger-related costs primarily related toprofessional service fees.
( 3 ) Discontinued Operations
The discontinued operations include the Company’s former PRB segment. On December 8, 2017, the Company closed a transaction (“PRB Transaction”) withBlackjewel L.L.C. (“Blackjewel” or the “Buyer”) to sell the Eagle Butte and Belle Ayr mines located in the PRB. During the anticipated permit transfer period, theCompany maintained the required reclamation bonds and related collateral. As of June 30, 2019 , the Company had outstanding surety bonds with a total faceamount of $237,310 to secure various obligations and commitments related to the PRB. As the permits associated with the PRB Transaction have not transferreddue to the Blackjewel Chapter 11 bankruptcy filing on July 1, 2019, the Company no longer anticipates the related restricted cash and deposits will be returned inthe near term to operating cash. Refer to Note 19 for
18

Table of ContentsCONTURA ENERGY, INC. AND SUBSIDIARIES
Notes to Condensed Consolidated Financial Statements(Unaudited, amounts in thousands except share and per share data)
further details within subsequent event disclosures.
The major components of net income (loss) from discontinued operations in the Condensed Consolidated Statements of Operations are as follows:
Three Months Ended June 30, Six Months Ended June 30,
2019 2018 2019 2018Revenues:
Total revenues (1) $ 52 $ 182 $ 148 $ 1,115
Costs and expenses: Depreciation, depletion and amortization (2) $ 145,913 $ — $ 145,913 $ —Asset impairment (3) $ 16,468 $ — $ 16,468 $ —Other expenses $ 1,349 $ 1,104 $ 2,939 $ 2,402
Other non-major expense (income) items, net $ 189 $ (68) $ 285 $ 926(1) Total revenues for the three and six months ended June 30, 2019 and 2018 consisted entirely of other revenues.(2) The depreciation, depletion and amortization is primarily related to an increase in the asset retirement obligation as a result of the Blackjewel Chapter 11bankruptcy filing on July 1, 2019. The Company remeasured the liability based on the expectation that the mining permits will not transfer and Blackjewel isnot expected to perform on their contractual obligation to reclaim the properties due to Blackjewel’s Chapter 11 bankruptcy filing. The increase in the assetretirement obligation was expensed in the three months ended June 30, 2019 as there are no related mining assets. The estimates and assumptions used todetermine the asset retirement obligation as of June 30, 2019 will continue to be evaluated and updated as additional information becomes available insubsequent periods. Refer to Note 19 for further details within subsequent event disclosures.(3) The asset impairment is primarily related to the write-off of a tax receivable. Refer to the disclosures below for further details.
Refer to Note 6 for net income (loss) per share information related to discontinued operations.
The major components of asset and liabilities that are classified as discontinued operations in the Condensed Consolidated Balance Sheets are as follows:
June 30, 2019 December 31, 2018Assets: Accounts receivable, net $ 1,060 $ 5Prepaid expenses and other current assets $ 999 $ 22,470
Liabilities:
Trade accounts payable, accrued expenses and other current liabilities (1) $ 17,298 $ 21,892Asset retirement obligations (2) $ 146,921 $ —Other non-current liabilities $ 95 $ 94
(1) The liabilities are primarily comprised of taxes for which the Company is considered to be the primary obligor but for which the Buyer is contractually obligatedto pay. During the three months ended June 30, 2019 , the Company recorded an impairment charge for the offsetting receivable from the Buyer as a result of theBlackjewel Chapter 11 bankruptcy filing on July 1, 2019. Refer to Note 19 for further details within subsequent event disclosures.(2) Refer to discussion of asset retirement obligation in the table above.
The major components of cash flows related to discontinued operations are as follows:
19

Table of ContentsCONTURA ENERGY, INC. AND SUBSIDIARIES
Notes to Condensed Consolidated Financial Statements(Unaudited, amounts in thousands except share and per share data)
Three Months Ended June 30, Six Months Ended June 30,
2019 2018 2019 2018Other significant operating non-cash items related todiscontinued operations:
Depreciation, depletion and amortization $ 145,913 $ — $ 145,913 $ —
Blackjewel Surety Bonding
During the third quarter of 2018, the Company recorded a guarantee within discontinued operations to account for the Blackjewel surety bonding arrangementwith no material impact on the Company's Condensed Consolidated Financial Statements. During the three months ended June 30, 2019, the Company reversed theguarantee liability as a result of the Blackjewel Chapter 11 bankruptcy filing on July 1, 2019 and the expectation of the permits not transferring to Blackjewel.Refer to Note 19 for further details within subsequent event disclosures.
( 4 ) Revenue
Disaggregation of Revenue from Contracts with Customers
The following tables disaggregate the Company’s coal revenues by product category and by market to depict how the nature, amount, timing, and uncertaintyof the Company’s coal revenues and cash flows are affected by economic factors:
Three Months Ended June 30, 2019
Met Thermal TotalExport coal revenues $ 345,576 $ 17,262 $ 362,838Domestic coal revenues 156,053 134,937 290,990Total coal revenues $ 501,629 $ 152,199 $ 653,828
Three Months Ended June 30, 2018
Met Thermal TotalExport coal revenues $ 453,581 $ 7,909 $ 461,490Domestic coal revenues 14,940 48,738 63,678Total coal revenues $ 468,521 $ 56,647 $ 525,168
Six Months Ended June 30, 2019
Met Thermal TotalExport coal revenues $ 679,762 $ 26,382 $ 706,144Domestic coal revenues 292,311 262,333 554,644Total coal revenues $ 972,073 $ 288,715 $ 1,260,788
Six Months Ended June 30, 2018
Met Thermal TotalExport coal revenues $ 867,259 $ 15,786 $ 883,045Domestic coal revenues 22,864 97,624 120,488Total coal revenues $ 890,123 $ 113,410 $ 1,003,533
Performance Obligations
The following table includes estimated revenue expected to be recognized in the future related to performance obligations that are unsatisfied as of June 30,2019 .
20

Table of ContentsCONTURA ENERGY, INC. AND SUBSIDIARIES
Notes to Condensed Consolidated Financial Statements(Unaudited, amounts in thousands except share and per share data)
Remainder of 2019 2020 2021 2022 2023 Total
Estimated coal revenues $ 129,558 $ 269,340 $ 117,590 $ 69,943 $ 84,268 $ 670,699
Contract Balances
During the six months ended June 30, 2019 , the Company paid amounts under certain contracts related to the modification of contract terms. These paymentswere deferred and allocated to the remaining performance obligations after contract modification. The following table includes the opening and closing balances ofcontract assets from modifications with contracts with customers, which are included within prepaid expenses and other current assets on the Company’sCondensed Consolidated Balance Sheets:
June 30, 2019 December 31, 2018
Contract assets (1) $ 2,204 $ 950(1) Amounts primarily relate to payments made upon modification of coal contracts.
Of the December 31, 2018 contract asset balance, $293 and $517 was recognized within coal revenues in the Company’s Condensed Consolidated Statementsof Operations during the three and six months ended June 30, 2019, respectively. During the three and six months ended June 30, 2018 , there were no contractbalances as of December 31, 2017 recognized within the Company’s Condensed Consolidated Statements of Operations.
( 5 ) Accumulated Other Comprehensive Income (Loss)
The following tables summarize the changes to accumulated other comprehensive income (loss) during the six months ended June 30, 2019 and 2018 :
Balance January 1, 2019 Other comprehensive income(loss) before reclassifications
Amounts reclassified fromaccumulated other
comprehensive income (loss) Balance June 30, 2019
Employee benefit costs $ (23,130) $ 713 $ 341 $ (22,076)
Balance January 1, 2018 Other comprehensive income(loss) before reclassifications
Amounts reclassified fromaccumulated other
comprehensive income (loss) Balance June 30, 2018
Employee benefit costs $ (1,948) $ (128) $ 78 $ (1,998)
The following table summarizes the amounts reclassified from accumulated other comprehensive income (loss) and the Condensed Consolidated Statementsof Operations line items affected by the reclassification during the three and six months ended June 30, 2019 and 2018 :
Details about accumulated othercomprehensive income (loss)components
Amounts reclassified from accumulated other comprehensive income (loss)Affected line item in theCondensed ConsolidatedStatements of Operations
Three Months Ended June 30, Six Months Ended June 30,
2019 2018 2019 2018
Employee benefit costs: Amortization of actuarial loss $ 222 $ 41 $ 461 $ 78 (1) Miscellaneous loss, net
Income tax expense (58) — (120) —Income tax benefit(expense)
Total, net of income tax $ 164 $ 41 $ 341 $ 78 (1) These accumulated other comprehensive income (loss) components are included in the computation of net periodic benefit costs for black lung and life
insurance. Refer to Note 15 .
( 6 ) Net Income (Loss) Per Share
21

Table of ContentsCONTURA ENERGY, INC. AND SUBSIDIARIES
Notes to Condensed Consolidated Financial Statements(Unaudited, amounts in thousands except share and per share data)
The number of shares used to calculate basic net income (loss) per common share is based on the weighted average number of the Company’s outstandingcommon shares during the respective period. The number of shares used to calculate diluted net income (loss) per common share is based on the number ofcommon shares used to calculate basic net income (loss) per share plus the dilutive effect of stock options and other stock-based instruments held by theCompany’s employees and directors during the period, and the Company’s outstanding Series A warrants. The warrants become dilutive for net income (loss) percommon share calculations when the market price of the Company’s common stock exceeds the exercise price. For the three and six months ended June 30, 2019,95,162 stock options and 131,707 restricted stock units were excluded from the computation of dilutive net income (loss) per share because they would have beenanti-dilutive. For the three and six months ended June 30, 2018, 129,520 stock options were excluded from the computation of dilutive net income (loss) per sharebecause they would have been anti-dilutive. These potential shares could dilute net income (loss) per share in the future.
The following table presents the net income (loss) per common share for the three and six months ended June 30, 2019 and 2018 :
Three Months Ended June 30, Six Months Ended June 30,
2019 2018 2019 2018
Net income (loss) Income from continuing operations $ 24,300 $ 74,642 $ 32,290 $ 132,942Loss from discontinued operations (137,961) (854) (139,136) (2,213)
Net (loss) income $ (113,661) $ 73,788 $ (106,846) $ 130,729
Basic
Weighted average common shares outstanding - basic 19,123,705 9,625,874 19,009,643 9,587,457 Basic income (loss) per common share:
Income from continuing operations $ 1.27 $ 7.75 $ 1.70 $ 13.87Loss from discontinued operations (7.21) (0.08) (7.32) (0.23)
Net (loss) income $ (5.94) $ 7.67 $ (5.62) $ 13.64
Diluted
Weighted average common shares outstanding - basic 19,123,705 9,625,874 19,009,643 9,587,457Diluted effect of warrants 143,571 260,919 179,807 253,795Diluted effect of stock options 74,278 261,849 139,956 268,364Diluted effect of restricted share units, restricted stock shares andperformance-based restricted share units 78,917 157,401 150,777 189,923
Weighted average common shares outstanding - diluted 19,420,471 10,306,043 19,480,183 10,299,539
Diluted income (loss) per common share:
Income from continuing operations $ 1.25 $ 7.24 $ 1.66 $ 12.91Loss from discontinued operations (7.10) (0.08) (7.14) (0.22)
Net (loss) income $ (5.85) $ 7.16 $ (5.48) $ 12.69
22

Table of ContentsCONTURA ENERGY, INC. AND SUBSIDIARIES
Notes to Condensed Consolidated Financial Statements(Unaudited, amounts in thousands except share and per share data)
( 7 ) Inventories, net
Inventories, net consisted of the following:
June 30, 2019 December 31, 2018
Raw coal $ 34,288 $ 33,607Saleable coal 104,141 63,767Materials, supplies and other, net 25,874 24,591
Total inventories, net $ 164,303 $ 121,965
( 8 ) Goodwill and Acquired Intangibles
Goodwill
In connection with the Merger, the Company recorded provisional goodwill. Refer to Note 2 for information on goodwill.
Acquired Intangibles
The Company has recognized assets for acquired above market-priced coal supply agreements and acquired mine permits and liabilities for acquired belowmarket-priced coal supply agreements. The coal supply agreements were valued based on the present value of the difference between the expected net contractualcash flows based on the stated contract terms, and the estimated net contractual cash flows derived from applying forward market prices at the Merger oracquisition date for new contracts of similar terms and conditions. The acquired mine permits were valued based on the replacement cost and lost profits method asof the Merger date. The balances and respective balance sheet classifications of such assets and liabilities as of June 30, 2019 and December 31, 2018, net ofaccumulated amortization, are set forth in the following tables:
June 30, 2019
Assets (1) Liabilities (2) Net TotalCoal supply agreements, net $ 3,923 $ (14,402) $ (10,479)Acquired mine permits, net 142,631 — 142,631Total $ 146,554 $ (14,402) $ 132,152
December 31, 2018
Assets (1) Liabilities (2) Net TotalCoal supply agreements, net $ 4,687 $ (33,912) $ (29,225)Acquired mine permits, net 149,897 — 149,897Total $ 154,584 $ (33,912) $ 120,672
(1) Included within other acquired intangibles, net of accumulated amortization on the Company’s Condensed Consolidated Balance Sheets.(2) Included within other non-current liabilities on the Company’s Condensed Consolidated Balance Sheets.
The acquired mine permits are amortized over the estimated life of the associated mine. The coal supply agreement assets and liabilities are amortized over theactual number of tons shipped over the life of each contract. Amortization of mine permits acquired as a result of the Merger was $5,664 and $11,605 for the threeand six months ended June 30, 2019 which is reported within amortization of acquired intangibles, net in the Condensed Consolidated Statements of Operations.Amortization of above-market coal supply agreements was $122 and $1,104 , and amortization of below-market coal supply agreements was ($6,129) and $0 ,resulting in a net (income) expense of ($6,007) and $1,104 for the three months ended June 30, 2019 and 2018, respectively, which is reported within amortizationof acquired intangibles, net in the Condensed Consolidated Statements of Operations. Amortization of above-market coal supply agreements was $879 and $11,310, and amortization of below-market coal supply agreements was ($19,510) and $0 , resulting in a net (income) expense of ($18,631) and $11,310 for the six monthsended June 30, 2019 and 2018, respectively, which is reported within amortization of acquired intangibles, net in the Condensed Consolidated Statements ofOperations.
23

Table of ContentsCONTURA ENERGY, INC. AND SUBSIDIARIES
Notes to Condensed Consolidated Financial Statements(Unaudited, amounts in thousands except share and per share data)
( 9 ) Leases
Subsequent to the adoption of ASC 842, the Company recognizes right of use assets and lease liabilities on the balance sheet for all leases with a term longerthan 12 months. The discount rates used to determine the present value of the lease assets and liabilities are based on the Company’s incremental borrowing rate atthe lease commencement date and commensurate with the remaining lease term. For leases with a term of 12 months or less, no right of use assets or liabilities arerecognized on the balance sheet and the Company recognizes the lease expense on a straight-line basis over the lease term. Additionally, the Company recognizesvariable lease payments as an expense in the period incurred.
The Company’s lease population consists primarily of vehicle and heavy equipment leases and leases for office equipment. The Company’s building and landleases relate to corporate office space and certain site offices. The Company determines whether a contract contains a lease based on whether the Company obtainsthe right to control the use of specifically identifiable property, plant, and equipment for a period of time in exchange for consideration. For the six months endedJune 30, 2019 the Company identified no instances requiring significant judgment in determining whether any contract entered into during the period were or werenot leases. Additionally, the Company had no material sublease agreements within the scope of ASC 842 or lease agreements for which the Company was thelessor for the six months ended June 30, 2019 .
Renewal options in the Company’s lease population primarily relate to month-to-month extensions on vehicle leases and are immaterial both individually andin the aggregate. The Company includes renewal options that are reasonably certain to be exercised in the measurement lease liabilities. As of June 30, 2019 , theCompany does not intend to exercise any termination options on existing leases.
As of June 30, 2019 , the Company had the following right-of-use assets and lease liabilities within the Company’s Condensed Consolidated Balance Sheets:
June 30, 2019
Assets Balance Sheet Classification Financing lease assets Property, plant, and equipment, net $ 11,134Operating lease right-of-use assets Other non-current assets 9,525Total lease assets $ 20,659
Liabilities Balance Sheet Classification Financing lease liabilities - current Current portion of long-term debt $ 3,038Operating lease liabilities - current Accrued expenses and other current liabilities 2,091Financing lease liabilities - long-term Long-term debt 5,649Operating lease liabilities - long-term Other non-current liabilities 7,434Total lease liabilities $ 18,212
Total lease costs and other lease information for the three and six months ended June 30, 2019 included the following:
Three Months Ended June 30,
2019 Six Months Ended June 30,
2019
Lease cost (1) Finance lease cost: Amortization of leased assets $ 1,013 $ 1,653 Interest on lease liabilities 214 258Operating lease cost 191 1,330Short-term lease cost 541 980
Total lease cost $ 1,959 $ 4,221(1) The Company had no variable lease costs or sublease income for the six months ended June 30, 2019 .
24
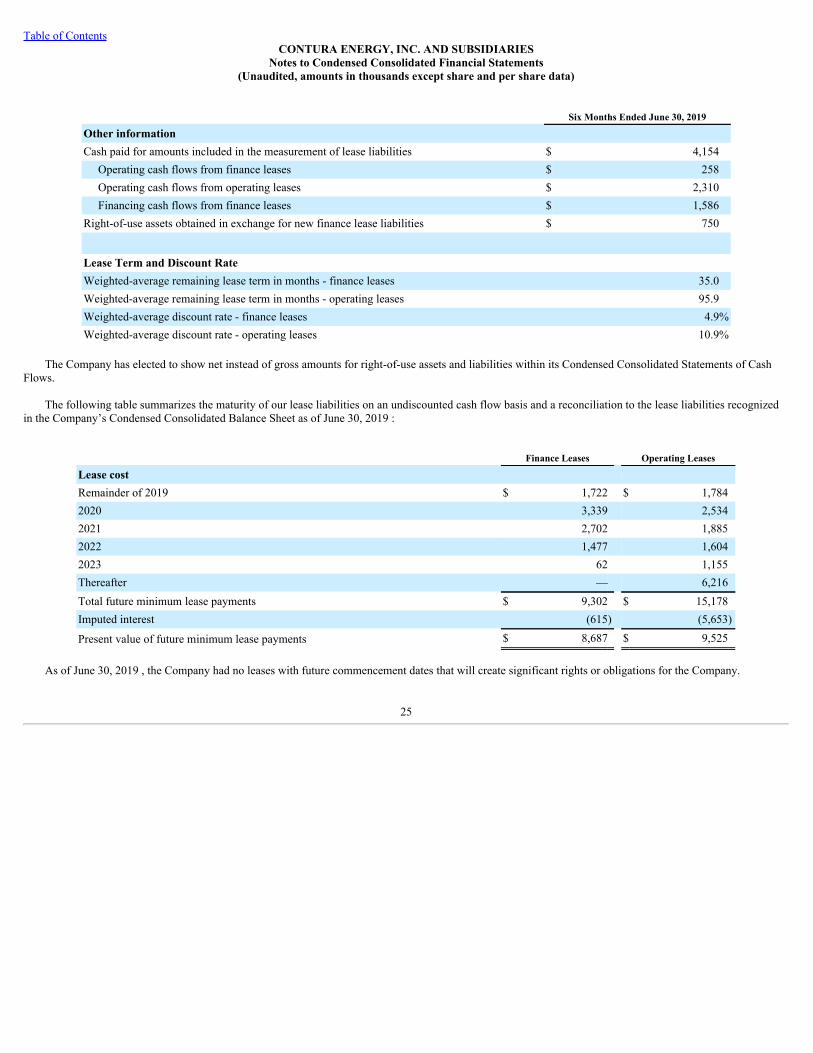
Table of ContentsCONTURA ENERGY, INC. AND SUBSIDIARIES
Notes to Condensed Consolidated Financial Statements(Unaudited, amounts in thousands except share and per share data)
Six Months Ended June 30, 2019
Other information Cash paid for amounts included in the measurement of lease liabilities $ 4,154 Operating cash flows from finance leases $ 258 Operating cash flows from operating leases $ 2,310 Financing cash flows from finance leases $ 1,586Right-of-use assets obtained in exchange for new finance lease liabilities $ 750
Lease Term and Discount Rate Weighted-average remaining lease term in months - finance leases 35.0Weighted-average remaining lease term in months - operating leases 95.9Weighted-average discount rate - finance leases 4.9%Weighted-average discount rate - operating leases 10.9%
The Company has elected to show net instead of gross amounts for right-of-use assets and liabilities within its Condensed Consolidated Statements of CashFlows.
The following table summarizes the maturity of our lease liabilities on an undiscounted cash flow basis and a reconciliation to the lease liabilities recognizedin the Company’s Condensed Consolidated Balance Sheet as of June 30, 2019 :
Finance Leases Operating Leases
Lease cost Remainder of 2019 $ 1,722 $ 1,7842020 3,339 2,5342021 2,702 1,8852022 1,477 1,6042023 62 1,155Thereafter — 6,216Total future minimum lease payments $ 9,302 $ 15,178Imputed interest (615) (5,653)
Present value of future minimum lease payments $ 8,687 $ 9,525
As of June 30, 2019 , the Company had no leases with future commencement dates that will create significant rights or obligations for the Company.
25
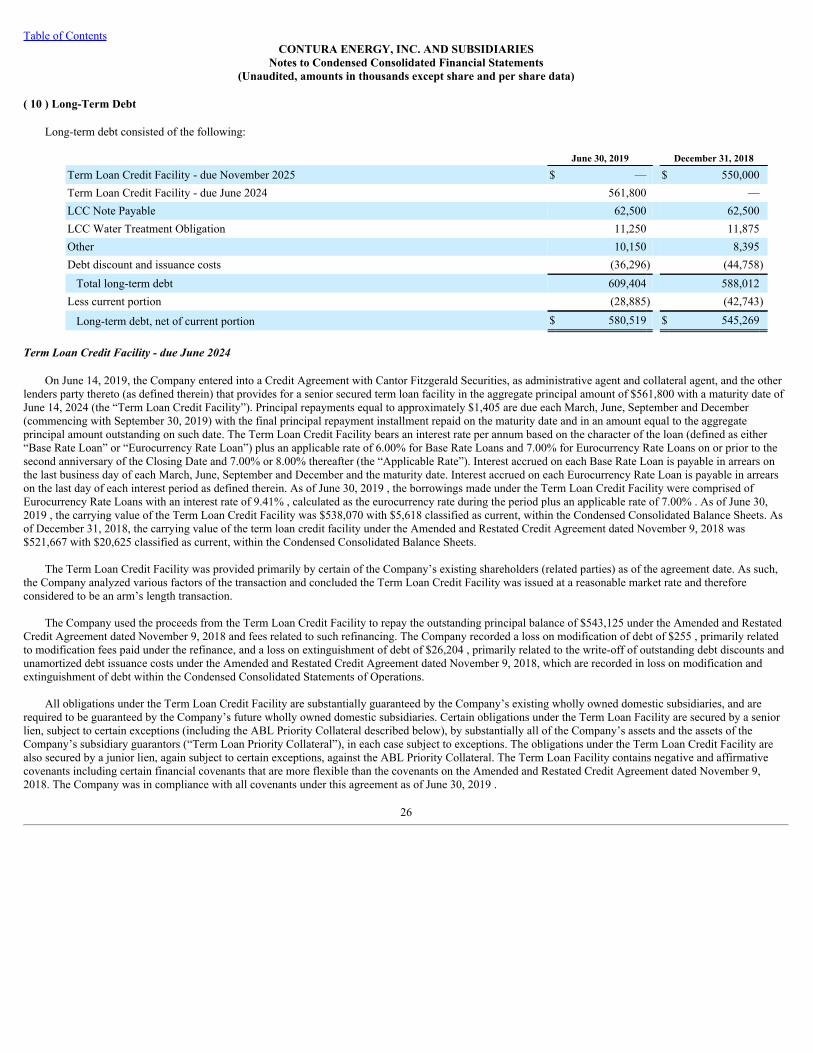
Table of ContentsCONTURA ENERGY, INC. AND SUBSIDIARIES
Notes to Condensed Consolidated Financial Statements(Unaudited, amounts in thousands except share and per share data)
( 10 ) Long-Term Debt
Long-term debt consisted of the following:
June 30, 2019 December 31, 2018
Term Loan Credit Facility - due November 2025 $ — $ 550,000Term Loan Credit Facility - due June 2024 561,800 —LCC Note Payable 62,500 62,500LCC Water Treatment Obligation 11,250 11,875Other 10,150 8,395Debt discount and issuance costs (36,296) (44,758)
Total long-term debt 609,404 588,012Less current portion (28,885) (42,743)
Long-term debt, net of current portion $ 580,519 $ 545,269
Term Loan Credit Facility - due June 2024
On June 14, 2019, the Company entered into a Credit Agreement with Cantor Fitzgerald Securities, as administrative agent and collateral agent, and the otherlenders party thereto (as defined therein) that provides for a senior secured term loan facility in the aggregate principal amount of $561,800 with a maturity date ofJune 14, 2024 (the “Term Loan Credit Facility”). Principal repayments equal to approximately $1,405 are due each March, June, September and December(commencing with September 30, 2019) with the final principal repayment installment repaid on the maturity date and in an amount equal to the aggregateprincipal amount outstanding on such date. The Term Loan Credit Facility bears an interest rate per annum based on the character of the loan (defined as either“Base Rate Loan” or “Eurocurrency Rate Loan”) plus an applicable rate of 6.00% for Base Rate Loans and 7.00% for Eurocurrency Rate Loans on or prior to thesecond anniversary of the Closing Date and 7.00% or 8.00% thereafter (the “Applicable Rate”). Interest accrued on each Base Rate Loan is payable in arrears onthe last business day of each March, June, September and December and the maturity date. Interest accrued on each Eurocurrency Rate Loan is payable in arrearson the last day of each interest period as defined therein. As of June 30, 2019 , the borrowings made under the Term Loan Credit Facility were comprised ofEurocurrency Rate Loans with an interest rate of 9.41% , calculated as the eurocurrency rate during the period plus an applicable rate of 7.00% . As of June 30,2019 , the carrying value of the Term Loan Credit Facility was $538,070 with $5,618 classified as current, within the Condensed Consolidated Balance Sheets. Asof December 31, 2018, the carrying value of the term loan credit facility under the Amended and Restated Credit Agreement dated November 9, 2018 was$521,667 with $20,625 classified as current, within the Condensed Consolidated Balance Sheets.
The Term Loan Credit Facility was provided primarily by certain of the Company’s existing shareholders (related parties) as of the agreement date. As such,the Company analyzed various factors of the transaction and concluded the Term Loan Credit Facility was issued at a reasonable market rate and thereforeconsidered to be an arm’s length transaction.
The Company used the proceeds from the Term Loan Credit Facility to repay the outstanding principal balance of $543,125 under the Amended and RestatedCredit Agreement dated November 9, 2018 and fees related to such refinancing. The Company recorded a loss on modification of debt of $255 , primarily relatedto modification fees paid under the refinance, and a loss on extinguishment of debt of $26,204 , primarily related to the write-off of outstanding debt discounts andunamortized debt issuance costs under the Amended and Restated Credit Agreement dated November 9, 2018, which are recorded in loss on modification andextinguishment of debt within the Condensed Consolidated Statements of Operations.
All obligations under the Term Loan Credit Facility are substantially guaranteed by the Company’s existing wholly owned domestic subsidiaries, and arerequired to be guaranteed by the Company’s future wholly owned domestic subsidiaries. Certain obligations under the Term Loan Facility are secured by a seniorlien, subject to certain exceptions (including the ABL Priority Collateral described below), by substantially all of the Company’s assets and the assets of theCompany’s subsidiary guarantors (“Term Loan Priority Collateral”), in each case subject to exceptions. The obligations under the Term Loan Credit Facility arealso secured by a junior lien, again subject to certain exceptions, against the ABL Priority Collateral. The Term Loan Facility contains negative and affirmativecovenants including certain financial covenants that are more flexible than the covenants on the Amended and Restated Credit Agreement dated November 9,2018. The Company was in compliance with all covenants under this agreement as of June 30, 2019 .
26

Table of ContentsCONTURA ENERGY, INC. AND SUBSIDIARIES
Notes to Condensed Consolidated Financial Statements(Unaudited, amounts in thousands except share and per share data)
Amended and Restated Asset-Based Revolving Credit Agreement
As of June 30, 2019 , the Company had no borrowings and $39,474 letters of credit outstanding under the senior secured asset-based revolving credit facility(the “ABL Facility”).
The Amended and Restated Asset-Based Revolving Credit Agreement, as amended, and related documents contain negative and affirmative covenantsincluding certain financial covenants. The Company was in compliance with all covenants under these agreements as of June 30, 2019 .
LCC Note Payable
The Lexington Coal Company (“LCC”) Note Payable has no stated interest rate and an imputed interest rate of 12.45% . The carrying value of the LCC NotePayable was $52,641 and $49,361 , with $17,500 and $17,500 reported within the current portion of long-term debt as of June 30, 2019 and December 31, 2018,respectively.
LCC Water Treatment Stipulation
The LCC Water Treatment Stipulation has no stated interest rate and an imputed interest rate of 13.12% . The carrying value of the LCC Water TreatmentStipulation was $8,543 and $8,589 , with $2,500 and $1,875 reported within the current portion of long-term debt as of June 30, 2019 and December 31, 2018,respectively.
Finance Leases
The Company entered into financing leases for certain property and other equipment during 2019 and 2018 . The Company’s liability for financing leases was$8,687 and $6,423 , with $3,038 and $2,110 reported within the current portion of long-term debt as of June 30, 2019 and December 31, 2018 , respectively.Financing leases are included in the other line item in the table above. Refer to Note 9 for additional information on leases.
( 11 ) Acquisition-Related Obligations
Acquisition-related obligations consisted of the following:
June 30, 2019 December 31, 2018
Contingent Revenue Obligation $ 58,941 $ 59,880Environmental Settlement Obligations 19,305 19,306Reclamation Funding Liability 22,000 22,000Retiree Committee VEBA Funding Settlement Liability 1,000 3,500UMWA Funds Settlement Liability 6,000 6,000Discount (7,137) (10,356)
Total acquisition-related obligations - long-term 100,109 100,330Less current portion (33,060) (27,334)
Acquisition-related obligations, net of current portion $ 67,049 $ 72,996
Contingent Revenue Obligation
As of June 30, 2019 and December 31, 2018 the carrying value of the Contingent Revenue Obligation was $58,941 and $59,880 , with $15,708 and $9,459classified as current, respectively, classified as an acquisition-related obligation in the Condensed Consolidated Balance Sheets. Refer to Note 13 for furtherdisclosures related to the fair value assignment and methods used.
During the second quarter of 2019, the Company paid $9,627 pursuant to terms of the Contingent Revenue Obligation.
Environmental Settlement Obligations
27

Table of ContentsCONTURA ENERGY, INC. AND SUBSIDIARIES
Notes to Condensed Consolidated Financial Statements(Unaudited, amounts in thousands except share and per share data)
As of June 30, 2019 and December 31, 2018, the carrying value of the Environmental Settlement Obligations was $15,748 and $14,768 , net of discounts of$3,557 and $4,538 , with $4,437 and $3,375 classified as current, respectively, all of which was classified as an acquisition-related obligation in the CondensedConsolidated Balance Sheets.
Reclamation Funding Agreement
As of June 30, 2019 and December 31, 2018, the carrying value of the Funding of Restricted Cash Reclamation liability was $19,856 and $18,106 , net ofdiscounts of $2,144 and $3,894 , with $10,000 and $10,000 classified as current, respectively, all of which was classified as an acquisition-related obligation in theCondensed Consolidated Balance Sheets.
( 12 ) Asset Retirement Obligations
The following table summarizes the changes in asset retirement obligations for the six months ended June 30, 2019 :
Total asset retirement obligations at December 31, 2018 $ 228,448Measurement-period adjustments (1) 12,718Accretion for the period 13,065Revisions in estimated cash flows (43)Expenditures for the period (11,114)Total asset retirement obligations at June 30, 2019 243,074Less current portion (25,244)
Long-term portion $ 217,830(1) Refer to Note 2 for additional information on the Merger and related measurement-period adjustments recorded during the six months ended June 30, 2019 .
Refer to Note 3 for detail on the $146,921 increase in asset retirement obligations within discontinued operations due to the Blackjewel Chapter 11 bankruptcyfiling. Additionally, refer to Note 19 for further details within subsequent event disclosures.
( 13 ) Fair Value of Financial Instruments and Fair Value Measurements
The estimated fair values of financial instruments are determined based on relevant market information. These estimates involve uncertainty and cannot bedetermined with precision.
The carrying amounts for cash and cash equivalents, trade accounts receivable, net, prepaid expenses and other current assets, short-term and long-termrestricted cash, short-term and long-term deposits, trade accounts payable, and accrued expenses and other current liabilities approximate fair value as of June 30,2019 and December 31, 2018 due to the short maturity of these instruments.
The following tables set forth by level, within the fair value hierarchy, the Company’s long-term debt at fair value as of June 30, 2019 and December 31, 2018:
June 30, 2019
Carrying
Amount (1) Total FairValue
Quoted Pricesin ActiveMarkets(Level 1)
SignificantOther
ObservableInputs(Level 2)
SignificantUnobservable
Inputs(Level 3)
Term Loan Credit Facility - due June 2024 $ 538,070 $ 560,396 $ 560,396 $ — $ —LCC Note Payable 52,641 52,029 — — 52,029LCC Water Treatment Obligation 8,543 8,475 — — 8,475
Total long-term debt $ 599,254 $ 620,900 $ 560,396 $ — $ 60,504
28

Table of ContentsCONTURA ENERGY, INC. AND SUBSIDIARIES
Notes to Condensed Consolidated Financial Statements(Unaudited, amounts in thousands except share and per share data)
December 31, 2018
Carrying
Amount (1) Total FairValue
Quoted Pricesin ActiveMarkets(Level 1)
SignificantOther
ObservableInputs(Level 2)
SignificantUnobservable
Inputs(Level 3)
Term Loan Credit Facility - due November 2025 $ 521,667 $ 540,375 $ 540,375 $ — $ —LCC Note Payable 49,361 50,606 — — 50,606LCC Water Treatment Obligation 8,589 8,827 — — 8,827
Total long-term debt $ 579,617 $ 599,808 $ 540,375 $ — $ 59,433(1) Net of debt discounts and debt issuance costs.
The following tables set forth by level, within the fair value hierarchy, the Company’s acquisition-related obligations at fair value as of June 30, 2019 andDecember 31, 2018 :
June 30, 2019
Carrying
Amount (1) Total Fair Value
Quoted Prices in Active Markets (Level 1)
SignificantOther
Observable Inputs (Level 2)
Significant Unobservable
Inputs (Level 3)
Retiree Committee VEBA Funding Settlement Liability $ 915 $ 933 $ — $ — $ 933UMWA Funds Settlement Liability 4,649 4,900 — — 4,900Reclamation Funding Liability 19,856 20,260 — — 20,260Environmental Settlement Obligations 15,748 15,528 — — 15,528
Total acquisition-related obligations $ 41,168 $ 41,621 $ — $ — $ 41,621
December 31, 2018
Carrying
Amount (1) Total Fair Value
Quoted Prices in Active Markets (Level 1)
SignificantOther
Observable Inputs (Level 2)
Significant Unobservable
Inputs (Level 3)
Retiree Committee VEBA Funding Settlement Liability $ 3,337 $ 3,391 $ — $ — $ 3,391UMWA Funds Settlement Liability 4,239 4,729 — — 4,729Reclamation Funding Liability 18,106 19,362 — — 19,362Environmental Settlement Obligations 14,768 14,936 — — 14,936
Total acquisition-related obligations $ 40,450 $ 42,418 $ — $ — $ 42,418(1) Net of discounts.
The following table sets forth by level, within the fair value hierarchy, the Company’s financial and non-financial assets and liabilities that were accounted forat fair value on a recurring basis as of June 30, 2019 and December 31, 2018 . Financial and non-financial assets and liabilities are classified in their entirety basedon the lowest level of input that is significant to the fair value measurement. The Company’s assessment of the significance of a particular input to the fair valuemeasurement requires judgment, and may affect the determination of fair value for assets and liabilities and their placement within the fair value hierarchy levels.
June 30, 2019
Total Fair Value
Quoted Pricesin Active Markets
(Level 1)
Significant Other
Observable Inputs (Level 2)
SignificantUnobservableInputs (Level 3)
Contingent Revenue Obligation $ 58,941 $ — $ — $ 58,941
29

Table of ContentsCONTURA ENERGY, INC. AND SUBSIDIARIES
Notes to Condensed Consolidated Financial Statements(Unaudited, amounts in thousands except share and per share data)
December 31, 2018
Total Fair Value
Quoted Pricesin Active Markets
(Level 1)
Significant Other
Observable Inputs (Level 2)
SignificantUnobservableInputs (Level 3)
Contingent Revenue Obligation $ 59,880 $ — $ — $ 59,880
The following table is a reconciliation of the financial and non-financial assets and liabilities that were accounted for at fair value on a recurring basis and thatwere categorized within Level 3 of the fair value hierarchy:
December 31,
2018 Payments Measurement Period
Adjustments (1) Loss Recognized in
Earnings
Transfer In (Out) ofLevel 3 Fair Value
Hierarchy June 30, 2019
Contingent Revenue Obligation $ 59,880 $ (9,627) $ 5,738 $ 2,950 $ — $ 58,941(1) Refer to Note 2 for additional information on the Merger and related measurement-period adjustments recorded during the six months ended June 30, 2019.
The following methods and assumptions were used to estimate the fair values of the assets and liabilities in the tables above:
Level 1 Fair Value Measurements
Term Loan Credit Facility - due June 2024 and Term Loan Credit Facility - due November 2025 - The fair value is based on observable market data.
Level 3 Fair Value Measurements
LCC Note Payable, LCC Water Treatment Obligation, Retiree Committee VEBA Funding Settlement Liability, UMWA Funds Settlement Liability,Environmental Settlement Obligations and Reclamation Funding Liability - Observable transactions are not available to aid in determining the fair value of theseitems. Therefore, the fair value was derived by using the expected present value approach in which estimated cash flows are discounted using a risk-free interestrate adjusted for market risk.
Contingent Revenue Obligation - The fair value of the contingent revenue obligation was estimated using a Black-Scholes pricing model and is marked tomarket at each reporting period with changes in value reflected in earnings. The inputs included in the Black-Scholes pricing model are the Company's forecastedfuture revenue, the stated royalty rate, the remaining periods in the obligation; annual risk-free interest rate based on the US Constant Maturity Treasury Curve andannualized volatility. The annualized volatility was calculated by observing volatilities for comparable companies with adjustments for the Company's size andleverage.
Acquisition accounting - The Company accounts for business combinations under the acquisition method of accounting. The total cost of acquisitions isallocated to the underlying identifiable net tangible and intangible assets based on their respective estimated fair values. Determining the fair value of assetsacquired and liabilities assumed requires management’s judgment, the utilization of independent valuation experts and often involves the use of significantestimates and assumptions with respect to the timing and amounts of future cash inflows and outflows, discount rates, market prices and asset lives, among otheritems. A combination of income, market and cost approaches are used for the valuation where appropriate, depending on the assets or liabilities being valued. Thevaluation inputs in these models and analyses give consideration to market participant assumptions.
( 14 ) Income Taxes
For the six months ended June 30, 2019 , the Company recorded income tax benefit of $5,778 on income from continuing operations before income taxes of$26,512 . The income tax benefit differs from the expected statutory amount primarily due to the impact of the percentage depletion allowance, the permanentimpact of stock-based compensation deductions, and the
30

Table of ContentsCONTURA ENERGY, INC. AND SUBSIDIARIES
Notes to Condensed Consolidated Financial Statements(Unaudited, amounts in thousands except share and per share data)
reduction in the valuation allowance. As of June 30, 2019 , the Company anticipates that no current federal income tax liability will be generated in 2019. For thesix months ended June 30, 2018 , the Company recorded income tax expense of $121 on income from continuing operations before income taxes of $133,063 . Theincome tax expense differs from the expected statutory amount primarily due to the impact of the percentage depletion allowance and the reduction in the valuationallowance, partially offset by the impact of state income taxes, net of federal tax impact.
During the six months ended June 30, 2019 , the Company recorded an increase of $12,387 to its deferred tax asset valuation allowance, which consists of a$2,089 reduction recorded to continuing operations and a $14,476 increase recorded to discontinued operations. The Company currently is relying primarily on thereversal of taxable temporary differences, along with consideration of taxable income via carryback to prior years and tax planning strategies, to support therealization of deferred tax assets. For each reporting period, the Company updates its assessment regarding the realizability of its deferred tax assets, includingscheduling the reversal of its deferred tax assets and liabilities, to determine the amount of valuation allowance needed. Scheduling the reversal of deferred taxasset and liability balances requires judgment and estimation. The Company believes the deferred tax liabilities relied upon as future taxable income in itsassessment will reverse in the same period and jurisdiction and are of the same character as the temporary differences giving rise to the deferred tax assets that willbe realized. The valuation allowance recorded represents the portion of deferred tax assets for which the Company is unable to support realization through themethods described above.
( 15 ) Employee Benefit Plans
The Company provides several types of benefits for its employees, including postemployment life insurance, defined benefit and defined contribution pensionplans, and workers’ compensation and black lung benefits. The Company does not participate in any multi-employer plans. The components of net periodic(benefit) expense other than the service cost component for pension, black lung, and life insurance benefits are included in the line item miscellaneous loss, net inthe Condensed Consolidated Statements of Operations.
Pension
The following table details the components of the net periodic (benefit) expense for pension obligations:
Three Months Ended June 30, Six Months Ended June 30, 2019 2019
Interest cost $ 6,677 $ 13,293Expected return on plan assets (7,015) (14,021)Amortization of net actuarial loss 190 398
Net periodic benefit $ (148) $ (330)
As the Company assumed these pension obligations in connection with the Merger, there was no net periodic (benefit) expense for the three and six monthsended June 30, 2018 .
Black Lung
The following table details the components of the net periodic (benefit) expense for black lung obligations:
Three Months Ended June 30, Six Months Ended June 30,
2019 2018 2019 2018
Service cost $ 403 $ 192 $ 807 $ 388Interest cost 909 175 1,819 347Expected return on plan assets (16) — (32) —Amortization of net actuarial loss 45 52 90 100
Net periodic expense $ 1,341 $ 419 $ 2,684 $ 835
Life Insurance Benefits
31

Table of ContentsCONTURA ENERGY, INC. AND SUBSIDIARIES
Notes to Condensed Consolidated Financial Statements(Unaudited, amounts in thousands except share and per share data)
The following table details the components of the net periodic (benefit) expense for life insurance benefit obligations:
Three Months Ended June 30, Six Months Ended June 30,
2019 2018 2019 2018
Interest cost $ 106 $ 97 $ 212 $ 194Amortization of net actuarial gain (26) (11) (52) (22)
Net periodic expense $ 80 $ 86 $ 160 $ 172
Defined Contribution and Profit Sharing Plans
The Company sponsors defined contribution plans to assist its eligible employees in providing for retirement. Generally, under the terms of these plans,employees make voluntary contributions through payroll deductions and the Company makes matching and/or discretionary contributions, as defined by each plan.The Company’s total contributions to these plans for the three months ended June 30, 2019 and 2018 was $3,767 and $1,475 , respectively. The Company’s totalcontributions to these plans for the six months ended June 30, 2019 and 2018 was $19,303 and $6,986 , respectively.
Self-Insured Medical Plan
The Company is self-insured for health insurance coverage for all of its active employees. Estimated liabilities for health and medical claims are recordedbased on the Company’s historical experience and include a component for incurred but not paid claims. During the three months ended June 30, 2019 and 2018 ,the Company incurred total expenses of $18,859 and $6,866 , respectively, which primarily includes claims processed and an estimate for claims incurred but notpaid. During the six months ended June 30, 2019 and 2018 , the Company incurred total expenses of $37,897 and $14,028 , respectively, which primarily includesclaims processed and an estimate for claims incurred but not paid.
( 16 ) Related Party Transactions
On June 14, 2019, the Company entered into a Credit Agreement which provides for the Term Loan Credit Facility as provided by a group of existingshareholders as of the agreement date. Refer to Note 10 for additional disclosures.
On July 19, 2019, the U.S. Bankruptcy Court approved debtor-in-possession (“DIP”) financing of $2,900 with DIP lenders, Highbridge Capital Management,LLC and Whitebox Advisors LLC, which are existing shareholders of the Company. The Company entered into an arrangement on July 19, 2019 to purchase theobligations under the DIP financing at the request of the lenders thereunder pursuant to certain terms and conditions. Refer to Note 19 for further details withinsubsequent event disclosures.
There were no other material related party transactions for the six months ended June 30, 2019 .
( 17 ) Commitments and Contingencies
(a) General
Estimated losses from loss contingencies are accrued by a charge to income when information available indicates that it is probable that an asset has beenimpaired or a liability has been incurred and the amount of the loss can be reasonably estimated.
If a loss contingency is not probable or reasonably estimable, disclosure of the loss contingency is made in the Condensed Consolidated Financial Statementswhen it is at least reasonably possible that a loss may be incurred and that the loss could be material.
(b) Commitments and Contingencies
Commitments
The Company leases coal mining and other equipment under long-term financing and operating leases with varying terms. Refer to Note 9 for furtherinformation on leases. In addition, the Company leases mineral interests and surface rights from land owners under various terms and royalty rates.
32

Table of ContentsCONTURA ENERGY, INC. AND SUBSIDIARIES
Notes to Condensed Consolidated Financial Statements(Unaudited, amounts in thousands except share and per share data)
Coal royalty expense was $27,305 and $7,770 for the three months ended June 30, 2019 and 2018. Coal royalty expense was $51,251 and $13,743 for the sixmonths ended June 30, 2019 and 2018.
Other Commitments
The Company has obligations under certain coal purchase agreements that contain minimum quantities to be purchased in the remainder of 2019 and 2020totaling an estimated $253,145 and $13,200 , respectively, which includes an estimated $50,400 in the remainder of 2019 related to contractually committedvariable priced tons from vendors with historical performance resulting in less than 20% of the committed tonnage being delivered. The Company has obligationsunder certain coal transportation agreements that contain minimum quantities to be shipped in the remainder of 2019 and 2020 totaling $2,058 and $10,906 ,respectively. The Company also has obligations under certain equipment purchase agreements that contain minimum quantities to be purchased in the remainder of2019 and 2020, totaling $42,005 and $2,134 , respectively.
Contingencies
Extensive regulation of the impacts of mining on the environment and of maintaining workplace safety has had and is expected to continue to have asignificant effect on the Company’s costs of production and results of operations. Further regulations, legislation or litigation in these areas may also cause theCompany’s sales or profitability to decline by increasing costs or by hindering the Company’s ability to continue mining at existing operations or to permit newoperations.
During the normal course of business, contract-related matters arise between the Company and its customers. When a loss related to such matters is consideredprobable and can reasonably be estimated, the Company records a liability.
Per terms of the Back-to-Back Coal Supply Agreements, the Company is required to purchase and sell coal in the remainder of 2019 and 2020 totaling $8,338and $9,175 , respectively. For the three months ended June 30, 2019 and 2018, the Company purchased and sold 352 and 1,486 tons, respectively, totaling $3,861and $16,590 , respectively, under the Back-to-Back Coal Supply Agreements. For the six months ended June 30, 2019 and 2018, the Company purchased and sold721 and 4,650 tons, respectively, totaling $7,742 and $50,339 , respectively, under the Back-to-Back Coal Supply Agreements. On July 1, 2019, Blackjewelannounced a Chapter 11 bankruptcy filing. Refer to Note 19 for further details within subsequent event disclosures. If the Company’s purchase of the PRBoperations is approved, the Company is expected to retain the contracts that were formally treated as Back-to-Back Coal Supply Agreements.
In October 2018, the State of Wyoming Department of Revenue invoiced Blackjewel for approximately $7,800 in severance taxes owed by Blackjewel inconnection with the Wyoming properties it previously acquired from the Company. In connection with this invoice, the Department purported to assert liens overContura Coal West, LLC, one of the Company’s subsidiaries. The Company believes that neither the Company nor its subsidiary is obligated to pay theseseverance taxes. On October 28, 2018, Blackjewel entered into a payment plan agreement with the State of Wyoming Department of Revenue to address theseverance taxes owed by Blackjewel. On July 1, 2019, Blackjewel announced a Chapter 11 bankruptcy filing. Refer to Note 19 for further details withinsubsequent event disclosures.
Future Federal Income Tax Refunds
As of June 30, 2019 , the Company has recorded $68,774 of federal income tax receivable and $68,774 of federal deferred tax asset related to AMT Credits. Inaddition, the Company has recorded a non-current federal income tax receivable of $43,770 related to an NOL carryback claim. Because the federal governmentwas a creditor in the Alpha Natural Resources, Inc. (“Predecessor Alpha”) bankruptcy proceedings, it is possible that the federal government could withhold someor all of the tax refund attributable to the NOL carryback claim and the refundable AMT Credits and assert a right to setoff the tax refund and refundable creditsagainst its prepetition bankruptcy claims.
(c) Guarantees and Financial Instruments with Off-Balance Sheet Risk
In the normal course of business, the Company is a party to certain guarantees and financial instruments with off-balance sheet risk, such as bank letters ofcredit, performance or surety bonds, and other guarantees and indemnities related to the obligations of affiliated entities which are not reflected in the Company’sCondensed Consolidated Balance Sheets. However, the underlying liabilities that they secure, such as asset retirement obligations, workers’ compensationliabilities, and royalty obligations, are reflected in the Company’s Condensed Consolidated Balance Sheets.
33

Table of ContentsCONTURA ENERGY, INC. AND SUBSIDIARIES
Notes to Condensed Consolidated Financial Statements(Unaudited, amounts in thousands except share and per share data)
The Company is required to provide financial assurance in order to perform the post-mining reclamation required by its mining permits, pay its federalproduction royalties, pay workers’ compensation claims under workers’ compensation laws in various states, pay federal black lung benefits, and perform certainother obligations. In order to provide the required financial assurance, the Company generally uses surety bonds for post-mining reclamation and workers’compensation obligations. The Company can also use bank letters of credit to collateralize certain obligations.
As of June 30, 2019 , the Company had outstanding surety bonds with a total face amount of $580,284 to secure various obligations and commitments,including $237,310 related to the PRB. To secure the Company’s reclamation-related obligations, the Company currently has $114,776 of collateral supportingthese obligations. As the permits associated with the PRB Transaction have not transferred due to the Blackjewel Chapter 11 bankruptcy filing on July 1, 2019, theCompany no longer anticipates the related restricted cash and deposits will be returned in the near term to operating cash. Refer to Note 19 for further detailswithin subsequent event disclosures.
Amounts included in restricted cash represent cash deposits that are restricted as to withdrawal as required by certain agreements entered into by the Companyand provide collateral in the amounts of $95,721 , $31,230 , $87,909 , $28,752 , and $2,833 as of June 30, 2019 for securing the Company’s obligations undercertain worker’s compensation, black lung, reclamation-related obligations, general liabilities, and financial guarantees, respectively, which have been written onthe Company’s behalf. Additionally, the Company has $4,431 of short-term restricted cash held in escrow related to the Company’s contingent revenue obligation.Refer to Note 11 for further information regarding the contingent revenue obligation. The Company’s restricted cash is primarily invested in interest bearingaccounts. This restricted cash is classified as both short-term and long-term on the Company’s Condensed Consolidated Balance Sheets.
Amounts included in restricted investments consist of certificates of deposit, corporate bonds, and U.S. treasury bills that are restricted as to withdrawal asrequired by certain agreements entered into by the Company and provide collateral in the amounts of $2,528 and $15,315 as of June 30, 2019 for securing theCompany’s obligations under certain worker’s compensation and reclamation-related obligations, respectively, which have been written on the Company’s behalf.These restricted investments are classified as long-term on the Company’s Condensed Consolidated Balance Sheets.
Deposits represent cash deposits held at third parties as required by certain agreements entered into by the Company to provide cash collateral. At June 30,2019 , the Company had cash collateral in the form of deposits in the amounts of $11,553 and $11,855 to secure the Company’s obligations under reclamation-related obligations and various other operating agreements, respectively. These deposits are classified as both short-term and long-term on the Company’sCondensed Consolidated Balance Sheets.
As of June 30, 2019 , the Company had real property collateralizing $26,749 of reclamation bonds.
The Company meets frequently with its surety providers and has discussions with certain providers regarding the extent of and the terms of their participationin the program. These discussions may cause the Company to shift surety bonds between providers or to alter the terms of their participation in our program. To theextent that surety bonds become unavailable or the Company’s surety bond providers require additional collateral, the Company would seek to secure itsobligations with letters of credit, cash deposits or other suitable forms of collateral. The Company’s failure to maintain, or inability to acquire, surety bonds or toprovide a suitable alternative would have a material adverse effect on its liquidity. These failures could result from a variety of factors including lack ofavailability, higher cost or unfavorable market terms of new surety bonds, and the exercise by third-party surety bond issuers of their right to refuse to renew thesurety.
Letters of Credit
As of June 30, 2019 , the Company had $39,474 letters of credit outstanding under the Amended and Restated Asset-Based Revolving Credit Agreement.Additionally, as of June 30, 2019 , the Company had $135,746 letters of credit outstanding under the Amended and Restated Letter of Credit Agreement datedNovember 9, 2018 between ANR, Inc. and Citibank, N.A. and $613 letters of credit outstanding under the Credit and Security Agreement dated June 30, 2017, andrelated amendments, between ANR, Inc. and First Tennessee Bank National Association.
(d) Legal Proceedings
The Company is party to legal proceedings from time to time. These proceedings, as well as governmental examinations,
34
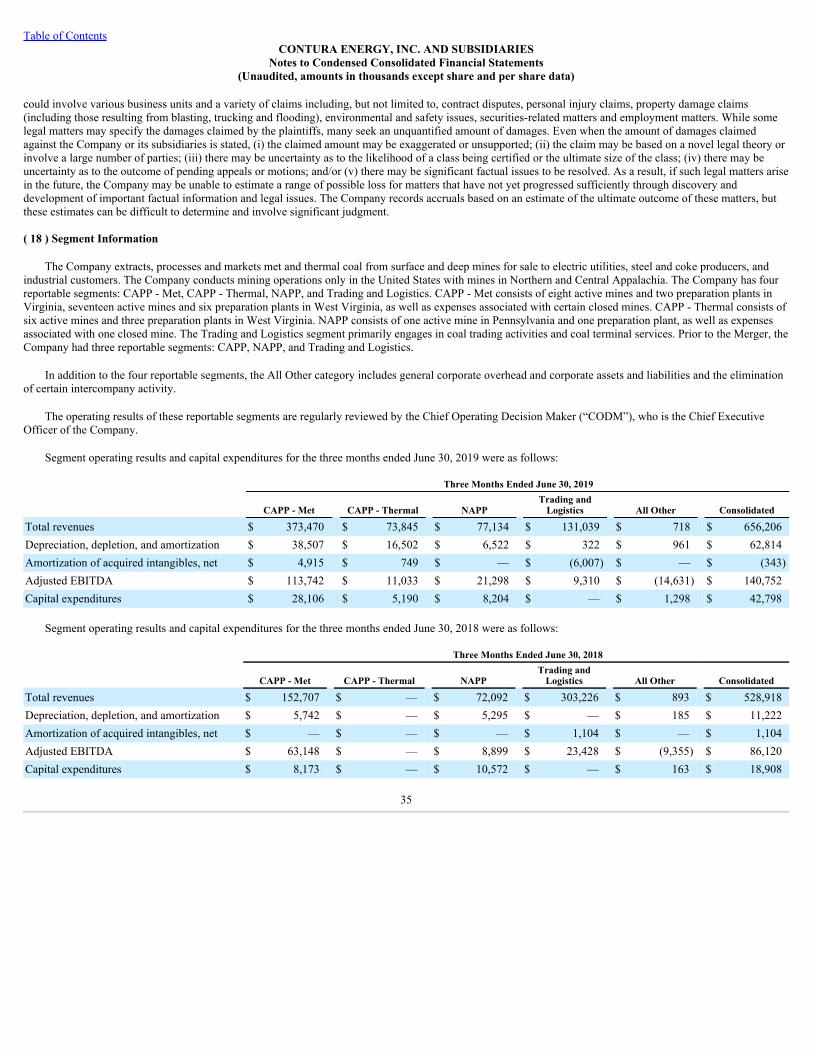
Table of ContentsCONTURA ENERGY, INC. AND SUBSIDIARIES
Notes to Condensed Consolidated Financial Statements(Unaudited, amounts in thousands except share and per share data)
could involve various business units and a variety of claims including, but not limited to, contract disputes, personal injury claims, property damage claims(including those resulting from blasting, trucking and flooding), environmental and safety issues, securities-related matters and employment matters. While somelegal matters may specify the damages claimed by the plaintiffs, many seek an unquantified amount of damages. Even when the amount of damages claimedagainst the Company or its subsidiaries is stated, (i) the claimed amount may be exaggerated or unsupported; (ii) the claim may be based on a novel legal theory orinvolve a large number of parties; (iii) there may be uncertainty as to the likelihood of a class being certified or the ultimate size of the class; (iv) there may beuncertainty as to the outcome of pending appeals or motions; and/or (v) there may be significant factual issues to be resolved. As a result, if such legal matters arisein the future, the Company may be unable to estimate a range of possible loss for matters that have not yet progressed sufficiently through discovery anddevelopment of important factual information and legal issues. The Company records accruals based on an estimate of the ultimate outcome of these matters, butthese estimates can be difficult to determine and involve significant judgment.
( 18 ) Segment Information
The Company extracts, processes and markets met and thermal coal from surface and deep mines for sale to electric utilities, steel and coke producers, andindustrial customers. The Company conducts mining operations only in the United States with mines in Northern and Central Appalachia. The Company has fourreportable segments: CAPP - Met, CAPP - Thermal, NAPP, and Trading and Logistics. CAPP - Met consists of eight active mines and two preparation plants inVirginia, seventeen active mines and six preparation plants in West Virginia, as well as expenses associated with certain closed mines. CAPP - Thermal consists ofsix active mines and three preparation plants in West Virginia. NAPP consists of one active mine in Pennsylvania and one preparation plant, as well as expensesassociated with one closed mine. The Trading and Logistics segment primarily engages in coal trading activities and coal terminal services. Prior to the Merger, theCompany had three reportable segments: CAPP, NAPP, and Trading and Logistics.
In addition to the four reportable segments, the All Other category includes general corporate overhead and corporate assets and liabilities and the eliminationof certain intercompany activity.
The operating results of these reportable segments are regularly reviewed by the Chief Operating Decision Maker (“CODM”), who is the Chief ExecutiveOfficer of the Company.
Segment operating results and capital expenditures for the three months ended June 30, 2019 were as follows:
Three Months Ended June 30, 2019
CAPP - Met CAPP - Thermal NAPP Trading andLogistics All Other Consolidated
Total revenues $ 373,470 $ 73,845 $ 77,134 $ 131,039 $ 718 $ 656,206Depreciation, depletion, and amortization $ 38,507 $ 16,502 $ 6,522 $ 322 $ 961 $ 62,814Amortization of acquired intangibles, net $ 4,915 $ 749 $ — $ (6,007) $ — $ (343)Adjusted EBITDA $ 113,742 $ 11,033 $ 21,298 $ 9,310 $ (14,631) $ 140,752Capital expenditures $ 28,106 $ 5,190 $ 8,204 $ — $ 1,298 $ 42,798
Segment operating results and capital expenditures for the three months ended June 30, 2018 were as follows:
Three Months Ended June 30, 2018
CAPP - Met CAPP - Thermal NAPP Trading andLogistics All Other Consolidated
Total revenues $ 152,707 $ — $ 72,092 $ 303,226 $ 893 $ 528,918Depreciation, depletion, and amortization $ 5,742 $ — $ 5,295 $ — $ 185 $ 11,222Amortization of acquired intangibles, net $ — $ — $ — $ 1,104 $ — $ 1,104Adjusted EBITDA $ 63,148 $ — $ 8,899 $ 23,428 $ (9,355) $ 86,120Capital expenditures $ 8,173 $ — $ 10,572 $ — $ 163 $ 18,908
35
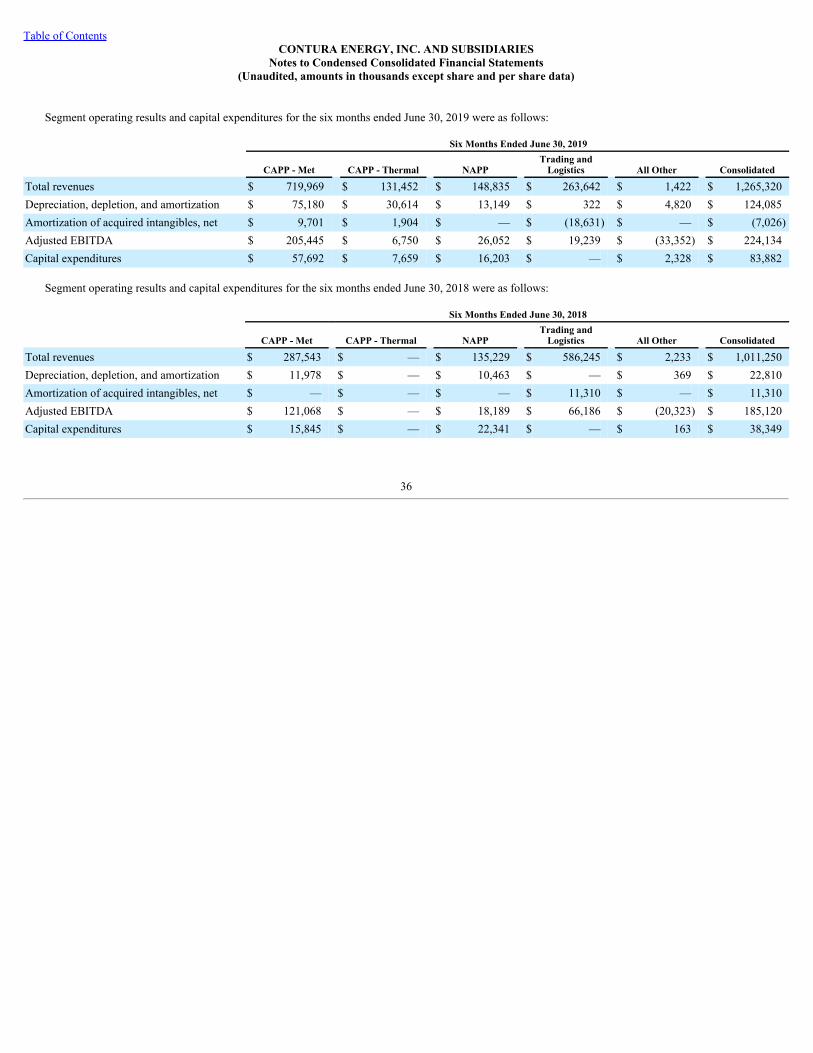
Table of ContentsCONTURA ENERGY, INC. AND SUBSIDIARIES
Notes to Condensed Consolidated Financial Statements(Unaudited, amounts in thousands except share and per share data)
Segment operating results and capital expenditures for the six months ended June 30, 2019 were as follows:
Six Months Ended June 30, 2019
CAPP - Met CAPP - Thermal NAPP Trading andLogistics All Other Consolidated
Total revenues $ 719,969 $ 131,452 $ 148,835 $ 263,642 $ 1,422 $ 1,265,320Depreciation, depletion, and amortization $ 75,180 $ 30,614 $ 13,149 $ 322 $ 4,820 $ 124,085Amortization of acquired intangibles, net $ 9,701 $ 1,904 $ — $ (18,631) $ — $ (7,026)Adjusted EBITDA $ 205,445 $ 6,750 $ 26,052 $ 19,239 $ (33,352) $ 224,134Capital expenditures $ 57,692 $ 7,659 $ 16,203 $ — $ 2,328 $ 83,882
Segment operating results and capital expenditures for the six months ended June 30, 2018 were as follows:
Six Months Ended June 30, 2018
CAPP - Met CAPP - Thermal NAPP Trading andLogistics All Other Consolidated
Total revenues $ 287,543 $ — $ 135,229 $ 586,245 $ 2,233 $ 1,011,250Depreciation, depletion, and amortization $ 11,978 $ — $ 10,463 $ — $ 369 $ 22,810Amortization of acquired intangibles, net $ — $ — $ — $ 11,310 $ — $ 11,310Adjusted EBITDA $ 121,068 $ — $ 18,189 $ 66,186 $ (20,323) $ 185,120Capital expenditures $ 15,845 $ — $ 22,341 $ — $ 163 $ 38,349
36

Table of ContentsCONTURA ENERGY, INC. AND SUBSIDIARIES
Notes to Condensed Consolidated Financial Statements(Unaudited, amounts in thousands except share and per share data)
The following table presents a reconciliation of net income (loss) to Adjusted EBITDA for the three months ended June 30, 2019 :
Three Months Ended June 30, 2019
CAPP - Met CAPP - Thermal NAPP Trading andLogistics All Other Consolidated
Net income (loss) from continuing operations $ 60,890 $ (8,895) $ 13,771 $ 14,673 $ (56,139) $ 24,300Interest expense 194 6 — — 15,877 16,077Interest income (4) — (11) — (1,870) (1,885)Income tax benefit — — — — (1,000) (1,000)Depreciation, depletion and amortization 38,507 16,502 6,522 322 961 62,814Merger related costs — — — — 156 156Non-cash stock compensation expense 54 5 — 322 (927) (546)Mark-to-market adjustment - acquisition-related obligations — — — — 1,014 1,014Accretion on asset retirement obligations 2,327 2,666 1,016 — 838 6,847Loss on modification and extinguishment ofdebt — — — — 26,459 26,459Asset impairment (1) 5,826 — — — — 5,826Cost impact of coal inventory fair valueadjustment (2) 1,033 — — — — 1,033Amortization of acquired intangibles, net 4,915 749 — (6,007) — (343)
Adjusted EBITDA $ 113,742 $ 11,033 $ 21,298 $ 9,310 $ (14,631) $ 140,752(1) Asset impairment primarily related to the write-off of prepaid purchased coal from Blackjewel as a result of Blackjewel’s Chapter 11 bankruptcy filing on July1, 2019. Refer to Note 19 for further details within subsequent event disclosures.(2) The cost impact of the coal inventory fair value adjustment as a result of the Alpha Merger is expected to have short-term impact.
37

Table of ContentsCONTURA ENERGY, INC. AND SUBSIDIARIES
Notes to Condensed Consolidated Financial Statements(Unaudited, amounts in thousands except share and per share data)
The following table presents a reconciliation of net income (loss) to Adjusted EBITDA for the three months ended June 30, 2018 :
Three Months Ended June 30, 2018
CAPP - Met CAPP - Thermal NAPP Trading andLogistics All Other Consolidated
Net income (loss) from continuing operations $ 73,140 $ — $ 3,090 $ 22,342 $ (23,930) $ 74,642Interest expense 3 — (417) — 9,193 8,779Interest income (6) — (10) (18) (157) (191)Income tax expense — — — — 55 55Depreciation, depletion and amortization 5,742 — 5,295 — 185 11,222Merger related costs — — — — 3,423 3,423Non-cash stock compensation expense — — — — 1,876 1,876Gain on sale of disposal group (1) (16,386) — — — — (16,386)Accretion on asset retirement obligations 655 — 941 — — 1,596Amortization of acquired intangibles, net — — — 1,104 — 1,104
Adjusted EBITDA $ 63,148 $ — $ 8,899 $ 23,428 $ (9,355) $ 86,120(1) During the fourth quarter of 2017, the Company entered into an asset purchase agreement to sell a disposal group (comprised of property, plant and equipmentand associated asset retirement obligations) within the CAPP - Met segment. From the date the Company entered into the asset purchase agreement through thetransaction close date, the property, plant and equipment and associated asset retirement obligations were classified as held for sale in amounts representing the fairvalue of the disposal group. Upon permit transfer, the transaction closed on April 2, 2018. The Company paid $10,000 in connection with the transaction, whichwas paid into escrow on March 27, 2018 and transferred to the buyer at the transaction close date, and expects to pay a series of additional cash payments in theaggregate amount of $1,500 , per the terms stated in the agreement, and recorded a gain on sale of $16,386 within other expenses (income) within the CondensedConsolidated Statements of Operations.
38

Table of ContentsCONTURA ENERGY, INC. AND SUBSIDIARIES
Notes to Condensed Consolidated Financial Statements(Unaudited, amounts in thousands except share and per share data)
The following table presents a reconciliation of net income (loss) to Adjusted EBITDA for the six months ended June 30, 2019 :
Six Months Ended June 30, 2019
CAPP - Met CAPP - Thermal NAPP Trading andLogistics All Other Consolidated
Net income (loss) from continuing operations $ 114,025 $ (34,024) $ 10,892 $ 36,940 $ (95,543) $ 32,290Interest expense 222 10 1 — 30,999 31,232Interest income (8) — (23) — (3,790) (3,821)Income tax benefit — — — — (5,778) (5,778)Depreciation, depletion and amortization 75,180 30,614 13,149 322 4,820 124,085Merger related costs — — — — 987 987Non-cash stock compensation expense 171 57 — 608 3,889 4,725Mark-to-market adjustment - acquisition-related obligations — — — — 2,950 2,950Accretion on asset retirement obligations 4,660 4,731 2,033 — 1,655 13,079Loss on modification and extinguishment ofdebt — — — — 26,459 26,459Asset impairment (1) 5,826 — — — — 5,826Cost impact of coal inventory fair valueadjustment (2) 4,751 3,458 — — — 8,209Gain on assets acquired in an exchangetransaction (3) (9,083) — — — — (9,083)Amortization of acquired intangibles, net 9,701 1,904 — (18,631) — (7,026)
Adjusted EBITDA $ 205,445 $ 6,750 $ 26,052 $ 19,239 $ (33,352) $ 224,134(1) Asset impairment primarily related to the write-off of prepaid purchased coal from Blackjewel as a result of Blackjewel’s Chapter 11 bankruptcy filing on July1, 2019. Refer to Note 19 for further details within subsequent event disclosures.(2) The cost impact of the coal inventory fair value adjustment as a result of the Alpha Merger is expected to have short-term impact.(3) During the six months ended June 30, 2019 , the Company entered into an exchange transaction which primarily included the release of the PRB overridingroyalty interest owed to the Company in exchange for met coal reserves which resulted in a gain of $9,083 .
39

Table of ContentsCONTURA ENERGY, INC. AND SUBSIDIARIES
Notes to Condensed Consolidated Financial Statements(Unaudited, amounts in thousands except share and per share data)
The following table presents a reconciliation of net income (loss) to Adjusted EBITDA for the six months ended June 30, 2018 :
Six Months Ended June 30, 2018
CAPP - Met CAPP - Thermal NAPP Trading andLogistics All Other Consolidated
Net income (loss) from continuing operations $ 123,000 $ — $ 6,205 $ 54,894 $ (51,157) $ 132,942Interest expense 312 — (349) — 18,021 17,984Interest income (10) — (12) (18) (282) (322)Income tax expense — — — — 121 121Depreciation, depletion and amortization 11,978 — 10,463 — 369 22,810Merger related costs — — — — 3,883 3,883Management restructuring costs (1) — — — — 2,659 2,659Non-cash stock compensation expense — — — — 6,355 6,355Gain on settlement of acquisition-relatedobligations — — — — (292) (292)Gain on sale of disposal group (2) (16,386) — — — — (16,386)Accretion on asset retirement obligations 2,174 — 1,882 — — 4,056Amortization of acquired intangibles, net — — — 11,310 — 11,310
Adjusted EBITDA $ 121,068 $ — $ 18,189 $ 66,186 $ (20,323) $ 185,120(1) Management restructuring costs are related to severance expense associated with senior management changes in the six months ended June 30, 2018 .(2) During the fourth quarter of 2017, the Company entered into an asset purchase agreement to sell a disposal group (comprised of property, plant and equipmentand associated asset retirement obligations) within the CAPP - Met segment. From the date the Company entered into the asset purchase agreement through thetransaction close date, the property, plant and equipment and associated asset retirement obligations were classified as held for sale in amounts representing the fairvalue of the disposal group. Upon permit transfer, the transaction closed on April 2, 2018. The Company paid $10,000 in connection with the transaction, whichwas paid into escrow on March 27, 2018 and transferred to the buyer at the transaction close date, and expects to pay a series of additional cash payments in theaggregate amount of $1,500 , per the terms stated in the agreement, and recorded a gain on sale of $16,386 within other expenses (income) within the CondensedConsolidated Statements of Operations.
No asset information has been provided for these reportable segments as the CODM does not regularly review asset information by reportable segment.
The Company markets produced, processed and purchased coal to customers in the United States and in international markets, primarily India, Brazil, Turkey,France, and Netherlands. Export coal revenues were the following:
Three Months Ended June 30, Six Months Ended June 30,
2019 2018 2019 2018
Total coal revenues $ 653,828 $ 525,168 $ 1,260,788 $ 1,003,533Export coal revenues (1) $ 362,838 $ 461,490 $ 706,144 $ 883,045Export coal revenues as % of total coal revenues 55% 88% 56% 88%
40

Table of ContentsCONTURA ENERGY, INC. AND SUBSIDIARIES
Notes to Condensed Consolidated Financial Statements(Unaudited, amounts in thousands except share and per share data)
(1) The amounts for the three months ended June 30, 2019 include $71,991 of export coal revenues from external customers in India, recorded within the CAPP -Met, CAPP - Thermal, NAPP, and Trading and Logistics segments. The amounts for the three months ended June 30, 2018 include $123,131 , $91,599 , and$53,367 of export coal revenues from external customers in India, Brazil, and France, respectively, recorded within the CAPP - Met, NAPP, and Trading andLogistics segments. The amounts for the six months ended June 30, 2019 include $197,589 of export coal revenues from external customers in India, recordedwithin the CAPP - Met, CAPP - Thermal, NAPP, and Trading and Logistics segments. The amounts for the six months ended June 30, 2018 include $289,415 and$161,967 of export coal revenues from external customers in India and Brazil, respectively, recorded within the CAPP - Met, NAPP, and Trading and Logisticssegments. Revenue is tracked within the Company’s accounting records based on the product destination.
The Company sold 655 and 1,711 tons of coal purchased from third parties, excluding tons sold related to the Back-to-Back Coal Supply Agreements, for thethree months ended June 30, 2019 and 2018, respectively, representing approximately 10% and 39% , respectively, of total coal sales volume during such periods.The Company sold 1,375 and 3,233 tons of coal purchased from third parties, excluding tons sold related to the Back-to-Back Coal Supply Agreements, for the sixmonths ended June 30, 2019 and 2018, respectively, representing approximately 11% and 39% , respectively, of total coal sales volume during such periods. TheCompany purchased 1,196 and 2,295 tons of this coal from Alpha during the three and six months ended June 30, 2018 .
Additionally, one of the Company’s customers had an outstanding balance in excess of 10% of the total accounts receivable balance as of June 30, 2019 , andtwo of the Company’s customers had outstanding balances each in excess of 10% of the total accounts receivable balance as of December 31, 2018.
( 19 ) Subsequent Events
On July 1, 2019, Blackjewel announced that it and certain affiliated entities had filed voluntary petitions for reorganization under Chapter 11 of theBankruptcy Code in the U.S. Bankruptcy Court for the Southern District of West Virginia. Subsequently, on July 10, 2019, the Wyoming Environmental QualityCouncil (the “EQC”) stayed the transfer process of the still outstanding permits from Contura Coal West to Blackjewel to allow the EQC time to review thesedevelopments. The EQC has taken no additional action since July 10, 2019. On July 25, 2019, the Company announced that it would seek to serve as the stalkinghorse purchaser for certain assets offered for sale through Blackjewel’s bankruptcy proceedings, and on August 6, 2019, the federal bankruptcy judge in theSouthern District of West Virginia verbally approved the Company’s purchase of the Eagle Butte and Belle Ayr mines in Wyoming and the Pax Surface Mine inScarbro, West Virginia for $33,750 . Subject to the terms of the Company’s offer to purchase the Eagle Butte and Belle Ayr mines in Wyoming and the PaxSurface Mine, the Company made a purchase deposit of $8,100 on July 26, 2019 which will be applied to the purchase price in accordance with the preliminaryterm sheet. Pursuant to preliminary term sheet, the Company also expects to assume other obligations in connection with the purchase. Closing of the transaction issubject to the Company, Blackjewel’s debtor estate and additional relevant parties in the bankruptcy proceedings (including federal and state governmentalagencies) reaching an agreement as to the payment of certain pre-petition claims and entry of a final order by the court. There can be no assurance that a settlementamong the parties can be reached.
41
Table of Contents
GLOSSARY
Acquisition. Refers to the transaction by which Contura acquired certain of Alpha’s core coal operations as part of the Alpha Restructuring.
Alpha. Alpha Natural Resources, Inc.
Alpha Restructuring. The series of bankruptcy restructuring transactions which led to Alpha’s emergence from Chapter 11 bankruptcy on July 26, 2016.
Ash. Impurities consisting of iron, alumina and other incombustible matter that are contained in coal. Since ash increases the weight of coal, it adds to the costof handling and can affect the burning characteristics of coal.
Back-to-Back Coal Supply Agreement. An agreement with Blackjewel (the “Buyer”) under the terms of the asset purchase agreement associated with the saleof PRB under which the Buyer will supply, deliver and sell to the Company, and the Company will accept, purchase and pay for, all coal that the Company isobligated to supply, deliver and sell under PRB coal supply agreements existing as of the transaction closing date that did not transfer to the Buyer at closing.
British Thermal Unit or BTU. A measure of the thermal energy required to raise the temperature of one pound of pure liquid water one degree Fahrenheit atthe temperature at which water has its greatest density (39 degrees Fahrenheit).
Central Appalachia or CAPP. Coal producing area in eastern Kentucky, Virginia, southern West Virginia and a portion of eastern Tennessee.
Coal seam. Coal deposits occur in layers. Each layer is called a “seam.”
Coke. A hard, dry carbon substance produced by heating coal to a very high temperature in the absence of air. Coke is used in the manufacture of iron andsteel. Its production results in a number of useful byproducts.
Contura or Company. Contura Energy, Inc.
Metallurgical coal. The various grades of coal suitable for carbonization to make coke for steel manufacture. Also known as “met” coal, its quality dependson four important criteria: volatility, which affects coke yield; the level of impurities including sulfur and ash, which affect coke quality; composition, whichaffects coke strength; and basic characteristics, which affect coke oven safety. Met coal typically has a particularly high BTU but low ash and sulfur content.
Northern Appalachia or NAPP. Coal producing area in Maryland, Ohio, Pennsylvania and northern West Virginia.
Operating Margin. Coal revenues less cost of coal sales.
Powder River Basin or PRB. Coal producing area in northeastern Wyoming and southeastern Montana.
Predecessor. Contura on a carve-out basis using Predecessor Alpha’s historical basis and our assets, liabilities and operating results while they were underPredecessor Alpha’s ownership
Preparation plant. A preparation plant is a facility for crushing, sizing and washing coal to remove impurities and prepare it for use by a particular customer.The washing process has the added benefit of removing some of the coal’s sulfur content. A preparation plant is usually located on a mine site, although one plantmay serve several mines.
Probable reserves. Reserves for which quantity and grade and/or quality are computed from information similar to that used for proven reserves, but the sitesfor inspection, sampling and measurement are farther apart or are otherwise less adequately spaced. The degree of assurance, although lower than that for provenreserves, is high enough to assume continuity between points of observation.
Productivity. As used in this report, refers to clean metric tons of coal produced per underground man hour worked, as published by the MSHA.
Proven reserves. Reserves for which quantity is computed from dimensions revealed in outcrops, trenches, workings or drill holes; grade and/or quality arecomputed from the results of detailed sampling; and the sites for inspection, sampling and
42

Table of Contents
measurement are spaced so closely and the geologic character is so well defined that size, shape, depth and mineral content of reserves are well-established.
Reclamation. The process of restoring land and the environment to their original state following mining activities. The process commonly includes“recontouring” or reshaping the land to its approximate original appearance, restoring topsoil and planting native grass and ground covers. Reclamation operationsare usually underway before the mining of a particular site is completed. Reclamation is closely regulated by both state and federal law.
Reserve. That part of a mineral deposit that could be economically and legally extracted or produced at the time of the reserve determination.
Roof. The stratum of rock or other mineral above a coal seam; the overhead surface of a coal working place.
Sulfur. One of the elements present in varying quantities in coal that contributes to environmental degradation when coal is burned. Sulfur dioxide is producedas a gaseous by-product of coal combustion.
Surface mine. A mine in which the coal lies near the surface and can be extracted by removing the covering layer of soil.
Thermal coal. Coal used by power plants and industrial steam boilers to produce electricity, steam or both. It generally is lower in BTU heat content andhigher in volatile matter than metallurgical coal.
Tons. A “short” or net ton is equal to 2,000 pounds. A “long” or British ton is equal to 2,240 pounds; a “metric” ton (or “ tonne ”) is approximately 2,205pounds. Tonnage amounts in this prospectus are stated in short tons, unless otherwise indicated.
Underground mine. Also known as a “deep” mine. Usually located several hundred feet below the earth’s surface, an underground mine’s coal is removedmechanically and transferred by shuttle car and conveyor to the surface.
43

Table of Contents
Item 2. Management ’ s Discussion and Analysis of Financial Condition and Results of Operations
The following discussion and analysis provides a narrative of our results of operations and financial condition for the three and six months ended June 30,2019 and 2018 . The following discussion and analysis should be read in conjunction with our Condensed Consolidated Financial Statements and related notesincluded elsewhere in this Quarterly Report on Form 10-Q and our Consolidated Financial Statements and related notes and risk factors contained in our AnnualReport on Form 10-K for the year ended December 31, 2018.
Non-GAAP Financial Measures
The discussion below contains “non-GAAP financial measures.” These are financial measures which either exclude or include amounts that are not excludedor included in the most directly comparable measures calculated and presented in accordance with generally accepted accounting principles in the United States(“GAAP”). Specifically, we make use of the non-GAAP financial measure “Adjusted EBITDA” and “Adjusted Cost of Produced Coal Sold.” We use AdjustedEBITDA to measure the operating performance of our segments and allocate resources to the segments. Adjusted EBITDA does not purport to be an alternative tonet income (loss) as a measure of operating performance. We use Adjusted Cost of Produced Coal Sold to distinguish the cost of captive produced coal from theeffects of purchased coal, idle costs and acquisition accounting requirements. The presentation of these measures should not be considered in isolation, or as asubstitute for analysis of our results as reported under GAAP.
Management uses non-GAAP financial measures to supplement GAAP results to provide a more complete understanding of the factors and trends affectingthe business than GAAP results alone. The definition of these non-GAAP measures may be changed periodically by management to adjust for significant itemsimportant to an understanding of operating trends. Because not all companies use identical calculations, the presentations of these measures may not be comparableto other similarly titled measures of other companies and can differ significantly from company to company depending on long-term strategic decisions regardingcapital structure, the tax jurisdictions in which companies operate, and capital investments.
Included below are reconciliations of non-GAAP financial measures to GAAP financial measures.
Overview
We are a large-scale provider of met and thermal coal to a global customer base, operating high-quality, cost-competitive coal mines across two major U.S.coal basins (CAPP and NAPP) along with a robust Trading and Logistics business. As of June 30, 2019 , our operations consisted of thirty-two active mines andtwelve coal preparation and load-out facilities, with approximately 4,520 employees. We produce, process, and sell met coal and thermal coal from operationslocated in Virginia, West Virginia and Pennsylvania. We also sell coal produced by others, some of which is processed and/or blended with coal produced from ourmines prior to resale, with the remainder purchased for resale by our trading operations. As of December 31, 2018, we had 1.3 billion tons of reserves, including885.5 million tons of proven reserves and 462.9 million tons of probable reserves.
For the three months ended June 30, 2019 and 2018, sales of met coal were 3.4 million tons and 3.0 million tons, respectively, and accounted forapproximately 53.1% and 69.4%, respectively, of our coal sales volume. Sales of thermal coal were 3.0 million tons and 1.4 million tons, respectively, andaccounted for approximately 46.9% and 30.6%, respectively, of our coal sales volume. For the six months ended June 30, 2019 and 2018, sales of met coal were6.5 million tons and 5.5 million tons, respectively, and accounted for approximately 52.8% and 67.3%, respectively, of our coal sales volume. Sales of thermal coalwere 5.8 million tons and 2.7 million tons, respectively, and accounted for approximately 47.2% and 32.7%, respectively, of our coal sales volume. These resultsinclude sales from our Trading and Logistics business.
Our sales of met coal were made primarily to steel companies in the northeastern and midwestern regions of the United States and in several countries inEurope, Asia and the Americas. Our sales of thermal coal were made primarily to large utilities and industrial customers throughout the United States. For the threemonths ended June 30, 2019 and 2018 approximately 55.5% and 87.9%, respectively, of our total coal revenues were derived from coal sales made to customersoutside the United States. For the six months ended June 30, 2019 and 2018 approximately 56.0% and 88.0%, respectively, of our total coal revenues were derivedfrom coal sales made to customers outside the United States.
As of June 30, 2019 , we have four reportable segments: CAPP - Met, CAPP - Thermal, NAPP, and Trading and Logistics. Refer to Note 18 for additionaldisclosures on reportable segments including export coal revenue information.
Business Developments
44

Table of Contents
Merger with Alpha Natural Resources Holdings, Inc. and ANR, Inc.
Refer to Note 2 for information on Alpha Merger and terms of the Merger Agreement.
Sale of PRB Operations
Refer to Note 3 for disclosure information on discontinued operations.
On July 1, 2019, Blackjewel announced a Chapter 11 bankruptcy filing. Refer to Note 19 for further details within subsequent event disclosures.
Factors Affecting Our Results of Operations
Sales Volume. We earn revenues primarily through the sale of coal produced at our operations and resale of coal purchased from third parties. During the threemonths ended June 30, 2019 , we sold 3.4 million tons of met coal, including 0.4 million tons from our Trading and Logistics business, and 3.0 million tons ofthermal coal. During the three months ended June 30, 2018 , we sold 3.0 million tons of met coal, including 1.6 million tons from our Trading and Logisticsbusiness, and 1.4 million tons of thermal coal. During the six months ended June 30, 2019 , we sold 6.5 million tons of met coal, including 0.8 million tons fromour Trading and Logistics business, and 5.8 million tons of thermal coal, including 0.1 million tons from our Trading and Logistics business. During the six monthsended June 30, 2018 , we sold 5.5 million tons of met coal, including 3.1 million tons from our Trading and Logistics business, and 2.7 million tons of thermalcoal.
Sales Agreements
We manage our commodity price risk for coal sales through the use of coal supply agreements. As of August 5, 2019, we expect to ship on sales commitmentsof approximately 7.0 million tons of NAPP coal for 2019, 100% of which is priced at an average realized price per ton of $43.06, 11.8 million tons of CAPP - Metcoal for 2019, 72% of which is priced at an average realized price per ton of $124.46, and 4.5 million tons of CAPP - Thermal coal for 2019, 98% of which ispriced at an average realized price per ton of $58.61.
Realized Pricing . Our realized price per ton of coal is influenced by many factors that vary by region, including (i) coal quality, which includes energy (heatcontent), sulfur, ash, volatile matter and moisture content; (ii) differences in market conventions concerning transportation costs and volume measurement; and(iii) regional supply and demand.
• Coal Quality. The energy content or heat value of thermal coal is a significant factor influencing coal prices as higher energy coal is more desirable toconsumers and typically commands a higher price in the market. The heat value of coal is commonly measured in British thermal units or the amount ofheat needed to raise the temperature of one pound of water by one degree Fahrenheit. Coal from the eastern and midwest regions of the United Statestends to have a higher heat value than coal found in the western United States. Coal volatility is a significant factor influencing met coal pricing as coalwith a lower volatility has historically been more highly valued and typically commands a higher price in the market. The volatility refers to the loss inmass, less moisture, when coal is heated in the absence of air. The volatility of met coal determines the percentage of feed coal that actually becomescoke, known as coke yield, with lower volatility producing a higher coke yield.
• Market Conventions. Coal sales contracts are priced according to conventions specific to the market into which such coal is to be sold. Our domestic salescontracts are typically priced free on board (“FOB”) at our mines and on a short ton basis. Our international sales contracts are typically priced FOB at theshipping port from which such coal is delivered and on a metric ton basis. Accordingly, for international sales contracts, we typically bear the cost oftransportation from our mines to the applicable outbound shipping port, and our coal sales realization per ton calculation reflects the conversion of suchtonnage from metric tons into short tons, as well as the elimination of the freight and handling fulfillment component of coal sales revenue. In addition,for domestic sales contracts, as customers typically bear the cost of transportation from our mines, our operations located further away from the end userof the coal may command lower prices.
• Regional Supply and Demand. Our realized price per ton is influenced by market forces of the regional market into which such coal is to be sold. Marketpricing may vary according to region and lead to different discounts or premiums to the most directly comparable benchmark price for such coal product.
45

Table of Contents
Costs. Our results of operations are dependent upon our ability to improve productivity and control costs. Our primary expenses are for operating supply costs,repair and maintenance expenditures, cost of purchased coal, royalties, current wages and benefits, freight and handling costs and taxes incurred in selling our coal.Principal goods and services we use in our operations include maintenance and repair parts and services, electricity, fuel, roof control and support items,explosives, tires, conveyance structure, ventilation supplies and lubricants.
Our cost of coal sales includes idle and closed mine costs and purchased coal costs. Additionally due to the Merger, our cost of coal sales includes the costimpact of coal inventory fair value adjustments. In the following tables, we calculate adjusted cost of produced coal sold as cost of coal sales less idle and closedmine costs, cost impact of coal inventory fair value adjustments and purchased coal costs.
Three Months Ended June 30, 2019
(In thousands, except for per ton data) CAPP - Met CAPP - Thermal NAPP All Other
Cost of coal sales: Cost of produced coal sold $ 232,239 $ 58,738 $ 53,906 $ —Cost of purchased coal sold 24,406 2,443 — —Cost impact of coal inventory fair valueadjustment (1) 1,033 — — —Idle and closed mine costs 2,496 561 733 678
Total cost of coal sales $ 260,174 $ 61,742 $ 54,639 $ 678Tons sold 3,060 1,189 1,747 —Cost of coal sales per ton $ 85.02 $ 51.93 $ 31.28 $ —
Total cost of coal sales $ 260,174 $ 61,742 $ 54,639 $ 678Less: cost of purchased coal sold (24,406) (2,443) — —Less: cost impact of coal inventory fair valueadjustment (1,033) — — —Less: idle and closed mine costs (2,496) (561) (733) (678)Cost of produced coal sold $ 232,239 $ 58,738 $ 53,906 $ —Produced tons sold 2,819 1,144 1,747 —Cost of produced coal sold per ton $ 82.38 $ 51.34 $ 30.86 $ —
(1) The cost impact of the coal inventory fair value adjustment as a result of the Alpha Merger is expected to have short-term impact.
46

Table of Contents
Three Months Ended June 30, 2018
(In thousands, except for per ton data) CAPP - Met CAPP - Thermal NAPP All Other
Cost of coal sales: Cost of produced coal sold $ 79,778 $ — $ 62,514 $ —Cost of purchased coal sold 8,420 — — —Idle and closed mine costs 1,050 — 914 —
Total cost of coal sales $ 89,248 $ — $ 63,428 $ —Tons sold 1,184 — 1,572 —Cost of coal sales per ton $ 75.38 $ — $ 40.35 $ —
Total cost of coal sales $ 89,248 $ — $ 63,428 $ —Less: cost of purchased coal sold (8,420) — — —Less: idle and closed mine costs (1,050) — (914) —Cost of produced coal sold $ 79,778 $ — $ 62,514 $ —Produced tons sold 1,102 — 1,572 —Cost of produced coal sold per ton $ 72.39 $ — $ 39.77 $ —
Six Months Ended June 30, 2019
(In thousands, except for per ton data) CAPP - Met CAPP - Thermal NAPP All Other
Cost of coal sales: Cost of produced coal sold $ 458,276 $ 117,136 $ 119,964 $ —Cost of purchased coal sold 52,763 5,327 — —Cost impact of coal inventory fair valueadjustment (1) 4,751 3,458 — —Idle and closed mine costs 4,127 910 1,562 2,178
Total cost of coal sales $ 519,917 $ 126,831 $ 121,526 $ 2,178Tons sold 5,856 2,181 3,399 —Cost of coal sales per ton $ 88.78 $ 58.15 $ 35.75 $ —
Total cost of coal sales $ 519,917 $ 126,831 $ 121,526 $ 2,178Less: cost of purchased coal sold (52,763) (5,327) — —Less: cost impact of coal inventory fair valueadjustment (4,751) (3,458) — —Less: idle and closed mine costs (4,127) (910) (1,562) (2,178)Cost of produced coal sold $ 458,276 $ 117,136 $ 119,964 $ —Produced tons sold 5,390 2,088 3,399 —Cost of produced coal sold per ton $ 85.02 $ 56.10 $ 35.29 $ —
(1) The cost impact of the coal inventory fair value adjustment as a result of the Alpha Merger is expected to have short-term impact.
47

Table of Contents
Six Months Ended June 30, 2018
(In thousands, except for per ton data) CAPP - Met CAPP - Thermal NAPP All Other
Cost of coal sales: Cost of produced coal sold $ 146,491 $ — $ 115,518 $ —Cost of purchased coal sold 17,469 — — —Idle and closed mine costs 2,036 — 1,716 —
Total cost of coal sales $ 165,996 $ — $ 117,234 $ —Tons sold 2,138 — 2,986 —Cost of coal sales per ton $ 77.64 $ — $ 39.26 $ —
Total cost of coal sales $ 165,996 $ — $ 117,234 $ —Less: cost of purchased coal sold (17,469) — — —Less: idle and closed mine costs (2,036) — (1,716) —Cost of produced coal sold $ 146,491 $ — $ 115,518 $ —Produced tons sold 1,982 — 2,986 —Cost of produced coal sold per ton $ 73.91 $ — $ 38.69 $ —
Our management strives to aggressively control costs and improve operating performance to mitigate external cost pressures. We experience volatility inoperating costs related to fuel, explosives, steel, tires, contract services and healthcare, among others, and take measures to mitigate the increases in these costs atall operations. We have a centralized sourcing group for major supplier contract negotiation and administration, for the negotiation and purchase of major capitalgoods, and to support the business units. We promote competition between suppliers and seek to develop relationships with suppliers that focus on lowering ourcosts. We seek suppliers who identify and concentrate on implementing continuous improvement opportunities within their area of expertise. To the extent upwardpressure on costs exceeds our ability to realize sales increases, or if we experience unanticipated operating or transportation difficulties, our operating marginswould be negatively impacted. We may also experience difficult geologic conditions, delays in obtaining permits, labor shortages, unforeseen equipment problems,and unexpected shortages of critical materials such as tires, fuel and explosives that may result in adverse cost increases and limit our ability to produce atforecasted levels.
Results of Operations
Our results of operations for the three months ended June 30, 2019 and 2018 are discussed in these “Results of Operations” presented below.
Three Months Ended June 30, 2019 Compared to the Three Months Ended June 30, 2018
Revenues
The following table summarizes information about our revenues during the three months ended June 30, 2019 and 2018:
Three Months Ended June 30, Increase (Decrease)
(In thousands, except for per ton data) 2019 2018 $ or Tons %
Coal revenues $ 653,828 $ 525,168 $ 128,660 24.5 %Other revenues 2,378 3,750 (1,372) (36.6)%
Total revenues $ 656,206 $ 528,918 $ 127,288 24.1 %
Tons sold 6,365 4,385 1,980 45.2 %
Coal revenues. Coal revenues increased $128.7 million , or 24.5% , for the three months ended June 30, 2019 compared to the prior year period. The increasewas primarily due to higher coal sales volume of 2.0 million tons. Refer to the Coal Operations and Trading and Logistics Operations sections below for furtherdetail on coal revenues for the three months ended June 30, 2019 compared to the prior year period.
48
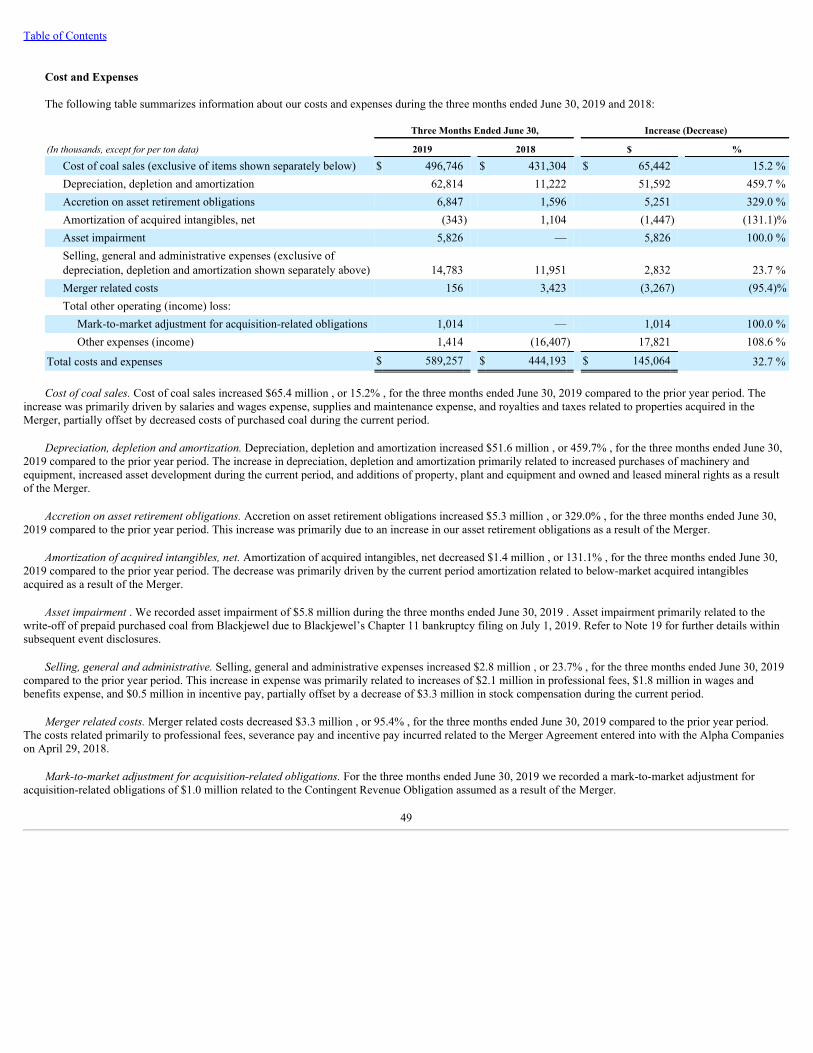
Table of Contents
Cost and Expenses
The following table summarizes information about our costs and expenses during the three months ended June 30, 2019 and 2018:
Three Months Ended June 30, Increase (Decrease)
(In thousands, except for per ton data) 2019 2018 $ %
Cost of coal sales (exclusive of items shown separately below) $ 496,746 $ 431,304 $ 65,442 15.2 %Depreciation, depletion and amortization 62,814 11,222 51,592 459.7 %Accretion on asset retirement obligations 6,847 1,596 5,251 329.0 %Amortization of acquired intangibles, net (343) 1,104 (1,447) (131.1)%Asset impairment 5,826 — 5,826 100.0 %Selling, general and administrative expenses (exclusive ofdepreciation, depletion and amortization shown separately above) 14,783 11,951 2,832 23.7 %Merger related costs 156 3,423 (3,267) (95.4)%Total other operating (income) loss:
Mark-to-market adjustment for acquisition-related obligations 1,014 — 1,014 100.0 %Other expenses (income) 1,414 (16,407) 17,821 108.6 %
Total costs and expenses $ 589,257 $ 444,193 $ 145,064 32.7 %
Cost of coal sales. Cost of coal sales increased $65.4 million , or 15.2% , for the three months ended June 30, 2019 compared to the prior year period. Theincrease was primarily driven by salaries and wages expense, supplies and maintenance expense, and royalties and taxes related to properties acquired in theMerger, partially offset by decreased costs of purchased coal during the current period.
Depreciation, depletion and amortization. Depreciation, depletion and amortization increased $51.6 million , or 459.7% , for the three months ended June 30,2019 compared to the prior year period. The increase in depreciation, depletion and amortization primarily related to increased purchases of machinery andequipment, increased asset development during the current period, and additions of property, plant and equipment and owned and leased mineral rights as a resultof the Merger.
Accretion on asset retirement obligations. Accretion on asset retirement obligations increased $5.3 million , or 329.0% , for the three months ended June 30,2019 compared to the prior year period. This increase was primarily due to an increase in our asset retirement obligations as a result of the Merger.
Amortization of acquired intangibles, net. Amortization of acquired intangibles, net decreased $1.4 million , or 131.1% , for the three months ended June 30,2019 compared to the prior year period. The decrease was primarily driven by the current period amortization related to below-market acquired intangiblesacquired as a result of the Merger.
Asset impairment . We recorded asset impairment of $5.8 million during the three months ended June 30, 2019 . Asset impairment primarily related to thewrite-off of prepaid purchased coal from Blackjewel due to Blackjewel’s Chapter 11 bankruptcy filing on July 1, 2019. Refer to Note 19 for further details withinsubsequent event disclosures.
Selling, general and administrative. Selling, general and administrative expenses increased $2.8 million , or 23.7% , for the three months ended June 30, 2019compared to the prior year period. This increase in expense was primarily related to increases of $2.1 million in professional fees, $1.8 million in wages andbenefits expense, and $0.5 million in incentive pay, partially offset by a decrease of $3.3 million in stock compensation during the current period.
Merger related costs. Merger related costs decreased $3.3 million , or 95.4% , for the three months ended June 30, 2019 compared to the prior year period.The costs related primarily to professional fees, severance pay and incentive pay incurred related to the Merger Agreement entered into with the Alpha Companieson April 29, 2018.
Mark-to-market adjustment for acquisition-related obligations. For the three months ended June 30, 2019 we recorded a mark-to-market adjustment foracquisition-related obligations of $1.0 million related to the Contingent Revenue Obligation assumed as a result of the Merger.
49

Table of Contents
Other expenses (income). Other income decreased by $17.8 million or 108.6% for the three months ended June 30, 2019 compared to the prior year period.During the three months ended June 30, 2018, we recorded a gain on disposal of assets of $16.5 million primarily related to the sale of a disposal group within theCompany’s CAPP - Met segment.
Other Income (Expense)
The following table summarizes information about our other income (expense) during the three months ended June 30, 2019 and 2018:
Three Months Ended June 30, Increase (Decrease)
(In thousands, except for per ton data) 2019 2018 $ %
Other income (expense): Interest expense $ (16,077) $ (8,779) $ (7,298) (83.1)%Interest income 1,885 191 1,694 886.9 %Loss on modification and extinguishment of debt (26,459) — (26,459) (100.0)%Equity loss in affiliates (2,475) (1,170) (1,305) (111.5)%Miscellaneous loss, net (523) (270) (253) (93.7)%
Total other expense, net $ (43,649) $ (10,028) $ (33,621) (335.3)%
Interest expense. Interest expense increased $7.3 million , or 83.1% , for the three months ended June 30, 2019 compared to the prior year period, primarilydue to higher interest rates and larger accretion of debt discounts related to the debt facilities in place during the current period. Refer to Note 10 for additionalinformation.
Loss on modification and extinguishment of debt. During the three months ended June 30, 2019 , we recorded a loss on modification of debt of $0.3 million ,primarily related to modification fees paid under the refinance, and a loss on extinguishment of debt of $26.2 million, primarily related to the write-off ofoutstanding debt discounts and unamortized debt issuance costs under the Amended and Restated Credit Agreement dated November 9, 2018. Refer to Note 10 foradditional information.
Income Tax Benefit (Expense)
The following table summarizes information about our income tax benefit (expense) during the three months ended June 30, 2019 and 2018:
Three Months Ended June 30, Increase (Decrease)
(In thousands, except for per ton data) 2019 2018 $ %
Income tax benefit (expense) $ 1,000 $ (55) $ 1,055 1,918.2%
Income taxes. Income tax benefit of $1.0 million was recorded for the three months ended June 30, 2019 on income from continuing operations before incometaxes of $23.3 million . The effective tax rate is lower than the federal statutory rate of 21% primarily due to the impact of the percentage depletion allowance, thepermanent impact of stock-based compensation deductions, and the reduction in the valuation allowance.
Income tax expense of $0.1 million was recorded for the three months ended June 30, 2018 on income from continuing operations before income taxes of$74.7 million . The effective tax rate is lower than the federal statutory rate of 21% primarily due to the impact of the percentage depletion allowance and thereduction in the valuation allowance, partially offset by the impact of state income taxes, net of federal tax impact. Refer to Note 14 for additional information.
Coal Operations
We extract, process and market met and thermal coal from surface and deep mines for sale to electric utilities, steel and coke producers, and industrialcustomers. The Company conducts mining operations only in the United States with mines in Northern and Central Appalachia.
50

Table of Contents
Our CAPP - Met operations consist of high-quality met coal mines, including Deep Mine 41 and Road Fork 52, which predominantly produce low-ash metcoal, including High-Vol. A, High-Vol. B, Mid-Vol., and Low-Vol., which are shipped to domestic and international coke and steel producers. While the CAPP -Met operations is predominantly met coal, it also produces some amounts of thermal coal as a byproduct of mining. CAPP - Met operations consist of eight activemines and two preparation plants in Virginia, seventeen active mines and six preparation plants in West Virginia, as well as expenses associated with certain closedmines.
Our CAPP - Thermal operations consist of surface and underground thermal coal mines primarily producing low sulfur, high BTU thermal coal for electricitygeneration, as well as specialty coal for industrial customers, with some met coal byproduct. CAPP - Thermal consists of six active mines and three preparationplants in West Virginia.
Our NAPP operations produce primarily high-BTU thermal coal. This thermal coal has metallurgical properties, but it is higher in sulfur content than typicalproducts sold in the metallurgical coal market. Limited volumes can be placed in the metallurgical coal market where customers have the flexibility toaccommodate quantities of higher sulfur coal in their coking coal blends. Our thermal coal is primarily sold to the domestic power generation industry. Our NAPPoperations consist of one active mine in Pennsylvania and one preparation plant, as well as expenses associated with one closed mine.
Our All Other category is not included in our Coal Operations results of operations as it includes general corporate overhead and corporate assets andliabilities and the elimination of certain intercompany activity.
The following tables summarize certain financial information relating to our coal operations for the three months ended June 30, 2019 and 2018:
Three Months Ended June 30, Increase (Decrease)
(In thousands, except for per ton data) 2019 2018 Tons %
Tons sold: CAPP - Met operations 3,060 1,184 1,876 158.4%CAPP - Thermal operations 1,189 — 1,189 100.0%NAPP operations 1,747 1,572 175 11.1%
Three Months Ended June 30, Increase (Decrease)
(In thousands, except for per ton data) 2019 2018 $ %
Coal revenues: CAPP - Met operations $ 372,863 $ 152,154 $ 220,709 145.1 %CAPP - Thermal operations $ 73,511 $ — $ 73,511 100.0 %NAPP operations $ 76,239 $ 70,708 $ 5,531 7.8 %
Coal sales realization per ton: CAPP - Met operations $ 121.85 $ 128.51 $ (6.66) (5.2)%CAPP - Thermal operations $ 61.83 $ — $ 61.83 100.0 %NAPP operations $ 43.64 $ 44.98 $ (1.34) (3.0)%Average $ 87.16 $ 80.86 $ 6.30 7.8 %
Coal revenues. CAPP - Met operations coal revenues increased $220.7 million , or 145.1% , for the three months ended June 30, 2019 compared to the prioryear period. The increase in CAPP - Met operations coal revenues was primarily due to higher coal sales volume of 1.9 million tons as a result of the Merger,partially offset by lower coal sales realization of $6.66 per ton.
CAPP - Thermal operations coal revenues were $73.5 million during the current year period. CAPP - Thermal operations coal revenues consisted of 1.2million tons sold at a coal sales realization of $61.83 per ton. The CAPP - Thermal operations were acquired as part of the Alpha Merger.
NAPP operations increased $5.5 million , or 7.8% , for the three months ended June 30, 2019 compared to the prior year period. The increase in NAPPoperations coal revenues was primarily due to higher coal sales volumes of 0.2 million tons, partially offset by lower coal sales realization of $1.34 per ton.
51

Table of Contents
Three Months Ended June 30, Increase (Decrease)
(In thousands, except for per ton data) 2019 2018 $ %
Cost of coal sales: CAPP - Met operations $ 260,174 $ 89,248 $ 170,926 191.5 %CAPP - Thermal operations $ 61,742 $ — $ 61,742 100.0 %NAPP operations $ 54,639 $ 63,428 $ (8,789) (13.9)%
Cost of coal sales per ton:
CAPP - Met operations $ 85.02 $ 75.38 $ 9.64 12.8 %CAPP - Thermal operations $ 51.93 $ — $ 51.93 100.0 %NAPP operations $ 31.28 $ 40.35 $ (9.07) (22.5)%
Coal margin per ton (1) :
CAPP - Met operations $ 36.83 $ 53.13 $ (16.30) (30.7)%CAPP - Thermal operations $ 9.90 $ — $ 9.90 100.0 %NAPP operations $ 12.36 $ 4.63 $ 7.73 167.0 %
(1) Coal margin per ton for our coal operations is calculated as coal sales realization per ton for our coal operations less cost of coal sales per ton for our coaloperations.
Cost of coal sales. CAPP - Met operations cost of coal sales increased $170.9 million , or 191.5% , for the three months ended June 30, 2019 compared to theprior year period. The increase in CAPP - Met operations cost of coal sales was primarily due to increases to salaries and wages expense, supplies and maintenanceexpense, and royalties and taxes related to properties acquired in the Merger, partially offset by an increase in inventory resulting in lower cost of coal sales.
CAPP - Thermal operations cost of coal sales were $61.7 million during the current year period. CAPP - Thermal operations cost of coal sales consisted of 1.2million tons sold at a coal margin per ton of $9.90 per ton. The CAPP - Thermal cost of coal sales were primarily comprised of supplies and maintenance expenses,salaries and wages expenses and royalties and taxes.
NAPP operations cost of coal sales decreased $8.8 million , or 13.9% , for the three months ended June 30, 2019 compared to the prior year period. Thedecrease in NAPP operations cost of coal sales was primarily due to decreases in inventory costs and supplies and maintenance expense, partially offset by anincrease in salaries and wages expense.
Trading and Logistics Operations
Trading and Logistics operations focuses on coal trading and coal terminal facility services. Our coal trading business primarily purchases met coal fromdomestic producers and sells into international markets. Such purchases are predominantly made pursuant to long-term agreements, but we also purchase coal onthe spot market when it is advantageous to our business. In March 2017, we increased our stake in the DTA coal export terminal from 40.6% to 65.0%, whichprovides us with 14 million tons of export capacity. Purchasing coal produced by various CAPP operators allows us to leverage our export capacity at DTA. Ourlogistics platform complements our met coal operations by blending captive and third-party coal at DTA to achieve a broader portfolio of coal qualities. Wetypically build in margin for transportation fees, overhead, risk and profit when purchasing third-party coal. Additionally, we sell capacity to third-party operatorsvia throughput contracts. The Trading and Logistics business provides us with a larger presence in international markets and further diversifies and expands ourrevenue sources.
The following table summarizes certain financial information relating to our Trading and Logistics operations for the three months ended June 30, 2019 and2018:
52

Table of Contents
Three Months Ended June 30, Increase (Decrease)
(In thousands, except for per ton data) 2019 2018 (2) $ or Tons %
Tons sold 369 1,629 (1,260) (77.3)%
Coal revenues $ 131,215 $ 302,306 $ (171,091) (56.6)%Less: cost of coal sales 119,513 278,628 (159,115) (57.1)%Trading and Logistics margin (1) $ 11,702 $ 23,678 $ (11,976) (50.6)%
(1) Trading and Logistics margin includes coal trading margin and logistics-related margin.(2) Prior periods have been modified to reflect total coal revenues and total cost of coal sales including freight and handling components formerly statedseparately.
Coal revenues decreased $171.1 million , or 56.6% , and cost of coal sales decreased by $159.1 million , or 57.1% , for the three months ended June 30, 2019compared to the prior year period due to lower sales volumes of 1.3 million tons, primarily related to decreased sales of coal purchased from the Alpha Companiesduring the current period as a result of the Merger.
Segment Adjusted EBITDA
Segment Adjusted EBITDA for our reportable segments is a financial measure. This non-GAAP financial measure is presented as a supplemental measure andis not intended to replace financial performance measures determined in accordance with GAAP. Moreover, this measure is not calculated identically by allcompanies and therefore may not be comparable to similarly titled measures used by other companies. Segment Adjusted EBITDA is presented becausemanagement believes it is a useful indicator of the financial performance of our coal operations. The following tables present a reconciliation of net income (loss)to Adjusted EBITDA for the three months ended June 30, 2019 and 2018:
Three Months Ended June 30, 2019
CAPP - Met CAPP - Thermal NAPP Trading andLogistics All Other Consolidated
Net income (loss) from continuing operations $ 60,890 $ (8,895) $ 13,771 $ 14,673 $ (56,139) $ 24,300Interest expense 194 6 — — 15,877 16,077Interest income (4) — (11) — (1,870) (1,885)Income tax benefit — — — — (1,000) (1,000)Depreciation, depletion and amortization 38,507 16,502 6,522 322 961 62,814Merger related costs — — — — 156 156Non-cash stock compensation expense 54 5 — 322 (927) (546)Mark-to-market adjustment - acquisition-related obligations — — — — 1,014 1,014Accretion on asset retirement obligations 2,327 2,666 1,016 — 838 6,847Loss on modification and extinguishment ofdebt — — — — 26,459 26,459Asset impairment (1) 5,826 — — — — 5,826Cost impact of coal inventory fair valueadjustment (2) 1,033 — — — — 1,033Amortization of acquired intangibles, net 4,915 749 — (6,007) — (343)
Adjusted EBITDA $ 113,742 $ 11,033 $ 21,298 $ 9,310 $ (14,631) $ 140,752(1) Asset impairment primarily related to the write-off of prepaid purchased coal from Blackjewel as result of Blackjewel’s Chapter 11 bankruptcy filing on July 1,2019. Refer to Note 19 for further details within subsequent event disclosures.(2) The cost impact of the coal inventory fair value adjustment as a result of the Alpha Merger is expected to have short-term impact.
53

Table of Contents
Three Months Ended June 30, 2018
CAPP - Met CAPP - Thermal NAPP Trading andLogistics All Other Consolidated
Net income (loss) from continuing operations $ 73,140 $ — $ 3,090 $ 22,342 $ (23,930) $ 74,642Interest expense 3 — (417) — 9,193 8,779Interest income (6) — (10) (18) (157) (191)Income tax expense — — — — 55 55Depreciation, depletion and amortization 5,742 — 5,295 — 185 11,222Merger related costs — — — — 3,423 3,423Non-cash stock compensation expense — — — — 1,876 1,876Gain on sale of disposal group (1) (16,386) — — — — (16,386)Accretion on asset retirement obligations 655 — 941 — — 1,596Amortization of acquired intangibles, net — — — 1,104 — 1,104
Adjusted EBITDA $ 63,148 $ — $ 8,899 $ 23,428 $ (9,355) $ 86,120(1) During the fourth quarter of 2017, we entered into an asset purchase agreement to sell a disposal group (comprised of property, plant and equipment andassociated asset retirement obligations) within our CAPP - Met segment. From the date we entered into the asset purchase agreement through the transaction closedate, the property, plant and equipment and associated asset retirement obligations were classified as held for sale in amounts representing the fair value of thedisposal group. Upon permit transfer, the transaction closed on April 2, 2018. We paid $10.0 million in connection with the transaction, which was paid intoescrow on March 27, 2018 and transferred to the buyer at the transaction close date, and expects to pay a series of additional cash payments in the aggregateamount of $1.5 million , per the terms stated in the agreement, and recorded a gain on sale of $16.4 million within other expenses (income) within the CondensedConsolidated Statements of Operations.
The following table summarizes Adjusted EBITDA for our three reportable segments and All Other category:
Three Months Ended June 30, Increase (Decrease)
(In thousands) 2019 2018 $ %
Adjusted EBITDA CAPP - Met operations $ 113,742 $ 63,148 $ 50,594 80.1 %CAPP - Thermal operations 11,033 — 11,033 100.0 %NAPP operations 21,298 8,899 12,399 139.3 %Trading and Logistics operations 9,310 23,428 (14,118) (60.3)%All Other (14,631) (9,355) (5,276) (56.4)%
Total $ 140,752 $ 86,120 $ 54,632 63.4 %
CAPP - Met operations. Adjusted EBITDA increased $50.6 million , or 80.1% , for the three months ended June 30, 2019 compared to the prior year period.The increase in Adjusted EBITDA was primarily driven by increased sales volumes during the current period as a result of the Merger, partially offset bydecreased coal margin per ton of $16.30 , or approximately 30.7% , and increased costs associated with purchased coal during the current period.
CAPP - Thermal operations. Adjusted EBITDA for the CAPP - Thermal operations was $11.0 million for the three months ended June 30, 2019 . The prioryear period did not have any activity in this segment and therefore the current year results explain the entire amount of change.
NAPP operations. Adjusted EBITDA increased $12.4 million , or 139.3% , for the three months ended June 30, 2019 compared to the prior year period. Theincrease in Adjusted EBITDA was primarily due to increased coal sales in the current year period and increased coal margin per ton of $7.73 , or approximately167.0% .
54

Table of Contents
Trading and Logistics operations. Adjusted EBITDA decreased $14.1 million , or 60.3% , for the three months ended June 30, 2019 compared to the prioryear period. The decrease in Adjusted EBITDA was primarily due to decreased sales of coal purchased from the Alpha Companies during the current period as aresult of the Merger.
All Other category. Adjusted EBITDA decreased $5.3 million , or 56.4% , for the three months ended June 30, 2019 compared to the prior year period. Thedecrease in Adjusted EBITDA was primarily driven by increases in costs associated with idled properties acquired in the Merger and increases in professionalservices fees and wages and benefits expense, partially offset by a gain on sale of assets during the period.
Six Months Ended June 30, 2019 Compared to the Six Months Ended June 30, 2018
Revenues
The following table summarizes information about our revenues during the six months ended June 30, 2019 and 2018:
Six Months Ended June 30, Increase (Decrease)
(In thousands, except for per ton data) 2019 2018 $ or Tons %
Coal revenues $ 1,260,788 $ 1,003,533 $ 257,255 25.6 %Other revenues 4,532 7,717 (3,185) (41.3)%
Total revenues $ 1,265,320 $ 1,011,250 $ 254,070 25.1 %
Tons sold 12,252 8,202 4,050 49.4 %
Coal revenues. Coal revenues increased $257.3 million , or 25.6% , for the six months ended June 30, 2019 compared to the prior year period. The increasewas primarily due to higher coal sales volume of 4.1 million tons. Refer to the Coal Operations and Trading and Logistics Operations sections below for furtherdetail on coal revenues for the six months ended June 30, 2019 compared to the prior year period.
Costs and Expenses
The following table summarizes information about our costs and expenses during the six months ended June 30, 2019 and 2018:
Six Months Ended June 30, Increase (Decrease)
(In thousands, except for per ton data) 2019 2018 $ %
Cost of coal sales (exclusive of items shown separately below) $ 1,012,440 $ 802,048 $ 210,392 26.2 %Depreciation, depletion and amortization 124,085 22,810 101,275 444.0 %Accretion on asset retirement obligations 13,079 4,056 9,023 222.5 %Amortization of acquired intangibles, net (7,026) 11,310 (18,336) (162.1)%Asset impairment 5,826 — 5,826 100.0 %Selling, general and administrative expenses (exclusive ofdepreciation, depletion and amortization shown separately above) 35,734 31,108 4,626 14.9 %Merger related costs 987 3,883 (2,896) (74.6)%Total other operating (income) loss:
Mark-to-market adjustment for acquisition-related obligations 2,950 — 2,950 100.0 %Other income (7,485) (16,506) 9,021 54.7 %
Total costs and expenses $ 1,180,590 $ 858,709 $ 321,881 37.5 %
Cost of coal sales. Cost of coal sales increased $210.4 million , or 26.2% , for the six months ended June 30, 2019 compared to the prior year period. Theincrease was primarily driven by salaries and wages expense, supplies and maintenance expense, and royalties and taxes related to properties acquired in theMerger, partially offset by decreased costs of purchased coal during the current period.
55

Table of Contents
Depreciation, depletion and amortization. Depreciation, depletion and amortization increased $101.3 million , or 444.0% , for the six months ended June 30,2019 compared to the prior year period. The increase in depreciation, depletion and amortization primarily related to increased purchases of machinery andequipment, increased asset development during the current period, and additions of property, plant and equipment and owned and leased mineral rights as a resultof the Merger.
Accretion on asset retirement obligations. Accretion on asset retirement obligations increased $9.0 million or 222.5% , for the six months ended June 30, 2019compared to the prior year period. This increase was primarily due to an increase in our asset retirement obligations as a result of the Merger.
Amortization of acquired intangibles, net. Amortization of acquired intangibles, net decreased $18.3 million , or 162.1% , for the six months ended June 30,2019 compared to the prior year period. The decrease was primarily driven by the current period amortization related to below-market acquired intangiblesacquired as a result of the Merger.
Asset impairment . We recorded asset impairment of $5.8 million during the six months ended June 30, 2019 . Asset impairment primarily related to the write-off of prepaid purchased coal from Blackjewel due to Blackjewel’s Chapter 11 bankruptcy filing on July 1, 2019. Refer to Note 19 for further details withinsubsequent event disclosures.
Selling, general and administrative. Selling, general and administrative expenses increased $4.6 million , or 14.9% for the six months ended June 30, 2019compared to the prior year period. This increase in expense was primarily related to increases of $3.7 million in wages and benefits expense and $4.0 million inprofessional fees, partially offset by decreases of $4.2 million in stock compensation expense during the current period.
Merger related costs. Merger related costs decreased $2.9 million , or 74.6% , for the six months ended June 30, 2019 compared to the prior year period. Thecosts related primarily to professional fees, severance pay and incentive pay incurred related to the Merger Agreement entered into with the Alpha Companies onApril 29, 2018.
Mark-to-market adjustment for acquisition-related obligations. For the six months ended June 30, 2019 we recorded a mark-to-market adjustment foracquisition-related obligations of $3.0 million related to the Contingent Revenue Obligation assumed as a result of the Merger.
Other income. Other income decreased by $9.0 million or 54.7% for the six months ended June 30, 2019 compared to the prior year period. During the sixmonths ended June 30, 2019, we recorded a gain on assets acquired in an exchange transaction of $9.1 million. During the six months ended June 30, 2018, werecorded a gain on disposal of assets of $16.5 million primarily related to the sale of a disposal group within the Company’s CAPP - Met segment.
Other Income (Expense)
The following table summarizes information about our other income (expense) during the six months ended June 30, 2019 and 2018:
Six Months Ended June 30, Increase (Decrease)
(In thousands, except for per ton data) 2019 2018 $ %
Other income (expense): Interest expense $ (31,232) $ (17,984) $ (13,248) (73.7)%Interest income 3,821 322 3,499 1,086.6 %Loss on modification and extinguishment of debt (26,459) — (26,459) (100.0)%Equity loss in affiliates (2,959) (1,233) (1,726) (140.0)%Miscellaneous loss, net (1,389) (583) (806) (138.3)%
Total other expense, net $ (58,218) $ (19,478) $ (38,740) (198.9)%
Interest expense. Interest expense increased $13.2 million , or 73.7% , for the six months ended June 30, 2019 compared to the prior year period, primarily dueto higher interest rates and larger accretion of debt discounts related to the debt facilities in place during the current period. Refer to Note 10 for additionalinformation.
Loss on modification and extinguishment of debt. During the six months ended June 30, 2019 , we recorded a loss on modification of debt of $0.3 million ,primarily related to modification fees paid under the refinance, and a loss on
56

Table of Contents
extinguishment of debt of $26.2 million, primarily related to the write-off of outstanding debt discounts and unamortized debt issuance costs under the Amendedand Restated Credit Agreement dated November 9, 2018. Refer to Note 10 for additional information.
Income Tax Benefit (Expense)
The following table summarizes information about our income tax benefit (expense) during the six months ended June 30, 2019 and 2018:
Six Months Ended June 30, Increase (Decrease)
(In thousands, except for per ton data) 2019 2018 $ %
Income tax benefit (expense) $ 5,778 $ (121) $ 5,899 4,875.2%
Income taxes. Income tax benefit of $5.8 million was recorded for the six months ended June 30, 2019 on income from continuing operations before incometaxes of $26.5 million . The effective tax rate is lower than the federal statutory rate of 21% primarily due to the impact of the percentage depletion allowance, thepermanent impact of stock-based compensation deductions, and the reduction in the valuation allowance.
Income tax expense of $0.1 million was recorded for the six months ended June 30, 2018 on income from continuing operations before income taxes of $133.1million . The effective tax rate is lower than the federal statutory rate of 21% primarily due to the impact of the percentage depletion allowance and the reduction inthe valuation allowance, partially offset by the impact of state income taxes, net of federal tax impact. Refer to Note 14 for additional information.
Coal Operations
The following tables summarize certain financial information relating to our coal operations for the six months ended June 30, 2019 and 2018:
Six Months Ended June 30, Increase (Decrease)
(In thousands, except for per ton data) 2019 2018 Tons %
Tons sold: CAPP - Met operations 5,856 2,138 3,718 173.9%CAPP - Thermal operations 2,181 — 2,181 100.0%NAPP operations 3,399 2,986 413 13.8%
Six Months Ended June 30, Increase (Decrease)
(In thousands, except for per ton data) 2019 2018 $ %
Coal revenues: CAPP - Met operations $ 718,684 $ 286,723 $ 431,961 150.7 %CAPP - Thermal operations $ 130,826 $ — $ 130,826 100.0 %NAPP operations $ 147,094 $ 132,166 $ 14,928 11.3 %
Coal sales realization per ton:
CAPP - Met operations $ 122.73 $ 134.11 $ (11.38) (8.5)%CAPP - Thermal operations $ 59.98 $ — $ 59.98 100.0 %NAPP operations $ 43.28 $ 44.26 $ (0.98) (2.2)%Average $ 87.15 $ 81.75 $ 5.40 6.6 %
Coal revenues. CAPP - Met operations coal revenues increased $432.0 million , or 150.7% , for the six months ended June 30, 2019 compared to the prioryear period. The increase in CAPP - Met operations coal revenues was primarily due to higher coal sales volume of 3.7 million tons as a result of the Merger,partially offset by lower coal sales realization of $11.38 per ton.
57

Table of Contents
CAPP - Thermal operations coal revenues were $130.8 million during the current year period. CAPP - Thermal operations coal revenues consisted of 2.2million tons sold at a coal sales realization of $59.98 per ton. The CAPP - Thermal operations were acquired as part of the Alpha Merger.
NAPP operations coal revenues increased $14.9 million , or 11.3% , for the six months ended June 30, 2019 compared to the prior year period. The increase inNAPP operations coal revenues was primarily due to higher coal sales volumes of 0.4 million tons, partially offset by lower coal sales realization of $0.98 per ton.
Six Months Ended June 30, Increase (Decrease)
(In thousands, except for per ton data) 2019 2018 $ %
Cost of coal sales: CAPP - Met operations $ 519,917 $ 165,996 $ 353,921 213.2 %CAPP - Thermal operations $ 126,831 $ — $ 126,831 100.0 %NAPP operations $ 121,526 $ 117,234 $ 4,292 3.7 %
Cost of coal sales per ton: CAPP - Met operations $ 88.78 $ 77.64 $ 11.14 14.3 %CAPP - Thermal operations $ 58.15 $ — $ 58.15 100.0 %NAPP operations $ 35.75 $ 39.26 $ (3.51) (8.9)%
Coal margin per ton (1) :
CAPP - Met operations $ 33.95 $ 56.47 $ (22.52) (39.9)%CAPP - Thermal operations $ 1.83 $ — $ 1.83 100.0 %NAPP operations $ 7.53 $ 5.00 $ 2.53 50.6 %
(1) Coal margin per ton for our coal operations is calculated as coal sales realization per ton for our coal operations less cost of coal sales per ton for our coaloperations.
Cost of coal sales. CAPP - Met operations cost of coal sales increased $353.9 million , or 213.2% , for the six months ended June 30, 2019 compared to theprior year period. The increase in CAPP - Met operations cost of coal sales was primarily due to increases to salaries and wages expense, supplies and maintenanceexpense, and royalties and taxes related to properties acquired in the Merger, partially offset by an increase in inventory resulting in lower cost of coal sales.
CAPP - Thermal operations cost of coal sales were $126.8 million during the current year period. CAPP - Thermal operations cost of coal sales consisted of2.2 million tons sold at a coal margin per ton of $1.83 per ton. The CAPP - Thermal cost of coal sales were primarily comprised of supplies and maintenanceexpenses, salaries and wages expenses and royalties and taxes.
NAPP operations cost of coal sales increased $4.3 million , or 3.7% , for the six months ended June 30, 2019 compared to the prior year period. The increasein NAPP operations cost of coal sales was primarily due to an increase in salaries and wages expense and supplies and maintenance expense, partially offset by anincrease in inventory resulting in lower cost of coal sales.
Trading and Logistics Operations
The following table summarizes certain financial information relating to our Trading and Logistics operations for the three months ended June 30, 2019 and2018:
58

Table of Contents
Six Months Ended June 30, Increase (Decrease)
(In thousands, except for per ton data) 2019 2018 (2) $ or Tons %
Tons sold 816 3,078 (2,262) (73.5)%
Coal revenues $ 264,184 $ 584,644 $ (320,460) (54.8)%Less: cost of coal sales 241,988 518,818 (276,830) (53.4)%Trading and Logistics margin (1) $ 22,196 $ 65,826 $ (43,630) (66.3)%
(1) Trading and Logistics margin includes coal trading margin and logistics-related margin.(2) Prior periods have been modified to reflect total coal revenues and total cost of coal sales including freight and handling components formerly statedseparately.
Coal revenues decreased $320.5 million , or 54.8% , and cost of coal sales decreased by $276.8 million , or 53.4% , for the six months ended June 30, 2019compared to the prior year period due to lower sales volumes of 2.3 million tons, primarily related to decreased sales of coal purchased from the Alpha Companiesduring the current period as a result of the Merger.
Segment Adjusted EBITDA
Segment Adjusted EBITDA for our reportable segments is a financial measure. This non-GAAP financial measure is presented as a supplemental measure andis not intended to replace financial performance measures determined in accordance with GAAP. Moreover, this measure is not calculated identically by allcompanies and therefore may not be comparable to similarly titled measures used by other companies. Segment Adjusted EBITDA is presented becausemanagement believes it is a useful indicator of the financial performance of our coal operations. The following tables present a reconciliation of net income (loss)to Adjusted EBITDA for the six months ended June 30, 2019 and 2018:
Six Months Ended June 30, 2019
CAPP - Met CAPP - Thermal NAPP Trading andLogistics All Other Consolidated
Net income (loss) from continuing operations $ 114,025 $ (34,024) $ 10,892 $ 36,940 $ (95,543) $ 32,290Interest expense 222 10 1 — 30,999 31,232Interest income (8) — (23) — (3,790) (3,821)Income tax benefit — — — — (5,778) (5,778)Depreciation, depletion and amortization 75,180 30,614 13,149 322 4,820 124,085Merger related costs — — — — 987 987Non-cash stock compensation expense 171 57 — 608 3,889 4,725Mark-to-market adjustment - acquisition-related obligations — — — — 2,950 2,950Accretion on asset retirement obligations 4,660 4,731 2,033 — 1,655 13,079Loss on modification and extinguishment ofdebt — — — — 26,459 26,459Asset impairment (1) 5,826 — — — — 5,826Cost impact of coal inventory fair valueadjustment (2) 4,751 3,458 — — — 8,209Gain on assets acquired in an exchangetransaction (3) (9,083) — — — — (9,083)Amortization of acquired intangibles, net 9,701 1,904 — (18,631) — (7,026)
Adjusted EBITDA $ 205,445 $ 6,750 $ 26,052 $ 19,239 $ (33,352) $ 224,134(1) Asset impairment primarily related to the write-off of prepaid purchased coal from Blackjewel as a result of Blackjewel’s Chapter 11 bankruptcy filing on July1, 2019. Refer to Note 19 for further details within subsequent event disclosures.
59

Table of Contents
(2) The cost impact of the coal inventory fair value adjustment as a result of the Alpha Merger is expected to have short-term impact.(3) During the six months ended June 30, 2019 , we entered into an exchange transaction which primarily included the release of the PRB overriding royalty interestowed to us in exchange for met coal reserves which resulted in a gain of $9.1 million .
Six Months Ended June 30, 2018
CAPP - Met CAPP - Thermal NAPP Trading andLogistics All Other Consolidated
Net income (loss) from continuing operations $ 123,000 $ — $ 6,205 $ 54,894 $ (51,157) $ 132,942Interest expense 312 — (349) — 18,021 17,984Interest income (10) — (12) (18) (282) (322)Income tax expense — — — — 121 121Depreciation, depletion and amortization 11,978 — 10,463 — 369 22,810Merger related costs — — — — 3,883 3,883Management restructuring costs (1) — — — — 2,659 2,659Non-cash stock compensation expense — — — — 6,355 6,355Gain on settlement of acquisition-relatedobligations — — — — (292) (292)Gain on sale of disposal group (2) (16,386) — — — — (16,386)Accretion on asset retirement obligations 2,174 — 1,882 — — 4,056Amortization of acquired intangibles, net — — — 11,310 — 11,310
Adjusted EBITDA $ 121,068 $ — $ 18,189 $ 66,186 $ (20,323) $ 185,120(1) Management restructuring costs are related to severance expense associated with senior management changes in the six months ended June 30, 2018 .(2) During the fourth quarter of 2017, we entered into an asset purchase agreement to sell a disposal group (comprised of property, plant and equipment andassociated asset retirement obligations) within our CAPP - Met segment. From the date we entered into the asset purchase agreement through the transaction closedate, the property, plant and equipment and associated asset retirement obligations were classified as held for sale in amounts representing the fair value of thedisposal group. Upon permit transfer, the transaction closed on April 2, 2018. We paid $10.0 million in connection with the transaction, which was paid intoescrow on March 27, 2018 and transferred to the buyer at the transaction close date, and expects to pay a series of additional cash payments in the aggregateamount of $1.5 million , per the terms stated in the agreement, and recorded a gain on sale of $16.4 million within other expenses (income) within the CondensedConsolidated Statements of Operations.
The following table summarizes Adjusted EBITDA for our three reportable segments and All Other category:
Six Months Ended June 30, Increase (Decrease)
(In thousands) 2019 2018 $ %
Adjusted EBITDA CAPP - Met operations $ 205,445 $ 121,068 $ 84,377 69.7 %CAPP - Thermal operations 6,750 — 6,750 100.0 %NAPP operations 26,052 18,189 7,863 43.2 %Trading and Logistics operations 19,239 66,186 (46,947) (70.9)%All Other (33,352) (20,323) (13,029) (64.1)%
Total $ 224,134 $ 185,120 $ 39,014 21.1 %
CAPP - Met operations. Adjusted EBITDA increased $84.4 million , or 69.7% , for the six months ended June 30, 2019 compared to the prior year period. Theincrease in Adjusted EBITDA was primarily driven by increased sales volumes during the current period as a result of the Merger, partially offset by decreasedcoal margin per ton of $22.52 , or approximately 39.9% , and increased costs associated with purchased coal during the current period.
60

Table of Contents
CAPP - Thermal operations. Adjusted EBITDA for the CAAP - Thermal operations was $6.8 million for the six months ended June 30, 2019 . The prior yearperiod did not have any activity in this segment and therefore the current year results explain the entire amount of change. During the three months ended March31, 2019, the primary driver for adjusted EBITDA related to ventilation factors negatively impacting production. These ventilation factors were corrected duringthe during the three months ended June 30, 2019 .
NAPP operations. Adjusted EBITDA increased $7.9 million , or 43.2% , for the six months ended June 30, 2019 compared to the prior year period. Theincrease in Adjusted EBITDA was primarily due to increased sales volumes during the current period and increased coal margin per ton of $2.53 , orapproximately 50.6% .
Trading and Logistics operations. Adjusted EBITDA decreased $46.9 million , or 70.9% , for the six months ended June 30, 2019 compared to the prior yearperiod. The decrease in Adjusted EBITDA was primarily due to decreased sales of coal purchased from the Alpha Companies during the current period as a resultof the Merger.
All Other category. Adjusted EBITDA decreased $13.0 million , or 64.1% , for the six months ended June 30, 2019 compared to the prior year period. Thedecrease in Adjusted EBITDA was primarily driven by increases in costs associated with idled properties acquired in the Merger and increases in professionalservices fees and wages and benefits expenses.
Liquidity and Capital Resources
Our primary liquidity and capital resource requirements stem from the cost of our coal production and purchases, our capital expenditures, our debt service,our reclamation obligations, our regulatory costs and settlements and associated costs. Our primary sources of liquidity are derived from sales of coal, our debtfinancing and miscellaneous revenues.
We believe that cash on hand and cash generated from our operations will be sufficient to meet our working capital requirements, anticipated capitalexpenditures, debt service requirements, acquisition-related obligations, and reclamation obligations for the next 12 months. We have relied on a number ofassumptions in budgeting for our future activities. These include the costs for mine development to sustain capacity of our operating mines, our cash flows fromoperations, effects of regulation and taxes by governmental agencies, mining technology improvements and reclamation costs. These assumptions are inherentlysubject to significant business, political, economic, regulatory, environmental and competitive uncertainties, contingencies and risks, all of which are difficult topredict and many of which are beyond our control. We may need to raise additional funds more quickly if market conditions deteriorate, and we may not be able todo so in a timely fashion, or at all; or one or more of our assumptions proves to be incorrect or if we choose to expand our acquisition, exploration, appraisal, ordevelopment efforts or any other activity more rapidly than we presently anticipate. We may decide to raise additional funds before we need them if the conditionsfor raising capital are favorable. We may seek to sell equity or debt securities or obtain additional bank credit facilities. The sale of equity securities could result indilution to our stockholders. The incurrence of additional indebtedness could result in increased fixed obligations and additional covenants that could restrict ouroperations.
At June 30, 2019 , we had total liquidity of $435.1 million, including cash and cash equivalents of $249.6 million and $185.5 million of unused commitmentsavailable under the Amended and Restated Asset-Based Revolving Credit Agreement, subject to limitations described therein. On June 14, 2019, we entered into a$561.8 million Term Loan Credit Facility under the Credit Agreement. On November 9, 2018, we entered into a $225.0 million asset-based revolving credit facilityunder the Amended and Restated Asset-Based Revolving Credit Agreement expiring on April 3, 2022. Refer to Note 10 for disclosures on long-term debt.
We sponsor three qualified non-contributory pension plans (“Pension Plans”) which cover certain salaried and non-union hourly employees. Participantsaccrued benefits either based on certain formulas, the participant’s compensation prior to retirement or plan specified amounts for each year of service. Benefits arefrozen under these Pension Plans. Annual funding contributions to the Pension Plans are made as recommended by consulting actuaries based upon the ERISAfunding standards. Funding decisions also consider certain funded status thresholds defined by the Pension Protection Act of 2006. We expect to contribute $7.0million to the Pension Plans in the remainder of 2019. Refer to Note 15 for further disclosures related to this obligation.
To secure our obligations under certain worker’s compensation, black lung, reclamation-related obligations, general liabilities, and financial guarantees, weare required to provide cash collateral. At June 30, 2019 , we had cash collateral in the amounts of $250.8 million, $11.6 million, and $17.8 million classified asshort-term and long-term restricted cash, short-term and long-term deposits, and long-term restricted investments, respectively, on our Condensed ConsolidatedBalance Sheets. As the permits associated with the PRB Transaction have not transferred due to the Blackjewel Chapter 11 bankruptcy filing on
61

Table of Contents
July 1, 2019, we no longer anticipate the related restricted cash and deposits will be returned in the near term to operating cash. Refer to Note 19 for further detailswithin subsequent event disclosures.
Capital Return Program
During the three months ended June 30, 2019, our board of directors adopted a capital return program that permits us to return to stockholders up to anaggregate amount of $250 million of capital. The capital return program does not have a fixed expiration date, and returns of capital may take the form of sharerepurchases, dividends or a combination thereof. Any share repurchases may be made from time to time through open market transactions, block trades, privatelynegotiated transactions, tender offers, or otherwise. Any returns of capital under the program will be at the discretion of the board and are subject to market andbusiness conditions, levels of available liquidity, our cash needs, restrictions under agreements or obligations, legal or regulatory requirements or restrictions, andother relevant factors. During the three months ended June 30, 2019, there was no activity under the Capital Return Program.
Blackjewel Developments
On July 1, 2019, Blackjewel announced that it and certain affiliated entities had filed voluntary petitions for reorganization under Chapter 11 of theBankruptcy Code in the U.S. Bankruptcy Court for the Southern District of West Virginia. Subsequently, on July 10, 2019, the Wyoming Environmental QualityCouncil (the “EQC”) stayed the transfer process of the still outstanding permits from Contura Coal West to Blackjewel to allow the EQC time to review thesedevelopments. On July 25, 2019, we announced that we would seek to serve as the stalking horse purchaser for certain assets offered for sale through Blackjewel’sbankruptcy proceedings, and on August 6, 2019, the federal bankruptcy judge in the Southern District of West Virginia verbally approved the Company’s purchaseof the Eagle Butte and Belle Ayr mines in Wyoming and the Pax Surface Mine in Scarbro, West Virginia for $33.75 million. Closing of the transaction is subject tothe Company, Blackjewel’s debtor estate and additional relevant parties in the bankruptcy proceedings (including federal and state governmental agencies)reaching an agreement as to the payment of certain pre-petition claims and entry of a final order by the court. The EQC has taken no additional action since July10, 2019.
Subject to terms of the bankruptcy order approving Contura’s purchase of the Eagle Butte and Belle Ayr mines in Wyoming and the Pax Surface Mine, wemade a purchase deposit of $8.1 million on July 26, 2019 which will be applied to the purchase price in accordance with the preliminary term sheet. Pursuant topreliminary term sheet, we also expect to assume other obligations in connection with the purchase.
As a result of the Blackjewel Chapter 11 bankruptcy filing, we increased our asset retirement obligation within discontinued operations. Refer to theContractual Obligations section for information on our estimated undiscounted cash flows for asset retirement obligations as of June 30, 2019, which are based onthe information currently available. The estimates and assumptions used to determine the asset retirement obligation as of June 30, 2019 will continue to beevaluated and updated as additional information becomes available in subsequent periods. Refer to Note 3 for additional detail related to second quarter 2019impacts due to the Blackjewel Chapter 11 bankruptcy filing. Additionally, refer to Note 19 for further details within subsequent event disclosures.
Additionally, refer to Note 3 for disclosure information on discontinued operations.
Cash Flows
Cash, cash equivalents, and restricted cash increased by $23.2 million and $52.2 million over the six months ended June 30, 2019 and 2018 , respectively. Thenet change in cash, cash equivalents, and restricted cash was attributable to the following:
Six Months Ended June 30,
2019 2018
Cash flows (in thousands): Net cash provided by operating activities $ 117,133 $ 115,606Net cash used in investing activities (76,131) (50,106)Net cash used in financing activities (17,774) (13,288)
Net increase in cash and cash equivalents and restricted cash $ 23,228 $ 52,212
Operating Activities
62

Table of Contents
Net cash flows from operating activities consist of net income adjusted for non-cash items, such as depreciation, depletion and amortization, amortization ofacquired intangibles, net, accretion of acquisition-related obligations discount, amortization of debt issuance costs and accretion of debt discount, mark-to-marketadjustments for acquisition-related obligations, gain on assets acquired in an exchange transaction, equity loss in affiliates, accretion on asset retirementobligations, employee benefit plans, stock-based compensation, deferred income taxes, and changes in net working capital.
Net cash provided by operating activities for the six months ended June 30, 2019 was $117.1 million and was primarily attributable to net loss of $106.8million adjusted for depreciation, depletion and amortization of $270.0 million , loss on modification and extinguishment of debt of $26.5 million , accretion onasset retirement obligations of $13.1 million , employee benefit plans, net of $9.6 million , asset impairment of $22.3 million , amortization of debt issuance costsand accretion of debt discount of $6.7 million , and stock-based compensation of $4.8 million , partially offset by deferred income taxes of $33.6 million , a $9.1million gain on assets acquired in an exchange transaction, and amortization of acquired intangibles, net of $7.0 million . The change in our operating assets andliabilities of ($90.1) million was primarily attributed to increases in inventories, net of $42.3 million, decreases trade accounts payable of $23.6 million, decreasesin asset retirement obligations of $11.1 million, decreases in acquisition related obligations of $12.1 million, and decreases in other non-current liabilities of $12.7million, partially offset by a decrease in trade accounts receivable $11.0 million.
Net cash provided by operating activities for the six months ended June 30, 2018 was $115.6 million and was primarily attributable to net income of $130.7million adjusted for depreciation, depletion and amortization of $22.8 million, amortization of acquired intangibles, net of $11.3 million, stock-based compensationof $7.1 million, and accretion on asset retirement obligations of $4.1 million, partially offset by a $16.5 million gain on disposal of assets. The change in ouroperating assets and liabilities of $54.7 million was primarily attributed to increases in trade accounts receivable of $24.1 million, increases in inventories, net of$4.9 million, decreases in trade accounts payable of $16.6 million, and decreases in other non-current liabilities of $12.9 million.
Investing Activities
Net cash used in investing activities for the six months ended June 30, 2019 was $76.1 million , primarily driven by capital expenditures of $83.9 million ,purchases of investment securities - held to maturity of $9.9 million , and capital contributions to equity affiliates of $4.8 million , partially offset by maturity ofinvestment securities - held to maturity of $21.3 million .
Net cash used in investing activities for the six months ended June 30, 2018 was $50.1 million, driven by capital expenditures of $38.3 million and paymentson disposal of assets of $10.3 million.
Financing Activities
Net cash used in financing activities for the six months ended June 30, 2019 was $17.8 million , primarily attributable to principal repayments of debt of$550.0 million , debt issuance costs of $5.8 million , and common stock repurchases and related expenses of $4.9 million , partially offset by proceeds fromborrowings on debt of $544.9 million .
Net cash used in financing activities for the six months ended June 30, 2018 was $13.3 million, primarily attributable to principal repayments of debt of $5.3million, common stock repurchases and related expenses of $4.8 million, and principal repayments of notes payable of $2.9 million.
Long-Term Debt
Refer to Note 10 for additional disclosures on long-term debt.
Analysis of Material Debt Covenants
We were in compliance with all covenants under the Credit Agreement and the Amended and Restated Asset-Based Revolving Credit Agreement, as ofJune 30, 2019 . A breach of the covenants in the Credit Agreement and the Amended and Restated Asset-Based Revolving Credit Agreement could result in adefault under the terms of the agreement and the respective lenders could elect to declare all amounts borrowed due and payable.
Pursuant to the Amended and Restated Asset-Based Revolving Credit Agreement, during any Liquidity Period (capitalized terms as defined in the Amendedand Restated Asset-Based Revolving Credit Agreement), our Fixed Charge Coverage Ratio cannot be less than 1.0 as of the last day of any Test Period,commencing with the Test Period ended immediately preceding the
63

Table of Contents
commencement of such Liquidity Period. The Fixed Charge Coverage Ratio is calculated as (a) Consolidated EBITDA of the Company and its RestrictedSubsidiaries for such period, minus non-financed Capital Expenditures (including Capital Expenditures financed with the proceeds of any Loans) paid or payablecurrently in cash by the Company or any of its Subsidiaries for such period to (b) the Fixed Charges of the Company and its Restricted Subsidiaries during suchperiod. As of June 30, 2019 , we were not in a Liquidity Period.
Acquisition-Related Obligations
Refer to Note 11 for additional details and disclosures on acquisition-related obligations.
Off-Balance Sheet Arrangements
Refer to Note 17 , part (c) for disclosures on off-balance sheet arrangements.
Other
As a regular part of our business, we review opportunities for, and engage in discussions and negotiations concerning, the acquisition or disposition of coalmining and related infrastructure assets and interests in coal mining companies, and acquisitions or dispositions of, or combinations or other strategic transactionsinvolving companies with coal mining or other energy assets. When we believe that these opportunities are consistent with our strategic plans and our acquisitionor disposition criteria, we will make bids or proposals and/or enter into letters of intent and other similar agreements. These bids or proposals, which may bebinding or non-binding, are customarily subject to a variety of conditions and usually permit us to terminate the discussions and any related agreement if, amongother things, we are not satisfied with the results of due diligence. Any acquisition opportunities we pursue could materially affect our liquidity and capitalresources and may require us to incur indebtedness, seek equity capital or both. There can be no assurance that additional financing will be available on termsacceptable to us, or at all.
Contractual Obligations
Our contractual obligations are discussed in “ Management’s Discussion and Analysis of Financial Condition and Results of Operations ” in our AnnualReport on Form 10-K for the year ended December 31, 2018.
Our contractual obligations relating to the contingent revenue obligation increased during the six months ended June 30, 2019 as a result of the measurement-period adjustments recorded and changes to forecasted revenue assumptions. Refer to Note 11 for further disclosures related to this obligation. The table belowreflects these obligations as of June 30, 2019:
(in thousands) Remainder of 2019 2020 2021 2022 2023 After 2023 Total
Contingent revenue obligation $ — $ 16,029 $ 16,915 $ 17,054 $ 16,182 $ — $ 66,180
Our long-term liabilities relating to asset retirement obligations, including discontinued operations, increased during the six months ended June 30, 2019 as aresult of the measurement-period adjustments recorded and due to the Blackjewel Chapter 11 bankruptcy filing. Refer to Note 19 for further details withinsubsequent event disclosures. Asset retirement obligations cash flows associated with the PRB are an estimate based on information currently available. Theestimates are subject to material change and will be updated as additional information become available. Refer to Note 2 for further information on measurementperiod adjustments. Refer to Note 3 for disclosure information on discontinued operations. The table below reflects the estimated undiscounted cash flows for theseobligations as of June 30, 2019:
(in thousands)Remainder of
2019 2020 2021 2022 2023 After 2023 Total
Asset retirement obligation $ 15,716 $ 24,674 $ 75,686 $ 80,417 $ 66,394 $ 663,323 $ 926,210
Refer to Note 9 for information about our lease obligations. Refer to Note 17 for disclosures related to our other contractual obligations.
Critical Accounting Policies and Estimates
The preparation of financial statements in accordance with GAAP requires management to make estimates and assumptions that affect reported amounts ofassets, liabilities, revenues and expenses, and related disclosure of contingent
64

Table of Contents
assets and liabilities. We base our estimates on historical experience and on various other factors and assumptions, including the current economic environmentthat we believe are reasonable under the circumstances, the results of which form the basis for making judgments about the carrying values of assets and liabilitiesthat are not readily apparent from other sources. We evaluate our estimates and assumptions on an ongoing basis and adjust such estimates and assumptions asfacts and circumstances require. Foreign currency and energy markets, and fluctuations in demand for steel products have combined to increase the uncertaintyinherent in such estimates and assumptions. As future events and their effects cannot be determined with precision, actual results may differ significantly fromthese estimates. Changes in these estimates resulting from continuing changes in the economic environment will be reflected in the financial statements in futureperiods.
Our critical accounting policies are discussed in “ Management’s Discussion and Analysis of Financial Condition and Results of Operations ” in our AnnualReport on Form 10-K for the year ended December 31, 2018. Our critical accounting policies remain unchanged at June 30, 2019 . Refer to Note 1 for disclosuresrelated to new accounting policies adopted.
Goodwill. Global economic weakness and in particular deterioration or weakness for an extended period of time in the global metallurgical coal market, aswell as other factors that could result in adverse changes in the key assumptions described in our Annual Report on Form 10-K for the year ended December 31,2018, could lead to a reduction in the fair value of the reporting unit. Accordingly, the goodwill associated with this reporting unit may be at risk for impairmentcharges.
Item 3. Quantitative and Qualitative Disclosures about Market Risk
Commodity Price Risk
We manage our commodity price risk for coal sales through the use of coal supply agreements. As of August 5, 2019, we expect to ship on sales commitmentsof approximately 7.0 million tons of NAPP coal for 2019, 100% of which is priced, 11.8 million tons of CAPP - Met coal for 2019, 72% of which is priced, and 4.5million tons of CAPP - Thermal coal for 2019, 98% of which is priced.
We have exposure to price risk for supplies that are used directly or indirectly in the normal course of production such as diesel fuel, steel and other items suchas explosives. We manage our risk for these items through strategic sourcing contracts in normal quantities with our suppliers and may use derivative instrumentsin the future from time to time, primarily swap contracts with financial institutions, for a certain percentage of our monthly requirements. Swap agreements wouldessentially fix the price paid for our diesel fuel by requiring us to pay a fixed price and receive a floating price.
We expect to use approximately 12.4 million and 23.9 million gallons of diesel fuel in the remainder of 2019 and 2020, respectively.
Credit Risk
Our credit risk is primarily with electric power generators and steel producers. Our policy is to independently evaluate each customer’s creditworthiness priorto entering into transactions and to monitor outstanding accounts receivable against established credit limits. When appropriate (as determined by our creditmanagement function), we have taken steps to reduce our credit exposure to customers that do not meet our credit standards or whose credit has deteriorated. Thesesteps include obtaining letters of credit or cash collateral, obtaining credit insurance, requiring prepayments for shipments or establishing customer trust accountsheld for our benefit in the event of a failure to pay.
Interest Rate Risk
As of June 30, 2019 , we had exposure to changes in interest rates through the asset-based revolving credit facility under our Amended and Restated Asset-Based Revolving Credit Agreement, which bears interest based on the character of the loan (defined as either “Base Rate Loan” or “Eurocurrency Rate Loan”) plusan applicable rate ranging from 1.00% to 1.50% for Base Rate Loans and 2.00% to 2.50% for Eurocurrency Rate Loans, depending on the amount of creditavailable. As of June 30, 2019 , the Company had no borrowings under the Asset-Based Term Loan Credit Agreement.
As of June 30, 2019 , we also had exposure to changes in interest rates through the Term Loan Credit Facility under our Credit Agreement, which bears aninterest rate per annum based on the character of the loan (defined as either “Base Rate Loan” or “Eurocurrency Rate Loan”) plus an applicable rate of 6.00% to7.00% on or prior to the second anniversary of the Closing Date and 7.00% to 8.00% thereafter (the “Applicable Rate”). As of June 30, 2019 , a 50 basis pointincrease or decrease in interest rates would increase or decrease our annual interest expense by approximately $2.8 million.
65

Table of Contents
Item 4. Controls and Procedures
Evaluation of Disclosure Controls and Procedures
We maintain disclosure controls and procedures as that term is defined in Rules 13a-15(e) and 15d-15(e) under the Securities Exchange Act of 1934, asamended (the “Exchange Act”) that are designed to ensure that information required to be disclosed by the Company in reports that it files or submits under theExchange Act, is recorded, processed, summarized and reported within the time periods specified in the SEC’s rules and forms, and that such information isaccumulated and communicated to our management, including our Chief Executive Officer (“CEO”) and our Chief Financial Officer (“CFO”), as appropriate, toallow timely decisions regarding required disclosures. Any controls and procedures, no matter how well designed and operated, can provide only reasonableassurance of achieving the desired control objectives. In accordance with Rule 13a-15(b) of the Exchange Act, we have evaluated, under the supervision of ourCEO and our CFO, the effectiveness of disclosure controls and procedures as of June 30, 2019 . Based on this evaluation, our CEO and our CFO concluded thatour disclosure controls and procedures were effective as of June 30, 2019 at a reasonable assurance level.
Changes in Internal Control Over Financial Reporting
There were no changes in our internal control over financial reporting (as defined in Rule 13a-15(f) under the Exchange Act) that occurred during the periodcovered by this Quarterly Report on Form 10-Q that have materially affected, or is reasonably likely to materially affect, our internal control over financialreporting.
Inherent Limitations on Effectiveness of Disclosure Controls and Procedures
Our Chief Executive Officer, our Chief Financial Officer and other members of management do not expect that our disclosure controls and procedures or ourinternal control over financial reporting will prevent all errors and all fraud. A control system, no matter how well designed and operated, can provide onlyreasonable, not absolute, assurance that the objectives of the control system are met. Because of its inherent limitations, internal control over financial reportingmay not prevent or detect misstatements. Also, projections of any evaluation of effectiveness to future periods are subject to the risk that controls may becomeinadequate because of changes in conditions, or that the degree of compliance with the policies or procedures may deteriorate.
Part II - Other Information
Item 1. Legal Proceedings
For a description of the Company’s legal proceedings, refer to Note 17 , part (d), to the unaudited Condensed Consolidated Financial Statements, which isincorporated herein by reference.
Item 1A. Risk Factors
In addition to the other information set forth in this report, you should carefully consider the factors discussed in the “ Risk Factors ” sections in theCompany’s Annual Report on Form 10-K for the year ended December 31, 2018, together with the cautionary statement under the caption Cautionary NoteRegarding Forward Looking Statements in this report. These described risks are not the only risks we face. Additional risks and uncertainties not currently knownto us or that we currently deem to be immaterial also may materially adversely affect our business, financial condition and/or operating results.
The concurrent loss of, or significant reduction in, purchases by several of our largest customers could materially andadversely affect our revenues and profitability.
Our largest customer during the year ended December 31, 2018 accounted for approximately 16.7% of our total coal revenues, and coal sales to our 10 largestcustomers accounted for approximately 60.1% of our total coal revenues. These customers could decide to discontinue purchasing coal from us in the volumes thatthey have previously purchased or decide to not purchase at all. If several of these customers were concurrently to reduce their purchases of coal significantly, or ifwe were unable to sell coal to them on terms as favorable to us as previous sales, we could face a significant reduction in sales while we attempt to sell the coal toother customers in the global marketplace. If this concurrent loss or significant reduction were to happen, our revenues and profitability could be materially andadversely affected.
Item 2. Unregistered Sales of Equity Securities and Use of Proceeds
66

Table of Contents
The following table summarizes information about shares of common stock that were repurchased during the second quarter of 2019.
Total Numberof Shares
Purchased (1) Average PricePaid per Share
Total Number ofShares Purchasedas Part of Publicly
Announced Share RepurchasePrograms
Approximate DollarValue of Sharesthat May Yet BePurchased Underthe Programs
April 1, 2019 through April 30, 2019 11,959 $ 58.79 — $ —May 1, 2019 through May 31, 2019 — $ — — $ —June 1, 2019 through June 30, 2019 — $ — — $ —
11,959 — $ —(1) The Company is authorized to repurchase common shares from employees (upon the election by the employee) to satisfy the employees’ statutory taxwithholdings upon the vesting of stock grants. Shares that are repurchased to satisfy the employees’ statutory tax withholdings are recorded in treasury stock atcost.
Repurchases related to warrants during the current quarter were immaterial.
Item 4. Mine Safety Disclosures
Information concerning mine safety violations or other regulatory matters required by Section 1503(a) of the Dodd-Frank Wall Street Reform and ConsumerProtection Act and Item 104 of Regulation S-K is included in Exhibit 95 to this Quarterly Report on Form 10-Q.
Item 6. Exhibits
Refer to the Exhibit Index following the signature page to this Quarterly Report on Form 10-Q.
67

Table of Contents
SIGNATURES
Pursuant to the requirements of Section 13 or 15(d) of the Securities Exchange Act of 1934, the registrant has duly caused this report to be signed on its behalfby the undersigned, thereunto duly authorized.
CONTURA ENERGY, INC.Date: August 14, 2019 By: /s/ Charles Andrew Eidson Name: Charles Andrew Eidson Title: Executive Vice President and Chief Financial Officer (Principal Financial Officer and Principal Accounting Officer)
68

Table of Contents
Exhibit Index
Exhibit No. Description of Exhibit3.1 Second Amended and Restated Certificate of Incorporation of Contura Energy, Inc. (incorporated by reference to Exhibit 3.1 to the
Registrant’s Registration Statement on Form S-4 filed with the Commission on August 21, 2018)3.2 Second Amended and Restated Bylaws of Contura Energy, Inc. (incorporated by reference to Exhibit 3.2 to the Registrant’s Registration
Statement on Form S-4 filed with the Commission on August 21, 2018)10.1 Commitment Letter, dated as of May 15, 2019, by and among Contura Energy, Inc. and certain of its existing shareholders (incorporated
by reference to Exhibit 10.1 to the Registrant’s Current Report on Form 8-K filed with the Commission on May 21, 2019)10.2 Amended and Restated Commitment Letter, dated as of May 21, 2019, by and among Contura Energy, Inc. and certain of its existing
shareholders (incorporated by reference to Exhibit 10.2 to the Registrant’s Current Report on Form 8-K filed with the Commission onMay 21, 2019)
10.3 Credit Agreement, dated as of June 14, 2019, by and among Contura Energy, Inc., as the Borrower, Cantor Fitzgerald Securities, asAdministrative Agent and certain lenders party thereto (incorporated by reference to Exhibit 10.1 to the Registrant’s Current Report onForm 8-K filed with the Commission on June 18, 2019)
31* Certifications Pursuant to Rule 13a-14(a) under the Securities Exchange Act of 1934, as adopted pursuant to §302 of the Sarbanes-OxleyAct of 2002
32* Certifications Pursuant to 18 U.S.C. §1350, As Adopted Pursuant to §906 of the Sarbanes-Oxley Act of 200295* Mine Safety Disclosure Exhibit101.INS* XBRL instance document101.SCH* XBRL taxonomy extension schema101.CAL* XBRL taxonomy extension calculation linkbase101.DEF* XBRL taxonomy extension definition linkbase101.LAB* XBRL taxonomy extension label linkbase101.PRE* XBRL taxonomy extension presentation linkbase
* Filed herewith
69

EXHIBIT 31
CERTIFICATIONS
CERTIFICATION OF PRINCIPAL EXECUTIVE OFFICER AND PRINCIPAL FINANCIAL OFFICER
Each of the officers below certifies that:1. I have reviewed this Quarterly Report on Form 10-Q (this “Report”) of Contura Energy, Inc. (the “Registrant”);2. Based on my knowledge, this Report does not contain any untrue statement of a material fact or omit to state a material fact necessary to make the statements
made, in light of the circumstances under which such statements were made, not misleading with respect to the period covered by this Report;3. Based on my knowledge, the financial statements, and other financial information included in this Report, fairly present in all material respects the financial
condition, results of operations and cash flows of the Registrant as of, and for, the periods presented in this Report;4. The Registrant's other certifying officer and I are responsible for establishing and maintaining disclosure controls and procedures (as defined in Exchange Act
Rules 13a-15(e) and 15d-15(e)) for the Registrant and have:a. Designed such disclosure controls and procedures, or caused such disclosure controls and procedures to be designed under our supervision, to ensure that
material information relating to the Registrant, including its consolidated subsidiaries, is made known to us by others within those entities, particularlyduring the period in which this Report is being prepared;
b. Evaluated the effectiveness of the Registrant's disclosure controls and procedures and presented in this Report our conclusions about the effectiveness ofthe disclosure controls and procedures, as of the end of the period covered by this Report based on such evaluation; and
c. Disclosed in this Report any change in the Registrant's internal control over financial reporting that occurred during the Registrant's most recent fiscalquarter (the Registrant's fourth fiscal quarter in the case of an annual report) that has materially affected, or is reasonably likely to materially affect, theRegistrant's internal control over financial reporting; and
5. The Registrant's other certifying officer and I have disclosed to the Registrant's auditors and the audit committee of the Registrant's board of directors (orpersons performing the equivalent functions):a. All significant deficiencies and material weaknesses in the design or operation of internal control over financial reporting which are reasonably likely to
adversely affect the Registrant's ability to record, process, summarize and report financial information; andb. Any fraud, whether or not material, that involves management or other employees who have a significant role in the Registrant's internal control over
financial reporting.
Date: August 14, 2019 By: /s/ David J. StetsonDavid J. StetsonChief Executive Officer(Principal Executive Officer)
Date: August 14, 2019 By: /s/ Charles Andrew EidsonCharles Andrew EidsonExecutive Vice President and Chief Financial Officer(Principal Financial Officer and Principal Accounting Officer)
EXHIBIT 32
CERTIFICATION PURSUANT TO 18 U.S.C. SECTION 1350, AS ADOPTED PURSUANT TO SECTION 906 OF THE SARBANES-OXLEY ACT OF 2002
In connection with the Quarterly Report on Form 10-Q of Contura Energy, Inc. (the “Registrant”) for the period ended June 30, 2019 , as filed with the Securitiesand Exchange Commission on the date hereof (the “Report”), each of the undersigned officers of the Registrant certifies, pursuant to 18 U.S.C. Section 1350, asadopted pursuant to Section 906 of the Sarbanes-Oxley Act of 2002, that to his knowledge:
1) The Report fully complies with the requirements of Section 13(a) or 15(d) of the Securities Exchange Act of 1934; and2) The information contained in the Report fairly presents, in all material respects, the financial condition and results of operations of the Registrant.
Date: August 14, 2019
By: /s/ David J. StetsonDavid J. StetsonChief Executive Officer(Principal Executive Officer)
Date: August 14, 2019 By: /s/ Charles Andrew EidsonCharles Andrew EidsonExecutive Vice President and Chief Financial Officer(Principal Financial Officer and Principal Accounting Officer)

Exhibit 95
Mine Safety and Health Administration Data
Our subsidiaries’ mining operations have consistently been recognized with numerous local, state and national awards over the years for outstanding safetyperformance.
Our behavior-based safety process involves all employees in accident prevention and continuous improvement. Safety leadership and training programs arebased upon the concepts of situational awareness and observation, changing behaviors and, most importantly, employee involvement. The core elements of oursafety training include identification of critical behaviors, frequency of those behaviors, employee feedback and removal of barriers for continuous improvement.
All employees are empowered to champion the safety process. Every person is challenged to identify hazards and initiate corrective actions, ensuring thathazards are addressed in a timely manner.
All levels of the organization are expected to be proactive and commit to perpetual improvement, implementing new safety processes that promote a safe andhealthy work environment.
Our subsidiaries operate multiple mining complexes in three states and are regulated by both the U.S. Mine Safety and Health Administration (“MSHA”) andstate regulatory agencies. As described in more detail in the “Environmental and Other Regulatory Matters” section of our Annual Report on Form 10-K for theyear ended December 31, 2018, the Federal Mine Safety and Health Act of 1977, as amended (the “Mine Act”), among other federal and state laws andregulations, imposes stringent safety and health standards on all aspects of mining operations. Regulatory inspections are mandated by these agencies withthousands of inspection shifts at our properties each year. Citations and compliance metrics at each of our mines and coal preparation facilities vary due to the sizeand type of the operation. We endeavor to conduct our mining and other operations in compliance with all applicable federal, state and local laws and regulations.However, violations occur from time to time. None of the violations identified or the monetary penalties assessed upon us set forth in the tables below has beenmaterial.
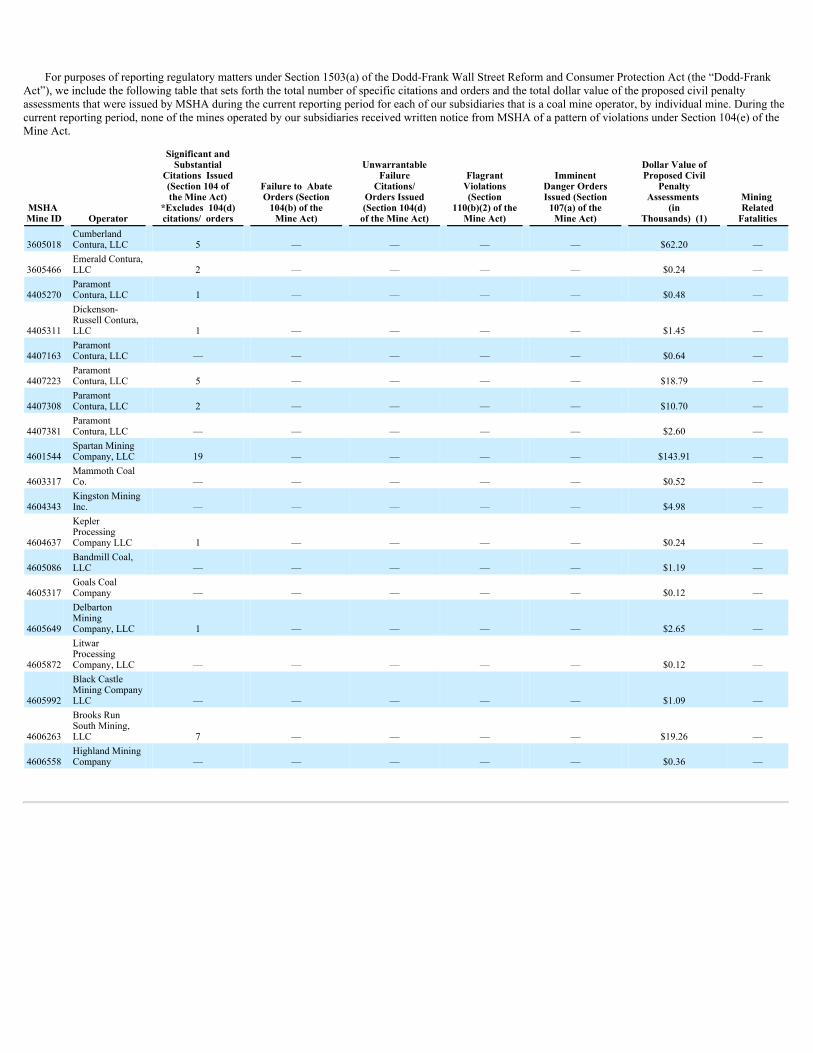
For purposes of reporting regulatory matters under Section 1503(a) of the Dodd-Frank Wall Street Reform and Consumer Protection Act (the “Dodd-FrankAct”), we include the following table that sets forth the total number of specific citations and orders and the total dollar value of the proposed civil penaltyassessments that were issued by MSHA during the current reporting period for each of our subsidiaries that is a coal mine operator, by individual mine. During thecurrent reporting period, none of the mines operated by our subsidiaries received written notice from MSHA of a pattern of violations under Section 104(e) of theMine Act.
MSHA Mine ID Operator
Significant andSubstantial
Citations Issued(Section 104 ofthe Mine Act)
*Excludes 104(d)citations/ orders
Failure to AbateOrders (Section104(b) of theMine Act)
UnwarrantableFailureCitations/
Orders Issued(Section 104(d)of the Mine Act)
FlagrantViolations(Section
110(b)(2) of theMine Act)
ImminentDanger OrdersIssued (Section107(a) of theMine Act)
Dollar Value ofProposed Civil
PenaltyAssessments
(inThousands) (1)
Mining RelatedFatalities
3605018 CumberlandContura, LLC 5 — — — — $62.20 —
3605466 Emerald Contura,LLC 2 — — — — $0.24 —
4405270 ParamontContura, LLC 1 — — — — $0.48 —
4405311
Dickenson-Russell Contura,LLC 1 — — — — $1.45 —
4407163 ParamontContura, LLC — — — — — $0.64 —
4407223 ParamontContura, LLC 5 — — — — $18.79 —
4407308 ParamontContura, LLC 2 — — — — $10.70 —
4407381 ParamontContura, LLC — — — — — $2.60 —
4601544 Spartan MiningCompany, LLC 19 — — — — $143.91 —
4603317 Mammoth CoalCo. — — — — — $0.52 —
4604343 Kingston MiningInc. — — — — — $4.98 —
4604637
KeplerProcessingCompany LLC 1 — — — — $0.24 —
4605086 Bandmill Coal,LLC — — — — — $1.19 —
4605317 Goals CoalCompany — — — — — $0.12 —
4605649
DelbartonMiningCompany, LLC 1 — — — — $2.65 —
4605872
LitwarProcessingCompany, LLC — — — — — $0.12 —
4605992
Black CastleMining CompanyLLC — — — — — $1.09 —
4606263
Brooks RunSouth Mining,LLC 7 — — — — $19.26 —
4606558 Highland MiningCompany — — — — — $0.36 —
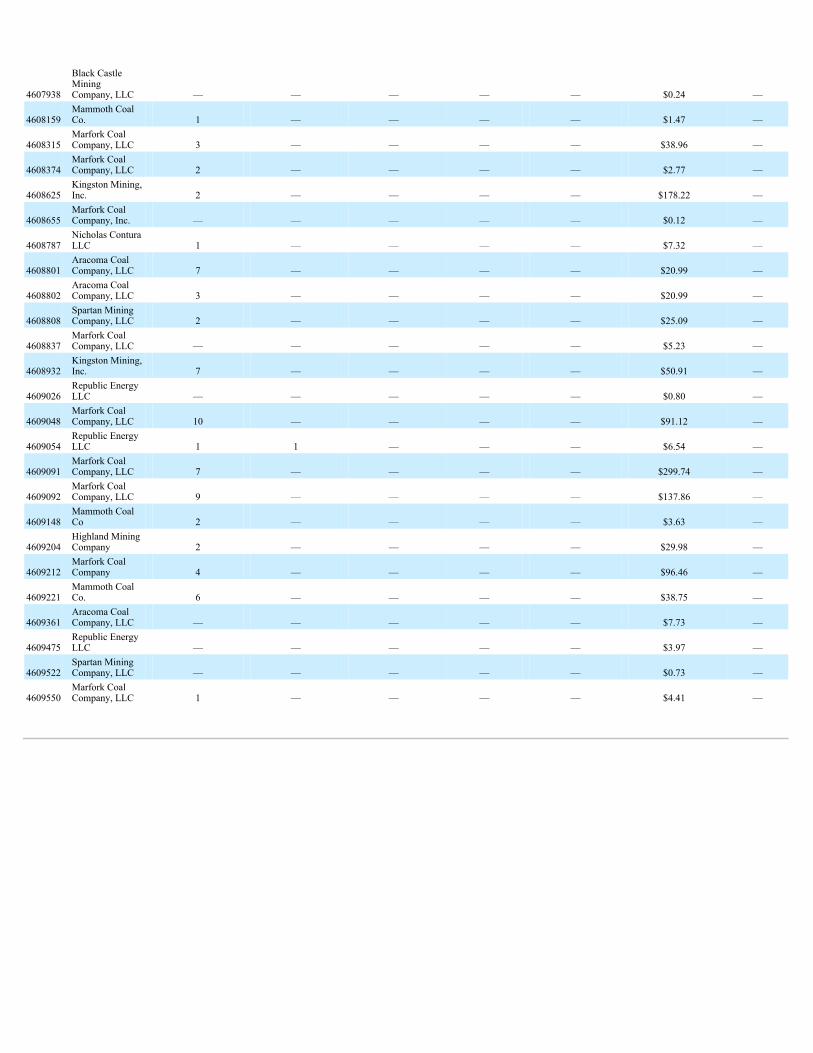
4607938
Black CastleMiningCompany, LLC — — — — — $0.24 —
4608159 Mammoth CoalCo. 1 — — — — $1.47 —
4608315 Marfork CoalCompany, LLC 3 — — — — $38.96 —
4608374 Marfork CoalCompany, LLC 2 — — — — $2.77 —
4608625 Kingston Mining,Inc. 2 — — — — $178.22 —
4608655 Marfork CoalCompany, Inc. — — — — — $0.12 —
4608787 Nicholas ConturaLLC 1 — — — — $7.32 —
4608801 Aracoma CoalCompany, LLC 7 — — — — $20.99 —
4608802 Aracoma CoalCompany, LLC 3 — — — — $20.99 —
4608808 Spartan MiningCompany, LLC 2 — — — — $25.09 —
4608837 Marfork CoalCompany, LLC — — — — — $5.23 —
4608932 Kingston Mining,Inc. 7 — — — — $50.91 —
4609026 Republic EnergyLLC — — — — — $0.80 —
4609048 Marfork CoalCompany, LLC 10 — — — — $91.12 —
4609054 Republic EnergyLLC 1 1 — — — $6.54 —
4609091 Marfork CoalCompany, LLC 7 — — — — $299.74 —
4609092 Marfork CoalCompany, LLC 9 — — — — $137.86 —
4609148 Mammoth CoalCo 2 — — — — $3.63 —
4609204 Highland MiningCompany 2 — — — — $29.98 —
4609212 Marfork CoalCompany 4 — — — — $96.46 —
4609221 Mammoth CoalCo. 6 — — — — $38.75 —
4609361 Aracoma CoalCompany, LLC — — — — — $7.73 —
4609475 Republic EnergyLLC — — — — — $3.97 —
4609522 Spartan MiningCompany, LLC — — — — — $0.73 —
4609550 Marfork CoalCompany, LLC 1 — — — — $4.41 —
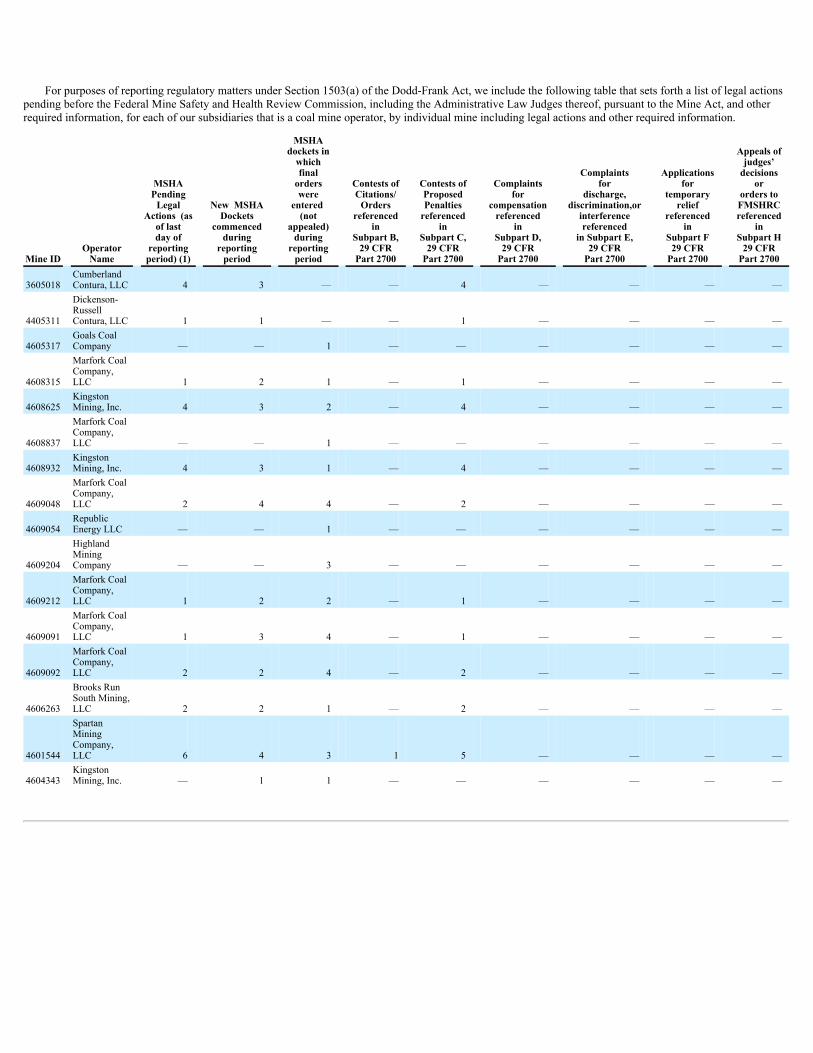
For purposes of reporting regulatory matters under Section 1503(a) of the Dodd-Frank Act, we include the following table that sets forth a list of legal actionspending before the Federal Mine Safety and Health Review Commission, including the Administrative Law Judges thereof, pursuant to the Mine Act, and otherrequired information, for each of our subsidiaries that is a coal mine operator, by individual mine including legal actions and other required information.
Mine ID OperatorName
MSHAPendingLegal
Actions (asof lastday of
reportingperiod) (1)
New MSHADockets
commencedduring
reportingperiod
MSHAdockets inwhichfinalorderswere
entered (not
appealed)during
reportingperiod
Contests ofCitations/Orders
referencedin
Subpart B,29 CFRPart 2700
Contests ofProposedPenaltiesreferenced
inSubpart C,29 CFRPart 2700
Complaintsfor
compensationreferenced
inSubpart D,29 CFRPart 2700
Complaintsfor
discharge,discrimination,orinterferencereferenced
in Subpart E,29 CFRPart 2700
Applicationsfor
temporaryrelief
referencedin
Subpart F29 CFRPart 2700
Appeals ofjudges’decisions
ororders toFMSHRCreferenced
inSubpart H29 CFRPart 2700
3605018 CumberlandContura, LLC 4 3 — — 4 — — — —
4405311
Dickenson-RussellContura, LLC 1 1 — — 1 — — — —
4605317 Goals CoalCompany — — 1 — — — — — —
4608315
Marfork CoalCompany,LLC 1 2 1 — 1 — — — —
4608625 KingstonMining, Inc. 4 3 2 — 4 — — — —
4608837
Marfork CoalCompany,LLC — — 1 — — — — — —
4608932 KingstonMining, Inc. 4 3 1 — 4 — — — —
4609048
Marfork CoalCompany,LLC 2 4 4 — 2 — — — —
4609054 RepublicEnergy LLC — — 1 — — — — — —
4609204
HighlandMiningCompany — — 3 — — — — — —
4609212
Marfork CoalCompany,LLC 1 2 2 — 1 — — — —
4609091
Marfork CoalCompany,LLC 1 3 4 — 1 — — — —
4609092
Marfork CoalCompany,LLC 2 2 4 — 2 — — — —
4606263
Brooks RunSouth Mining,LLC 2 2 1 — 2 — — — —
4601544
SpartanMiningCompany,LLC 6 4 3 1 5 — — — —
4604343 KingstonMining, Inc. — 1 1 — — — — — —

4407381 ParamontContura, LLC 1 1 — — 1 — — — —
(1) The MSHA proposed assessments issued during the current reporting period do not necessarily relate to the citations or orders issued by MSHA during the current reporting period or to thepending Legal Actions reported herein.