Embed Size (px)
Citation preview

General rights Copyright and moral rights for the publications made accessible in the public portal are retained by the authors and/or other copyright owners and it is a condition of accessing publications that users recognise and abide by the legal requirements associated with these rights.
Users may download and print one copy of any publication from the public portal for the purpose of private study or research.
You may not further distribute the material or use it for any profit-making activity or commercial gain
You may freely distribute the URL identifying the publication in the public portal If you believe that this document breaches copyright please contact us providing details, and we will remove access to the work immediately and investigate your claim.
Downloaded from orbit.dtu.dk on: Apr 02, 2022
Common solar simulation and validation in EuropeA report presenting work of the CEC modelling group for SHS and DHW
Jørgensen, Ove
Publication date:1982
Document VersionPublisher's PDF, also known as Version of record
Link back to DTU Orbit
Citation (APA):Jørgensen, O. (1982). Common solar simulation and validation in Europe: A report presenting work of the CECmodelling group for SHS and DHW. Technical University of Denmark, Department of Civil Engineering.
THERMAL INSULAION LABORATORY
TECHNICAL UNIVERSITY OF DENMARK
COMMON SOLAR SIMULATION AND VALIDATION IN EUROPE
" A report presenting work of the CEC modelling group for SHS and DHW"
Ove Jargensen
February 1982 report no.1 19


P r e f a c e
The Commission of t h e European Communities i s , a s p a r t of
i t s S o l a r Energy Programme, c o n d u c t i n g a Research and D e -
velopment programme on S o l a r Energy A p p l i c a t i o n s f o r D w e l -
l i n g s , The c o o p e r a t i v e work w i t h i n t h e European Model l ing
Group f o r S o l a r Hea t ing Systems and Domestic Hot Water i s
one of t h e a c t i v i t i e s u n d e r t a k e n w i t h i n t h i s programme,
During t h e f i r s t one and a h a l f y e a r s of o p e r a t i o n of t h e
c u r r e n t CEC 4-year programme t h i s g roup h a s u n d e r t a k e n work
i n t h e f o l l o w i n g a r e a s :
a n a l y s i s of d a t a from t h e S o l a r P i l o t T e s t F a c i l i t i e s
v a l i d a t i o n of s i m u l a t i o n models
pa ramete r s e n s i t i v i t y a n a l y s e s
i n v e s t i g a t i o n o f s i m p l i f i c a t i o n s and assunipt ions i n
s i m u l a t i o n models
simpl-if i e d d e s i g n methods
These a c t i v i t i e s have n o t o n l y been c o - o r d i n a t e d w i t h i n t h e
g roup b u t a l s o performed i n c l o s e c o o p e r a t i o n w i t h two o t h e r
c o n c e r t e d a c t i o n s w i t h i n t h e CEC programme f o r S o l a r Energy
A p p l i c a t i o n s f o r Dwel l ings : The S o l a r P i l o t T e s t F a c i l i t i e s
Group and t h e Performance Moni tor ing Group.
T h i s r e p o r t c o n s t i t u t e s a d e t a i l e d summary of t h e work done
i n t h e CEC Modell ing Group d u r i n g t h e 18-month p e r i o d from
J a n u a r y 1980 t o J u l y 1981. The i n t e n t i o n s have been t o p r e -
s e n t i l l u s t r a t i v e examples of t h e e x t e n s i v e amount of r e s u l t s
p r e s e n t e d i n t h e i n d i v i d u a l r e p o r t s , t o g i v e a p i c t u r e of t h e
n a t u r e of t h e work and, a t t h e same t i m e , draw some g e n e r a l
c o n c l u s i o n s on t h e b a s i s of t h e r e s u l t s . Most of t h e work
h a s been p r e s e n t e d by t h e i n d i v i d u a l p a r t i c i p a n t s i n t h e i r
summary r e p o r t s , r e f . 5-14, and h a s been p r e s e n t e d i n a l e s s
comple te form i n t h e p r o g r e s s r e p o r t s produced d u r i n g t h e work.
February 28, 1982
Ove J Q r g e n s e n

Table of contents
1 . Introduction ................................. l
2 . Description of simulation models ............. 7
3 . Parameter sensitivity analyses ............... 15
3.1 Parameter sensitivity analysis I ............. 15
3 . 2 Parameter sensitivity analysis 11 ............ 15
3 . 3 Parameter sensitivity analysis III ........... 16
................... 4 . Common validation i e . . e e m . e 3 3
.................. 4.1 Description of the activity 3 3
4.2 Common validation on data from the Danish SPTF installation ............................ 34
4.3 Common validation on data from the Belgian SPTF installation ............................ 3 8
.......................... 5 . National validation 55
5.1 Country by country presentation .............. 55
6 . Validation of simplified methods ............. 8 7
6 . 1 Introduction ................................. 8 7
6 . 2 Description of the CFC-2 method .............. 8 7
6 . 3 Results ...................................... 8 9
6 . 4 Conclusions .................................. 9 0
7 . S p e c i f i c ta.xk.s ............................... 93
................................. "l . L In.krod~.action 93
' 7 .2 U i f f e r e n t i a l e q u a t i o n s s o l u t i o n methods ..... 93
7 . 3 Accuracy of c o l l e c t o r t o p Loss model l ing .... 9 4
7 . 4 GoS.Lector e f f i c i e n c y c u r v e .................. 95
7.5 System dynamics ............................. 97
7 .6 'Time s t e p ..................................a. 98
7 . 7 S t a t i s t i c a l a n a l y s i s of PT'F--vali.dation c a l c u l a t i o n s .............................=.. 99
7 . 8 D e t a i l e d s t u d i e s of components .............. 99
7 .9 Measured . coll.ec.t.or performance .............. l 0 0
'7 .10 S t a t i s t i c a l v a l . i d a t i o n methods .............. 1 0 1
.................... 7 . 1 1 Extrapo. la . t iou~ of r e s u l t s 101
7.1.2 'Teanperature s t : r a t i f i c a t i o n .j in s t o r a g e .tank . . 102
-tee 8
8 . Conc lus ions ................................. l11
8 . l O b j e c t i v e s .................................. 111
8 . 2 Parameter s e n s i t i v i t y anaZyses .............. 111-
8 . 3 V a l i d a - t i o n of s i m u l a t i o n model-s ............. 1 1 2
8 . 4 Recommendations f o r v a l i d a t i o n .............. 113
8 . 5 Recommendations f o r mode l l ing ............... 113
8 . Q V a l i d a t i o n of si .rnplifi .ed methods ............ 11.4
8 .7 F u t u r e work . . . . . . . .S.. . . . . .o. . . . . . . . . . . . . . . . 115
8 - 8 Concluding remarks .......................... 115
L i s t o f r e f e r e n c e s ............................... 117
Appendix I: I n s t a l l a t i o n B e s c r i p t o r
Appendix 2 : PTF Log S h e e t
Appendix 3 : Address L i s t of P a r t i c i p a n t s

CHAPTER 1
INTRODUCTION


l. I N T R O D U C T I O N
I n v e s t i g a t i o n o f t h e performance of s o l a r h e a t i n g sys tems
was b o t h n a k i o n a l l y and i n t e r n a t i o n a l l y r e c o g n i s e d a s a
m a t t e r of g r e a t impor tance i n 1979 when t h e c u r r e n t CEC
4-year programme was i n i t i a t e d . I t was r e a l i s e d t h a t t h e
n e t ene rgy o u t p u t o f a s o l a r system was n o t o n l y a q u e s t i o n
o f component performance b u t a l s o of sys tem performance .
For t h e CEC programme t h e r e s u l t o f t h i s meant t h e i n i t i a t i o n
of t h r e e c o n c e r t e d a c t i o n s : The S o l a r P i l o t T e s t F a c i l i t y
Group (SPTFG), t h e Performance Moni tor ing Group (PMG) and
t h e Model l ing Group f o r S o l a r Hea t ing Systems and Domestic
Hot Water Systems (MG) . The work of t h e Model l ing Group was o f f i c i a l l y i n i t i a t e d
a t i t s f i r s t meet ing which took p l a c e i n B r u s s e l s , J a n u a r y
16-17, 1980. I n v i t e d t o t h i s meet ing w e r e t h e p a r t i c i p a n t s
of t h e a l r e a d y e x i s t i n g Model l ing Group which had been i n
o p e r a t i o n s i n c e 1977, see r e f . 1 and 2 . B e f o r e t h e mee t ing
t h e p a r t i c i p a n t s had p rov ided t h e c o o r d i n a t o r w i t h t h e i r
p r o p o s a l s f o r t h e n e x t 4-year programme. The f o l l o w i n g seven
p o i n t s o f i n t e r e s t w e r e s t a t e d :
l, V a l i d a t i o n of s i m u l a t i o n mcdels
2 . Development of models
3. S e n s i t i v i t y a n a l y s i s
4 . Model l ing of a l t e r n a t i v e sys tems
5. Development o f s i m p l i f i e d methods
6 . The economics o f s o l a r sys tems i n t h e CEC c o u n t r i e s
7. V a l i d a t i o n of s i m p l i f i e d methods
I t i s v e r y c l e a r l y s e e n t h a t t h e s e a c t i v i t i e s c a n be d i v i d e d
i n t o two a r e a s , one f o r s i m u l a t i o n models and one f o r s i m p l i -
f i e d methods. T h i s d i v i s i o n and t h e e x i s t e n c e o f t h e S o l a r
P i l o t T e s t F a c i l i t y Group and t h e Performance Moni to r ing
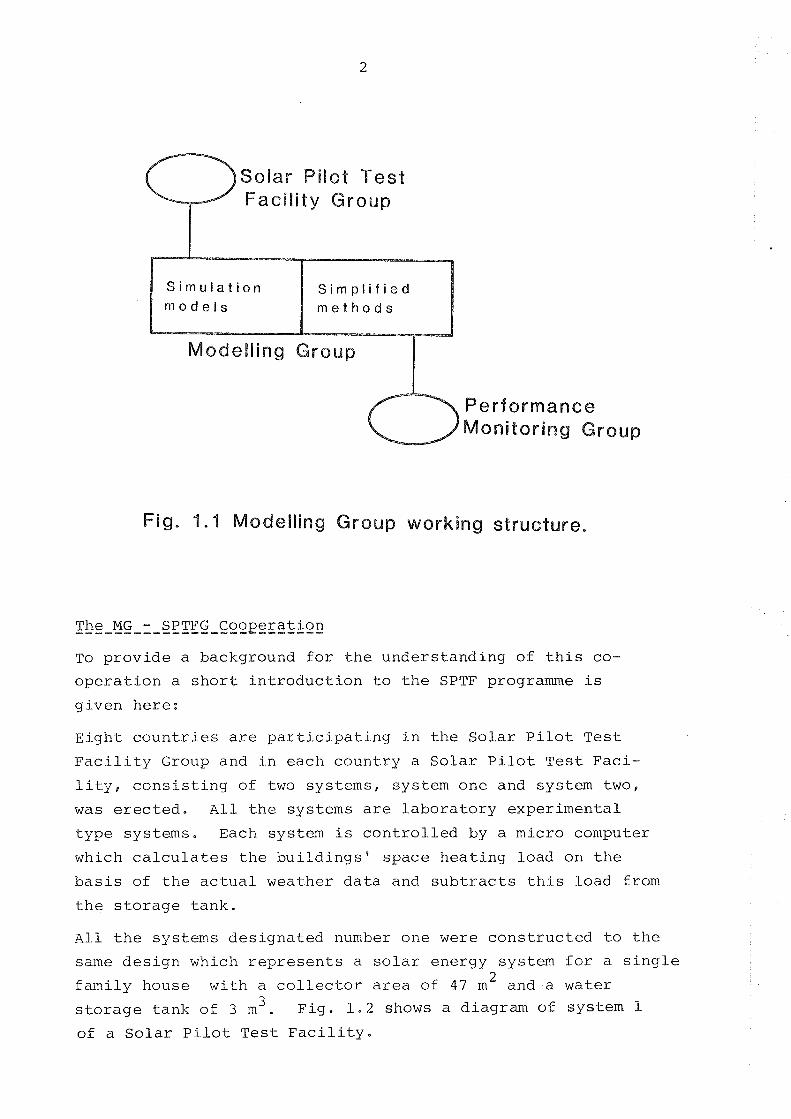
Group s t r u c t u r e d t h e programme a s ske tched on f i g . 1.1.
Solar Pilot "$S%
Faci l i ty Group
S i m u l a t i o n
Modelling Group
Performance Monitoring Group
Fig. 1.1 Modelling Group working structure.
The MG - SPTFG C o o ~ e r a t i o n ------------------ To p r o v i d e a background f o r t h e u n d e r s t a n d i n g of t h i s co-
o p e r a t i o n a s h o r t i n t r o d u c t i o n t o t h e SPTF programme i s
g i v e n h e r e :
E i g h t c o u n t r i e s a r e p a r t i c i p a t i n g i n t h e S o l a r P i l o t T e s t
F a c i l i t y Group and i n each c o u n t r y a S o l a r P i l o t T e s t F a c i -
l i t y , c o n s i s t i n g of two sys tems , sys tem one and system two,
was e r e c t e d . A 1 1 t h e sys tems a r e l a b o r a t o r y e x p e r i m e n t a l
t y p e sys tems . Each system i s c o n t r o l l e d by a micro computer
which c a l c u l a t e s t h e b u i l d i n g s ' s p a c e h e a t i n g l o a d on t h e
b a s i s of t h e a c t u a l weather d a t a and s u b t r a c t s t h i s l o a d from
t h e s t o r a g e t a n k .
A l l t h e sys tems d e s i g n a t e d number one w e r e c o n s t r u c t e d t o t h e
same d e s i g n which r e p r e s e n t s a s o l a r ene rgy system f o r a s i n g l e
f a m i l y house w i t h a c o l l e c t o r a r e a of 4 7 m 2 and a w a t e r 3 s t o r a g e t a n k of 3 m . F i g . 1 . 2 shows a d iagram of sys tem 1
of a S o l a r P i l o t T e s t F a c i l i t y .

TANK I S I
PACE HEATING LOAD
PUMP PUMP
Fig. 1-2 The CEC Solar Pilot Test Facility, System 1.
As seen from the diagram the solar system incorporates two
collecting Loops separated by a heat exchanger, At the be-
ginning of the program the two pumps were always running and
the 3-way valve at the collector outlet was used to control
the system. When there is energy available for collection,
the valve diverts the fluid flow through the heat exchanger
and otherwise by-passes it.
The independence of primary and secondary loops enables con-
tinuous running of the secondary loop pump, thus minimizing
the stratification in the solar storage.
The systems are very extensively monitored and data can be
taken and stored on magnetic tape cassettes at any time-
interval from 5 minutes to one hour. For more information on
the different systems in the countries (SS2) see ref. 23.
The primary aim of the work in the Modelling Group was to
validate the simulation models in the group, using data from
the 8 SPTF system 1 (SS1) in the different countries. To
make effective use of the data available from the SPTF Group
it was necessary to develop some formal way of information
exchange about the data. Two formats were identified:

a log sheet and
an installation descriptor
The log sheets (see example in Appendix 2) were developed to
pass information on the data on a given cassette (i.e. time
periods, weather, problems, etc,), and the installation de-
scriptor (see Appendix l) was made to present the system pa-
rameters in a uniform way for eash system variant. Thus, for
each cassette of data a log sheet and an installation de-
scriptor would be included to make the data useful to the
modeller for validation purposes.
This formality was necessary as it should be possible to di-
stribute data obtained from any of the SSlls to any of the
modellers without the cisk of misunderstandings, for example:
Which collector area was used when these data were taken?
During the working period such problems did not occur, which
proves the value of these documents.
The MG - PMG Cooperation
The Performance Monitoring Group had developed a format for
the presentation of the performance of solar systems, and a
number of systems has already been and were continuously
being reported in this format. The objective of the coopera-
tion between the Modelling Group and the PMG was to investi-
gate the viability of using the information in the formats
to validate simplified design methods.
The MG Workinq Plan
~t the initiating meeting mentioned above, the group agreed on
some short term and some long term goals. On the basis of
these goals the detailed working programme was sketched out.
As this programme dealt with two levels of cooperation it had
to be very flexible and adjustable, as the work progressed.
A total number of five meetings were held during the working
period in order to coordinate the programme and to discuss
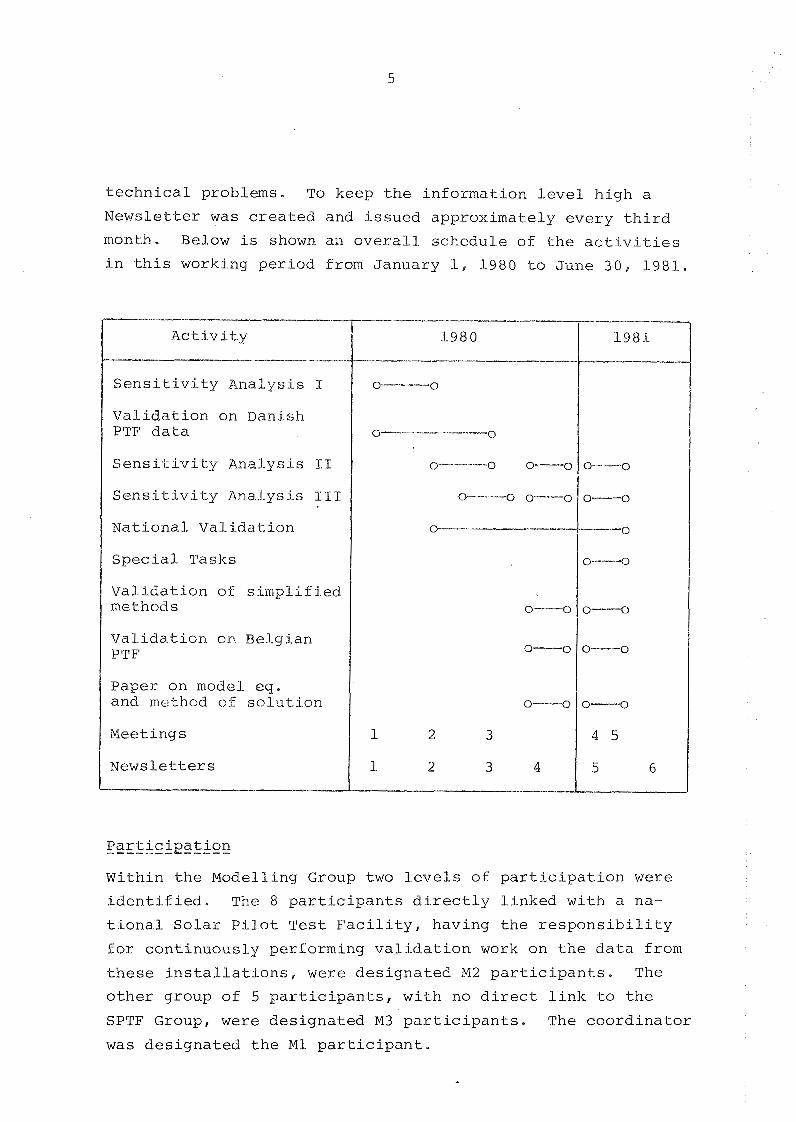
technical problems. To keep the information level high a
Newsletter wa,s created and issued approximately every third
month, Below is shown an overall schedule of the activities
in this working period from January 1, 1980 to June 30, 1981.
Activity - - -
Sensitivity Analysis I
Validation on Danish PTF data
Sensitivity Analysis 19
Sensitivity Analysis I%I
National Validation
Special Tasks
Validation of simplified methods
Validation on Belgian PTF
Paper on model eg. and method of solution
Meetings
Newsletters
Partici~ation
Within the Modelling Group two levels of participation were
identified. The 8 participants directly linked with a na-
tional Solar Pilot Test Facility, having the responsibility
for continuously performing validation work on the data from
these installations, were designated M 2 participants. The
other group of 5 participants, with no direct link to the
SPTF Group, were designated M 3 participants. The coordinator
was designated the M1 participant.
As the validation of simulation models, using data from the
SPTF's, was the main objective of the total programme for
the Modelling Group, there was a significant difference be-
tween the size of the budget for these two groups. The M3-
participants had a very small budget, but were, on the other
hand, free to selectively take part in any of the activities
of the group.
Appendix 3 contains a list of the participants in the Model-
ling Group.

CHAPTER 2
DESCRIPTION OF
SIMULATION MODELS

DESCRIPTION OF SIMULATION PiIODELS
The s i m u l a t i o n of s o l a r h e a t i n g sys tems a lways i m p l i e s
s t e p w i s e s o l v i n g o f a number of d i f f e r e n t i a l e q u a t i o n s ,
one f o r each s i g n i f i c a n t c a p a c i t y of t h e system.
Thus t h e p h y s i c a l b a s i s o f t h e models i s a lways t h e same:
a d i f f e r e n t i a l e q u a t i o n . What makes t h e model d i f f e r a r e
t h e assumpt ions and d e c i s i o n s t a k e n by t h e m o d e l l e r .
F i r s t : What a r e t h e s i g n i f i c a n t c a p a c i t i e s ? The t a n k ?
The c o l l e c t o r and t h e t a n k ? The p i p e s ? The h e a t exchanger?
The n e x t assumpt ion made h a s t o do w i t h t h e component i n t e r -
a c t i o n s and t h e system i n t e r a c t i o n w i t h t h e envi ronment .
Again, o n l y t h e assumed s i g n i f i c a n t c o n t r i b u t i o n s a r e ac -
coun ted f o r t o a v o i d t o o complex a model. A t t h i s s t e p t h e
m o d e l l e r a l s o has t o d e c i d e on whether t o l i n e a r i z e t h e s e
i n t e r a c t i o n s o r t o keep them n o n - l i n e a r and c l o s e r t o t h e
p h y s i c a l r e a l i t y , e . g . t e m p e r a t u r e dependency of l o s s c o e f -
f i c i e n t s , f l o w s and c o n d u c t i o n t e r m s .
F i n a l l y , t h e m o d e l l e r must choose a d i f f e r e n t i a l e q u a t i o n
s o l u t i o n t e c h n i q u e , The se t of l i n e a r o r n o n - l i n e a r e q u a t i o n s
c a n e i t h e r be s o l v e d s e q u e n t i a l l y o r s i m u l t a n e o u s l y . The
a c t u a l i n t e g r a t i o n o f t h e d i f f e r e n t i a l e q u a t i o n s o v e r a t i m e
s t e p can e i t h e r be done a n a l y t i c a l l y o r by assuming l i n e a r i t y
by a p p l y i n g a d i f f e r e n t i a l q u o t i e n t , developed one way o r
t h e o t h e r f o r t h e whole t i m e s t e p . I n most c a s e s o n l y t h e
l a t t e r approach p roves p r a c t i c a l .
~ h u s a number of a s sumpt ions and d e c i s i o n s a r e t a k e n by t h e
m o d e l l e r when deve lop ing a p a r t i c u l a r model. An i m p o r t a n t
o b j e c t i v e o f t h i s work was t o c a s t l i g h t upon t h e impact on
t h e r e s u l t s of t h e assumpt ions and o p t i o n s .
The f a c t t h a t a number of t h e d i f f e r e n t p o s s i b l e p a t h s i n t h e
model development were covered by t h e models of t h e p a r t i c i -
p a n t s i n t h e Mode1li.ng Group made it f e a s i b l e t o approach
t h i s o b j e c t i v e by u s i n g t h e models on t h e same problems and
a n a l y s e t h e r e s u l t s .
To accompl ish t h i s o b j e c t i v e u s i n g t h e models o f t h e pa r -
t i c i p a n t s i n t h e Model l ing Group, t h e f i r s t n e c e s s i t y i s .to
e s t a b l i s h a n overv iew and c l a s s i f i c a t i o n o f t h e s e models
w i t h r e s p e c t t o t h e above mentioned assumpt ions and d e c i s i o n s
upon which t h e models a r e b u i l t . A t o t a l number o f n i n e s i-
m u l a t i o n models w e r e used by a s many d i f f e r e n t p a r t i c i p a n t s ,
When r e f e r r i n g t o t h e models t h e n a t i o n a l au tomobi le code
i s u s e d , i . e . B , D , D K , e t c .
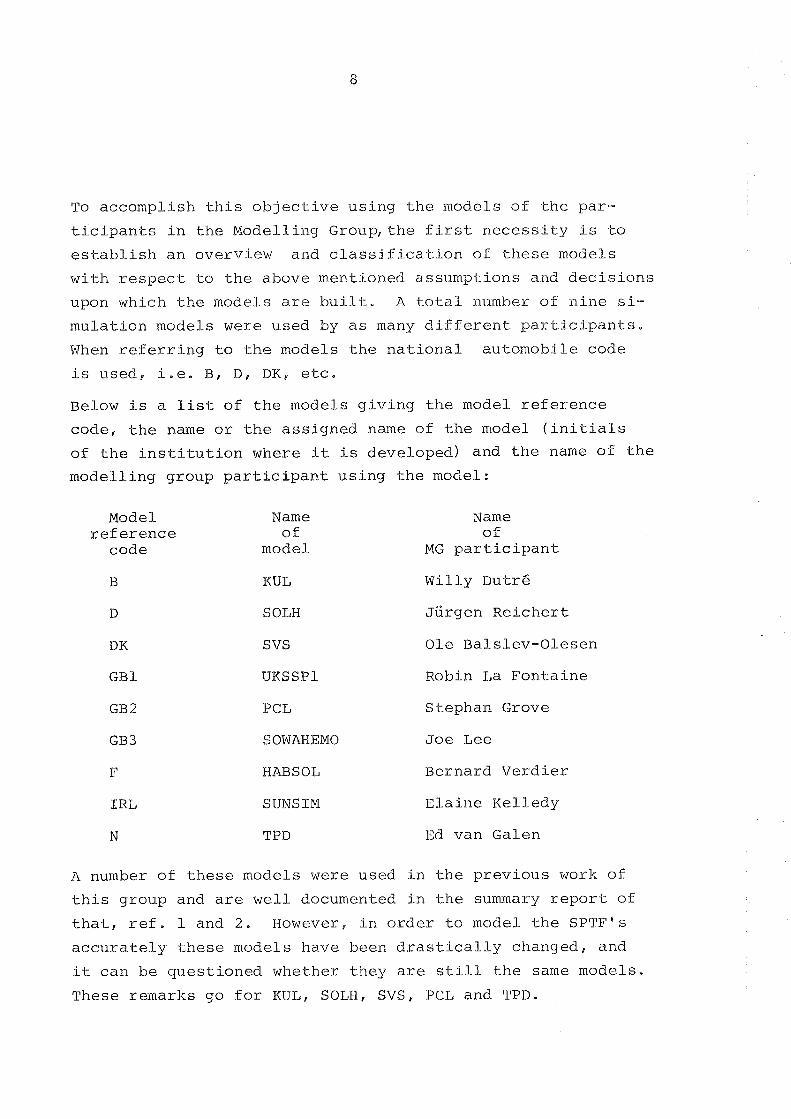
Below i s a l i s t of t h e models g i v i n g t h e model r e f e r e n c e
code , t h e name o r t h e a s s i g n e d name of t h e model ( i n i t i a l s
of t h e i n s t i t u t i o n where it i s developed) and t h e name of t h e
m o d e l l i n g g roup p a r t i c i p a n t u s i n g t h e model:
Model r e £ e r e n c e
code
Name of
model
Name o f
MG p a r t i c i p a n t
B KUL W i l l y Dutr6
D SOLH ~ G r g e n R e i c h e r t
DK SVS O l e Ba l s l ev -Olesen
G B 1 UKSSPl Robin La F o n t a i n e
GB 2 PCL S tephan Grove
GB3 SOWAHEMO J o e Lee
F MABSOL Bernard V e r d i e r
I R L SUNSIM E l a i n e Ke l l edy
N TPD Ed van Galen
A number o f t h e s e models were used i n t h e p r e v i o u s work o f
t h i s g roup and a r e w e l l documented i n t h e summary r e p o r t of
t h a t , r e f . l and 2 . However, i n o r d e r t o model t h e SPTFss
a c c u r a t e l y t h e s e models have been d r a s t i c a l l y changed, and
it c a n be q u e s t i o n e d whether t h e y a r e s t i l l t h e same models .
These remarks go f o r KUL, SOLH, SVS, PCL and TPD.
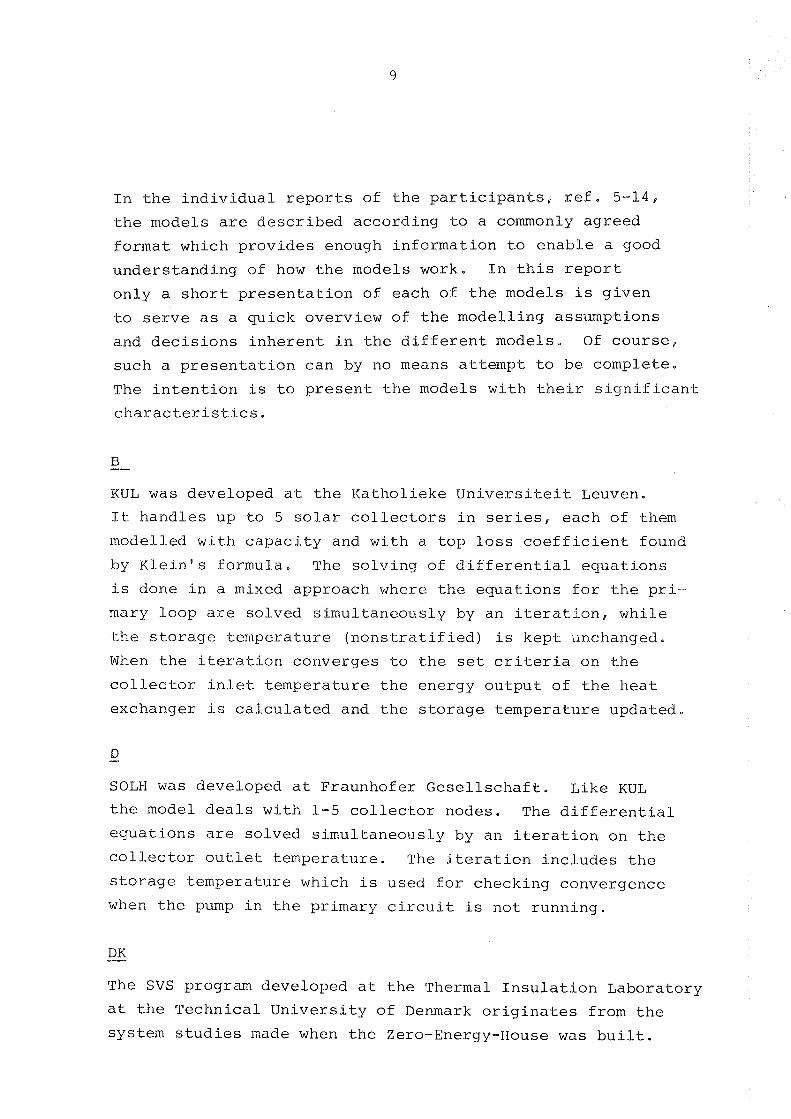
In the individual reports of the participants, ref. 5-14,
the models are described according to a commonly agreed
format which provides enough information to enable a good
understanding of how the models work. In this report
only a short presentation of each of the models is given
to serve as a quick overview of the modelling assumptions
and decisions inherent in the different models. Of course,
such a presentation can by no means attempt to be complete.
The intention is to present the models with their significant
characteristics.
KUL was developed at the Katholieke Universiteit Leuven.
It handles up to 5 solar collectors in series, each of them
modelled with capacity and with a top loss coefficient found
by Kleinqs formula, The solving of differential equations
is done in a mixed approach where the equations for the pri-
mary loop are solved simultaneously by an iteration, while
the storage temperature (nonstratified) is kept unchanged.
When the iteration converges to the set criteria on the
collector inlet temperature the energy output of the heat
exchanger is calculated and the storage temperature updated.
SOLH was developed at Fraunhofer Gesellschaft. Like KUL
the model deals with 1-5 collector nodes. The differential
equations are solved simultaneously by an iteration on the
collector outlet temperature. The iteration includes the
storage temperature which is used for checking convergence
when the pump in the primary circuit is not running.
The SVS program developed at the Thermal Insulation Laboratory
at the Technical University of Denmark originates from the
system studies made when the Zero-Energy-House was built.
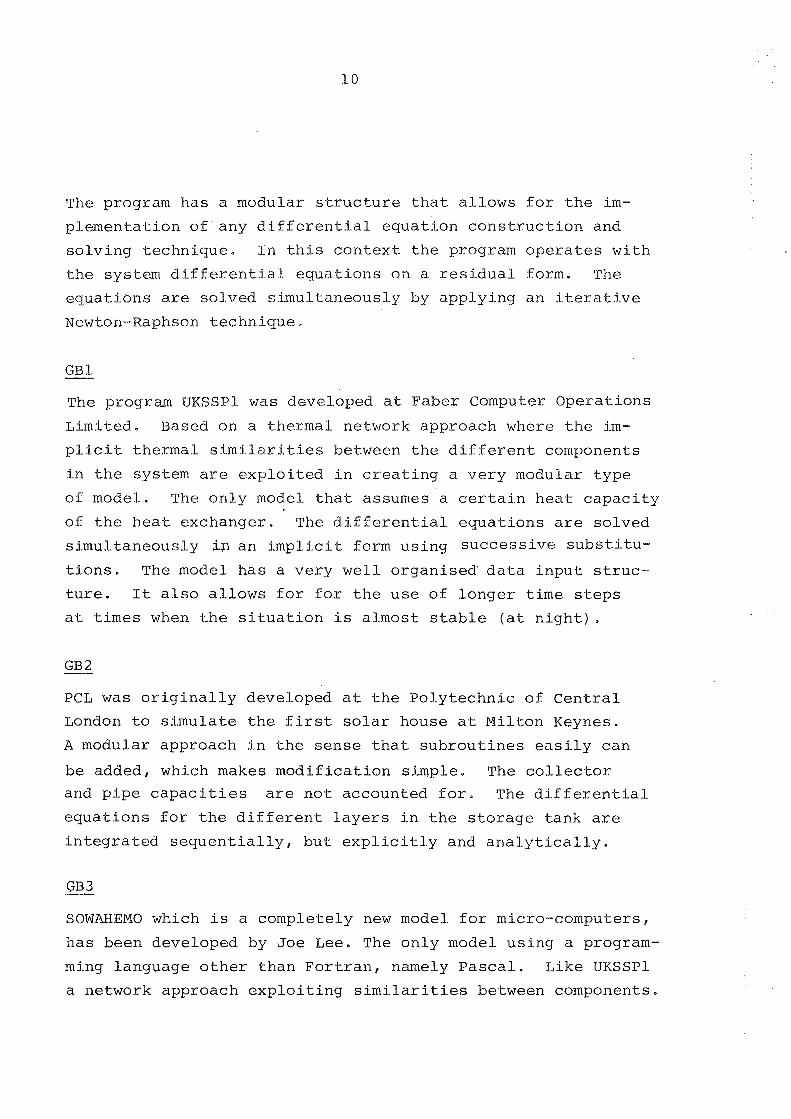
The program h a s a modular s t r u c t u r e t h a t a l l o w s f o r t h e i m -
p l e m e n t a t i o n of any d i f f e r e n t i a l e q u a t i o n c o n s t r u c t i o n and
s o l v i n g t e c h n i q u e . I n t h i s c o n t e x t t h e program o p e r a t e s w i t h
t h e sys tem d i f f e r e n t i a l e q u a t i o n s on a r e s i d u a l form. The
e q u a t i o n s a r e s o l v e d s i m u l t a n e o u s l y by a p p l y i n g a n i t e r a t i v e
Newton-Raphson t e c h n i q u e ,
The program UKSSPl was developed a t Faber Computer O p e r a t i o n s
Limi ted . Based on a t h e r m a l network approach where t h e i m -
p l i c i t t h e r m a l s i m i l a r i t i e s between t h e d i f f e r e n t components
i n t h e system a r e e x p l o i t e d i n c r e a t i n g a v e r y modular t y p e
of model. The o n l y model t h a t assumes a c e r t a i n h e a t c a p a c i t y
of t h e h e a t exchanger , The d i f f e r e n t i a l e q u a t i o n s a r e s o l v e d
s i m u l t a n e o u s l y i~ a n i m p l i c i t form u s i n g s u c c e s s i v e s u b s t i t u -
t i o n s . The model h a s a v e r y w e l l o rgan i sed ' d a t a i n p u t s t r u c -
t u r e . I t a l s o a l l o w s f o r f o r t h e u s e o f l o n g e r t i m e s t e p s
a t t i m e s when t h e s i t u a t i o n i s a l m o s t s t a b l e ( a t n i g h t ) .
PCL was o r i g i n a l l y developed a t t h e P o l y t e c h n i c of C e n t r a l
London t o s i m u l a t e t h e f i r s t s o l a r house a t M i l t o n Keynes.
A modular approach i n t h e s e n s e t h a t s u b r o u t i n e s e a s i l y can
be added, which makes m o d i f i c a t i o n s imple . The c o l l e c t o r
and p i p e c a p a c i t i e s a r e n o t accounted f o r . The d i f f e r e n t i a l
e q u a t i o n s f o r t h e d i f f e r e n t l a y e r s i n t h e s t o r a g e t a n k a r e
i n t e g r a t e d s e q u e n t i a l l y , b u t e x p l i c i t l y and a n a l y t i c a l l y .
GB 3
SOWAHEMO which i s a comple te ly new model f o r micro-computers ,
h a s been developed by J o e L e e . The o n l y model u s i n g a program-
ming l anguage o t h e r t h a n F o r t r a n , namely P a s c a l . L i k e UKSSPl
a network approach e x p l o i t i n g s i m i l a r i t i e s between components.
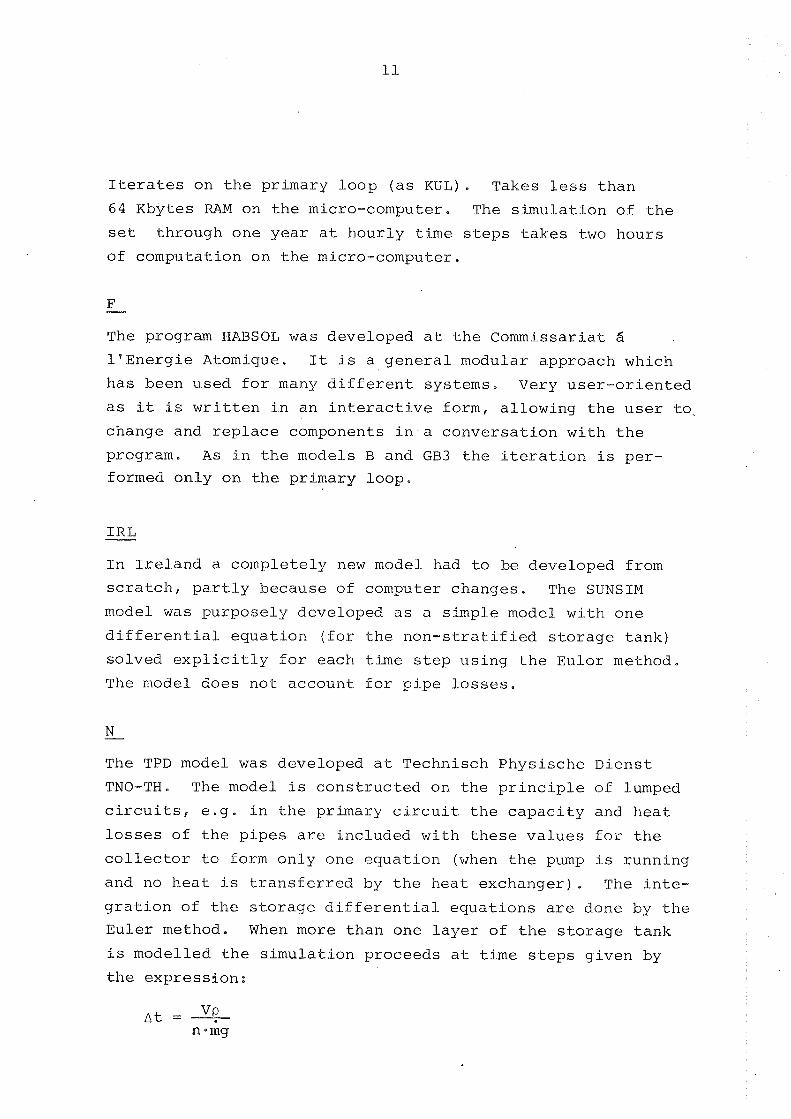
I t e r a t e s on t h e pr imary l o o p ( a s K U L ) . Takes less t h a n
6 4 Kbytes RAM on t h e micro-computer , The s i m u l a t i o n o f t h e
se t th rough one y e a r a t h o u r l y t i m e s t e p s t a k e s two h o u r s
o f computa t ion on t h e micro-computer .
The program HABSOL was developed a t t h e Commissariat S
l q E n e r g i e Atomigue. I t i s a g e n e r a l modular approach which
h a s been used f o r many d i f f e r e n t sys tems . Very u s e r - o r i e n t e d
a s it i s w r i t t e n i.n a n i n t e r a c t i v e form, a l l o w i n g t h e u s e r to .
change and r e p l a c e components i n . a c o n v e r s a t i o n w i t h t h e
program. A s i n t h e models B and GB3 t h e i t e r a t i o n i s p e r -
formed o n l y on t h e p r imary l o o p .
IRL P
I n I r e l a n d a c o m p l e t e l y new model had t o be developed from
s c r a t c h , p a r t l y because o f computer changes . The SUNSIM
model was p u r p o s e l y developed a s a s i m p l e model w i t h one
d i f f e r e n t i a l e q u a t i o n ( f o r t h e n o n - s t r a t i f i e d s t o r a g e t a n k )
s o l v e d e x p l i c i t l y f o r e a c h , t i m e s t e p u s i n g t h e E u l o r method.
The model d o e s n o t a c c o u n t f o r p i p e l o s s e s .
The TPD model was developed a t Technisch P h y s i s c h e D i e n s t
TNO-TH. The model i s c o n s t r u c t e d on t h e p r i n c i p l e of lumped
c i r c u i t s , e . g . i n t h e pr imary c i r c u i t t h e c a p a c i t y and h e a t
l o s s e s of t h e p i p e s a r e i n c l u d e d w i t h t h e s e v a l u e s f o r t h e
c o l l e c t o r t o form o n l y one e q u a t i o n (when t h e pump i s runn ing
and no h e a t i s t r a n s f e r r e d by t h e h e a t e x c h a n g e r ) , The i n t e -
g r a t i o n o f t h e s t o r a g e d i f f e r e n t i a , - e q u a t i o n s a r e done by t h e
E u l e r method. When more t h a n one l a y e r of t h e s t o r a g e t a n k
i s model led t h e s i m u l a t i o n p roceeds a t t i m e s t e p s g i v e n by
t h e e x p r e s s i o n :

where 3 V = t o t a l volume of h e a t s t o r a g e system ( m )
p = d e n s i t y of w a t e r (kg/m3)
n = number of s e c t i o n s i n t h e s t o r a g e
&g = mass f l o w r a t e i.n t h e secondary c o l l e c t i n g c i r c u i t
The i d e a of t h i s i s t h a t o n l y one s e c t i o n of t h e s t o r a g e w i l l
be r e f r e s h e d d u r i n g each t i m e s t e p .
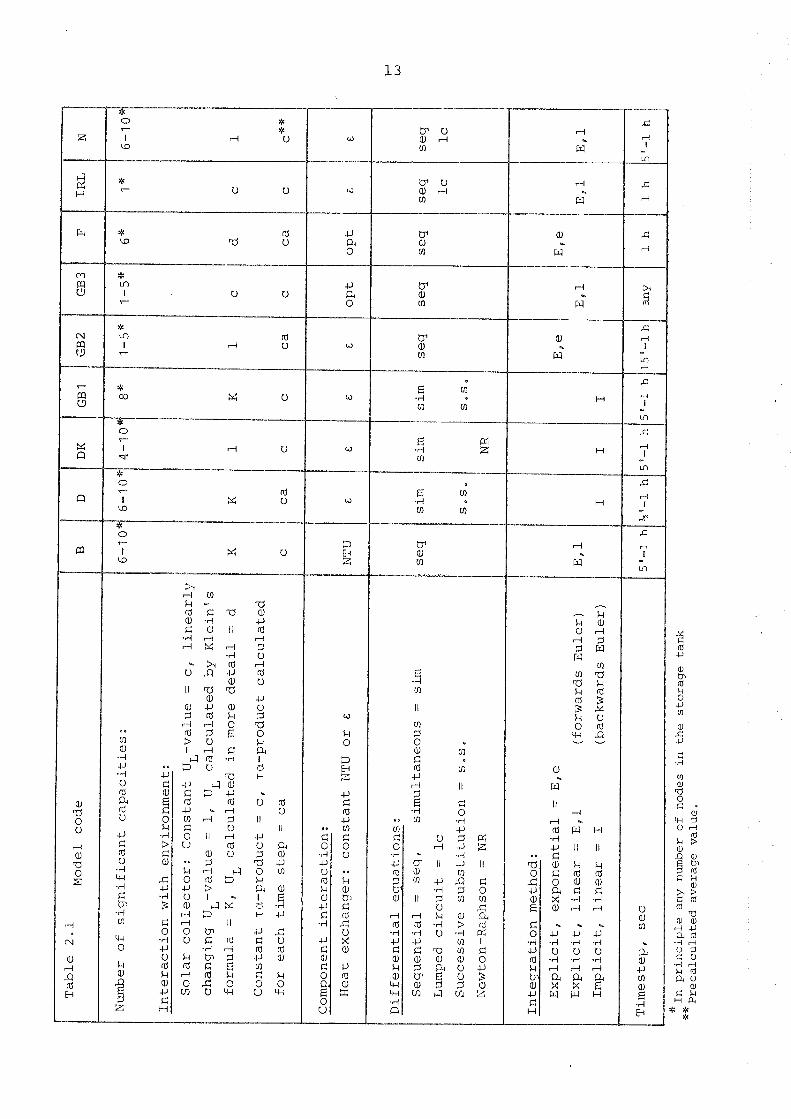
TO p r o v i d e an overview of t h e models t h e t a b l e on t h e f o l -
lowing page h a s been c r e a t e d . I t needs t o be emphasized t h a t
many of t h e models a r e v e r y g e n e r a l i n n a t u r e and t h e r e f o r e
t h e t a b l e d o e s n o t a c c o u n t f o r a l l t h e c h a r a c t e r i s t i c s of t h e
models , b u t shows o n l y t h o s e used i n t h i s c o n t e x t .
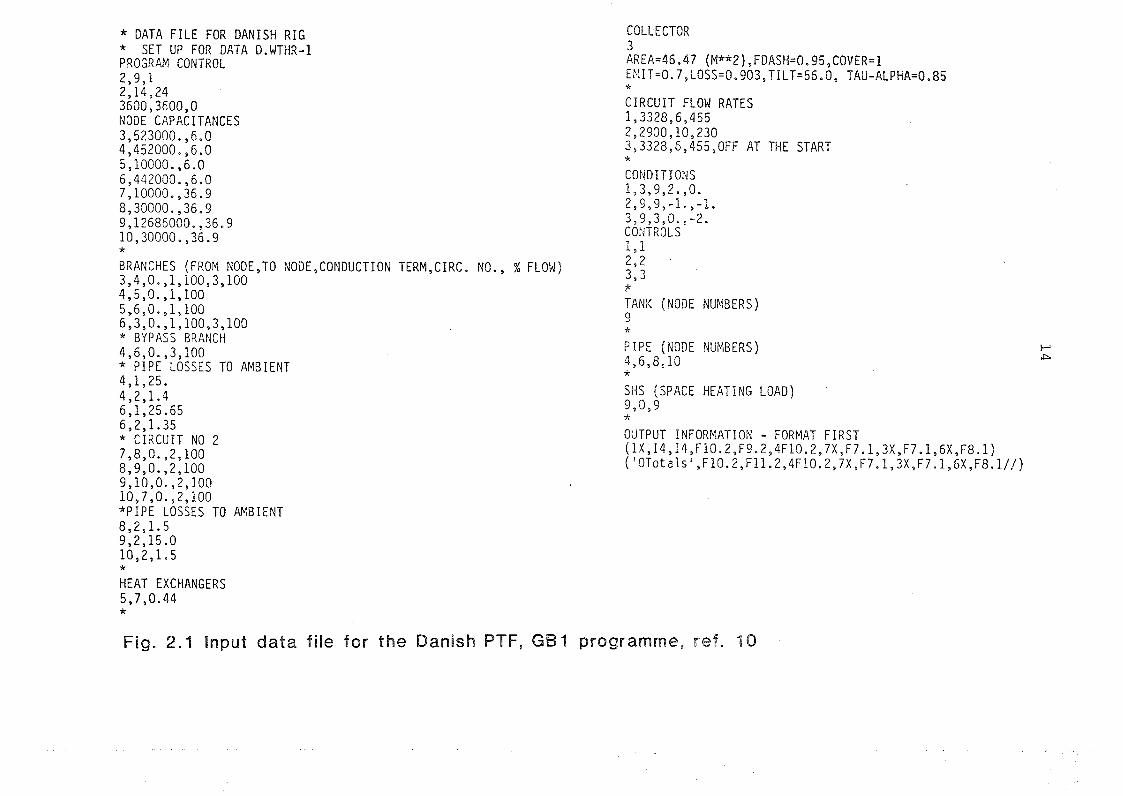
* DATA FILE FOR DANISH RIG * SET UP FOR DATA 0-WTHR-1 PROGRAM CONTROL 2,9,1 2,14,24 3600,3EOO,O NODE CAPACITANCES 3,523000. ,6.0 4,452000,,6.0 5,10000. ,6.0 6,442000.,6.0 7,10000.,36.9 8,30000. ,36.9 9,12686000.,36.9 10,30000. ,36.9 * BRANCHES (FROM NODE ,TO NODE ,CONDUCTION TERM,CIRC. NO., % FLOW) 3,4,0.,1,100,3,100 4,5,0. ,1,100 5,6,0.,1,100 6,310. j1;100,3,100 * BYPASS BRANCH 4,6,0.,3,100 * PIPE LOSSES TO AMBIENT 4,1,25. 4,2,1.4 6,1,25.65 6,2,1.35 * CIRCUIT NO 2 7,8,0. ,2,100 8,9,0. ,2,100 9,10,0. ,2,100 1097,0.,2,100 *PIPE LOSSES TO AMBIENT 8,2,1.5 9,2,15.0 10,2,1.5 * HEAT EXCHANGERS 5,7,0.44 *
COLLECTOR 3 AREA=& .47 (Ma*2) ,FDASH=O. 95,COVER=1 EMIT=0,7,L0SS=0.9033TILT=56.0, TAU-ALPHA=0.85 * CIRCUIT FLOW RATES 1,3328,6,455 2,2900,10,230 3,3328,6,455,0FF AT THE START * CONDITIONS 1,3,9,2.,0. 2,9393-1. ,-le 3,9,3,0.,-2. CONTROLS 1,1 2,2 333 li'
TANK (NODE NUMBERS) 9 * PIPE (NODE NUMBERS) 4,6,8,10 * SHS (SPACE HEATING LOAD) 9 ¶Q, 9 * OUTPUT INFORMATION - FORMAT FIRST (1~,I4,14,F10.2,F9.2,4F10.2,7X,F7.1,3X,F7~1~6X~F8~1) ( V T o t a 1 s 4 ,F10.2,F11.2,4F100297X9F79133X,F7~1,6X,F8.1//)
Fig. 2.4 input data fi le for the Danish PTF, GB1 programme, ref. 10

CHAPTER 3
PARAMETER SENSITIVITY
ANALYSES


3. P A W E T E R SENSITIVITY ANALYSES
3.1 Parameter Sensitivity Analysis I
A parameter sensitivity analysis was defined as the first
cooperative activity of the Modelling Group. The modellers
were to set up their models according to the specifications
of their national SPTF solar system l and use a common set
of weather data with a precalculated load for the simula-
tions (see ref. l). The objectives were:
to establish a common starting position for all the
modellers
to identify, assess and analyse differences between
the models as an aid to the validation work
to provide a comparison data base for the validation
of simplified methods.
The results of the models in Parameter Sensitivity A.nalysis I
differed widely. A closer investigation revea.led that th.is
was primarily due to the differences in the 8 SPTF instal-
lations. Although they were all built to the same design
specifications, the local situation of each of the SPTF's
was different causing differences in pipe length, pump sizes,
collector back loss, etc. The important conclusion drawn on
this first analysis was that the SPTF rigs differed more than
expected.
3.2 Parameter Sensitivity Analysis 1%
As the objectives of the work were not met by Analysis I,
another parameter sensitivity analysis was defined (11).
The same weather and load data were used and the same pa-
rameter variations made as in the first analysis, but in-
stead of modelling each of the 8 SPTF's the Danish SPTF
installation was taken as the base run case for all the
models. The parameter variations in question were collec-
tor area, storage volume and pump starting and stopping
differential set points,
The results of the models were in much closer agreement
this time, the percent solar ranging from 55% to 61% in
the 'base run (from 44% to 60% in Sensitivity Analysis I).
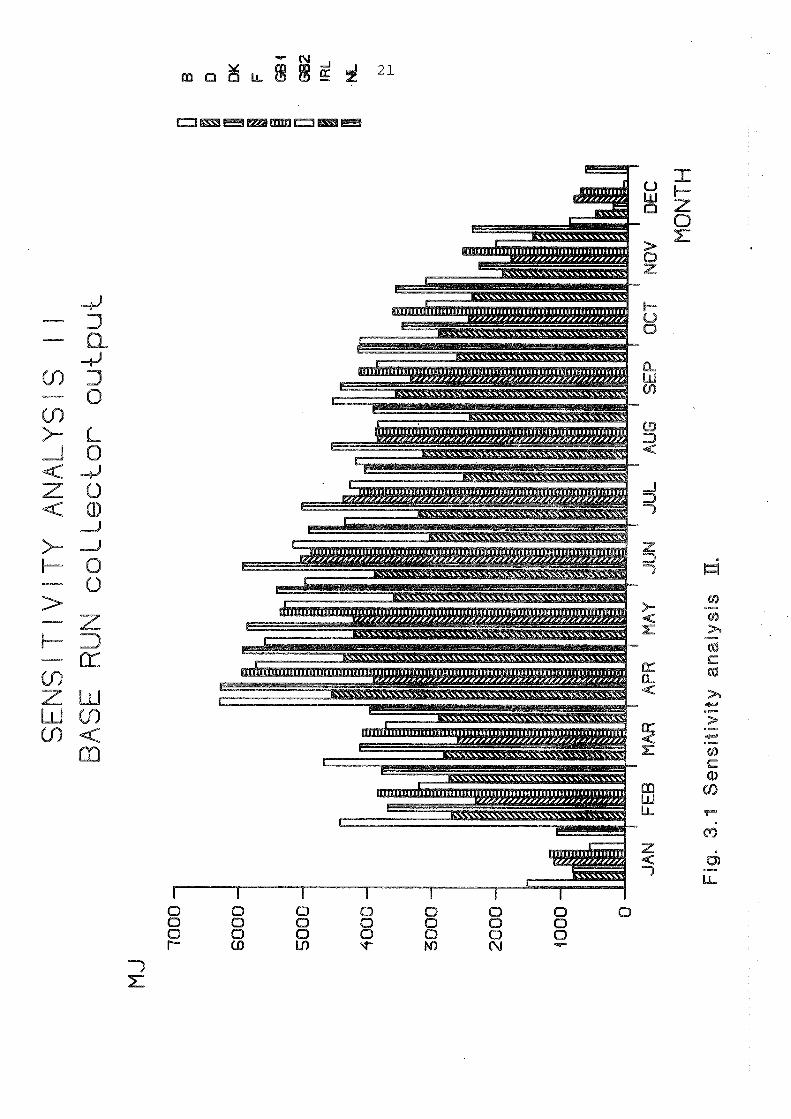
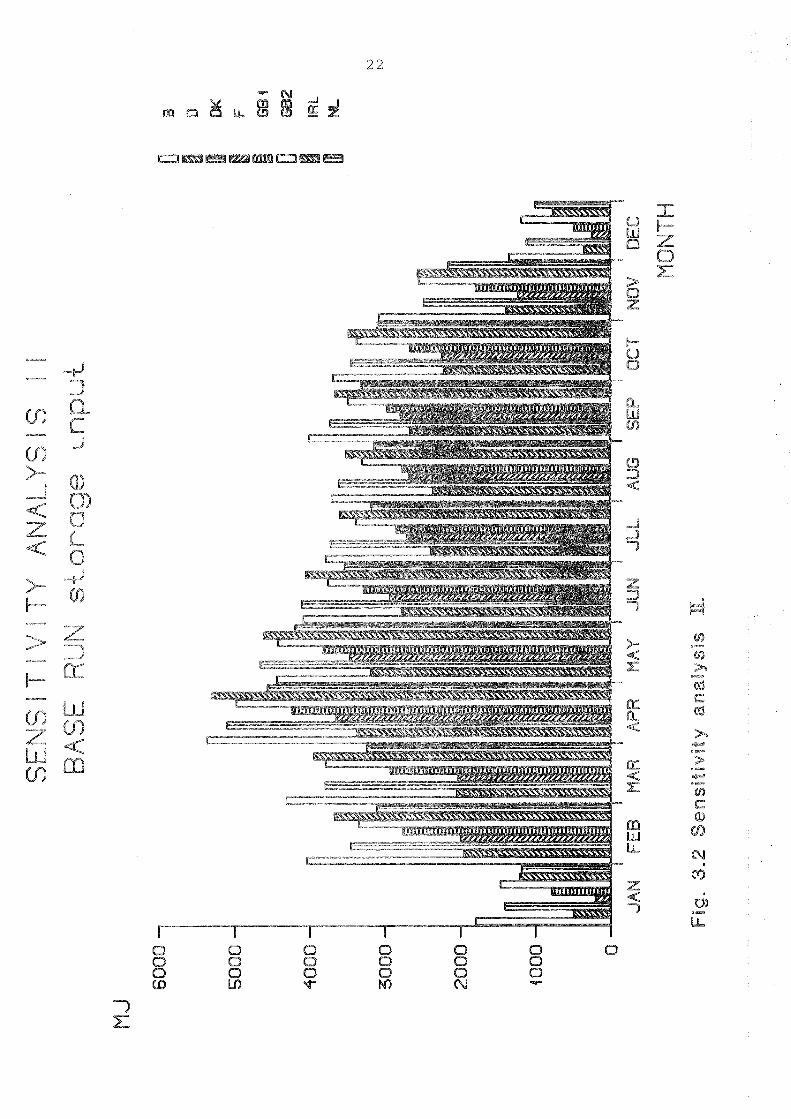
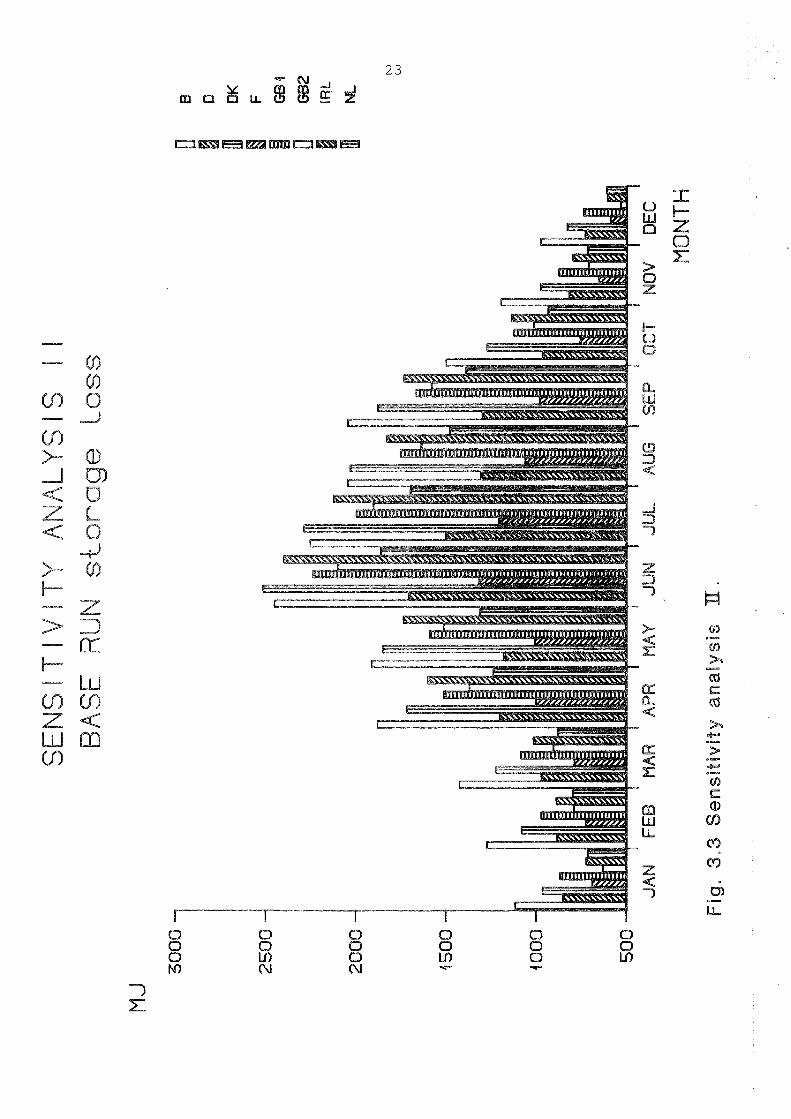
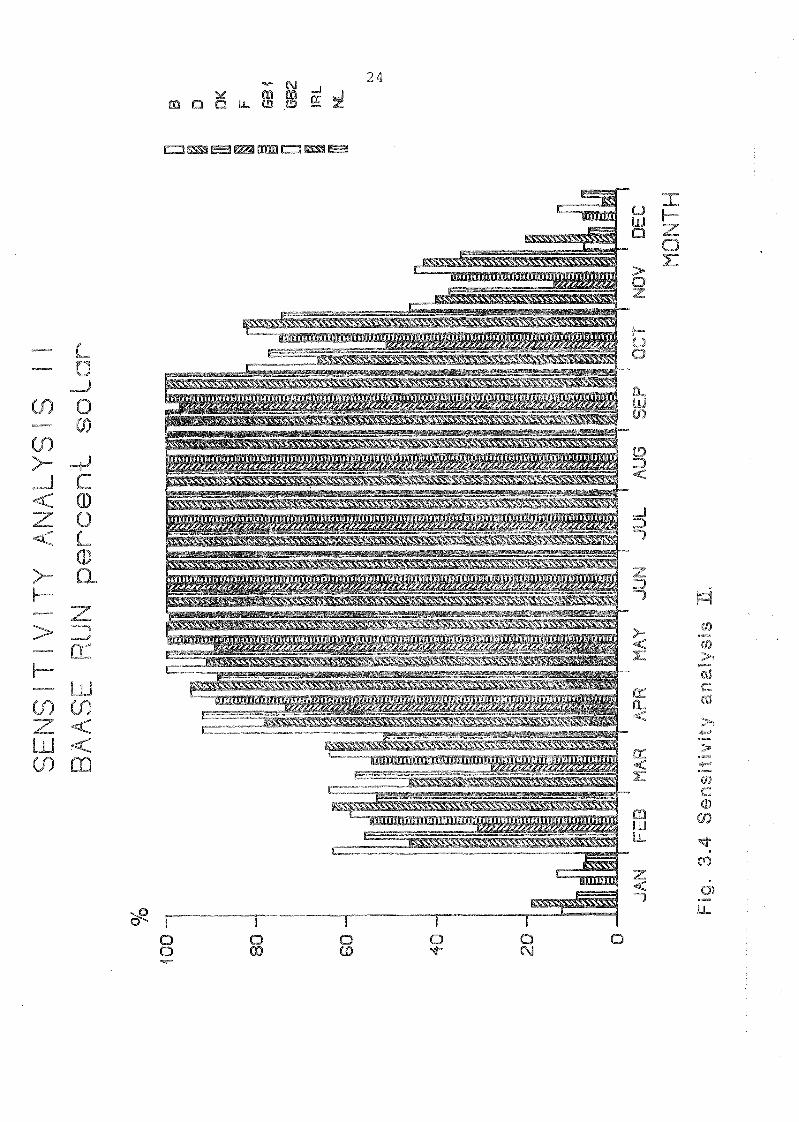
Fig. 3.1 to 3.6 present a more detailed comparison of the
results. The first of these figures shows the predicted,
monthly performance of the system for the base run: the
collector output, the storage loss and the percent solar.
From the figures it is clear that the agreement among the
models is not completely satisfactory on a monthly basis.
Large variations are observed, especially on the storage
losses.
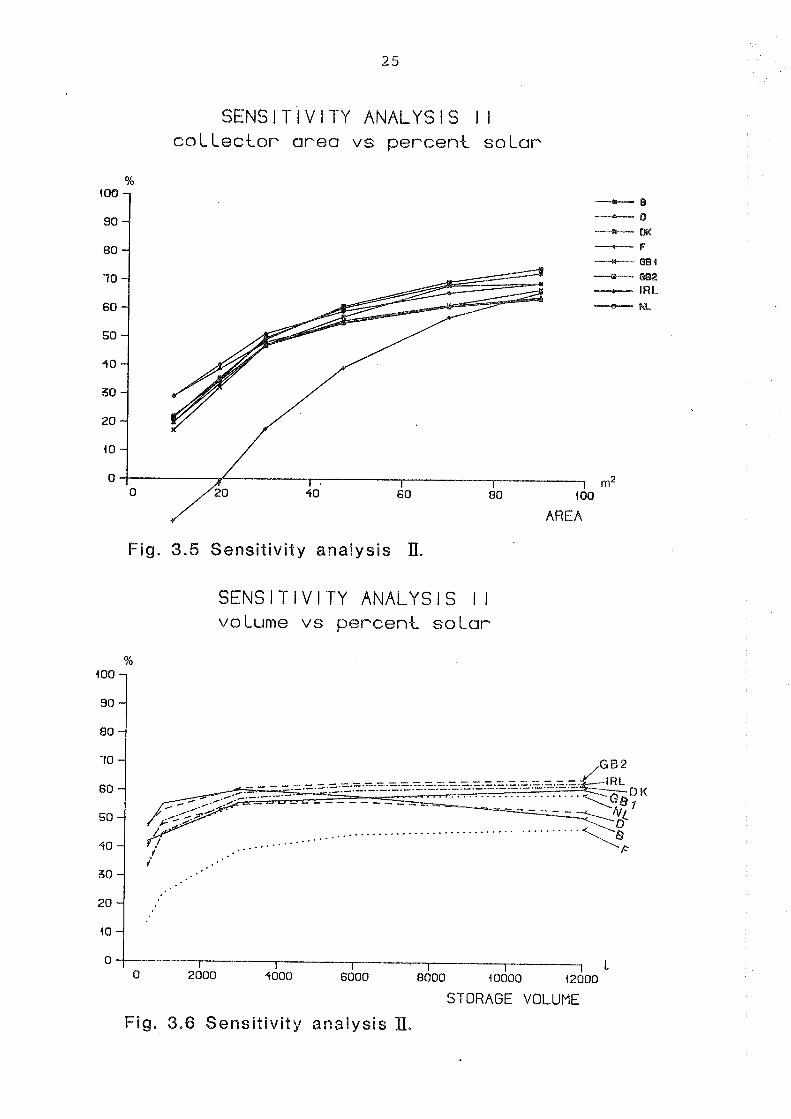
Fig. 3.5 shows the predicted percent solar for the system
as a function of the collector area variations. It is seen
that, some of the curves are more "flat" than others, even
though the same trend can be observed for all the codes, The
sensitivity to storage volume is shown on fig. 3.6, an almost
complete set of parallel curves. The reason why the curve
of model B is different is that a storage volume dependent
heat loss coefficient for the storage has been used, whereas
the prescribed value was constant. The main reason for the
results of the F code differing quite a lot from those of
the others is that the energy consumed by the pumps in the
collector circuit was not included in the thermal balance
of the system. In the case of the Danish SPT'F, these pumps
are somewhat oversized, which means that the energy consumed
by these pumps is considerable, compared to other energy
flows in the system.
With respect to the change in starting and stopping tempe-
rature differentials almost no sensitivity was observed.
This is probably due to the special configuration of the
system, where the primary collecting circuit pump is running
all the time.
3.3 Parameter sensitivity analysis I11
This analysis was designed for a final adjustment of the
models, and to provide some information to the SPTF Group as
t o t h e impact on t h e sys tem performance of c e r t a i n sys tem
changes . The a n a l y s i s c o n s i s t s of 17 r u n s w i t h t h e main em-
p h a s i s on s t r a t i f i c a t i o n o f t h e t a n k t e m p e r a t u r e . The r u n s
a r e numbered from 0 - 1 6 , r u n 0 b e i n g t h e b a s e r u n ,
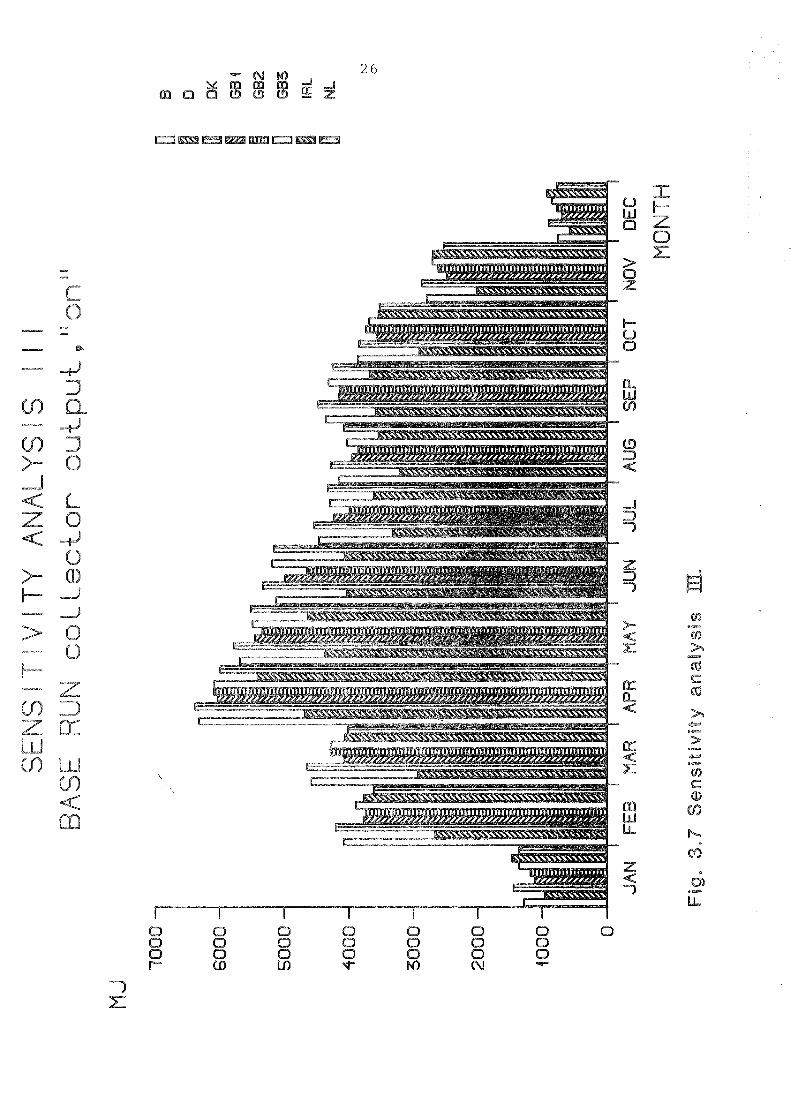
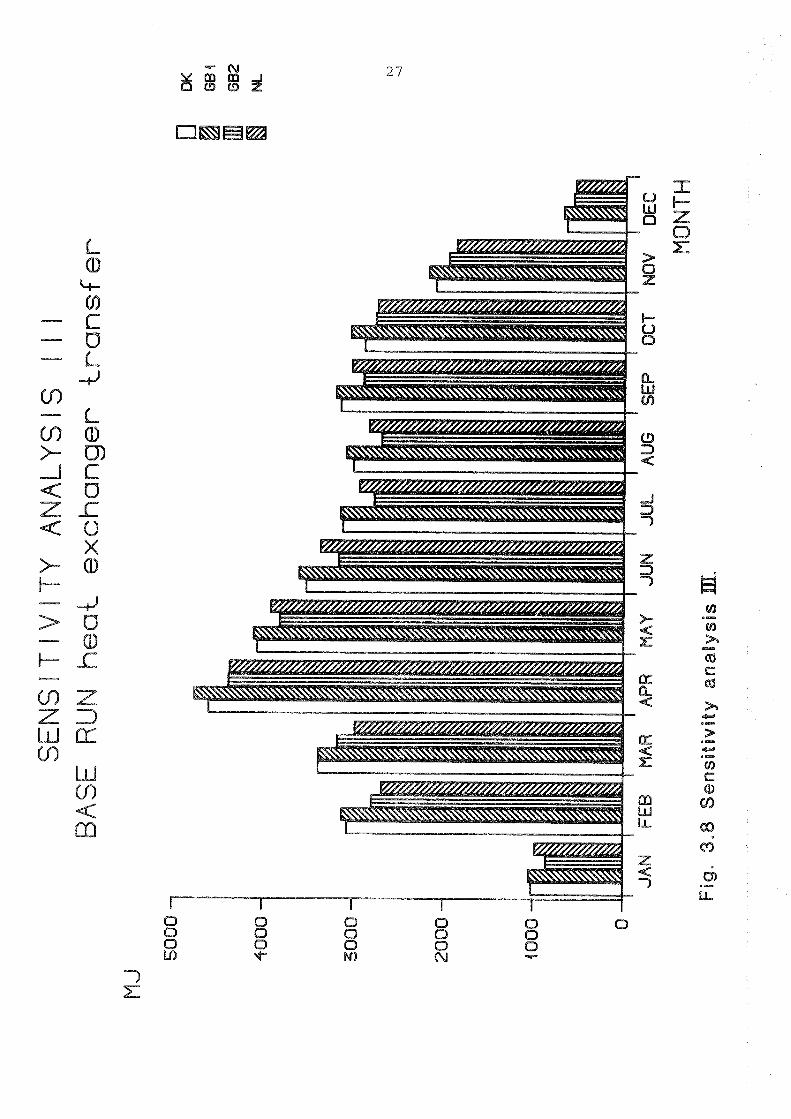
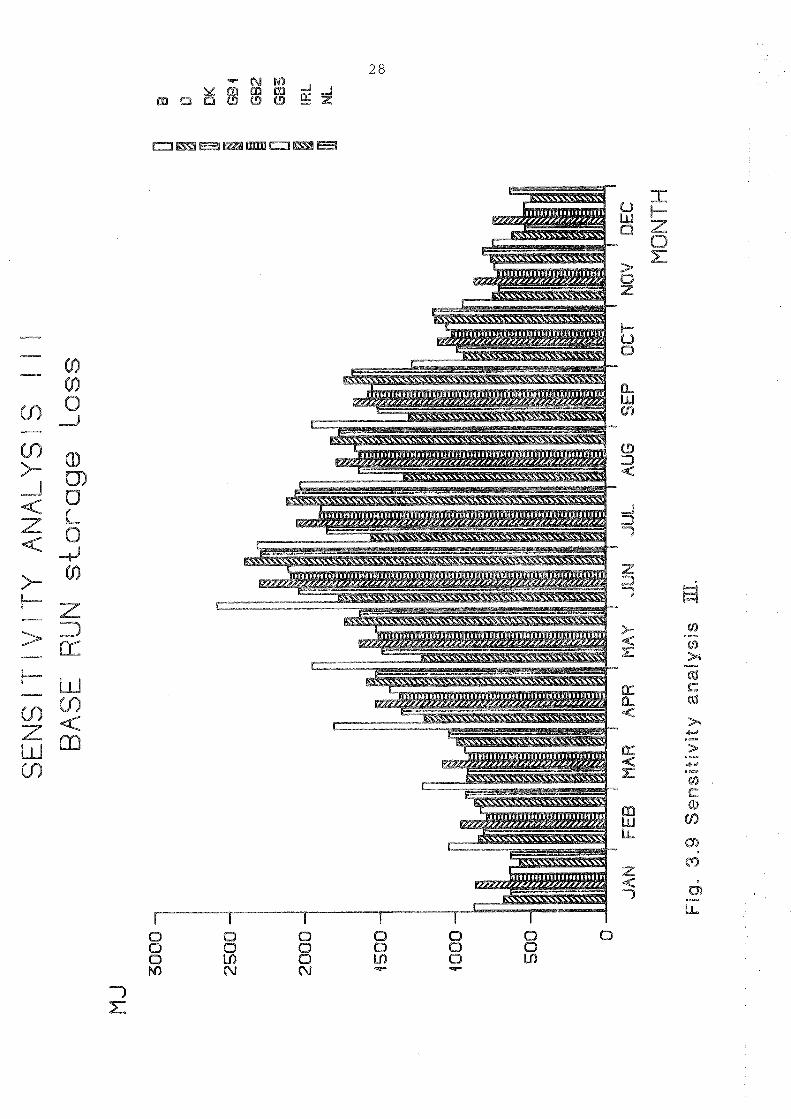
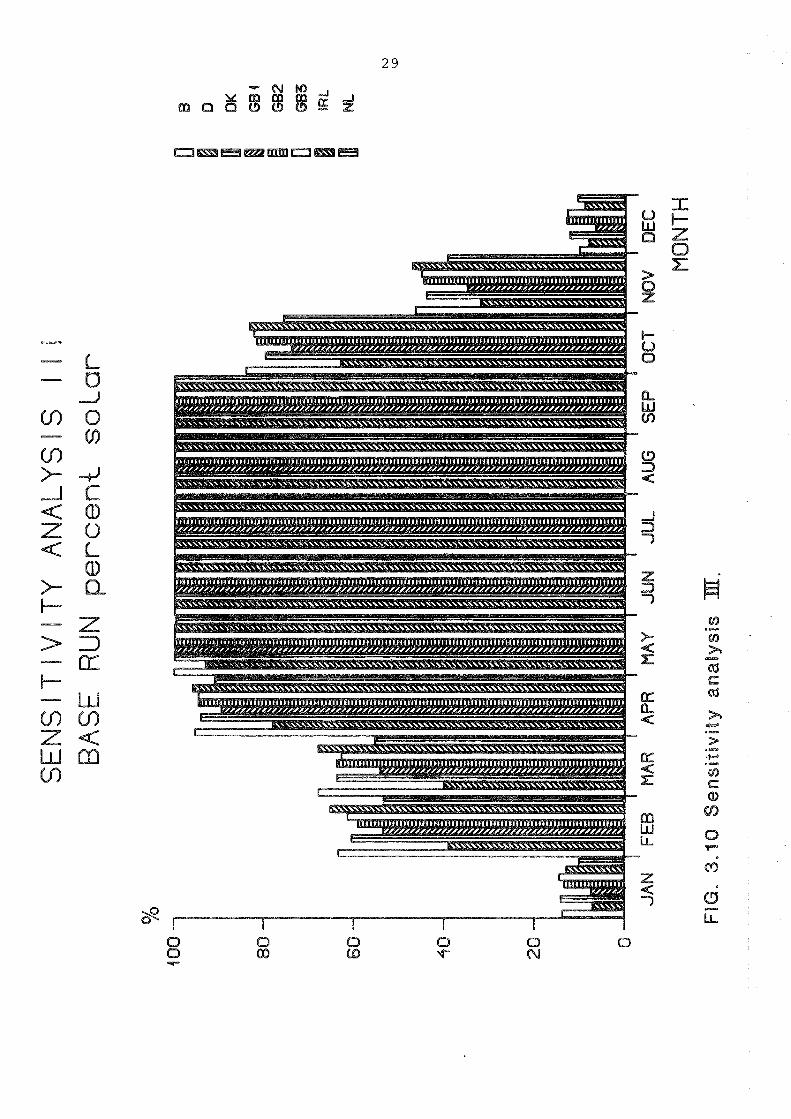
The monthly p r e d i c t i o n s of t h e models on t h e b a s e r u n have
been computer p l o t t e d f o r comparison on f i g , 3.7 t o 3 .10 .
The " n e t " c o l l e c t o r o u t p u t e n e r g i e s compared on f i g , 3.7
show a r e a s o n a b l y good agreement among t h e models , e x c e p t B ,
which p r e d i c t s a somewhat ' lower c o l l e c t o r o u t p u t , The
agreement between t h e f o u r models , hav ing t h e h e a t exchanger
t r a n s f e r energy a s .an o p t i o n (shown on f i g . 3 . 8 ) , i s v e r y
good. The l g r g e s t d i f f e r e n c e s r a n g e from 10-15%- A s i n
t h e b a s e r u n of S e n s i t i v i t y A n a l y s i s I1 t h e s t o r a g e l o s s e s
e x h i b i t t h e g r e a t e s t V a r i a t i o n s , though t h e d i s a g r e e m e n t
t h i s t i m e i s much s m a l l e r . The B code p r e d i c t s a h i g h e r
s t o r a g e l o s s t h a n t h e o t h e r s f o r t h e whole y e a r . T h i s i s
p robab ly due t o a h i g h e r s t o r a g e t e m p e r a t u r e , which c a n b e
deduced from f i g . 3.10 showing t h e monthly p r e d i c t i o n s of
p e r c e n t s o l a r . The B and IRL c o d e s a r e , i n a l m o s t a l l
months, p r e d i c t i n g t h e h i g h e s t p e r c e n t s o l a r .
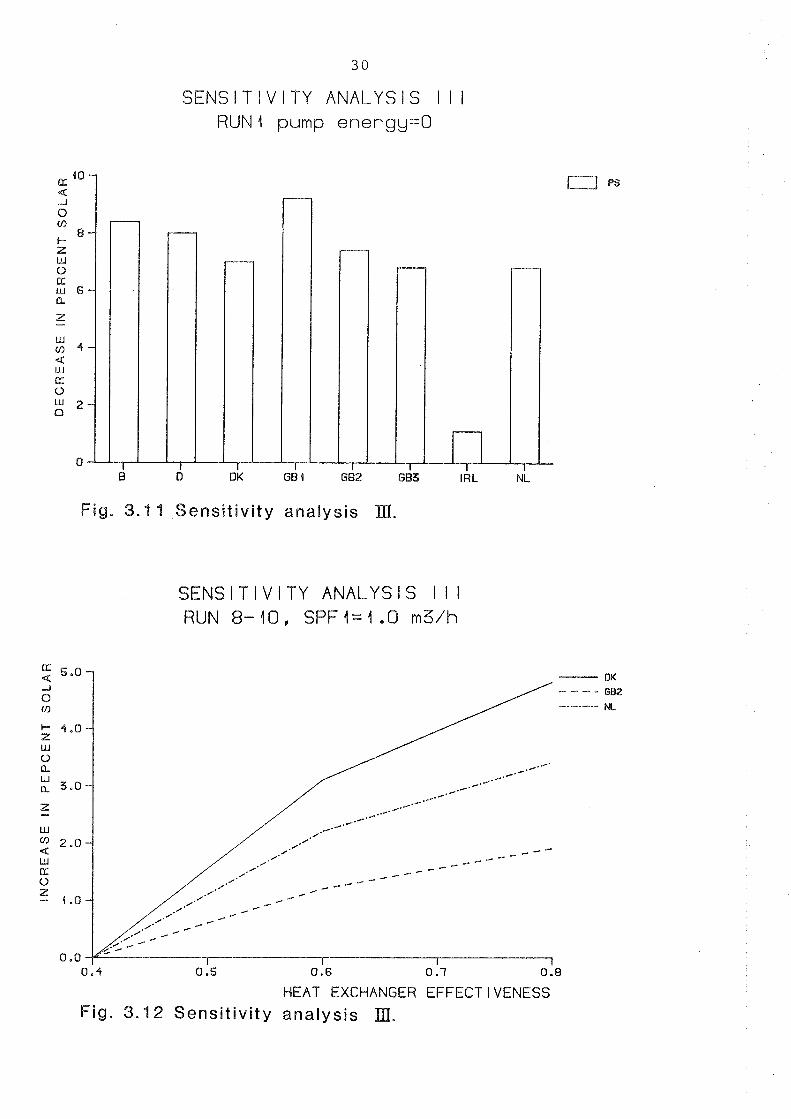
I n r u n 1 t h e pump energy i n p u t t o t h e c o l l e c t o r c i r c u i t s
was set t o z e r o i n o r d e r t o check whether t h e energy
consumption of t h e p u m p ' s t r a n s f e r t o t h e working f l u i d s was
i n c o r p o r a t e d c o r r e c t l y i n t h e models . The b a r c h a r t shown
on f i g . 3 - 1 1 shows t h e d e c r e a s e i n p e r c e n t s o l a r from t h e
b a s e r u n r e s u l t s p r e d i c t e d by t h e models . I t i s s e e n t h a t
a l l t h e models , e x c e p t t h e IRL, a g r e e on a d e c r e a s e from
7 - 9 % . Thus t h e pump energy i s t r e a t e d s i m i l a r l y i n a l l
models b u t t h e IRL.
D i s t r i b u t i o n t e m ~ e r a t u r e ---m------------
The w e l l known f a c t t h a t s o l a r h e a t i n g sys tems work b e s t
a t t h e l o w e s t p o s s i b l e t e m p e r a t u r e s was t h e background f o r
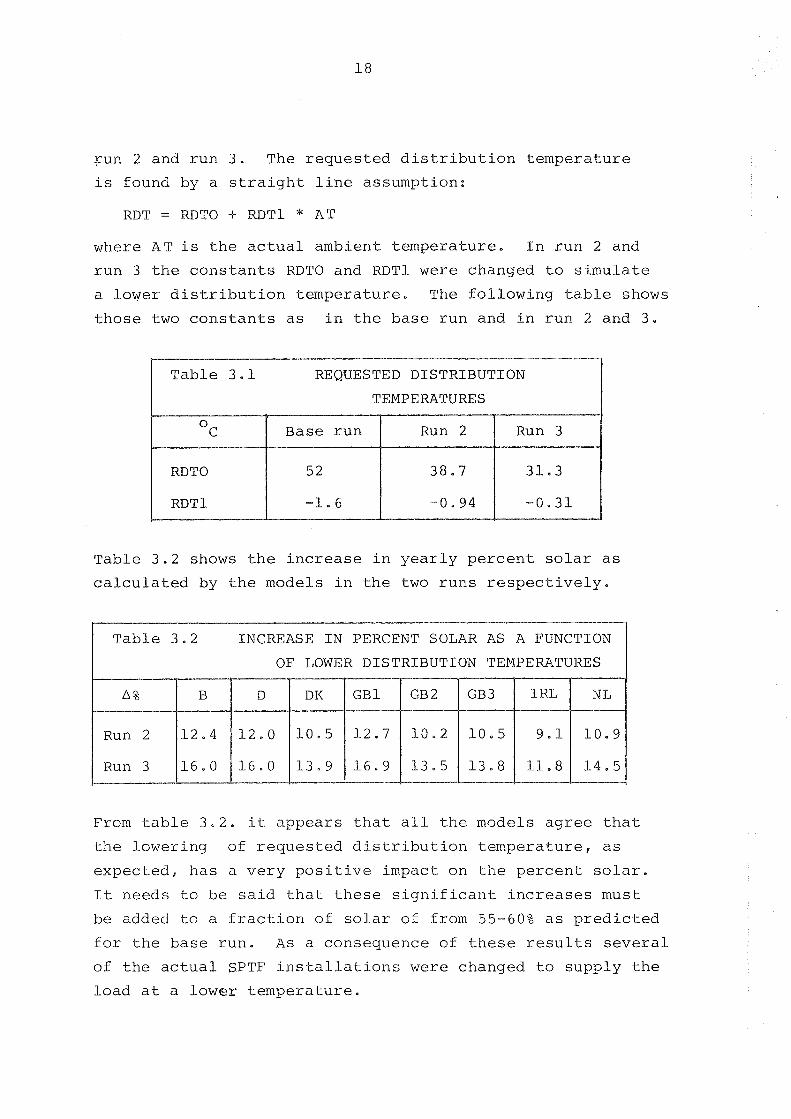
Fun 2 and r u n 3 . The r e q u e s t e d d i s t r i b u t i o n t e m p e r a t u r e
i s found by a s t r a i g h t l i n e assumpt ion:
RDT = RDTO + R D T l * A T
where A T i s t h e a c t u a l ambient t e m p e r a t u r e . I n r u n 2 and
r u n 3 t h e c o n s t a n t s RDTO and RDTl were changed t o s i m u l a t e
a lower d i s t r i b u t i o n t e m p e r a t u r e . The f o l l o w i n g t a b l e shows
t h o s e two c o n s t a n t s a s i n t h e b a s e run and i n r u n 2 and 3 .
TEMPERATURES
Base r u n
Tab le 3 . 2 shows t h e i n c r e a s e i n y e a r l y p e r c e n t s o l a r a s
c a l c u l a t e d by t h e models i n t h e two r u n s r e s p e c t i v e l y .
- PERCENT SOLAR AS A
OF LOWER DISTRIBUTION TEMPERATURES
From t a b l e 3 , 2 . i t a p p e a r s t h a t a l l t h e models a g r e e t h a t
t h e lower ing of r e q u e s t e d d i s t r i b u t i o n t e m p e r a t u r e , a s
e x p e c t e d , h a s a v e r y p o s i t i v e impact on t h e p e r c e n t s o l a r .
I t needs t o be s a i d t h a t t h e s e s i g n i f i c a n t i n c r e a s e s must
be added t o a f r a c t i o n of s o l a r of from 55-60% a s p r e d i c t e d
f o r t h e b a s e r u n . A s a consequence of t h e s e r e s u l t s s e v e r a l
of t h e a c t u a l S.PTF i n s t a l l a t i o n s were changed t o s u p p l y t h e
l o a d a t a lower t e m p e r a t u r e .

A s e x p l a i n e d i n t h e i n t r o d u c t i o n a t t h e o u t s e t o f t h e ex-
p e r i m e n t , t h e pumps i n SPTF SS1 i n s t a l l a t i o n s were c o n s t a n t -
l y r u n n i n g , and t h e c o l l e c t i o n was c o n t r o l l e d v i a a t h r e e -
way v a l v e . T h i s s t r a t e g y was chosen because it was cons ide -
r e d t h e b e s t way t o o b t a i n a v e r y w e l l " c o n t r o l l e d " e x p e r i -
ment i n t h e s e n s e t h a t t r a n s i e n t s were s l o w e r and no s t r a -
t i f i c a t i o n c o u l d o c c u r i n t h e s t o r a g e t a n k . T h i s o b j e c t i v e
was d i c t a t e d by t h e wish t o produce good d a t a f o r v a l i -
d a t i o n purposes . On t h e o t h e r hand, it i s v e r y energy-
consuming t o have t h e pumps runn ing a l l t h e t i m e and b e s i d e s ,
t h e e f f i c i e n c y of t h e system i s expec ted t o i n c r e a s e i f
t e m p e r a t u r e s t r a t i f i c a t i o n i n t h e s t o r a g e t a n k i s a l lowed
f o r , T h e r e f o r e , when t h e f i r s t v a l i d a t i o n work was comple-
t e d , a change i n t h e c o n t r o l s t r a t e g y w a s c o n s i d e r e d . I t
was d e c i d e d t o model a c a s e where t h e pumps were ~ n l y run-
n i n g from 600 t o 1800 h o u r s , and a t t h e same t i m e change t h e
d i r e c t i o n o f t h e f l o w o f t h e f l u i d i n t h e secondary c i r c u i t
t o have t h e t a n k o u t l e t a t t h e bot tom and t h e i n l e t a t t h e
t o p t o improve t h e s t r a t i f i c a t i o n . T h i s l a t t e r change was
combined w i t h a lower ing of t h e f low r a t e i n t h e secondary
c i r c u i t t o f u r t h e r improve t h e s t r a t i f i c a t i o n . A l l t h e s e
changes were implemented a s r u n 4 , and t h e n e t r e s u l t was
a s l i g h t d e c r e a s e i n t h e y e a r l y f r a c t i o n of s o l a r p r e d i c t e d
by t h e programs ( a b o u t 1%) . ~ h u s t h e much s m a l l e r pump energy
t r a n s f e r r e d t o t h e working f l u i d s was c o u n t e r b a l a n c e d by t h e
impact of s t r a t i f i c a t i o n .
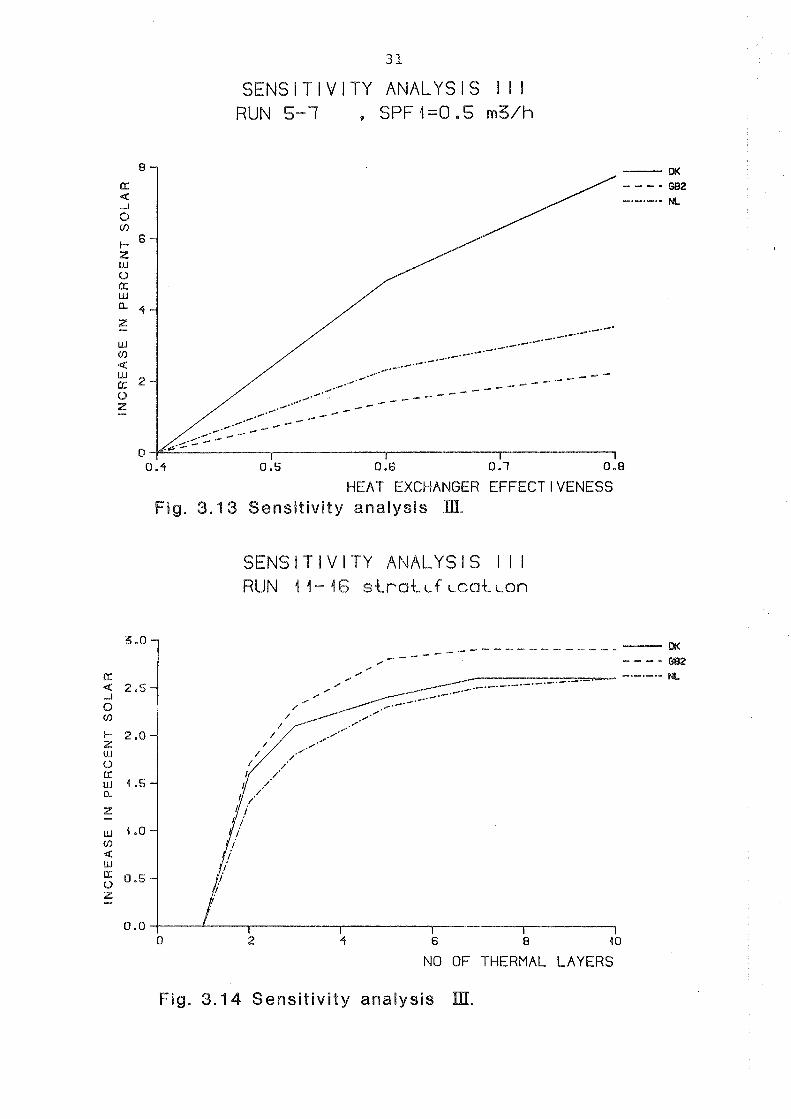
Heat exchanqer e f f e c t i v e n e s s
S e v e r a l of t h e p a r t i c i p a n t s q u e s t i o n e d t h e s t a t e d v a l u e of
t h e h e a t exhanger e f f e c t i v e n e s s d u r i n g t h e i r v a l i d a t i o n work
(see c h a p t e r 4 and 5 ) . The s t a t e d v a l u e was - 4 4 and t h e
p a r t i c i p a n t s c la imed t h a t t h e c o r r e c t v a l u e was more l i k e l y
.34 . T h i s was t h e background f o r t h e c h o i c e of r u n 5 t o
r u n 1 0 , which c o n s t i t u t e s two s e r i e s of t h r e e r u n s each t o
i n v e s t i g a t e t h e impact on system performance of h e a t ex-
changer e f f e c t i v e n e s s f o r two d i f f e r e n t f low r a t e s i n t h e
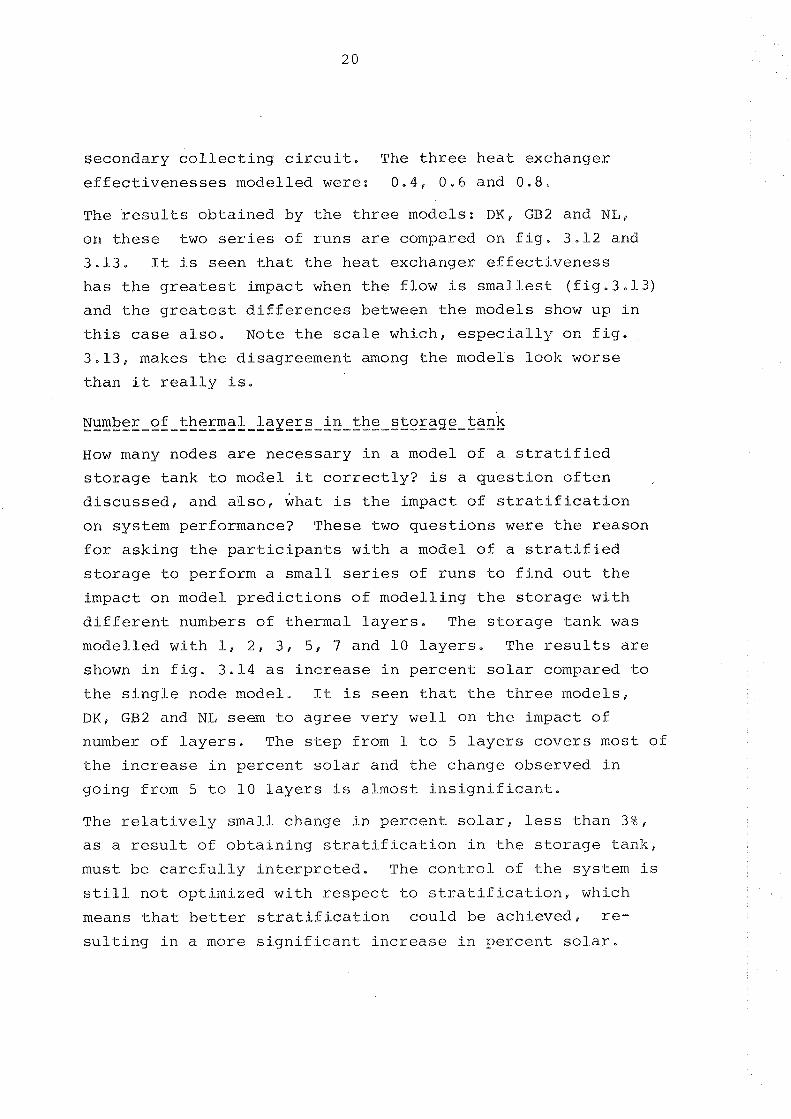
secondary c o l l e c t i n g c i r c u i t . The t h r e e h e a t exchanger
e f f e c t i v e n e s s e s modelled w e r e : 0 .4, 0.6 and 0 . 8 .
The r e s u l t s o b t a i n e d by t h e t h r e e models: DK, GB2 and N L ,
on t h e s e two series of r u n s a r e compared on f i g . 3 - 1 2 and
3.13. I t i s s e e n t h a t t h e h e a t exchanger e f f e c t i v e n e s s
h a s t h e g r e a t e s t impact when t h e f l o w i s s m a l l e s t ( f i g . 3 . 1 3 )
and t h e g r e a t e s t d i f f e r e n c e s between t h e models show up i n
t h i s c a s e a l s o . Note t h e s c a l e which, e s p e c i a l l y on f i g .
3 .13 , makes t h e d i sagreement among t h e models look worse
t h a n it r e a l l y i s ,
Number of t h e r m a l ----------------- l a y e r s --- ---- i n t h e s t o r a g e -- t a n k , - -m-
HOW many nodes a r e n e c e s s a r y i n a model of a s t r a t i f i e d
s t o r a g e t a n k t o model it c o r r e c t l y ? i s a q u e s t i o n o f t e n
d i s c u s s e d , and a l s o , what i s t h e impact of s t r a t i f i c a t i o n
on sys tem performance? These two q u e s t i o n s w e r e t h e r e a s o n
f o r a s k i n g t h e p a r t i c i p a n t s w i t h a model of a s t r a t i f i e d
s t o r a g e t o perform a s m a l l s e r i e s of r u n s t o f i n d o u t t h e
impact on model p r e d i c t i o n s o f mode l l ing t h e s t o r a g e w i t h
d i f f e r e n t numbers of t h e r m a l l a y e r s . The s t o r a g e t a n k was
model led w i t h l , 2 , 3 , 5 , 7 and 10 l a y e r s , The r e s u l t s a r e
shown i n f i g . 3.14 a s i n c r e a s e i n p e r c e n t s o l a r compared t o
t h e s i n g l e node model. I t i s s e e n t h a t t h e t h r e e models ,
D K , GB2 and N L s e e m t o a g r e e v e r y w e l l on t h e impact of
number of l a y e r s . The s t e p from l t o 5 Layers c o v e r s most of
t h e i n c r e a s e i n p e r c e n t s o l a r and t h e change obse rved i n
go ing from 5 t o 1 0 l a y e r s i s a lmos t i n s i g n i f i c a n t .
The r e l a t i v e l y s m a l l change i n p e r c e n t s o l a r , less t h a n 3 % ,
a s a r e s u l t of o b t a i n i n g s t r a t i f i c a t i o n i n t h e s t o r a g e t a n k ,
must be c a r e f u l l y i n t e r p r e t e d . The c o n t r o l of t h e sys tem i s
s t i l l n o t o p t i m i z e d w i t h r e s p e c t t o s t r a t i f i c a t i o n , which
means t h a t b e t t e r s t r a t i f i c a t i o n c o u l d be a c h i e v e d , re-
s u l t i n g i n a more s i g n i f i c a n t i n c r e a s e i n p e r c e n t s o l a r .
S E N S I T I V I T Y ANALYSIS I I cobbector area vs percen t sobar
70
60
50
40
30
20
10
0 m2
AREA
Fig. 3.5 Sensit ivity analysis II.
SENSIT IV ITY ANALYSIS I I volume vs percenk s o l a r
0 1 00
S T O R A G E V O L U M E
Fig. 3.6 Sensit iv i ty acalysis X.
43 0 er, m
0 0 er, N
L 81.. C
[K < X
A 'P.
SENSITIVITY ANALYSIS I l l RUN4 pump energy=O
Fig. 3 . M Sensi t iv i ty analysis
SENSITIVITY ANALYSIS I l l RUN 8-10, SPF1=1 .0 m5/h
HEAT EXCHANGER EFFECTIVENESS
Fig. 3.1 2 Sensi t iv i ty analysis BB.
31
SENSIT IV ITY ANALYSIS I l l RUN 5-7 SPF 1=0.5 m 3 / h
8 W<
K - - - - 682 Q -.-.-.- d E&
0 V)
t- 6 Z 1M 6> U: W
4 Z - W V) Q W _ - - - E 2 _ - - - - - 0 C - - - - _ _ - - - z
0 0 - 4 0 .S 0 .hj 0.7 0.8
HEAT EXCHANGER EFFECTIVENESS Fig. 3.13 Sensit ivity analysis m.
SENSIT IV ITY ANALYSIS I l l RUN 11-16 s t r a t ~ f ~ c a t ~ o n
P _ - - -
J - - - *
J
K 4 2.5 A 0 cn I-- z2.0 E: Ibl (d 18; W 4.5 L
Z - '1 -0
cn Q: W 5 8.5 Z -
0 .0 0 2 4 6 €3 10
NO OF THERMAL LAYERS
Fig. 3.14 Sensi t iv i ty analysis Ek$.


CHAPTER 4
COMMON VALIDATION

4. COMMON VALIDATION
The p h r a s e "Common VaLida t ion" was chosen t o d e s c r i b e t h i s
a c t i v i t y o f t h e g roup which t a k e s advan tage o f t h e h i g h
d e g r e e of s i m i l a r i t y between t h e S o l a r P i l o t T e s t F a c i l i -
t i e s i n t h e p a r t i c i p a t i n g c o u n t r i e s , T h i s s i m i l a r i t y
makes it v e r y e a s y t o s i m u l a t e , i n p r i n c i p l e , a l l t h e o t h e r
S o l a r P i l o t T e s t F a c i l i t i e s a s it i s a l m o s t o n l y a c a s e of
changing p a r a m e t e r s , when t h e system model h a s once been
made. N a t u r a l l y , t h i s a l s o means t h a t it i s r e l a t i v e l y e a s y
t o u s e a l l t h e models t o s i m u l a t e one of t h e S o l a r P i l o t
T e s t F a c i l i t i e s and compare t h e p r e d i c t i o n s of t h e models
t o measured d a t a from t h i s f a c i l i t y . T h i s i s e x a c t l y what
w a s done under t h i s a c t i v i t y .
Two sets of c o n t i n u o u s d a t a from two d i f f e r e n t S o l a r P i l o t
T e s t F a c i l i t i e s w e r e d i s t r i b u t e d t o b e used by a 1 1 t h e pa r -
t i c i p a n t s f o r t h e v a l i d a t i o n of t h e i r models . Compared t o
t h e n a t i o n a l v a l i d a t i o n work t h i s approach had c e r t a i n ad-
v a n t a g e s :
Some p a r t i c i p a n t s cou ld beg in t h e i r v a l i d a t i o n work
even b e f o r e t h e i r n a t i o n a l S o l a r P i l o t T e s t F a c i l i t y
produced u s e f u l d a t a .
. The d a t a had t o some e x t e n t been checked by one p a r t i c i -
p a n t b e f o r e t h e o t h e r p a r t i c i p a n t s began working w i t h
them.
Each model was v a l i d a t e d a g a i n s t d a t a from a t l e a s t two
d i f f e r e n t sys tems .
he d i s t r i b u t e d d a t a were i n t h i s way doub le checked.
A d i s a d v a n t a g e of u s i n g d a t a from a n o t h e r c o u n t r y f o r v a l i d a -
t i o n purposes i s , of c o u r s e , n o t having t h e p o s s i b i l i t y of d i -
r e c t i n t e r a c t i o n w i t h t h e system i f a problem o c c u r s . Another
problem c o u l d have been t h e t r a n s f e r of d a t a from one sys tem

$0 a n o t h e r , b u t n e i t h e r of t h e s e problems seemed t o c r e a t e
s e v e r e d i f f i c u l t i e s .
The d a t a d i s t r i b u t e d w e r e 1 4 d a y s o f h o u r l y d a t a from t h e
Danish S o l a r P i l o t T e s t F a c i l i t y from February/March 1980
and one month of 5-minutes d a t a from t h e B e l g i a n S o l a r P i l o t
T e s t F a c i l i t y from March 1980. The r e s u l t s p r e s e n t e d h e r e
a r e a summary of t h e r e s u l t s produced by t h e p a r t i c i p a n t s
The s e l e c t i o n i s done w i t h t h e main emphasis on showing a n
o v e r a l l p i c t u r e of t h e d i f f e r e n t approaches and t h e r e s u l t s
o b t a i n e d by t h e d i f f e r e n t p a r t i c i p a n t s . T h e r e f o r e , it i s
n o t a country-by-country p r e s e n t a t i o n and t h e s e l e c t i o n of
f i g u r e s and t a b l e s shou ld n o t b e t a k e n a s a r e f l e c t i o n on
t h e q u a n t i t y and q u a l i t y of t h e work o f t h e d i f f e r e n t p a r t i -
c i p a n t s .
4.2 Common v a l i d a t i o n on d a t a from t h e Danish SPTF i n s t a l l a t i o n
A magne t i c t a p e w i t h h o u r l y wea the r d a t a measured a t t h e
S o l a r P i l o t T e s t F a c i l i t y and t h e p r e d i c t e d h o u r l y l o a d d a t a
on t h e b a s i s of t h e weather d a t a mentioned above was p r e p a r e d
and d i s t r i b u t e d by t h e c o o r d i n a t o r , Along w i t h t h e magne t i c
t a p e was s e n t a n i n s t a l l a t i o n d e s c r i p t o r f o r t h e Danish
sys tem l.
S i x o f t h e M2 p a r t i c i p a n t s have p r e s e n t e d t h e i r r e s u l t s on
t h e s e d a t a . The models used by t h e s e p a r t i c i p a n t s w e r e B , D ,
DK, G B 1 , I R L , N . The v a l i d a t i o n e f f o r t by t h e s e p a r t i c i p a n t s
encompasses component v a l i d a t i o n , sys tem v a l i d a t i o n and
sys tem paramete r " f i t t i n g " and t h e combinat ion of t h e s e ,
The r e s u l t s a r e p r e s e n t e d b o t h a s g r a p h i c a l p l o t s which show
how w e l l t h e p r e d i c t e d dynamic behav iour of t h e system c o r -
r e sponds t o t h e measured, and t a b l e s which show how w e l l t h e
p r e d i c t e d and measured energy f l o w s compare.
C o m ~ o n e n t - -m v a l i d a t i o n
The a d v a n t a g e of component v a l i d a t i o n i n r e l a t i o n t o o v e r a l l
system v a l i d a t i o n i s t h a t e r r o r s i n t h e model f o r t h e
model l ing of o t h e r components have no i n f l u e n c e on t h e
i n v e s t i g a t e d components, because measured d a t a f o r t h e
a c t u a l t i m e . x t e p a r e used a s i n p u t d a t a f o r t h e component
i n q u e s t i o n . Thus t h e computed v a l u e s f o r t h e component
g i v e o n l y i n f o r m a t i o n a b o u t t h e i n s t a n t a n e o u s behav iour
of t h e component and n o t on accumula ted e r r o r s . S i n c e a
component i s t r e a t e d i n i s o l a t i o n t h i s approach can be
used f o r t h e e s t i m a t i o n o f c o r r e c t p a r a m e t e r s .
Three of t h e p a r t i c i p a n t s have p r e s e n t e d r e s u l t s on compo-
n e n t v a l i d a t i o n : B , D , and I R L .
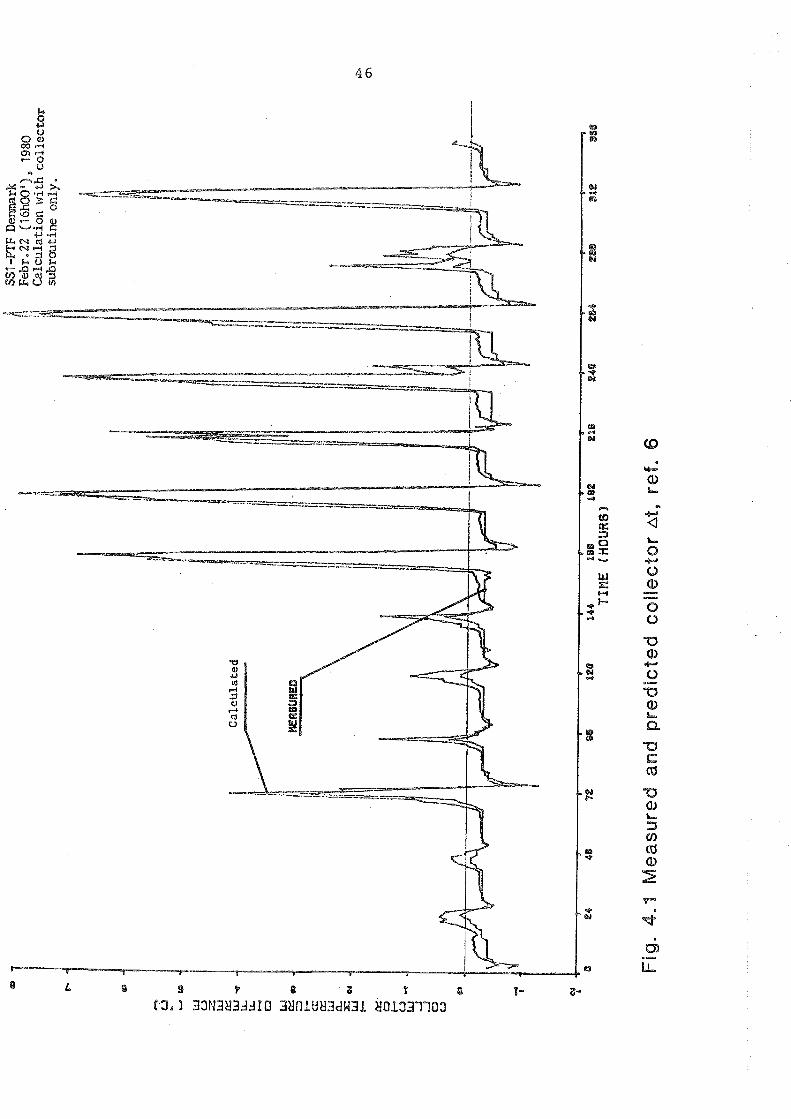
The t h r e e component s u b r o u t i n e s i n q u e s t i o n f o r component
v a l i d a t i o n on t h e S o l a r P i l o t Te 's t F a c i l i t y system 1 a r e
t h e r o u t i n e s f o r t h e s o l a r c o l l e c t o r , t h e p i p e s and h e a t
exchanger and t h e s t o r a g e . F i g . 4 . 1 shows a comparison
o f c a l c u l a t e d and measured t e m p e r a t u r e d i f f e r e n c e a c r o s s
t h e c o l l e c t o r . A s i m i l a r p l o t c a n be found i n r e f . 13 .
I n b o t h c a s e s t h e agreement between measured and c a l c u l a t e d
v a l u e s c a n b e c h a r a c t e r i z e d a s v e r y good. The German p a r -
t i c i p a n t performed i s o l a t e d r u n s w i t h t h e p i p e s and h e a t
exchanger s u b r o u t i n e and concluded from t h e s e c a l c u l a t i o n s
t h a t t h e s t a t e d e f f i c i e n c y of t h e h e a t exchanger was t o o
h i g h , which i n t h e c a l c u l a t i o n s r e s u l t e d i n t o o much e n e r -
gy b e i n g withdrawn from t h e p r imary c i r c u i t compared t o
t h e measured r e s u l t s . I n a t o t a l sys tem c a l c u l a t i o n t h i s
r e s u l t e d i n t h e p r e d i c t i o n of t o o h i g h s t o r a g e t e m p e r a t u r e s .
The B e l g i a n and German p a r t i c i p a n t s a l s o performed c a l c u l a -
t i o n s w i t h a s t o r a g e r o u t i n e and found t h a t t h e c a l c u l a t e d
s t o r a g e l o s s e s were t o o s m a l l , which c o u l d be caused e i t h e r
by a n u n d e r e s t i m a t e d h e a t l o s s c o e f f i c i e n t o r by an o v e r e s t i -
mated c o n s t a n t t e m p e r a t u r e of t h e s u r r o u n d i n g s . The l a t t e r
t e m p e r a t u r e was n o t g i v e n on t h e d a t a t a p e and a c o n s t a n t 0 v a l u e of 2 0 C were assumed by t h e p a r t i c i p a n t s . I n f a c t ,
f o r t h e p e r i o d i n q u e s t i o n , t h e t e m p e r a t u r e v a r i e d between 0
16 and 1.7 C , which shows t h a t t h i s approach can l e a d t o
s e n s i b l e c o n c l u s i o n s . More r e s u l t s on component v a l i d a t i o n
a r e p r e s e n t e d i n t h e n e x t pa ragraph and i n c h a p t e r 5 .
System V a l i d a t i o n - --------.----m--
Khen performing comple te sys tem v a l i d a t i o n t h e two dominant
i s s u e s of i n t e r e s t a r e :
1. How w e l l i s t h e dynamic behaviour o f t h e sys tem
s i m u l a t e d ?
2 . What i s t h e impact of accumulated e r r o r s ?
The dynamic behav iour of t h e sys tem i s e x p r e s s e d by t h e
e v o l u t i o n of t h e s t a t e v a r i a b l e s , t h e t e m p e r a t u r e s , and i s
t h e r e f o r e b e s t p r e s e n t e d i n g r a p h i c a l p l o t s . F i g . 4 .2 - f i g . 4 .8 c o n s t i t u t e a s m a l l b u t r e p r e s e n t a t i v e sample of
t h e t o t a l amount of p l o t s produced by t h e p a r t i c i p a n t s f o r
t h e comparison of t h e p r e d i c t i o n s of t h e i r models t o t h e
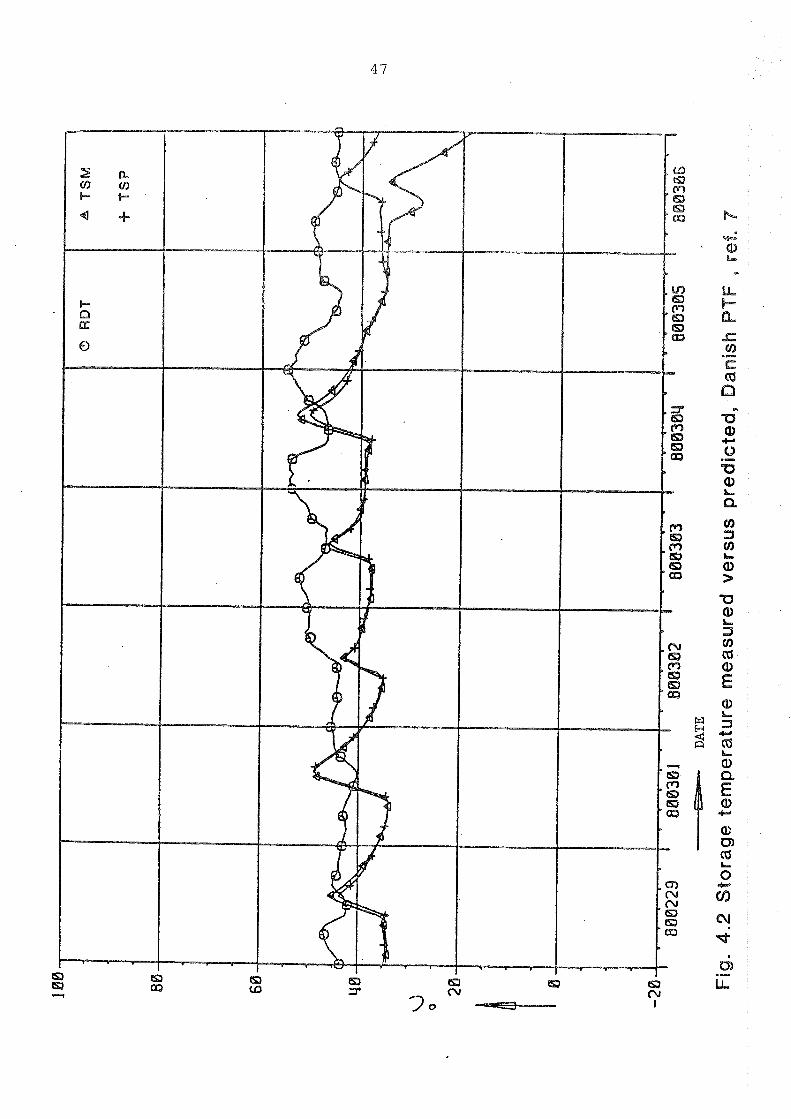
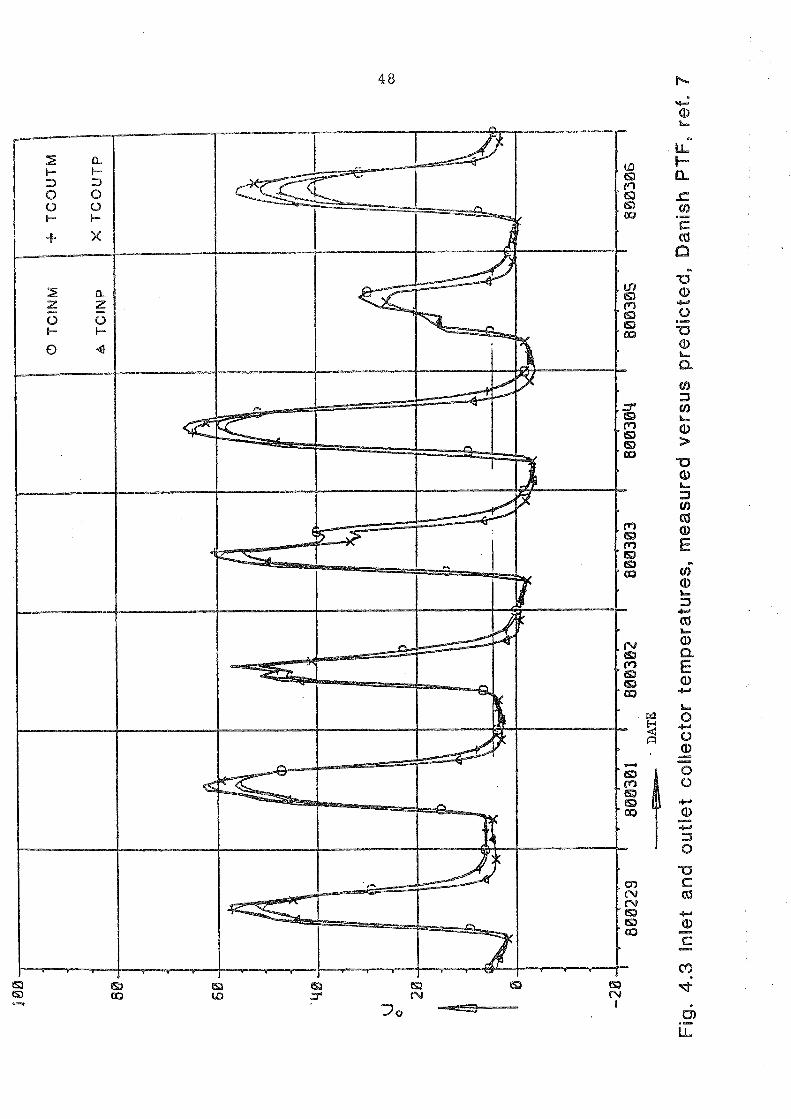
measured d a t a from t h e Danish PTF. F i g . 4 , 2 - f i g . 4.5
show t y p i c a l t e rapera tu re p l o t s f o r t h e s t o r a g e and t h e co l - ,
l e c t o r , A s i s s e e n from t h e s e p l o t s t h e p r e d i c t i o n of t h e
dynamic behav iour o f t h e sys tem i s v e r y good. The s e p a r a -
t i o n o f t h e t e m p e r a t u r e s on t h e l a s t day of f i g . 4 .2 i s
caused by a m a l f u n c t i o n o f t h e sys tem. T h i s i s a n i l l u s t r a -
t i o n o f a n i m p o r t a n t a s p e c t of v a l i d a t i o n work, which i s t o o
o f t e n over looked ; it c a n p r o v i d e a v e r y e f f e c t i v e check on
t h e f u n c t i o n i n g of a system.
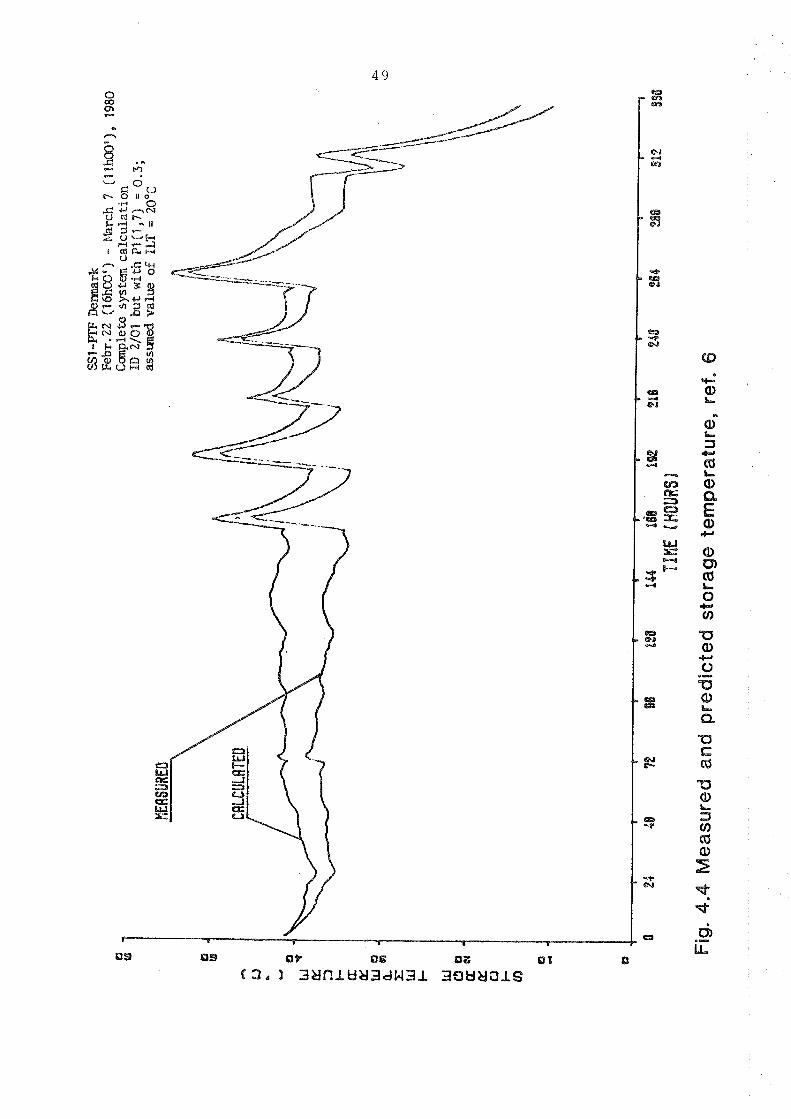
Two of t h e f i g u r e s i l l u s t r a t e a n a t t e m p t of pa ramete r e s t i -
ma t ion by v a l i d a t i o n . I n t h i s c a s e some u n c e r t a i n t y e x i s t e d
on t h e t e m p e r a t u r e of t h e s u r r o u n d i n g of t h e s t o r a g e , ILT.
F i g . 4,4 shows a comparison of p r e d i c t e d and measured s t o r a g e 0
t e m p e r a t u r e s , assuming I L T = 20 C . The d i f f e r e n c e between
p r e d i c t e d and measured s t o r a g e t e m p e r a t u r e i n c r e a s e s d u r i n g
t h e f i r s t 7 d a y s which most obvi .ously c o u l d b e caused by t h e
p r e d i c t i o n of low s t o r a g e l o s s e s , which a g a i n c a n be caused
by e i t h e r t o o s m a l l a l o s s c o e f f i c i e n t f o r t h e s t o r a g e o r
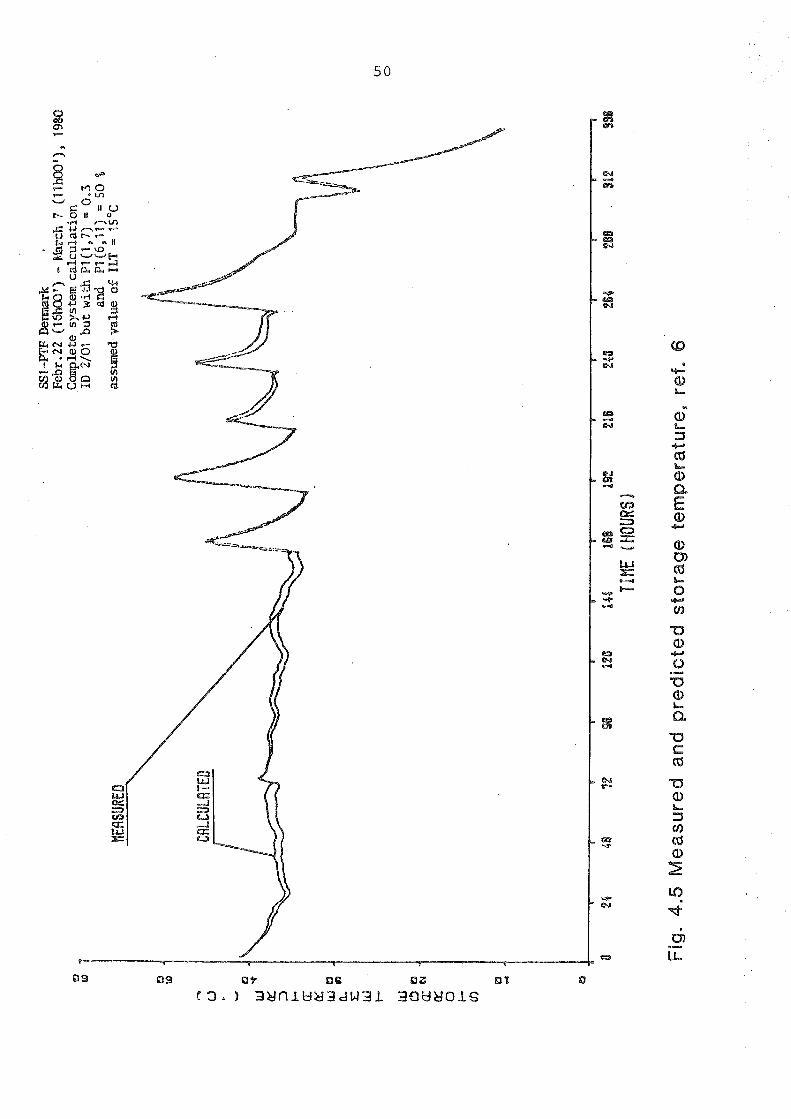
t o o h i g h a v a l u e of I L T . The l a t t e r has been lowered 5OC t o
15Oc on f i g . 4 . 5 , which seems t o be a much b e t t e r e s t i m a t e
f o r t h i s t e m p e r a t u r e . The a c t u a l t e m p e r a t u r e s f o r t h i s pe-
r i o d w e r e between 16OC and 17Oc.
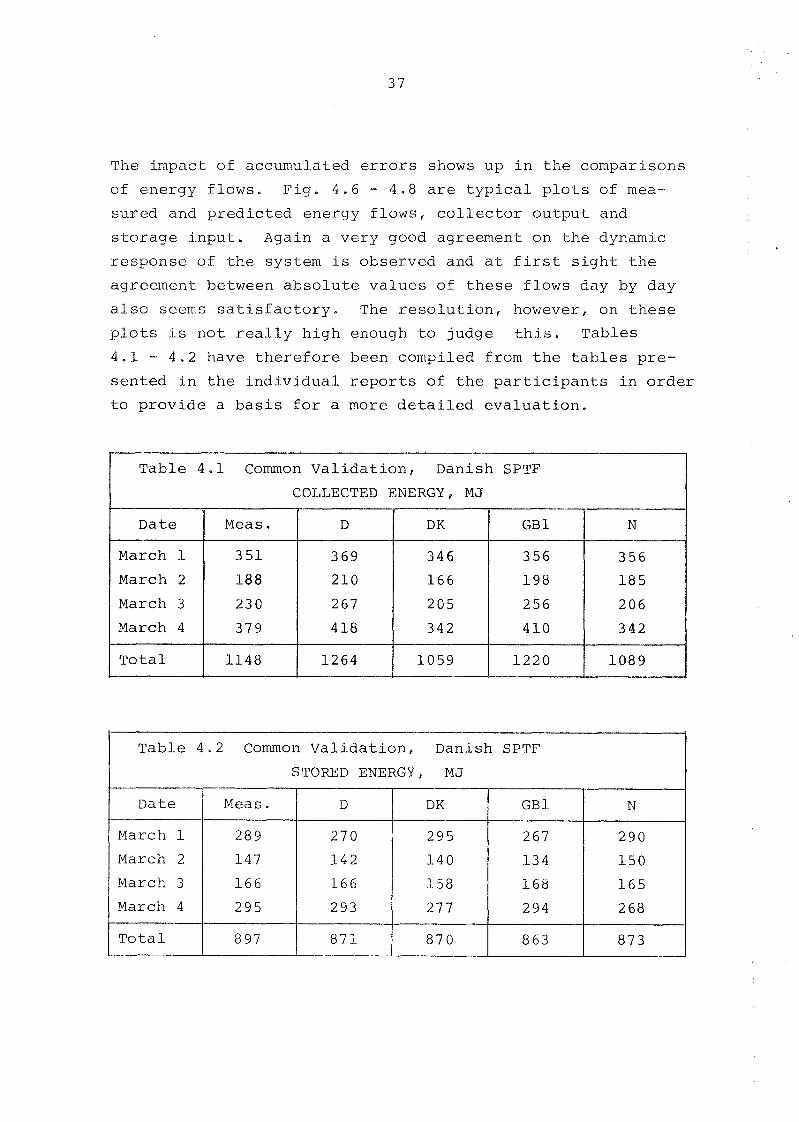
The impact of accumulated e r r o r s shows up i n t h e compar isons
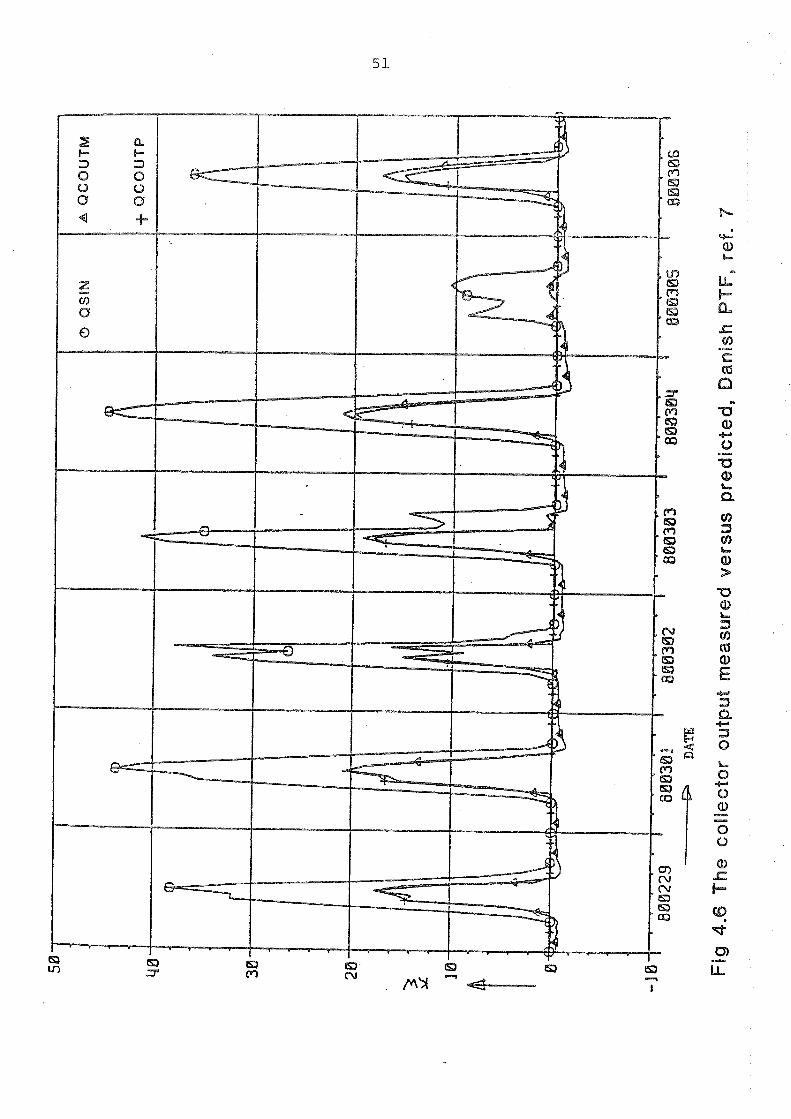
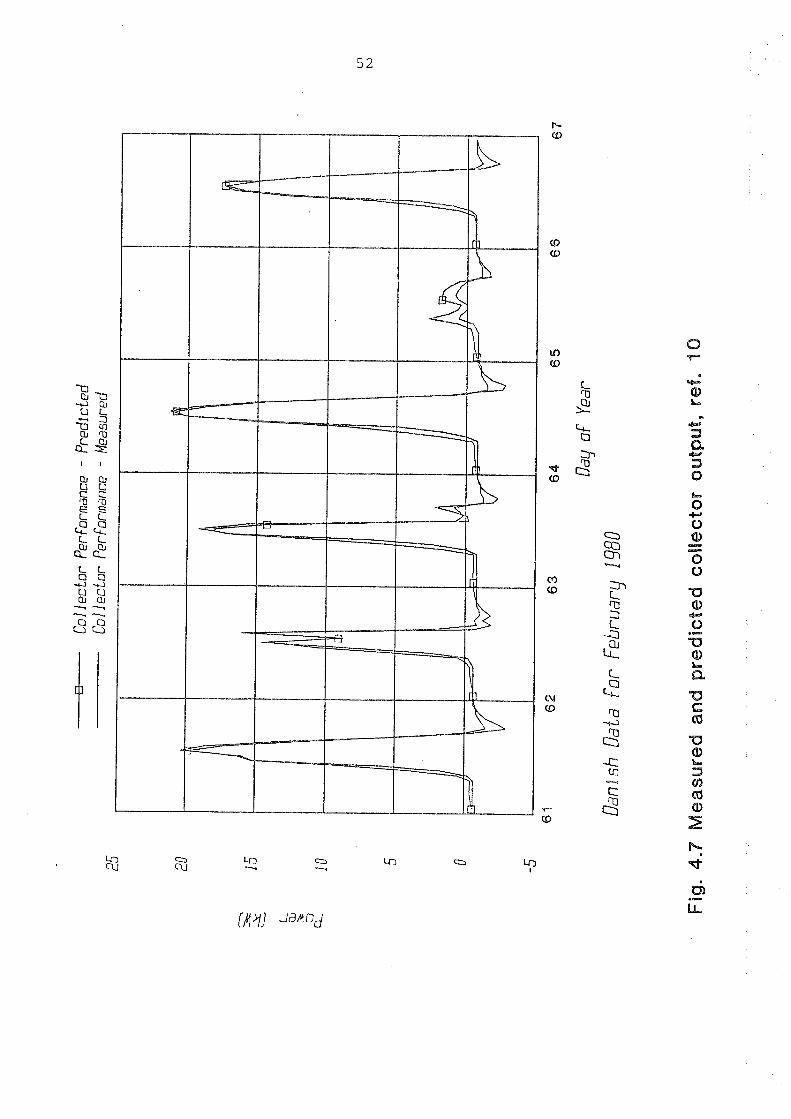
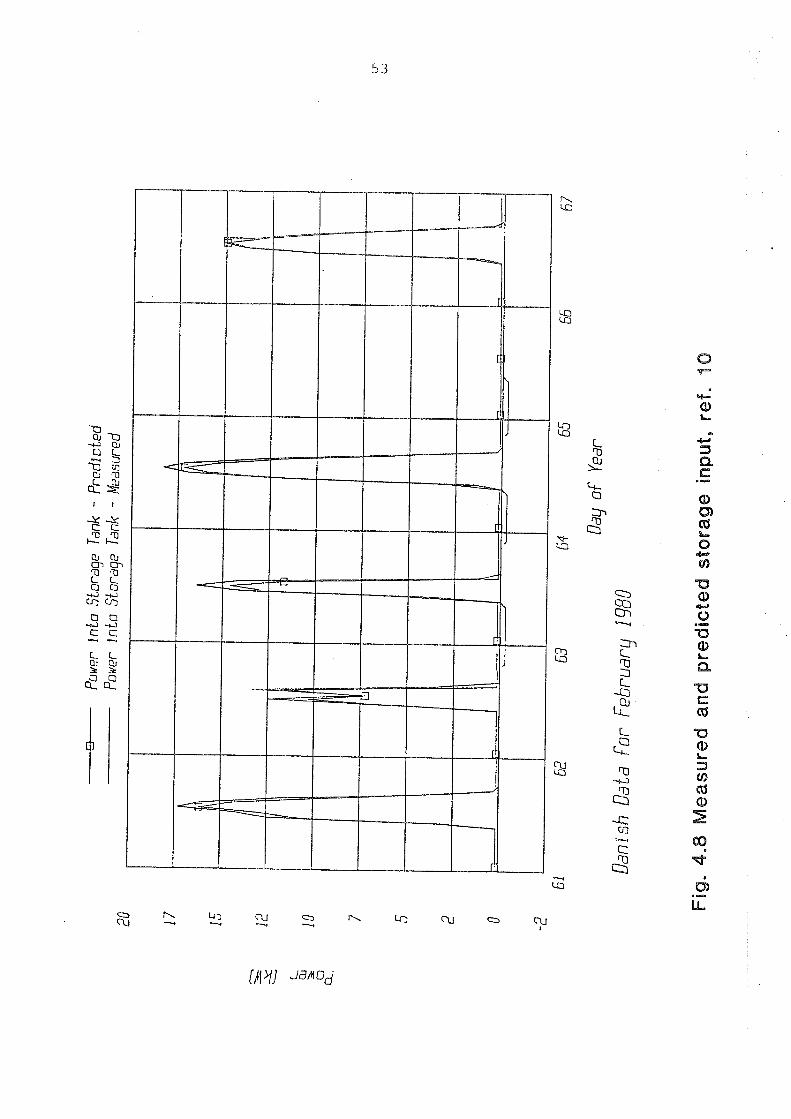
of ene rgy f l o w s . F i g . 4 . 6 - 4 . 8 a r e t y p i c a l p l o t s of mea-
s u r e d and p r e d i c t e d energy f l o w s , c o l l e c t o r o u t p u t and
s t o r a g e i n p u t . Again a v e r y good agreement on t h e dynamic
r e s p o n s e of t h e system i s obse rved and a t f i r s t s i g h t t h e
agreement between a b s o l u t e v a l u e s of t h e s e f l o w s day by day
a l s o seems s a t i s f a c t o r y . The r e s o l u t i o n , however, on t h e s e
p l o t s i s n o t r e a l l y h i g h enough t o judge t h i s . T a b l e s
4 . 1 - 4 . 2 have t h e r e f o r e been compiled from t h e t a b l e s p r e -
s e n t e d i n t h e i n d i v i d u a l r e p o r t s of t h e p a r t i c i p a n t s i n o r d e r
t o p r o v i d e a b a s i s f o r a more d e t a i l e d e v a l u a t i o n .
T a b l e 4.2 Common V a l i d a t i o n , Danish SPTF
STORED ENERGY, M J
The v a l u e s of i n t e g r a t e d c o l l e c t o r o u t p u t p r e s e n t e d i n
t a b l e 4 . 1 do n o t c o n t a i n t h e n e g a t i v e v a l u e s of c o l l e c t o r
g a i n d u r i n g n i g h t t i m e , ma in ly because most of t h e c o l l e c -
t o r s u b r o u t i n e s do n o t h a n d l e t h i s s i t u a t i o n v e r y w e l l .
The r e s u l t s of t h e Danish model, however, have o n l y been
p r e s e n t e d a s n e t ene rgy g a i n , and t o compare t o t h e o t h e r s
approx. 10 M J p e r day shou ld be added t o e x c l u d e t h e n i g h t -
t i m e l o s s e s . The p r e d i c t e d t o t a l ene rgy o u t p u t of t h e c o l -
l e c t o r s f o r t h i s 4-day p e r i o d r a n g e s between 5.1% below t o
10 .1% above t h e measured v a l u e . I t shou ld be n o t e d t h a t t h e
measured v a l u e i n c l u d e s t h e l o s s e s o f t h e s e c t i o n s of p i p e s
between t h e c o l l e c t o r s and t h e s e n s o r s which a r e q u i t e sub-
s t a n t i a l i n t h i s system. The p r e d i c t e d e n e r g i e s do n o t
a c c o u n t f o r t h e s e p i p e l o s s e s and have t h e r e f o r e a s m a l l po-
s i t i v e b i a s (5-10 MJ/.day) i n r e l a t i o n t o t h e measured v a l u e .
From t a b l e 4 . 2 i s s e e n t h a t t h e t o t a l amount of s t o r e d energy
p r e d i c t e d by t h e f o u r programs f o r t h e p e r i o d i n q u e s t i o n
v a r i e s between 2.9% and 3 .8% below t h e measured v a l u e . T h i s
seems l i k e a r e a s o n a b l y good agreement , b u t on a c l o s e r l o o k
much l a r g e r d i f f e r e n c e s a r e obse rved on a d a i l y b a s i s . I n
b o t h t a b l e s d i f f e r e n c e s i n t h e o r d e r of 210% c a n be found
f o r t h e d a i l y v a l u e s .
The f i n e agreement i n t h e n e t r e s u l t s ( t o t a l s t o r e d energy)
i n d i c a t e s t h a t a s i m p l e accumula t ion of e r r o r s d o e s n o t t a k e
p l a c e . T h i s c a n , however, a l s o be t h e e f f e c t o f t h e e r r o r s
b a l a n c i n g each o t h e r because of t h e i n t e r a c t i o n of components
i n t h e system. T h i s i s a consequence of t h e n e g a t i v e feed-
back mechanism i n t h e s o l a r system which, t o some e x t e n t ,
p r e v e n t s accumula t ion of e r r o r s .
4 . 3 Common v a l i d a t i o n on d a t a from t h e p-- B e l g i a n SPTF i n s t a l l a t i o n
For t h i s second p a r t of t h e common v a l i d a t i o n work a s e l e c -
t e d p e r i o d of d a t a from t h e B e l g i a n SPTF were used . The d a t a
c o n s t i t u t i n g one month of 5-minutes d a t a , were d i s t r i b u t e d
on magne t i c t a p e a long w i t h t h e i n s t a l l a t i o n d e s c r i p t o r
for the system (see Appendix l). The models validated on
these data were: B, D, DK, F, GB1 and N.
The fact that these data were given at S-minutes intervals
was exploited by two of the participants to investigate the
impact of the choice of simulation time step. The approach
was taken for the models D and GBl. Two of the partici-
pants, B and D, have performed component validation and
three have tried to obtain better agreement by parameter
adjustment, B, D and F.
As the Belgian participant presents his work on these data
in the context of his national validation work, his results
on these data are discussed in the following chapter.
Con~ponent --- validation
The German participant chose to divide the system into three
components: The collector, the pipes and heat exchanger,
and the storage.
From the first comparisons of the collector output it ap-
peared that the collector model was dynamically too slow re-
sulting in a calculated net* collector gain 17% less than
the measured. This difference was reduced to 1% by making
the following parameter changes:
- Absorptance of cover = 0-04 instead of 0.084
- Emittance of absorber = 0.18 - 0.30
- Collector efficiency = 0.98 - 11 - 0.95
Although the use of these parameters made the calculated net
collector output agree very well with the measured value, the
agreement on gross collector outputs was still not satisfac-
tory. The difference for the period was changed from 30% to
21%.
* valve in the primary circuit in the heat exchanger position
The compar isons on t h e p i p e s and h e a t exchanger show t h a t
t h e p r e d i c t e d c o l l e c t o r i n l e t t e m p e r a t u r e i s t o o s m a l l and
t h e p r e d i c t e d s t o r a g e t e m p e r a t u r e t o o h i g h , when t h e c o l -
l e c t o r supp l . i e s ene rgy t o t h e s t o r a g e . T h i s i n d i c a t e s t h a t
t h e h e a t exchanger e f f e c t i v e n e s s i s o v e r e s t i m a t e d . When no
energy i s d e l i v e r e d from t h e c o l l e c t o r s t o t h e s t o r a g e t h e
compar isons show t h a t t h e measured i n t e g r a t e d energy f low
t o t h e s t o r a g e i s h i g h e r t h a n t h a t c a l c u l a t e d ; t h i s was
t a k e n a s an i n d i c a t i o n of t o o s m a l l a n e s t i m a t e of pump power
d e l i v e r e d t o t h e f l u i d . Consequent ly t h e f o l l o w i n g changes
w e r e made and gave b e t t e r agreement:
- e f f i c i e n c y of h e a t exchanger = 0.32 i n s t e a d of 0.44
- pump power d e l i v e r e d t o t h e f l u i d = 70 % - ,I - 50%
The c a l c u l a t i o n s w i t h t h e s t o r a g e model a l o n e gave s a t i s f a c -
t o r y r e s u l t s and no pa ramete r a d j u s t m e n t s w e r e needed.
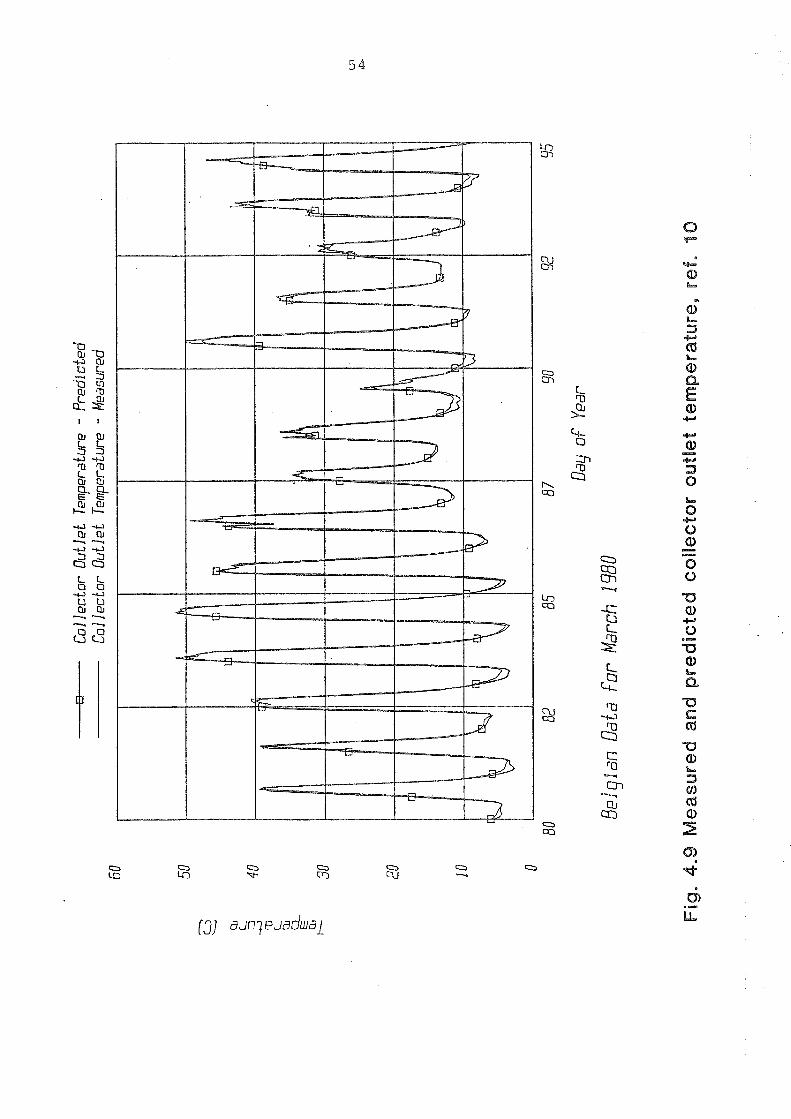
System - v a l i d a t i o n
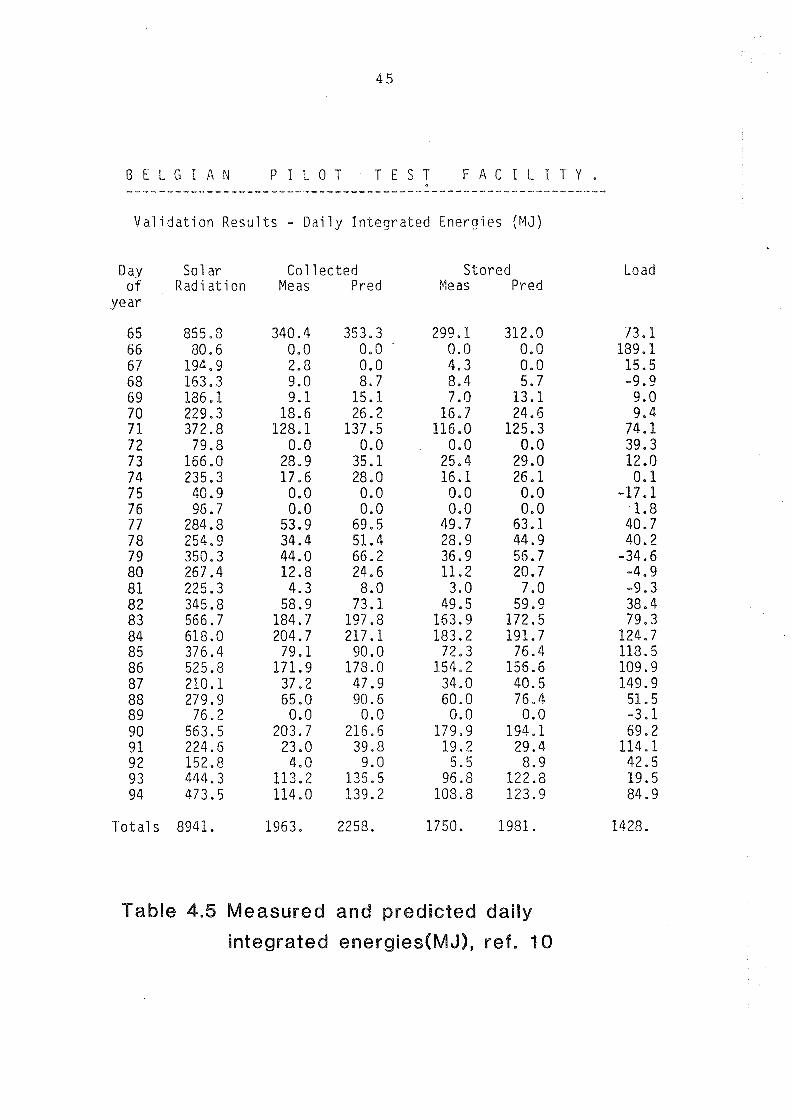
F i v e of t h e p a r t i c i p a n t s have p r e s e n t e d t h e i r r e s u l t s i n
bo th t a b u l a r and g r a p h i c a l forms ( t a b l e 4 . 5 and f i g . 4.9 a r e
t y p i c a l e x a m p l e s ) . On t h e b a s i s of t h e t a b l e s t h e r e s u l t s
o b t a i n e d by t h e s e p a r t i c i p a n t s on t h i s same d a t a se t c a n be
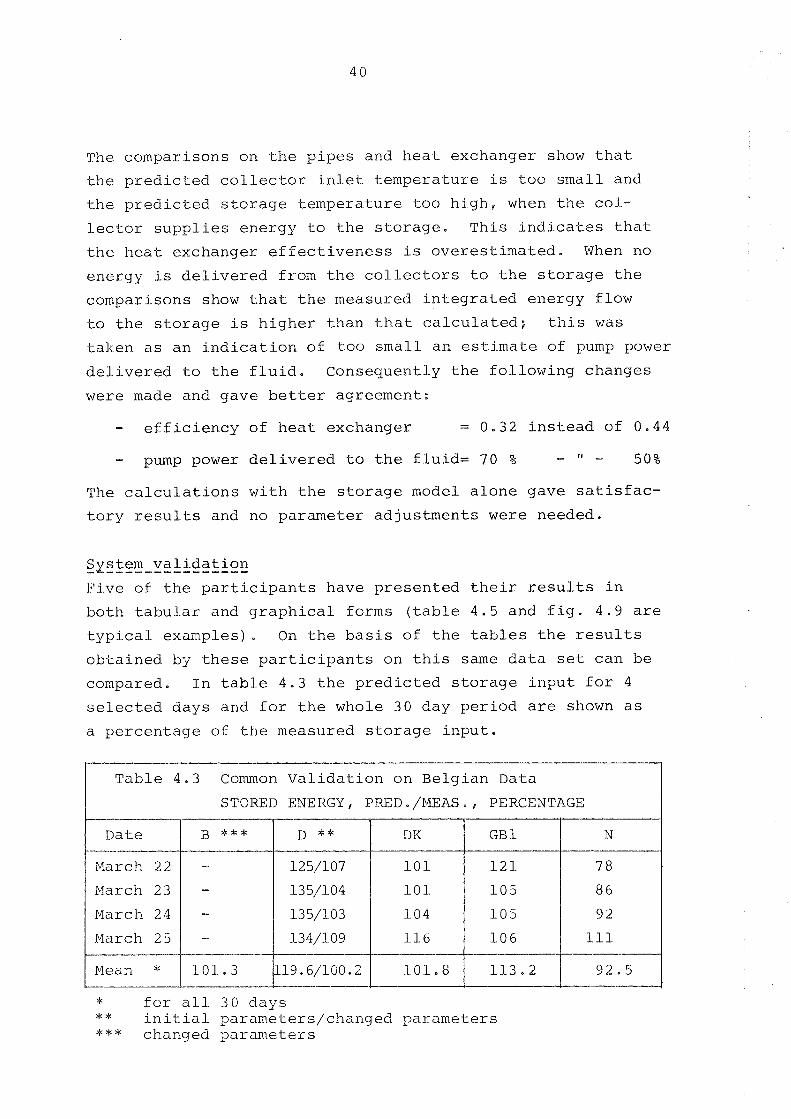
compared. I n t a b l e 4 .3 t h e p r e d i c t e d s t o r a g e i n p u t f o r 4
s e l e c t e d days and f o r t h e whole 3 0 day p e r i o d a r e shown a s
a p e r c e n t a g e of t h e mea.sured s t o r a g e i n p u t .
V a l i d a t i o n on B e l g i a n Data
p e a n * 101.3 101.8 113.2 9 2 . 5
* fcr a l l 30 d a y s * * i n i t i a l pararneters/changed p a r a m e t e r s * * * changed 2 a r a m e t e r s
It should be noted that the results obtained with DK, GB1
and N have been calculated on the basis of the distributed
installation descriptor, whereas the results obtained with
B is calculated using the set of parameters found by con-
ponent validation. For D both sets of results are presen-
ted. It is almost impossible to conclude anything on the
basis of these numbers except that they show that the va-
riations day by day are rather large and also that the va-
riations among the models are very large. It is striking
that the four codes using exactly the same input parameters
predict 92.5, 101.8, 113.2 and 119-6 % of the measured
storage input, a variation of 25%: This table illustrates
the necessity of comparing predictions and measurements of
integrated energy. If this is not done a graphical compa-
rison of temperatures as shown on fig. 4.9 (which is a ty-
pical plot produced by the participants) may lead to the
conclusion that the agreement is excellent in a case where
the integrated energy flows are 13% off.
Parameter adjustments --------
As mentioned above three of the participants have sought to
obtain better agreement by changing some of the input para-
meters to the model. This, however, is a very delicate
matter because many of the parameters are inter-related.
TO obtain a better collector performance, for example, the
gain can be improved or the losses decreased and there are
several ways to do both; and then the collector capacity
can be changed. This does not mean that it should not be
tried but rather that it should be done with care. In the
case of the Belgian SPTF it is interesting to see which pa-
rameters the participants found to improve the agreement of
the comparisons. In table 4.4 the "improved" parameters are
presented along with the original values.

TABLE 4.4 "IMPROVED" PARAMETER VALUES
Parameter Original value Value obtained by from ID 1 B ~ ) D1) F 2 )
Storage loss coefficient W/K
Heat exchanger effectiveness
Specific heat of fluid in primary circuit J/k9K
Back and side collector loss coefficient W/K
Absorptance of the cover
Emittance of the absorber plate
Collector effi- ciency factor
Power from pump to fluid %
I) componentvalidation 2) system validation 3) measured
It appears from the table that the French and German partici-
pants seek to raise the system output by respectively lowering
the storage losses and raising the collector efficiency. Both
of them have found that the quoted heat exchanger effective-
ness was too high, On the other hand the Belgian participant
has found that the original value of the heat exchanger
effectiveness is a11 right and that the collector efficiency
has to be lowered by increasing the back and side losses.
This comparison, however, is not very meaningful because
the Belgian participant had measured the specific heat of
the fluid in the primary circuit to a somewhat lower value
than given in the installation descriptor for the system.
The measured collector output was then lowered accordingly,
5-minutes vs. l-hour time step simulation --------.---------------------
In the interest of saving computer time, the question of
the length of time step to us,e in the simulation of solar
systems is of great interest to modellers. Two of the
modellers in the Modelling Group compared the predictions - obtained with 5-minute time .steps to those obtained with
hourly time steps, Both concluded that, although a diffe-
rence could be observed, it was of no significance for the
simulation of this system. It has to be emphazised that
the sensitivity to length of time step is very dependent
on both system time-constant and on integration technique
implemented in the model. In the case of the SPTF the time-
constant is rather large which means that long time steps
can be used in most models. This is very nicely supported
by the results obtained by the German and English partici-
pants. This question is further treated in chapter 6.
The treatment of load in SPTF system validation work .................... The special configuration of the SPTF systems, with a simu-
lated load and an artificial interface to withdraw the
fraction of this load as a function of requested distribu-
tion temperature in the "heating system", invites a
discussion among modellers on how to treat this load, when
performing system validation. In the case of the Belgian
data, the load was given as measured storage output and not
as the required heating load of the simulated house. There-
fore the latter could not be used as input for the models,
but the storage inlet temperature and capacity flow rate
from t h e i n t e r f a c e were g i v e n on t a p e , and opened up a
t h i r d ( i n between) p o s s i b i l i t y , which was chosen by t h e
Danish p a r t i c i p a n t . The impact of u s i n g t h e s e two v a r i -
a b l e s i s t h a t t h e s t o r a g e t e m p e r a t u r e becomes c r u c i a l f o r
t h e amount of ene rgy t h a t can be withdrawn from t h e s t o r a g e .
I n t h i s way t h e l o a d i s t r e a t e d i n a manner s i m i l a r t o a
t r u e r e q u i r e d h e a t i n g l o a d w i t h o u t mode l l ing t h e c o n t r o l on
t h e i n t e r f a c e .
When u s i n g t h e measured s t o r a g e o u t p u t a s a d r i v i n g f o r c e
i n t h e model, t h i s amount o f ene rgy i s withdrawn from t h e
s t o r a g e whether o r n o t t h e s t o r a g e t e m p e r a t u r e i s a t a
l e v e l where it c a n supp ly t h i s amount of ene rgy . The i m -
p a c t of t h i s i s i l l u s t r a t e d on f i g . 4 . 4 where t h e measured
and p r e d i c t e d s t o r a g e t e m p e r a t u r e a r e compared. During t h e
p e r i o d shown t h e d i f f e r e n c e i n c r e a s e s s l i g h t l y , which i s an
i n d i c a t i o n of a s m a l l u n d e r p r e d i c t i o n o f t h e sys tem p e r f o r -
mance. The f a c t t h a t t h e s t o r a g e i s f o r c e d t o d e l i v e r more
energy t h a n it a c t u a l l y c a n , makes t h e p r e d i c t e d s t o r a g e
t e m p e r a t u r e lower and lower . Had t h e r e q u i r e d h e a t i n g l o a d
been u s e d , implying t h a t t h e program c a l c u l a t e s how much
of t h i s can be s u p p l i e d from t h e s t o r a g e , t h e s m a l l under-
p r e d i c t i o n would n o t have shown up a s s i g n i f i c a n t l y on t h e
s t o r a g e t e m p e r a t u r e a s on f i g . 4 . 4 , b u t i n s t e a d r e s u l t e d
i n a s m a l l e r f r a c t i o n o f s o l a r .
The advan tage of t h e former approach i s t h a t it v e r y d i -
s t i n c t l y i l l u s t r a t e s a n accumula ted e r r o r . The l a t t e r
i s a more r e a l i s t i c c a l c u l a t i o n and h a s t h e advan tage t h a t
t h e compar isons a r e n o t t h a t much a f f e c t e d by an accumu-
l a t e d e r r o r .
From t a b l e 4 . 3 i t a p p e a r s t h a t t h e Danish p a r t i c i p a n t p re -
d i c t s a s t o r a g e i n p u t 1 . 8 % h i g h e r t h a n t h e measured. T h i s
c o r r e s p o n d s v e r y w e l l w i t h h i s p r e d i c t i o n of t h e s o l a r
s u p p l y t o t h e l o a d which i s 2.1% h i g h e r t h a n t h e measured.
B E L G I A N P I L O T . T E S T F A C I L I T Y . O - P - I - P - ~ - - - I - P - - - D - - - - - - - - - - - - - - - - - - - - - - - - - - - - - - - - - - - - - - - - -
Validation Results - Dai ly Integrated Energies (MJ)
D a.Y Sol ar Col lected Stored o f . Radiation Meas Pred Me as Pred
year
T o t a l s 8941. 1963. 2 2 5 8 . 1750. 1981.
Table 4.5 Measured and predicted daily
Load
integrated energiesgMJ), ref. 10
'C] Q) + 0 .- 'C]

CHAPTER 5
NATIONAL VALIDATION


5. NATIONAL VALIDATION
The national validation work constituted a considerable
part of the work of the Modelling Group participants during
the pe.riod in question. Each modeller performed data ana-
lysis and model validation work on all the data produced by
the SPTF SSlin his/her own country. Since not all the
SPTF's were completed at the same time the amount of data
produced for validation work differed a great deal from
country to country. Six of the eight participants have pre-
sented results under this activity. Below a short presenta-
tion of the work of each of the six participants is given.
Belgium --- --- The Belgian participant performed national validation work
on five sets of data from 1980. The periods are between 13
and 30 days long. In ref. 6 both component and system vali-
dation works are documented. All the calculations are per-
formed with a time step of 5 minutes. The primary aim of
the component validation work has been to find the correct
parameters for the description of the components. The cal-
culations have been performed for all five periods to give
a better estimation of the parameters in question. Fig. 5.1-
5.3 show a set of curves in order to find the correct value
for the tank heat loss coefficient, the collector back end
side loss coefficient and the heat exchanger heat transfer
coefficient respectively. The expectation was that the
curves on each figure intersect the abscissa axis at the
same point. This is not the case; on the contrary the spread
is rather large. There can be several reasons for the ob-
served discrepancy:
- measured errors and uncertainties
- wrong estimation of other parameters (such as
capacities and pump energy dissipation)
The Belgian participant intends to repeat these calcula-
tions on new sets of data to obtain a better statistical
basis for the estimation of the parameters.
Two pairs of curves from ref. 6 are shown here to illustrate
how the choice of parameter values affects the simulation
results. Fig. 5.4 and fig. 5.5 show a plot of measured
and predicted storage temperatures using storage loss
coefficients of 5 W/K and 13 W/K respectively. Likewise
fig. 5.6 and fig. 5.7 show the measured and predicted dif-
ferences between collector inlet and collector outlet tem-
peratures for two values of the collector back and side loss
coefficient, 101 W/K and 37.55 W/K respectively. In both
cases the agreement between measured and predicted values
are significantly improved by changing the parameter.
Germalrar The German Modelling Group participant received only one set
of data useful for validation work from the German SPTF,
(April 3-9, 1980). More data were sent from the SPTF, but
most of them represented very short periods of time. No
data were produced during a period of more than half a year
because of alterations of the system installation, and when
data collection was resumed, problems with temperature and
insolation measuring equipment meant that the data could not
be used for validation purposes.
In April 1 9 8 0 the SPTF was not quite completed, so the vali-
dation work on these data was mainly made to check the per-
formance of the system and the measuring equipment. One of
the results of this was that the measurements of the storage
temperature difference was found to be erroneous.
Because of a shortage of national data the German participant
concentrated his effort on the common validation work, see
chapter 4.
Validation on the Danish SPTF data has been performed con-
tinuously during the period. Results from three different
periods containing 14-16 days of hourly data have been re-
ported in ref. 5 using comparison plots of collector output,
storage input, collector inlet temperature and storage tank
temperature, and tables of daily energy flows. NO attempt
has been made to adjust some of the parameters for better
agreement, and only total system validation calculations
have been performed.
Fig. 5.8 - 5.11 show.the set of comparison ?lots from one of the periods and table 5.1 is the daily energy flow compa-
rison table for the same period. Results show a remarkably
good agreement between.measured and predicted values. The
Danish participant mentions three reasons for the discrepan-
cies:
measurement errors
wrong estimation of system parameters
model shortcomings
Because of the inter-relationship between these factors it
is very difficult to estimate the relative importance of
each of them.
Validation of the model GB1 using data from the UK SPTF has
been carried out on four sets of data of 8-16 days. During
the working period the model was modified and improved and a
final series of simulations have been performed for all four
sets of data. In ref. 10 the results of these simulations
are compared to the measured results by computer plots and
tables. For each set of data the following plots have been
made: Storage Tank Temperature, collector outlet tempera-
ture, collector inlet temperature, collector output and
storage tank input. The tables contain daily integrated
values of collected and stored energy. Special conside-
ration was given to the pipe losses as input parameter to
the model, An assessment of the area of uninsulated parts
of the pipes (ro.tameters, valves, pumps, etc.) was made and
it was found that the heat losses from, these parts accounted
for a significant proportion of the total losses of the
pipes. In the secondary circuit, the loss coefficient from
the insulated parts was 0.5 W/K, and 3.8 W/K from the un-
insulated parts.
The storage tank heat loss coefficj..ent was initi-ally calcu-
lated to be 4.56 W/K. From the validation work on the
fourth set of data it became evident that this value was too
small and a value of 15 W/K, as used by other participants
of the Modelling Group in their national validation work,
wa.s adopted, In facttit was later discovered that there had
been an increase in the losses from the storage prior to the
recording of the set of data. This was due to distortion of
the bottom section of the tank as a result of overheating,
caused by a pump failure in the cooling circuit. Reasonably
good agreement has, however, been obtained with three of the
four sets of data with a loss value of 15 W/K. Thus, some
uncertainty remain as to what the correct loss value is.
Four plots have been selected from ref. l0 as a typical
example of the results of the U.K. participant, fig. 5.12 - fig. 5-15. Al.1 four plots show a fine agreement between
measured and predicted values.
Table 5.2 and 5.3 have been selected to show how well the
daily integrated flows compare, It is seen that the predic-
ted energy stored is higher than the measured. Taking into
account the accuracies of the measurements of temperature
differential, flow rate and the error in specific heat capa-
city of the fluid, the predicted energy lies well within the
range of accuracy of the measured data.
The energy collected shows more deviation. One particular
source of error here is the variation in specific heat ca-
pacity of the primary circuit fluid with temperature. This
will be taken into account in future work,
In addition to the four sets of data mentioned above, one
particular day (October 31, 1979) has been selected for
more detailed analysis. Data for that day were supplied at
five-minute intervals instead of hourly intervals. Fig.5.16
and 5.17 show the comparisons between measured and predicted
collector outlet and storage input. Also on these plots the
predicted collector output is somewhat higher than the meas-
ured, whereas the agreement on the storage input is quite
satisfactory.
Ireland
The Irish Modelling Group participant has presented valida-
tion results using one week of data from the Irish SPTF.
In ref. 9 the results are presented as two computer print-
out tables showing energy collected, energy stored, collec-
tor inlet, collector outlet and storage temperatures. From
the tables it can be seen that the model provides a compara-
tively poor fit to the observations of the real system.
Collector inlet and outlet temperatures were under-predicted 0 by about 6 C on average, while the mean difference between
0 measured and predicted store temperatures was -12.5 C.
The observed discrepancies may largely be due to malfunc-
tions and measurement errors in the SPTF installation over
the period in question. Also the use of incorrect parameter
values as input to the node1 is part of the reason for the
poor agreement; e.g, the heat loss coefficient used was
3.19 W / K , which is considerably lower than the 15 W/K used
by the other Modelling Group participants.
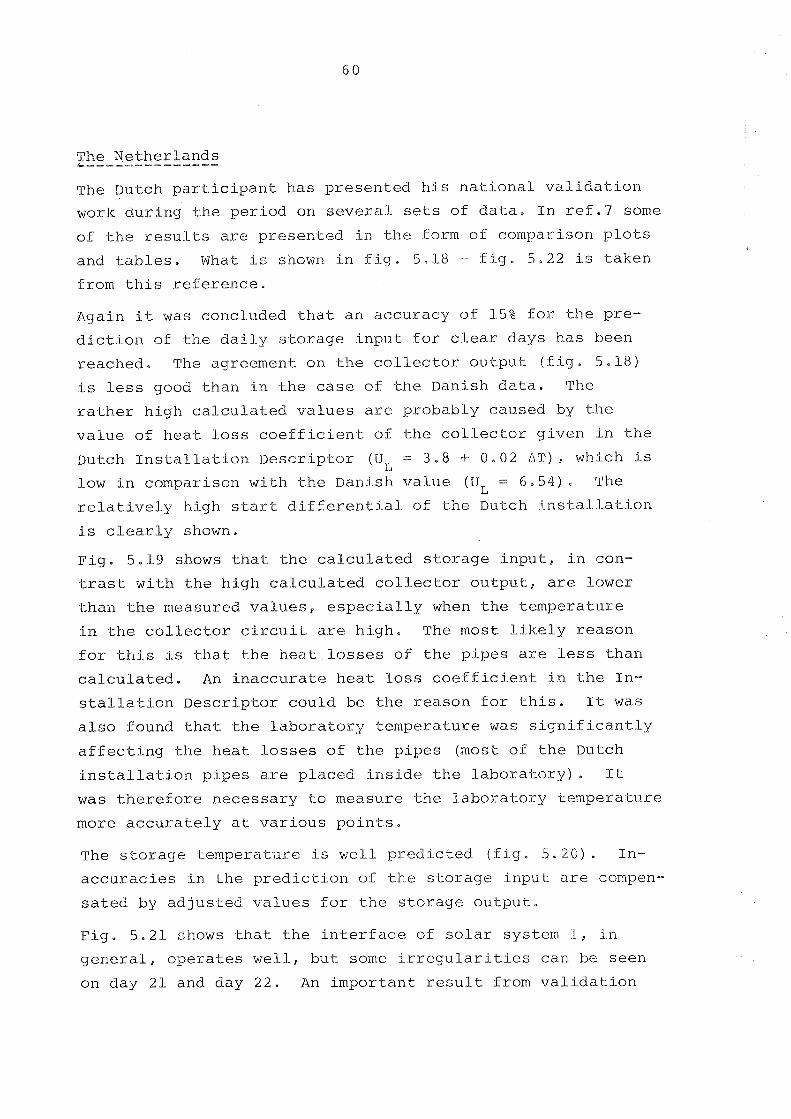
The Netherlands L ------------- -- The ~ u t c h participant has presented his national validation
work during the period on several sets of data, In ref ,7 some
of the results are presented in the form of comparison plots
and tables. What is shown in fig, 5.18 - fig. 5.22 is taken from this reference.
Again it was concluded that an accuracy of 1..5% for the pre-
diction of the daily storage input for clear days has been
reached. The agreem.ent on the collector outpuk(fig. 5.18)
i,.s less good than in the case of the Danish data. The
rather high calcula.ted values are probably caused by the
value of heat loss coefficient of the collector given in the
Dutch Installation Descriptor (UL = 3.8 + 0.02 A T ) r which is
low in comparison with the Danish value (UL = 6,54), The
relatively high start differential of the Dutch installation
is c1ea.rl.y shown.
Fig. 5.19 shows that the calculated storage input, in con-
trast with the high calculated collector output, are Lower
than the measured values, especially when the temperature
in the collector circuit are high, The most likely reason
for this is that the heat losses of the pipes are less than
calculated, An inaccurate heat loss coefficient in the In-
stallation Descriptor could be the reason for this. It was
also found that the laboratory temperature was significantly
affecting the heat losses of the pipes (most of the Dutch
installation pipes are placed inside the laboratory). It
was therefore necessary to measure the laboratory temperature
more accurately at various points,
The storage temperature is well predi.cted (fig, 5.20). In-
accuracies in, the prediction of the storage input are compen-
sated by adjusted values for the storage output.
Fig. 5.21 shows that the interface of solar system 1, in
general, operates well, but some irregularities can be seen
on day 21 and day 22. An important result from validation

work d u r i n g o t h e r p e r i o d s i s t h a t t h e c o o l i n g u n i t a p p e a r s
t o have i n s u f f i c i e n t c a p a c i t y t o o p e r a t e t h e i n t e r f a c e
d u r i n g t h e summer.
F i g . 5 . 2 2 shows r e l a t i v e l y h i g h c a l c u l a t e d c o l l e c t o r t e m -
p e r a t u r e s d u r i n g t h e mornings and r e l a t i v e l y low tempera-
t u r e s d u r i n g t h e n i g h t s . T h i s was a l s o t h e c a s e i n t h e
v a l i d a t i o n work on Danish and B e l g i a n d a t a .
A s a r e s u l t of t h i s v a l i d a t i o n work c o n v e c t i o n h e a t l o s s e s
from t h e h e a t exchanger w e r e i d e n t i f i e d . These l o s s e s oc-
c u r r e d a t n i g h t when t h e h e a t exchanger was bypassed.
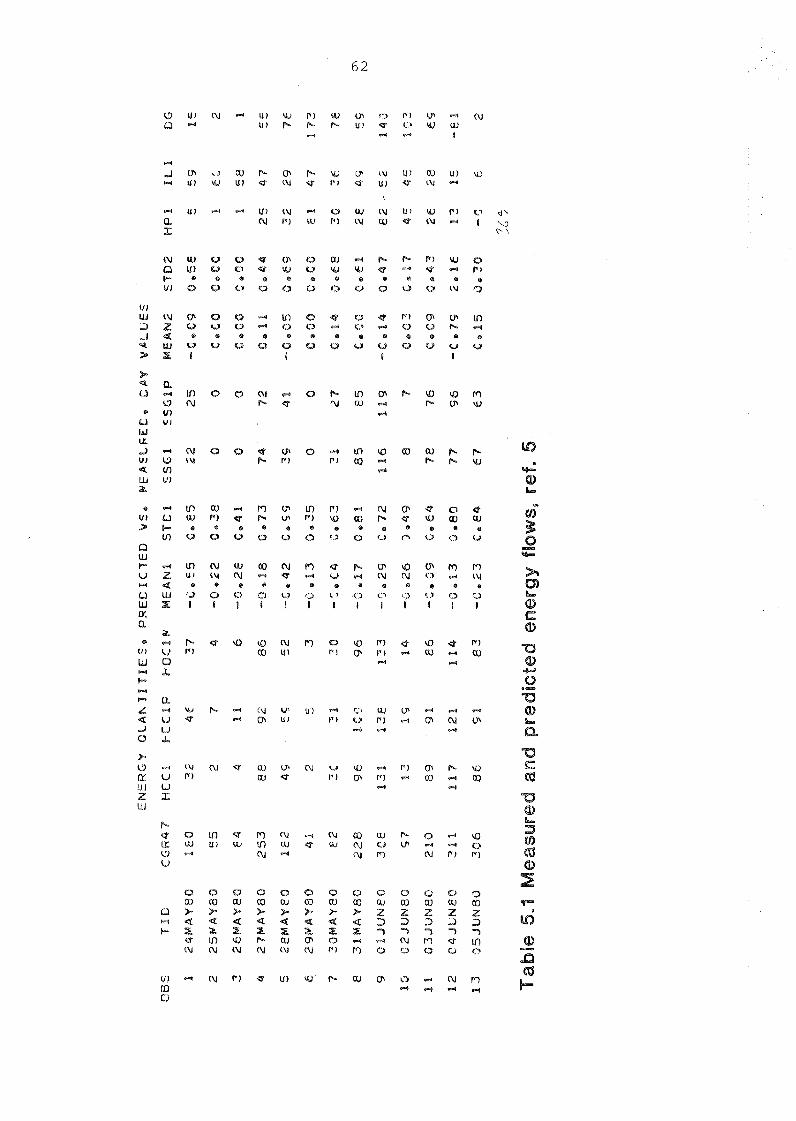
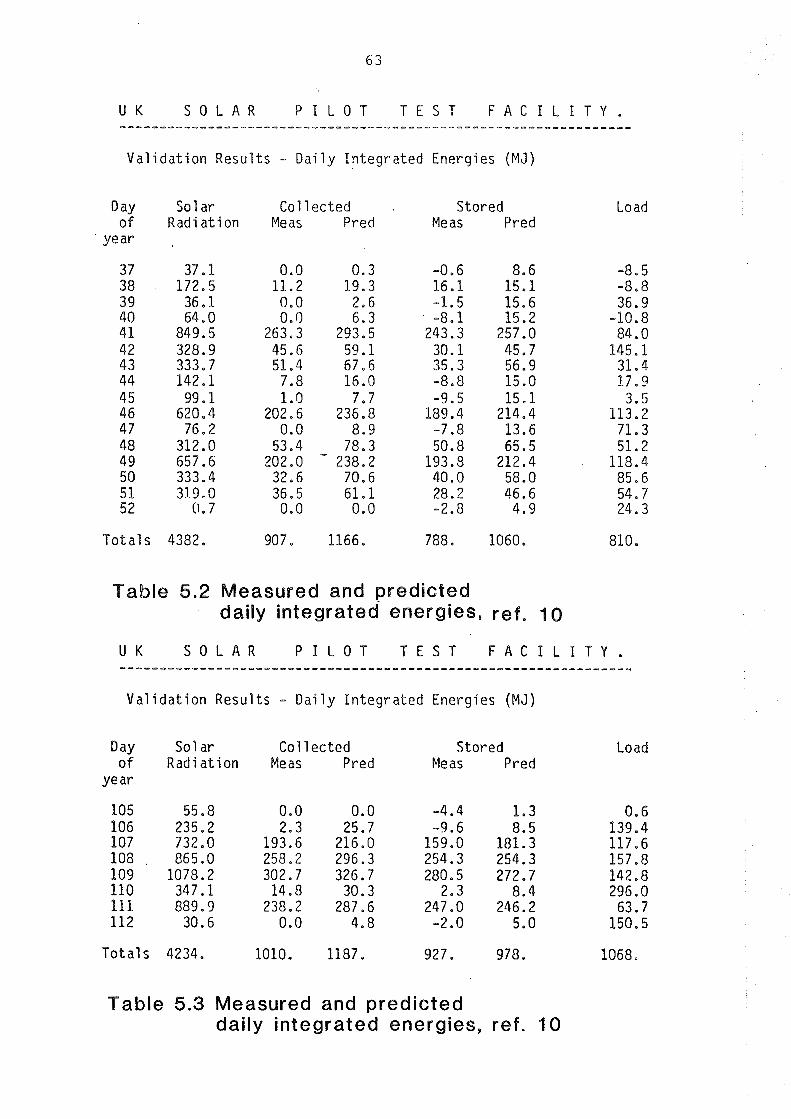
U K S O L A R P I L O T T E S T F A C I L I T Y . ................................................................
Validat ion Results - Daily In tegra ted Energies (MJ)
Day So l ar Col l ected Stored Load of Radiation Meas Pred Me as Pred
year
Tot a1 S 4382. 907. 1166. 788. 1060. 810.
Table 5.2 Measured and predicted daily integrated energies, ref. 10
U K S O L A R P I L O T T E S T F A C I L I T Y . -____P_--__--___---__---------------------------------------------
Validat ion Results - Daily In tegra ted Energies (MJ)
Day Sol ar Col lec ted Stored Load of Radiation Meas Pred Me as Pred
year
To ta l s 4234. 1010. 1187. 927. 978. 1068,
Table 5.3 Measured and predicted daily integrated energies, ref. 10
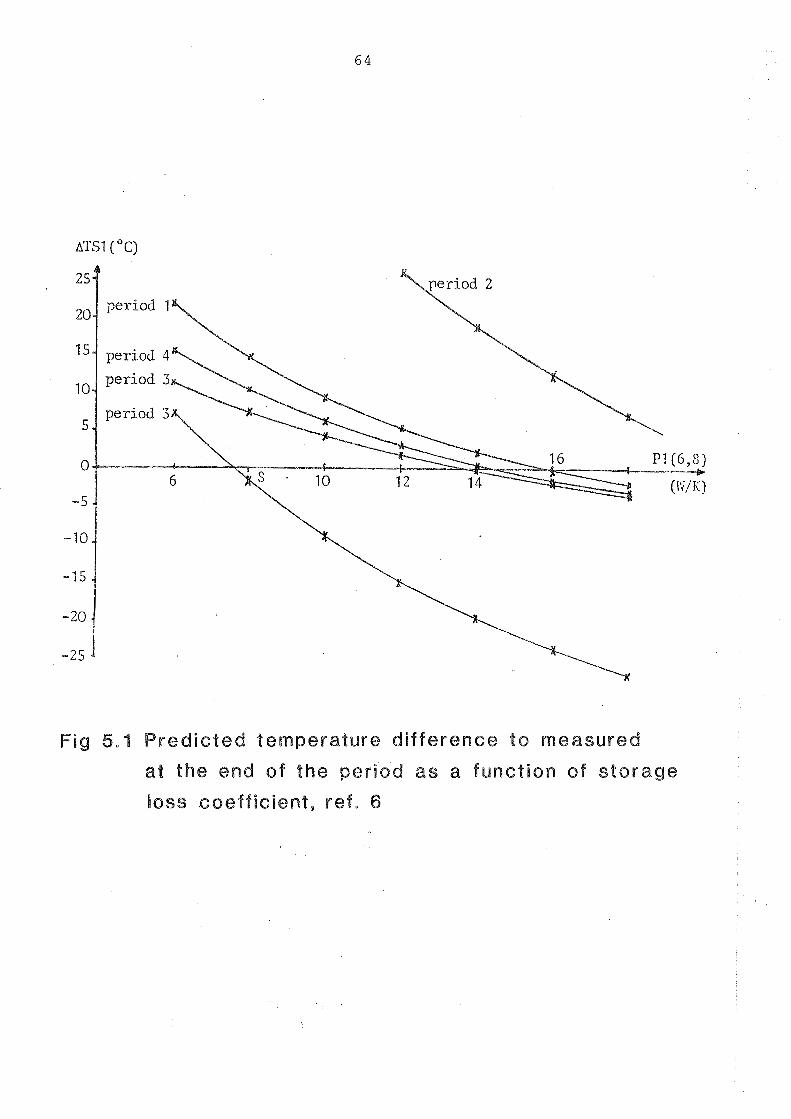
2 5
20 period 1
151 period 4
Fig 6.1 Pred ic ted temperature di f ference t o measured
at the end of the period as a function of s torage
loss coeff ic ient , ref. 6
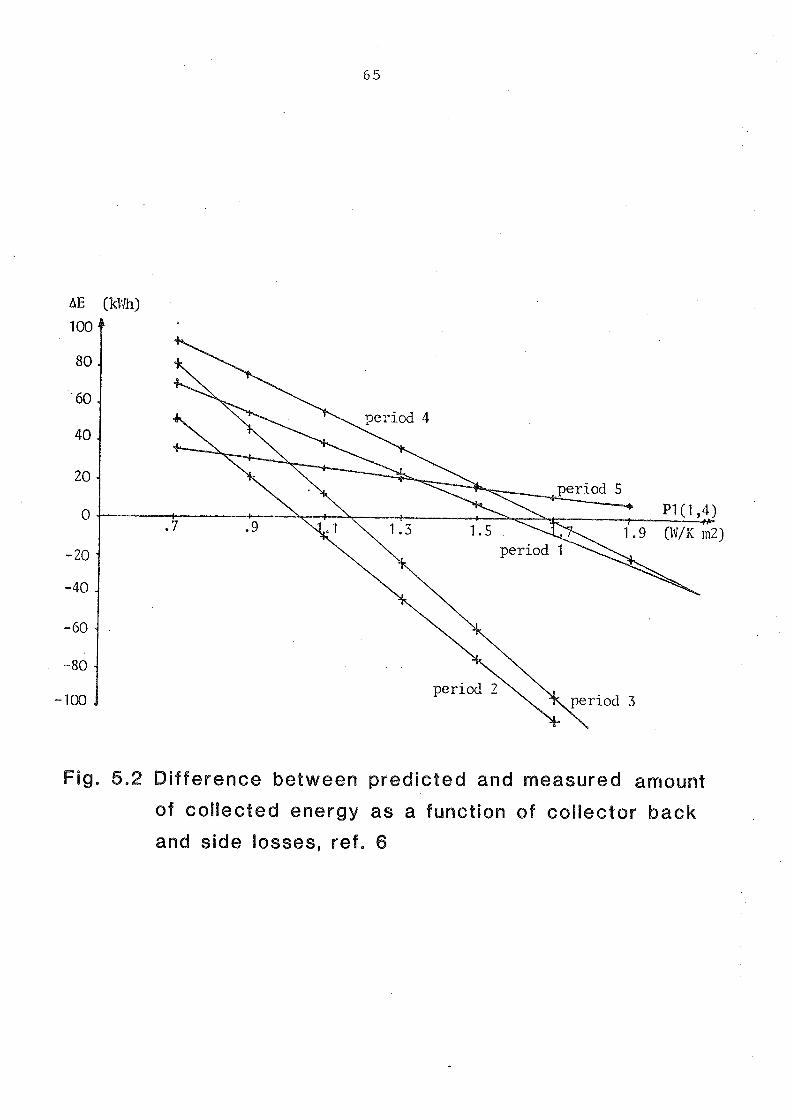
Fig. 5.2 Difference between predicted and measured amount
of collected energy as a function of collector back
and side losses, ref. 6
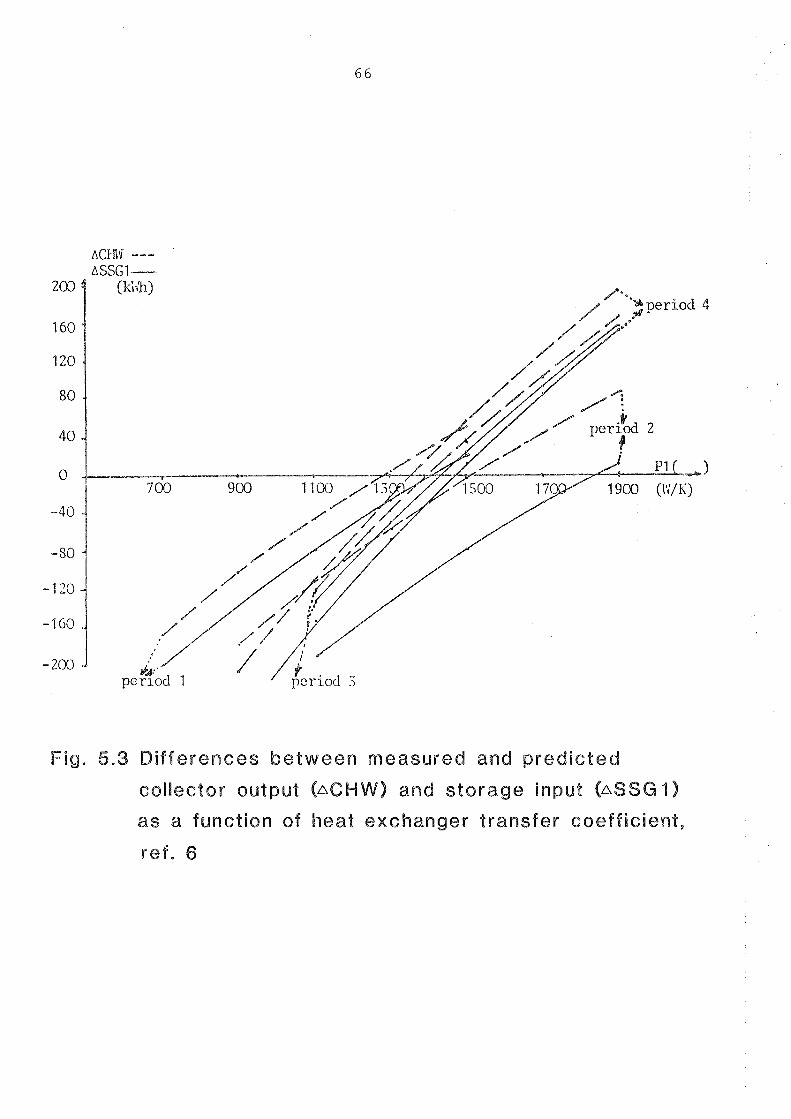
A~~~ --- ASSG 1 -----
Fig. 5.3 Di f ferences between measured and predicted
collector output (aCHW) and storage input ( A S S G I )
as a function of heat exchanger transfer coefficient,
ref . 6
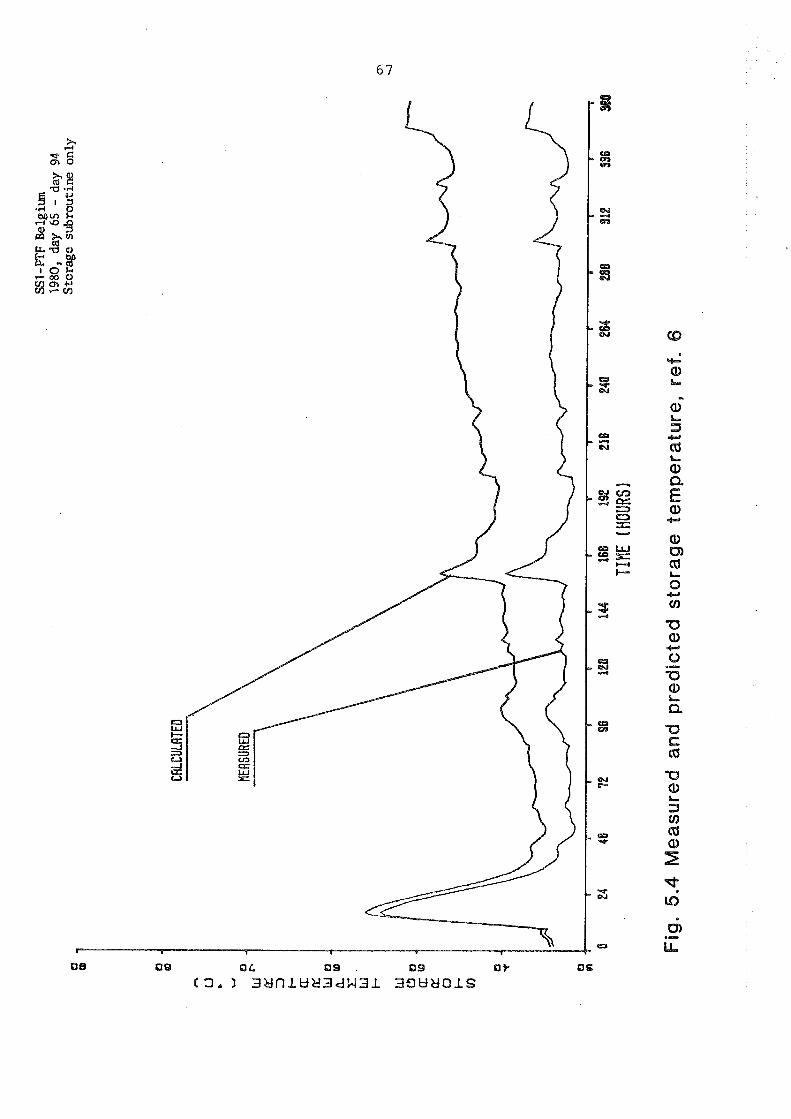
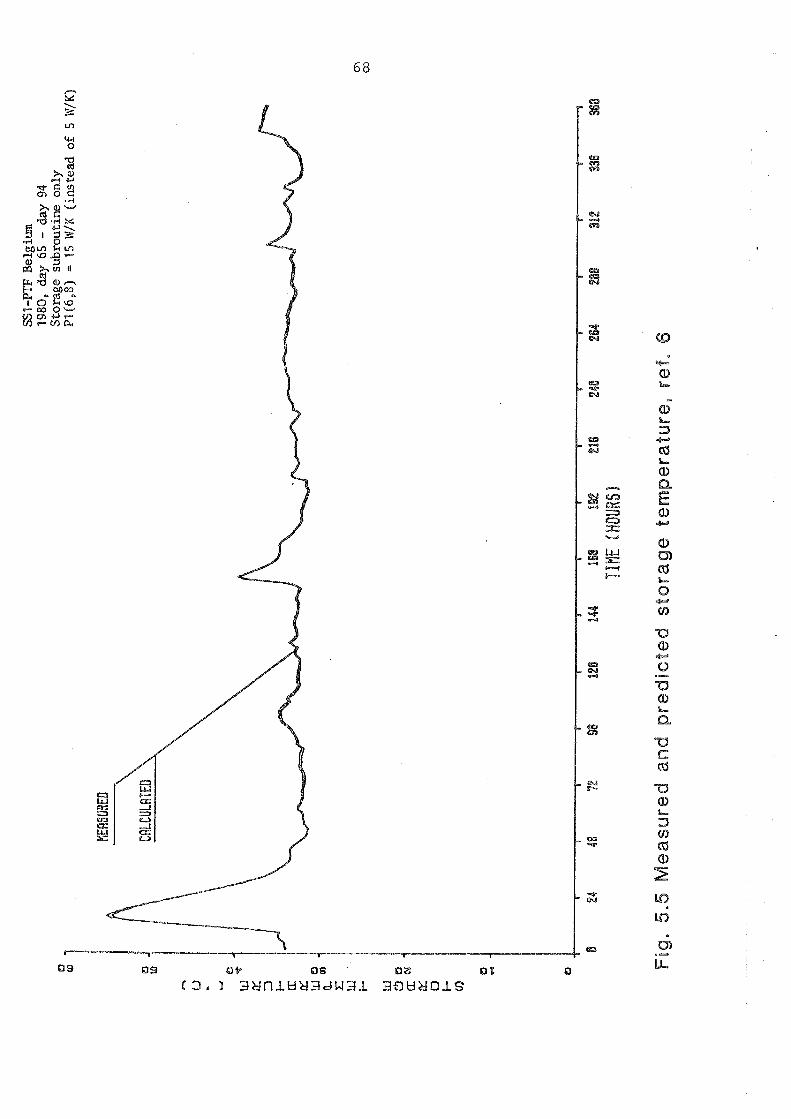
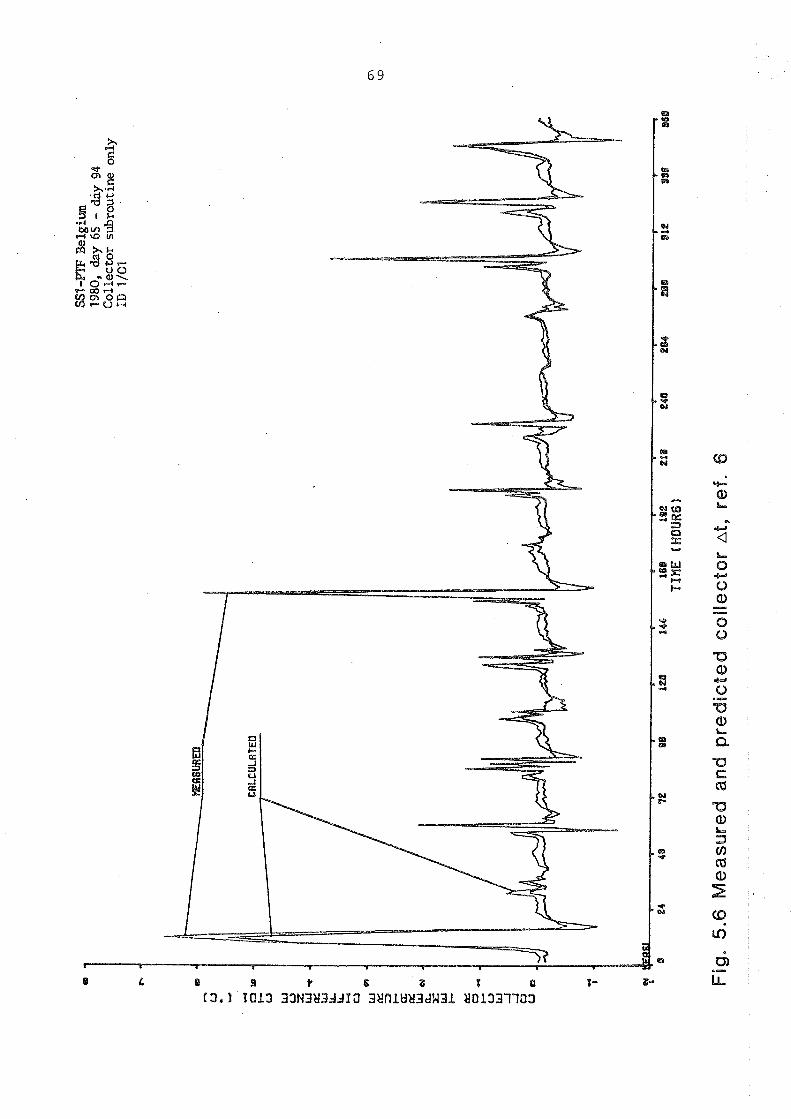
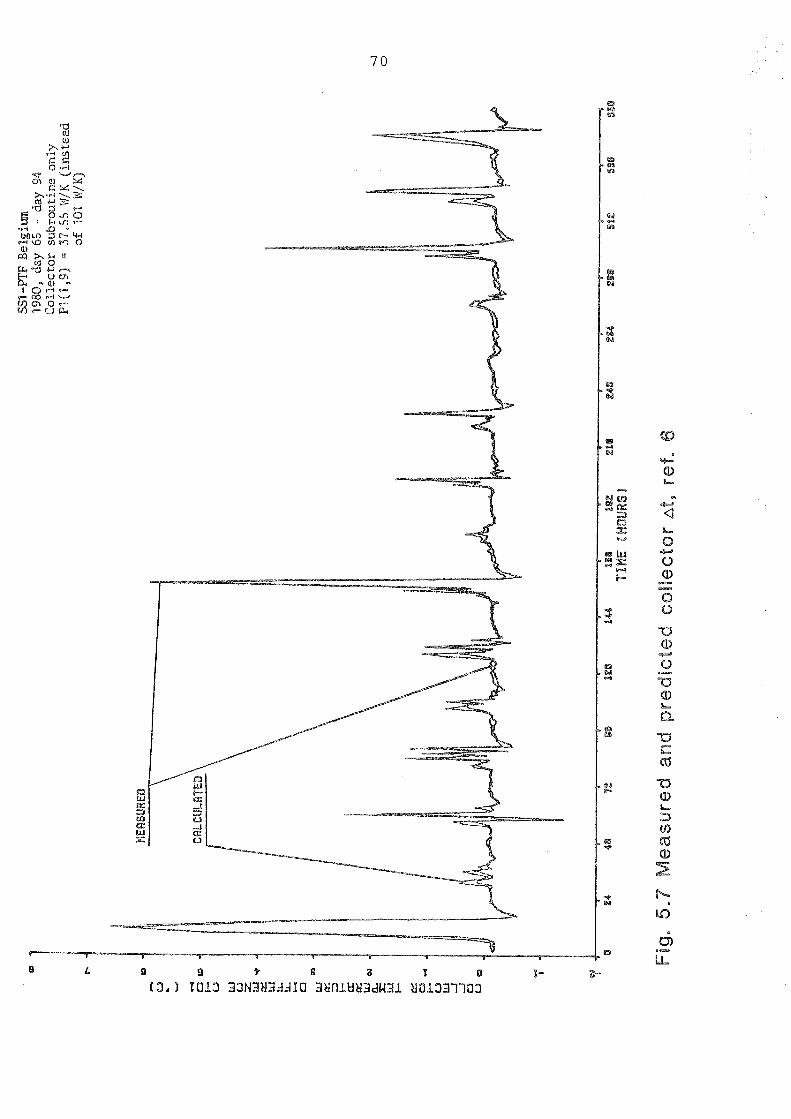
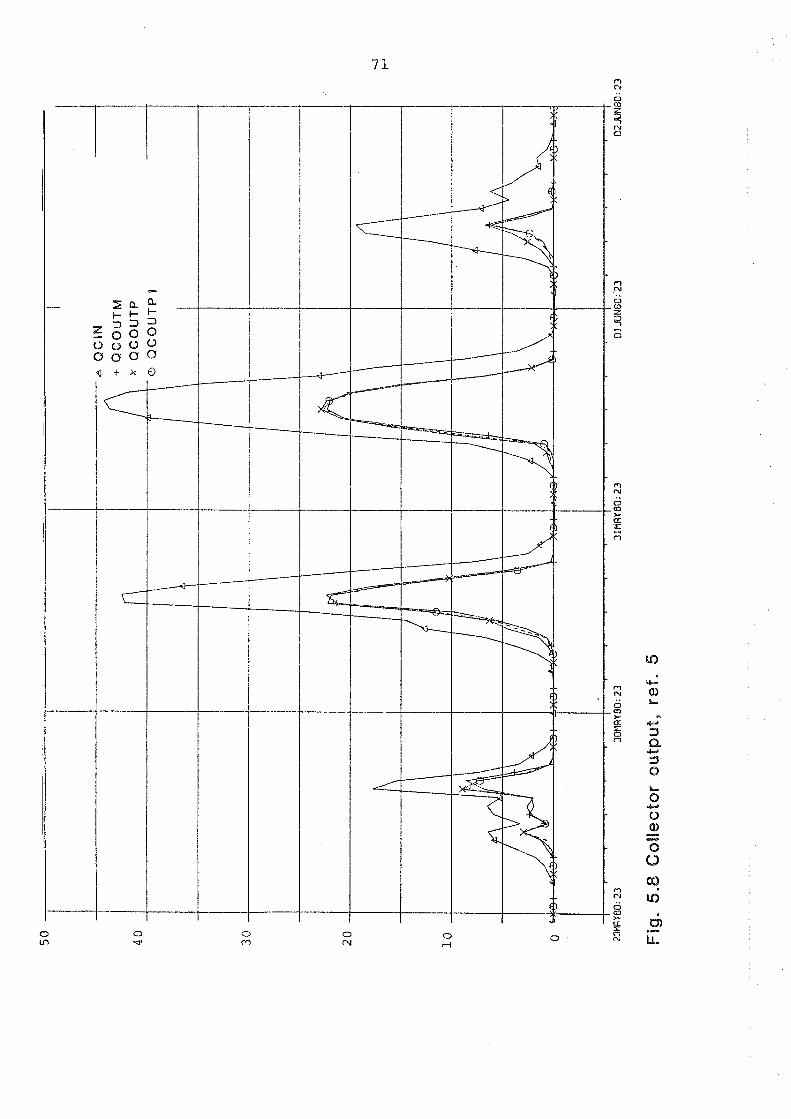
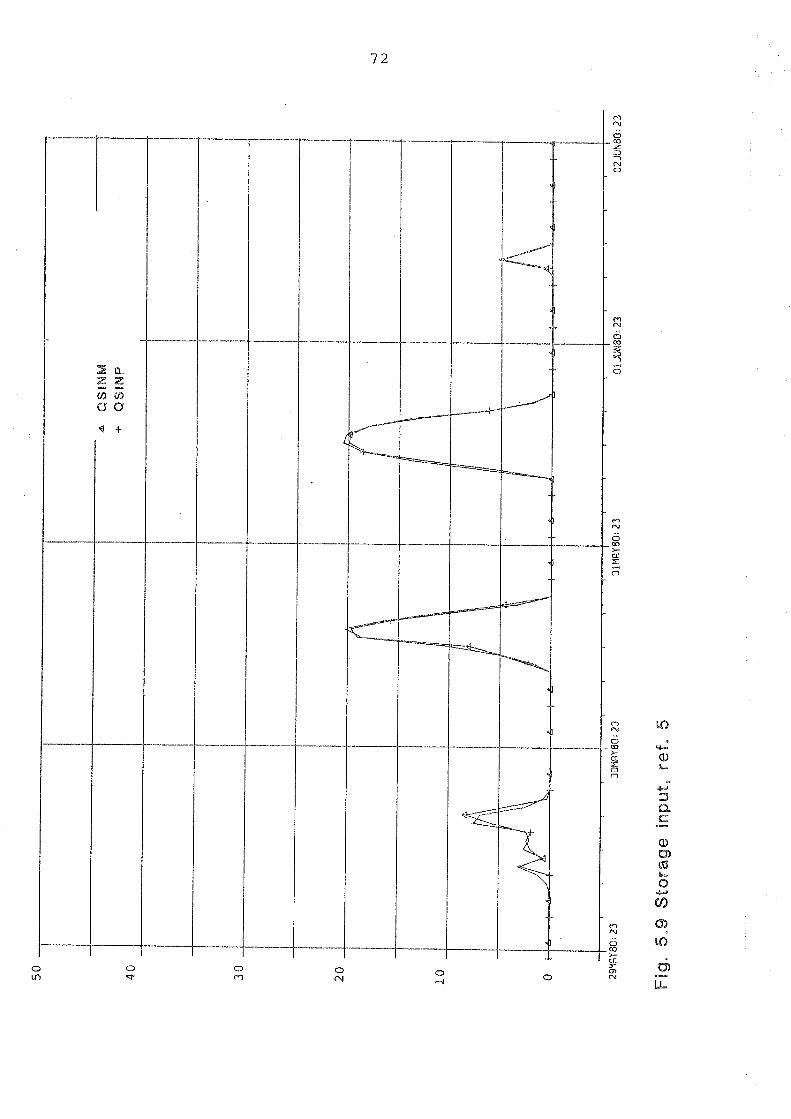
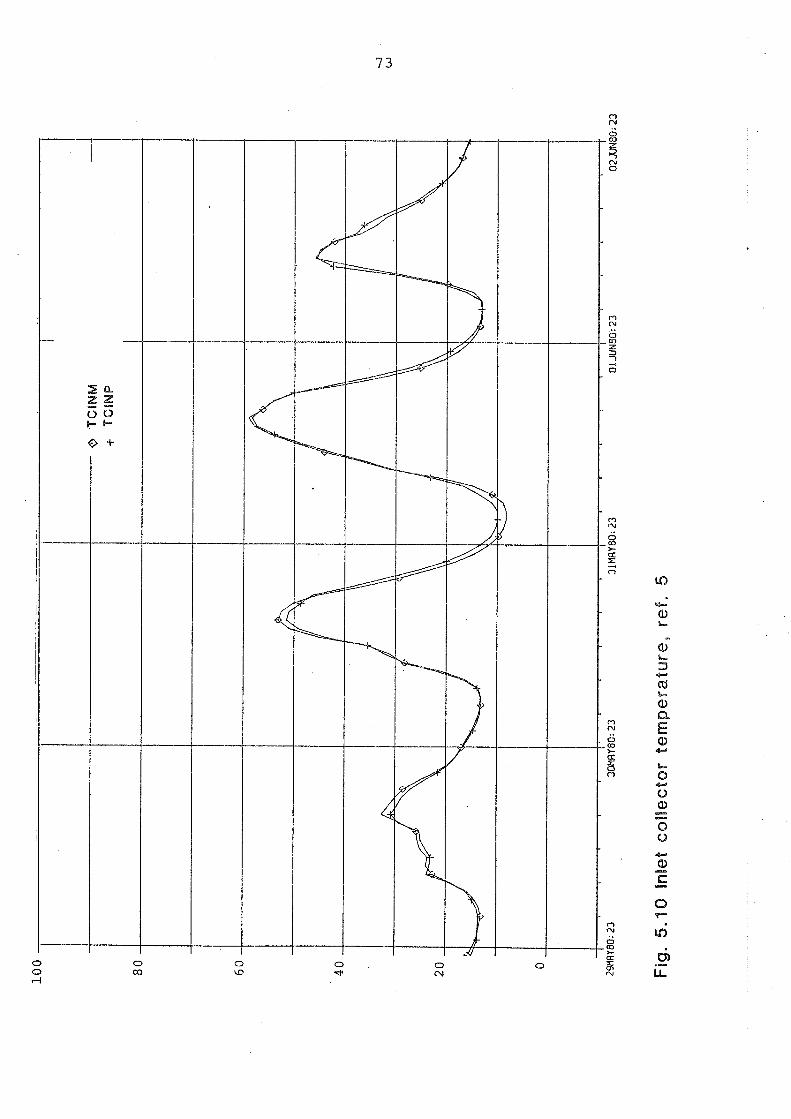
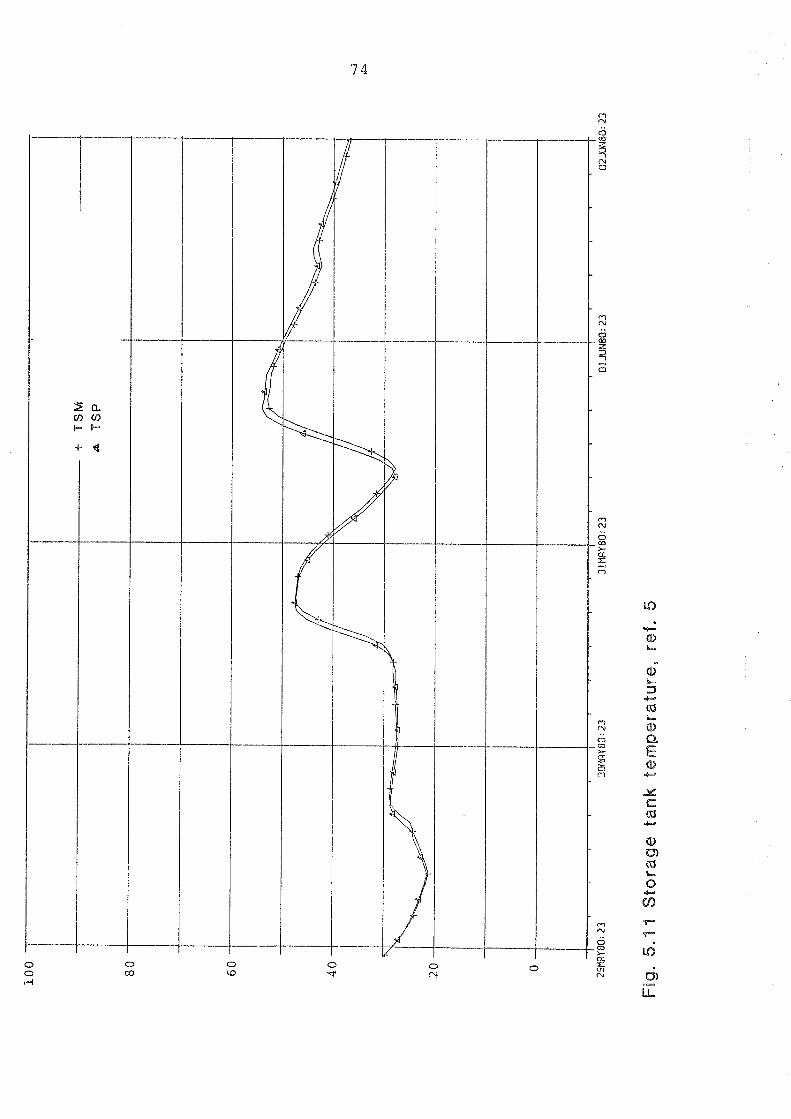
T-
'B"""
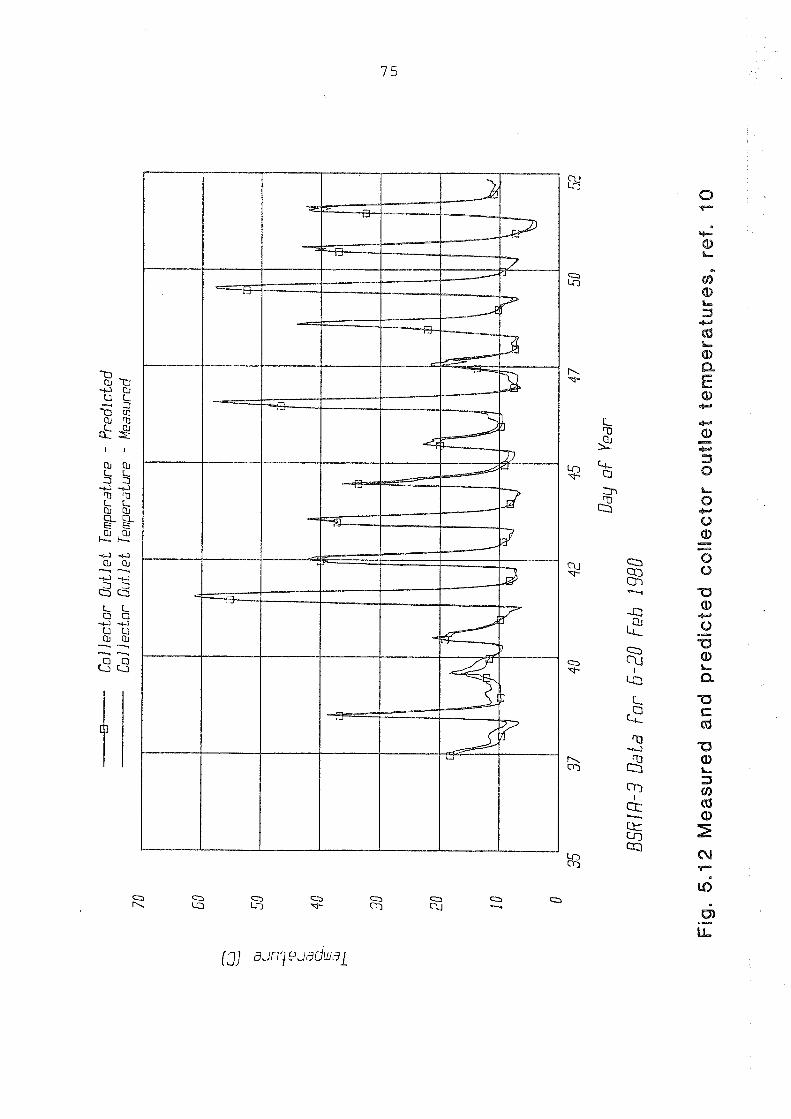
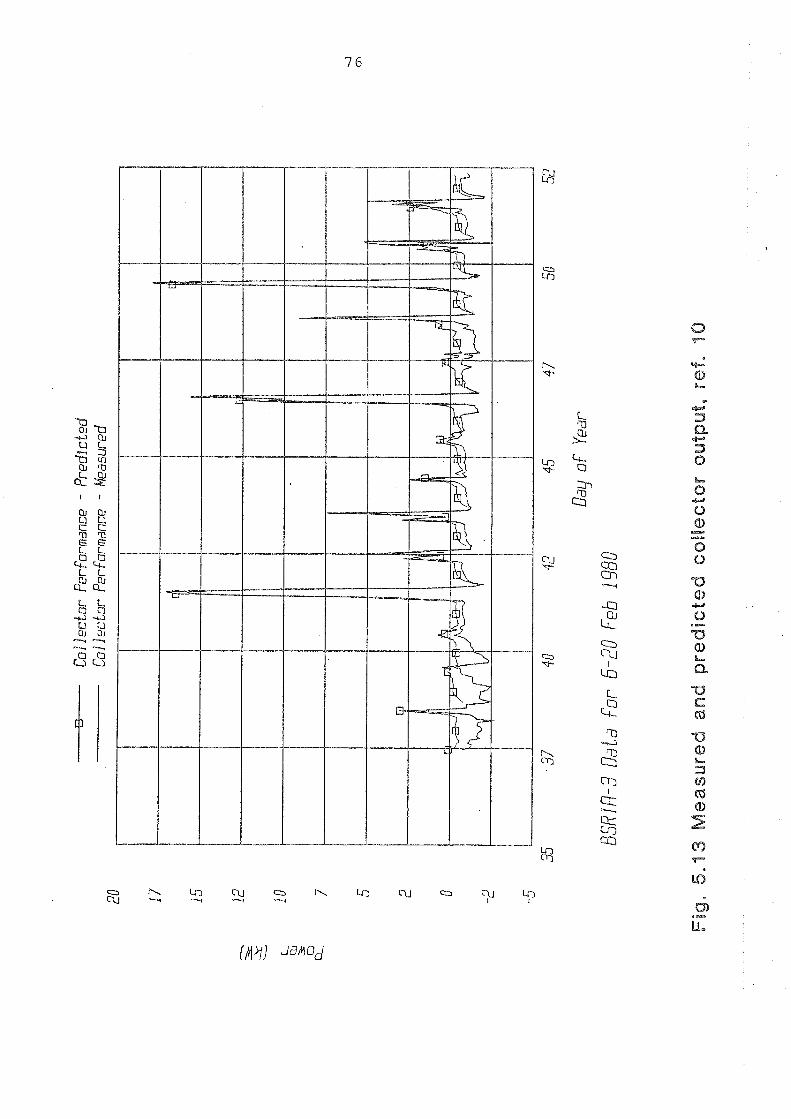
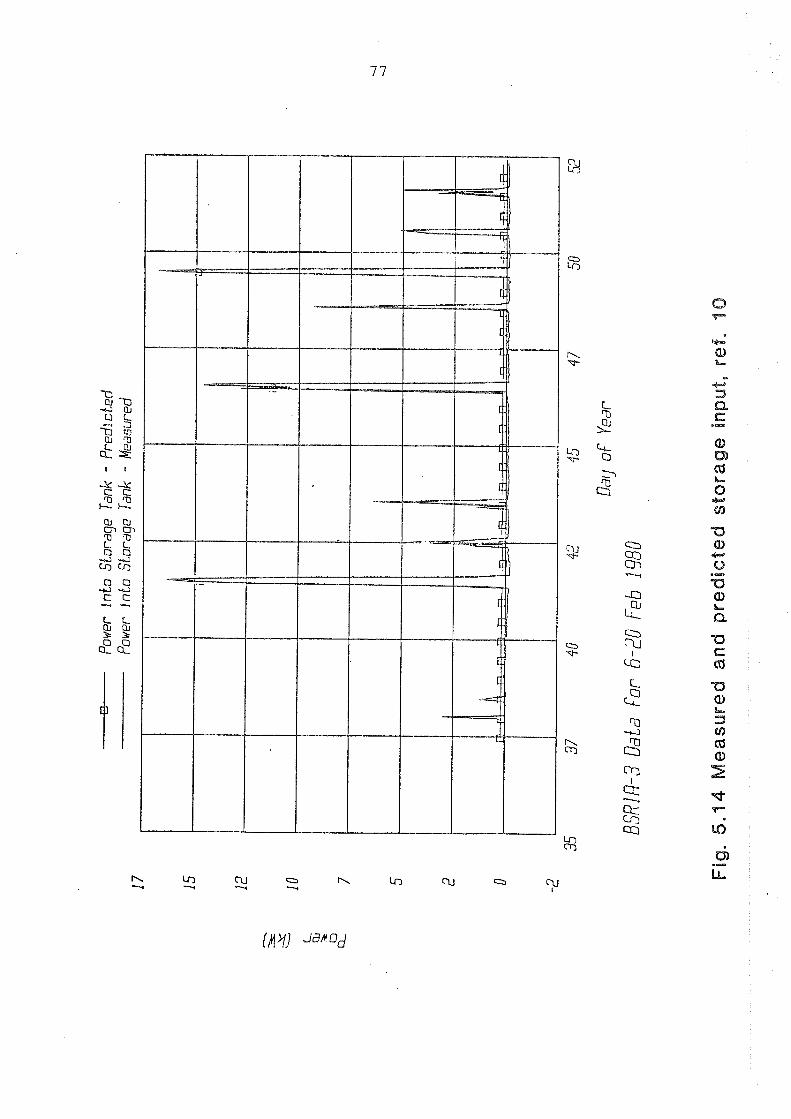
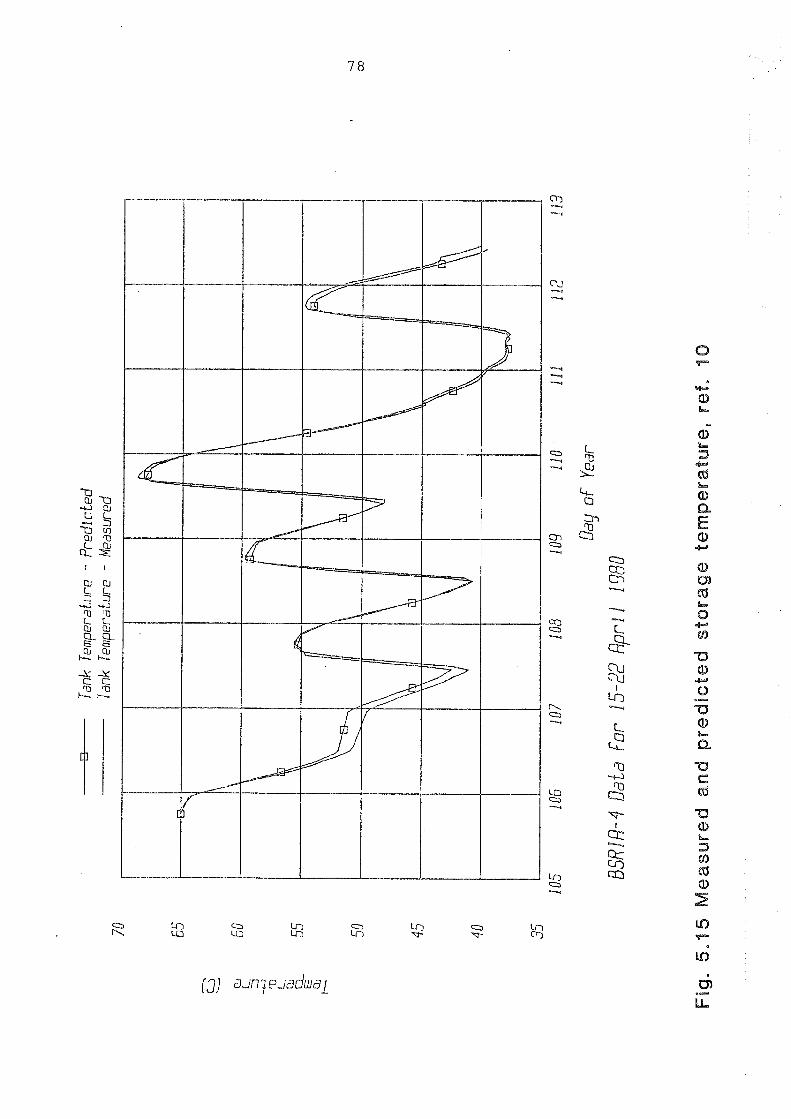
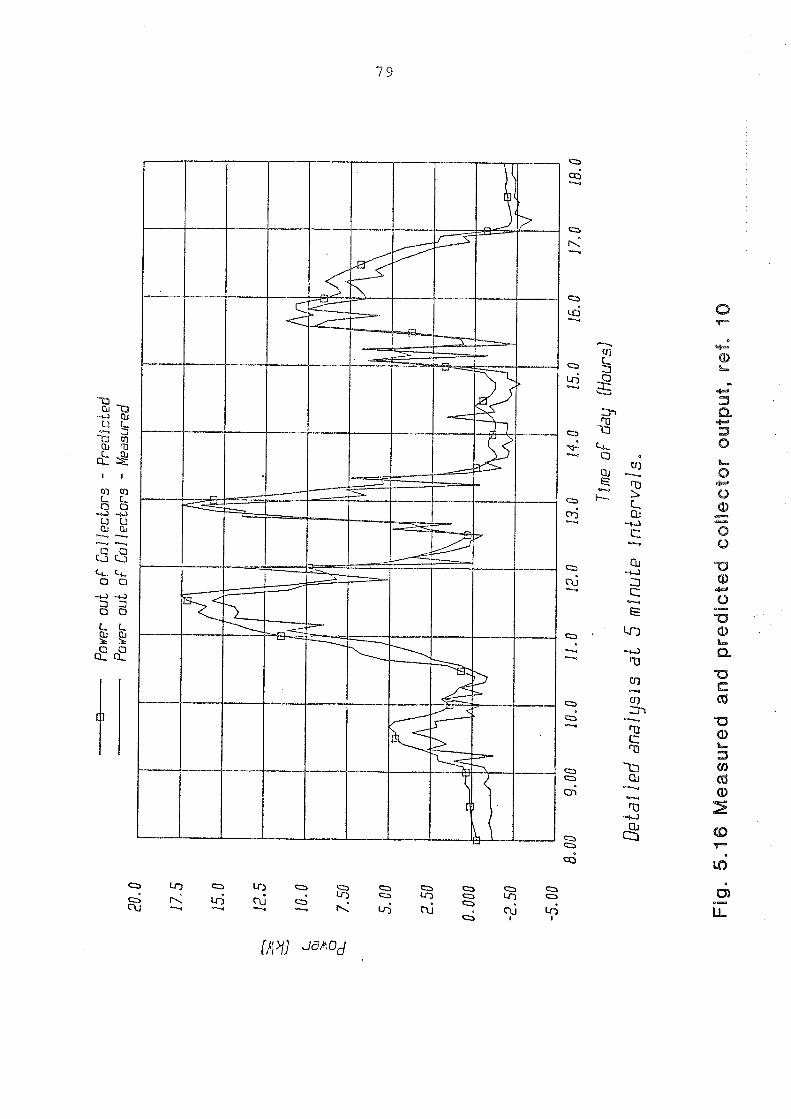
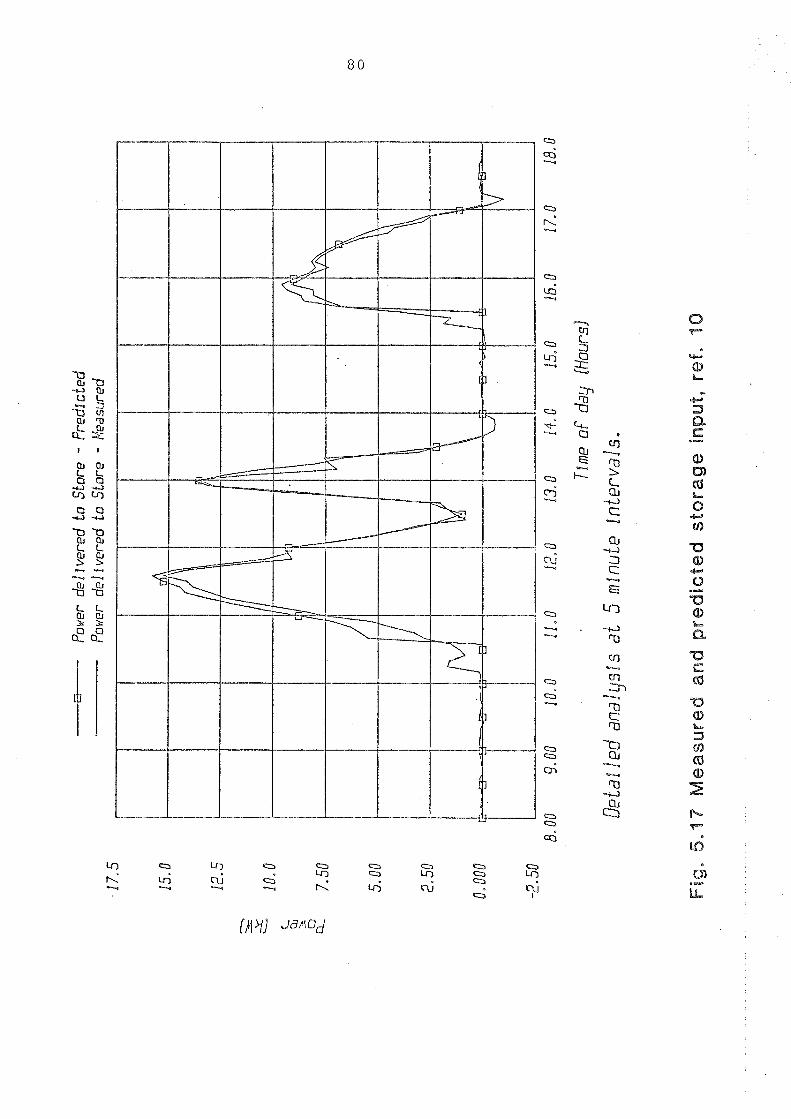
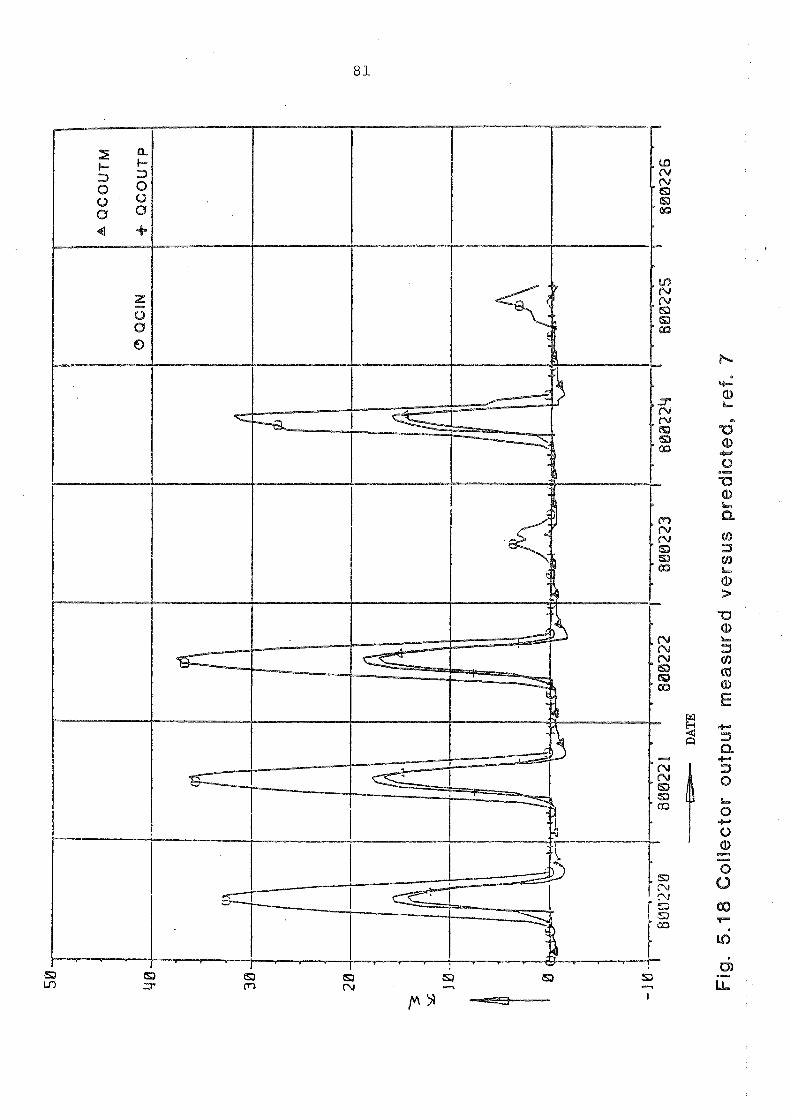
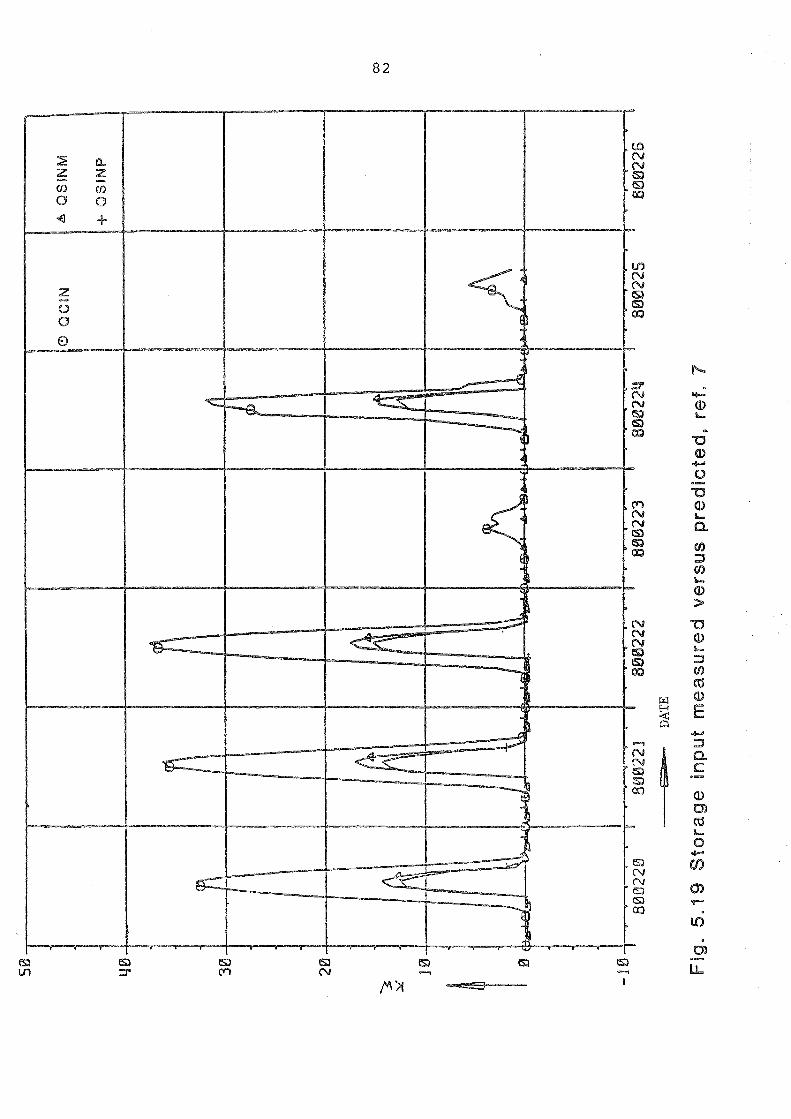
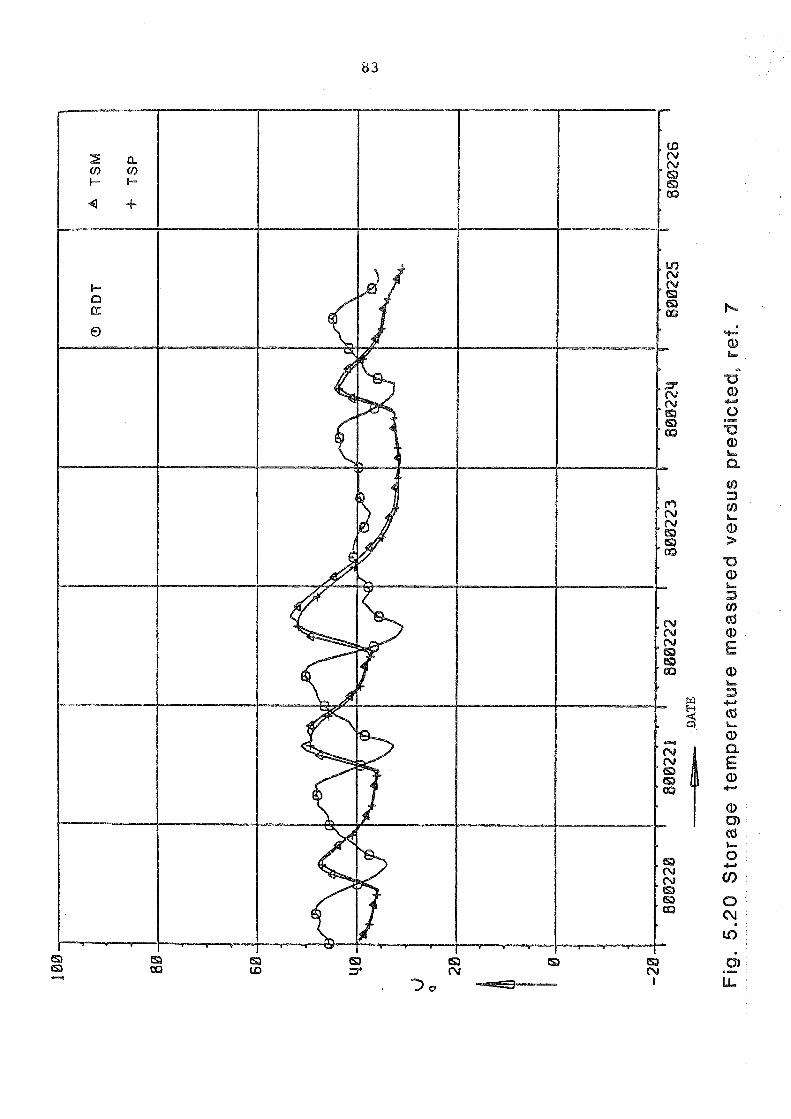
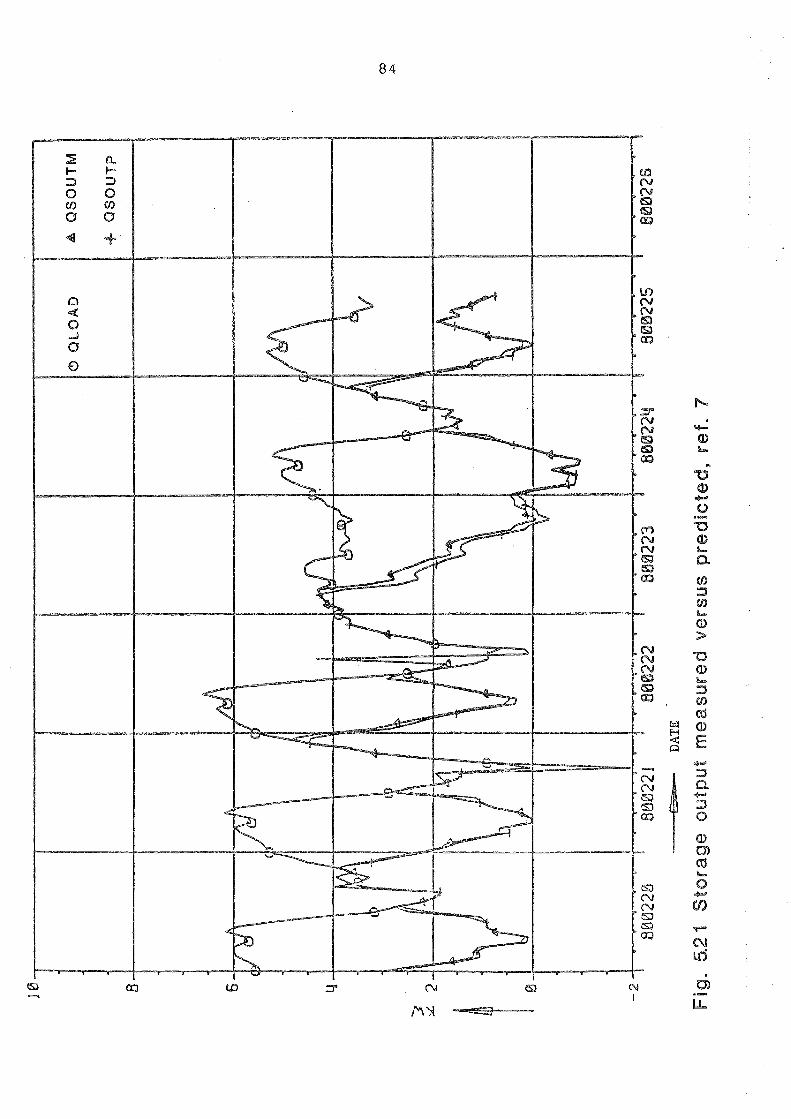
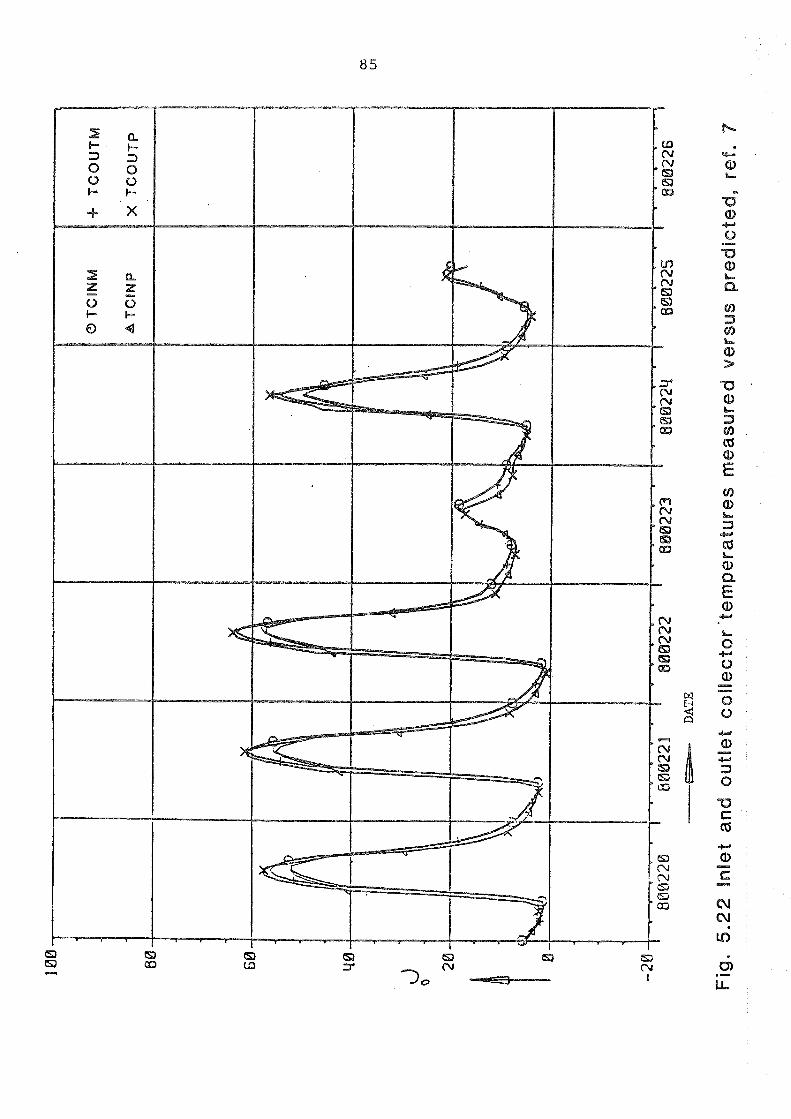


CHAPTER 6
VALIDATION OF
SIMPLIFIED METHODS

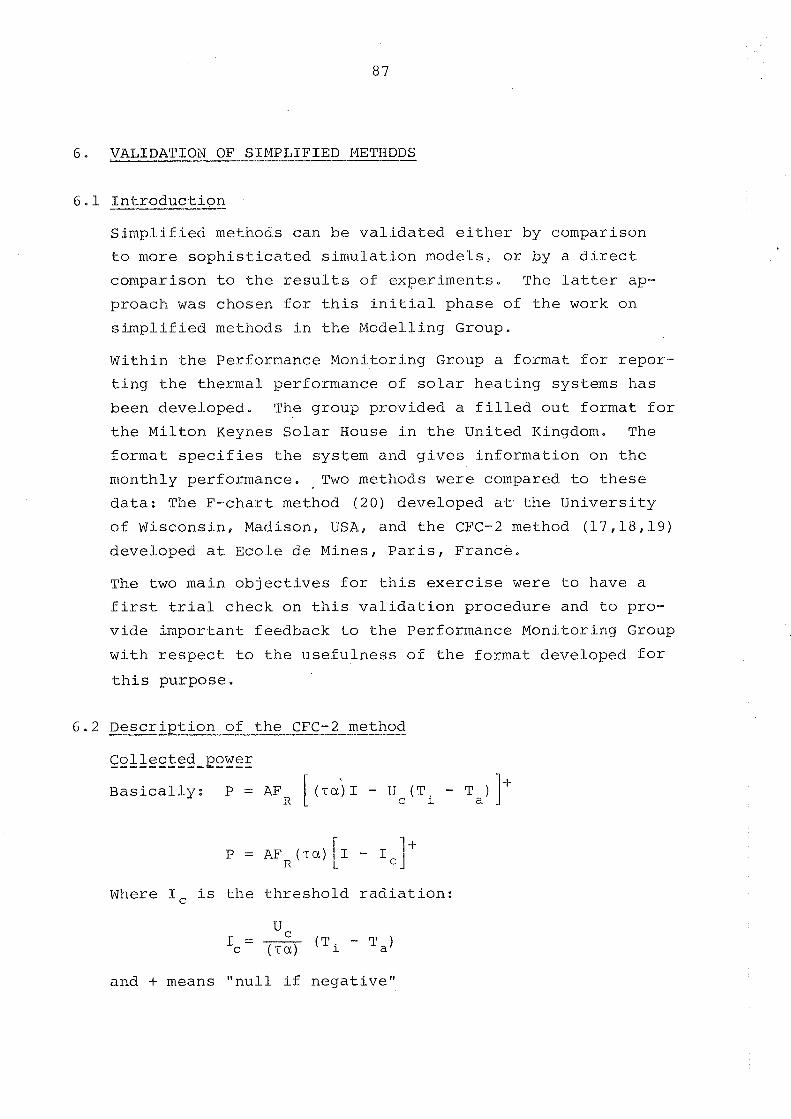
6. VALIDATION OF SIMPLIFIED METHDDS
Simplified methods can be validated either by comparison
to more sophisticated simulation models, or by a direct
comparison to the results of experiments. The latter ap-
proach was chosen for this initial phase of the work on
simplified methods in the Modelling Group.
Within the Performance Monitoring Group a format for repor-
ting the thermal performance of solar heating systems has
been developed. The group provided a filled out format for
the Milton Keynes Solar House i.n the United Kingdom. The
format specifies the system and gives information on the
monthly performance. Two methods were compared to these
data: The F-chart method (20) developed at the University
of Wisconsin, Madison, USA, and the CFC-2 method (17,18,19)
developed at Ecole de Mines, Paris, France.
The two main objectives for this exercise were to have a
first trial check on this validation procedure and to pro-
vide important feedback to the Performance Monitoring Group
with respect to the usefulness of the format developed for
this purpose.
6.2 Description of the CFC-2 method
Collected power ----
Basically: P = AF [(ri) 1 - uc (Ti - Ta) R I+
Where I, is the threshold radiation:
U c 1 = ---v
c (-ca) (Ti - Ta)
and + means "null if negative"
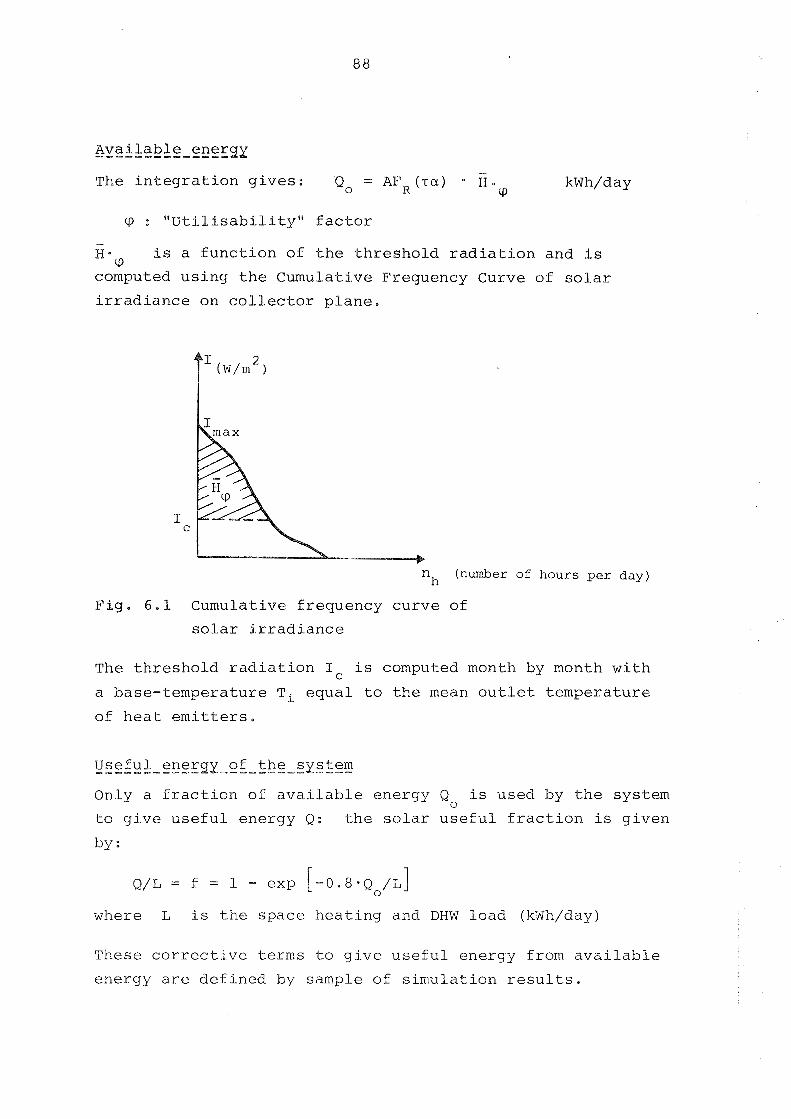
Avaf lable-ener%y -
The integration gives: Q. = AFR ( ~ a ) H. kWh/day (Q
: "Utilisability" factor -
I i e q is a function of the threshold radiation and is
computed using the Cumulative Frequency Curve of solar
irradiance on collector plane.
n (number of hours per day) h
Fig. 6.1 Cumulative frequency curve of
solar irradiance
The threshold radiation Ic is computed month by nonth with
a base-temperature T~ equal to the mean outlet temperature
of heat emitters.
Useful energy of the system _.-_-------- -_------I ---- Only a fraction of available energy Q. is used by the system
to give useful energy Q: the solar useful fraction is given
by :
Q/L= f = l - exp [ - 0 . 8 0 ' 2 o /L]
where L is the space heating and DHW load (Xdh/day)
These corrective terms to give useful energy from available
energy are defined by sample of simulation results.
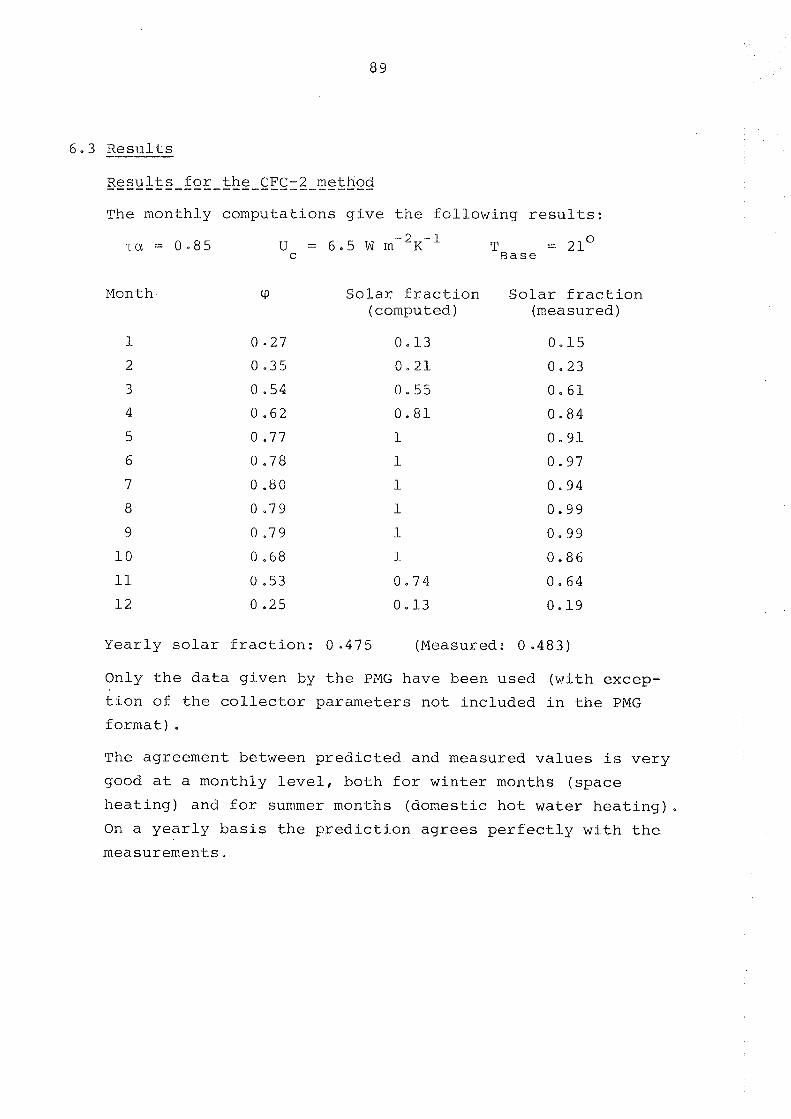
6 . 3 R e s u l t s
R e s u l t s f o r t h e CFC-2 method ............................ The monthly computa t ions g i v e t h e f o l l o w i n g r e s u l t s :
Month
T Base = 21°
cP S o l a r f r a c t i o n S o l a r f r a c t i o n (computed) (measured)
y e a r l y s o l a r f r a c t i o n : 0 - 4 7 5 (Measured: 0.483)
Only t h e d a t a g i v e n by t h e PMG have been used ( w i t h excep-
t i o n of t h e c o l l e c t o r p a r a m e t e r s n o t i n c l u d e d i n t h e PMG
f o r m a t ) .
The agreement between p r e d i c t e d and measured v a l u e s i s v e r y
good a t a monthly l e v e l , b o t h f o r w i n t e r months ( s p a c e
h e a t i n g ) and f o r summer months (domes t i c h o t w a t e r h e a t i n g ) .
On a y e a r l y b a s i s t h e p r e d i c t i o n a g r e e s p e r f e c t l y w i t h t h e
measurements .
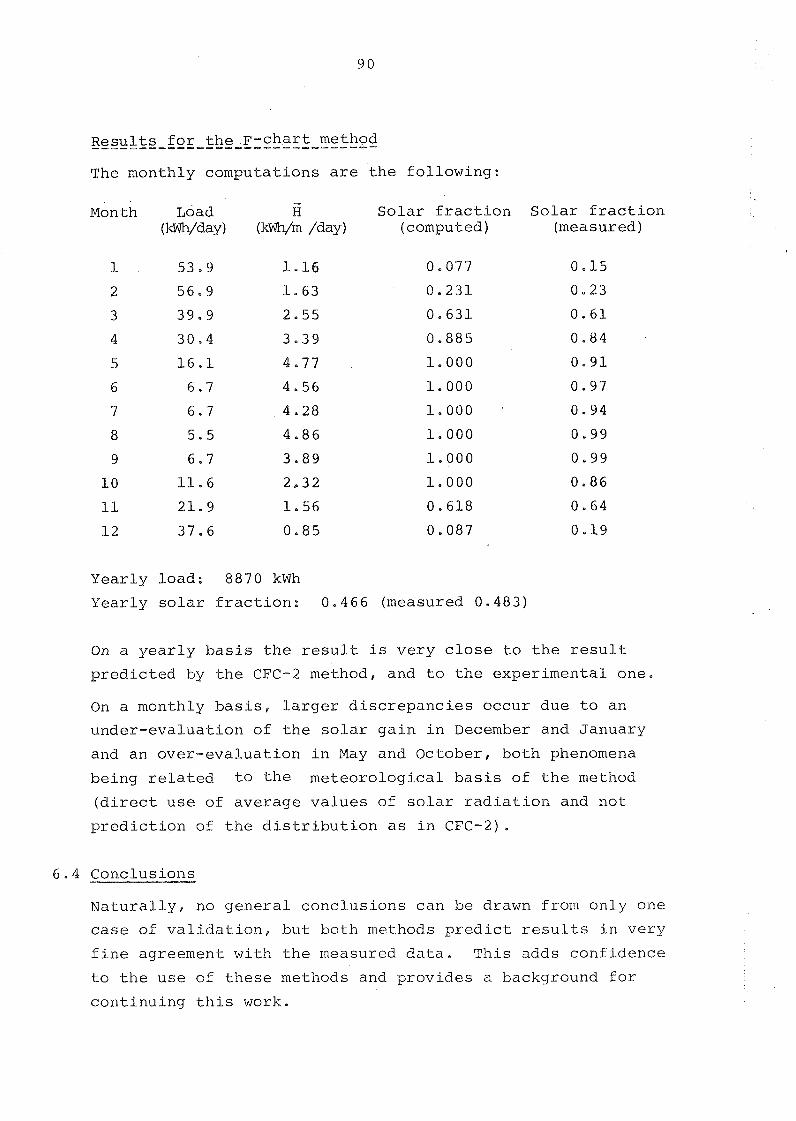
R e s u l t s f o r t h e F - c h a r t method I--I-_I_--_-_____P_-----------
The monthly computa t ions a r e t h e f o l l o w i n g :
- Month ~ o a d H S o l a r f r a c t i o n S o l a r f r a c t i o n
(kTm/day) (km/m /day (computed) (measured)
Year ly l o a d : 8870 kWh
Year ly s o l a r f r a c t i o n : 0.466 (measured 0.483)
On a y e a r l y b a s i s t h e r e s u l t i s v e r y c l o s e t o t h e r e s u l t
p r e d i c t e d by t h e CFC-2 method, and t o t h e e x p e r i m e n t a l one .
On a monthly b a s i s , l a r g e r d i s c r e p a n c i e s o c c u r due t o a n
u n d e r - e v a l u a t i o n of t h e s o l a r g a i n i n December and J a n u a r y
and a n o v e r - e v a l u a t i o n i n May and Oc tober , b o t h phenomena
b e i n g r e l a t e d t o t h e m e t e o r o l o g i c a l b a s i s of t h e method
( d i r e c t u s e of a v e r a g e v a l u e s of s o l a r r a d i a t i o n and n o t
p r e d i c t i o n of t h e d i s t r i b u t i o n a s i n CFC-2).
6.4 Conc lus ions
N a t u r a l l y , no g e n e r a l c o n c l u s i o n s can be drawn from o n l y one
c a s e of v a l i d a t i o n , but b o t h methods p r e d i c t r e s u l t s i n v e r y
f i n e agreement w i t h t h e measured. d a t a . T h i s adds c o n f i d e n c e
t o t h e u s e of t h e s e methods and p r o v i d e s a background f o r
c o n t i n u i n g t h i s work.

With respect to the other objective of this work, important
feedback was given to the Performance Monitoring Group and
suggestions were very quickly implemented as changes in the
format to include more system and component specifications.
For example, the collector efficiency equation and the over-
all loss coefficient of the thermal storage were added.


CHAPTER 7
S P E C I F I C TASKS


7 . SPECIFIC TASKS
7 . 1 I n t r o d u c t i o n
A f t e r a b o u t one y e a r o f o p e r a t i o n , t h e Model l ing Group
p a r t i c i p a n t s r e c o g n i s e d t h a t t h e r e s u l t s o b t a i n e d s o f a r
w e r e n o t enough t o judge some of t h e model a s sumpt ions ,
t h e r e a s o n be ing t h e complex i ty of t h e i n t e r a c t i o n p a t t e r n
i n s o l a r sys tems mode l l ing . T h e r e f o r e , it was d e c i d e d t h a t
t h e p a r t i c i p a n t s shou ld form s m a l l e r g roups t o i n v e s t i g a t e
s p e c i f i c a s p e c t s of t h e mode l l ing o f s o l a r h e a t i n g sys tems ,
7 .2 D i f f e r e n t i a l e q u a t i o n s s o l u t i o n methods
A s s e e n i n c h a p t e r 2 , . a v e r y d e s t i n c t g roup ing e x i s t s be-
tween models u s i n g a n e x p l i c i t ( f o r w a r d s ) E u l e r and an i m -
p l i c i t (backwards) E u l e r i n t e g r a t i o n method f o r t h e sys tem
d i f f e r e n t i a l e q u a t i o n s . The assumpt ion was t h a t t h e d i f f e -
r e n c e between t h e s e two methods w i l l show up, when t h e
system t i m e - c o n s t a n t i s lowered s t e p w i s e by d e c r e a s i n g t h e
s t o r a g e volume.
Four models were used i n t h i s e x e r c i s e : B , N , GB1 and D K .
The two former a r e b o t h of t h e e x p l i c i t E u l e r t y p e and t h e
two l a t t e r u s e a n i m p l i c i t E u l e r s o l u t i o n . The Danish p a r -
t i c i p a n t d e c i d e d t o perform a n o t h e r series of c a l c u l a t i o n s
t h i s t i m e u s i n g a Trapez method ( l i k e i n TRNSYS) . The
r e s u l t s a r e shown i n t a b l e 7 .1 .
AS s e e n i n t h e t a b l e , a l l t h e models a g r e e v e r y w e l l on t h e
d e c r e a s e i n p e r c e n t s o l a r f o r d e c r e a s i n g s t o r a g e volumes.
T h i s i s i n c o n t r a d i c t i o n t o t h e assumpt ion . The r e a s o n f o r
t h i s i s t h a t t h e m o d e l l e r s , u s i n g t h e models w i t h a n ex-
p l i c i t i n t e g r a t i o n of t h e system e q u a t i o n s , e i t h e r through-
o u t used a t i m e s t e p of 5 minu tes ( B ) , o r lowered t h e t i m e
s t e p a s t h e s t o r a g e volume was d e c r e a s e d ( N ) . T h i s means
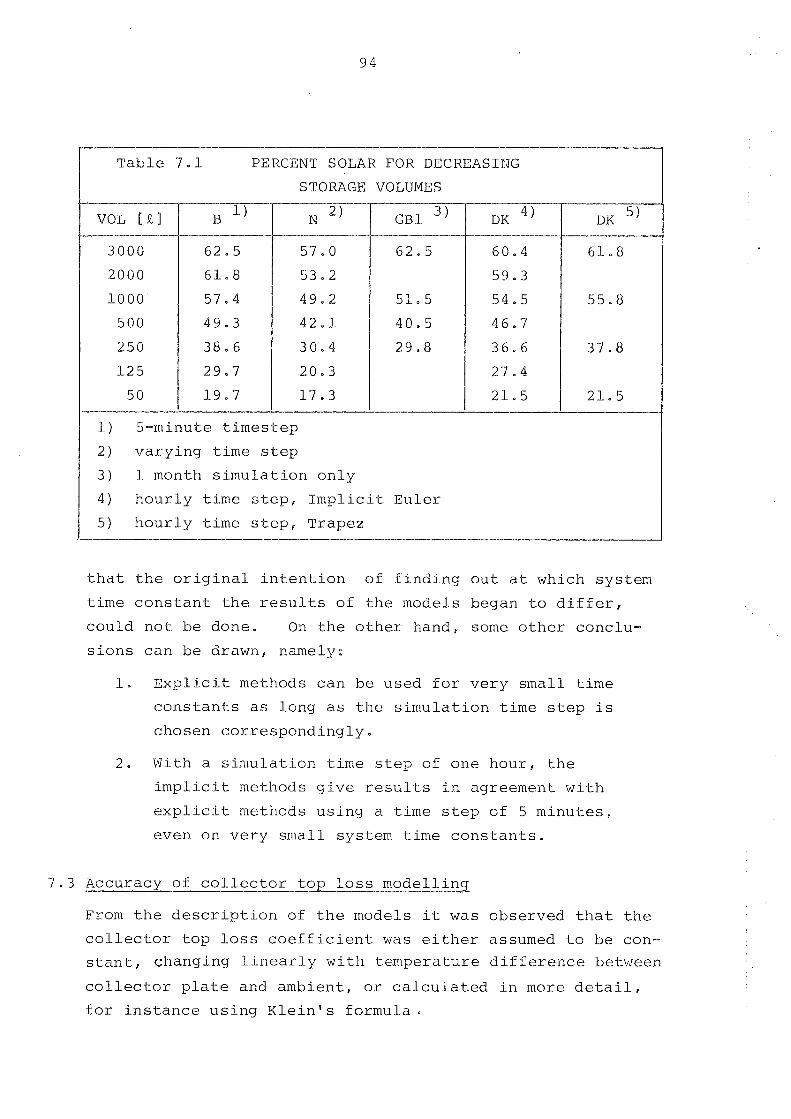
I Table 7.1
STORAGE VOLUMES
l) 5-minute timestep
2) varying time step
3) 1 month simulation only
4) hourly time step, Implicit Euler
5) hourly time step, Trapez
that the original intention of finding out at which system
time constant the results of the models began to differ,
could not be done. On the other hand, some other conclu-
sions can be drawn, namely:
l. Explicit methods can be used for very small time
constants as long as the simulation time step is
chosen correspondingly.
2. With a simulation time step of one hour, the
implicit methods give results in agreement with
explicit methods using a time step of 5 minutes,
even on very small system time constants.
3 Accuracy of collector top loss modelling
From the description of the models it was observed that the
collector top loss coefficient was either assumed to be con-
stant, changing linearly with temperature difference between
collector plate and ambient, or calculated in more detail,
for instance using Klein's formula.
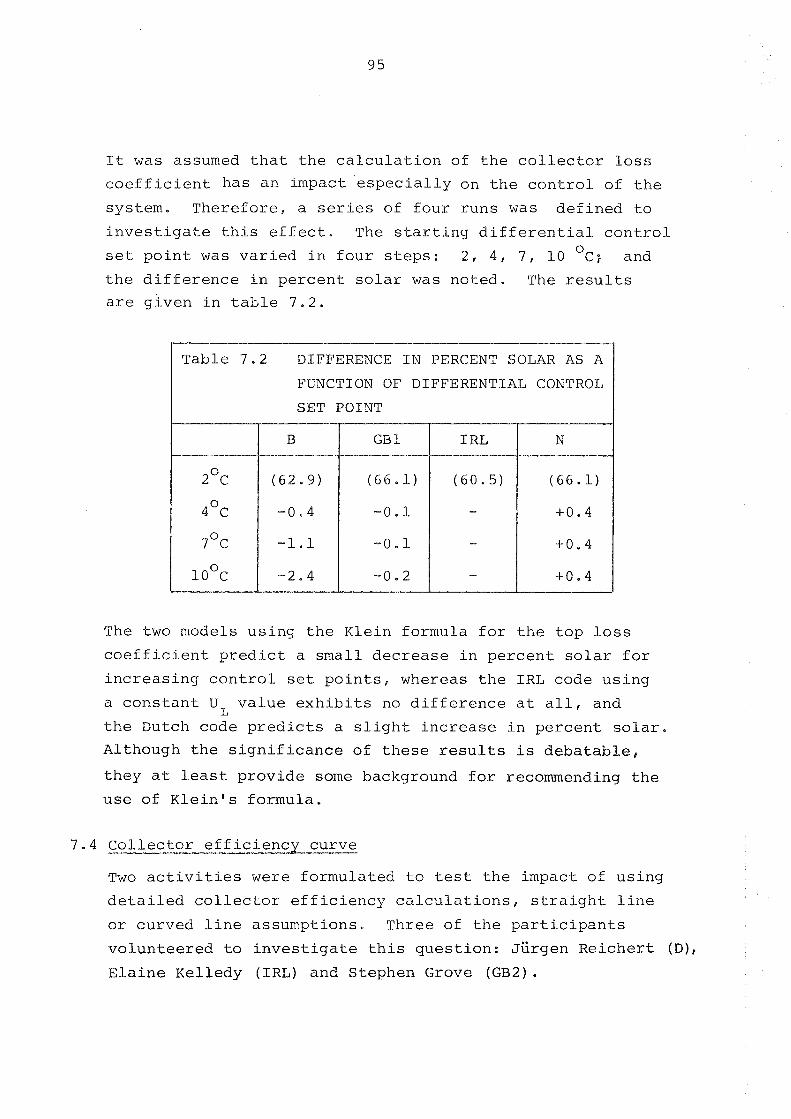
It was assumed that the calculation of the collector loss
coefficient has an impact'especially on the control of the
system. Therefore, a series of four runs was defined to
investigate this effect. The starting differential control
set point was varied in four steps: 2, 4, 7, 10 OC; and
the difference in percent solar was noted. The results
are given in table 7.2.
Table 7.2 DIFFERENCE IN PERCENT SOLAR AS A
FUNCTION OF DIFFERENTIAL CONTROL
SET POINT
The two models using the Klein formula for the top loss
coefficient predict a small decrease in percent solar for
increasing control set points, whereas the IRL code using
a constant U L value exhibits no difference at all, and
the ~utch code predicts a slight increase in percent solar.
Although the significance of these results is debatable,
they at least provide some background for recommending the
use of Kleinss formula.
4 Collector efficiency curve
TWO activities were formulated to test the impact of using
detailed collector efficiency calculations, straight line
or curved line assumptions. Three of the participants
volunteered to investigate this question: ~iirgen Reichert (D),
Elaine Kelledy (IRL) and Stephen Grove (GB2).
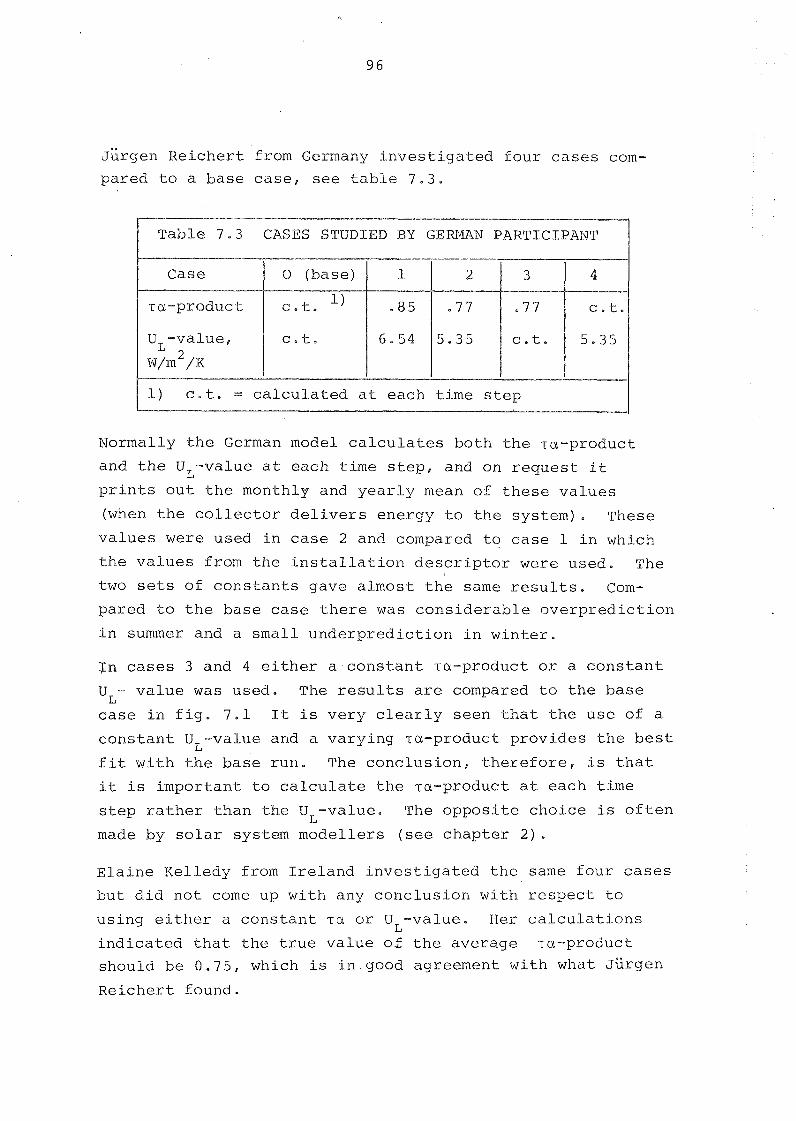
~ u r g e n R e i c h e r t from Germany i n v e s t i g a t e d f o u r c a s e s com-
pa red t o a b a s e c a s e , s e e t a b l e 7 . 3 .
"--"+------p
7 - 3 CASES STUDIED BY GERMAN PARTICIPANT 1
1 l) c . t . = c a l c u l a t e d a t each t i m e s t e p - I
Normally t h e German model c a l c u l a t e s b o t h t h e r a - p r o d u c t
and t h e UL-value a t each t ime s t e p , and on r e q u e s t i t
p r i n t s o u t t h e monthly and y e a r l y mean of t h e s e v a l u e s
(when t h e c o l l e c t o r d e l i v e r s ene rgy t o t h e s y s t e m ) . These
v a l u e s w e r e used i n c a s e 2 and compared t o c a s e l i n which
t h e v a l u e s from t h e i n s t a l l a t i o n d e s c r i p t o r w e r e used . The
two sets of c o n s t a n t s gave a l m o s t t h e same r e s u l t s . Com-
pa red t o t h e b a s e c a s e t h e r e was c o n s i d e r a b l e o v e r p r e d i c t i o n
i n summer and a s m a l l u n d e r p r e d i c t i o n i n w i n t e r .
Jn c a s e s 3 and 4 e i t h e r a c o n s t a n t ~ a - p r o d u c t o r a c o n s t a n t
UL- v a l u e was used. The r e s u l t s a r e compared t o t h e b a s e
c a s e i n f i g . 7 . 1 I t i s v e r y c l e a r l y s e e n t h a t t h e u s e of a
c o n s t a n t UL-value and a v a r y i n g sa -p roduc t p r o v i d e s t h e b e s t
f i t w i t h t h e b a s e r u n , The c o n c l u s i o n , t h e r e f o r e , i s t h a t
it i s i m p o r t a n t t o c a l c u l a t e t h e sa -p roduc t a t each t ime
s t e p r a t h e r t h a n t h e UL-value. The o p p o s i t e c h o i c e i s o f t e n
made by s o l a r system m o d e l l e r s (see c h a p t e r 2 ) .
E l a i n e Ke l l edy from I r e l a n d i n v e s t i g a t e d t h e same f o u r c a s e s
b u t d i d n o t come up w i t h any c o n c l u s i o n w i t h r e s p e c t t o
u s i n g e i t h e r a c o n s t a n t Ta o r U - v a l u e . H e r c a l c u l a t i o n s L
i n d i c a t e d t h a t t h e t r u e v a l u e OS t h e a v e r a g e ~ a - p r o d u c t
shou ld b e 0 . 7 5 , which i s i n good agreement w i t h what ~ i i r g e n
R e i c h e r t found.

Stephen Grove from t h e Uni ted Kingdom c o n c e n t r a t e d h i s e f -
f o r t on f i n d i n g an a v e r a g e c o l l e c t o r l o s s c o e f f i c i e n t .
The approach was t o f i n d which c o n s t a n t number f o r U gave L
t h e b e s t f i t t o t h e r e s u l t s o b t a i n e d by u s i n g t h e l i n e a r l y
v a r y i n g U - v a l u e proposed by t h e Dutch p a r t i c i p a n t : L
2 3 . S + 0.02AT W/K/m . The UL-value found was approx imate ly 2 4 , 6 W/K/m , which compares r e a s o n a b l y w e l l w i t h t h e v a l u e
found by ~ G r g e n R e i c h e r t .
AS a g e n e r a l c o n c l u s i o n from t h i s e x e r c i s e it can b e s t a t e d
t h a t s t r a i g h t l i n e approx imat ions t o t h e c o l l e c t o r e f f i c i e n -
cy c u r v e can be used i n t h e s i m u l a t i o n models , and reason-
a b l e r e s u l t s c a n b e o b t a i n e d , presuming t h e s t r a i g h t l i n e
p a r a m e t e r s ( s l o p e and i n t e r s e c t ) have been e s t a b l i s h e d by
a d e t a i l e d a n a l y s i s . I f o n l y one of t h e s e v a l u e s c a n be
c a l c u l a t e d a t each time s t e p it shou ld be t h e za-product .
( T h i s i s a g r e a t advan tage because it a l l o w s f o r t ime s a v i n g
p r e - p r o c e s s i n g of t h e wea the r d a t a ) .
7 .5 sys tem Dynamics
A s p e c i a l t a s k was devo ted t o a n i n v e s t i g a t i o n of how w e l l
t h e s i m u l a t i o n model p r e d i c t s t h e dynamic behav iour of t h e
sys tem. I n t h i s c a s e it was d e c i d e d t o compare t h e measured
and p r e d i c t e d d u r a t i o n of p e r i o d s of c o l l e c t i n g and n o t c o l -
l e c t i n g s o l a r ene rgy .
F i g . 7 .2 shows a comparison of t h e measured and c a l c u l a t e d
c o l l e c t i n g p e r i o d s d e r i v e d from t h e Bel .gian 5-minute d a t a .
The f i g u r e s t o t h e r i g h t r e p r e s e n t t h e d i f f e r e n c e between
c a l c u l - a t e d and measured 5-minute t i m e s t e p s , t h e p o s i t i v e
v a l u e s i n d i c a t i n g t h e number of t i m e s t e p s i n which t h e c a l -
c u l a t e d sys tem i s "on" and t h e measured one i s " o f f " ; t h e
n e g a t i v e v a l u e s i n d i c a t i n g t h e number of t i m e s t e p s i n which
t h e measured sys tem i s "on" and t h e c a l c u l a t e d one i s " o f f " .
I n g e n e r a l , t h e r e s u l t s a r e r e a s o n a b l e t a k i n g i n t o a c c o u n t
t h e r a p i d l y changing wea the r c o n d i t i o n s d u r i n g some p e r i o d s .
However, t h e c a l c u l a t e d sys tem h a s more "on" t i m e s t e p s and
a l m o s t a lways s w i t c h e s t o t h e "on" p o s i t i o n a few s t e p s
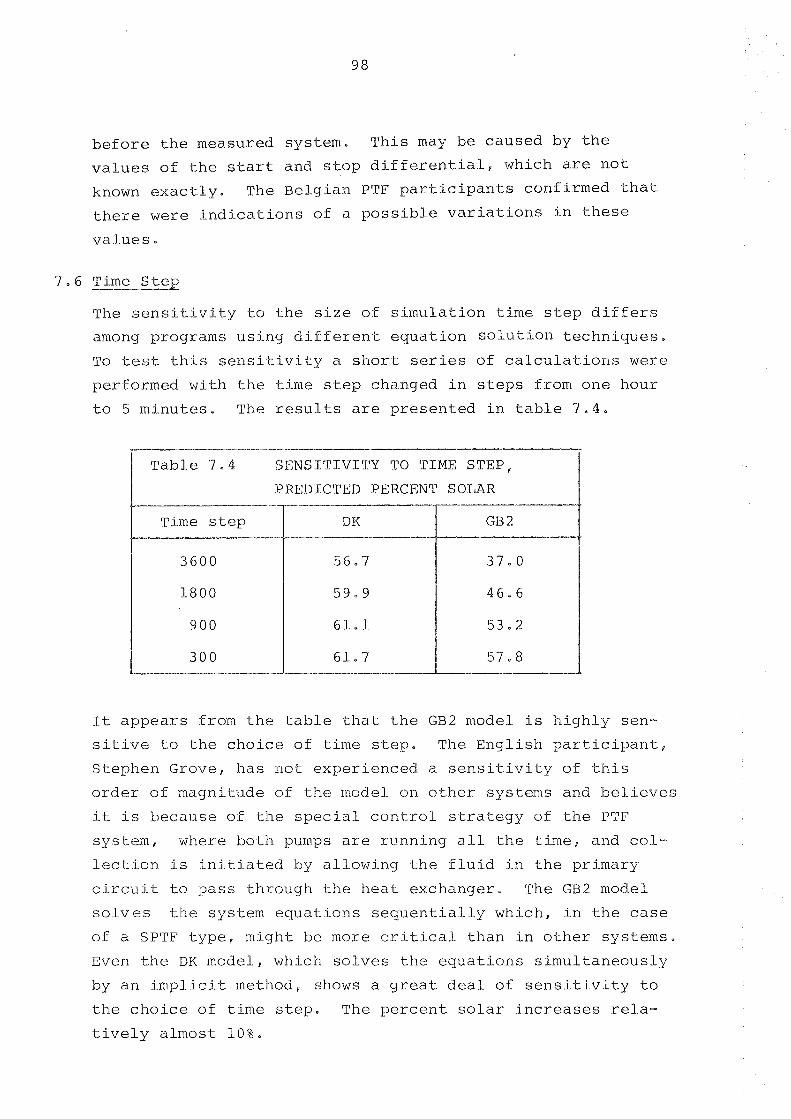
b e f o r e t h e measured system. T h i s may be caused by t h e
v a l u e s of t h e s t a r t and s t o p d i f f e r e n t i a l , which a r e n o t
known e x a c t l y . The B e l g i a n PTF p a r t i c i p a n t s conf i rmed t h a t
t h e r e w e r e i n d i c a t i o n s of a p o s s i b l e v a r i a t i o n s i n t h e s e
v a l u e s .
The s e n s i t i . v i . t y .to "che s i z e of s i m u l a t i o n t i m e s t e p d i f f e r s
among programs u s i n g d i f f e r e n t e q u a t i o n s o l u t i o n t e c h n i q u e s .
To tes t t h i s s e n s i t i v i t y a s h o r t series of c a l c u l a t i o n s were
performed w i t h t h e t i m e s t e p changed i n s t e p s from one hour
t o 5 m i n u t e s , The r e s u l t s a r e p r e s e n t e d i n t a b l e 7 . 4 .
T a b l e 7 - 4 SENSITIVITY 'TO TIME STEP,
I t a p p e a r s from t h e t a b l e t h a t t h e GB2 model.. i s h i g h l y sen-
s i t i v e t o t h e c h o i c e of t i m e s t e p , The E n g l i s h p a r t i c i p a n t ,
S tephen Grove, h a s n o t e x p e r i e n c e d a s e n s i t i v i t y of t h i s
o r d e r o f magnitude of t h e model on o t h e r sys tems and b e l i e v e s
it i s because of t h e s p e c i a l c o n t r o l s t r a t e g y of t h e PTF
sys tem, where bo th purnps a r e runn ing a l l t h e t i m e , and c o l -
lec-Lion i s ix l i t i a . t ed by a l l o w i n g t h e f l u i d i n t h e pr imary
c i . r cu i - t t o p a s s th rough t h e h e a t exchanger . The GB2 model
s o l v e s t h e systein e q u a t i o n s s e q u e n t i a l l y which, i n t h e c a s e
of a SPTF t y p e , might be more c r i t i c a . 1 t h a n i n o t h e r s y s t e m s ,
Even t h e DK model, which s o l v e s t h e e q u a t i o n s s i m u l t a n e o u s l y
by a n i m p l i c i t method, shows a g r e a t d e a l of s e n s i t i v i t y t o
t h e c h o i c e o f t i m e s t e p . The p e r c e n t s o l a r i n c r e a s e s r e l a -
t i v e l y a lmos t 1 0 % .
The Danish participant investigated this problem a little
further and found that the differences found for different
time steps were due to two separate effects:
l. Control shift during a time step.
2. Integration error accumulation.
He therefore changed the program in such a way that, when
a control shift was happening, the program automatically
used 5-minute time steps during the hour in question.
The results obtained this way are compared to the results
of the original version of the program for various time
steps on fig. 7.3. From this figure it appears that the
prediction of the accurate time of control shift during a
time step is the reason for the biggest part of the observed
difference. Almost 48 of the 5% difference stems from that.
From fig. 7.3 it can also be concluded that a time step of
10-15 minutes seems to be appropriate to obtain very ac-
curate results with this type of model. Alternatively, a
model that automatically switches to smaller time steps,
when a change in the system operating mode occurs, give
fairly good results.
Statistical analysis of PTF-validation calculations
The Belgian participant, Willy Dutr6, volunteered to study
the effect of uncertainty of model predictions and system
measurements on the validation results and to develop a pro-
cedure to systematically treat these problems in the vali-
dation work. This work was completed and reported in
March 1981, ref. 15, and the method developed has
been implemented in the programme of the Modelling Group.
7.8 Detailed studies of components
The French participant had a special simulation code avail-
able, ORIENT, which takes into account many more details of
the systems than the code HABSOL used elsewhere in this
context. Using this model a series of calculations on one
d a y E s d a t a were performed t o f i n d t h e p a r a n e t e r v a l u e s
r e s u l t i n g i n b e s t agreement w i t h t h e measurements. F i g . 7 , 4
shows such a series of r u n s t o o b t a i n a c o r r e c t e s t i m a t e
of t h e a b s o r b e r p l a t e e m i t t a n c e .
7 . 9 Measured c o l l e
The Banish p a r t i c i p a n t v o l u n t e e r e d t o i n v e s t i g a t e . the
agreement between t h e c o l l e c t o r e f f i c i e n c y c u r v e o b t a i n e d
by a s:l.rrgle c o l l e c t o r e f f i c i e n c y t e s t , and th.e c u r v e ob-
t a i n e d by a n a l y z i n g t h e d a t a from a r e a l sys tem i n s t a l l a t i o n
( t h e Danish SPTF).
The t y p e of c o l l e c t o r used on t h e SPTFss h a s been t e s t e d by
t h e European Communities C o l l e c t o r T e s t i n g Group i n a Round
Robin t e s t i n g programme ( r e f . 2 3 ) The dashed c u r v e on
f i g . 7 . 5 i s t h e e f f i c i e n c y c u r v e o b t a i n e d by t h i s g roup .
By a n a l y z i n g s e l e c t e d d a t a p o i n t s ( s o l a r r a d i a t i o n above L 700 W/m , s m a l l i n c i d e n c e a n g l e ) from a f o u r month p e r i o d ,
Ole BalsZev-Olesen h a s o b t a i n e d t h e two o t h e r c u r v e s on
f i g . 4 .5 . Curve no. 3 i s o b t a i n e d by t a k i n g i n t o a c c o u n t
the t r a n s i e n t e f f e c t s ( e , g , c o l l e c t o r h e a t c a p a c i t y ) , and
c u r v e no, 2 by i g n o r i n g t h e s e . I t was n o t p o s s i b l e t o ob-
t a i n t h e y - a x i s i n t e r c e p t (qo) from t h e SPTF d a t a . There-
f o r e t h e v a l u e o b t a i n e d by t h e C o l l e c t o r T e s t i n g Group was
used .
The agreement seems s a t i s f a c t o r y , b u t what does t h e d i f -
f e r e n c e mean. o v e r a y e a r ' s s im.u la t ion of a comple te system?
O l e Ba l s l ev -Olesen compared two s i m u l a t i o n s of t h e SP'TF
sys tem u s i n g c u r v e l and c u r v e 3 on t h e Danish T e s t Refe-
r e n c e Year and found a r e l a t i v e d i f f e r e n c e of 8 % on t h e pe r -
c e n t s o l a r . T h i s r e s u l t shows t h a t t h e u s e of c o l l e c t o r
e f f i c i e n c y c u r v e s o b t a i n e d by c o l l e c t o r t e s t i n g must b e done
v e r y c a r e f u l l y and w i t h an a n a l y s i s of t h e e f f e c t o f i n t e -
g r a t i n g c o l l e c t o r s i n a sys tem. I n t h i s c a s e .neat l o s s e s
e s p e c i a l l y , because of wind speed , were d r a s t i c a l l y reduced
i n t h e system i n t e g r a t i o n of t h e c o l - l e c t o r s compared t o t h e
i n d i v i d u a l c o l l e c t o r t e s t i n g .
7.10. Statistical validation methods
In the search for criteria for how well model predictions
agree with experimental results, the Danish participant,
Ole Balslev-Olesen, identified four statistical methods
and made some trial calculations with them (5). The
methods identified were MEAN, STANDARD DEVIATION, RANGE and
NUMl3ER OF ACCEPTABLE DATA POINTS. Such methods can be used
for the comparison of the results of different models to
the same set of data and can be used in addition to simple
comparisons of state and flow variables. For validation
methods see also ref. 16.
7.11 Extra~olation of results
One of the basic objectives of working with simulation
models is to be able to predict the performance of solar
systems in different climates and under different working
conditions. When a simulation model has been validated,
using data obtained from a certain system configuration, the
model can be used to simulate this system by using another
set of weather data, another load profile and, perhaps,
another collector area, and thus extrapolating the results
of the experiment to a number of cases. One of the ques-
tions this procedure raises is, how long a period of con-
tinous measurements is needed for each sequence of data to
get some stability of the validation results, This question
was addressed by the Danish participants by plotting the
accumulated difference between model predictions and experi-
mental results for energy flows and efficiencies, Fig. 7.6
and 7.7 in ref. 5 show these differences for the collector
efficiency and the system efficiency respectively, for six
different sets of data. The conclusion is that reasonable
stability is reached after a period of 12-14 days. The
appropriate length of data sequences for validation purposes
is therefore 12-14 days.
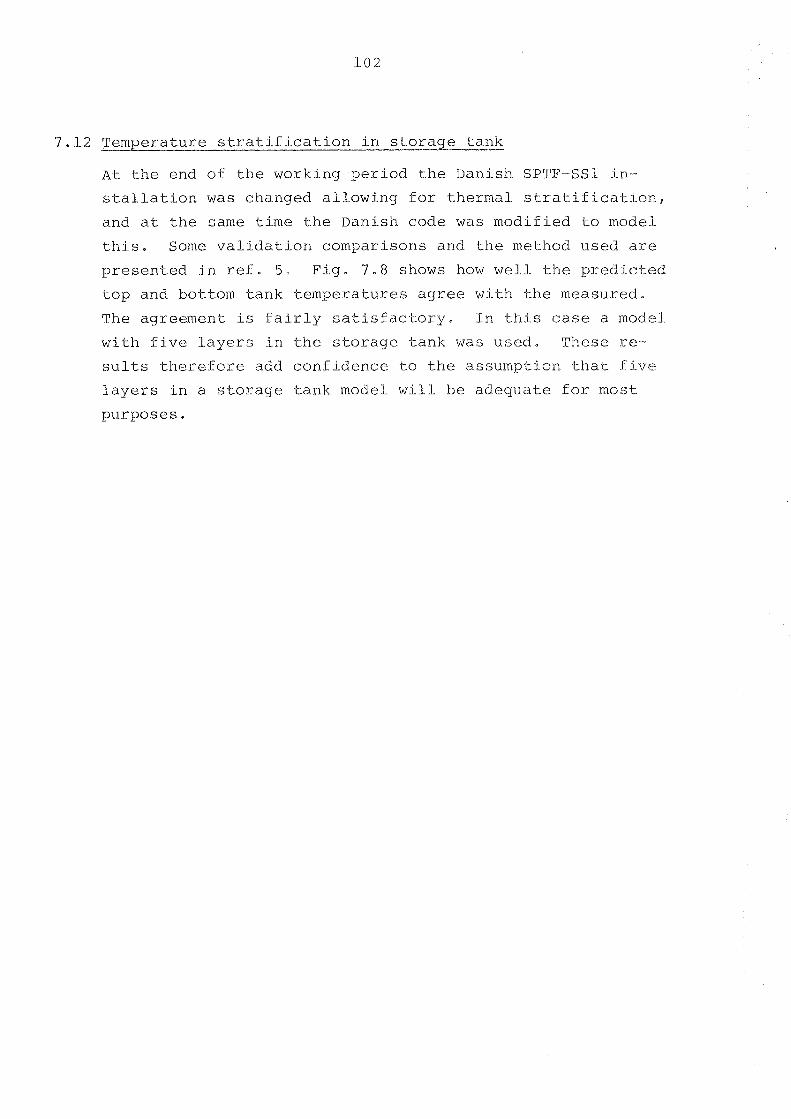
7.12 Temperature s t r a t i f i c a t i o n i n s t o r a g e t a n k
A t t h e end of t h e working p e r i o d t h e Danish SPTF-SS1 i n -
s t a l l a t i o n was changed alLowing f o r thermal- s t r a t i f i c a t i o n ,
and a t t h e same t ime t h e Danish code was modi f i ed t o model
t h . . i s . Some v a l i d a t i o n corrlparisons and .the method used a r e
p r e s e n t e d i n r e f . 5 . F i g . 7 . 8 shows how w e l l t h e p r e d i c t e d
t o p and bottom t a n k t e m p e r a t u r e s a g r e e w i t h t h e measured.
The agreement i s f a i r l y s a t i s f a c t o r y . I n t h i s c a s e a model
w i t h f i v e Layers i n t h e s t o r a g e t a n k was used. These r e -
s u l t s t h e r e f o r e add c o n f i d e n c e ts t h e assumpt ion t h a t f i v e
l a y e r s i n a s t o r a g e t a n k model w i l l be a d e q u a t e f o r most
purposes .
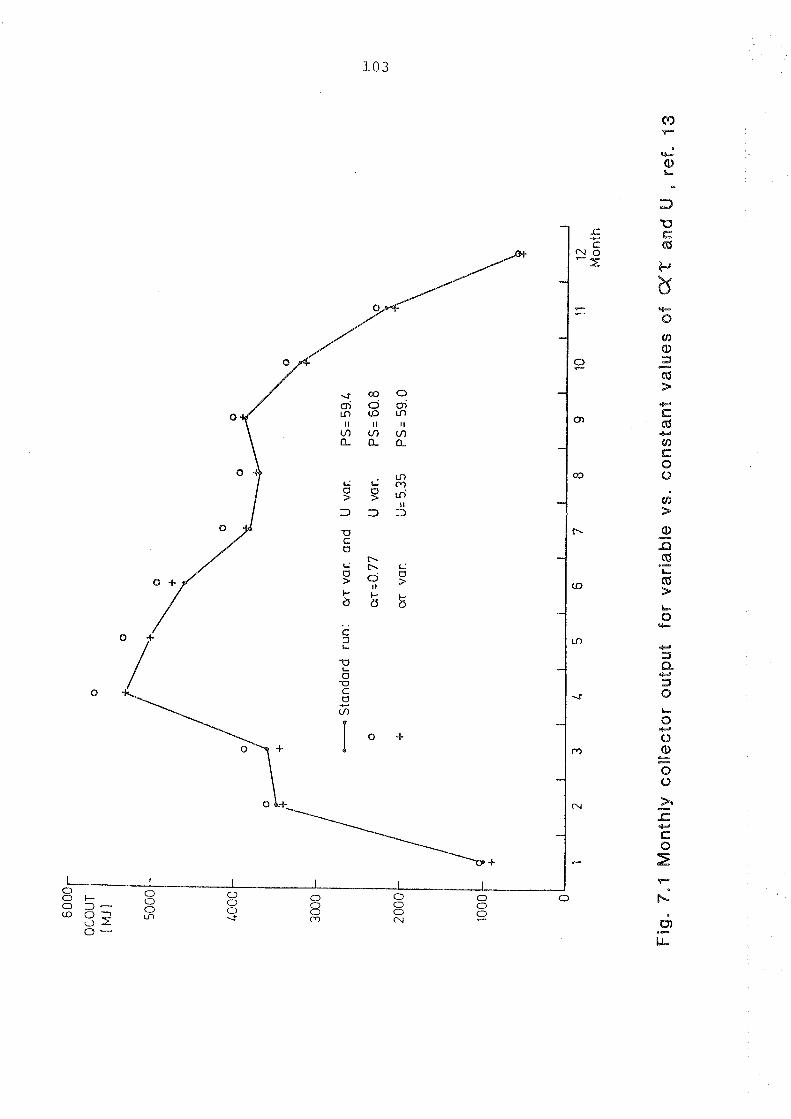
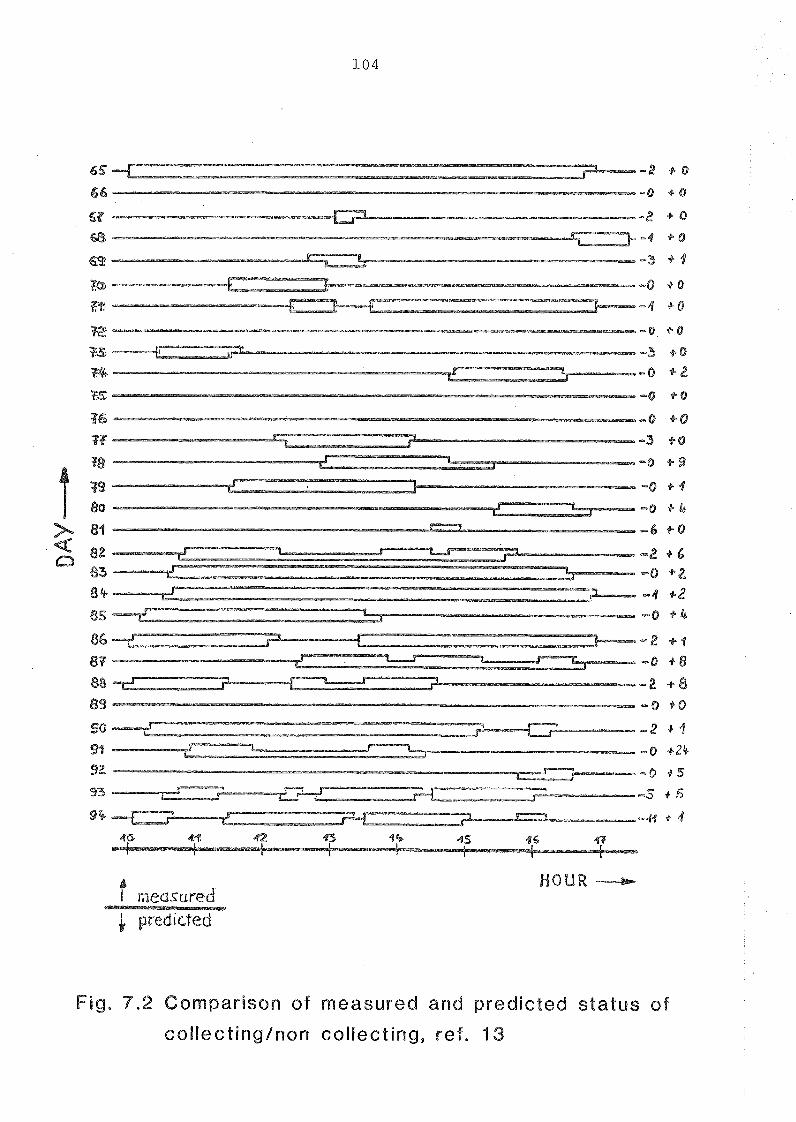
f measured 1 predicted
H O U R
Fig. 7.2 Comparison of measured and predicted status of"
collectingPnon collecting, ref. 13
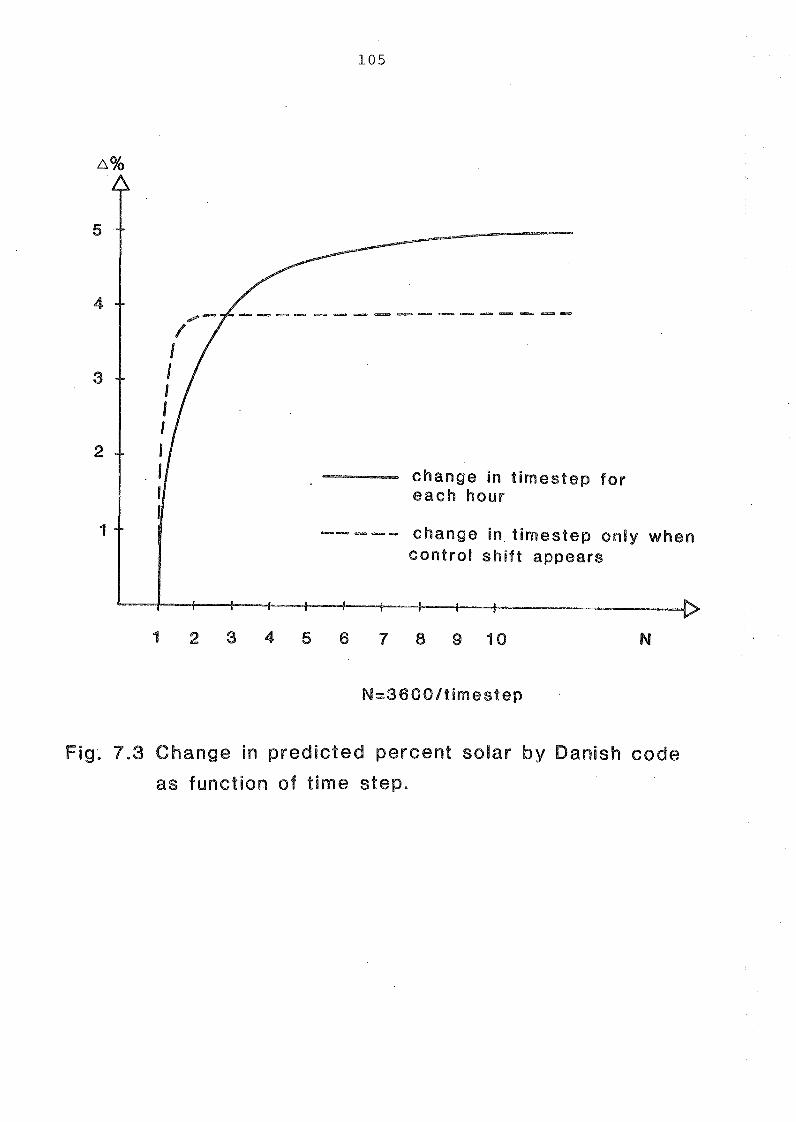
5
4
3
2 change in t imestep fo r each hour
1 _OI-_8._I_D._) change in. t imestep only when con t ro l skif t appears
Fig. 7.3 Change in predicted percent solar by Danish code
as function of time step.
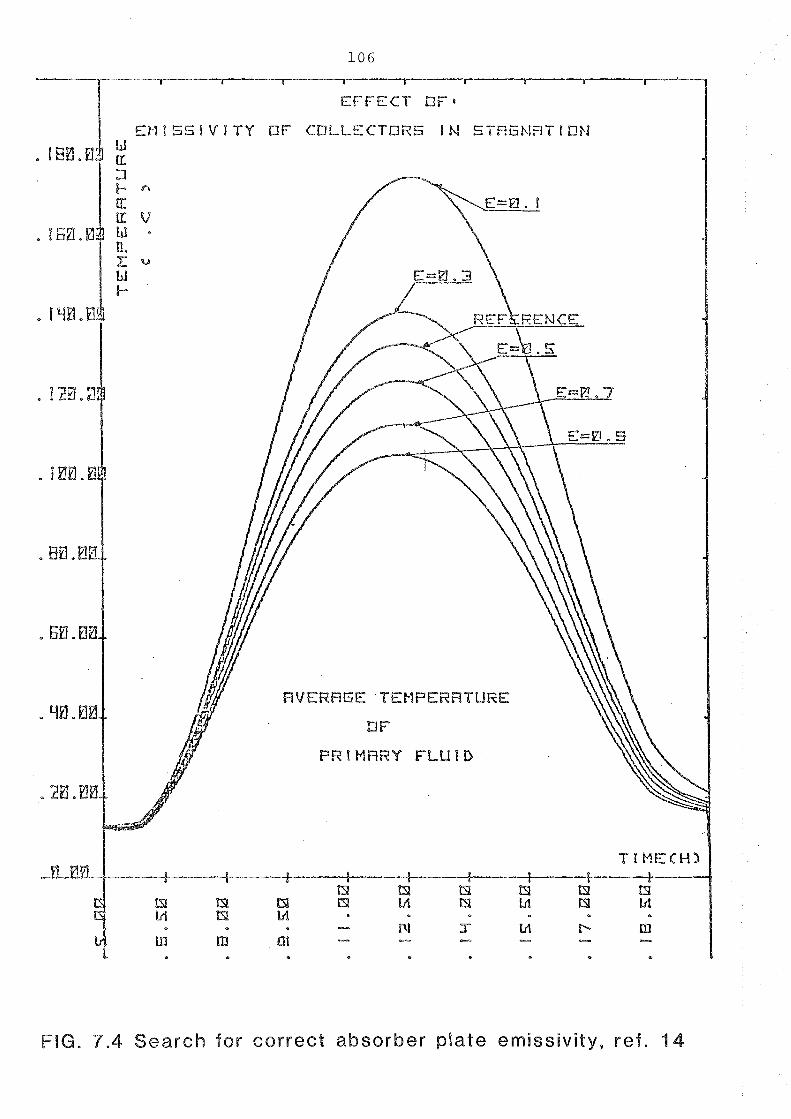
FIG. 7.4 Search for correct absorber p iate emissivity, ref. 14
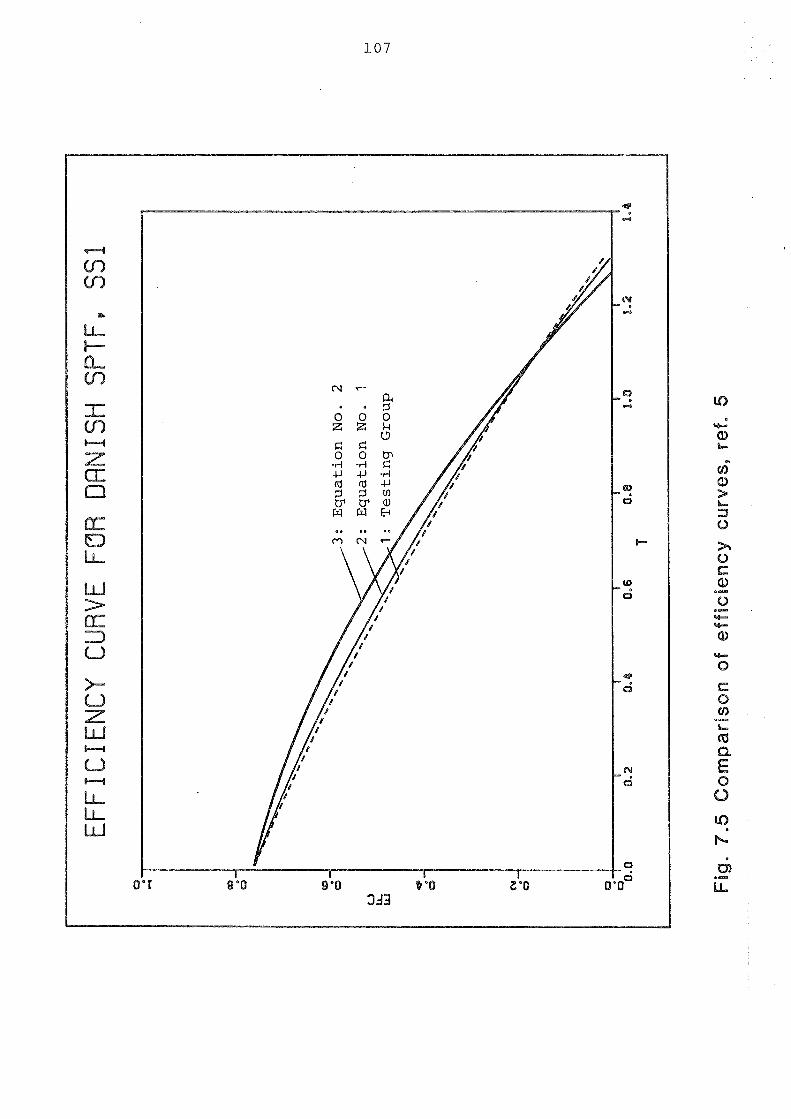
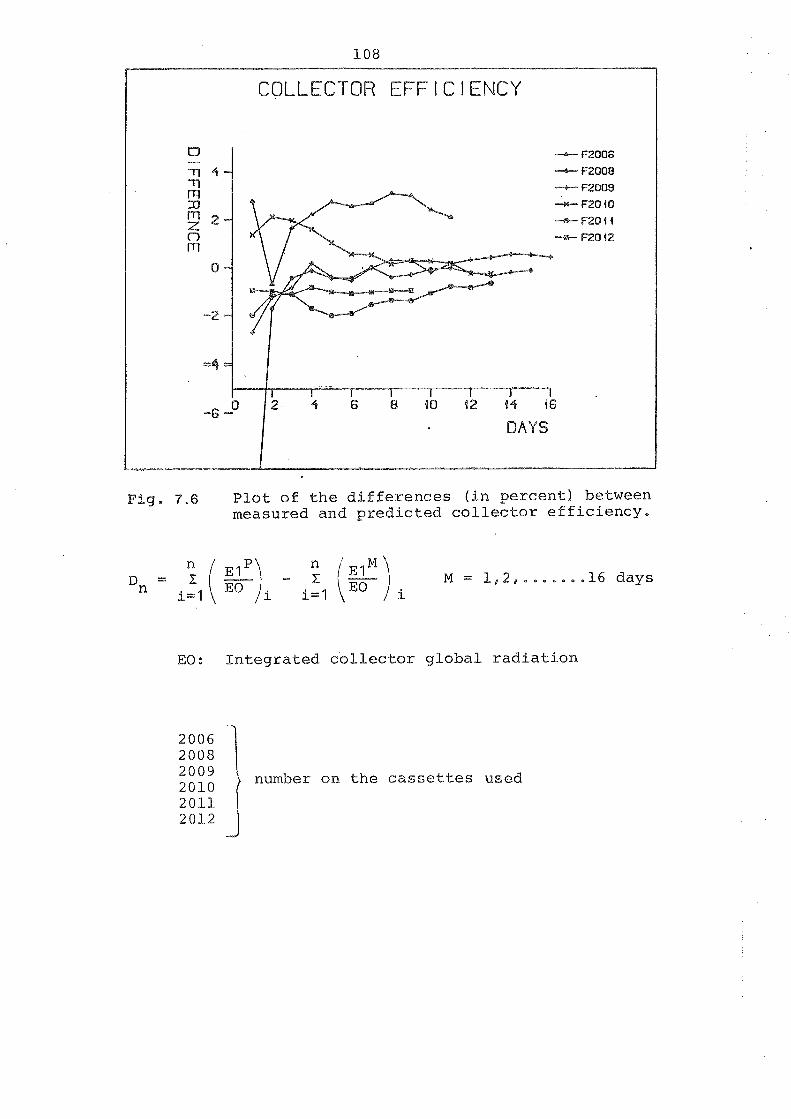
Fig , 7.6 P l o t of t h e d i f f e r e n c e s ( i n pe rcen t ) between measured and p red ic t ed c o l l e c t o r e f f i c i e n c y ,
M = 1 ,2 , . . . . . -16 days i= '1
E 0
EO: I n t e g r a t e d c o l l e c t o r g l o b a l r a d i a t i o n
2009 ) number on t h e c a s s e t t e s used 2010
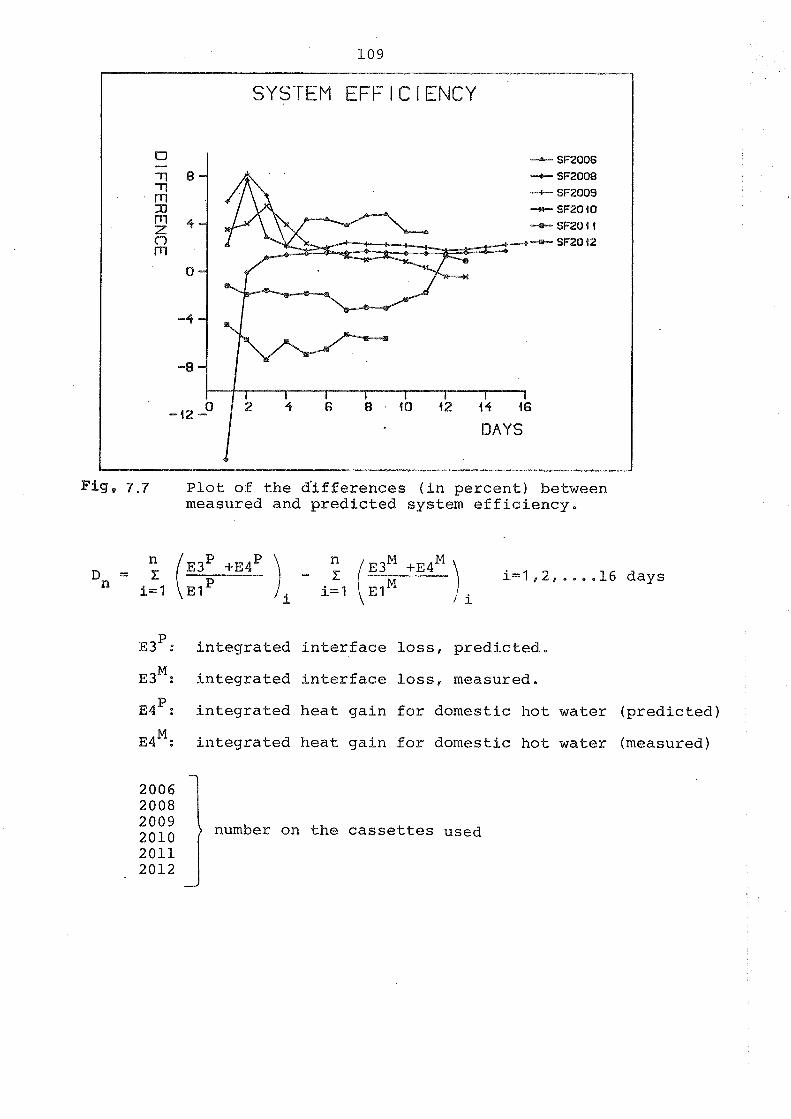
Fig, 7.7 Plot of the differences (in percent) between measured and predicted system efficiency*
n P +E4 n = ( E 3 ) I ( ~ 3 ~ +E*'' \
Dn i=l,2,..,.lQ days i=l EI' i ==l ~1~ i
P E3 : integrated interface loss, predicted,
~ 3 ~ : integrated interface loss, measured.
P E4 : integrated heat gain for domestic hot water (predicted)
~ 4 ~ : integrated heat gain for domestic hot water (measured)
2009 } number on the cassettes used 2010
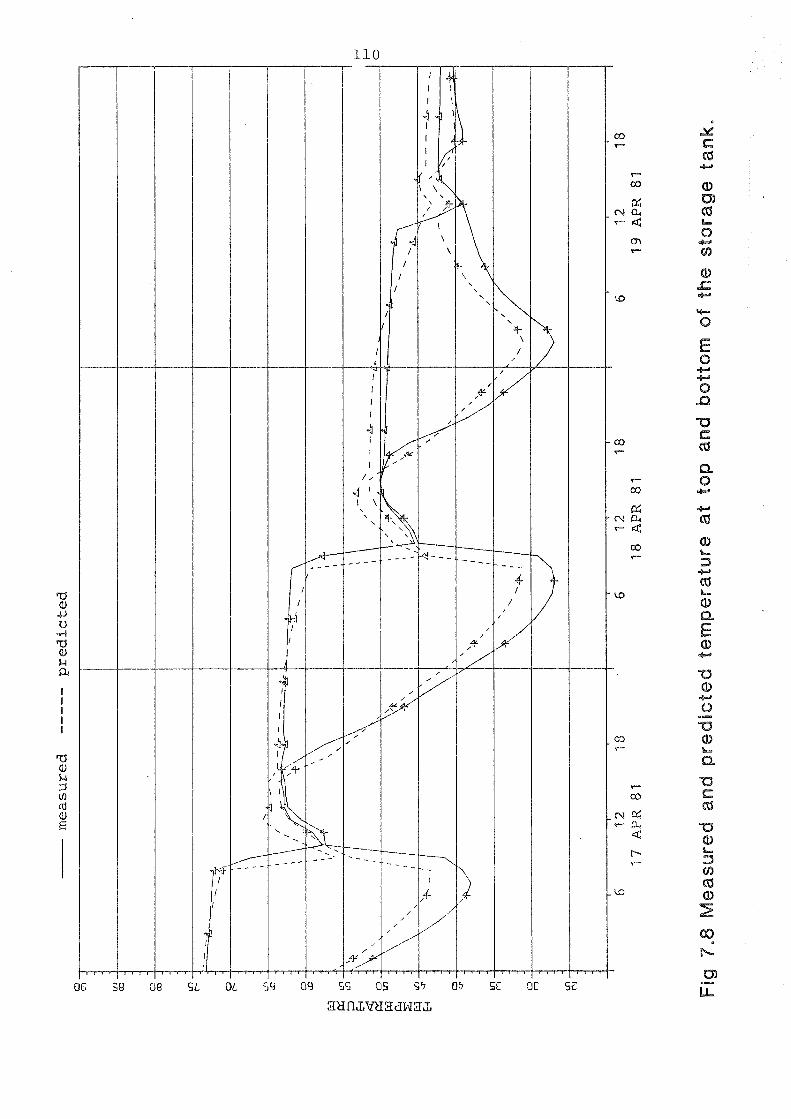

CHAPTER 8
CONCLUSIONS


8. CONCLUSIONS
At the outset of this cooperative programme a number of goals
or objectives for this first one and a half year working pe-
riod were identified:
Model - model comparisons and sensitivity analyses on SPTF-type of system.
Component model validation on SPTF-data
Overall system validation on SPTF-data
(from at least two different installations).
Extrapolation of results in time and location.
Small time increment validation.
Recommendations for mathematical descriptions of
solar heating system modelling.
Simplified design method validation using PMG format.
At the end of the working period it could be established
that these objectives had been met in a satisfactory way.
This is thoroughly documented in details in the preceding
chapters and in the reports of the participants, see ref.
5-14. The results of these activities are briefly summarized
in the paragraphs below, and some general conclusions are
drawn.
8 .2
~ 1 1 the participants had their models set up to model the
SPTF-SS1 system, and a total number of three parameter sensi-
tivity analyses were performed. An improvement in the model-
ling of this system was achieved resulting in an improved
agreement among the models in the final analysis.
In the third parameter sensitivity analysis the models were
used to extrapolate from a given configuration of the system
t o a n o t h e r , t h u s e n a b l i n g c l e a r d i r e c t i o n s t o be g i v e n t o
t h e SPTF Group w i t h r e s p e c t t o systern changes .
8 . 3 -~ V a l i d a t i o n of s i m u l a t i o n models
T h i s a c t i v i t y was under taken b o t h a s a l o c a l a c t i v i t y
( n a t i o n a l v a l i d a t i o n ) and by exchange of d a t a from a SPTF
i n one c o u n t r y t o m o d e l l e r s i n o t h e r c o u n t r i e s (common va-
l i d a t i o n ) . Both a c t i v i t i e s were c o n s i d e r e d v e r y u s e f u l ,
h u t w i t h a s l i g h t l y d i f f e r e n t scope . The n a t i o n a l v a l i d a -
t i o n a c t i v i t y a l l o w s f o r d i r e c t i n t e r a c t i o n between t h e model-
ler and t h e pe r son r e s p o n s i b l e f o r t h e sys tem hardware (who
i n some c a s e s i s t h e same p e r s o n ) , T h i s i n t e r a c t i o n e n a b l e d
p r o g r e s s t o be made on b o t h f r o n t s . The model showed up de-
f i c i e n c i e s i n t h e sys tems and changes i n t h e i r per formance ,
and t h e measurements h i g h l i g h t e d a r e a s where t h e models re-
q u i r e d improvement. Only t h e l a t t e r achievement was p r a c t i c a l
f o r t h e common v a l i d a t i o n a c t i v i t y . However, a v e r y s i g n i f i -
c a n t advan tage of t h i s a c t i v i t y was t h a t two of t h e p a r t i c i -
p a n t s , who had r e c e i v e d no o r v e r y l i t t l e d a t a u s e f u l f o r
v a l i d a t i o n work d u r i n g t h e working p e r i o d , by t h i s a c t i v i t y
o b t a i n e d v a l u a b l e d a t a from o t h e r sys tems. T h i s gave them
a n o p p o r t u n i t y t o g a i n i m p o r t a n t e x p e r i e n c e s from v a l i d a t i o n
of t h e i r models.
The r e s u l t s of t h e n a t i o n a l and common v a l i d a t i o n work were
v e r y s i m i l a r . By comparing measured and p r e d i c t e d s t a t e s of
t h e sys tem and dynamic behav iour on comparison p l o t s , t h e
agreement seemed s a t i s f a c t o r y . A d e t a i l e d comparison of i n t e -
g r a t e d energy f lows r e v e a l e d , however, i n some c a s e s unaccep t -
a .b le d i f f e r e n c e s i n t h e o r d e r of 10-15%. The r e a s o n s f o r
t h e s e d i f f e r e n c e s a r e d i f f i c u l t t o i d e n t i f y . Some of t h e
r e a s o n s a r e :
wrong i n p u t d a t a
i n a c c u r a t e o p e r a t i o n of t h e b u i l d i n g l o a d i n t e r f a c e of
t h e SPTF-system
m a l f u n c t i o n i n g of components
model shor tcomings

8.4 Recommendations for validation
From some of the detailed component validation work it can
be concluded that one of the most important factors for good
validation work is to have accurate input data.
The model input data describing the system should be based
on the.system as built or, even better, as measured to pro-
vide meaningful comparisons between model predictions and
thermal performance measurements. Experience with the SPTFs
and other solar systems has shown that the systems are very
rarely built to the design specifications.
One of the questions often raised with respect to the vali-
dation of simulation models of solar heating systems deals
with the necessary amount of data for this purpose. The answer
found during this work is that the appropriate length of data
sequences is 12-14 days. It is recommended that the data
sequences used are taken under different weather conditions,
e.g. during spring, summer, autumn and winter.
8.5 Recommendations for modelling
It appears from chapter 2 that the models used within this
programme covered a wide variety of model assumptions and
philosophies. One of the objectives of this work was to
clarify the impact of these different model strategies on
the simulation results.
Besides the activities scheduled in the programme from the
outset (parameter sensitivity analysis and validations), a
number of special tasks were identified during the work, most
of them designed especially for one model or group of models,
to better accomplish this objective. This work is described
in detail in chapter 7. Below the results are generalized
and summed up.
Collector loss coefficient
Many of the models make use of Klein's formula (20) for the
top loss coefficient, and all the results obtained with this
expression in this context support the continued use of it.
Another approach attempted was a linear dependency of plate
and ambient .temperature difference. 'This also seemed to be
a reasonable assumption. Even the use of a constant loss
coefficient can be justified from the results obtained
under this work, provided that a detailed analysis goes in-
to finding the right parameter to use,
Collector I---_-_-_------------------- transmission-absor~tion-("ca) --I_-_---- eroduct --____
One of the special tasks performed gave the concl.usion that
it is more important to calculate the z a - product than the
collector loss coefficient at each time step.
Time s t e ~ and integration methods P---I--- ------m-- -------------- Two of the special tas'ks performed clearly showed that
using a time step of one hour does not always lead to cor-
rect results. These factors influence the size of time
step necessary:
type of model, explicit or implicit
system time constant
system control strategy
As a general rule implicit methods are much less sensitive
to the choice of time step than explicit methods. It is
shown, however, that even for normal system time constants 2
(storage volume/collector area - LOO litre/m ) a time step
of one hourfused in an implicit rnethod,yields results that
are 5% off in absolute value from predictions obtained with
a time step of 10-15 minutes. This difference is mainly due
to changes of system mode operation occurring during a time
step.
84 6
TWO simplified design methods, the French CFC-2 and the
American F-Chart method, were compared to a year's measure-
ment of the first solar house at Milton Keynes, reported in
the reporting format developed by the Performance Monitoring
Group.
The two methods showed exceptionally good agreement to the
measured results, both on a monthly and a yearly comparison
basis. The exercise resulted in important feedback to the
Performance Monitoring Group with respect to the usefulness
of the format for validation purposes. This feedback was
quickly implemented as changes to the format.
8.7 Future work
At the outset of the programme the development of the two
European Solar Heating System Yearly Forecast Programmes
(one simulation model and one simplified method) were identi-
fied as long term goals. To achieve these goals it was de-
cided to focus the work of the group on one simulation model
in the current programme. This model has been distributed
to all the participants and is being reviewed and validated
against data from the SPTF installations.
The work on simplified methods has been greatly extended,
and at the moment several of these methods (approx. 8) are
being evaluated, both with'respect to ease of use and to
accuracy. The latter is being assessed using the results of
the detailed simulation model mentioned above.
Many of the participants of the Modelling Group have expressed
their satisfaction with the work in the group. A couple of
citations from the final reports of the participants are
presented here to illustrate their viewpoints:
"Generally, the work done by this group was very en-
couraging. Cooperating with the SPTF Group was a
stimulation to develop models more practically." (ref.13)

"During the period of this work considerable progress has
been made with both model development and understanding
of the nature and behaviour of active sol-ar energy sy-
stems . . . . . . " (ref. 10)
"Discussion with other members of the group, and compari-
son of models, has meant that more progress has been rnade
than would have been, had the work been done in isola-
tion. '"ref. 10) .

List of references
1 . JGrgensen, 0. (1 979) . Conunission of the European
Communities, Solar Energy R-D Programme, Project A:
Solar Energy Applications for Dwellings, Modelling
and Simulation Part.
2, JGrgensen, 0. (1979). Annex to ref.[l]: Description
of Simulation Codes and Monthly Tables.
CEC Modelling Group for SHS and DHW
January 1980 - June 1981
3. JQrgensen, 0. (1980), Progress Report, July 1980, Denmark,
4. JGrgensen, 0. (1981), Progress Report, April 1981,Denmark,
5. Balslev-Olesen, 0. ( 1 98 1 ) , Final Report, Denmark.
6. Dutrg, W. (1 980-1 981 ) , Sensit.ivity Analysis and Validation Calculation on Solar System One (part 1 and 2 ) ,
January 1981, Belgium.
7. van Galen, E. (1981), Final Report, the Netherlands.
8. Grove, S. (1981), Final Report, United Kingdom.
9. Kelledy, E. (1 951 ) , Draft Report, Ireland.
10. La Fontaine, R. (1981), Final Report, United Kingdom.
1 1 . La Fontaine, R. (1981), ISES Paper for Brighton Conference:
A Cooperative Programme of Model Development, United
Kingdom, August 1981 . 12. Lee, J. (1981), Final Report,
United Kingdom.
13. Reichert, J. (1981), Final Report, Germany.
14. Verdier, B. (1981), Final Report, France.
15. W.L.Dutr6, A . Debosscher, P. Deceuninck (1981),
Statistical Analysis of PTF-validation calculations,
Belgium.

16. W.J. Kennish. An Approach to the Validation of
Computer Simulation Codes, March 1978, NTIS 5285
. . Port Royal Road, Springfield, VA 22161.
17. 3. Adnot, B, Bourges, D, Campana, R. Gicquel,
Utilization of Cunulative Frequency Curves of Global
Irradiation for Calculating Solar Installations,
internal Report, Centre dPEnerg&tique, ENSMP 1978,
18. B. Bourges et al. Prevision of long-term average
performance of Low temperature solar systems: a
synthetical review of existing methods and available
meteorological data, ICBEM, Portugal, 1980.
19. B, Bourges, D. Campana, R. Gicquel and G, Watremez,
Courbes de Fr6quences Comul6es de lsIrradiation
Solaire Globale, CEC report (contract No. 295-77 ESF),
4 volumes, 1979,
20. W.A. Beckman, S. Klein and J.A. Duffie, Wiley-Inter-
science, 19'77, Solar Heating Design by the f-chart
method.
21, 3.A- Duffie & W,A. Beckman. Solar Energy Thermal
Processes, Wiley-Interscience, 1974.
22. Newsletters 1-6, January 1980, May 1980, August 1980,
October 1980, February 1981, May 1981,
23. Brochure on the Solar Pilot Test Facilities, a project
of the solar energy R&D programme of the Commission of
the European Communities (DG XII) , 1981. Address inquiries to: P'lr. T,C. Steerners,
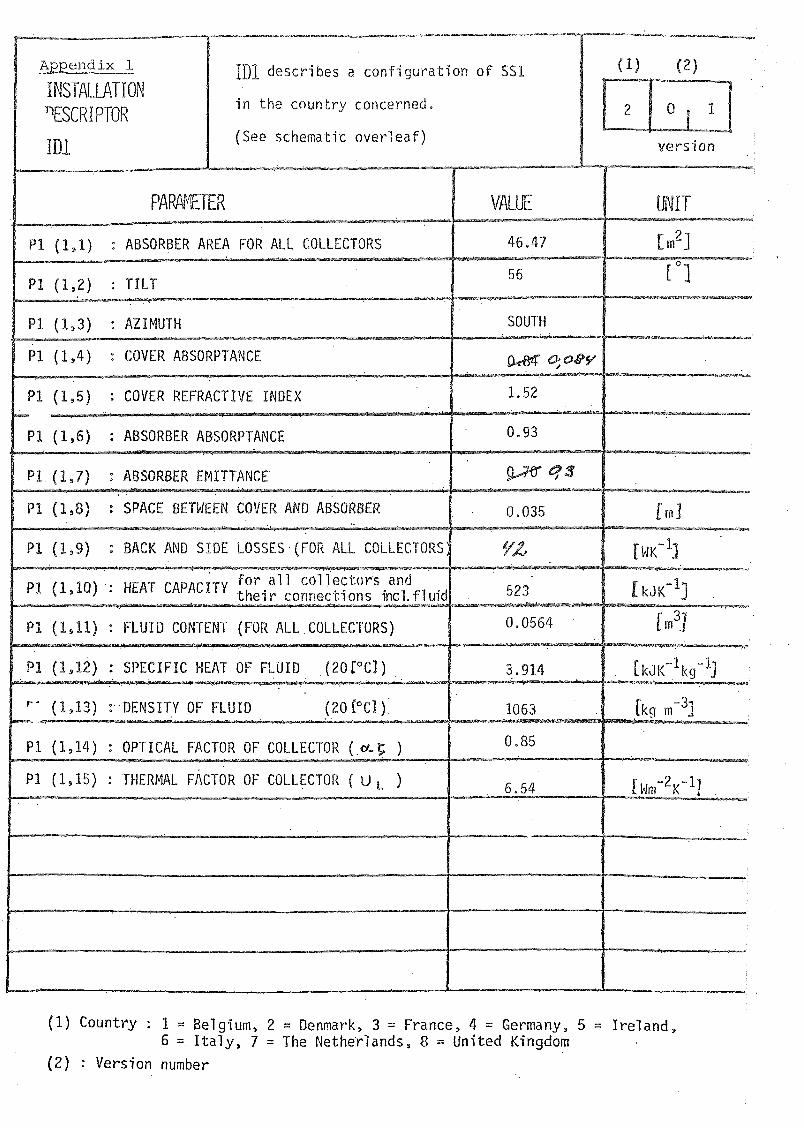
, Appendix 1 $D% describes a conf i yuration of S S 1
i n the country concerned.
(See schematic over leaf)
P 1 (1 ,3) : AZIMUTH SOUTH
P 1 (1,7) : ABSORBER EMITPANCE
P1 (1,9) : BACK AND SIDE LOSSES (FOR ALL COLLECTORS
fo r a l l col 1ec"r;or.s and P 1 (1,10) : HEAT CAPACITY their corm
P 1 ( 1,ll) : FLUID CONTENT (FOR ALL. COLLECTORS)
(1) Country : l = Belgium, 2 = Denmark, 3 = France, 4 = Germany, 5 = I re land, 6 = I t a l y , 7 = The Netherlands, 8 = United Kingdom
( 2 ) : Version number
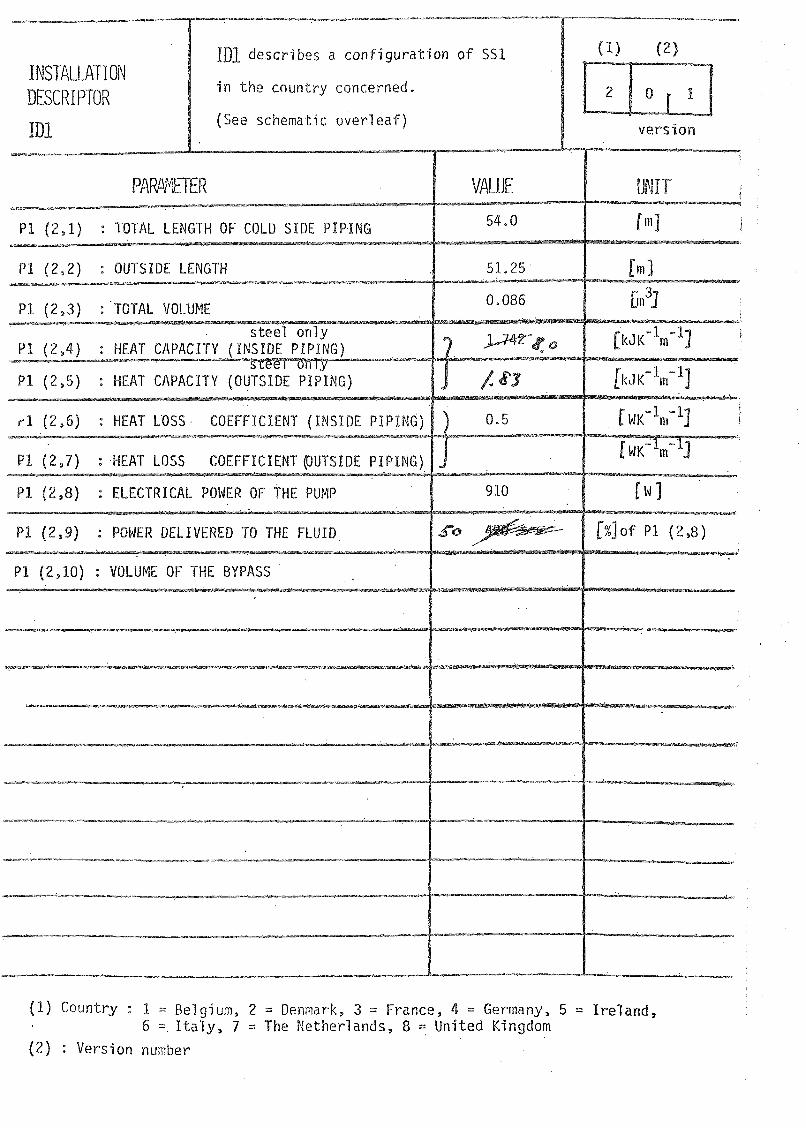
ID1 describes a c o n f i g u r a t i o n of SS1
in the country concerned,
(See schematic overleaf)
PP ( 2 , 3 ) : TOTAL VOLUME
steel only
P% ( 2 , 5 ) : HEAT CAPACITY (OUTSIDE P I P I N G )
f% ( 2 , 6 ) : MEAWOSS. C O E F F I C I E N T (INSIDE PIPINd)
P 1 (2,7) : .HEAT LOSS C O E F F I C I E N T (OUTSIDE PIPING)
P I (2 ,8 ) : E L E C T R I C A L POWER OF THE PUMP
P 1 ( 2 , 9 ) : POWER DELIVERED TO THE F L U I D
U P -
(1) Country : 1 = Belgium, 2 = Denmark, 3 = France, 4 = Germany, 5 = I re land, 6 Y I t a ly , 7 = The Netherlands, 8 = United Kingdom
( 2 ) : Version number
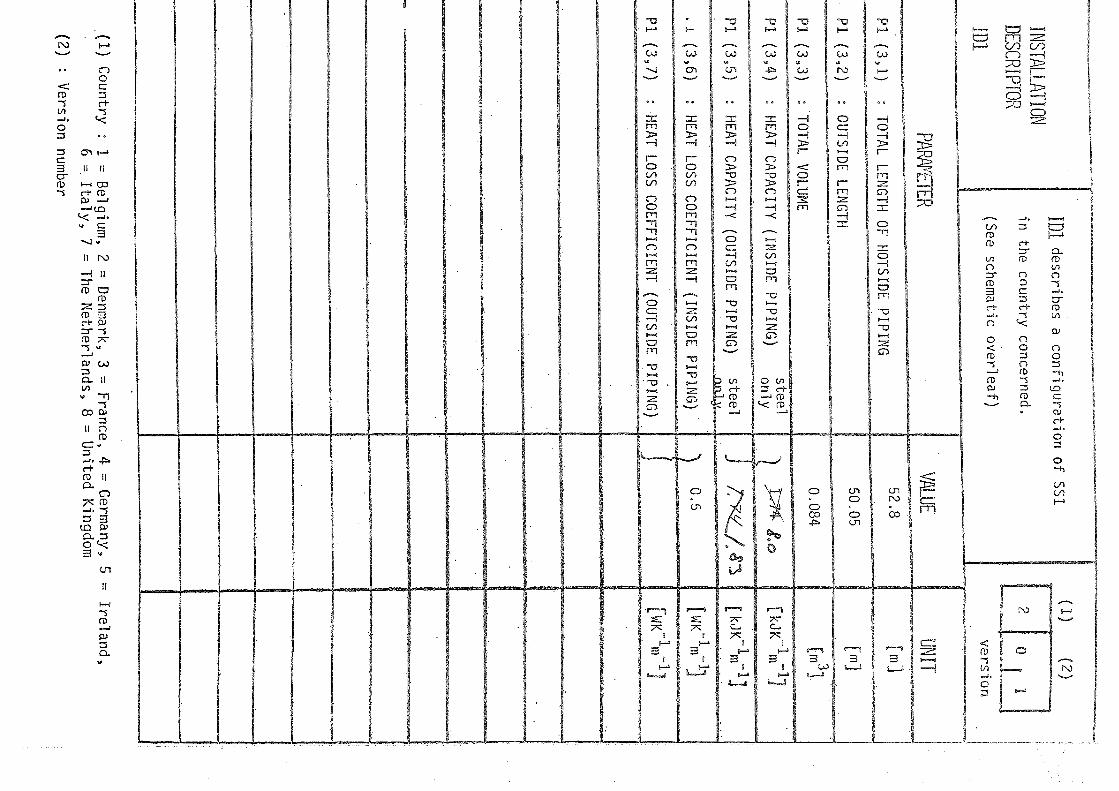
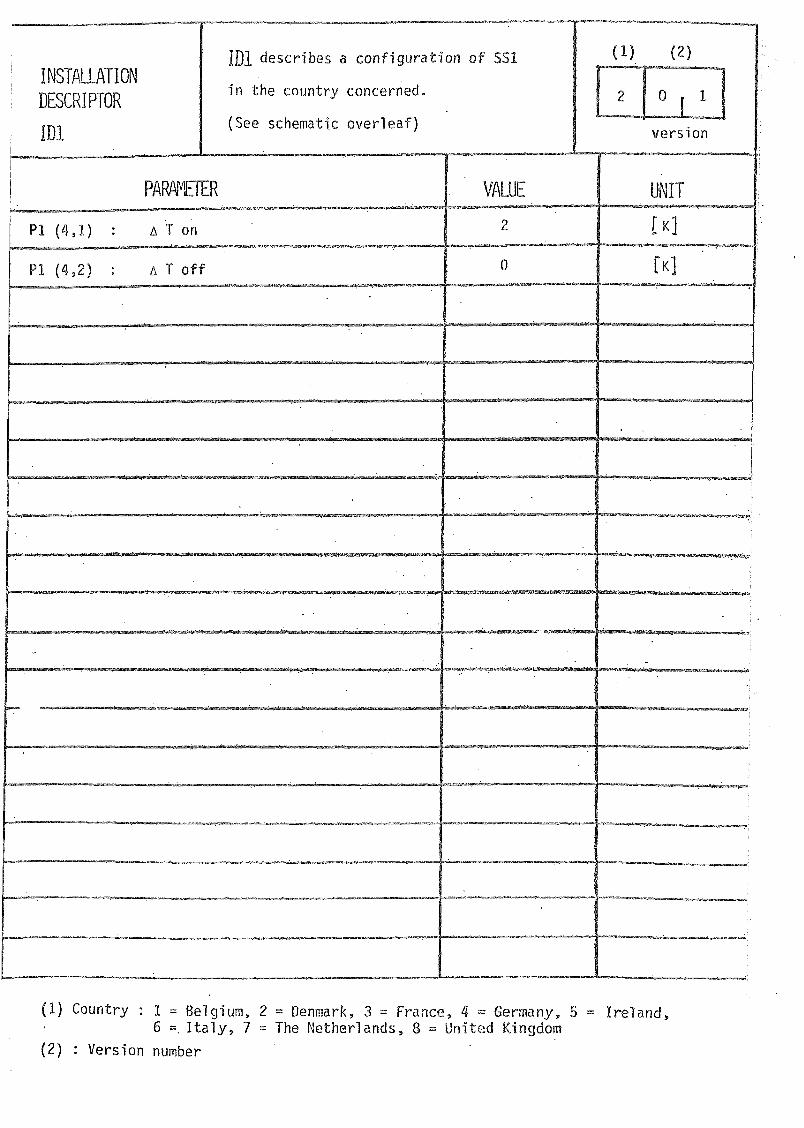
describes a c o n f i g u r a t i o n o f SS1
i n t he country concerned.
(See schematic overleaf)
(1) Country : 1 = Belgium, 2 = Denmark, 3 = France, 4 = Germany, 5 = I re land, 6 =, I t a l y , 7 = The Netherlands, 8 = United Kingdom
(2 ) : Version number
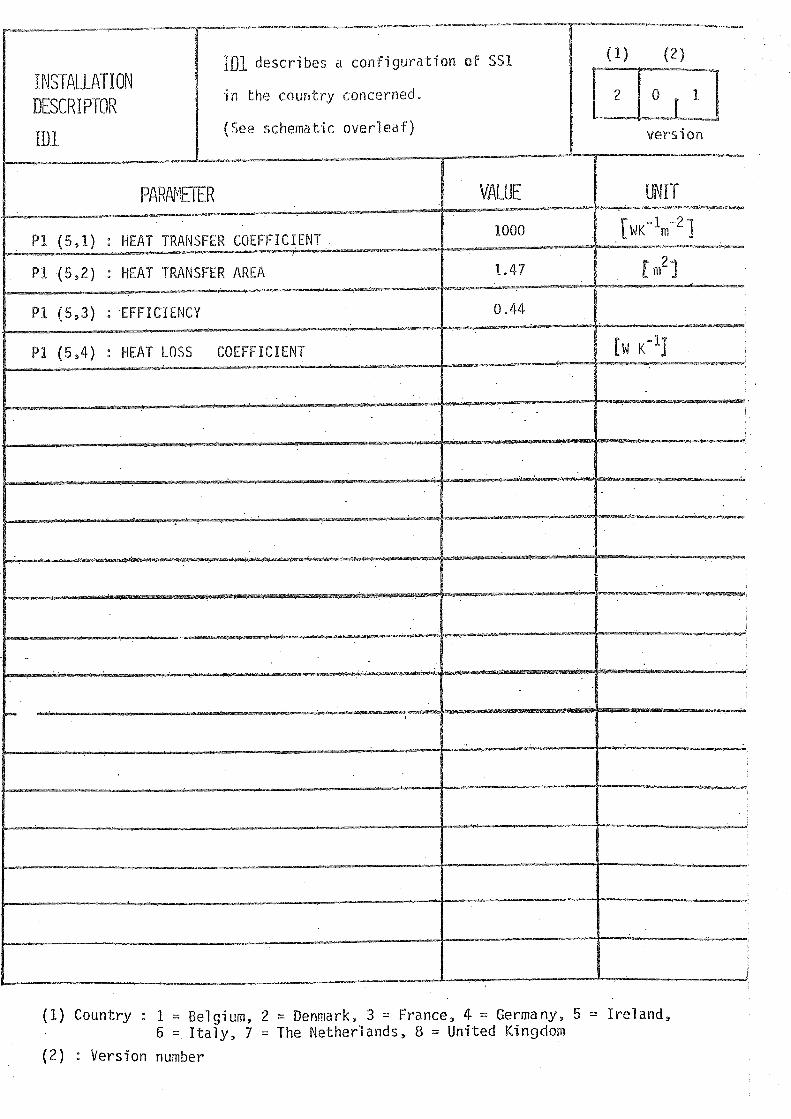
]D% describes a configuration o f SS1 I NSTALMTI ON DESCRE ?TOR
i n the country concerned.
ID.1 (See schematic overleaf) versaon
: HEAT TRANSFER COEFFICIENT
P1 , (5 ,%) : HEAT TRANSFER AREA
P 1 (5,3) : 'EFF IC IENCY
P I (5,4) : HEAT LOSS COEFF IC IENT
(1) Country : 1 = Belgium, 2 = Denmark, 3 = France, 4 = Germany, 5 = I re land, 6 = I t a ly , 7 = The Netherlands, 8 = United Kingdom
( 2 ) : Version number
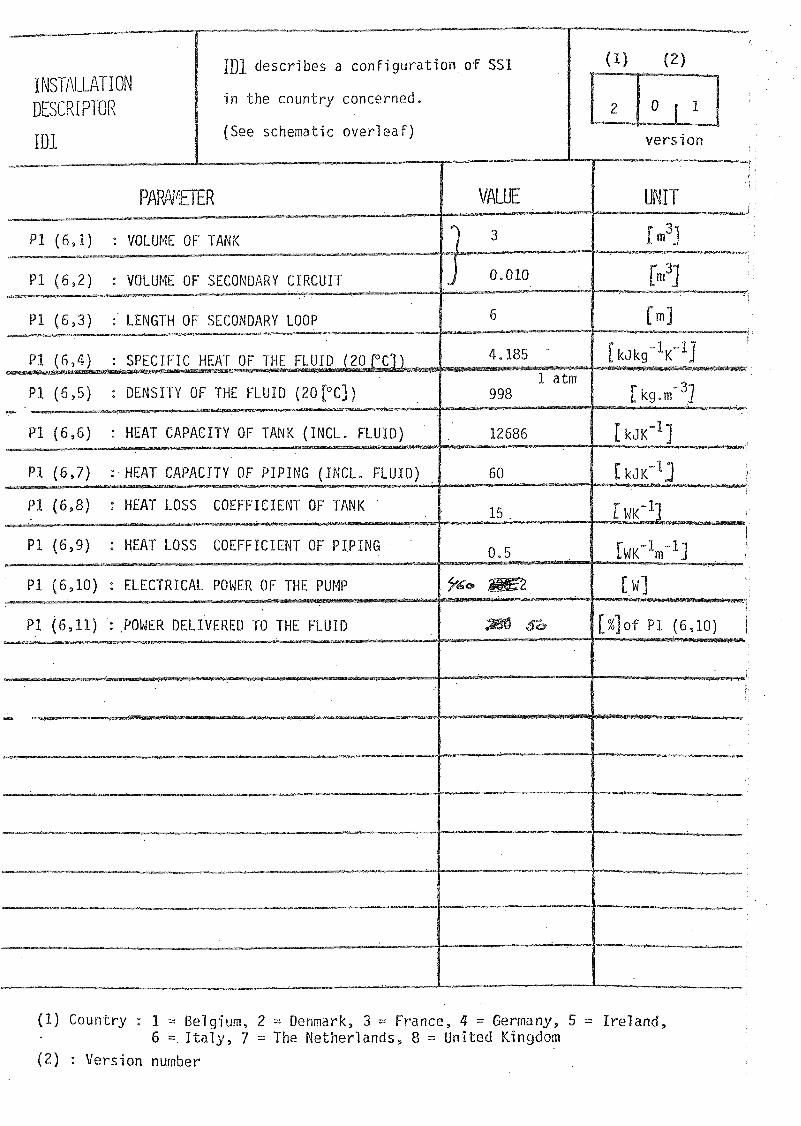
describes a configuration of SS1
in t h e cnuntry concerned.
(See schematic overleaf)
( 1 ) Country : X = Belgium, 2 = Denmark, 3 = France, 4 = Germany, 5 = Ireland, 6 = I t a l y , 7 = The Netherlands, 8 = United Kingdom
( 2 ) : Version number
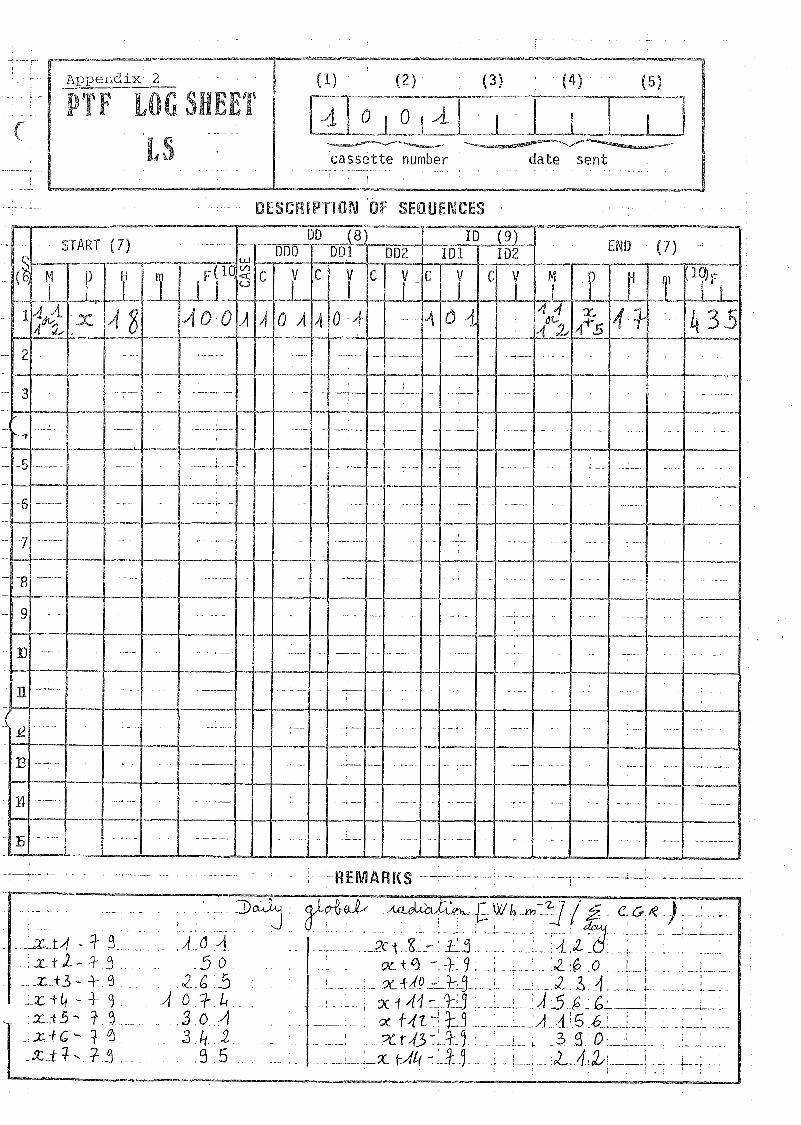
. . - DESCRlPTiON OF SEQUENCES
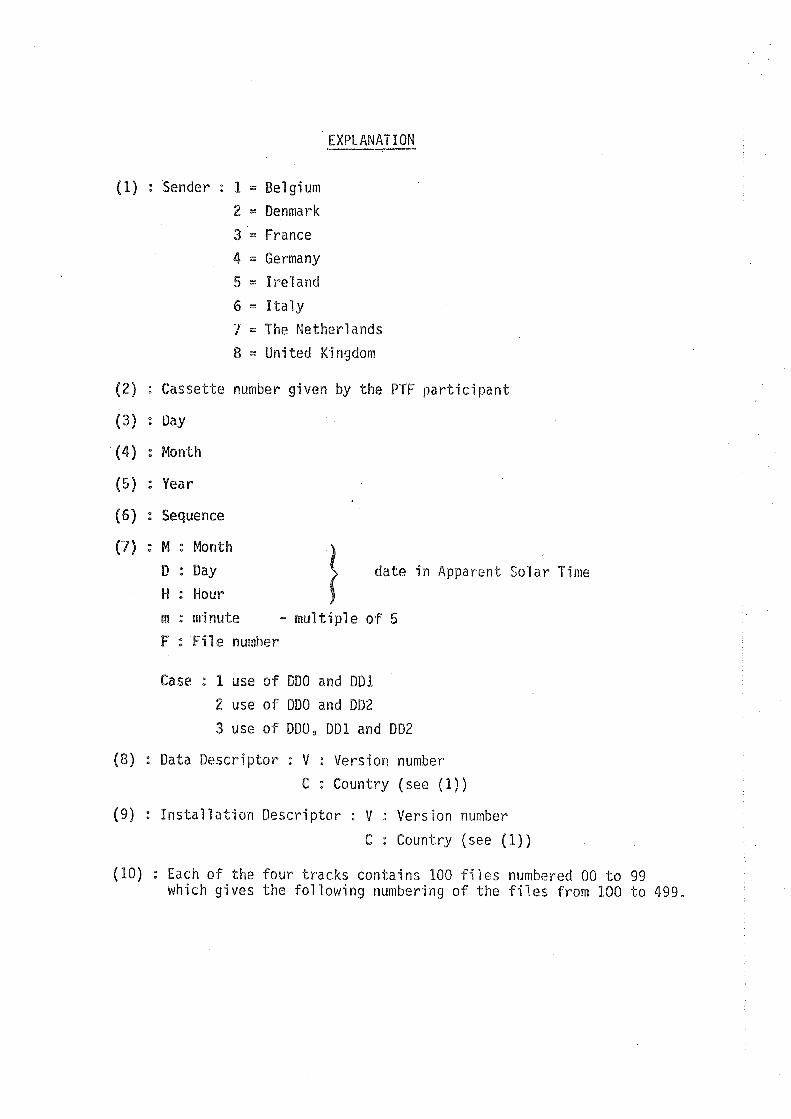
EXPLANATION
(1) : Sender : 1 = Belgium 2 = Denmark
3 = France
4 = Germany 5 = Ireland
6 = I ta ly
7 = The Netherlands 8 = United Kingdom
( 2 ) : Cassette number given by the PTF participant
(3) : Day
(4) : Month
(5) : Year
(6) : Sequence
(7) : M : Month
D : Day date in Apparent Solar Time H : Hour
m : m%nute - multiple of 5
F : F i l e number
Case : f use o f DD0 and B D 1
2 use of DD0 and DD2
3 use of DDO, D D 1 and DD2
(8) : Data Descriptor : V : Version number C : Country (see (1) )
(91) : Installation Descriptor : V : Version number
C : Country (see (1))
(10) : Each of the four tracks contains I00 f i l e s numbered 80 t o 99 which gives the following numbering of the f i l e s from 100 to 499.
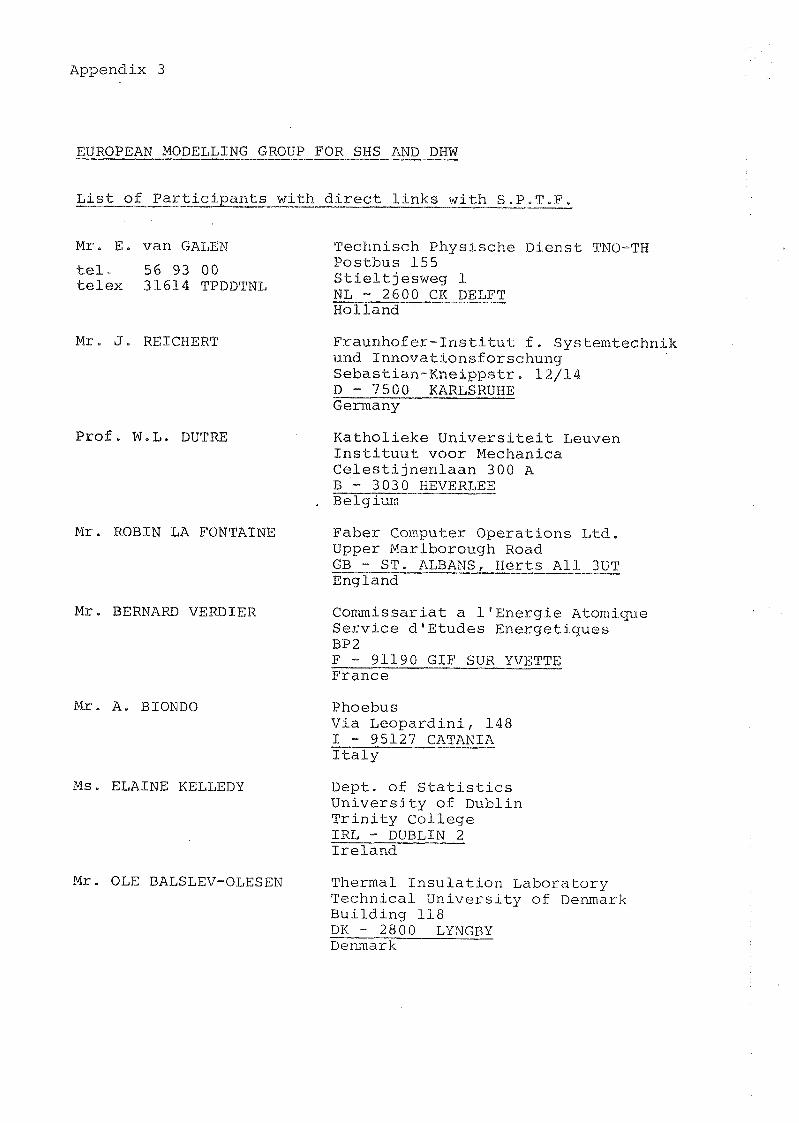
Appendix 3
EUROPEAN MODELLING GROUP FOR SHS AND DHW --
.ToFe
Mr. E. van GWLEN Technisch Physische Dienst TNO-TH
tel. 56 93 00 Postbus l55
telex 31614 TPDDTNE Stieltjesweg L NE - 2600 CK DELPT Holland
Mr. J. REECMERT
Prof. W.L. DUTm
Fraunhofer-Pnstitut f. Systentechnik und Inno~ationsfor~~h~ng Sebastian-Kneippstr. 12/14 B - 7500 KWRLSRUHE Germany
Katholieke Universiteit Eeuven Instituut voor Meehanica Celestijnenlaan 300 A B - 3030 WEVERLEE
. Belgi-an
Mr. ROBIN LA FONTAINE Faber Computer Operations Ltd, Upper Marlborough Road GB - ST. ALBANS, Herts All 3UT England
Mr, BERNARD VERDIER Commissariat a 1'Energie Atomique Service dsEtudes Energetiques BP2 F - 91190 GIF S U K YVETTE France
Mr, A. BIONDO
Ms. ELAINE KEELEDY
Mr. OLE BALSLEV-OLESEN
Phoebus Via Leopardini, l48 1 - 95127 CATANIA Italy
Dept. of Statistics University of Dublin Trinity College IRL - DUBLIN 2 Ireland
Thermal Insulation Laboratory Technical University of Denmark Building 118 DK - 2800 LYNGBY Denmark
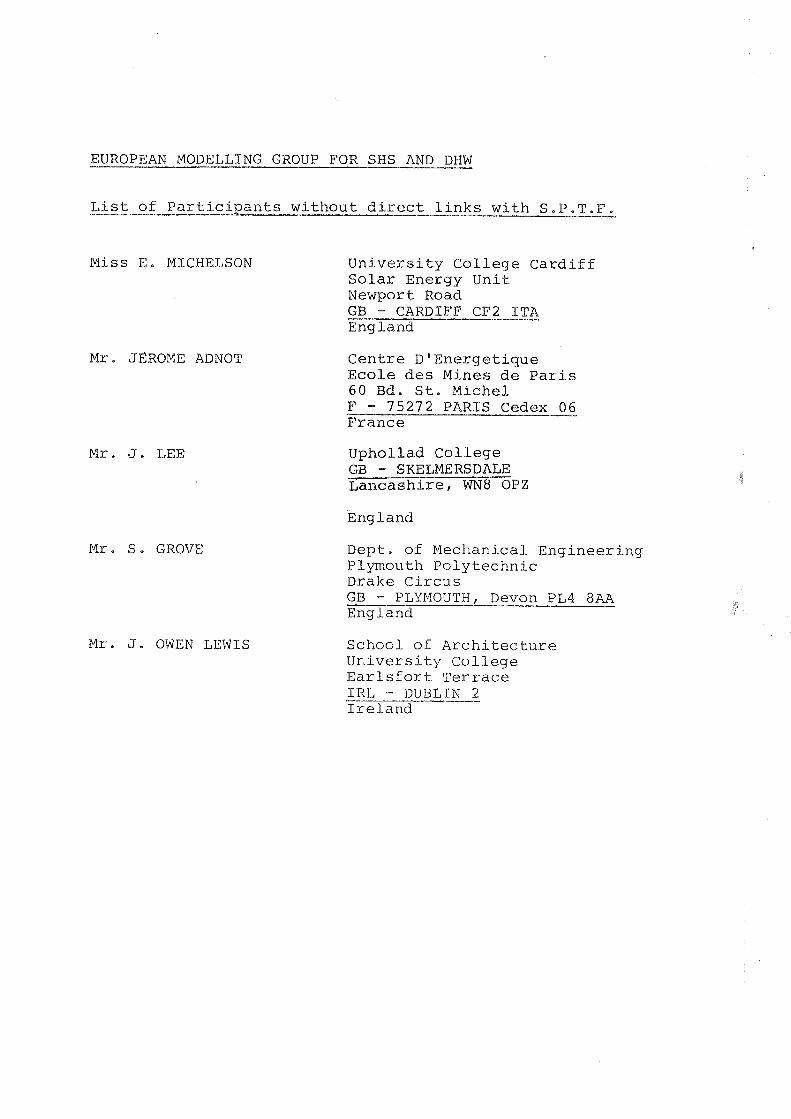
EUROPEAN MODELLING GROUP FOR SHS AND DHW
M i s s E . MICHELSON
M r . JEROME ADNOT
M r . J. LEE
M r . S . GROVE
M r , J, OWEN LEWSS
U n i v e r s i t y C o l l e g e C a r d i f f S o l a r Energy U n i t Newport Road GB - CARDIFF CF2 I T A England
C e n t r e D 8 E n e r g e t i q u e Ecole d e s Mines d e P a r i s 60 Bd. S t . Michel F - 75272 PARIS Cedex 06 France
Uphollad C o l l e g e GB - SKELMERSBALE ~ a n c a s h i r e , WN8 OPZ
England
Dept. of Mechanical E n g i n e e r i n g Plymouth P o l y t e c h n i c Drake C i r c u s GB - PLYMOUTH, Devon PL4 8AA England
School of A r c h i t e c t u r e U r . i v e r s i t y C o l l e g e E a r l s f o r t T e r r a c e I R L - D U B L I N 2 I r e l a n d