Embed Size (px)
Citation preview

General Rights Copyright and moral rights for the publications made accessible in the public portal are retained by the authors and/or other copyright owners and it is a condition of accessing publications that users recognize and abide by the legal requirements associated with these rights.
• Users may download and print one copy of any publication from the public portal for the purpose of private study or research. • You may not further distribute the material or use it for any profit-making activity or commercial gain • You may freely distribute the URL identifying the publication in the public portal
If you believe that this document breaches copyright please contact us providing details, and we will remove access to the work immediately and investigate your claim.
This coversheet template is made available by AU Library Version 1.0, October 2016
Coversheet This is the accepted manuscript (post-print version) of the article. Contentwise, the post-print version is identical to the final published version, but there may be differences in typography and layout. How to cite this publication Please cite the final published version: Jakobsen, M., & Jensen, R. (2015). Common Method Bias in Public Management Studies. International Public Management Journal, 18(1). DOI: 10.1080/10967494.2014.997906
Publication metadata Title: Common Method Bias in Public Management Studies Author(s): Morten Jakobsen & Rasmus Jensen Journal: International Public Management Journal DOI/Link: 10.1080/10967494.2014.997906 Document version: Accepted manuscript (post-print)

1
Common Method Bias in Public Management Studies
Morten Jakobsen Associate professor Aarhus University
Rasmus Jensen
Government Officer Municipality of Copenhagen
Published as: Jakobsen, Morten and Rasmus Jensen. 2015. “Common Method Bias in Public Management
Studies” with Rasmus Jensen. 2015. International Public Management Journal 18(1). doi: 10.1080/10967494.2014.997906
Contact Department of Political Science and Government Aarhus University Bartholins Alle 7, Bygning 1350 8000 Aarhus C E-mail: [email protected] Telephone: +45 8916 5246

2
Common Method Bias in Public Management Studies
Abstract
The questionnaire survey is one of the most commonly used methods of data collection in
public management research. These surveys often provide the information used to
measure both the independent and dependent variables in an analysis. However, this
introduces the risk of common method bias—a serious methodological challenge that has
not received much attention as a distinct topic in public management research. We
discuss the challenge of common method bias in relation to public management studies
and illustrate the problem using an analysis of intrinsic work motivation and sickness
absence. Thereafter, we discuss solutions for reducing common method bias when it is
not possible to use different methods.
Running head: Common Method Bias
Acknowledgements We would like to thank Søren Serritzlew, Lotte B. Andersen, Simon C. Andersen, Editor Steve Kelman and the anonymous reviewers for very helpful comments and suggestions. We also thank Aarhus Municipality for collaboration regarding data collection. Finally, we would like to thank KREVI (The Danish Evaluation Institute for Local Government) and The Danish Council for Independent Research (grant 11-116617) for funding. Tobias Varneskov and Thorbjørn Sejr Nielsen provided excellent assistance with the data collection

3
INTRODUCTION
Numerous studies in public management research use the survey questionnaire as a
method for data collection (Lee, Benoit-Bryan, and Johnson 2012). Furthermore, surveys
often provide the information used to measure both the independent and dependent
variables of an analysis. However, in such cases, the estimated effect of one variable on
another is at risk of being biased because of common method variance; that is, systematic
variance shared among the variables, which is introduced to the measures by the
measurement method rather than the theoretical constructs the measures represent
(Podsakoff et al. 2003; Richardson, Simmering, and Sturman 2009; Podsakoff,
MacKenzie, and Podsakoff 2012).
For example, if the effect of employees’ organizational commitment on
performance is estimated using employees’ perceptions of their own commitment and
performance as measures, the estimated effect may be biased if some respondents
systematically overstate both commitment and performance due to social desirability or a
tendency to evaluate oneself in too positive a manner. In this case, using the same survey
respondent to measure both the independent and dependent variables produces positive
correlation between the two variables. Hence, the estimated effect suffers from common
method bias.1 While the challenge of common method bias has long been recognized in
psychology research and the broader research on organizations, public management
research has paid much less attention to the issue as a distinct topic (Meier and O'Toole
2013a).

4
In this paper, we seek to discuss, evaluate, and further enhance awareness of
potential common method bias in public management studies. Not least, we point towards
different literature in which researchers may seek remedies for reducing common method
bias. First, we discuss two important potential sources of common method bias—
common source bias and bias produced by item characteristics—and how they may
challenge effect estimation. The challenge of common method bias is then exemplified
using an analysis that examines the effect of frontline employees’ intrinsic work
motivation on their short-term sickness absence. Employee work motivation is a key
subject in the public management literature. The effect is estimated using data from a
common source (survey respondents) to measure both intrinsic work motivation and
absence, and the estimated effect is expected to be biased due to the common source as
well as item characteristics. This effect is then compared to the estimated effect when
absence is measured by administrative records; that is, without the common method bias.
Second, we discuss the extent to which the challenge of common method bias is
relevant for the public management literature. We do so by looking at the number of
empirical studies in the literature that use a common source to obtain information on both
the independent and dependent variables; surveying existing investigations of common
method bias in the organizational and public management literatures; and examining the
characteristics of the constructs in the public management literature. Among other things,
we discuss how common method bias may be a potential challenge in relation to
constructs of psychological character, which have (with good reason) become popular in
public management studies, and how it may be a potential challenge when measuring the

5
use of specific management strategies and styles. We also discuss common method bias
in relation to the special case of interaction effects.
Third, we discuss potential strategies that may reduce common method bias
related to common source bias and item characteristics if the independent and/or
dependent variables cannot be measured using different methods. For instance, a panel
data approach that may reduce some of the bias is presented. We also examine the
existing evaluations of the statistical solutions that have been proposed to test and control
for common method bias. On this basis, we conclude that the widely used Harman’s
single factor test is insufficient as a test for common method bias.
We thus seek to contribute to the existing literature in public management
research that focuses specifically on common method bias (Meier and O´Toole 2013a;
2013b; Favero & Bullock 2014) by drawing from fields with longer traditions of
examining common method bias and solutions to it; exemplifying the challenge and
remedies; and evaluating potential problems in relation to the empirical public
management literature.
COMMON METHOD BIAS
In recent decades, empirical research within psychology and organization studies has
devoted considerable attention to the concept of common method variance and how it
may bias the results of empirical analyses that use respondents or raters as data sources.
Following Doty and Glick (1998, 374), common method variance “occurs when the
measurement technique introduces systematic variance into the measures.” Likewise,

6
Richardson, Simmering, and Sturman (2009, 763) define common method variance as
“systematic error variance shared among variables measured with and introduced as a
function of the same method and/or source.”
This systematic error variance can bias the estimated relationships between
measures (e.g., Campbell and Fiske 1959); that is, it can cause common method bias. In
the case of bias in the estimated relationship between two variables, the common method
can be thought of as a confounding (or third) variable that influences both of the
substantive variables in a systematic way. This may either inflate or deflate the observed
relationship between the substantive variables of interest.
Using the comprehensive reviews in Podsakoff et al. (2003), Podsakoff,
MacKenzie, and Podsakoff (2012), and MacKenzie and Podsakoff (2012) of the
longstanding discussion of common method variance in the psychology and organization
literatures as reference, we may distinguish between at least four sources of common
method bias: (a) bias produced by using a common source, e.g. a survey respondent or
rater, to provide information on both the independent and dependent variables; (b) bias
produced by item characteristics; (c) bias produced by item context; and (d) bias
produced by measurement contexts.2 While all four may be relevant to public
management studies, we focus on the first two of these (bias produced by a common
source and item characteristics), which have attracted much of the attention in the
literature on common method bias.
Common Source Bias

7
Using the same survey respondent (i.e., a common source) to provide information for the
measures of both the independent variable and the dependent variable is an important
potential cause of common method bias (Podsakoff et al. 2003). Specifically, common
method bias may arise from certain tendencies that respondents apply, or that impact their
responses, systematically across different measures when answering a survey. Hence,
much attention has been given to such response bias, or what Paulhus (1991, 17)
describes as “a systematic tendency to respond to a range of questionnaire items on some
basis other than the specific content (i.e., what the items were designed to measure).”
A well-known response tendency is social desirability, which refers to a
respondent’s tendency to give answers that make him or her look good (Paulhus 1991;
Ganster, Hennessey, and Luthans 1983). For example, if we survey leaders about the
degree to which they use a popular or in-fashion leadership style, we should consider
whether they may overstate their usage of this leadership style because of social
desirability. This might also be a problem if these managers were asked to evaluate the
performance of their organization. Managers who attach high importance to social
desirability might overstate both usage of the leadership style and performance, while
managers with low social desirability will not make these exaggerations. In this case,
social desirability is a confounder that affects the answers to both leadership style and
performance, which inflates the estimated correlation between the two constructs.
Common method bias may also be produced by the tendency of respondents to
provide consistent answers across items (a consistency motif— e.g., Podsakoff et al.
2003). Another response tendency consists of a person’s pervasive view of him/herself

8
and the world in general, which is captured by the concepts of positive and negative
affectivity (Watson and Clark 1984). Negative affectivity concerns the individual’s
predisposition to experience negative emotions, whereas positive affectivity is related to
positive emotionality. According to Watson and Clark (1984), positive and negative
affectivity constitute two separate dimensions. Furthermore, common method bias may
arise from some respondents’ tendency to use (or avoid using) the extreme choices on a
response scale (Bachman and O'Malley 1984) and the tendency to agree (or disagree)
with attitude statements regardless of content (acquiescence and disacquiescence—e.g.,
Baumgartner and Steenkamp 2001).
An important characteristic of many response tendencies is that they, according to
existing research, are highly stable across time. For example, this is the case for social
desirability (Crowne and Marlowe 1960; Furnham 1986), positive and negative
affectivity (Watson and Clark 1984), extreme responding (Bachman and O'Malley 1984),
and acquiescence (Billiet and Davidov 2008). As detailed below, this can be exploited
when trying to reduce common method bias caused by a common source. However, it is
important to note that not all common method bias is stable across time. Thus, common
method bias may also be produced by a respondent’s transient mood state, which may
affect a respondent’s answers to questions about both the independent and dependent
variable (Podsakoff et al. 2003).
Item Characteristics

9
Common method bias may also be produced by the characteristics of a survey item.
Importantly, an item is more likely to produce method bias if it makes the task of
responding difficult because the item is complex, ambiguous, or abstract (Podsakoff,
MacKenzie, and Podsakoff 2012). As formulated by Podsakoff et al. (2003, 883): “The
problem with ambiguous items is that they often require respondents to develop their own
idiosyncratic meanings of them. This may either increase random responding or increase
the probability that respondents’ own systematic response tendencies (…) may come into
play.” For example, the task of responding may be difficult when items ask about
retrospective states, which may be difficult to remember, or when respondents are asked
to rate themselves on processes taking place inside their minds, such as their emotions,
motivation, and attitudes. Hence, in addition to being caused by item formulation, item
complexity may also be a factor of abstractness in the construct or notion itself (Doty and
Glick 1998).
The difficulty of responding to different items does not necessarily need to stem
from the same kind of ambiguity or abstractness (e.g., recall difficulty, abstract
constructs, or confusing item wording) in order to produce common method bias in item
correlations. The point is that a difficult responding task makes respondents uncertain
about how to answer on the basis of the item content, which increases the likelihood that
their systematic response tendencies will influence their answer (Podsakoff, MacKenzie,
and Podsakoff 2012).
Furthermore, several contributions have argued that method bias can be produced
if the item wording elicits socially desirable responses (e.g., Nederhof 1985; Perry 1996),

10
if the scale properties are similar across different items (Podsakoff et al. 2003), or if items
are only positively or only negatively worded (Podsakoff, MacKenzie, and Podsakoff
2012). Hence, there are a number of item characteristics that may produce method bias,
and they are not solely results of item formulation.
In the next section, we provide an example of how common method bias may
challenge the results of empirical studies. The example features a study in which we may
expect bias because of a common source as well as some difficulty in the task of
responding to the applied items. After the example, we move on to discussing the extent
to which common method bias is a relevant problem for public management studies.
A STUDY OF INTRINSIC WORK MOTIVATION AND SICKNESS ABSENCE
The empirical study presented here illustrates the potential challenge of common method
bias by examining the effect of employees’ intrinsic work motivation on their sickness
absence. The work motivation of public employees has become a key subject in the
public management literature in recent decades. Whereas the traditional view of public
employees tended to see them as motivated by their own economic interests, such as
budget- and slack-maximizing (e.g., Niskanen 1971), growing streams in the literature
focus on how public employees may be motivated by other factors, such as serving
society (captured by the notion of public service motivation; e.g., Perry, Hondeghem, and
Wise 2010) or intrinsic work motivation (e.g., Le Grand 2003).
Intrinsic motivation refers to people performing an activity because they find it
interesting and derive satisfaction from the activity itself (Gagné and Deci 2005, 331).

11
Since high intrinsic work motivation is expected to cause high work effort, it is likely that
intrinsic motivation reduces employees’ short-term sickness absence. As noted by
Markussen (2010), in many cases of less serious sickness, there is room for subjective
judgment by the employee regarding whether he or she is able to work, or to take
sickness leave. This judgment is expected to be influenced by the employee’s motivation
to work (Rhodes and Steers 1990). We focus on short-term sickness absenteeism (less
than one week), as the health literature on the topic often assumes that short-term
sickness absence is more related to employee attitudes, whereas long-term absenteeism is
suggested to be more related to ill health and inability to perform work tasks (Janssen et
al. 2003).
The effect is examined using a survey administered to 244 Danish childcare
employees working in childcare centers in 2011 (76 percent responded). The employees
provide childcare for preschool children (0-6 years), which includes taking care of the
children, participating in play activities, and teaching. In Denmark, childcare centers are
usually organized within the public sector and managed by municipalities. The study
includes employees from 19 centers. Of these, 13 are purely public, i.e., managed by the
local government; five are semi-public, i.e., publicly financed but partly managed by a
board of parents within the municipality’s guidelines (the employees are considered
public employees); and one is privately managed. Each center has a day-to-day manager,
who, like most of the employees, is trained as a preschool teacher. The centers usually
have between five and 20 employees. Compared to the length of childcare employees’
education (averaging 3.5 years of higher education), their salary and promotion
12
opportunities are often limited. Hence, childcare employees are often expected to be
motivated by other factors (e.g., working with children, teaching, or the possibility of
working part-time). The majority of these employees work part-time (62% in the present
study).
The survey provides a measure of intrinsic work motivation and a subjective self-
reported measure of sickness absence during the preceding seven months. Four items
were used to measure work motivation. They are presented in the left-hand column in
Table 1 (see Items 1-4). The respondents stated whether they agreed or disagreed with the
statements on a 5-point Likert scale (1. Strongly agree, 2. Agree, 3. Neither/Nor, 4.
Disagree, 5. Strongly disagree). The items were recoded so a high value represented high
intrinsic work motivation. The four items were combined into an additive index (0-10, 10
= high intrinsic work motivation). A factor analysis of the four items reveals one
dimension, and the Cronbach’s Alpha of the index is 0.73.
The subjective measure of sickness absence was obtained by the same survey. The
employees indicated the number of days they had been absent from work due to sickness
during the past seven months. In practice, they chose between different intervals of days:
“0”, “1-2”, or “3-5.” Respondents indicating a number larger than 5 (48 workers) were
dropped from the analysis in order to include only the short-term absence spells. Thus,
there are three categories of self-reported absence (1=“0 days,” 2=“1-2 days,” and 3=“3-5
days”). Additional analyses that include long-term sickness as well are also reported in
the results section.

13
However, there are at least two sources of common method bias that potentially
distort the estimated effect of motivation on absence. First, since data on both work
motivation and sickness absence is obtained by a common source (the individual
employees), the estimated effect may potentially contain common source bias. The bias
may be produced by social desirability, as we expect it to be more socially accepted for
the childcare workers in this setting to be more intrinsically motivated than motived by,
for example, pay or promotion. Moreover, based on an ongoing public focus on short-
term absence among public employees in the context of the study, we would expect it to
be more socially desirable to state no short-term sickness absence.
Second, common method bias may be produced and inflated by the item
characteristics—in particular, the task difficulty and abstractness of the items may be a
source of method bias. For many employees it may be difficult to remember the number
of days they have been absent due to sickness, and this may be particularly difficult for
short-term sickness absence. Likewise, the four items measuring motivation are, like
most motivation items, abstract in nature, which makes it difficult to tap the precise
construct of interest. Thus, following the arguments of, among others, Doty and Glick
(1998) and Podsakoff, MacKenzie, and Podsakoff (2012), the complexity and difficulty
of answering the absence and motivation items may enhance the influence of the
employees’ own systematic response tendencies (e.g., acquiescent or extreme response
styles).
In addition to this, common method bias may be produced if some employees
tend to select the first response category presented. This is sometimes referred to as a
14
type of primacy effect, which occurs most often in self-administered surveys such as the
one used in the present example (Ayidiya and McClendon 1990). The motivation items
all have the same answering scale format (i.e., “1. Strongly agree,” “2. Agree”…) and
three of the four applied motivation measures are positively loaded (see Items 1-3 in
Table 1). Furthermore, the absence categories are ascending from left to right (i.e., “0”,
“1-2”…). Hence, a tendency to select the first response category among some employees
would produce a spurious correlation in which employees appearing to be strongly
motivated would also appear to be less absent.
The effect estimated using the subjective measure of absence can be compared to
the effect when absence is measured by administrative records; that is without the
common source and item characteristics described above. To do this, we used the
administrative records of sickness absenteeism covering the same period of time as the
subjective measure. The administrative data was recoded into the same three categories
as the subjective measure (0, 1-2, or 3-5 days).
Table 1 shows the simple, bivariate correlations of Goodman and Kruskal’s
Gamma between each of the work motivation items and the subjective and administrative
measures of absence, respectively. A negative correlation indicates that high intrinsic
motivation is associated with low absence. Except for Item 4 of work motivation (the
only negatively loaded motivation item), the correlations between work motivation and
subjective absence are clearly higher than the correlation between work motivation and
the administrative absence measure. This indicates a substantial common method bias
when both motivation and absence are measured by the survey. As expected, the

15
estimated effect of motivation on the subjective measure is less inflated—yet still
stronger than the effect estimated using the administrative records—when long-term
sickness absence is included in the analysis. Additional analyses (not shown), including
long-term absence, estimate the Goodman and Kruskal’s Gamma between the four
motivation items and the subjective absence measures to be -0.17, -0.12, -0.11, and -0.08
compared to -0.02, -0.02, -0.05, and -0.05 when using the administrative absence
measure.
[Table 1 about here]
Table 2 presents the results of an analysis that explains absence by the work
motivation index, controlled for different factors that may also influence absence (such as
gender, age, and working part-time). Ordered logistic regressions are used since absence
is ordinally scaled, and clustered robust standard errors are applied as the employees are
clustered in centers. Model I uses the subjective absence measure as its dependent
variable, and Model II the administrative measure.
Table 2 shows that work motivation has a significant effect on absence when
using the subjective measure in Model I (p<0.05), but there is no significant effect when
using the administrative measure as the dependent variable (see Model II). The effect of
work motivation on absence is substantially higher when using the subjective measure—
even enough to make the effect significant in spite of the low number of observations. On
the other hand, even if an interval scaled version of the administrative absence measure
(number of days absent) is used, which is more fine-grained than recoding absence into
three categories, intrinsic work motivation still does not have a statistically significant

16
effect on absence (not shown). Again, the estimated effect of motivation on subjective
absence is smaller when long-term sickness is included (-0.21, p=0.12).
[Table 2 about here]
It is important to keep in mind that the results should not be interpreted to mean
that common method bias will always be a problem when using data from surveys to
measure both the independent and dependent variables. Nor should it be interpreted to
mean that common method bias will always be a problem in analyses of work motivation
and sickness absence. The results serve as an example of how common method bias may
be a challenge in survey studies. It is also important to note that common method bias is
not only a potential cause for concern when examining effects of independent variables
on dependent variables. It is relevant for any estimation of correlation. For instance,
Johnson, Rosen, and Djurdjevic (2011) emphasize that common method bias may affect
the interrelationships among the indicators of a construct.
PUBLIC MANAGEMENT STUDIES AND POTENTIAL COMMON METHOD BIAS
Although there is a growing awareness of common method bias, it has not received much
attention as a distinctive topic in the public management literature (for exceptions, see
Meier and O’Toole 2013a; Meier and O’Toole 2013b; Favero and Bullock 2014).
However, common method bias is likely to be a challenge in this literature for three
reasons. First, surveys are an important tool for data collection in contemporary public
management research, and often the same survey respondent (i.e., the same source)
supplies the information used to measure both the independent and dependent variables.

17
Second, we may expect common method bias to be a problem based on the existing
empirical studies on the topic in public management research and the related, broader
research in the literature on organizations and psychology. And third, part of the
constructs applied in public management research is likely to be susceptible to common
method bias. This section provides further context for the relevance of these three claims.
To look at the significance of worries about common source bias in public
management research, we reviewed the empirical studies published in four prominent
public administration/management journals (American Review of Public Administration,
International Public Management Journal, Journal of Public Administration Research
and Theory, and Public Administration Review) in 2011 and 2012. First, we coded the
proportion of articles including empirical studies that use survey data. Second, we coded
the proportion of the survey data studies that use the same survey respondent to provide
the information on both independent and dependent variables.3 The results are shown in
Table 3. 266 articles included an empirical study, and 147 of those (55.3 %) included one
or more surveys. Of the 147 studies including surveys, a little more than half (79) used
the same survey respondent to provide information on both independent and dependent
variables. Some of the studies mention or discuss the risk of common method bias and
some also seek to measure or correct for the potential bias through the survey design or
statistical remedies (e.g., Hassan and Rohrbaugh 2011; Kim 2011). As Table 3 shows, the
survey is a valuable tool for public management research, and often the survey
respondent provides the information used to measure both independent and dependent

18
variables, which underscores the relevance of investigating the extent of common method
bias in the field.
[Table 3 about here]
However, while the use of surveys makes it relevant to investigate common
method bias, it does not say anything about whether common method bias actually exists
or whether it is a serious problem in the literature. Therefore, we now turn to the existing
empirical evidence on method bias (cf., the second claim outlined above, p. XX). As
there are few studies within the public management literature devoted to estimating the
extent of common method bias, a good alternative starting point may be to consult the
related literatures of organizational research and psychology, which have a longer
tradition of attention to this problem.
In a recent review, Podsakoff, MacKenzie, and Podsakoff (2012) refer to a
number of meta-studies that estimate the extent to which method bias affects the
estimated correlation between constructs: Lance et al. (2009) estimates that correlations
between constructs are inflated by 60 percent due to method bias, whereas the percent of
inflation due to method bias is 92 in Doty and Glick (1998), 38 in Buckley, Cote, and
Comstock (1990), and 45 in Cote and Buckley (1987). This leads Podsakoff, MacKenzie,
and Podsakoff (2012, 545) to conclude that “regardless of which estimate is used, the
bottom line is that the amount of method bias is substantial.” Doty and Glick (1998, 374)
reach a similar conclusion, although they note that “this level of bias is cause for concern
but does not invalidate many research findings.” Moreover, there are also researchers
who argue that the bias is exaggerated (see, e.g., Spector 2006).
19
Podsakoff, MacKenzie, and Podsakoff (2012) also review specific types of
method bias. Namely, they evaluate common source bias via a summary of meta-studies
comparing correlations on a specific topic (e.g., the effect of organizational commitment
on job performance) obtained by the same source versus correlations obtained by
different sources. On seven specific topics related to organizational research, the
estimated percent inflation in correlations due to the common source are 239, 212, 148,
208, 133, 304, and 184 (p. 546). This also indicates that extent of common method bias
may be very different from topic to topic.
If we turn to the public management literature, Meier and O’Toole (2013a; 2013b)
have conducted some of the most comprehensive empirical investigations of common
method bias. They focus mainly on common source bias in analyses of the performance
of public organizations. Using data from Texas school superintendents, they estimated
the effects of different public management constructs (e.g., strategy, buffering, diversity,
and network management) on subjective performance indicators measured in the same
questionnaire. Then, these effects were compared to the effects estimated by using the
actual performance of the organizations as the dependent variable. This allowed them to
assess the magnitude of common source bias. Although the presence of common source
bias varied from dimension to dimension, their overall assessment is that “[u]sing several
hundred public organizations …, the empirical illustration shows that perceptual
measures of organizational performance by organization members can and frequently do
lead to spurious results in scholarly research” (Meier and O'Toole 2013a, 430). In

20
particular, they found that general and vague formulations in measures of performance
are more vulnerable to common source bias than tight, focused items.
Another approach to the question of potential common method bias in public
management studies is to look at the topics and constructs of the literature on a more
theoretical basis. In some cases the nature of the constructs, and the items used to
measure them, may cause us to expect a substantial amount of common method bias, in
other cases less bias is expected. If the independent variable of an analysis is the
respondent’s gender, common method bias seems less likely since the variable is
generally easy for respondents to answer, and we would expect few people to lie about
their gender. In contrast, if both the independent and dependent variables of an analysis
are evaluations, attitudes, or feelings that are difficult to indicate in a survey (i.e., they are
more abstract in nature) or if they are susceptible to, for example, social desirability
responding, this would be a cause for concern about common method bias. An example is
the correlation between transformational leadership and leader-member exchange when
both constructs are measured by the same survey respondents. As Wang et al. (2005)
note, estimation of this relationship may be affected by common method bias. Both
transformational leadership and leader-member exchange is likely to be susceptible to
positive/negative affectivity as well as social desirability.
In between these extremes lie cases where we in some case may expect more bias,
but in other cases, we may expect less or no bias. For example, if people are asked to
state their income or educational level. People may find it difficult to precisely indicate
this, but most people have an idea where about to place themselves. Yet, their answers

21
may also be susceptible to some social desirability. Another example would be the
relationship between managers’ perceptions of own managerial skills and their attitudes
towards decentralization of hiring competence in an organization. In this case,
perceptions of own managerial skills are expected to be susceptible to positive/negative
affectivity and social desirability; however, attitudes towards decentralization are not.
Therefore, in this case the estimated correlation between the two constructs is not
expected to be particular affected by common method bias due to positive/negative
affectivity or social desirability.
Yet another example is the correlation between respondents’ attitude on the
legitimacy of congressional intervention in an agency’s rulemaking regulatory decisions
and their public service motivation. While public service motivation measured by a
survey is likely to be affected by, for example, social desirability (Perry 1996), there is
less reason to expect that attitude on the legitimacy of congressional intervention is
susceptible to such bias. Hence, even though both constructs of a relationship consist of
evaluations, attitudes, or feelings, common method bias is not necessarily a big problem.
It is important to note that the extent to which the nature of a construct causes its
measurement to be susceptible to positive/negative affectivity, social desirability,
abstractness, and so on is a matter of degree rather than bias is present or not. Yet, there
are good reasons to be particularly aware of, and assess the extent of, common method
bias in cases of measuring psychological dimensions. Because there, a present, are no
simple statistical tests that provide a reliable estimate of the extent of common method

22
bias, theoretical assessments of bias based on the nature of the constructs are important
when evaluating whether common method bias is an problem or not in a given analysis.
Should we expect some of the important topics and constructs applied in public
management research to be susceptible to common method bias (cf., the third claim
above)? While it may be worthwhile to discuss method bias in relation to different topics,
we will use as starting point a claim that recurs in the literature on common method bias:
that bias may be produced by abstractness, ambiguity, and complexity associated with
responding to given survey items.
Abstractness is often high when respondents are asked to rate themselves or
others on processes taking place inside people’s minds, such as motivation, commitment,
trust, and attitudes (for example, Perry [1996, 8-9] makes this point in relation to
motivation). Such constructs of psychological character are essential to understanding
public management and have received much attention in the literature, especially in
studies of public employees. Moreover, these constructs are often measured by surveys.
For example, as Kjeldsen (2012) notes, surveys have been an important tool for
measuring public service motivation, and many studies in this stream of research devote
attention to the potential challenge of common method bias.
In addition to the element of abstractness, there may also be a risk of social
desirability influence on self-reported ratings of motivation, commitment, trust, and
attitudes. For example, Perry (1996) notes that measuring public service motivation may
be susceptible to social desirability. Stating that one is motivated by serving society is, in
many contexts, regarded as socially desirable—and probably more socially desirable than

23
motivation driven by self-interest. Consequently, Perry’s study made extensive efforts to
reduce potential method bias when constructing items measuring different dimensions of
public service motivation.
Abstractness and ambiguity may also be a relevant concern even when
respondents are asked about the performance, organization, practices, or policies of
public organizations. Public management researchers often need such information, and
surveys offer a tool for collecting it from a large number of units. In spite of being less
abstract than, for example, motivation and commitment, such dimensions may also be
difficult to measure without ambiguity and complexity, and could therefore be another
potential source of common method bias.
In particular, when the applied items are general, vague and leave room for
respondents to define the concept of interest, we would expect them to be susceptible to
method bias. Serritzlew (2002) points this out by examining survey measures of
municipalities’ budgeting principles. First, he uses a general question to measure
budgeting principles (managers were asked to indicate the principle applied from a list of
different budgeting principles). Second, he asks specific questions about very concrete
practices and routines in the development of the municipalities’ budgets, which reveals
the applied budgeting principles. The difference between the general and the specific
measures are striking. According to the responses to the general questions, the (less in-
fashion) incremental budgeting method is only used in a small percentage of the
municipalities (3-21 percent, depending on policy area), but the incremental method was

24
revealed to be practiced in more than half of the municipalities when specific measures
were used to measure budgeting principles.
A likely interpretation of the difference is that the general measure leaves ample
space for the respondents to define what the principle means. At best, this leads to an
increase in random noise in the measure. At worst, it enhances the influence of given
response tendencies among the respondents and results in common method bias in
correlations. Hence, if some management practice is in fashion, it may be socially
desirable to report using that practice—just as it may socially desirable to report better
performance than an objective evaluation reveals—which would inflate the correlation
between use of the practice and performance. In sum, there seem to be both good
theoretical and empirical reasons for the public management literature to direct attention
to the possibility of common method bias in survey studies and, as far as possible, to
make efforts to reduce it.
Interaction Effects
Some of the important research questions and hypotheses of public management research
include interaction effects. Hence, we are often interested in, for example, if the effect of
a management strategy is contingent on one or more factors, such as organizational size,
characteristics of the employees, and so on. This raises the question of whether common
method bias is also a challenge in relation to interaction effects.
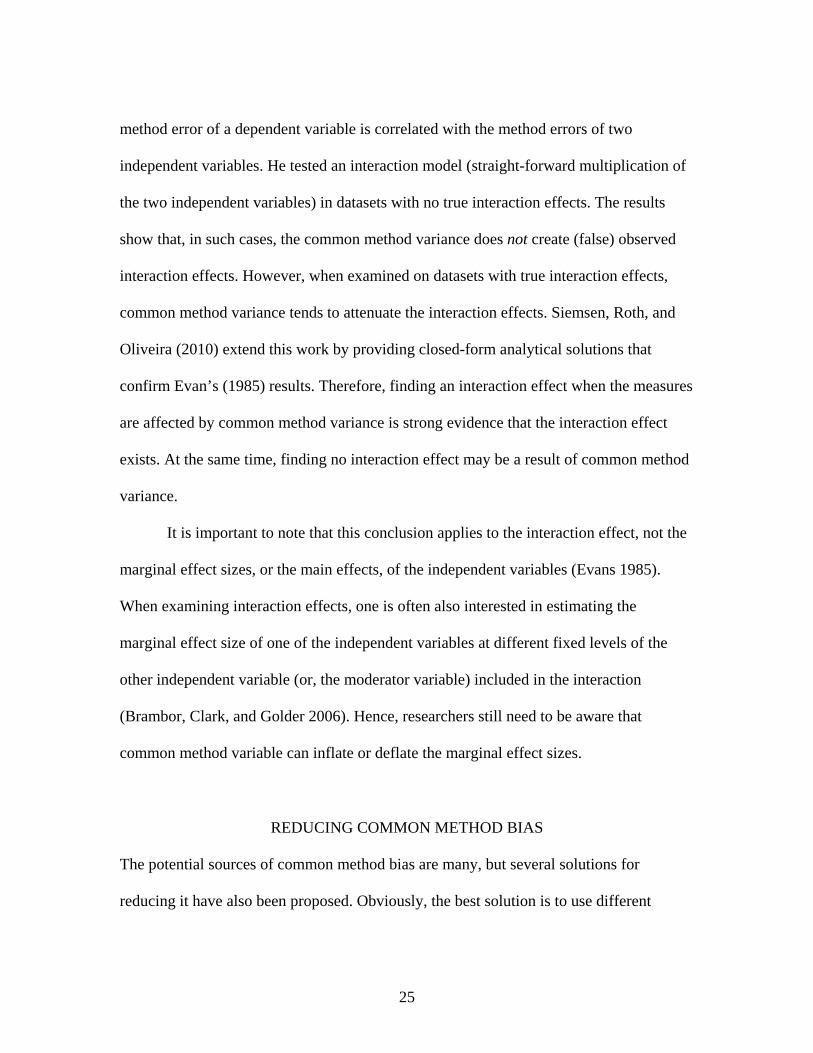
Although scholarly contributions on this special case are few, the conclusions are
consistent. Evans (1985) conducted a large number of different simulations, in which the
25
method error of a dependent variable is correlated with the method errors of two
independent variables. He tested an interaction model (straight-forward multiplication of
the two independent variables) in datasets with no true interaction effects. The results
show that, in such cases, the common method variance does not create (false) observed
interaction effects. However, when examined on datasets with true interaction effects,
common method variance tends to attenuate the interaction effects. Siemsen, Roth, and
Oliveira (2010) extend this work by providing closed-form analytical solutions that
confirm Evan’s (1985) results. Therefore, finding an interaction effect when the measures
are affected by common method variance is strong evidence that the interaction effect
exists. At the same time, finding no interaction effect may be a result of common method
variance.
It is important to note that this conclusion applies to the interaction effect, not the
marginal effect sizes, or the main effects, of the independent variables (Evans 1985).
When examining interaction effects, one is often also interested in estimating the
marginal effect size of one of the independent variables at different fixed levels of the
other independent variable (or, the moderator variable) included in the interaction
(Brambor, Clark, and Golder 2006). Hence, researchers still need to be aware that
common method variable can inflate or deflate the marginal effect sizes.
REDUCING COMMON METHOD BIAS
The potential sources of common method bias are many, but several solutions for
reducing it have also been proposed. Obviously, the best solution is to use different

26
methods/sources to measure different dimensions of interest (Podsakoff, MacKenzie, and
Podsakoff 2012). For example, a survey could be used to measure one variable and
administrative data to measure the other.
However, these approaches are far from always possible. What can researchers do
to reduce common method bias when using different methods/sources is not an option? It
is outside the scope of this paper to provide a full review of all proposed remedies.
Instead, we first point to some of the oft-suggested design and statistical remedies for
reducing common method bias and point to literature that elaborates on these and provide
reviews of remedies. Second, we provide an example of one strategy that uses a panel
data (fixed effects) design to eliminate the part of respondents’ common source bias that
is stable across time.
Designing Surveys
An important part of minimizing common method bias via survey design involves
reducing method bias in the individual items (e.g., if the individual items in a correlation
do not induce social desirability responding, the correlation estimate is less affected by
common method bias caused by social desirability). Therefore, many suggestions for
reducing common method bias are similar to the general recommendations for designing
survey items.
A comprehensive discussion of how researchers can reduce common method bias
when designing surveys can be found in Makenzie and Podsakoff (2012), who emphasize
that respondents must have both ability and motivation to answer in order to reduce bias.4
27
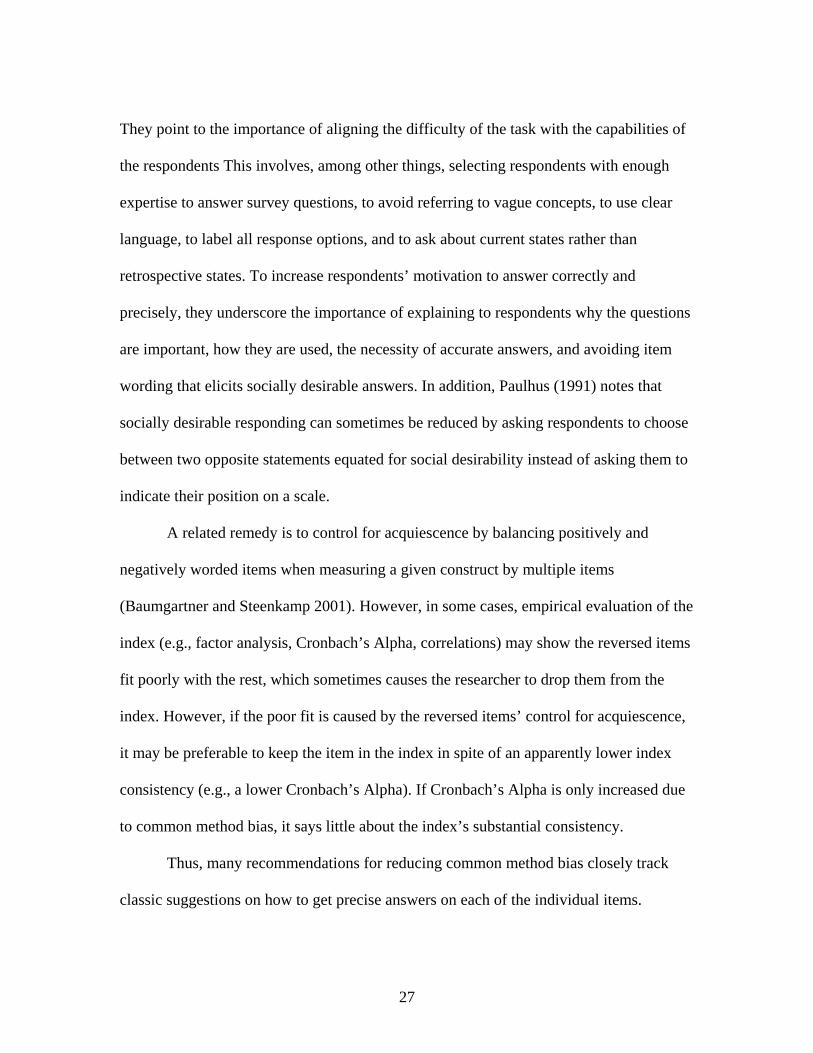
They point to the importance of aligning the difficulty of the task with the capabilities of
the respondents This involves, among other things, selecting respondents with enough
expertise to answer survey questions, to avoid referring to vague concepts, to use clear
language, to label all response options, and to ask about current states rather than
retrospective states. To increase respondents’ motivation to answer correctly and
precisely, they underscore the importance of explaining to respondents why the questions
are important, how they are used, the necessity of accurate answers, and avoiding item
wording that elicits socially desirable answers. In addition, Paulhus (1991) notes that
socially desirable responding can sometimes be reduced by asking respondents to choose
between two opposite statements equated for social desirability instead of asking them to
indicate their position on a scale.
A related remedy is to control for acquiescence by balancing positively and
negatively worded items when measuring a given construct by multiple items
(Baumgartner and Steenkamp 2001). However, in some cases, empirical evaluation of the
index (e.g., factor analysis, Cronbach’s Alpha, correlations) may show the reversed items
fit poorly with the rest, which sometimes causes the researcher to drop them from the
index. However, if the poor fit is caused by the reversed items’ control for acquiescence,
it may be preferable to keep the item in the index in spite of an apparently lower index
consistency (e.g., a lower Cronbach’s Alpha). If Cronbach’s Alpha is only increased due
to common method bias, it says little about the index’s substantial consistency.
Thus, many recommendations for reducing common method bias closely track
classic suggestions on how to get precise answers on each of the individual items.

28
However, some suggestions have been introduced specifically to reduce common method
bias. For example, it has been suggested that common method bias may be reduced by
introducing separation in the survey between measures of the independent and dependent
variables (Podsakoff, MacKenzie, and Podsakoff 2012). Such separation may, for
example, be a time delay between a respondent’s answers. However, one major drawback
of is time delay strategy is that much of method bias seems to be stable across time
(Weijters, Geuens, and Schillewaert 2010).
Another suggestion aimed specifically at reducing common method bias is to
avoid common scale properties (Podsakoff, MacKenzie, and Podsakoff 2012), that is,
avoiding use of similar scale types, anchor labels, etc. for different items. According to
Feldman and Lynch (1988), respondents will use cognition generated in answering one
question when answering subsequent questions if they perceive the response formats to
be similar, which increases common method bias. This suggestion is interesting, as it
goes against conventional practice in most public management studies; namely, save
space and make it easy for respondents to answer by applying common scale formats.
However, this should be weighed against the cost of potential increases in common
method bias.
Statistical Tests and Remedies
Measuring Directly the Important Sources of Common Method Bias
Common method bias may still be a concern in spite of efforts to reduce it in the design
phase, and several statistical solutions have been proposed to test and control for common
29
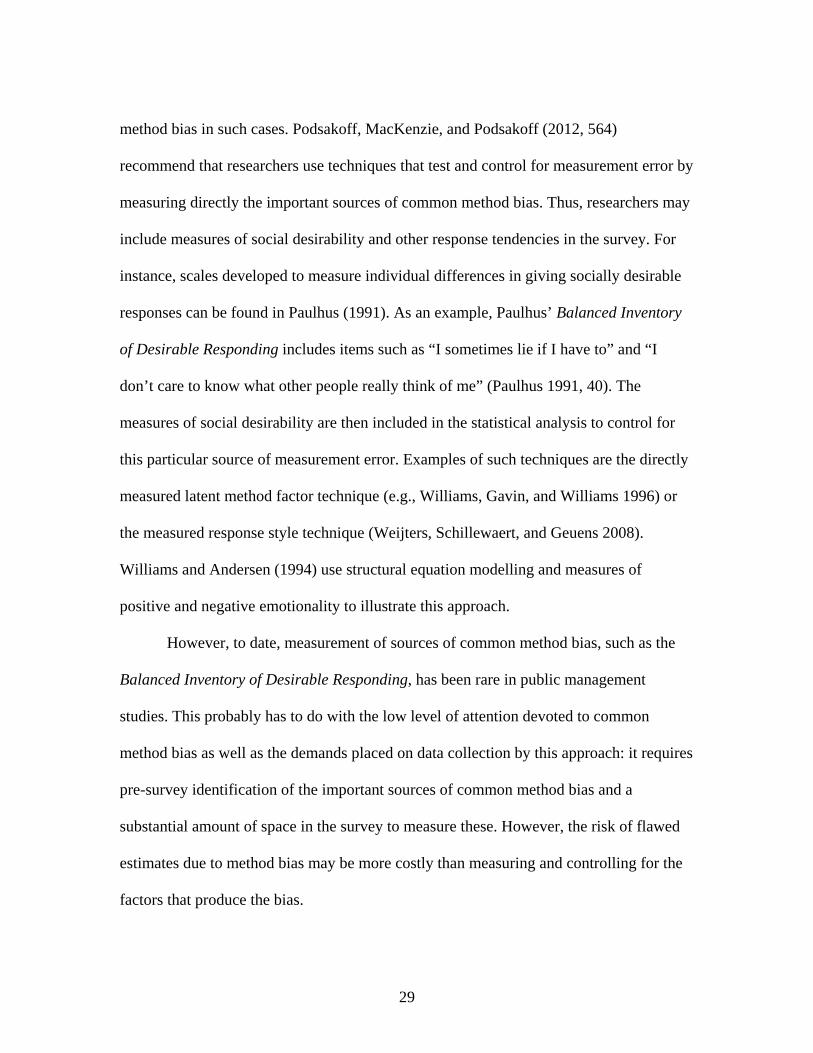
method bias in such cases. Podsakoff, MacKenzie, and Podsakoff (2012, 564)
recommend that researchers use techniques that test and control for measurement error by
measuring directly the important sources of common method bias. Thus, researchers may
include measures of social desirability and other response tendencies in the survey. For
instance, scales developed to measure individual differences in giving socially desirable
responses can be found in Paulhus (1991). As an example, Paulhus’ Balanced Inventory
of Desirable Responding includes items such as “I sometimes lie if I have to” and “I
don’t care to know what other people really think of me” (Paulhus 1991, 40). The
measures of social desirability are then included in the statistical analysis to control for
this particular source of measurement error. Examples of such techniques are the directly
measured latent method factor technique (e.g., Williams, Gavin, and Williams 1996) or
the measured response style technique (Weijters, Schillewaert, and Geuens 2008).
Williams and Andersen (1994) use structural equation modelling and measures of
positive and negative emotionality to illustrate this approach.
However, to date, measurement of sources of common method bias, such as the
Balanced Inventory of Desirable Responding, has been rare in public management
studies. This probably has to do with the low level of attention devoted to common
method bias as well as the demands placed on data collection by this approach: it requires
pre-survey identification of the important sources of common method bias and a
substantial amount of space in the survey to measure these. However, the risk of flawed
estimates due to method bias may be more costly than measuring and controlling for the
factors that produce the bias.

30
Harman’s Single-Factor Test
The literature on common method bias also includes suggestions on how researchers may
attempt to test and control for bias in cases where they do not have measures of the
factors producing common method bias. A popular procedure to test for the presence of
common method bias is Harman’s single-factor test, which, in contrast to the other
statistical procedures, only aims to test for bias; not to control for it. This test loads all
items that are suspected to be affected by the common method into an explorative factor
analysis to see if a single factor emerges or a general factor accounts for the majority of
covariance between the measures; if neither is the case, it is taken as evidence that
common method bias is not a major issue (Chang, Witteloostuijn, and Eden 2010).
Sometimes a confirmatory factor analysis (CFA) is used to conduct the test.
Although the single factor test is easy to apply, it is insufficient because, as
Chang, Witteloostuijn, and Eden (2010, 181) note “It is unlikely that a single-factor
model will fit the data, and there is no useful guideline as to what would be the
acceptable percentage of explained variance of a single-factor model” (see also Podsakoff
et al. 2003; Craighead et al. 2011; MacKenzie and Podsakoff 2012). Thus, even if the
common method variance is not strong enough to produce a single factor among
constructs that are not causally correlated, it may be strong enough to produce a sizeable
observed correlation between the constructs. Moreover, even if a single factor emerges
from the factor analysis, it may be a result of lacking discriminant validity or a causal
relationship between the constructs, not necessarily common method bias (Podsakoff et

31
al. 2003). In addition to this, the single factor test is sensitive to the number and types of
items and constructs included in the test. Hence, it is more likely that several factors will
emerge when the number of variables is increased (Podsakoff and Organ 1986). It is also
more likely that several factors will emerge if the included variables are not causally
related to one another. In sum, the single factor test is insufficient with regard to testing
for problems of common method bias.
Marker and Latent method factor techniques
Recently, several other approaches have been proposed for testing and controlling for
common method bias in cases where the sources of bias cannot be measured. They
include the unmeasured latent method factor technique, the correlation-based marker
technique, the regression-based marker technique, the instrumental variable technique,
and the CFA marker technique (Podsakoff, MacKenzie, and Podsakoff 2012). For
example, the correlation-based marker technique (1) identifies a “marker variable” that is
theoretically unrelated to at least one of the substantive variables, but susceptible to the
same common method variance, and (2) uses the smallest observed positive correlation
between the marker variable and the substantive variables as a measure of the common
method bias (Lindell and Whitney 2001).
In order to address problems associated with the correlation-based marker
technique, the CFA marker technique uses a series of items as a measure of a latent
method factor and uses confirmatory factor analyses in the attempt to identify and control
for the method bias. A comprehensive introduction to the CFA marker technique is found

32
in Williams, Hartman, and Cavazotte (2010). They also provide an empirical example in
which they estimate the correlations between leader–member exchange, job complexity,
and role ambiguity among employees of an organization. To test for common method
bias they use perceptions of benefit administration (i.e. how benefits are distributed to
employees by an organization) as a marker variable. Specifically, they use a number of
items measuring benefit administration as indicators of a latent method factor.
Furthermore, Williams, Hartman, and Cavazotte (2010, 506) argue that benefit
administration constitutes an appropriate marker variable as “LMX [leader-member
exchange], job complexity, and role stress, would not seem to be related through any
substantively driven mechanism to perceptions related to employee benefits (which
instead would be driven by features of the reward and compensation system).” Moreover,
they argue that correlation between benefit administration and the three substantive
variables could exist due to certain response tendencies.
Although techniques such as the correlation-based marker technique, the CFA
marker technique, and the unmeasured latent method factor technique are less data-
demanding than measuring the sources of method bias, even the most promising of these
techniques have a number of serious drawbacks. For example, locating appropriate
markers is a significant challenge related to the marker techniques. It will often be
difficult to justify that a marker variable is theoretically unrelated to a substantive
variable, but susceptible to the same amount of common method variance. It is outside
the scope of this paper to provide a full overview and discussion of these drawbacks

33
(such overviews can be found in Richardson, Simmering, and Sturman 2009; Podsakoff,
MacKenzie, and Podsakoff 2012).
Based on a comprehensive evaluation of the unmeasured latent method factor,
correlation-based marker, and CFA marker techniques, Richardson, Simmering, and
Sturman (2009) do not recommend these statistical techniques as a means for correcting
common method bias. However, they do point to the CFA marker technique as a means
for providing some evidence about the presence of common method variance, but only
when researchers can be reasonably confident they have used an appropriate marker.
Furthermore, they do not see the CFA marker technique as a definitive mechanism for
identifying common method variance. In cases where the source of bias cannot be
measured, Podsakoff, MacKenzie, and Podsakoff (2012, 564) point to the CFA marker
technique, the common method factor technique, or the instrumental variable technique;
they also, however, underscore important drawbacks of these tests.
Brewer’s Split Sample Method
This approach aims to remove common source bias by using one sample of respondents
to measure the independent variable and another to measure the dependent variable. It
was outlined by Brewer (2006) and applies to studies using individuals to examine
organizational characteristics. Hence, it requires that several respondents provide
information on each of the organizations included in the study. Brewer (2006, 46-47)
presents the approach in the following way: “Survey respondents are randomly assigned
to two groups so that different groups can be utilized to measure the independent and
34
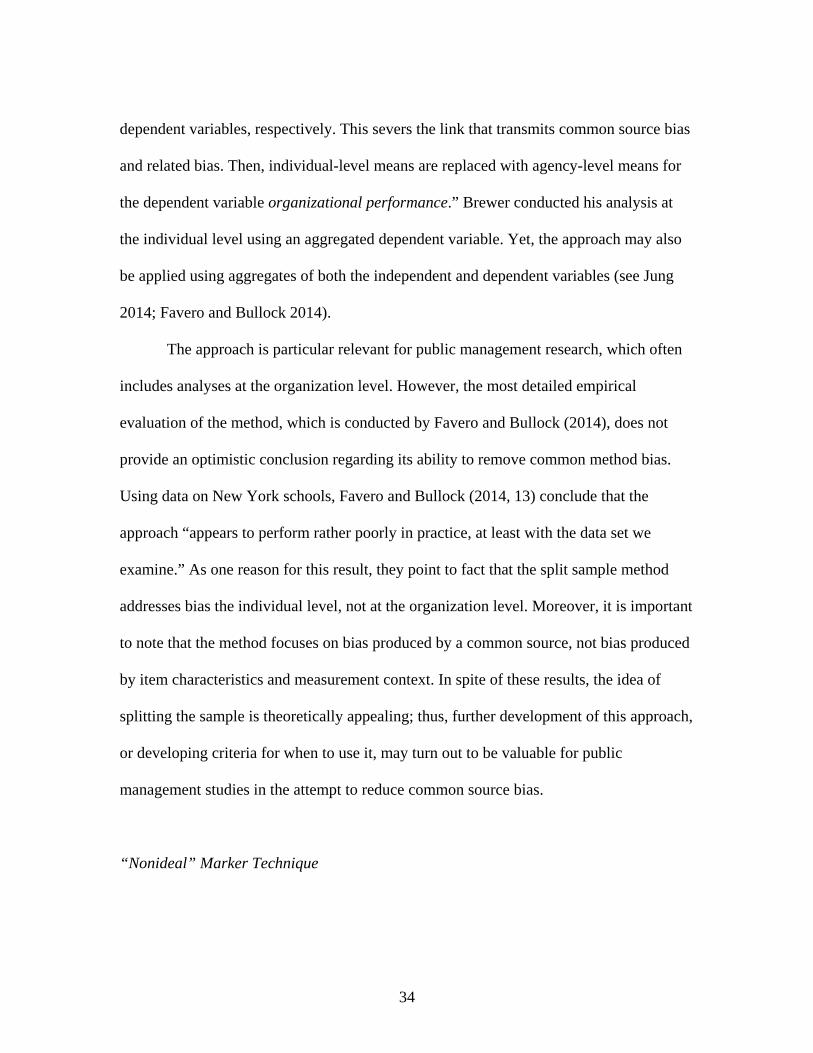
dependent variables, respectively. This severs the link that transmits common source bias
and related bias. Then, individual-level means are replaced with agency-level means for
the dependent variable organizational performance.” Brewer conducted his analysis at
the individual level using an aggregated dependent variable. Yet, the approach may also
be applied using aggregates of both the independent and dependent variables (see Jung
2014; Favero and Bullock 2014).
The approach is particular relevant for public management research, which often
includes analyses at the organization level. However, the most detailed empirical
evaluation of the method, which is conducted by Favero and Bullock (2014), does not
provide an optimistic conclusion regarding its ability to remove common method bias.
Using data on New York schools, Favero and Bullock (2014, 13) conclude that the
approach “appears to perform rather poorly in practice, at least with the data set we
examine.” As one reason for this result, they point to fact that the split sample method
addresses bias the individual level, not at the organization level. Moreover, it is important
to note that the method focuses on bias produced by a common source, not bias produced
by item characteristics and measurement context. In spite of these results, the idea of
splitting the sample is theoretically appealing; thus, further development of this approach,
or developing criteria for when to use it, may turn out to be valuable for public
management studies in the attempt to reduce common source bias.
“Nonideal” Marker Technique

35
In a recent article, Rutherford and Meier (2014) argued for adopting a conservative
approach. They use a measure of common source bias that is constructed by those items
from their study that are expected to be susceptible to common source bias, even though
the items are also expected to be theoretically related to the substantive variables (in
Rutherford and Meier’s study, the items of the common sources bias measure were also
used to measure the substantive dimensions). A somewhat similar approach is applied by
Favero, Meier, and O’Toole (forthcoming) to purge out potential halo effects when
estimating the effect of internal management practice on the performance of New York
schools. They construct a measure of the halo-effect by factor analyzing all items that
include responses about the school’s general administrative practices, characteristics, and
performance. Like the Rutherford and Meier study, the items used in the halo-effect
measure are expected to be theoretically related to the substantive measures. This
approach is akin to what Richardson, Simmering, and Sturman (2009, pp. 767-69) refer
to as a marker technique using a “nonideal” marker (i.e., a marker that may be
theoretically related to the substantive variables and therefore remove some of the
substantial effect). Thus, the argument is that if one still finds an effect even if the
common method factor has removed both the common method bias and some of the
substantial effect, it is evidence that there is some effect.
If we remove a substantive effect in order to correct for method bias that will be a
problem too. Yet, if researchers find an effect using data susceptible to common method
bias, it may be worthwhile examining whether that effect holds using a more conservative
analysis strategy such as including “nonideal” markers. It is important to note that the

36
conservativeness of the approach depends on how it is conducted and what variables are
chosen as “nonideal” markers. It should also be noted that further empirical evaluations
of this approach are needed in order to establish its usefulness.
Summary of Statistical Tests and Remedies
In sum, based on the existing evaluations of statistical techniques for testing and
controlling for common method bias, approaches in which the sources of method bias are
measured directly are preferable. Hence, the evaluations of approaches in which the
sources of method bias cannot be measured directly are not particularly optimistic. For
example, the Harman’s single factor test is not recommended.
The CFA marker technique may provide some evidence on the presence of
common method variance, but it seems less useful for estimating how, and the extent to
which, the results are biased by any common method variance (see Richardson,
Simmering, and Sturman 2009, note the distinction between common method variance
and bias, see also Footnote 1). This also implies that the CFA marker technique does not
seem to perform well as a means for correcting bias. Moreover, it may often be hard to
locate appropriate markers. Therefore, approaches such as the unmeasured latent method
factor technique or the marker techniques, in which the sources of method bias cannot be
measured directly, seem not, in their present state, to be useful as decisive tests for
whether or not common method bias is a problem in a given dataset.
Finally, the split sample method and using “nonideal” makers remain to be
examined and developed further in order to establish their possible value. Yet, in cases

37
where researchers find an effect in data susceptible to common method bias and no ideal
markers are available, using a “nonideal” marker to test that effect in a stricter way seems
fruitful. Of course, researchers still have to find a marker that captures the different types
common method bias expected to distort the estimated effects.
A Panel Data Approach
Another statistical remedy to reduce common method bias, which is rarely included in the
existing evaluations of statistical remedies (for an exception, see Favero and Bullock
(2014), consists of using panel data. Existing research shows that a part of common
method bias is stable across time. This can be exploited to reduce common method bias.
A useful feature of panel data is that it can be used to control out all factors that are time-
invariant—thus, control out all method bias that is stable across time. Panel data consists
of repeated observations of the respondents at different time points.5 To control out time-
invariant factors, a fixed effects model is applied, which corresponds to including dummy
variables for each of the respondents in the model (Verbeek 2008, 359-62).6 Therefore,
any respondent characteristics that do not change between the surveys are held constant.
The following example shows how a panel data design may be applied to estimate
the effect of public employees’ perceived support from their organization (in this case, a
municipality) on their felt obligation to work hard to help the organization reach its goals.
The theoretical basis for this effect is outlined in Eisenberger et al. (2001). Yet common
method bias may affect this estimation as a consequence of social desirability, and neither
perceived support nor felt obligation seems to be directly measurable by sources other

38
than employees’ own statements. Examining Danish public childcare employees’ felt
obligation and perceived support, we use panel data to remove the part of the method bias
that is stable across time. The employees were surveyed in 2008 and 2010.
In Table 4, the effect sizes of two regression analyses using regular cross-section
design on the 2008 and 2010 data are compared with the effect size estimated by a fixed
effects model using the panel data (2008 and 2010). The results from the two cross-
section models (I and II) in Table 4 show that POS has a significant and strong effect in
both 2008 and 2010, with effect sizes of 0.78 and 0.67, respectively. In the fixed effects
model (III), felt obligation has an effect of 0.59. Hence, when time-invariant factors,
including time-invariant factors’ response tendencies, are controlled out, the effect is
reduced.
[Table 4 about here]
Like the other possible solutions, the fixed effects approach has limitations. First, it
places a large demand on data collection. This means that the approach would in most
cases not be preferable if its sole purpose was to reduce common method bias (measuring
the sources of bias would often be a better solution in such cases). However, there may be
many reasons for applying the panel data design, and reduction of common method bias
adds to the combined value of the approach. Second, it requires change in the
independent variables between the included time points (i.e., within-subjects variation
across time). Furthermore, it cannot control for unobserved characteristics that vary
between surveys (e.g., transient mood). Nor can it control for events between surveys or
changes in context that produce method bias in one survey but not in the other. Hence,
39
although empirical evidence suggests that some types of method bias are highly stable
across time, we do not have such evidence for all of the many types of method bias. This
corresponds with an evaluation of the approach by Favero and Bullock (2014) who find
that the approach appears to “produce fewer spurious relationships (…), but there are still
some false positives” (p. 16). Nonetheless, the panel data design may be an option to
remove part of common method bias.
CONCLUSION
Surveys constitute an important source of information in contemporary public
management research, and surveys often provide measures of both the independent and
dependent variables in an analysis. However, this may produce common method bias
when estimating the correlation between the variables—an issue that seems to have
received less attention as a topic in the public management research compared to the
broader organizational, as well as the psychology, literature.
There are good reasons to take the risk of common method bias seriously in
public management research. This conclusion is based on our discussion of common
method bias in relation to topics and important constructs in the public management
literature, our survey of empirical studies in the literature that use a common source to
obtain information on both the independent and dependent variables, and our review of
existing empirical investigations of common method bias in the organizational and public
management literatures. The challenges were also illustrated by an empirical study of
work motivation and sickness absence. In the empirical example, the effect of intrinsic

40
motivation on sickness absence was large and statistically significant when both
motivation and absence were measured by a survey of employees. In contrast, the effect
was smaller and not statistically significant when using an administrative measure of
absence—that is, without common source bias. Neither the discussion nor the empirical
example should be taken as evidence that common method bias is always present, but it
nevertheless appears worthwhile to investigate method bias much further than previously
done.
The examination of common method bias in relation to interaction effects are based
on contributions that are few in number but consistent with regard to their conclusions.
Thus, common method variance does not create or inflate interaction effects. In contrast,
common method variance can attenuate interaction effects. Therefore, if one finds an
interaction effect when common method variance is present, it should be taken as strong
evidence that the interaction effect exists. It important to note that this conclusion applies
to the interaction effect, not the marginal effect sizes.
Based on the organizational and psychology literatures, we also discussed the
suggestions on how to reduce common method bias. These include both remedies related
to survey design and statistical procedures. Most of the evaluations of common method
bias point to the design phase as key to reducing common method bias. A comprehensive
discussion of how researchers can reduce common method bias when designing surveys
can be found in Makenzie and Podsakoff (2012). Some suggestions for reducing common
method bias, such as avoiding common response scale properties for different items, go
against other survey design recommendations as well as conventional practice in

41
contemporary public management research. Another example concerns the internal
consistency among the items used in an index. Sometimes, empirical evaluation of the
index shows that reversed items fit poorly with the rest of the items, which may cause
researchers to drop the reversed items from the index. However, if the poor fit is caused
by the reversed items’ control for acquiescence, it may be preferable to keep the item in
the index in spite of an apparently lower index consistency (e.g., a lower Cronbach’s
Alpha).
With regard to the statistical tests and controls for common method bias,
techniques that include measures of the factors causing common method bias (e.g.,
measures of social desirability or negative affectivity) are recommended. In their current
state of development, techniques that test and control for common method bias without
measuring the sources of common method bias seem to have important drawbacks.
Specifically, we regard the Harman’s single factor test and the unmeasured latent method
factor technique as insufficient when testing for the presence of common method bias.
The CFA marker technique may provide some indication on the presence or absence of
common method variance, which may contribute to the overall evaluation of common
method bias in the analysis. However, the CFA marker technique does not seem to
perform well as a means for correcting bias. Moreover, it may often be difficult to locate
appropriate markers. Consequently, the marker techniques seem not, in their present
state, to be useful as decisive tests for whether or not common method bias is a problem
in a given dataset. Yet, in cases where researchers find an effect in data susceptible to
common method bias and no appropriate markers are available, using a “nonideal”

42
marker (that removes both bias and part of the substantial relationship) to test that effect
in a stricter way seems to be a compelling way to, if the effect remains, add robustness to
the conclusion that there is an effect. However, the reliability of this approach has still to
be further evaluated.
At present, the best way to reduce common method bias, when it is not possible to
use different methods/sources to measure the independent and dependent variables, is
through survey design as well as measuring directly the important sources of common
method bias. In addition, we presented an example of how panel data designs and fixed
effects estimations can provide one type of correction that removes the part of common
method bias that is time-invariant. Moreover, the best way to evaluate the risk of
common method bias when the sources of bias are not measured directly seems to be
based on theoretical considerations about the nature of the constructs being measured,
thorough considerations of the survey design, and existing empirical evidence on
common method bias related to specific survey measures and correlations of these.7
NOTES
1 We use the term common method bias to denote the bias in an estimated correlation
between two variables produced by common method variance (see also Doty and Glick
1998; Podsakoff et al. 2003; Podsakoff, MacKenzie, and Podsakoff 2012; MacKenzie
and Podsakoff 2012).
2 Method is viewed in a broader manner and common method bias can be produced by
different elements of a survey data collection. For narrower definitions and further

43
discussions on the concept of method, see Spector and Brannick (2009).
3 The review includes only research articles.
4 Makenzie and Podsakoff (2012) outline remedies for dealing with seven conditions that
may cause method bias by decreasing the ability to answer, sixteen conditions related to
motivation, and three dimensions related to respondents’ tendency to satisfy.
5 Both the independent and dependent variables are measured at each time point. The
panel data approach outlined here should not be confused with the separation approach
described earlier, which uses measures of the independent variable at one time point and
the dependent variable at another in order to reduce temporary method bias (e.g.,
transient mood).
6 A similar way to hold the time-invariant characteristics constant is to use a first-
differences model in which individual-specific, one-period changes in the dependent
variable are explained by individual-specific, one-period changes in the independent
variable (Cameron and Trivedi 2005). For an example, Oberfield (2012) uses this logic to
difference out unobserved time-invariant characteristics of public organizations when
examining the effects of leadership style. The first-difference estimator uses the same
logic as the fixed effects model, and it produces the same results as the fixed effects
model in the case of two time points.
7 For example, Meier and O'Toole (2013a) provide such evidence on measures of public
organization performance.

44
REFERENCES Ayidiya, S. A. and M. J. McClendon. 1990. “Response Effects in Mail Surveys.” The
Public Opinion Quarterly 54: 229-247. Bachman, J. G. and P. M. O'Malley. 1984. “Yea-Saying, Nay-Saying, and Going to
Extremes: Black-White Differences in Response Styles.” The Public Opinion Quarterly 48: 491-509.
Baumgartner, H. and J. B. Steenkamp. 2001. “Response Styles in Marketing Research: A Cross-National Investigation.” Journal of Marketing Research 38: 143-156.
Billiet, J. B. and E. Davidov. 2008. “Testing the Stability of an Acquiescence Style Factor Behind Two Interrelated Substantive Variables in a Panel Design.” Sociological Methods and Research 36: 542-562.
Brambor, T., W. R. Clark, and M. Golder. 2006. “Understanding Interaction Models: Improving Empirical Analyses”. Political Analysis 14: 63-82.
Brewer, G. 2006. All Measures of Performance are subjective. Pp. 35-54 Boyne, G. A., K. J. Meier, L. J. O’Toole, and R. M. Walker Public Service Performance: Perspectives on Measurement and Management. Cambridge UK: Cambrudge University Press.
Brief, A. P., M. J. Burke, J. M. George, B. S. Robinson, and J. Webster. 1988. “Should Negative Affectivity Remain an Unmeasured Variable in the Study of Job Stress?” Journal of Applied Psychology 73: 193-198.
Buckley, M. R., J. A. Cote, and S. M. Comstock. 1990. “Measurement Errors in the Behavioral Sciences: The Case of Personality/Attitude Research.” Educational and Psychological Measurement 50: 447-474.
Cameron, A. C. and P. K. Trivedi. 2005. Microeconometrics: Methods and Applications. Cambridge University Press.
Campbell, D. T. and D. W. Fiske. 1959. “Convergent and Discriminant Validation by the Multitrait-Multimethod Matrix.” Psychological Bulletin 56: 81-105.
Cote, J. A. and M. R. Buckley. 1987. “Estimating Trait, Method, and Error Variance: Generalizing Across 70 Construct Validation Studies.” Journal of Marketing Research 24: 315-318.
Chang, S. J., A. v. Witteloostuijn, and L. Eden. 2010. “From the Editors: Common Method Variance in International Business Research.” Journal of International Business Studies 41: 178-184.
Craighead, C. W., D. J. Ketchen, K. S. Dunn, and G. G. Hult. 2011. “Addressing Common Method Variance: Guidelines for Survey Research on Information Technology, Operations, and Supply Chain Management.” IEEE Transactions on Engineering Management 58: 578-588.

45
Cronbach, L. J. 1946. “Response Sets and Test Validity.” Educational and Psychological Measurement 6: 475-494.
Crowne, D. P. and D. Marlowe. 1960. “A New Scale of Social Desirability Independent of Psychopathology.” Journal of Consulting Psychology 24: 349-354.
Doty, D. H. and William H. Glick. 1998. “Common Methods Bias: Does Common Methods Variance Really Bias Results?” Organizational Research Methods 1: 374-406.
Eisenberger, R., S. Armeli, B. Rexwinkel, P. D. Lynch, and L. Rhoades. 2001. “Reciprocation of Perceived Organizational Support.” Journal of Applied Psychology 86: 42-51.
Evans, Martin G. 1985. A Monte Carlo study of the effects of correlated method variance in moderated multiple regression analysis. Organizational Behavior and Human Decision Processes 36: 305-323.
Favero, N. and J. B. Bullock. 2014. “How (Not) to Solve the Problem: An Evaluation of Scholarly Responses to Common Source Bias.” Journal of Public Administration Research and Theory: Advance access, doi: 10.1093/jopart/muu020.
Feldman, J. M. and J. G. Lynch. 1988. “Self-Generated Validity and Other Effects of Measurement on Belief, Attitude, Intention, and Behavior.” Journal of Applied Psychology 73: 421-435.
Furnham, A. 1986. “Response Bias, Social Desirability and Dissimulation.” Personality and Individual Differences 7: 385-400.
Ganster, D. C., H. W. Hennessey, and F. Luthans. 1983. “Social Desirability Response Effects: Three Alternative Models.” Academy of Management Journal 26: 321-331.
Hassan, S. and J. Rohrbaugh. 2011. “The Role of Psychological Climate on Public Sector Employees' Organizational Commitment: An Empirical Assessment for Three Occupational Groups.” International Public Management Journal 14: 27-62.
Janssen, N., I. J. Kant, G. M. H. Swaen, P. P. M. Janssen, and C. A. P. Schröer. 2003. “Fatigue as a Predictor Of Sickness Absence: Results from the Maastricht Cohort Study on Fatigue at Work.” Occupational and Environmental Medicine 60: i71-i76.
Johnson, R. E., C. C. Rosen, and E. Djurdjevic. 2011. “Assessing the Impact of Common Method Variance on Higher Order Multidimensional Constructs.” Journal of Applied Psychology 96: 744–761.
Jung, C. S. 2014. “Organizational Goal Ambiguity and Job Satisfaction in the Public Sector.” Journal of Public Administration Research and Theory 24: 955-981.
Kim, S. 2011. “Testing a Revised Measure of Public Service Motivation: Reflective versus Formative Specification.” Journal of Public Administration Research and Theory 21: 521-546.

46
Kjeldsen, A. M. 2012. “Sector and Occupational Differences in Public Service Motivation: A Qualitative Study.” International Journal of Public Administration 35: 58-69.
Lance, C. E., Baranik, L. E., Lau, A. R., and Scharlau, E. A. 2009. “If it Ain't Trait it Must be Method: (Mis)application of the Multitrait-Multimethod Methodology in Organizational Research.” Pp. 337-360 C. E. Lance and R. J. Vandenberg, eds., Statistical and Methodological Myths and Urban Legends: Doctrine, Verity, and Fable in Organizational and Social Research. New York: Routledge.
Le Grand, J. 2003. Motivation, Agency, and Public Policy: Of Knights and Knaves, Pawns and Queens. Oxford: Oxford University Press.
Lee, G., J. Benoit-Bryan, and T. P. Johnson. 2012. “Survey Research in Public Administration: Assessing Mainstream Journals with a Total Survey Error Framework.” Public Administration Review 72: 87-97.
Lindell, M. K. and D. J. Whitney. 2001. “Accounting for common method variance in cross-sectional research designs.” Journal of Applied Psychology 86: 114-121.
Markussen S. 2010. “The Discresionary Nature of Sick Leave.” Frisch Centre. http://www.frisch.uio.no/publikasjoner/pdf/Thediscretionarynatureofsickleave.pdf
MacKenzie, S. B. and P. M. Podsakoff. 2012. “Common Method Bias in Marketing: Causes, Mechanisms, and Procedural Remedies.” Journal of Retailing 88: 542-555.
Meier, K. J. and L. J. O'Toole. 2013a. “Subjective Organizational Performance and Measurement Error: Common Source Bias and Spurious Relationships.” Journal of Public Administration Research and Theory 23: 429-456.
Meier, K. J. and L. J. O'Toole. 2013b. “I Think (I Am Doing Well), Therefore I Am: Assessing the Validity of Administrators' Self-Assessments of Performance.” International Public Management Journal 16: 1-27.
Nederhof, A. J. 1985. “Methods of Coping with Social Desirability Bias: A Review.” European Journal of Social Psychology 15: 263-280.
Niskanen, W. A. 1971. Bureaucracy and Representative Government. Chigaco and New York: Aldine-Atherton.
Oberfield, Z. W. 2012. “Public Management in Time: A Longitudinal Examination of the Full Range of Leadership Theory.” Journal of Public Administration Research and Theory. Advance access: doi:10.1093/jopart/mus060.
Paulhus, D. L. 1991. “Measurement and Control of Response Bias.” Pp. 17-60 J. P. Robinson and P. R. Shaver, eds., Measures of Personality and Social Psychological Attitudes. San Diego: Academic Press.
Perry, J. L. 1996. “Measuring Public Service Motivation: An Assessment of Construct Reliability and Validity.” Journal of Public Administration Research and Theory 6: 5-22.

47
Perry, J. L., A. Hondeghem, and L. R. Wise. 2010. “Revisiting the Motivational Bases of Public Service: Twenty Years of Research and an Agenda for the Future.” Public Administration Review 70: 681-690.
Podsakoff, P. M. and D. W. Organ. 1986. “Self-Reports in Organizational Research: Problems and Prospects.” Journal of Management 12: 531-544.
Podsakoff, P. M., S. B. MacKenzie, L. Jeong-Yeon, and N. P. Podsakoff. 2003. “Common Method Biases in Behavioral Research: A Critical Review of the Literature and Recommended Remedies.” Journal of Applied Psychology 88: 879-903.
Podsakoff, P. M., S. B. MacKenzie, and N. P. Podsakoff. 2012. “Sources of Method Bias in Social Science Research and Recommendations on How to Control It.” Annual Review of Psychology 63: 539-569.
Richardson, H. A., M. J. Simmering, and M. C. Sturman. 2009. “A Tale of Three Perspectives: Examining Post Hoc Statistical Techniques for Detection and Correction of Common Method Variance.” Organizational Research Methods 12: 762-800.
Rhodes, S. R. and R. M. Steers. 1990. Managing employee absenteeism. Reading, MA: Addison-Wesley.
Rutherford, A. and K. J. Meier. 2014. “Managerial Goals in a Performance-Driven System: Theory and Empirical Tests in Higher Education.” Public Administration: Advance access, doi: 10.1111/padm.12124.
Serritzlew, S. 2002. ”Ritualer og realiteter i den kommunale budgetlægning.” Pp. 139-162 J. Blom-Hansen, F. Bruun, and T. Pallesen, eds., Kommunale Patologier. Copenhagen: Systime.
Siemsen, Enno, Aleda Roth, and Pedro Oliveira. 2010. “Common Method Bias in Regression Models With Linear, Quadratic, and Interaction Effects.” Organizational Research Methods 13: 456-476.
Spector, P. E. 2006. “Method Variance in Organizational Research.” Organizational Research Methods 9: 221-232.
Spector, P. E. and M. T. Brannick. 2009. “Common Method Variance or Measurement Bias? The Problem and Possible Solutions.” Pp. 346-362 C. L. Cooper and I. T. Robertson, eds., The Sage Handbook of Organizational Research Methods, 10th edition. London: Sage.
Verbeek, M. 2008. A Guide to Modern Econometrics, 3rd edition. Chichester: John Wiley and Sons.
Wang, Hui, Kenneth S. Law, Rick D. Hackett, Duanxu Wang, and Zhen X. Chen. 2005. “Leader-Member Exchange as a Mediator of the Relationship Between Transformational Leadership and Followers' Performance and Organizational

48
Citizenship Behavior.” Academy of Management Journal 48: 420-432. Watson, D. and L. A. Clark. 1984. “Negative Affectivity: The Disposition to Experience
Negative Aversive Emotional States.” Psychological Bulletin 96: 465-490. Weibel, A., K. Rost, and M. Osterloh. 2010. “Pay for Performance in the Public Sector:
Benefits and (Hidden) Costs.” Journal of Public Administration Research and Theory 20: 387-412.
Weijters, B., M. Geuens, and N. Schillewaert. 2010. “The Individual Consistency of Acquiescence and Extreme Response Style in Self-Report Questionnaires.” Applied Psychological Measurement 34: 105-121.
Weijters, B., N. Schillewaert, and M. Geuens. 2008. “Assessing Response Styles Across Modes of Data Collection.” Journal of the Academy of Marketing Science 36: 409-422.
Williams, L. J. and S. E. Anderson. 1994. “An Alternative Approach to Method Effects by Using Latent-Variable Models: Applications in Organizational Behavior Research.” Journal of Applied Psychology 79: 323-331.
Williams, L. J., M. B. Gavin, and M. L. Williams. 1996. “Measurement and Nonmeasurement Processes with Negative Affectivity and Employee Attitudes.” Journal of Applied Psychology 81: 88-101.
Williams, L. J., N. Hartman, and F. Cavazotte. 2010. “Method Variance and Marker Variables: A Review and Comprehensive CFA Marker Technique.” Organizational Research Methods 13: 477-514.