Embed Size (px)
Citation preview

Common Core Math III Unit 1:
STATISTICS!
Three main topics in CCM3 with one additional topic for CCM3 Honors:
Normal Distributions
Sampling and Study Design
Estimating Population Parameters
Expected Value and Fair Game (H)
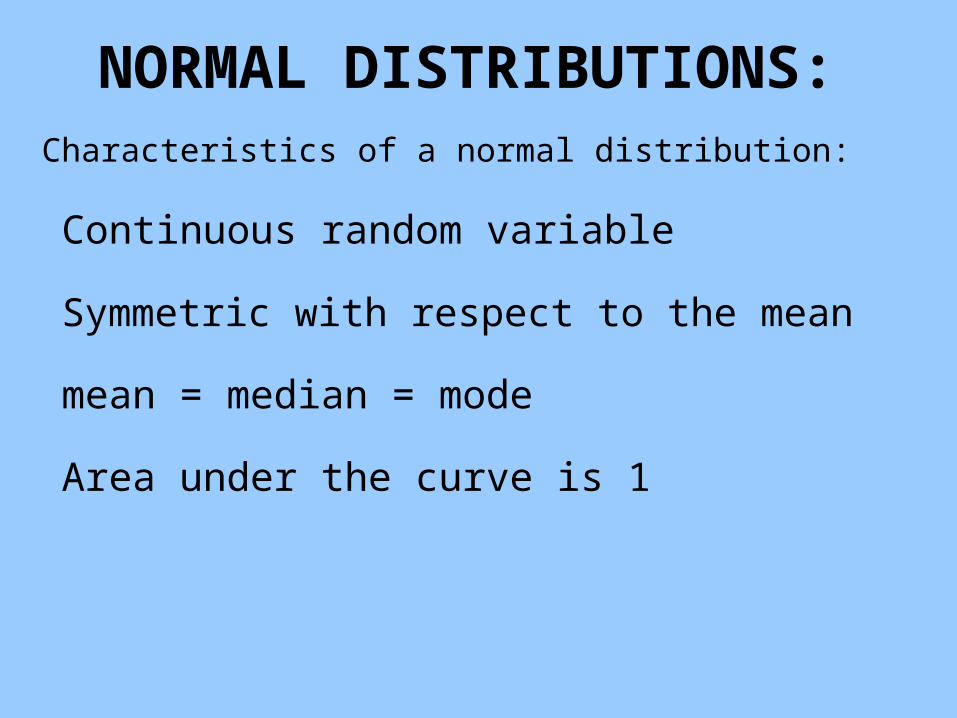
NORMAL DISTRIBUTIONS:Characteristics of a normal distribution:
Continuous random variable
Symmetric with respect to the mean
mean = median = mode
Area under the curve is 1
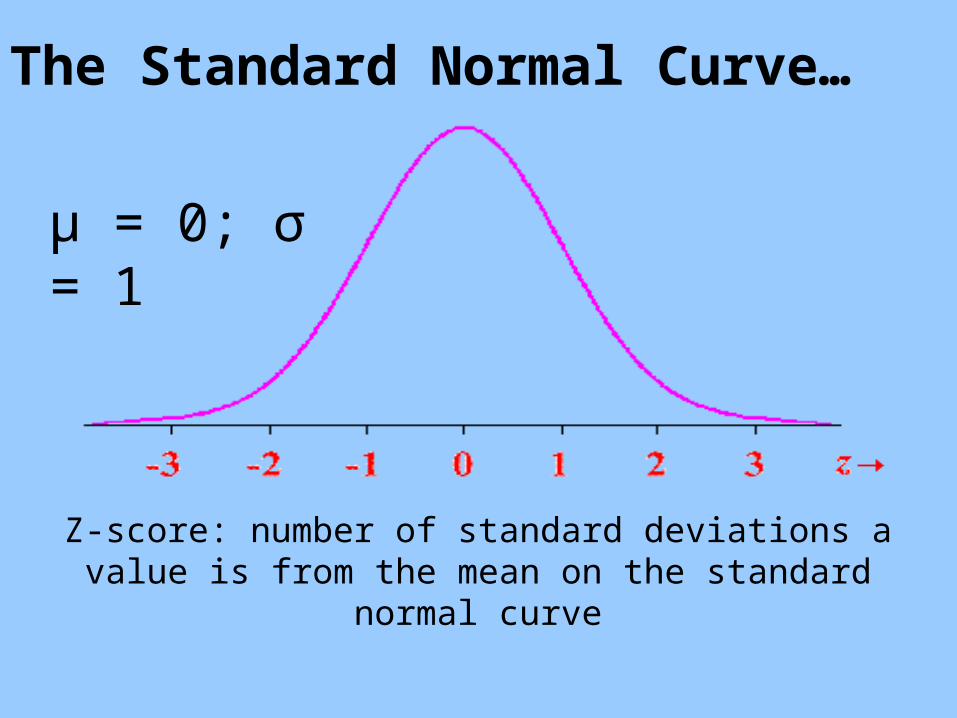
The Standard Normal Curve…
Z-score: number of standard deviations a value is from the mean on the standard normal curve
µ = 0; σ = 1
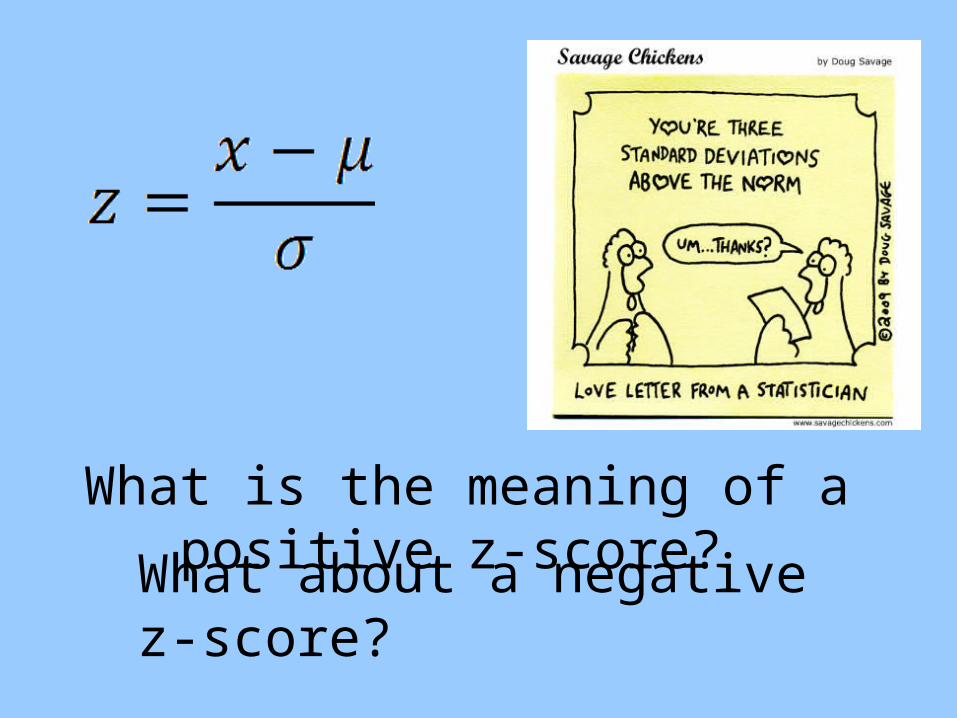
What is the meaning of a positive z-score?
What about a negative z-score?

How do you use this?The mean score on the SAT is 1500, with a standard deviation of 240. The ACT, a different college entrance examination, has a mean score of 21 with a standard deviation of 6.
If Bobby scored 1740 on the SAT and Kathy scored 30 on the ACT, who scored higher?

Bobby Kathy
z = 1 z = 1.5
Kathy scored higher – her z-score shows that she scored 1.5 standard deviations above the mean while Bobby scored 1 standard deviation above the mean.

The Empirical Rule:
68% of the data falls within ± 1σ

95% of the data falls within ± 2σ

99.7% of the data falls within ± 3σ
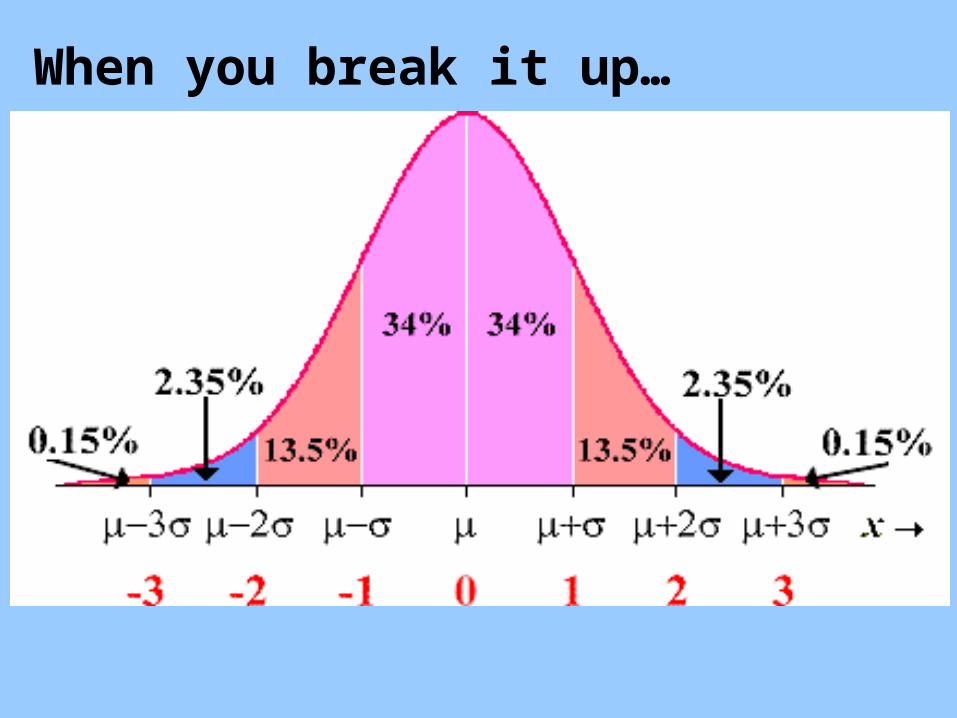
When you break it up…

The scores on the CCM3 midterm were normally distributed. The mean is 82 with a standard deviation of 5. Find the probability that a randomly selected person:
a. scored between 77 and 87 b. scored between 82 and 87c. scored between 72 and 87d. scored higher than 92e. scored less than 77
How do you use this?

82 87 92 97777267
Draw the curve, add the mean, then add the standard deviations above and below the mean…

a. scored between 77 and 87
b. scored between 82 and 87
c. scored between 72 and 87
d. scored higher than 92
e. scored less than 77
68%
34%
81.5%
2.5%
16%

what happens if you’re looking for scores that are not full standard deviations away from the mean?
You’re probably wondering…
normalcdf (lower bound, upper bound, µ, σ)
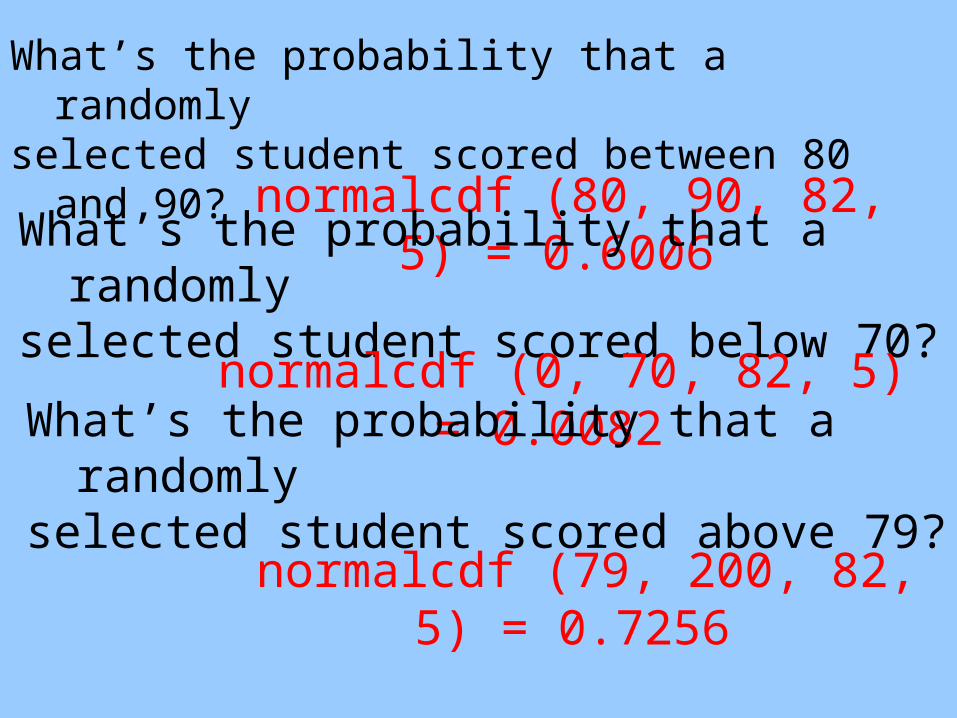
normalcdf (80, 90, 82, 5) = 0.6006
What’s the probability that a randomlyselected student scored between 80 and
90?
What’s the probability that a randomlyselected student scored below 70?
normalcdf (0, 70, 82, 5) = 0.0082
What’s the probability that a randomlyselected student scored above 79?
normalcdf (79, 200, 82, 5) = 0.7256

You can also work backward to find percentiles…
d.What score would a student need in order tobe in the 90th percentile?
invnorm (0.9, 82, 5) = 88.41, or 89
invnorm (percent of area to left,, )
e. What score would a student need in order to be in top 20% of the class?
invnorm (0.8, 82, 5) = 86.21, or 87
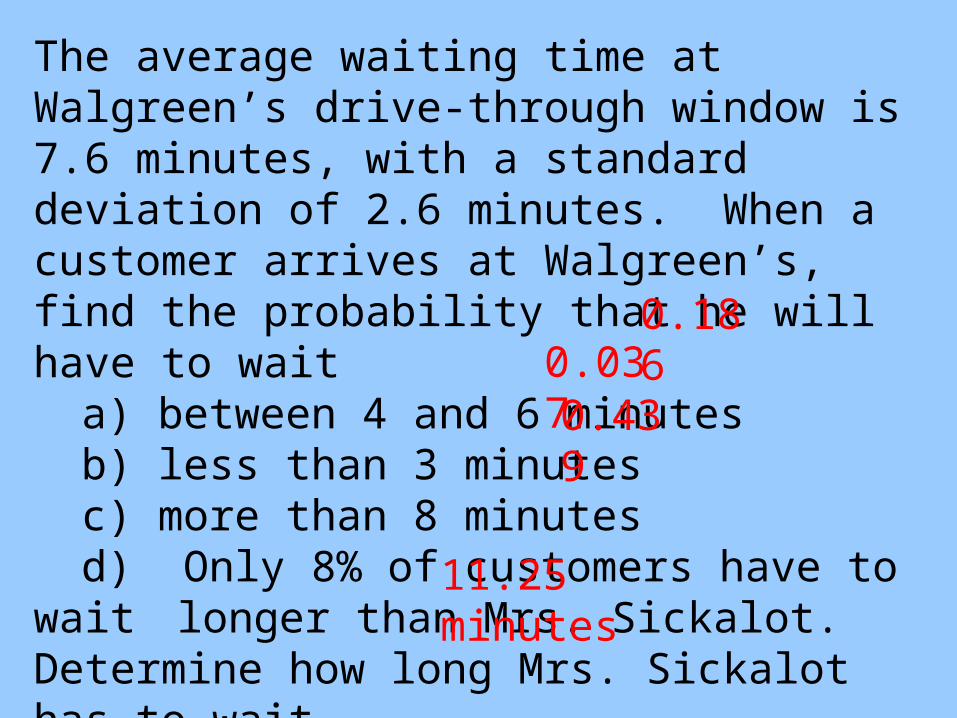
The average waiting time at Walgreen’s drive-through window is 7.6 minutes, with a standard deviation of 2.6 minutes. When a customer arrives at Walgreen’s, find the probability that he will have to wait
a) between 4 and 6 minutes b) less than 3 minutes c) more than 8 minutes d) Only 8% of customers have to wait longer
than Mrs. Sickalot. Determine how long Mrs. Sickalot has to wait.
0.1860.0370.439
11.25 minutes

Questions on normal
distributions?
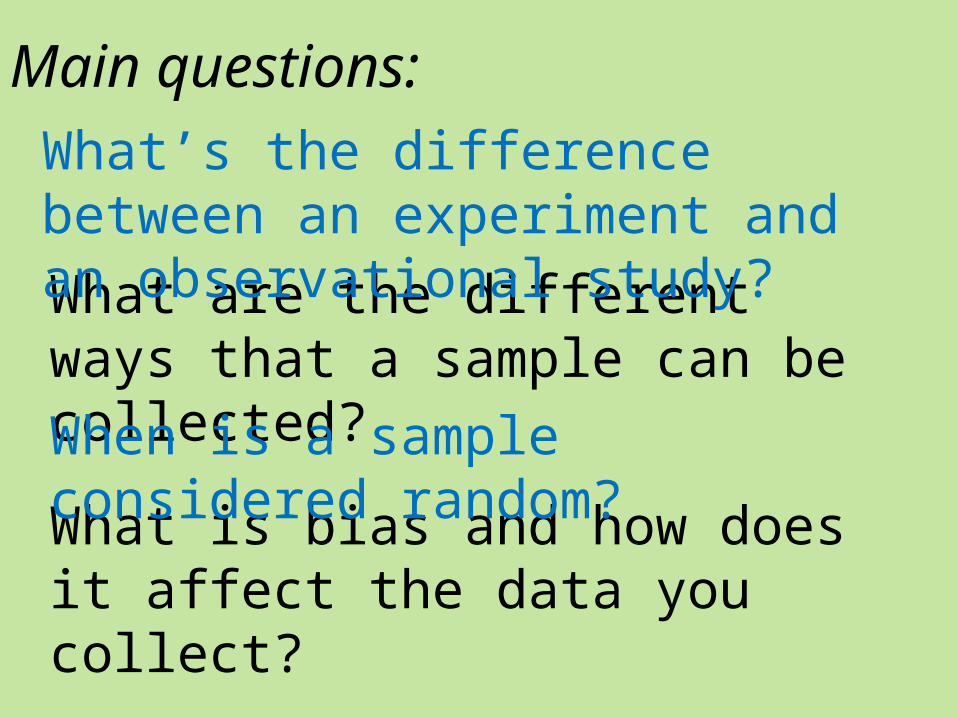
Main questions:
What is bias and how does it affect the data you collect?
What are the different ways that a sample can be collected?
What’s the difference between an experiment and an observational study?
When is a sample considered random?
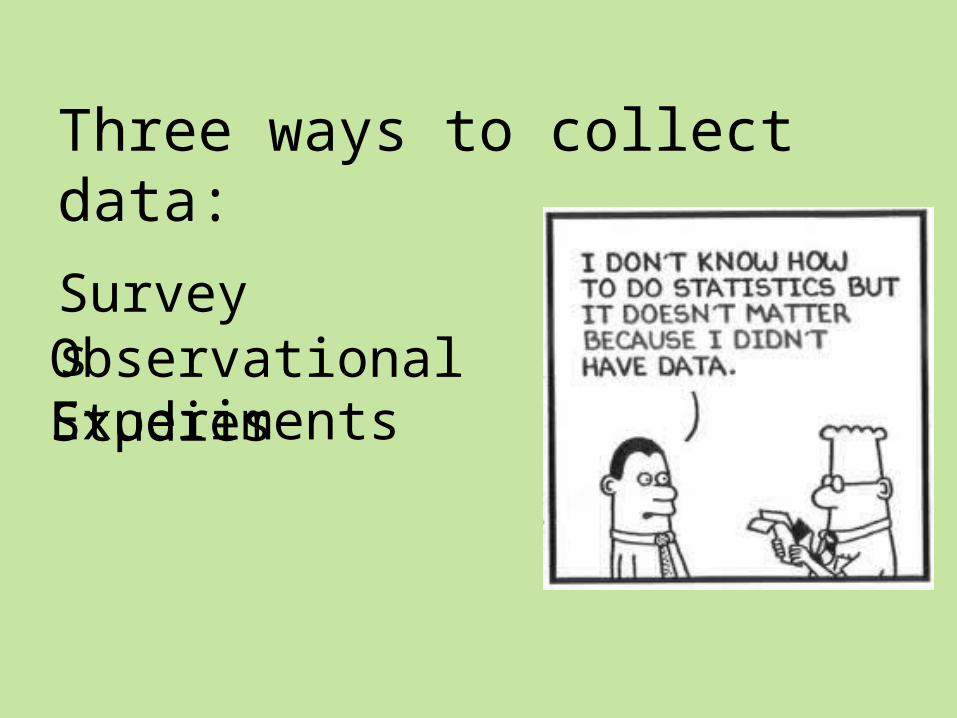
Three ways to collect data:
SurveysObservational StudiesExperiments

most often involve the use of a questionnaire to measure the characteristics and/or attitudes of people, for example, asking students their opinion about extending the school day.
Surveys…
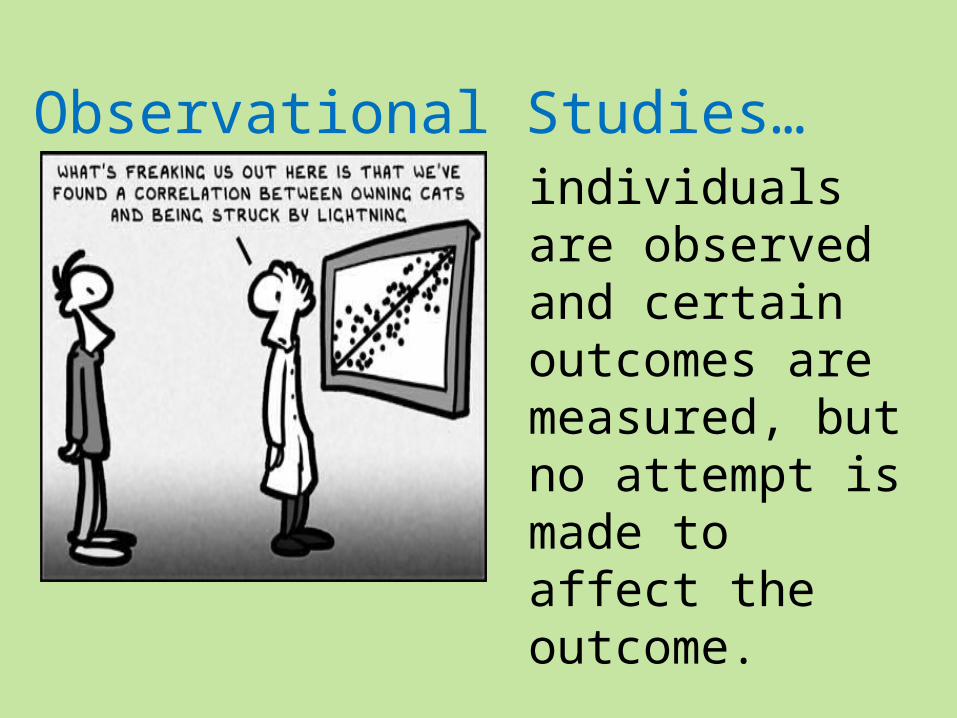
individuals are observed and certain outcomes are measured, but no attempt is made to affect the outcome.
Observational Studies…

treatments are imposed prior to observation. Experiments are the only way to show a cause-and-effect relationship.
Remember… correlation
is not causation!
Experiments…
Observational Study or Experiment?Fifty people with clinical depression were divided into two groups. Over a 6 month period, one group was given a traditional treatment for depression while the other
group was given a new drug. The people were evaluated at the end of the period to determine whether their depression had
improved. Experiment

Observational Study or Experiment?
To determine whether or not apples really do keep the doctor away, forty patients at a doctor’s office were asked to report how
often they came to the doctor and the number of apples they had eaten recently.
Observational Study
Observational Study or Experiment?
To determine whether music really helped students’ scores on a test, a teacher who taught two U. S. History classes played
classical music during testing for one class and played no music during testing for the
other class. Experiment
Types of Sampling:
all individuals in the population have the same probability of being selected AND all
groups of the sample size have the same probability of being selected
Simple random sample (SRS):

Putting 100 kids’ names in a hat and
picking out 10 - SRS
Putting 50 girls’ names in one hat and 50 boys’ names in another hat and picking out 5 of
each – not a SRS

used when the researcher wants to highlight specific subgroups within the population - the researcher divides the entire target population
into different subgroups, or strata, and then randomly selects the final subjects
proportionally from the different strata.
Stratified random sample:

the researcher selects a number at random, n, and then selects every nth individual for the
study.
Systematic random sample:

subjects are taken from a group that is conveniently accessible to a researcher, for
example, picking the first 100 people to enter the movies on Friday night.
Convenience sample:
a sampling technique where the entire population is divided into groups, or clusters,
and a random sample of these clusters are selected. All individuals in the selected
clusters are included in the sample.
Cluster sample:

The names of 70 contestants are written on 70 cards, the cards are placed in a bag, the bag is shaken, and three names are picked
from the bag.
Name that sample!
Simple random sample Stratified sample
Convenience sample cluster sample
Systematic sample
To avoid working late, the quality control manager inspects the last 10 items produced that day.
Simple random sample Stratified sample
Convenience sample cluster sample
Systematic sample
A researcher for an airline interviews all of the passengers on five randomly selected flights.
Simple random sample Stratified sample
Convenience sample cluster sample
Systematic sample

A researcher randomly selects and interviews fifty male and fifty female teachers.
Simple random sample Stratified sample
Convenience sample cluster sample
Systematic sample

Every fifth person boarding a plane is searched thoroughly.
Simple random sample Stratified sample
Convenience sample cluster sample
Systematic sample

Types of Bias in Survey Questions
Bias – when a sample systematically favors one outcome
Question wording bias:
In a survey about Americans’ interest in soccer, the first 25 people admitted to a high school soccer game were asked, “How interested are you in the world’s most popular sport, soccer?”

Undercoverage bias – occurs when the sample is not representative of the population
Response bias – occurs when survey respondents lie or misrepresent themselves
Nonresponse bias – occurs an individual is chosen to participate, but refuses
Voluntary response bias – occurs when people are asked to call or mail in their opinion

On the twelfth anniversary of the death of Elvis Presley, a Dallas record company sponsored a national call-in survey. Listeners of over 1000 radio stations were asked to call a 1-900 number (at a charge of $2.50) to voice an opinion concerning whether or not Elvis was really dead. It turned out that 56% of the callers felt Elvis was alive.
Voluntary response bias

In 1936, Literary Digest magazine conducted the most extensive (to that date) public opinion poll in history. They mailed out questionnaires to over 10 million people whose names and addresses they had obtained from telephone books and vehicle registration lists. More than 2.4 million people responded, with 57% indicating that they would vote for Republican Alf Landon in the upcoming Presidential election. Incumbent Democrat Franklin Roosevelt won the election, carrying 63% of the popular vote.
Undercoverage bias
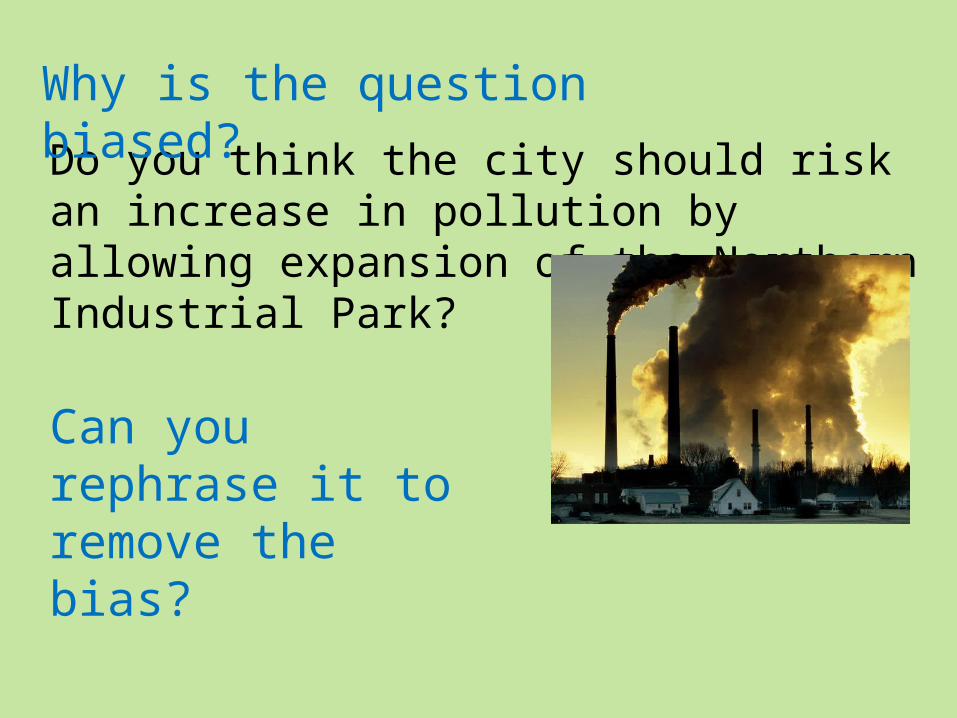
Do you think the city should risk an increase in pollution by allowing expansion of the Northern Industrial Park?
Why is the question biased?
Can you rephrase it to remove the bias?
Why is the question biased?
If you found a wallet with $100 in it on the street, would you do the honest thing and return it to the person or would you keep it?
Can you rephrase it to remove the bias?
Estimating Population Parameters
Vocabulary for this lesson is key!
Parameter – a value that represents a population
Statistic – a value that is taken from a sample and used to estimate a parameter

parameter statistic
mean µ
proportion p
Standard deviation
σ s
x
p̂

Finding a Margin of Error
Margin of error – “cushion” around a statistic
ME = n1
n = sample size
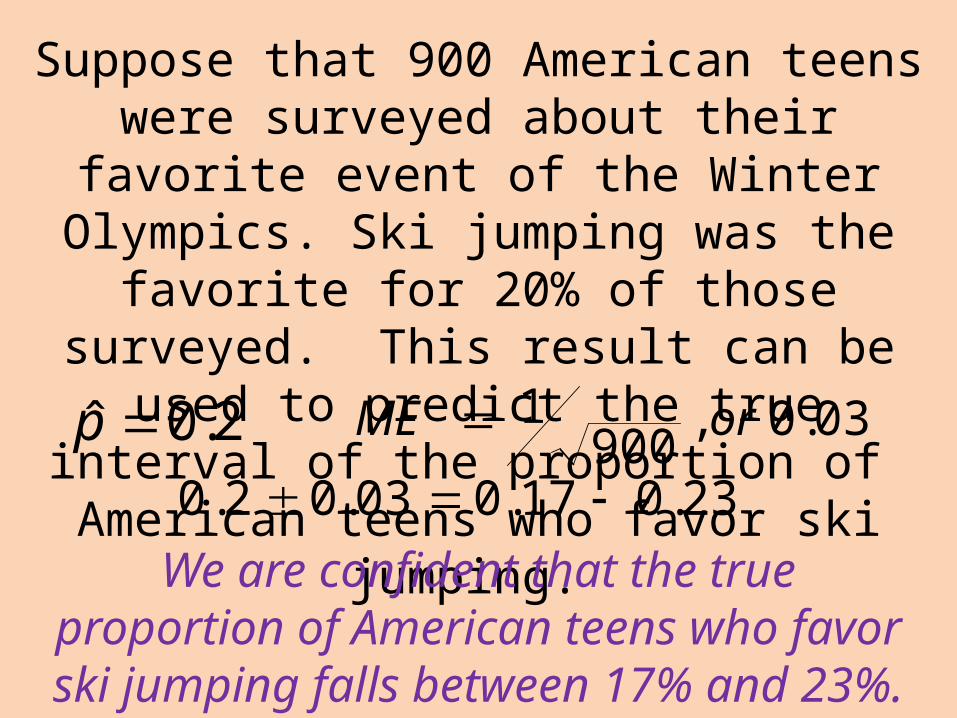
Suppose that 900 American teens were surveyed about their favorite event of the Winter
Olympics. Ski jumping was the favorite for 20% of those surveyed. This result can be used to predict the true interval of the proportion of
American teens who favor ski jumping.
We are confident that the true proportion of American teens who favor ski jumping falls
between 17% and 23%.
2.0ˆ p 03.0,900
1 orME
23.017.003.02.0
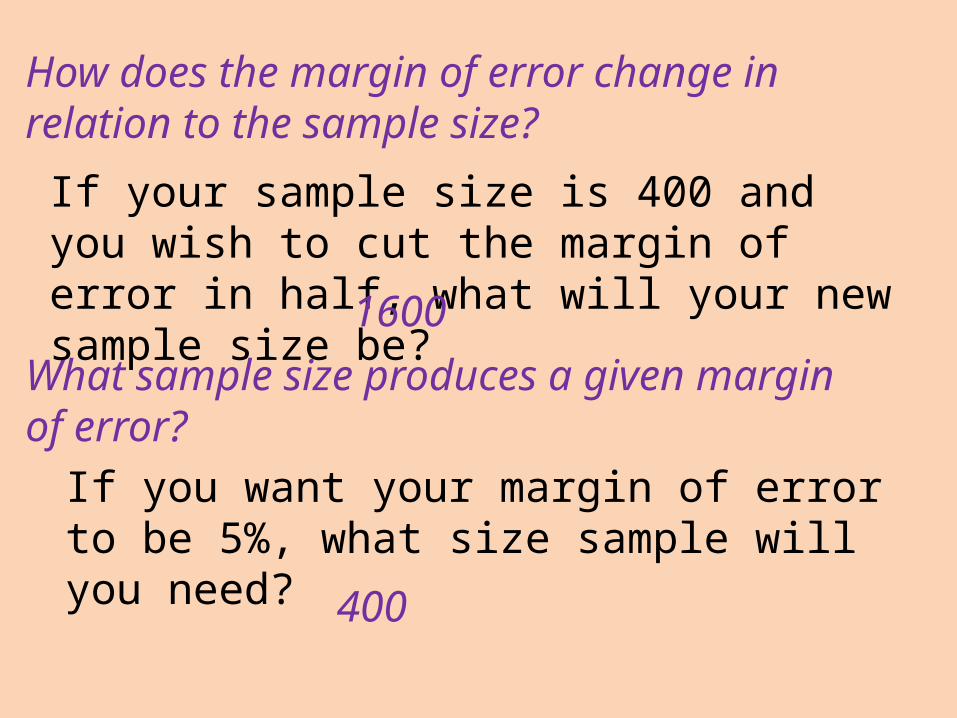
How does the margin of error change in relation to the sample size?
What sample size produces a given margin of error?
If your sample size is 400 and you wish to cut the margin of error in half, what will your new sample size be?
If you want your margin of error to be 5%, what size sample will you need?
1600
400

Expected Value and Fair Games
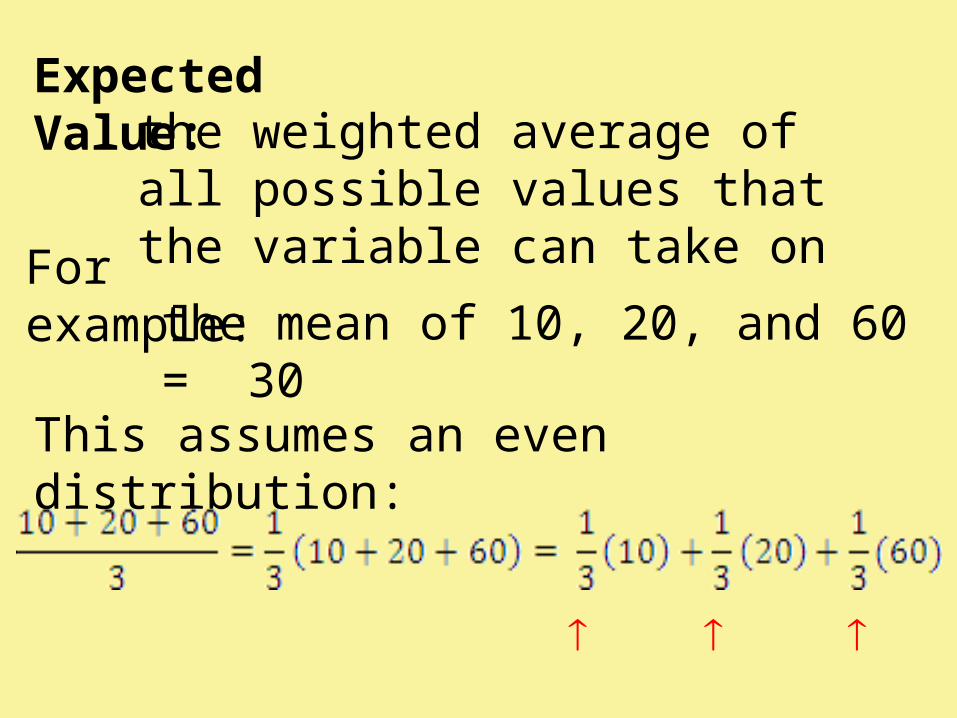
Expected Value:the weighted average of all possible values that the variable can take on
For example: the mean of 10, 20, and 60 = 30
This assumes an even distribution:

Probability distribution: all of the values that the variable takes on and their respective probabilities. X 10 20 60
P(X) .3 .4 .3
E(X) = .3(10) + .4(20) + .3(60) = 29
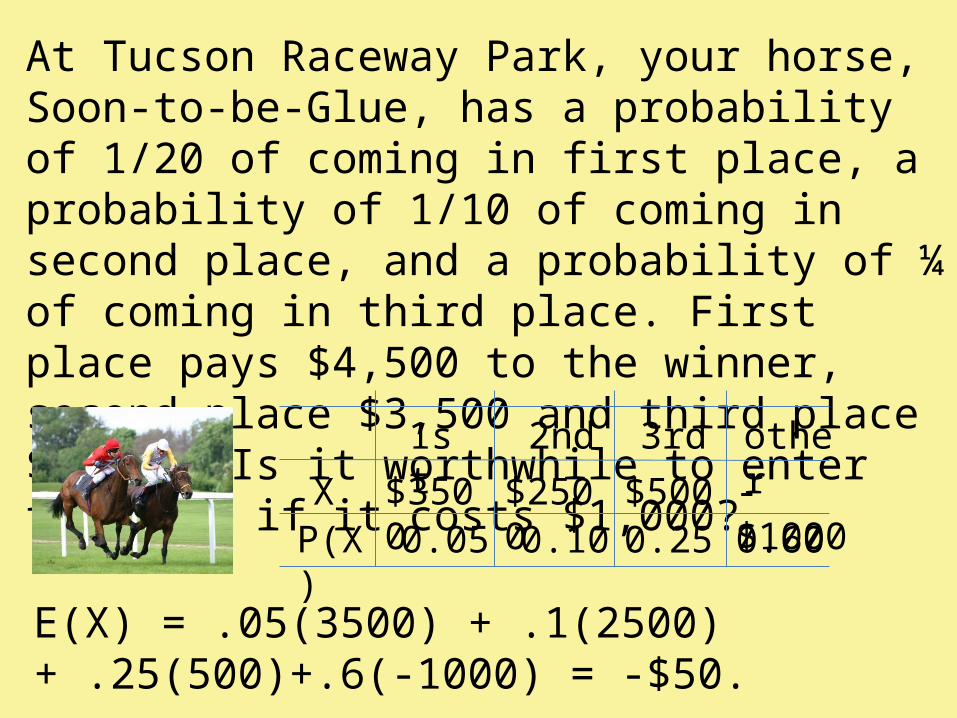
At Tucson Raceway Park, your horse, Soon-to-be-Glue, has a probability of 1/20 of coming in first place, a probability of 1/10 of coming in second place, and a probability of ¼ of coming in third place. First place pays $4,500 to the winner, second place $3,500 and third place $1,500. Is it worthwhile to enter the race if it costs $1,000?
XP(X)
1st 2nd 3rd other
$35000.05
$25000.10
$5000.25
-$10000.60
E(X) = .05(3500) + .1(2500) + .25(500)+.6(-1000) = -$50.
What does an expected value of -$50 mean?
Students should understand that nobody will actually lose $50… this is not one of our options. Over a large number of trials, this will be the average loss experienced.
This is the Law of Large Numbers
Insurance companies and casinos build their businesses based on the law of large numbers.
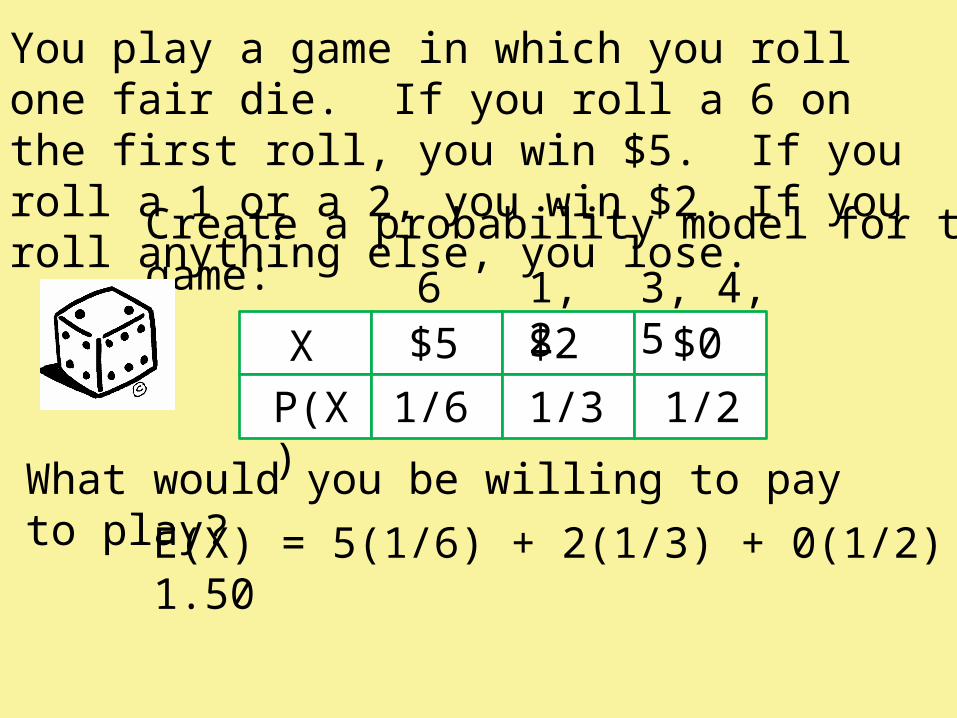
You play a game in which you roll one fair die. If you roll a 6 on the first roll, you win $5. If you roll a 1 or a 2, you win $2. If you roll anything else, you lose.
Create a probability model for this game:
X P(X)
6 1, 2 3, 4, 5 $5 $2 $0
What would you be willing to pay to play? E(X) = 5(1/6) + 2(1/3) + 0(1/2) = 1.50
1/6 1/3 1/2
AnyQuestions about Statistics?