Embed Size (px)
Citation preview
Adapted from GA DOE by
Common Core Georgia Performance Standards 6th
Grade - At a Glance
Common Core Georgia Performance Standards: Curriculum Map 1st 2 Semester nd Semester
Unit 1 Unit 2 Unit 3 Unit 4 Unit 5 Unit 6 Unit 7 Unit 8 4 weeks 6 weeks 3 weeks 5 weeks 4 weeks 4 weeks 5 weeks 6 weeks
Number System Fluency
Rate, Ratio and Proportional
Reasoning Using Equivalent Fractions
Expressions One-Step Equations and
Inequalities
Area and Volume
Rational Exploration: Numbers and
their Opposites
Statistics Show What We Know
MCC6.NS.1 MCC6.NS.2 MCC6.NS.3 MCC6.NS.4
MCC6.RP.1 MCC6.RP.2 MCC6.RP.3a MCC6.RP.3b MCC6.RP.3c MCC6.RP.3d
MCC6.EE.1 MCC6.EE.2a MCC6.EE.2b MCC6.EE.2c MCC6.EE.3 MCC6.EE.4
MCC6.EE.5 MCC6.EE.6 MCC6.EE.7 MCC6.EE.8 MCC6.EE.9
MCC6.RP.3a MCC6.RP.3b MCC6.RP.3c MCC6.RP.3d
(equations)
MCC6.G.1 MCC6.G.2 MCC6.G.4
MCC6.NS.5 MCC6.NS.6a MCC6.NS.6b MCC6.NS.6c MCC6.NS.7a MCC6.NS.7b MCC6.NS.7c MCC6.NS.7d MCC6.NS.8 MCC6.G.3
MCC6.SP.1 MCC6.SP.2 MCC6.SP.3 MCC6.SP.4 MCC6.SP.5
ALL
Power Standards are highlighted above and are linked to the Unwrapped Standard. 2 Buffer Days are included after each Unit for Remediation and Enrichment
Incorporated Standards MCC6.NS.1
MCC6.NS.2 MCC6.NS.3 MCC6.NS.4
MCC6.NS.1 MCC6.NS.2 MCC6.NS.3 MCC6.NS.4
MCC6.NS.1 MCC6.NS.2 MCC6.NS.3 MCC6.NS.4
MCC6.EE.2c MCC6.NS.1 MCC6.NS.2 MCC6.NS.3 MCC6.NS.4
MCC6.NS.1 MCC6.NS.2 MCC6.NS.3 MCC6.NS.4
Standards for Mathematical Practice 1 Make sense of problems and persevere in solving them. 2 Reason abstractly and quantitatively. 3 Construct viable arguments and critique the reasoning of others. 4 Model with mathematics
5 Use appropriate tools strategically. 6 Attend to precision. 7 Look for and make use of structure. 8 Look for and express regularity in repeated reasoning.
Adapted from GA DOE by
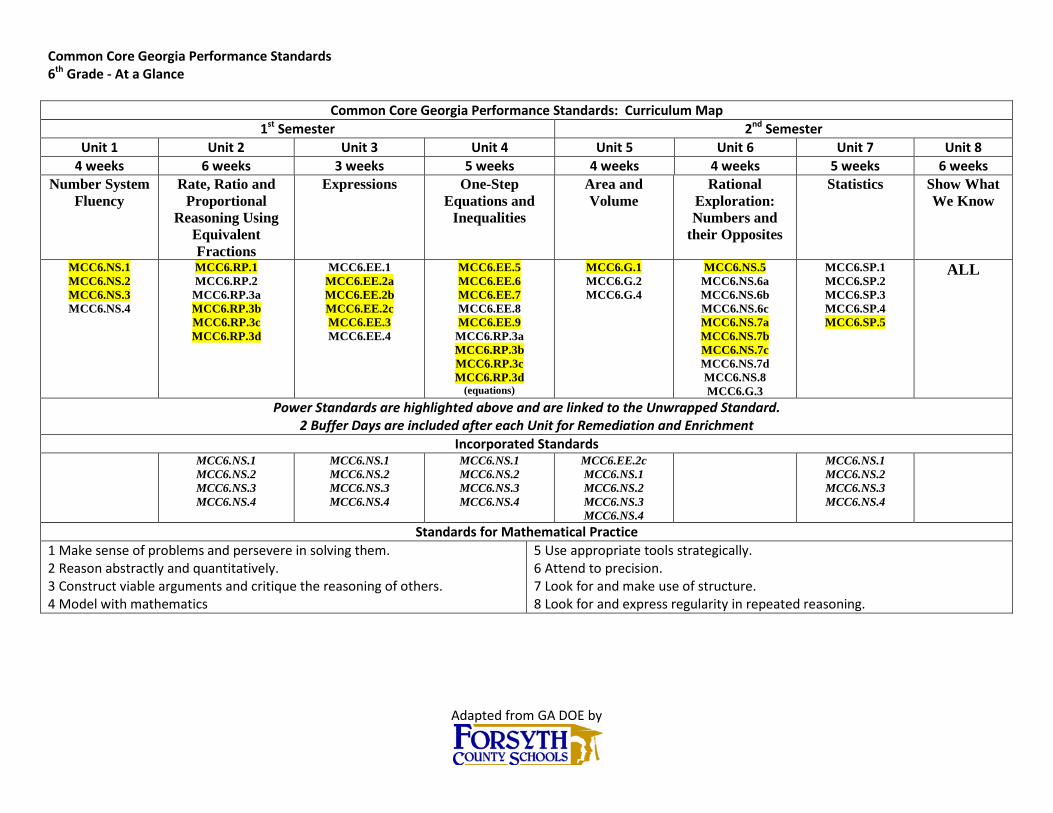
1st Semester Unit 1: Number System Fluency
MCC6.NS.1 Interpret and compute quotients of fractions, and solve word problems involving division of fractions by fractions, e.g., by using visual fraction models and equations to represent the problem.
Apply and extend previous understandings of multiplication and division to divide fractions by fractions.
MCC6.NS.2 Fluently divide multi-digit numbers using the standard algorithm. Compute fluently with multi-digit numbers and find common factors and multiples.
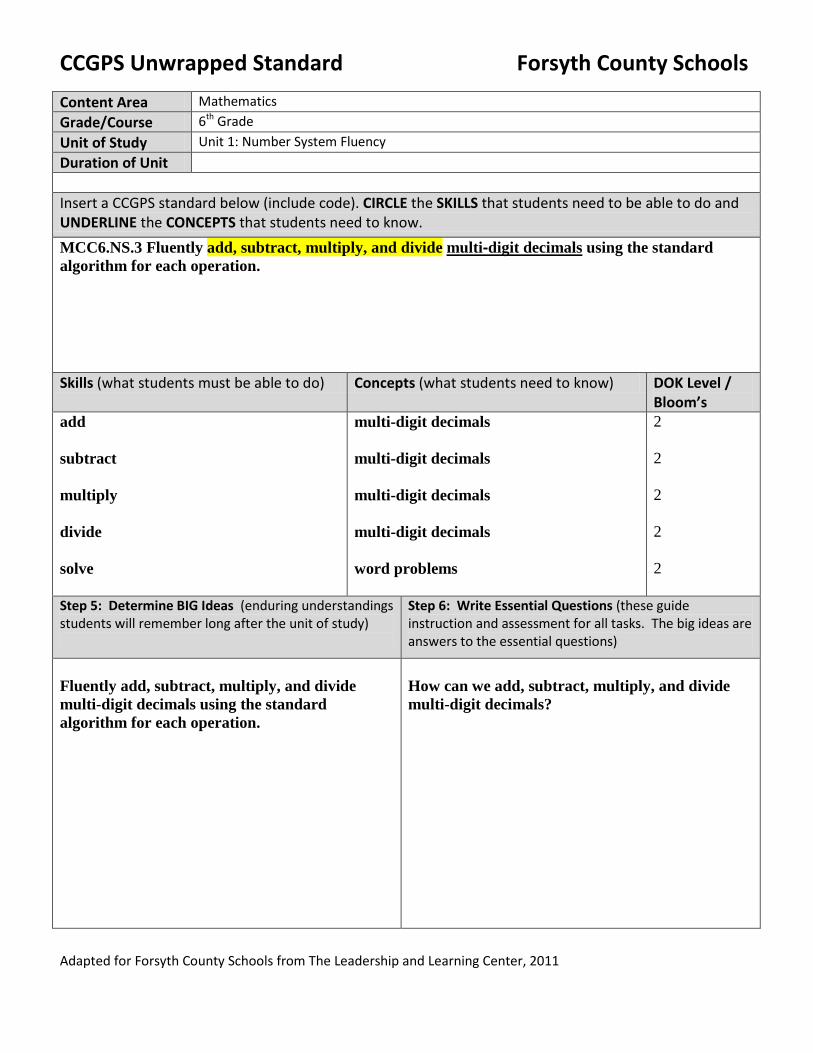
MCC6.NS.3 Fluently add, subtract, multiply, and divide multi-digit decimals using the standard algorithm for each operation.
MCC6.NS.4 Find the greatest common factor of two whole numbers less than or equal to 100 and the least common multiple of two whole numbers less than or equal to 12. Use the distributive property to express a sum of two whole numbers 1–100 with a common factor as a multiple of a sum of two whole numbers with no common factor.
Unit 2: Rate, Ratio and Proportional Reasoning Using Equivalent Fractions
MCC6.RP.1 Understand the concept of a ratio and use ratio language to describe a ratio relationship between two quantities.
Understand ratio concepts and use ratio reasoning to solve problems.
MCC6.RP.2 Understand the concept of a unit rate a/b associated with a ratio a: b with b ≠ 0 (b not equal to zero), and use rate language in the context of a ratio relationship. MCC6.RP.3 Use ratio and rate reasoning to solve real-world and mathematical problems, e.g., by reasoning about tables of equivalent ratios, tape diagrams, double number line diagrams, or equations.
MCC6.RP.3a Make tables of equivalent ratios relating quantities with whole-number measurements, find missing values in the tables, and plot the pairs of values on the coordinate plane. Use tables to compare ratios. MCC6.RP.3b Solve unit rate problems including those involving unit pricing and constant speed. MCC6.RP.3c Find a percent of a quantity as a rate per 100 (e.g., 30% of a quantity means 30/100 times the quantity); solve problems involving finding the whole given a part and the percent. MCC6.RP.3d Use ratio reasoning to convert measurement units; manipulate and transform units appropriately when multiplying or dividing quantities.
Unit 3: Expressions
MCC6.EE.1 Write and evaluate numerical expressions involving whole-number exponents.
Apply and extend previous understandings of arithmetic to algebraic expressions.
MCC6.EE.2 Write, read, and evaluate expressions in which letters stand for numbers. MCC6.EE.2a Write expressions that record operations with numbers and with letters standing for numbers. MCC6.EE.2b Identify parts of an expression using mathematical terms (sum, term, product, factor, quotient, coefficient); view one or more parts of an expression as a single entity.
MCC6.EE.2c Evaluate expressions at specific values for their variables. Include expressions that arise from formulas in real-world problems. Perform arithmetic operations, including those involving whole-number exponents, in the conventional order when there are no parentheses to specify a particular order (Order of Operations). MCC6.EE.3 Apply the properties of operations to generate equivalent expressions. MCC6.EE.4 Identify when two expressions are equivalent (i.e., when the two expressions name the same number regardless of which value is substituted into them).
Adapted from GA DOE by
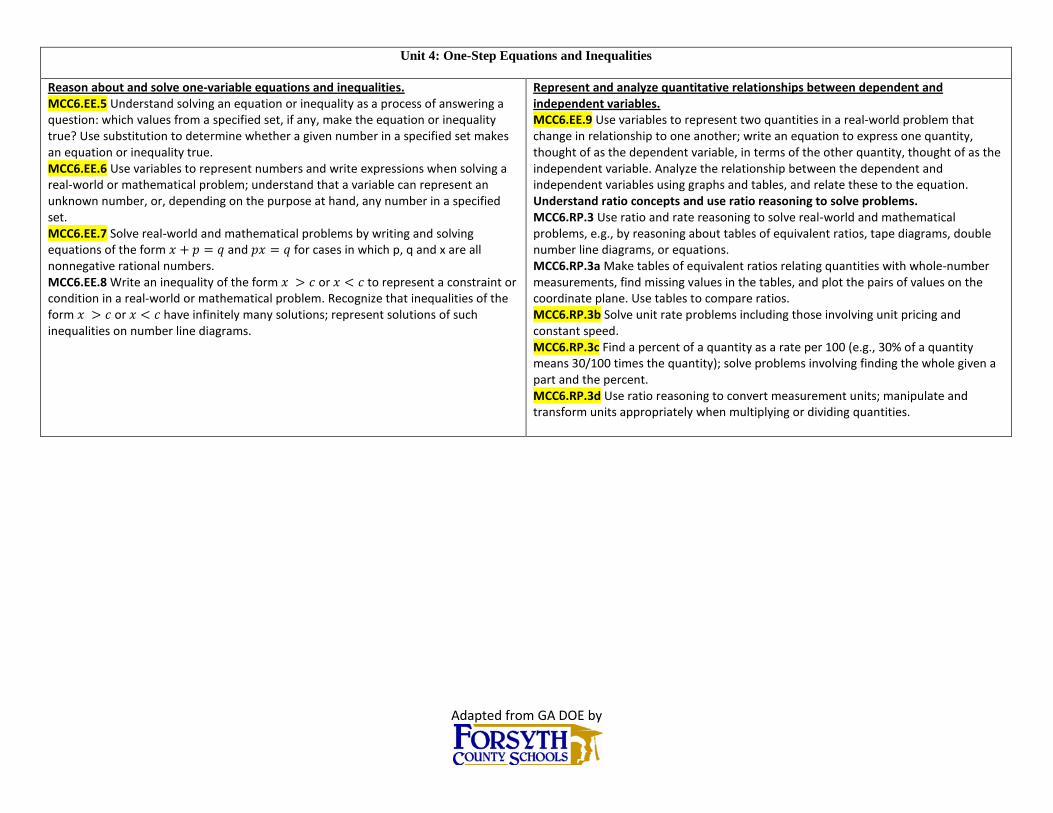
Unit 4: One-Step Equations and Inequalities
MCC6.EE.5 Understand solving an equation or inequality as a process of answering a Reason about and solve one-variable equations and inequalities.
question: which values from a specified set, if any, make the equation or inequality true? Use substitution to determine whether a given number in a specified set makes an equation or inequality true. MCC6.EE.6 Use variables to represent numbers and write expressions when solving a real-world or mathematical problem; understand that a variable can represent an unknown number, or, depending on the purpose at hand, any number in a specified set. MCC6.EE.7 Solve real-world and mathematical problems by writing and solving equations of the form 𝑥 + 𝑝 = 𝑞 and 𝑝𝑥 = 𝑞 for cases in which p, q and x are all nonnegative rational numbers. MCC6.EE.8 Write an inequality of the form 𝑥 > 𝑐 or 𝑥 < 𝑐 to represent a constraint or condition in a real-world or mathematical problem. Recognize that inequalities of the form 𝑥 > 𝑐 or 𝑥 < 𝑐 have infinitely many solutions; represent solutions of such inequalities on number line diagrams.
MCC6.EE.9 Use variables to represent two quantities in a real-world problem that change in relationship to one another; write an equation to express one quantity, thought of as the dependent variable, in terms of the other quantity, thought of as the independent variable. Analyze the relationship between the dependent and independent variables using graphs and tables, and relate these to the equation.
Represent and analyze quantitative relationships between dependent and independent variables.
Understand ratio concepts and use ratio reasoning to solve problems. MCC6.RP.3 Use ratio and rate reasoning to solve real-world and mathematical problems, e.g., by reasoning about tables of equivalent ratios, tape diagrams, double number line diagrams, or equations. MCC6.RP.3a Make tables of equivalent ratios relating quantities with whole-number measurements, find missing values in the tables, and plot the pairs of values on the coordinate plane. Use tables to compare ratios. MCC6.RP.3b Solve unit rate problems including those involving unit pricing and constant speed. MCC6.RP.3c Find a percent of a quantity as a rate per 100 (e.g., 30% of a quantity means 30/100 times the quantity); solve problems involving finding the whole given a part and the percent. MCC6.RP.3d Use ratio reasoning to convert measurement units; manipulate and transform units appropriately when multiplying or dividing quantities.
Adapted from GA DOE by
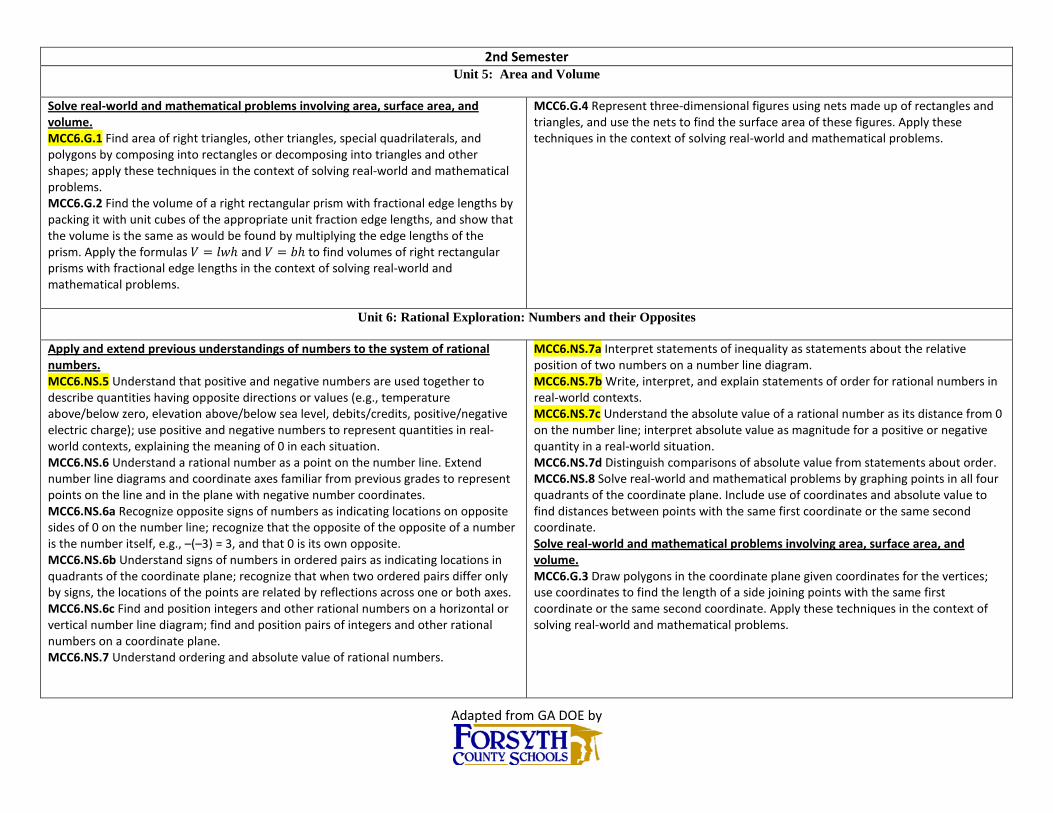
2nd Semester Unit 5: Area and Volume
MCC6.G.1 Find area of right triangles, other triangles, special quadrilaterals, and polygons by composing into rectangles or decomposing into triangles and other shapes; apply these techniques in the context of solving real-world and mathematical problems.
Solve real-world and mathematical problems involving area, surface area, and volume.
MCC6.G.2 Find the volume of a right rectangular prism with fractional edge lengths by packing it with unit cubes of the appropriate unit fraction edge lengths, and show that the volume is the same as would be found by multiplying the edge lengths of the prism. Apply the formulas 𝑉 = 𝑙𝑤ℎ and 𝑉 = 𝑏ℎ to find volumes of right rectangular prisms with fractional edge lengths in the context of solving real-world and mathematical problems.
MCC6.G.4 Represent three-dimensional figures using nets made up of rectangles and triangles, and use the nets to find the surface area of these figures. Apply these techniques in the context of solving real-world and mathematical problems.
Unit 6: Rational Exploration: Numbers and their Opposites
MCC6.NS.5 Understand that positive and negative numbers are used together to describe quantities having opposite directions or values (e.g., temperature above/below zero, elevation above/below sea level, debits/credits, positive/negative electric charge); use positive and negative numbers to represent quantities in real-world contexts, explaining the meaning of 0 in each situation.
Apply and extend previous understandings of numbers to the system of rational numbers.
MCC6.NS.6 Understand a rational number as a point on the number line. Extend number line diagrams and coordinate axes familiar from previous grades to represent points on the line and in the plane with negative number coordinates. MCC6.NS.6a Recognize opposite signs of numbers as indicating locations on opposite sides of 0 on the number line; recognize that the opposite of the opposite of a number is the number itself, e.g., –(–3) = 3, and that 0 is its own opposite. MCC6.NS.6b Understand signs of numbers in ordered pairs as indicating locations in quadrants of the coordinate plane; recognize that when two ordered pairs differ only by signs, the locations of the points are related by reflections across one or both axes. MCC6.NS.6c Find and position integers and other rational numbers on a horizontal or vertical number line diagram; find and position pairs of integers and other rational numbers on a coordinate plane. MCC6.NS.7 Understand ordering and absolute value of rational numbers.
MCC6.NS.7a Interpret statements of inequality as statements about the relative position of two numbers on a number line diagram. MCC6.NS.7b Write, interpret, and explain statements of order for rational numbers in real-world contexts. MCC6.NS.7c Understand the absolute value of a rational number as its distance from 0 on the number line; interpret absolute value as magnitude for a positive or negative quantity in a real-world situation. MCC6.NS.7d Distinguish comparisons of absolute value from statements about order. MCC6.NS.8 Solve real-world and mathematical problems by graphing points in all four quadrants of the coordinate plane. Include use of coordinates and absolute value to find distances between points with the same first coordinate or the same second coordinate.
MCC6.G.3 Draw polygons in the coordinate plane given coordinates for the vertices; use coordinates to find the length of a side joining points with the same first coordinate or the same second coordinate. Apply these techniques in the context of solving real-world and mathematical problems.
Solve real-world and mathematical problems involving area, surface area, and volume.
Adapted from GA DOE by
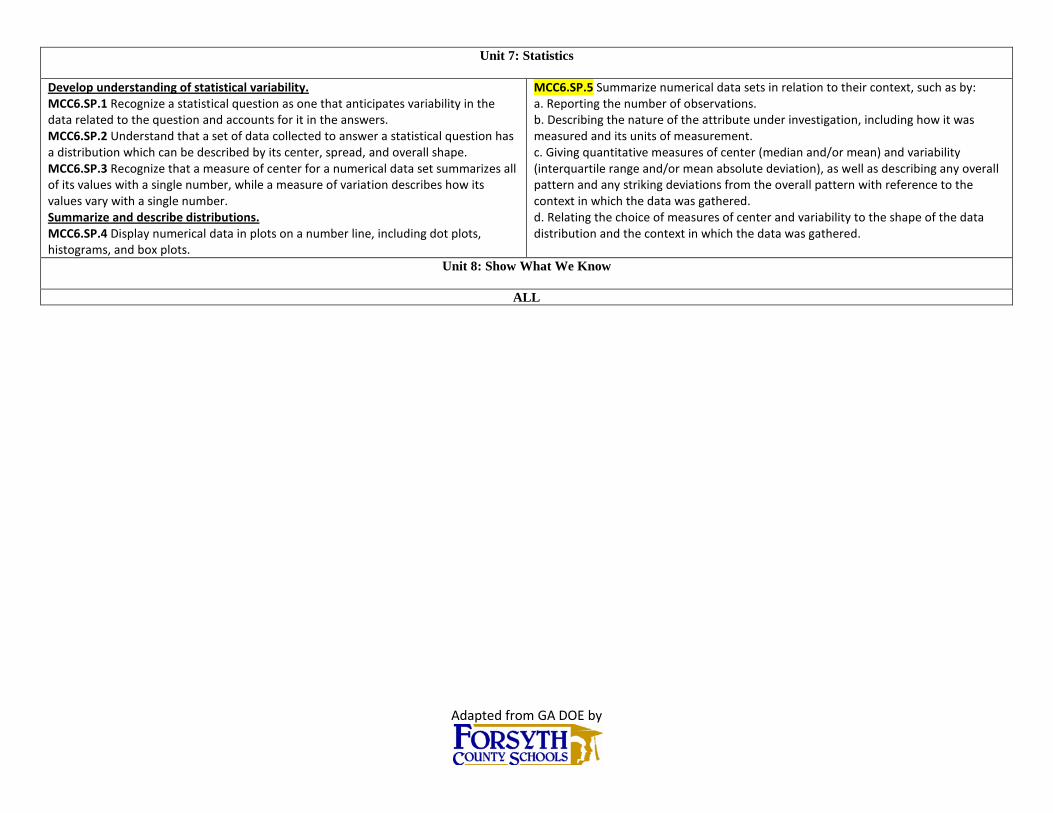
Unit 7: Statistics
MCC6.SP.1 Recognize a statistical question as one that anticipates variability in the data related to the question and accounts for it in the answers.
Develop understanding of statistical variability.
MCC6.SP.2 Understand that a set of data collected to answer a statistical question has a distribution which can be described by its center, spread, and overall shape. MCC6.SP.3 Recognize that a measure of center for a numerical data set summarizes all of its values with a single number, while a measure of variation describes how its values vary with a single number.
MCC6.SP.4 Display numerical data in plots on a number line, including dot plots, histograms, and box plots.
Summarize and describe distributions.
MCC6.SP.5 Summarize numerical data sets in relation to their context, such as by: a. Reporting the number of observations. b. Describing the nature of the attribute under investigation, including how it was measured and its units of measurement. c. Giving quantitative measures of center (median and/or mean) and variability (interquartile range and/or mean absolute deviation), as well as describing any overall pattern and any striking deviations from the overall pattern with reference to the context in which the data was gathered. d. Relating the choice of measures of center and variability to the shape of the data distribution and the context in which the data was gathered.
Unit 8: Show What We Know
ALL
CCGPS Unwrapped Standard Forsyth County Schools
Adapted for Forsyth County Schools from The Leadership and Learning Center, 2011
Content Area Math
Grade/Course 6th Grade
Unit of Study Unit 3: Expressions
Duration of Unit
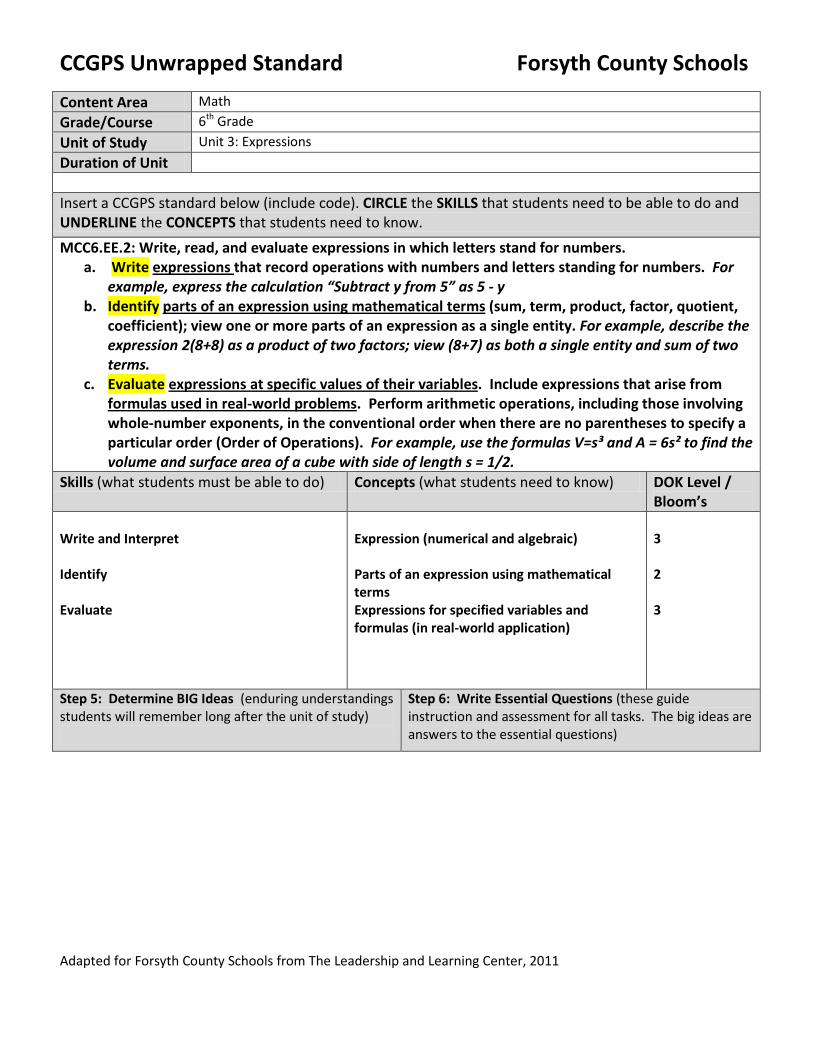
Insert a CCGPS standard below (include code). CIRCLE the SKILLS that students need to be able to do and UNDERLINE the CONCEPTS that students need to know. MCC6.EE.2: Write, read, and evaluate expressions in which letters stand for numbers.
a. Write expressions
b. Identify
that record operations with numbers and letters standing for numbers. For example, express the calculation “Subtract y from 5” as 5 - y
parts of an expression using mathematical terms
c. Evaluate
(sum, term, product, factor, quotient, coefficient); view one or more parts of an expression as a single entity. For example, describe the expression 2(8+8) as a product of two factors; view (8+7) as both a single entity and sum of two terms.
expressions at specific values of their variables. Include expressions that arise from formulas used in real-world problems. Perform arithmetic operations, including those involving whole-number exponents, in the conventional order when there are no parentheses to specify a particular order (Order of Operations). For example, use the formulas V=s³ and A = 6s² to find the volume and surface area of a cube with side of length s = 1/2.
Skills (what students must be able to do) Concepts (what students need to know) DOK Level / Bloom’s
Write and Interpret Identify Evaluate
Expression (numerical and algebraic) Parts of an expression using mathematical terms Expressions for specified variables and formulas (in real-world application)
3 2 3
Step 5: Determine BIG Ideas (enduring understandings students will remember long after the unit of study)
Step 6: Write Essential Questions (these guide instruction and assessment for all tasks. The big ideas are answers to the essential questions)
CCGPS Unwrapped Standard Forsyth County Schools
Adapted for Forsyth County Schools from The Leadership and Learning Center, 2011
Algebraic expressions can be used to generalize properties of arithmetic. Variables can be used as unique unknown values or as quantities that vary. Algebraic expressions may be used to represent and generalize mathematical problems and real life situations.
If we didn’t’ have variables, what would we use? What purposes do variable expressions serve? What are some advantages to being able to describe a pattern using variables? Why does the order of operations exist? What other task/processes require the use of a strict order of steps?
Explanations and Examples
It is important for students to read algebraic expressions in a manner that reinforces that the variable represents a number.
• r + 21 as “some number plus 21 as well as “r plus 21” • n • 6 as “some number times 6 as well as “n times 6”
•
s6
and s ÷ 6 as “as some number divided by 6” as well as “s divided by 6”
Students should identify the parts of an algebraic expression including variables, coefficients, constants, and the names of operations (sum, difference, product, and quotient). Development of this common language helps students to understand the structure of expressions and explain their process for simplifying expressions.
Terms are the parts of a sum. When the term is an explicit number, it is called a constant. When the term is a product of a number and a variable, the number is called the coefficient of the variable.
Variables are letters that represent numbers. There are various possibilities for the numbers they can represent; students can substitute these possible numbers for the letters in the expression for various different purposes.
Consider the following expression:
6352 +++ xyx
The variables are x and y.
CCGPS Unwrapped Standard Forsyth County Schools
Adapted for Forsyth County Schools from The Leadership and Learning Center, 2011
There are 4 terms, x2, 5y, 3x, and 6.
There are 3 variable terms, x2, 5y, 3x. They have coefficients of 1, 5, and 3 respectively. The coefficient of x2 is 1, since x2 = 1 x2. The term 5y represent 5 y’s or 5 * y.
There is one constant term, 6.
The expression shows a sum of all four terms.
Examples:
• 7 more than 3 times a number (Solution: 73 +x ) • 3 times the sum of a number and 5 (Solution: )5(3 +x • 7 less than the product of 2 and a number (Solution: 72 −x ) • Twice the difference between a number and 5 (Solution: )5(2 −z )
• Evaluate 5(n + 3) – 7n, when n =12
.
• The expression c + 0.07c can be used to find the total cost of an item with 7% sales tax, where c is the pre-tax cost of the item. Use the expression to find the total cost of an item that cost $25.
The perimeter of a parallelogram is found using the formula p = 2l + 2w. What is the perimeter of a rectangular picture frame with dimensions of 8.5 inches by 11 inches.
Next step, create assessments and engaging learning experiences
CCGPS Unwrapped Standard Forsyth County Schools
Adapted for Forsyth County Schools from The Leadership and Learning Center, 2011
Content Area Mathematics Grade/Course 6th Grade Unit of Study Unit 3: Expressions Duration of Unit
Insert a CCGPS standard below (include code). CIRCLE the SKILLS that students need to be able to do and UNDERLINE the CONCEPTS that students need to know. MCC6.EE.3 Apply the properties of operations to generate equivalent expressions
.
Skills (what students must be able to do) Concepts (what students need to know) DOK Level / Bloom’s
Apply Generate
Properties of operations Equivalent expressions
4 3
Step 5: Determine BIG Ideas (enduring understandings students will remember long after the unit of study)
Step 6: Write Essential Questions (these guide instruction and assessment for all tasks. The big ideas are answers to the essential questions)
Properties of numbers can be used to simplify and evaluate expressions. Algebraic properties can be used to create equivalent expressions Two equivalent expressions form an equation.
How do I use the properties to identify equivalent expressions How do I use the properties and mathematical models to generate equivalent expressions?
Explanations and Examples
Students use their understanding of multiplication to interpret 3 (2 + x). For example, 3 groups of (2 + x). They use a model to represent x, and make an array to show the meaning of 3(2 + x). They can explain why it makes sense that 3(2 + x) is equal to 6 + 3x.
CCGPS Unwrapped Standard Forsyth County Schools
Adapted for Forsyth County Schools from The Leadership and Learning Center, 2011
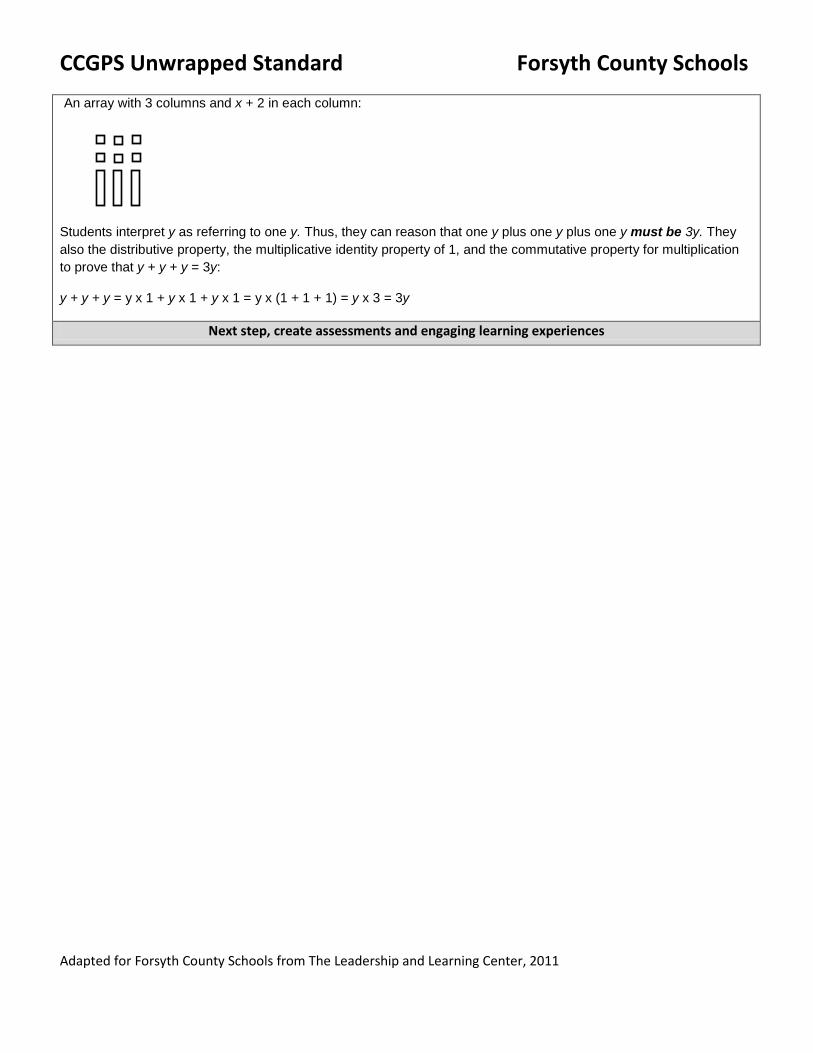
An array with 3 columns and x + 2 in each column:
Students interpret y as referring to one y. Thus, they can reason that one y plus one y plus one y must be 3y. They also the distributive property, the multiplicative identity property of 1, and the commutative property for multiplication to prove that y + y + y = 3y:
y + y + y = y x 1 + y x 1 + y x 1 = y x (1 + 1 + 1) = y x 3 = 3y
Next step, create assessments and engaging learning experiences
CCGPS Unwrapped Standard Forsyth County Schools
Adapted for Forsyth County Schools from The Leadership and Learning Center, 2011
Content Area Math Grade/Course 6th Grade Unit of Study Unit 4: One-Step Equations and Inequalities Duration of Unit
Insert a CCGPS standard below (include code). CIRCLE the SKILLS that students need to be able to do and UNDERLINE the CONCEPTS that students need to know. MCC6.EE.5 - Understand solving an equation or inequality as a process of answering a question: which values from a specified set, if any, make the equation or inequality true? Use substitution to determine whether a given number in a specified set makes an equation or inequality true
.
Skills (what students must be able to do) Concepts (what students need to know) DOK Level /
Bloom’s Solve Use Determine
Equation or Inequality Substitution Solution set of numbers
3 2 2
Step 5: Determine BIG Ideas (enduring understandings students will remember long after the unit of study)
Step 6: Write Essential Questions (these guide instruction and assessment for all tasks. The big ideas are answers to the essential questions)
Compare equal expressions Compare unequal expressions Use inverse operations to isolate and solve variables Use substitution to find solutions to equations and inequalities Identify values from a specified set that will make an equation or inequality true.
What is an equation? What is an inequality? How do I solve an equation? How do I determine a solution set of numbers to solve an equation or inequality?
CCGPS Unwrapped Standard Forsyth County Schools
Adapted for Forsyth County Schools from The Leadership and Learning Center, 2011
Explanations and Examples
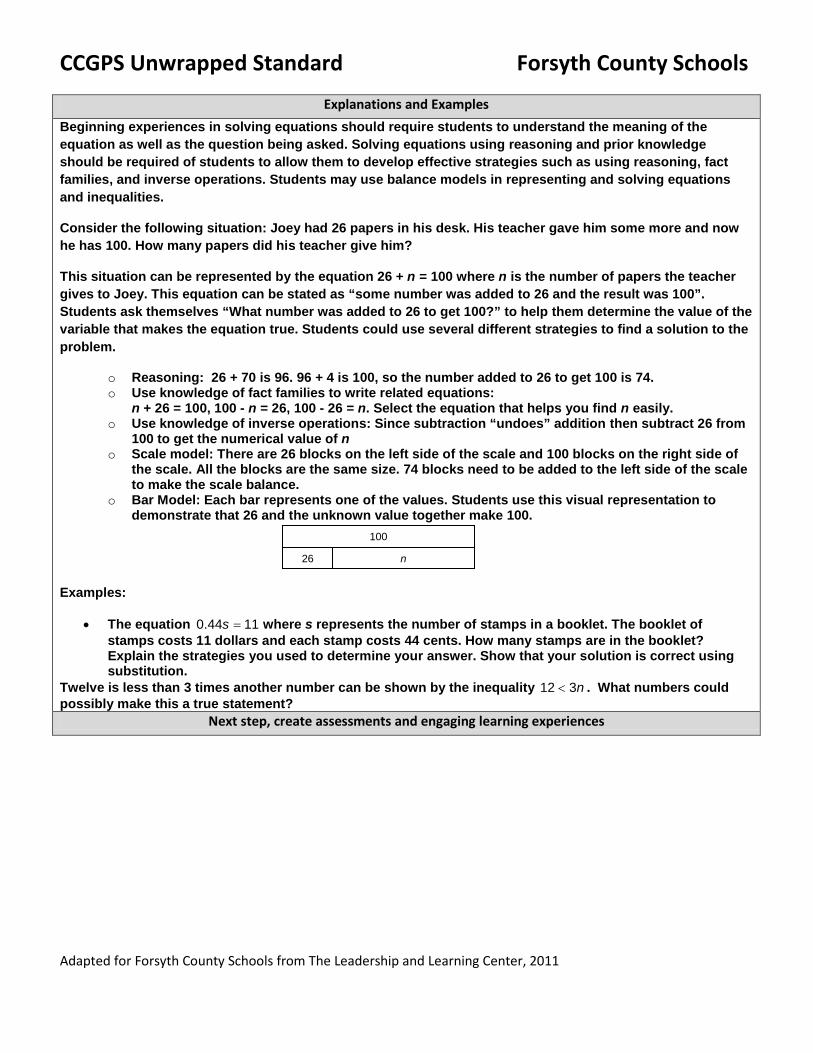
Beginning experiences in solving equations should require students to understand the meaning of the equation as well as the question being asked. Solving equations using reasoning and prior knowledge should be required of students to allow them to develop effective strategies such as using reasoning, fact families, and inverse operations. Students may use balance models in representing and solving equations and inequalities.
Consider the following situation: Joey had 26 papers in his desk. His teacher gave him some more and now he has 100. How many papers did his teacher give him?
This situation can be represented by the equation 26 + n = 100 where n is the number of papers the teacher gives to Joey. This equation can be stated as “some number was added to 26 and the result was 100”. Students ask themselves “What number was added to 26 to get 100?” to help them determine the value of the variable that makes the equation true. Students could use several different strategies to find a solution to the problem.
o Reasoning: 26 + 70 is 96. 96 + 4 is 100, so the number added to 26 to get 100 is 74. o Use knowledge of fact families to write related equations:
n + 26 = 100, 100 - n = 26, 100 - 26 = n. Select the equation that helps you find n easily. o Use knowledge of inverse operations: Since subtraction “undoes” addition then subtract 26 from
100 to get the numerical value of n o Scale model: There are 26 blocks on the left side of the scale and 100 blocks on the right side of
the scale. All the blocks are the same size. 74 blocks need to be added to the left side of the scale to make the scale balance.
o Bar Model: Each bar represents one of the values. Students use this visual representation to demonstrate that 26 and the unknown value together make 100.
Examples:
• The equation 1144.0 =s where s represents the number of stamps in a booklet. The booklet of stamps costs 11 dollars and each stamp costs 44 cents. How many stamps are in the booklet? Explain the strategies you used to determine your answer. Show that your solution is correct using substitution.
Twelve is less than 3 times another number can be shown by the inequality n312 < . What numbers could possibly make this a true statement?
Next step, create assessments and engaging learning experiences
100
26 n
CCGPS Unwrapped Standard Forsyth County Schools
Adapted for Forsyth County Schools from The Leadership and Learning Center, 2011
Content Area Math
Grade/Course 6th Grade
Unit of Study Unit 4: One-Step Equations and Inequalities
Duration of Unit
Insert a CCGPS standard below (include code). CIRCLE the SKILLS that students need to be able to do and UNDERLINE the CONCEPTS that students need to know. MCC6.EE.6 – Use variables to represent numbers and write expressions when solving a real world or mathematical problem; understand that a variable can represent an unknown number, or , depending on the purpose at hand, any number in a specified set.
Skills (what students must be able to do) Concepts (what students need to know) DOK Level / Bloom’s
Write Solve Understand Define
Variable Represent an unknown numbers Number in a specified set Writing Expressions Real world problems Mathematical problems
3 3 2 2
Step 5: Determine BIG Ideas (enduring understandings students will remember long after the unit of study)
Step 6: Write Essential Questions (these guide instruction and assessment for all tasks. The big ideas are answers to the essential questions)
Variables represents an unknown quantity Determine unknown/variable Determine mathematical relationship/pattern Translate words/symbols in numeric Write expressions to represent various real-world situations. In mathematics, letters are used to represent numbers.
Why do we use letters to represent numbers in mathematics? How do I write an equation from a given problem?
CCGPS Unwrapped Standard Forsyth County Schools
Adapted for Forsyth County Schools from The Leadership and Learning Center, 2011
Explanations and Examples
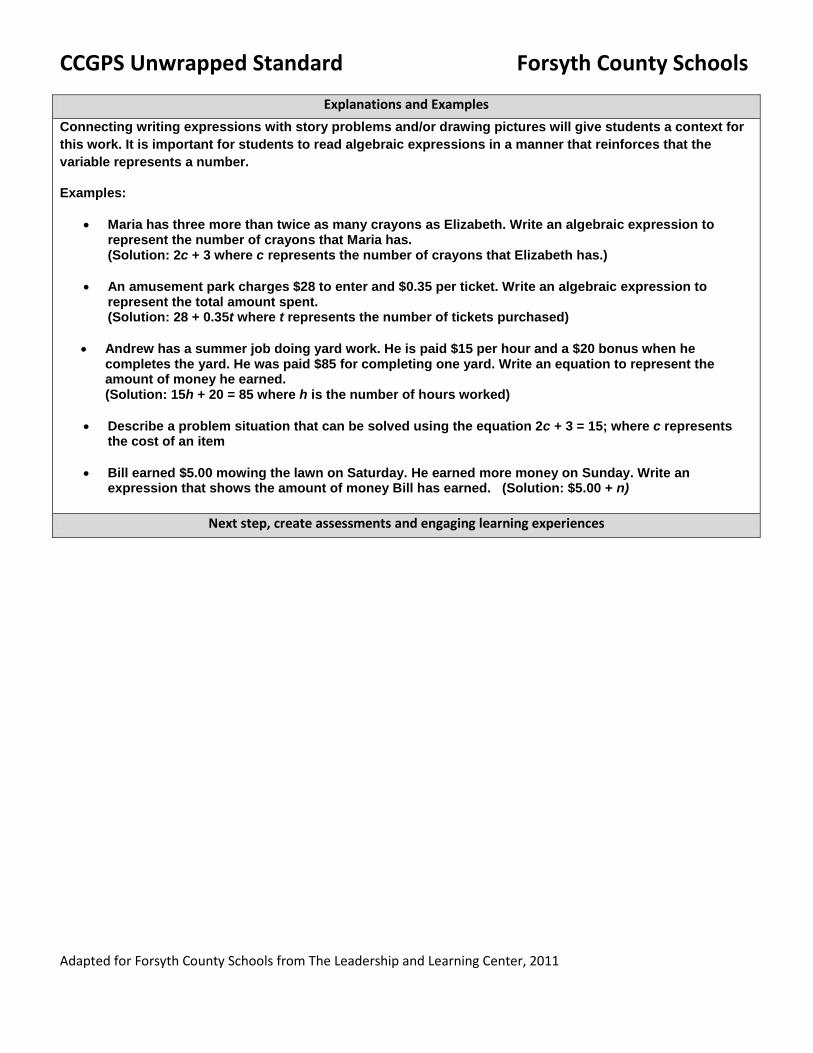
Connecting writing expressions with story problems and/or drawing pictures will give students a context for this work. It is important for students to read algebraic expressions in a manner that reinforces that the variable represents a number.
Examples:
• Maria has three more than twice as many crayons as Elizabeth. Write an algebraic expression to represent the number of crayons that Maria has. (Solution: 2c + 3 where c represents the number of crayons that Elizabeth has.)
• An amusement park charges $28 to enter and $0.35 per ticket. Write an algebraic expression to represent the total amount spent. (Solution: 28 + 0.35t where t represents the number of tickets purchased)
• Andrew has a summer job doing yard work. He is paid $15 per hour and a $20 bonus when he completes the yard. He was paid $85 for completing one yard. Write an equation to represent the amount of money he earned. (Solution: 15h + 20 = 85 where h is the number of hours worked)
• Describe a problem situation that can be solved using the equation 2c + 3 = 15; where c represents the cost of an item
• Bill earned $5.00 mowing the lawn on Saturday. He earned more money on Sunday. Write an expression that shows the amount of money Bill has earned. (Solution: $5.00 + n)
Next step, create assessments and engaging learning experiences
CCGPS Unwrapped Standard Forsyth County Schools
Adapted for Forsyth County Schools from The Leadership and Learning Center, 2011
Content Area Math
Grade/Course 6th Grade
Unit of Study Unit 4: One-Step Equations and Inequalities
Duration of Unit
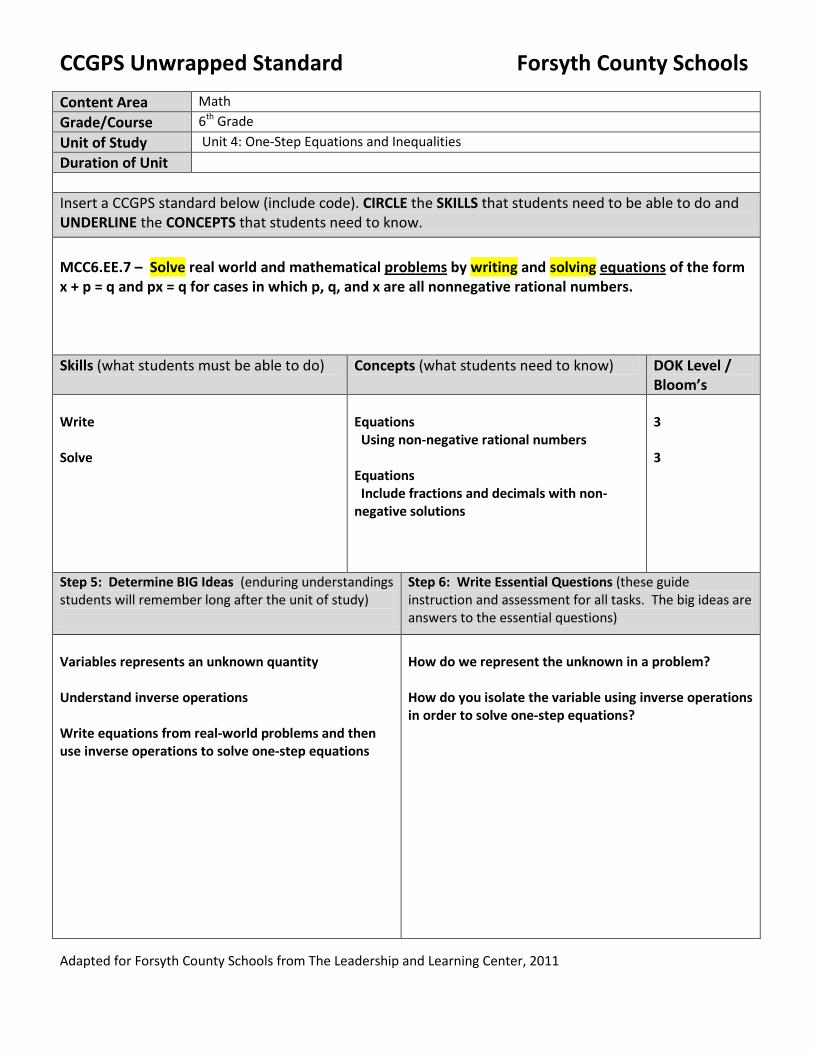
Insert a CCGPS standard below (include code). CIRCLE the SKILLS that students need to be able to do and UNDERLINE the CONCEPTS that students need to know. MCC6.EE.7 – Solve real world and mathematical problems by writing and solving equations of the form x + p = q and px = q for cases in which p, q, and x are all nonnegative rational numbers.
Skills (what students must be able to do) Concepts (what students need to know) DOK Level / Bloom’s
Write Solve
Equations Using non-negative rational numbers Equations Include fractions and decimals with non-negative solutions
3 3
Step 5: Determine BIG Ideas (enduring understandings students will remember long after the unit of study)
Step 6: Write Essential Questions (these guide instruction and assessment for all tasks. The big ideas are answers to the essential questions)
Variables represents an unknown quantity Understand inverse operations Write equations from real-world problems and then use inverse operations to solve one-step equations
How do we represent the unknown in a problem? How do you isolate the variable using inverse operations in order to solve one-step equations?
CCGPS Unwrapped Standard Forsyth County Schools
Adapted for Forsyth County Schools from The Leadership and Learning Center, 2011
Explanations and Examples
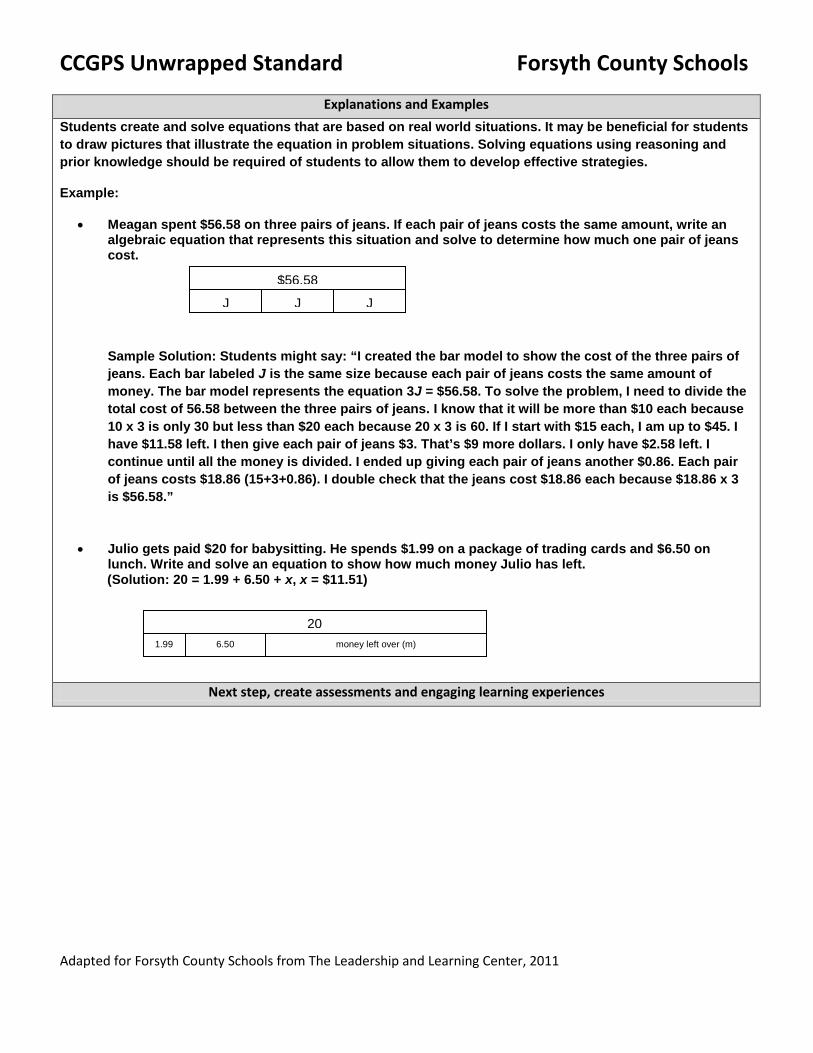
Students create and solve equations that are based on real world situations. It may be beneficial for students to draw pictures that illustrate the equation in problem situations. Solving equations using reasoning and prior knowledge should be required of students to allow them to develop effective strategies.
Example:
• Meagan spent $56.58 on three pairs of jeans. If each pair of jeans costs the same amount, write an algebraic equation that represents this situation and solve to determine how much one pair of jeans cost.
Sample Solution: Students might say: “I created the bar model to show the cost of the three pairs of jeans. Each bar labeled J is the same size because each pair of jeans costs the same amount of money. The bar model represents the equation 3J = $56.58. To solve the problem, I need to divide the total cost of 56.58 between the three pairs of jeans. I know that it will be more than $10 each because 10 x 3 is only 30 but less than $20 each because 20 x 3 is 60. If I start with $15 each, I am up to $45. I have $11.58 left. I then give each pair of jeans $3. That’s $9 more dollars. I only have $2.58 left. I continue until all the money is divided. I ended up giving each pair of jeans another $0.86. Each pair of jeans costs $18.86 (15+3+0.86). I double check that the jeans cost $18.86 each because $18.86 x 3 is $56.58.”
• Julio gets paid $20 for babysitting. He spends $1.99 on a package of trading cards and $6.50 on lunch. Write and solve an equation to show how much money Julio has left.
(Solution: 20 = 1.99 + 6.50 + x, x = $11.51)
Next step, create assessments and engaging learning experiences
$56.58
J J J
20 1.99 6.50 money left over (m)
CCGPS Unwrapped Standard Forsyth County Schools
Adapted for Forsyth County Schools from The Leadership and Learning Center, 2011
Content Area Mathematics
Grade/Course 6th Grade
Unit of Study Unit 4: One-Step Equations and Inequalities
Duration of Unit
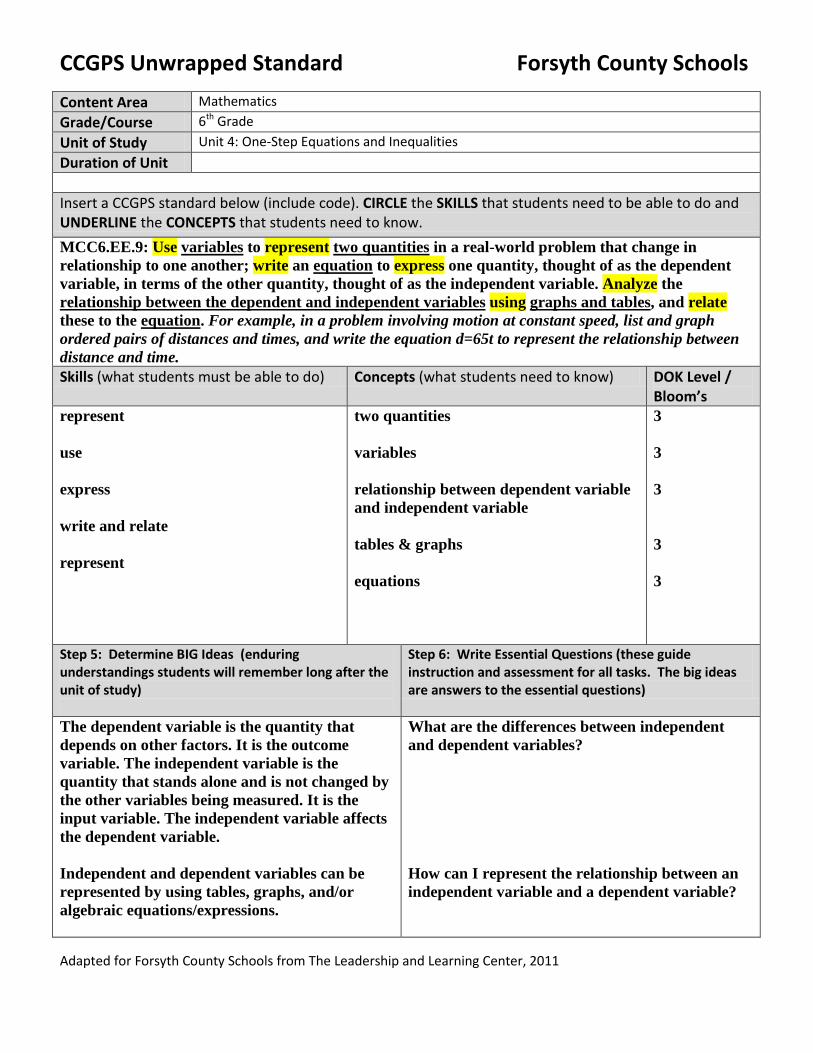
Insert a CCGPS standard below (include code). CIRCLE the SKILLS that students need to be able to do and UNDERLINE the CONCEPTS that students need to know. MCC6.EE.9: Use variables to represent two quantities in a real-world problem that change in relationship to one another; write an equation to express one quantity, thought of as the dependent variable, in terms of the other quantity, thought of as the independent variable. Analyze the relationship between the dependent and independent variables using graphs and tables, and relate these to the equation. For example, in a problem involving motion at constant speed, list and graph ordered pairs of distances and times, and write the equation d=65t to represent the relationship between distance and time. Skills (what students must be able to do) Concepts (what students need to know) DOK Level /
Bloom’s represent use express write and relate represent
two quantities variables relationship between dependent variable and independent variable tables & graphs equations
3 3 3 3 3
Step 5: Determine BIG Ideas (enduring understandings students will remember long after the unit of study)
Step 6: Write Essential Questions (these guide instruction and assessment for all tasks. The big ideas are answers to the essential questions)
The dependent variable is the quantity that depends on other factors. It is the outcome variable. The independent variable is the quantity that stands alone and is not changed by the other variables being measured. It is the input variable. The independent variable affects the dependent variable. Independent and dependent variables can be represented by using tables, graphs, and/or algebraic equations/expressions.
What are the differences between independent and dependent variables? How can I represent the relationship between an independent variable and a dependent variable?
CCGPS Unwrapped Standard Forsyth County Schools
Adapted for Forsyth County Schools from The Leadership and Learning Center, 2011
Expressions and Equations
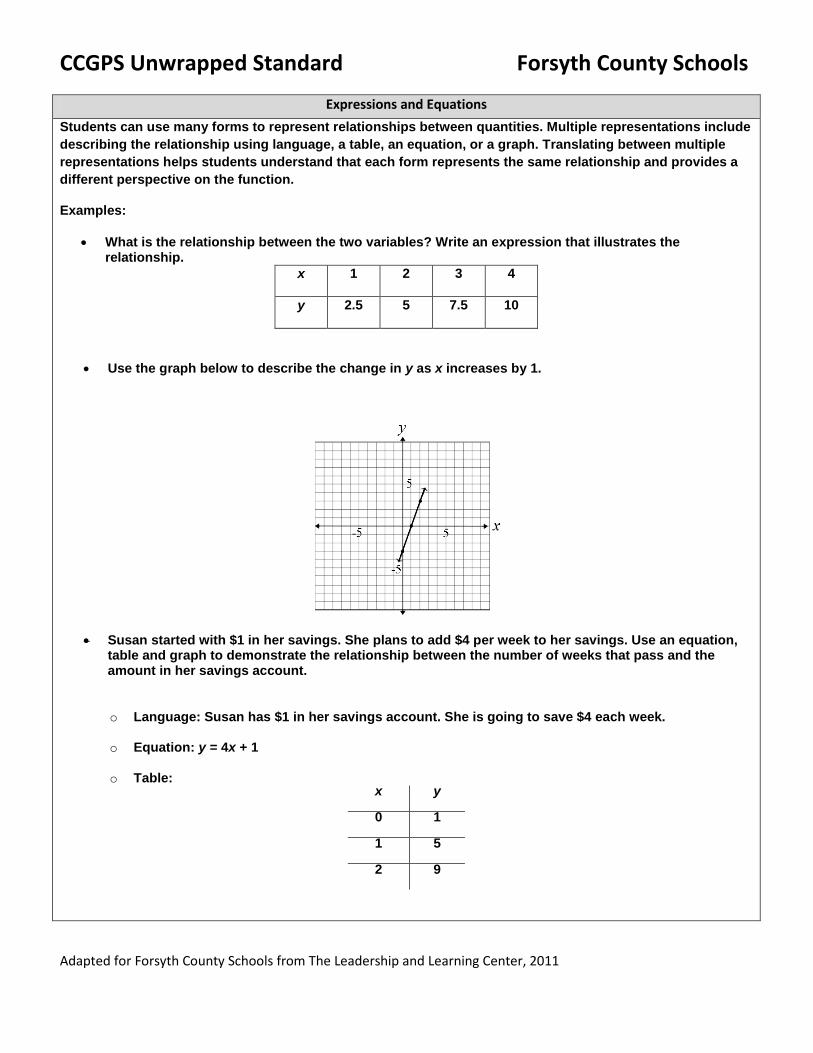
Students can use many forms to represent relationships between quantities. Multiple representations include describing the relationship using language, a table, an equation, or a graph. Translating between multiple representations helps students understand that each form represents the same relationship and provides a different perspective on the function.
Examples:
• What is the relationship between the two variables? Write an expression that illustrates the relationship.
x 1 2 3 4
y 2.5 5 7.5 10
• Use the graph below to describe the change in y as x increases by 1.
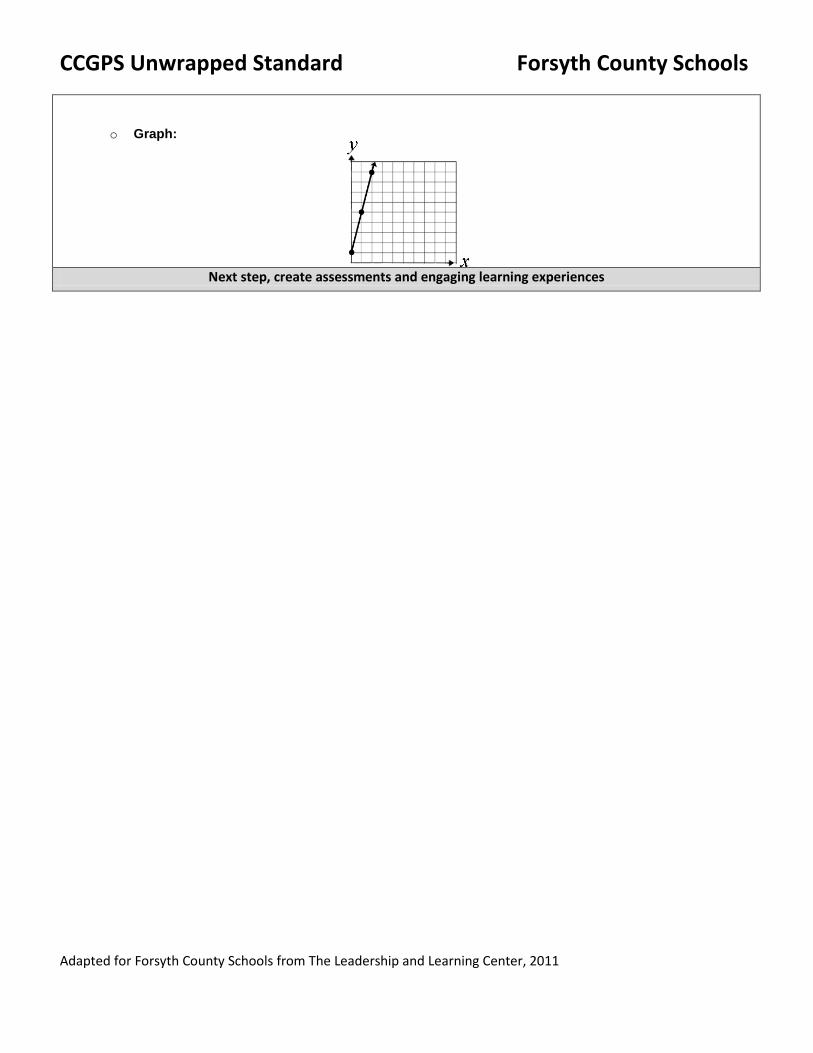
• Susan started with $1 in her savings. She plans to add $4 per week to her savings. Use an equation, table and graph to demonstrate the relationship between the number of weeks that pass and the amount in her savings account.
o Language: Susan has $1 in her savings account. She is going to save $4 each week.
o Equation: y = 4x + 1
o Table: x y
0 1
1 5
2 9
CCGPS Unwrapped Standard Forsyth County Schools
Adapted for Forsyth County Schools from The Leadership and Learning Center, 2011
o Graph:
Next step, create assessments and engaging learning experiences
CCGPS Unwrapped Standard Forsyth County Schools
Adapted for Forsyth County Schools from The Leadership and Learning Center, 2011
Content Area Math
Grade/Course 6th Grade
Unit of Study Unit 5: Area and Volume
Duration of Unit
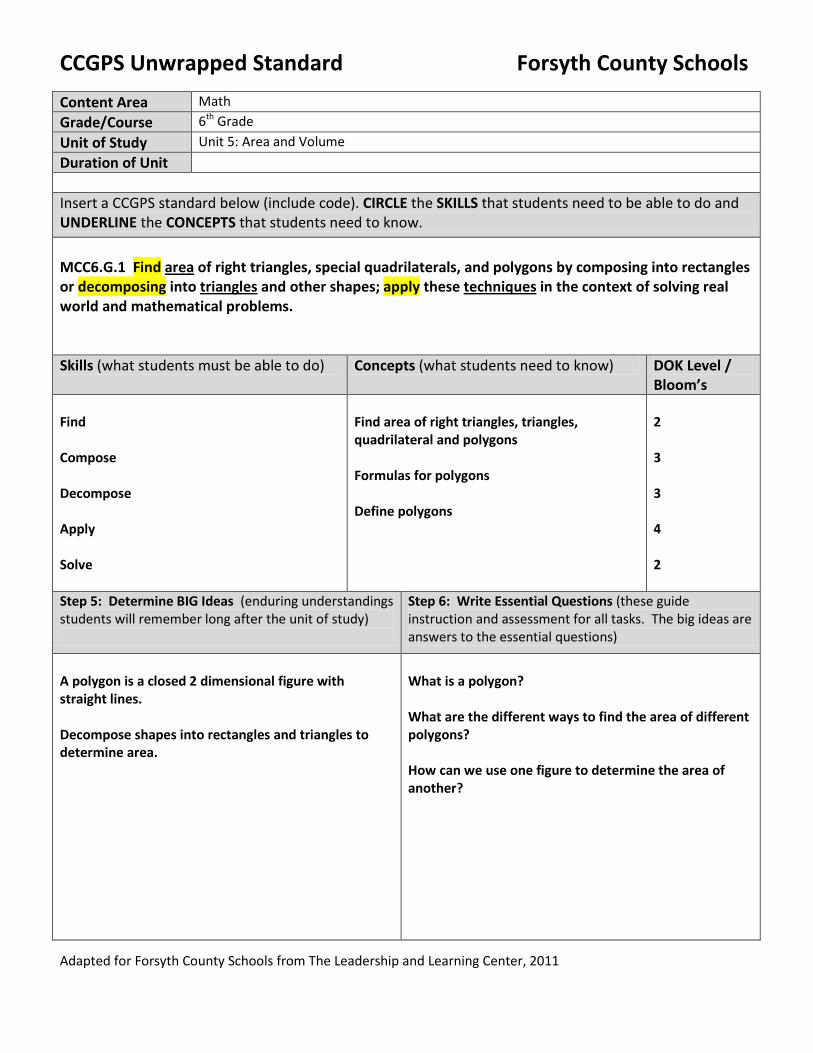
Insert a CCGPS standard below (include code). CIRCLE the SKILLS that students need to be able to do and UNDERLINE the CONCEPTS that students need to know. MCC6.G.1 Find area of right triangles, special quadrilaterals, and polygons by composing into rectangles or decomposing into triangles and other shapes; apply these techniques in the context of solving real world and mathematical problems.
Skills (what students must be able to do) Concepts (what students need to know) DOK Level / Bloom’s
Find Compose Decompose Apply Solve
Find area of right triangles, triangles, quadrilateral and polygons Formulas for polygons Define polygons
2 3 3 4 2
Step 5: Determine BIG Ideas (enduring understandings students will remember long after the unit of study)
Step 6: Write Essential Questions (these guide instruction and assessment for all tasks. The big ideas are answers to the essential questions)
A polygon is a closed 2 dimensional figure with straight lines. Decompose shapes into rectangles and triangles to determine area.
What is a polygon? What are the different ways to find the area of different polygons? How can we use one figure to determine the area of another?
CCGPS Unwrapped Standard Forsyth County Schools
Adapted for Forsyth County Schools from The Leadership and Learning Center, 2011
Explanations and Examples
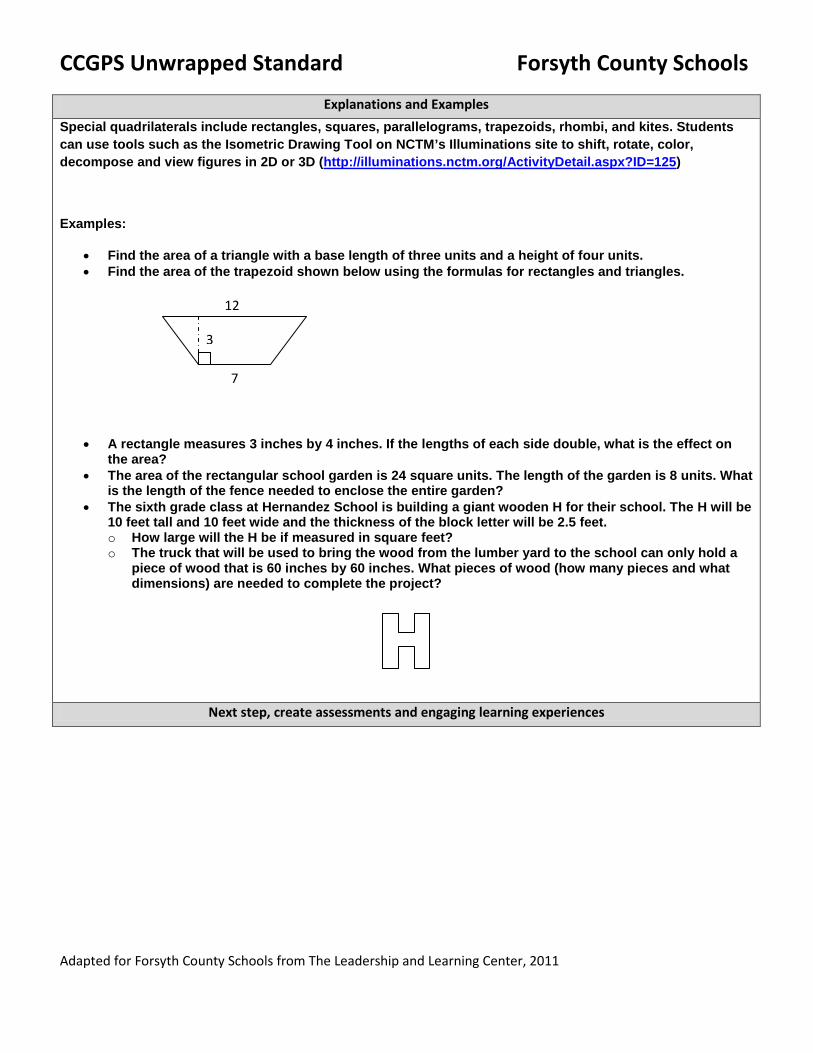
Special quadrilaterals include rectangles, squares, parallelograms, trapezoids, rhombi, and kites. Students can use tools such as the Isometric Drawing Tool on NCTM’s Illuminations site to shift, rotate, color, decompose and view figures in 2D or 3D (http://illuminations.nctm.org/ActivityDetail.aspx?ID=125)
Examples:
• Find the area of a triangle with a base length of three units and a height of four units. • Find the area of the trapezoid shown below using the formulas for rectangles and triangles.
• A rectangle measures 3 inches by 4 inches. If the lengths of each side double, what is the effect on the area?
• The area of the rectangular school garden is 24 square units. The length of the garden is 8 units. What is the length of the fence needed to enclose the entire garden?
• The sixth grade class at Hernandez School is building a giant wooden H for their school. The H will be 10 feet tall and 10 feet wide and the thickness of the block letter will be 2.5 feet. o How large will the H be if measured in square feet? o The truck that will be used to bring the wood from the lumber yard to the school can only hold a
piece of wood that is 60 inches by 60 inches. What pieces of wood (how many pieces and what dimensions) are needed to complete the project?
Next step, create assessments and engaging learning experiences
12
7
3
CCGPS Unwrapped Standard Forsyth County Schools
Adapted for Forsyth County Schools from The Leadership and Learning Center, 2011
Content Area Math
Grade/Course 6th Grade
Unit of Study Unit 1: Number System Fluency
Duration of Unit
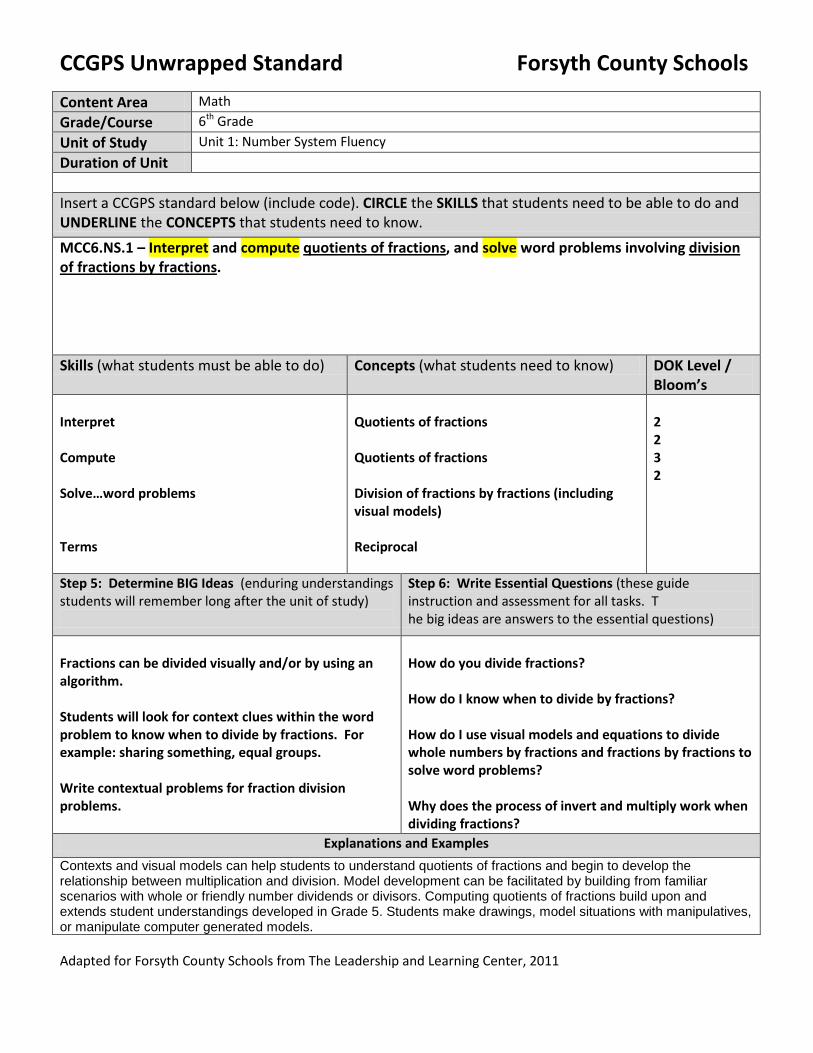
Insert a CCGPS standard below (include code). CIRCLE the SKILLS that students need to be able to do and UNDERLINE the CONCEPTS that students need to know. MCC6.NS.1 – Interpret and compute quotients of fractions, and solve word problems involving division of fractions by fractions
.
Skills (what students must be able to do) Concepts (what students need to know) DOK Level /
Bloom’s Interpret Compute Solve…word problems Terms
Quotients of fractions Quotients of fractions Division of fractions by fractions (including visual models) Reciprocal
2 2 3 2
Step 5: Determine BIG Ideas (enduring understandings students will remember long after the unit of study)
Step 6: Write Essential Questions (these guide instruction and assessment for all tasks. T he big ideas are answers to the essential questions)
Fractions can be divided visually and/or by using an algorithm. Students will look for context clues within the word problem to know when to divide by fractions. For example: sharing something, equal groups. Write contextual problems for fraction division problems.
How do you divide fractions? How do I know when to divide by fractions? How do I use visual models and equations to divide whole numbers by fractions and fractions by fractions to solve word problems? Why does the process of invert and multiply work when dividing fractions?
Explanations and Examples
Contexts and visual models can help students to understand quotients of fractions and begin to develop the relationship between multiplication and division. Model development can be facilitated by building from familiar scenarios with whole or friendly number dividends or divisors. Computing quotients of fractions build upon and extends student understandings developed in Grade 5. Students make drawings, model situations with manipulatives, or manipulate computer generated models.
CCGPS Unwrapped Standard Forsyth County Schools
Adapted for Forsyth County Schools from The Leadership and Learning Center, 2011
Examples:
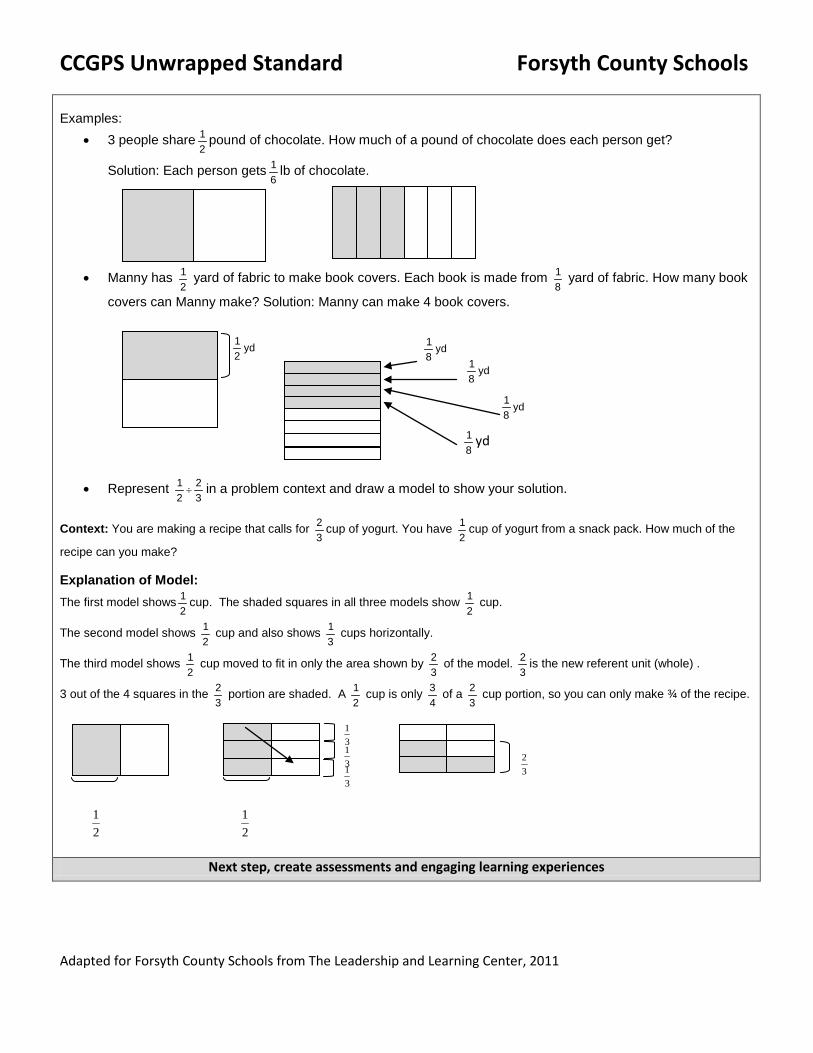
• 3 people share21 pound of chocolate. How much of a pound of chocolate does each person get?
Solution: Each person gets61 lb of chocolate.
• Manny has
21 yard of fabric to make book covers. Each book is made from
81 yard of fabric. How many book
covers can Manny make? Solution: Manny can make 4 book covers.
• Represent 32
21÷ in a problem context and draw a model to show your solution.
Context: You are making a recipe that calls for 32 cup of yogurt. You have
21 cup of yogurt from a snack pack. How much of the
recipe can you make? Explanation of Model: The first model shows
21 cup. The shaded squares in all three models show
21 cup.
The second model shows 21 cup and also shows
31 cups horizontally.
The third model shows 21 cup moved to fit in only the area shown by
32 of the model.
32 is the new referent unit (whole) .
3 out of the 4 squares in the 32 portion are shaded. A
21 cup is only
43 of a
32 cup portion, so you can only make ¾ of the recipe.
21
21
Next step, create assessments and engaging learning experiences
yd81
yd81
yd81
81 yd
32
31
31
31
yd21
CCGPS Unwrapped Standard Forsyth County Schools
Adapted for Forsyth County Schools from The Leadership and Learning Center, 2011
Content Area Math
Grade/Course 6th
Unit of Study Unit 1: Number System Fluency
Duration of Unit
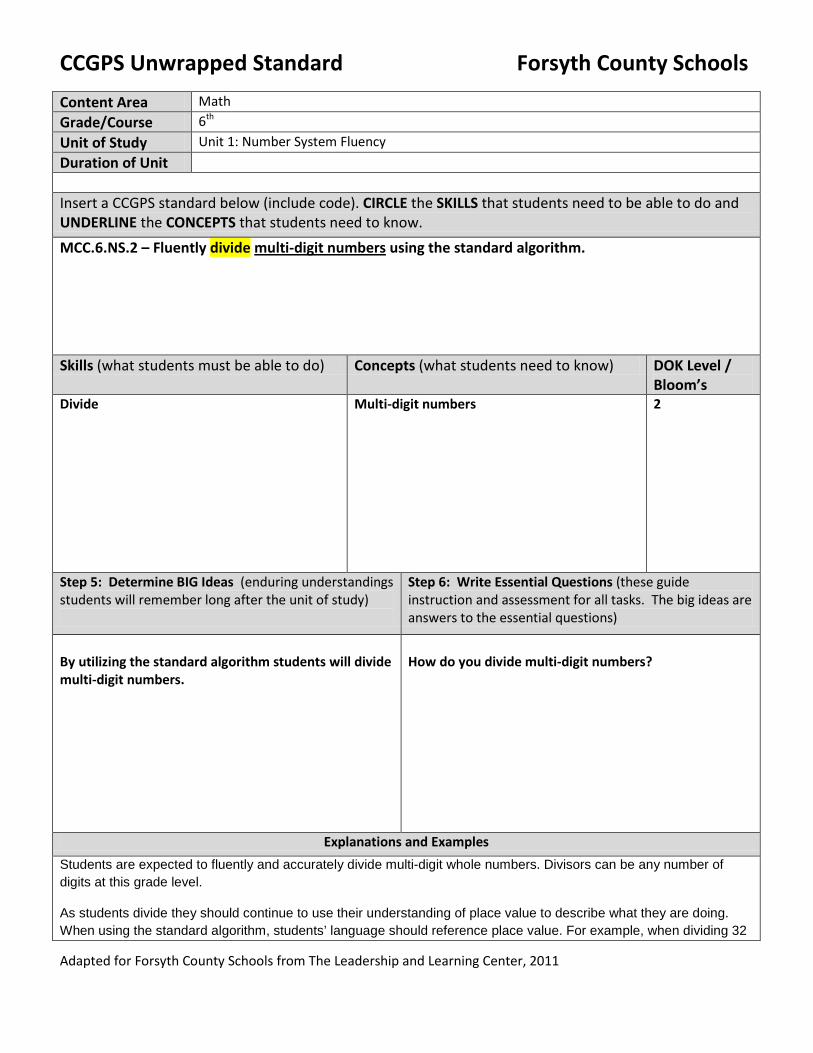
Insert a CCGPS standard below (include code). CIRCLE the SKILLS that students need to be able to do and UNDERLINE the CONCEPTS that students need to know. MCC.6.NS.2 – Fluently divide multi-digit numbers using the standard algorithm.
Skills (what students must be able to do) Concepts (what students need to know) DOK Level / Bloom’s
Divide Multi-digit numbers 2
Step 5: Determine BIG Ideas (enduring understandings students will remember long after the unit of study)
Step 6: Write Essential Questions (these guide instruction and assessment for all tasks. The big ideas are answers to the essential questions)
By utilizing the standard algorithm students will divide multi-digit numbers.
How do you divide multi-digit numbers?
Explanations and Examples
Students are expected to fluently and accurately divide multi-digit whole numbers. Divisors can be any number of digits at this grade level.
As students divide they should continue to use their understanding of place value to describe what they are doing. When using the standard algorithm, students’ language should reference place value. For example, when dividing 32
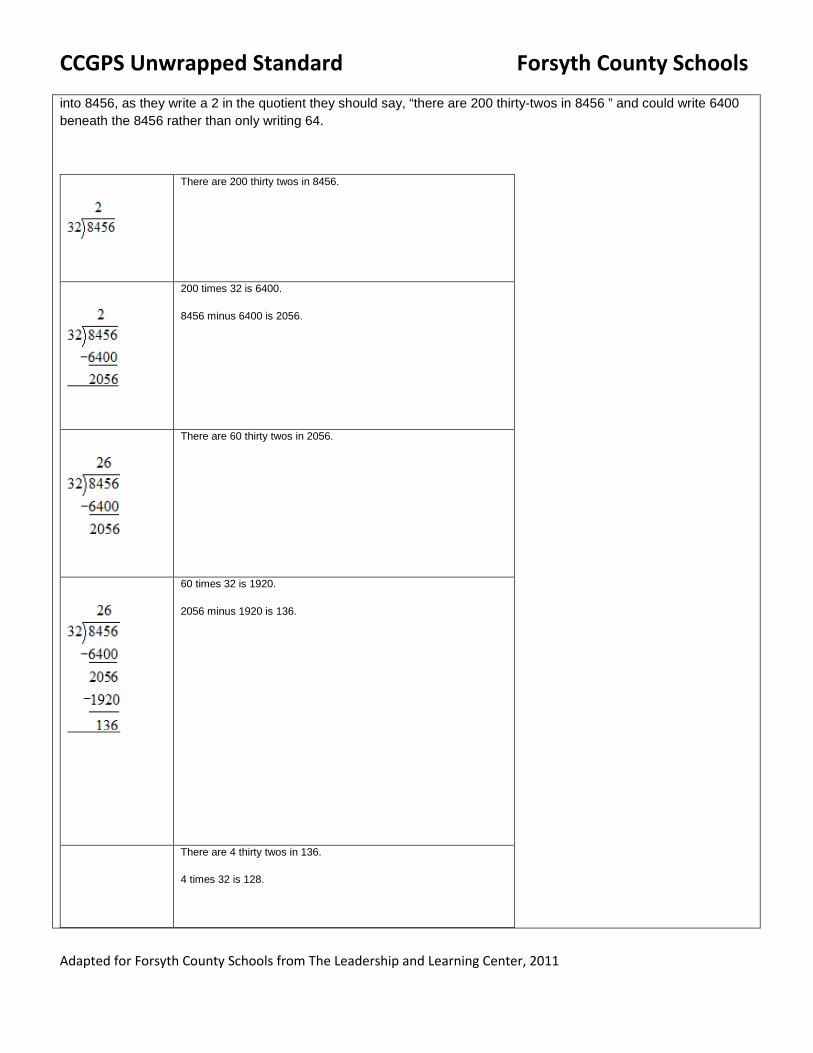
CCGPS Unwrapped Standard Forsyth County Schools
Adapted for Forsyth County Schools from The Leadership and Learning Center, 2011
into 8456, as they write a 2 in the quotient they should say, “there are 200 thirty-twos in 8456 ” and could write 6400 beneath the 8456 rather than only writing 64.
There are 200 thirty twos in 8456.
200 times 32 is 6400.
8456 minus 6400 is 2056.
There are 60 thirty twos in 2056.
60 times 32 is 1920.
2056 minus 1920 is 136.
There are 4 thirty twos in 136.
4 times 32 is 128.
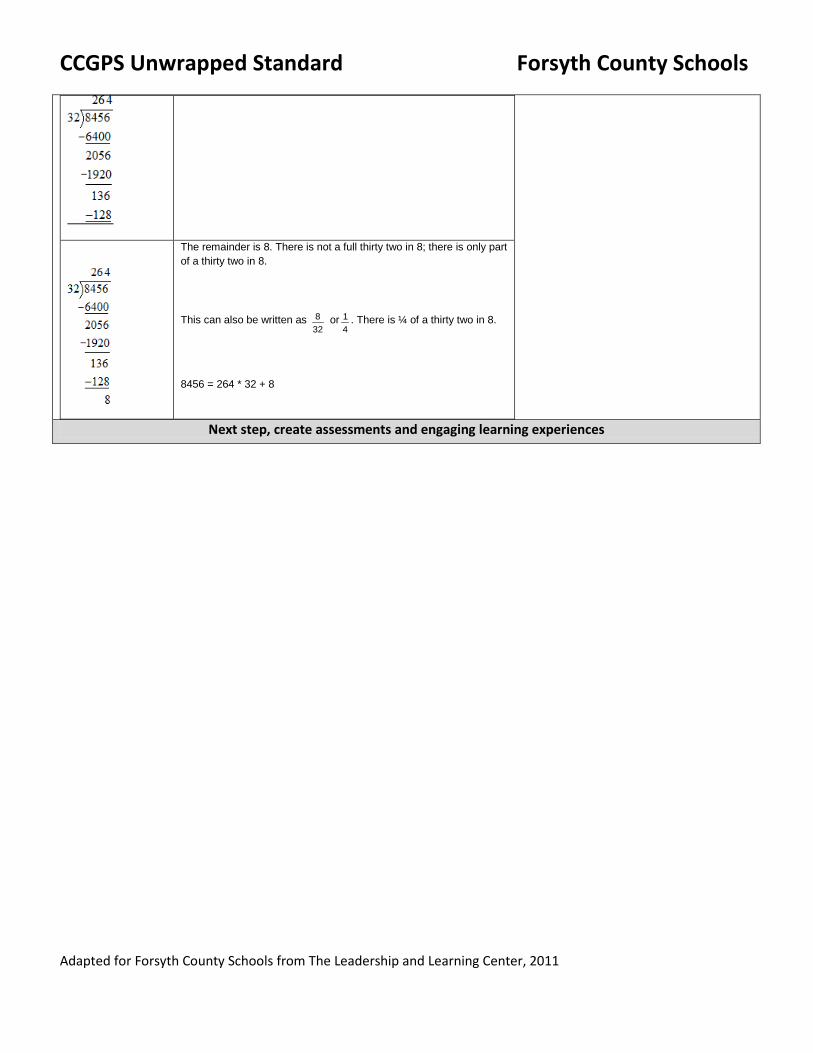
CCGPS Unwrapped Standard Forsyth County Schools
Adapted for Forsyth County Schools from The Leadership and Learning Center, 2011
The remainder is 8. There is not a full thirty two in 8; there is only part of a thirty two in 8.
This can also be written as 328 or
41 . There is ¼ of a thirty two in 8.
8456 = 264 * 32 + 8
Next step, create assessments and engaging learning experiences
CCGPS Unwrapped Standard Forsyth County Schools
Adapted for Forsyth County Schools from The Leadership and Learning Center, 2011
Content Area Mathematics
Grade/Course 6th Grade
Unit of Study Unit 1: Number System Fluency
Duration of Unit
Insert a CCGPS standard below (include code). CIRCLE the SKILLS that students need to be able to do and UNDERLINE the CONCEPTS that students need to know. MCC6.NS.3 Fluently add, subtract, multiply, and divide multi‐digit decimals
using the standard algorithm for each operation.
Skills (what students must be able to do) Concepts (what students need to know) DOK Level /
Bloom’s add subtract multiply divide solve
multi-digit decimals multi-digit decimals multi-digit decimals multi-digit decimals word problems
2 2 2 2 2
Step 5: Determine BIG Ideas (enduring understandings students will remember long after the unit of study)
Step 6: Write Essential Questions (these guide instruction and assessment for all tasks. The big ideas are answers to the essential questions)
Fluently add, subtract, multiply, and divide multi-digit decimals using the standard algorithm for each operation.
How can we add, subtract, multiply, and divide multi-digit decimals?
CCGPS Unwrapped Standard Forsyth County Schools
Adapted for Forsyth County Schools from The Leadership and Learning Center, 2011
Exploration and Examples
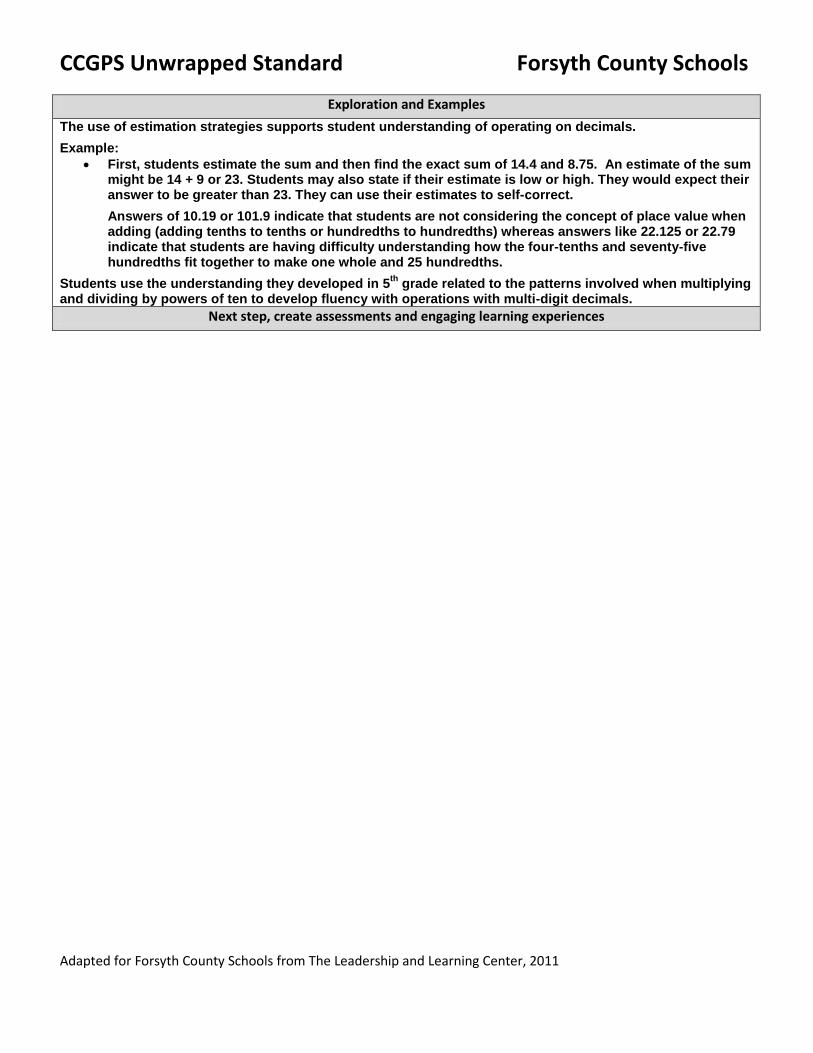
The use of estimation strategies supports student understanding of operating on decimals.
Example: • First, students estimate the sum and then find the exact sum of 14.4 and 8.75. An estimate of the sum
might be 14 + 9 or 23. Students may also state if their estimate is low or high. They would expect their answer to be greater than 23. They can use their estimates to self-correct.
Answers of 10.19 or 101.9 indicate that students are not considering the concept of place value when adding (adding tenths to tenths or hundredths to hundredths) whereas answers like 22.125 or 22.79 indicate that students are having difficulty understanding how the four-tenths and seventy-five hundredths fit together to make one whole and 25 hundredths.
Students use the understanding they developed in 5th grade related to the patterns involved when multiplying and dividing by powers of ten to develop fluency with operations with multi-digit decimals.
Next step, create assessments and engaging learning experiences
CCGPS Unwrapped Standard Forsyth County Schools
Adapted for Forsyth County Schools from The Leadership and Learning Center, 2011
Content Area Math Grade/Course 6th Grade Unit of Study Unit 6: Rational Explorations: Numbers and their opposites Duration of Unit
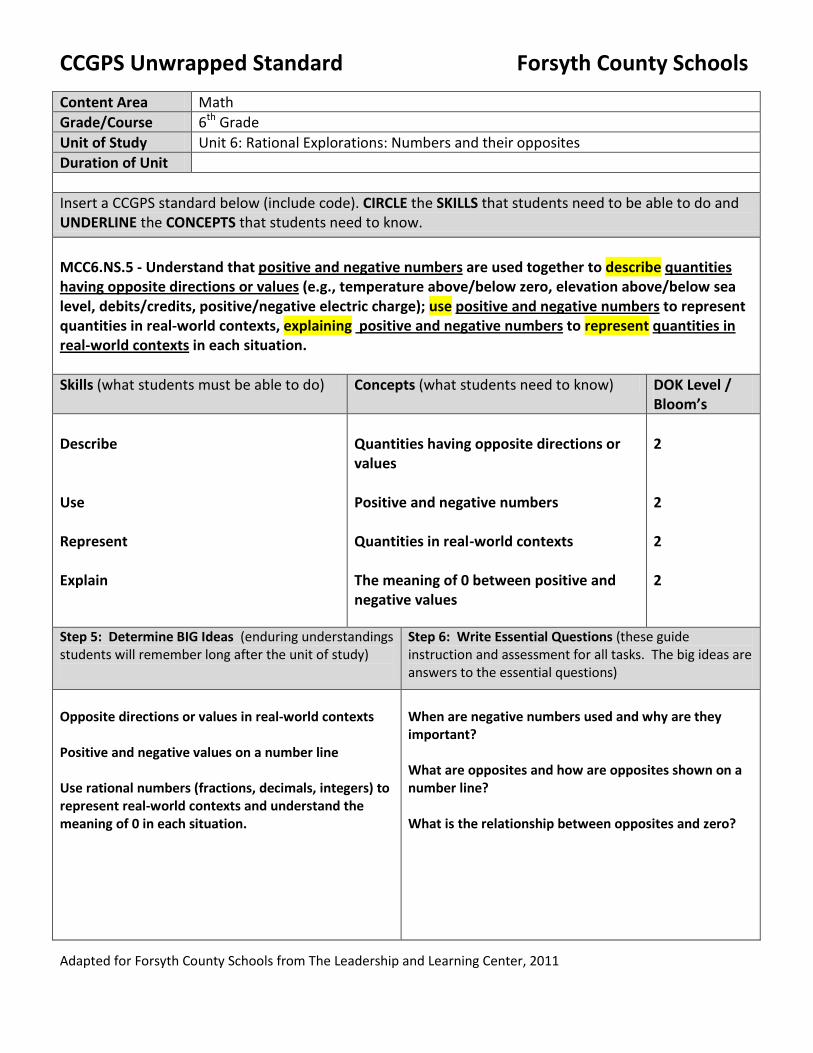
Insert a CCGPS standard below (include code). CIRCLE the SKILLS that students need to be able to do and UNDERLINE the CONCEPTS that students need to know. MCC6.NS.5 - Understand that positive and negative numbers are used together to describe quantities having opposite directions or values (e.g., temperature above/below zero, elevation above/below sea level, debits/credits, positive/negative electric charge); use positive and negative numbers to represent quantities in real-world contexts, explaining positive and negative numbers to represent quantities in real-world contexts
in each situation.
Skills (what students must be able to do) Concepts (what students need to know) DOK Level / Bloom’s
Describe Use Represent Explain
Quantities having opposite directions or values Positive and negative numbers Quantities in real-world contexts The meaning of 0 between positive and negative values
2 2 2 2
Step 5: Determine BIG Ideas (enduring understandings students will remember long after the unit of study)
Step 6: Write Essential Questions (these guide instruction and assessment for all tasks. The big ideas are answers to the essential questions)
Opposite directions or values in real-world contexts Positive and negative values on a number line Use rational numbers (fractions, decimals, integers) to represent real-world contexts and understand the meaning of 0 in each situation.
When are negative numbers used and why are they important? What are opposites and how are opposites shown on a number line? What is the relationship between opposites and zero?
CCGPS Unwrapped Standard Forsyth County Schools
Adapted for Forsyth County Schools from The Leadership and Learning Center, 2011
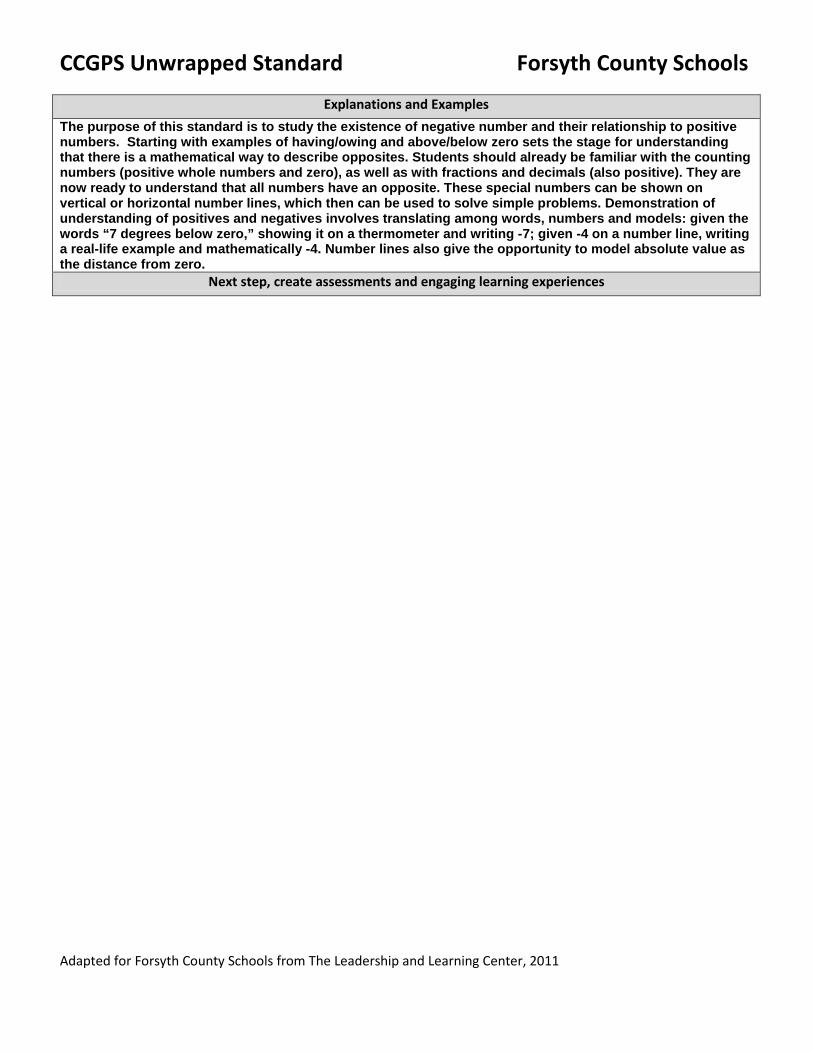
Explanations and Examples
The purpose of this standard is to study the existence of negative number and their relationship to positive numbers. Starting with examples of having/owing and above/below zero sets the stage for understanding that there is a mathematical way to describe opposites. Students should already be familiar with the counting numbers (positive whole numbers and zero), as well as with fractions and decimals (also positive). They are now ready to understand that all numbers have an opposite. These special numbers can be shown on vertical or horizontal number lines, which then can be used to solve simple problems. Demonstration of understanding of positives and negatives involves translating among words, numbers and models: given the words “7 degrees below zero,” showing it on a thermometer and writing -7; given -4 on a number line, writing a real-life example and mathematically -4. Number lines also give the opportunity to model absolute value as the distance from zero.
Next step, create assessments and engaging learning experiences
CCGPS Unwrapped Standard Forsyth County Schools
Adapted for Forsyth County Schools from The Leadership and Learning Center, 2011
Content Area Math
Grade/Course 6th Grade
Unit of Study Unit 6: Rational Explorations: Numbers and their opposites
Duration of Unit
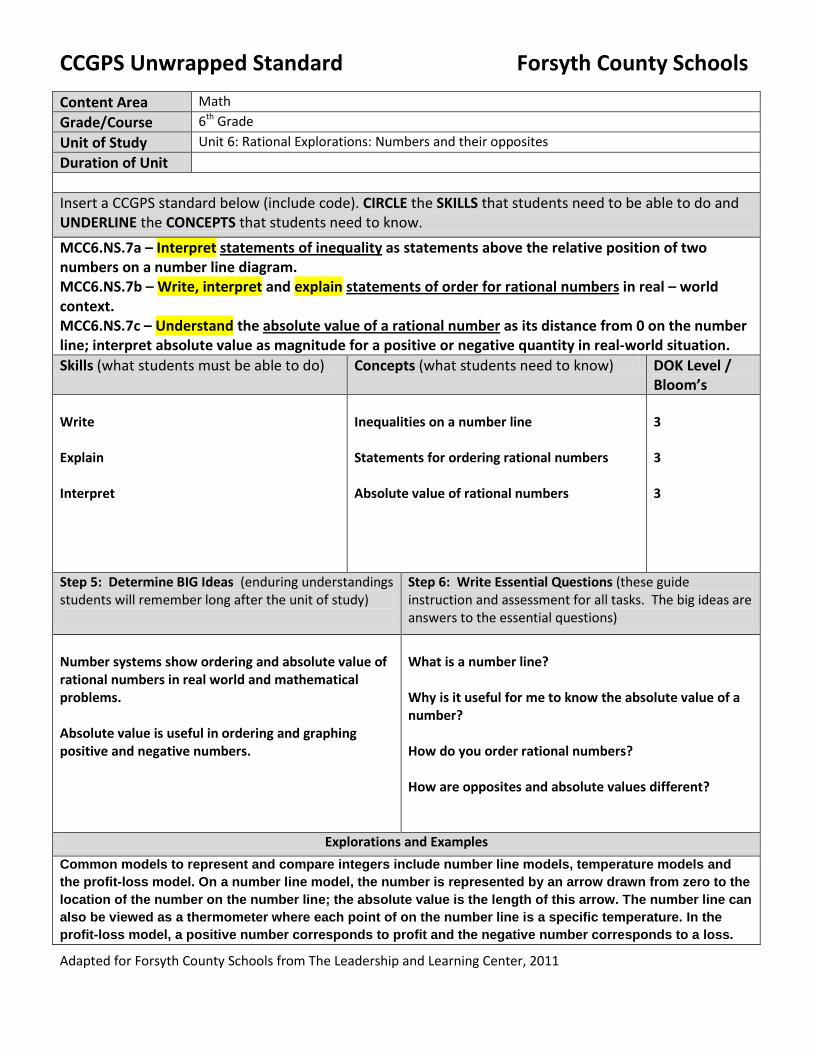
Insert a CCGPS standard below (include code). CIRCLE the SKILLS that students need to be able to do and UNDERLINE the CONCEPTS that students need to know. MCC6.NS.7a – Interpret statements of inequality
MCC6.NS.7b – Write, interpret and explain
as statements above the relative position of two numbers on a number line diagram.
statements of order for rational numbers
MCC6.NS.7c – Understand the
in real – world context.
absolute value of a rational number as its distance from 0 on the number line; interpret absolute value as magnitude for a positive or negative quantity in real-world situation. Skills (what students must be able to do) Concepts (what students need to know) DOK Level /
Bloom’s Write Explain Interpret
Inequalities on a number line Statements for ordering rational numbers Absolute value of rational numbers
3 3 3
Step 5: Determine BIG Ideas (enduring understandings students will remember long after the unit of study)
Step 6: Write Essential Questions (these guide instruction and assessment for all tasks. The big ideas are answers to the essential questions)
Number systems show ordering and absolute value of rational numbers in real world and mathematical problems. Absolute value is useful in ordering and graphing positive and negative numbers.
What is a number line? Why is it useful for me to know the absolute value of a number? How do you order rational numbers? How are opposites and absolute values different?
Explorations and Examples
Common models to represent and compare integers include number line models, temperature models and the profit-loss model. On a number line model, the number is represented by an arrow drawn from zero to the location of the number on the number line; the absolute value is the length of this arrow. The number line can also be viewed as a thermometer where each point of on the number line is a specific temperature. In the profit-loss model, a positive number corresponds to profit and the negative number corresponds to a loss.
CCGPS Unwrapped Standard Forsyth County Schools
Adapted for Forsyth County Schools from The Leadership and Learning Center, 2011
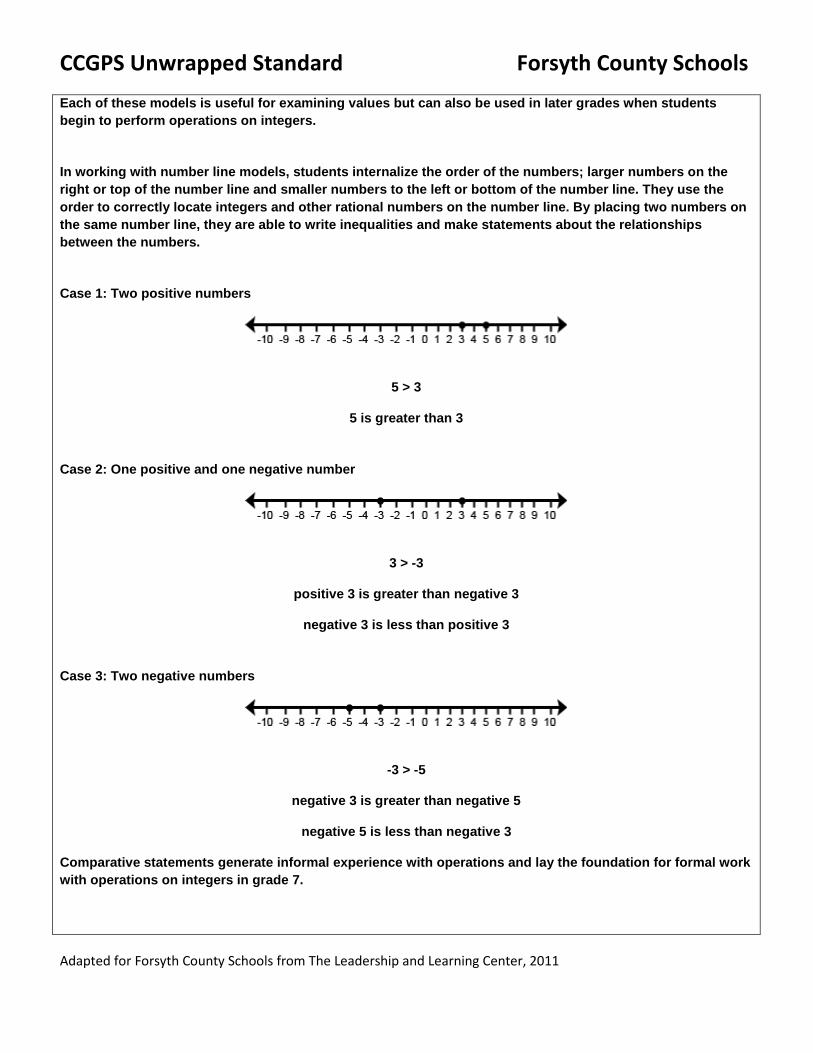
Each of these models is useful for examining values but can also be used in later grades when students begin to perform operations on integers.
In working with number line models, students internalize the order of the numbers; larger numbers on the right or top of the number line and smaller numbers to the left or bottom of the number line. They use the order to correctly locate integers and other rational numbers on the number line. By placing two numbers on the same number line, they are able to write inequalities and make statements about the relationships between the numbers.
Case 1: Two positive numbers
5 > 3
5 is greater than 3
Case 2: One positive and one negative number
3 > -3
positive 3 is greater than negative 3
negative 3 is less than positive 3
Case 3: Two negative numbers
-3 > -5
negative 3 is greater than negative 5
negative 5 is less than negative 3
Comparative statements generate informal experience with operations and lay the foundation for formal work with operations on integers in grade 7.
CCGPS Unwrapped Standard Forsyth County Schools
Adapted for Forsyth County Schools from The Leadership and Learning Center, 2011
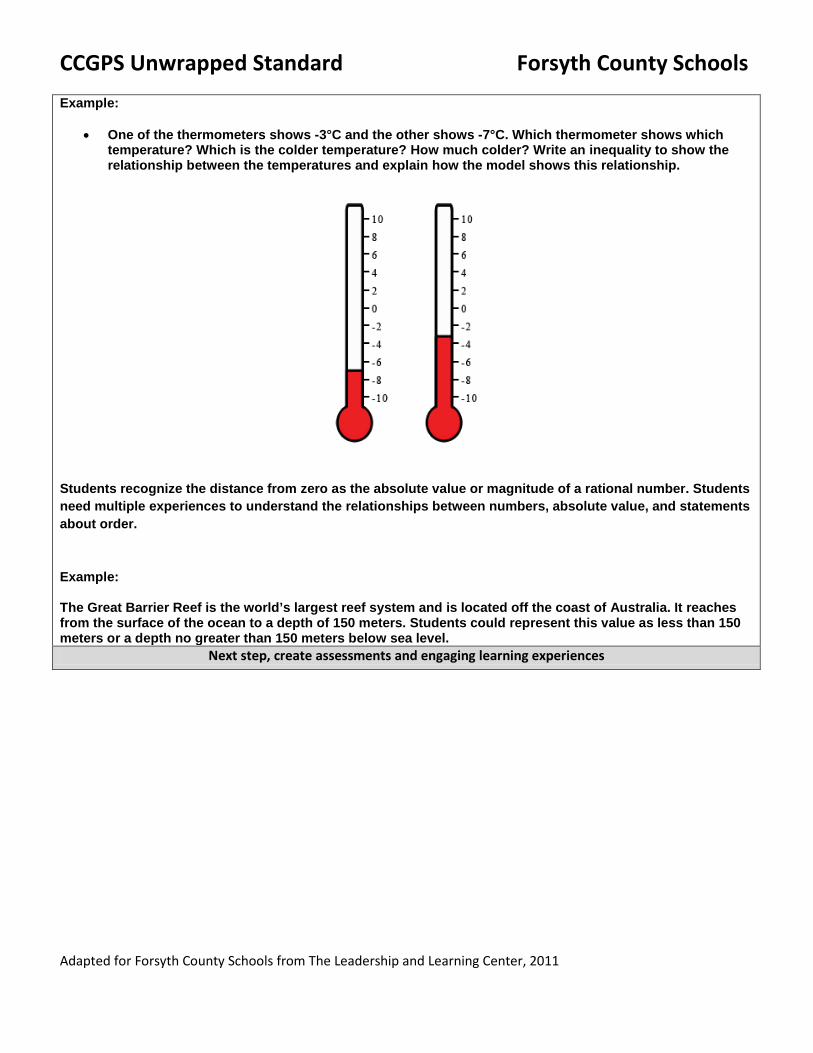
Example:
• One of the thermometers shows -3°C and the other shows -7°C. Which thermometer shows which temperature? Which is the colder temperature? How much colder? Write an inequality to show the relationship between the temperatures and explain how the model shows this relationship.
Students recognize the distance from zero as the absolute value or magnitude of a rational number. Students need multiple experiences to understand the relationships between numbers, absolute value, and statements about order.
Example:
The Great Barrier Reef is the world’s largest reef system and is located off the coast of Australia. It reaches from the surface of the ocean to a depth of 150 meters. Students could represent this value as less than 150 meters or a depth no greater than 150 meters below sea level.
Next step, create assessments and engaging learning experiences
CCGPS Unwrapped Standard Forsyth County Schools
Adapted for Forsyth County Schools from The Leadership and Learning Center, 2011
Content Area Math
Grade/Course 6th
Unit of Study Unit 2: Rate, Ratio and Proportional Reasoning Using Equivalent Fractins
Duration of Unit
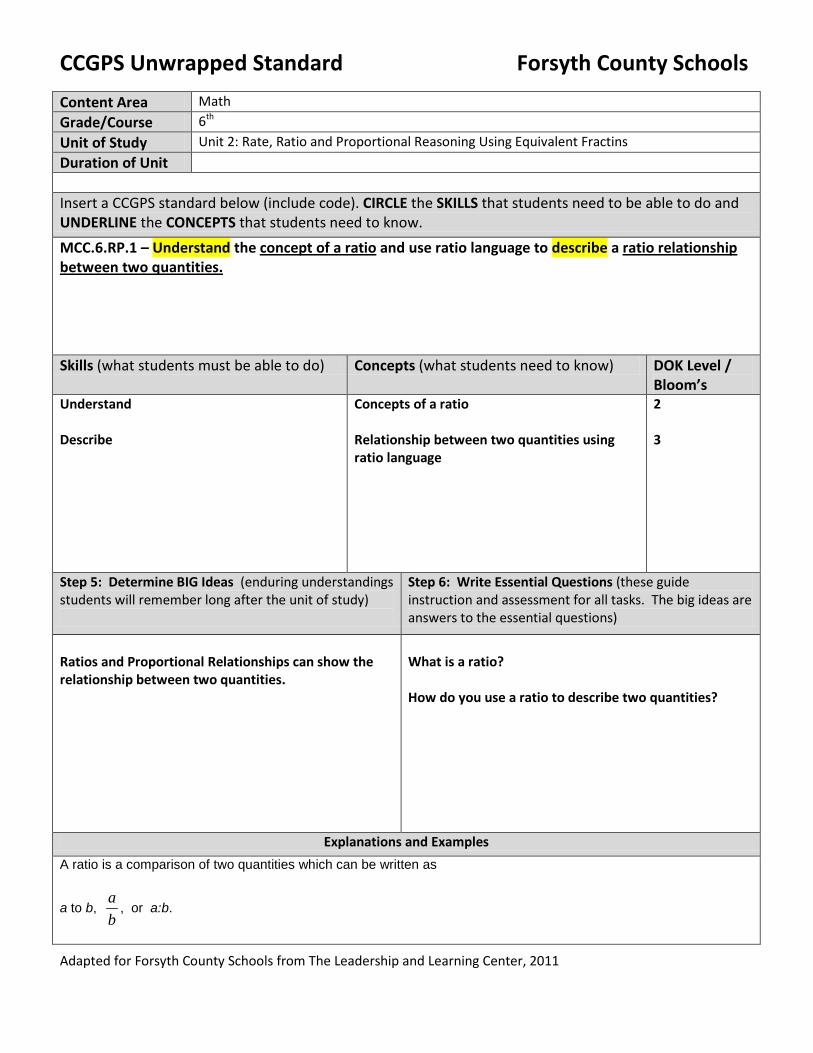
Insert a CCGPS standard below (include code). CIRCLE the SKILLS that students need to be able to do and UNDERLINE the CONCEPTS that students need to know. MCC.6.RP.1 – Understand the concept of a ratio and use ratio language to describe a
ratio relationship between two quantities.
Skills (what students must be able to do) Concepts (what students need to know) DOK Level / Bloom’s
Understand Describe
Concepts of a ratio Relationship between two quantities using ratio language
2 3
Step 5: Determine BIG Ideas (enduring understandings students will remember long after the unit of study)
Step 6: Write Essential Questions (these guide instruction and assessment for all tasks. The big ideas are answers to the essential questions)
Ratios and Proportional Relationships can show the relationship between two quantities.
What is a ratio? How do you use a ratio to describe two quantities?
Explanations and Examples
A ratio is a comparison of two quantities which can be written as
a to b, ba
, or a:b.
CCGPS Unwrapped Standard Forsyth County Schools
Adapted for Forsyth County Schools from The Leadership and Learning Center, 2011
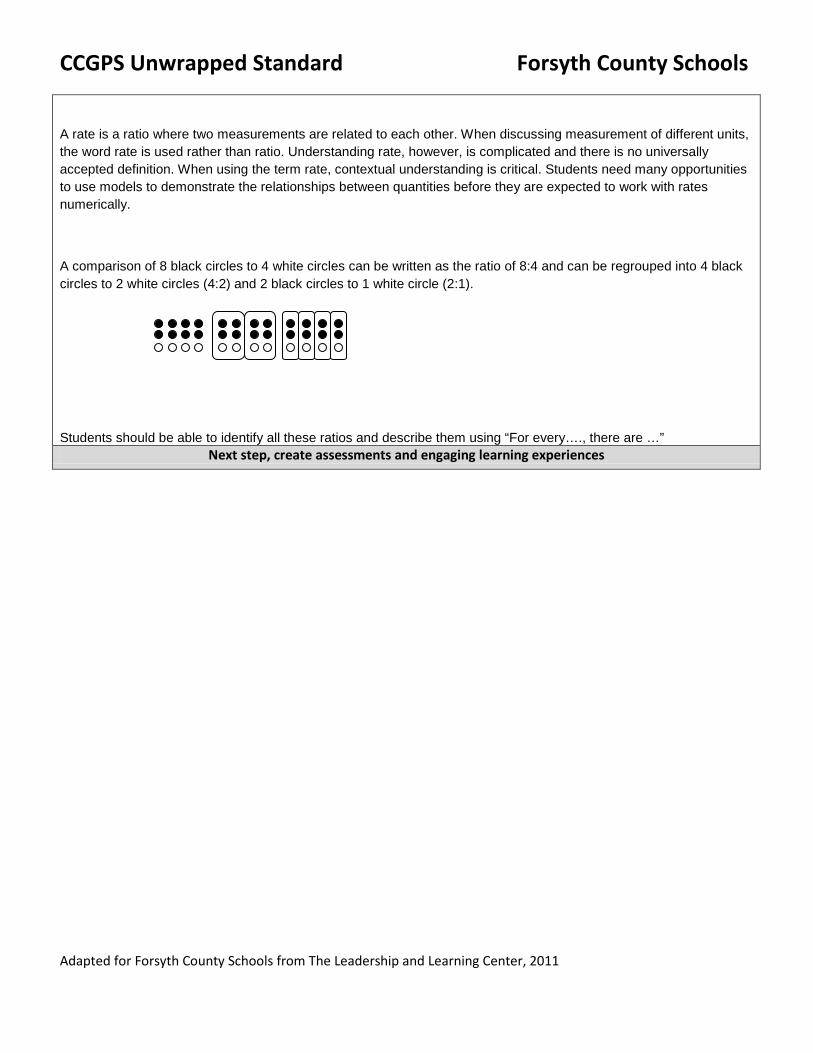
A rate is a ratio where two measurements are related to each other. When discussing measurement of different units, the word rate is used rather than ratio. Understanding rate, however, is complicated and there is no universally accepted definition. When using the term rate, contextual understanding is critical. Students need many opportunities to use models to demonstrate the relationships between quantities before they are expected to work with rates numerically.
A comparison of 8 black circles to 4 white circles can be written as the ratio of 8:4 and can be regrouped into 4 black circles to 2 white circles (4:2) and 2 black circles to 1 white circle (2:1).
Students should be able to identify all these ratios and describe them using “For every…., there are …”
Next step, create assessments and engaging learning experiences
CCGPS Unwrapped Standard Forsyth County Schools
Adapted for Forsyth County Schools from The Leadership and Learning Center, 2011
Content Area Math
Grade/Course 6th Grade
Unit of Study Unit 2: Rate, Ratio and Proportion Reasoning Using Equivalent Fractions
Duration of Unit
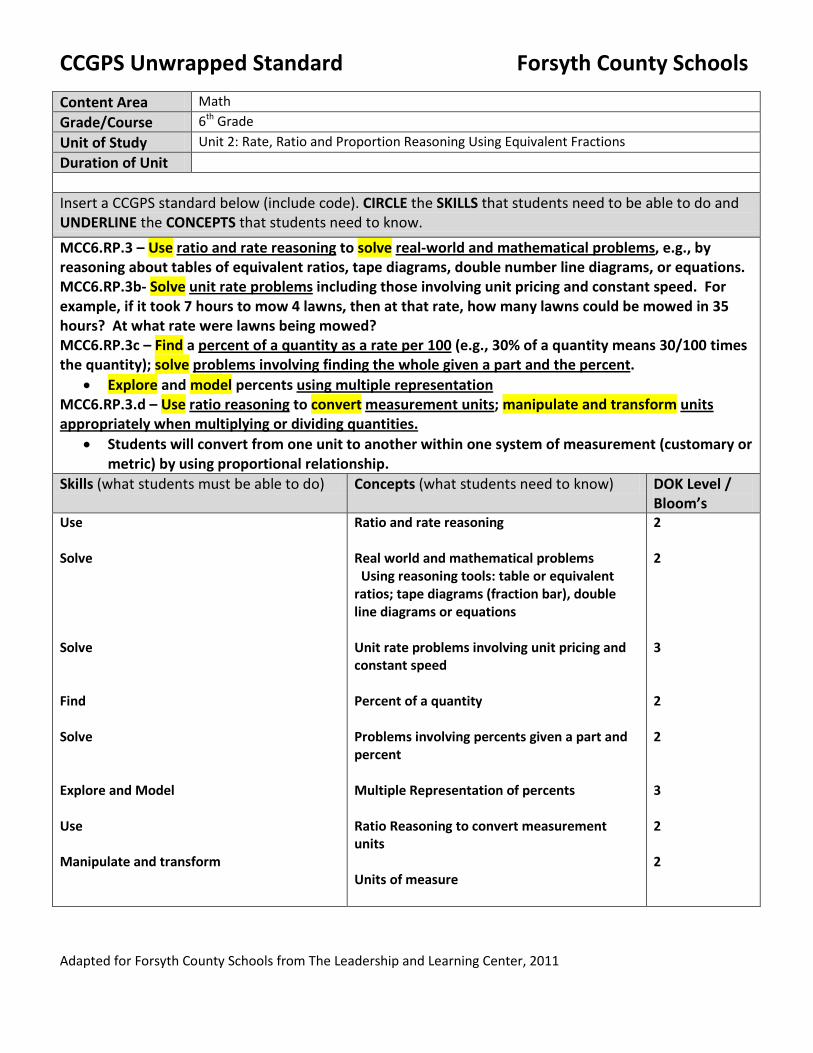
Insert a CCGPS standard below (include code). CIRCLE the SKILLS that students need to be able to do and UNDERLINE the CONCEPTS that students need to know. MCC6.RP.3 – Use ratio and rate reasoning to solve real-world and mathematical problems
MCC6.RP.3b- Solve
, e.g., by reasoning about tables of equivalent ratios, tape diagrams, double number line diagrams, or equations.
unit rate problems
MCC6.RP.3c – Find a
including those involving unit pricing and constant speed. For example, if it took 7 hours to mow 4 lawns, then at that rate, how many lawns could be mowed in 35 hours? At what rate were lawns being mowed?
percent of a quantity as a rate per 100 (e.g., 30% of a quantity means 30/100 times the quantity); solve problems involving finding the whole given a part and the percent
• Explore and model percents .
MCC6.RP.3.d – Use using multiple representation
ratio reasoning to convert measurement units; manipulate and transform
• Students will convert from one unit to another within one system of measurement (customary or metric) by using proportional relationship.
units appropriately when multiplying or dividing quantities.
Skills (what students must be able to do) Concepts (what students need to know) DOK Level / Bloom’s
Use Solve Solve Find Solve Explore and Model Use Manipulate and transform
Ratio and rate reasoning Real world and mathematical problems Using reasoning tools: table or equivalent ratios; tape diagrams (fraction bar), double line diagrams or equations Unit rate problems involving unit pricing and constant speed Percent of a quantity Problems involving percents given a part and percent Multiple Representation of percents Ratio Reasoning to convert measurement units Units of measure
2 2 3 2 2 3 2 2
CCGPS Unwrapped Standard Forsyth County Schools
Adapted for Forsyth County Schools from The Leadership and Learning Center, 2011
Step 5: Determine BIG Ideas (enduring understandings students will remember long after the unit of study)
Step 6: Write Essential Questions (these guide instruction and assessment for all tasks. The big ideas are answers to the essential questions)
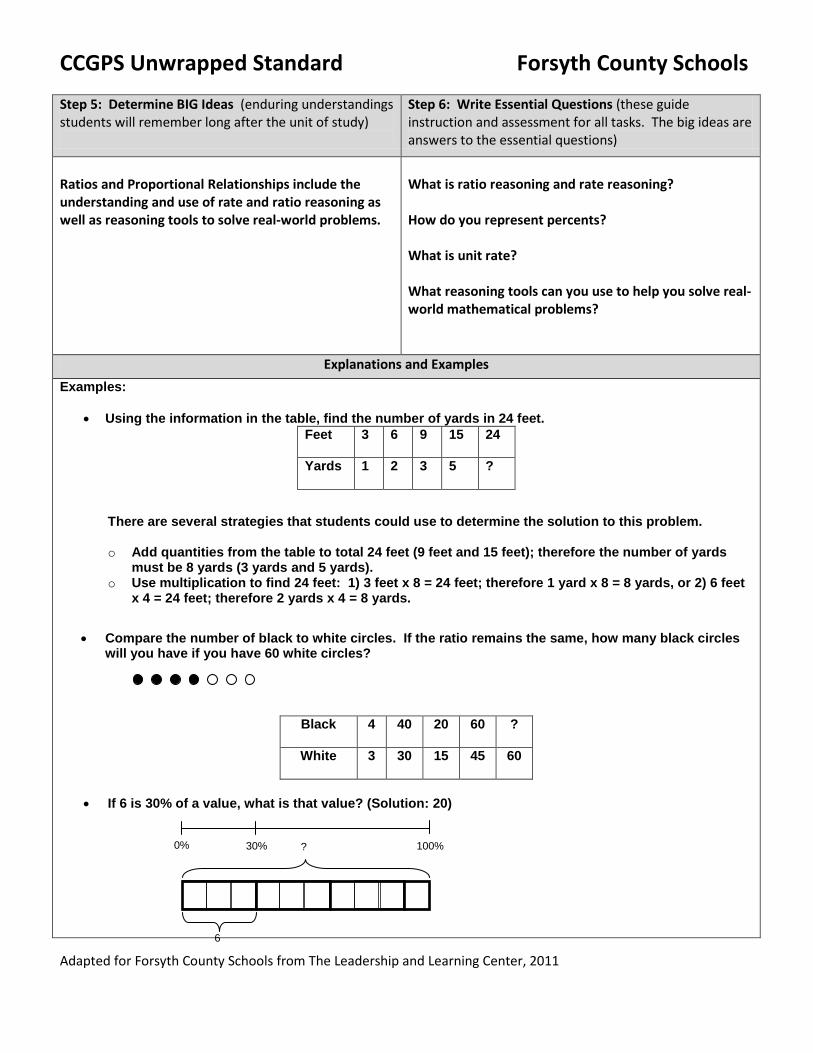
Ratios and Proportional Relationships include the understanding and use of rate and ratio reasoning as well as reasoning tools to solve real-world problems.
What is ratio reasoning and rate reasoning? How do you represent percents? What is unit rate? What reasoning tools can you use to help you solve real-world mathematical problems?
Explanations and Examples
Examples:
• Using the information in the table, find the number of yards in 24 feet. Feet 3 6 9 15 24
Yards 1 2 3 5 ?
There are several strategies that students could use to determine the solution to this problem.
o Add quantities from the table to total 24 feet (9 feet and 15 feet); therefore the number of yards must be 8 yards (3 yards and 5 yards).
o Use multiplication to find 24 feet: 1) 3 feet x 8 = 24 feet; therefore 1 yard x 8 = 8 yards, or 2) 6 feet x 4 = 24 feet; therefore 2 yards x 4 = 8 yards.
• Compare the number of black to white circles. If the ratio remains the same, how many black circles will you have if you have 60 white circles?
Black 4 40 20 60 ?
White 3 30 15 45 60
• If 6 is 30% of a value, what is that value? (Solution: 20)
6
0%
30% 100% ?
CCGPS Unwrapped Standard Forsyth County Schools
Adapted for Forsyth County Schools from The Leadership and Learning Center, 2011
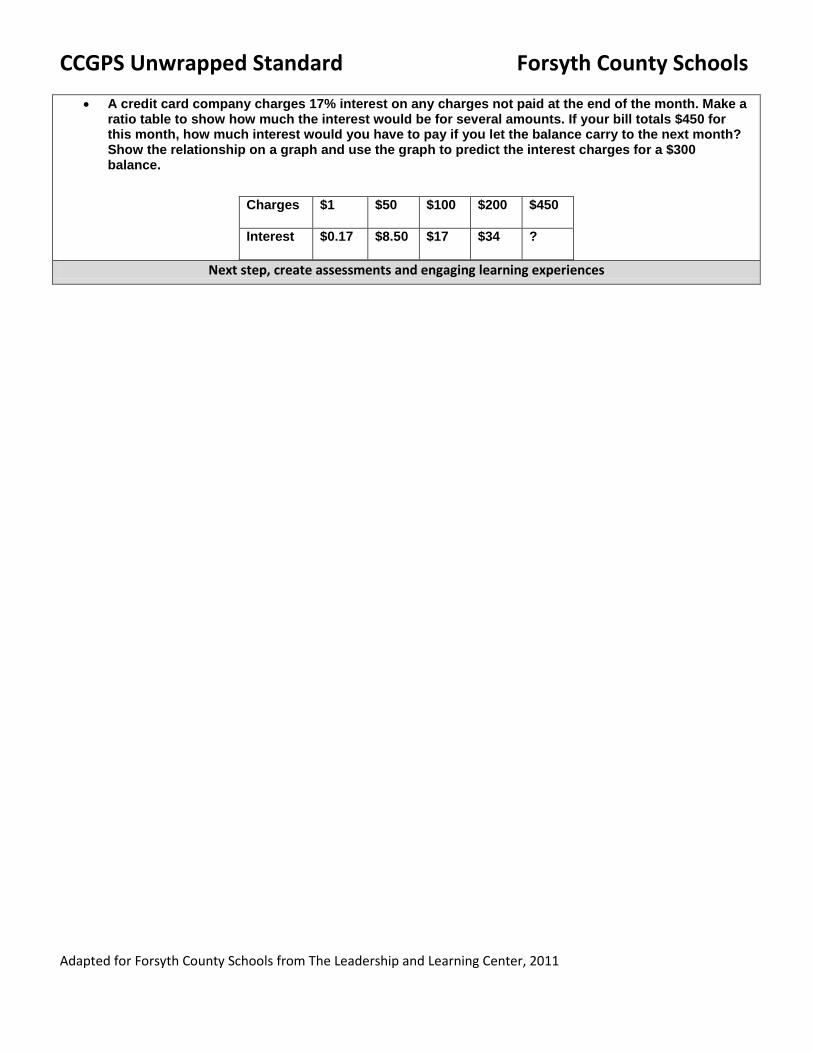
• A credit card company charges 17% interest on any charges not paid at the end of the month. Make a ratio table to show how much the interest would be for several amounts. If your bill totals $450 for this month, how much interest would you have to pay if you let the balance carry to the next month? Show the relationship on a graph and use the graph to predict the interest charges for a $300 balance.
Charges $1 $50 $100 $200 $450
Interest $0.17 $8.50 $17 $34 ?
Next step, create assessments and engaging learning experiences
CCGPS Unwrapped Standard Forsyth County Schools
Adapted for Forsyth County Schools from The Leadership and Learning Center, 2011
Content Area Mathematics Grade/Course 6th Grade Unit of Study Unit 7: Statistics Duration of Unit
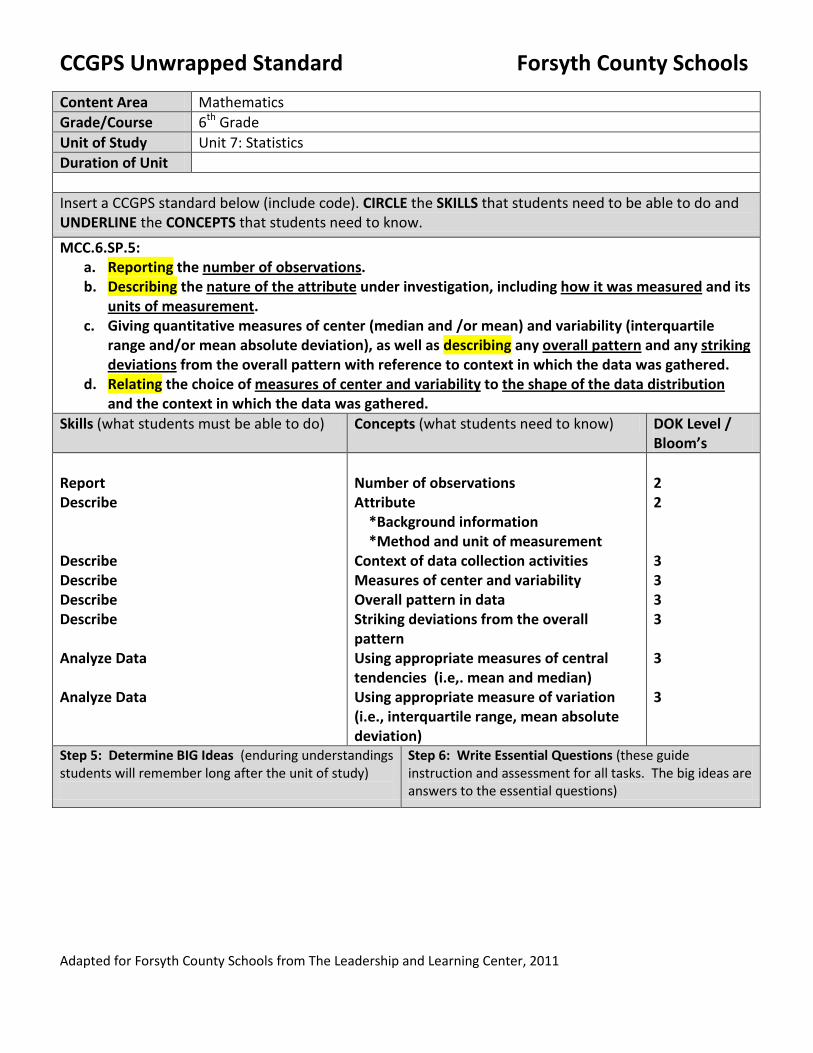
Insert a CCGPS standard below (include code). CIRCLE the SKILLS that students need to be able to do and UNDERLINE the CONCEPTS that students need to know. MCC.6.SP.5:
a. Reporting the number of observationsb. Describing the
. nature of the attribute under investigation, including how it was measured and its
units of measurementc. Giving quantitative measures of center (median and /or mean) and variability (interquartile
range and/or mean absolute deviation), as well as describing any
.
overall pattern and any striking deviations
d. Relating the choice of from the overall pattern with reference to context in which the data was gathered.
measures of center and variability to the shape of the data distribution and the context in which the data was gathered.
Skills (what students must be able to do) Concepts (what students need to know) DOK Level / Bloom’s
Report Describe Describe Describe Describe Describe Analyze Data Analyze Data
Number of observations Attribute *Background information *Method and unit of measurement Context of data collection activities Measures of center and variability Overall pattern in data Striking deviations from the overall pattern Using appropriate measures of central tendencies (i.e,. mean and median) Using appropriate measure of variation (i.e., interquartile range, mean absolute deviation)
2 2 3 3 3 3 3 3
Step 5: Determine BIG Ideas (enduring understandings students will remember long after the unit of study)
Step 6: Write Essential Questions (these guide instruction and assessment for all tasks. The big ideas are answers to the essential questions)
CCGPS Unwrapped Standard Forsyth County Schools
Adapted for Forsyth County Schools from The Leadership and Learning Center, 2011
Determined whether a set of data is categorical or numerical by describing the nature of the attribute under investigation. Describe what is typical about a set of data by using measures of center. Describe how much the data varies by using measures of variability.
How do I determine whether a set of data is categorical or numerical? How can I describe what is trypical about a set of data? How can I describe how much the data varies?
Explanations and Examples
Students summarize numerical data by providing background information about the attribute being measured, methods and unit of measurement, the context of data collection activities, the number of observations, and summary statistics. Summary statistics include quantitative measures of center, spread, and variability including extreme values (minimum and maximum), mean, median, mode, range, quartiles, interquartile ranges, and mean absolute deviation.
The measure of center that a student chooses to describe a data set will depend upon the shape of the data distribution and context of data collection. The mode is the value in the data set that occurs most frequently. The mode is the least frequently used as a measure of center because data sets may not have a mode, may have more than one mode, or the mode may not be descriptive of the data set. The mean is a very common measure of center computed by adding all the numbers in the set and dividing by the number of values. The mean can be affected greatly by a few data points that are very low or very high. In this case, the median or middle value of the data set might be more descriptive. In data sets that are symmetrically distributed, the mean and median will be very close to the same. In data sets that are skewed, the mean and median will be different, with the median frequently providing a better overall description of the data set.
The mean measures center in the sense that it is the value that each data point would take on if the total of the data values were redistributed equally, and also in the sense that it is a balance point. Students develop understanding of what the mean represents by redistributing data sets to be level or fair. The leveling process can be connected to and used to develop understanding of the computation of the mean.
Understanding the Mean
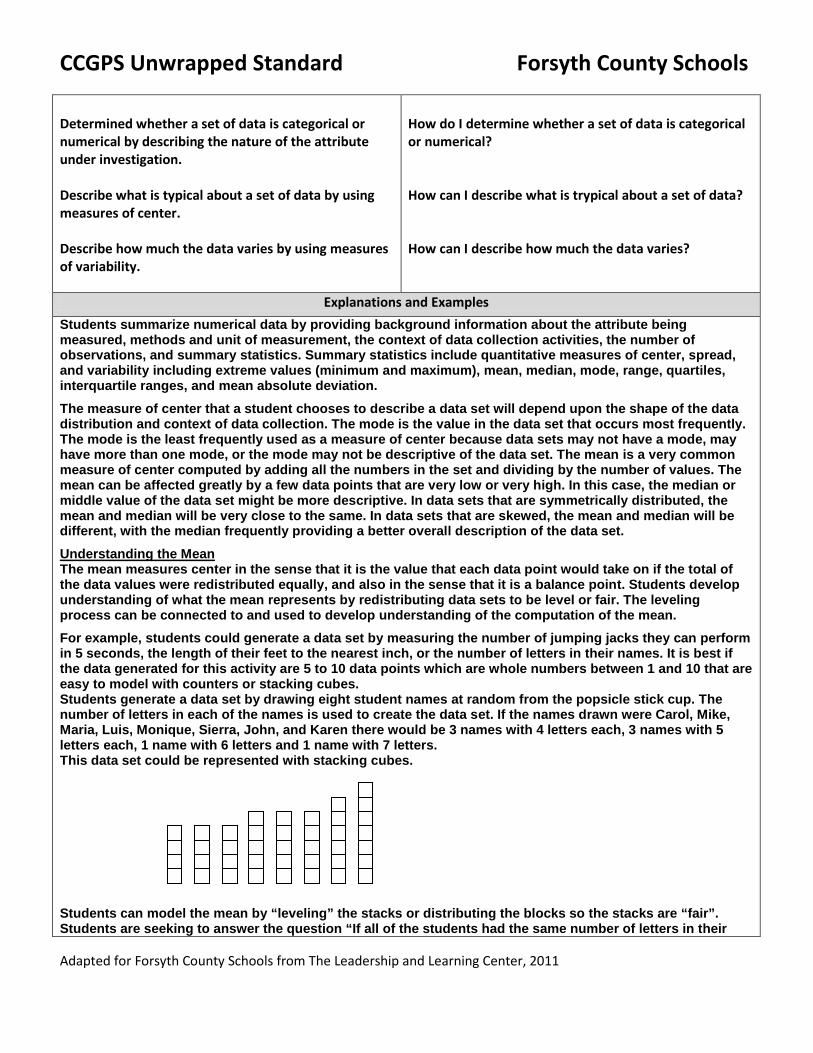
For example, students could generate a data set by measuring the number of jumping jacks they can perform in 5 seconds, the length of their feet to the nearest inch, or the number of letters in their names. It is best if the data generated for this activity are 5 to 10 data points which are whole numbers between 1 and 10 that are easy to model with counters or stacking cubes. Students generate a data set by drawing eight student names at random from the popsicle stick cup. The number of letters in each of the names is used to create the data set. If the names drawn were Carol, Mike, Maria, Luis, Monique, Sierra, John, and Karen there would be 3 names with 4 letters each, 3 names with 5 letters each, 1 name with 6 letters and 1 name with 7 letters. This data set could be represented with stacking cubes. Students can model the mean by “leveling” the stacks or distributing the blocks so the stacks are “fair”. Students are seeking to answer the question “If all of the students had the same number of letters in their
CCGPS Unwrapped Standard Forsyth County Schools
Adapted for Forsyth County Schools from The Leadership and Learning Center, 2011
name, how many letters would each person have?” One block from the stack of six and two blocks from the stack of 7 can be moved down to the stacks of 4 and then all the stacks have five blocks. If all students had the same number of letters in their name, they would have five letters. The mean number of letters in a name in this data set is 5. If it was not possible to make the stacks exactly even, students could begin to consider what part of the extra blocks each stack would have.
The use of mean absolute deviation in 6th grade is mainly exploratory. The intent is to build a deeper understanding of variability. Students would understand the mean distance between the pieces of data and the mean of the data set expresses the spread of the data set. Students can see that the larger the mean distance, the greater the variability. Comparisons can be made between different data sets.
Understanding Mean Absolute Deviation
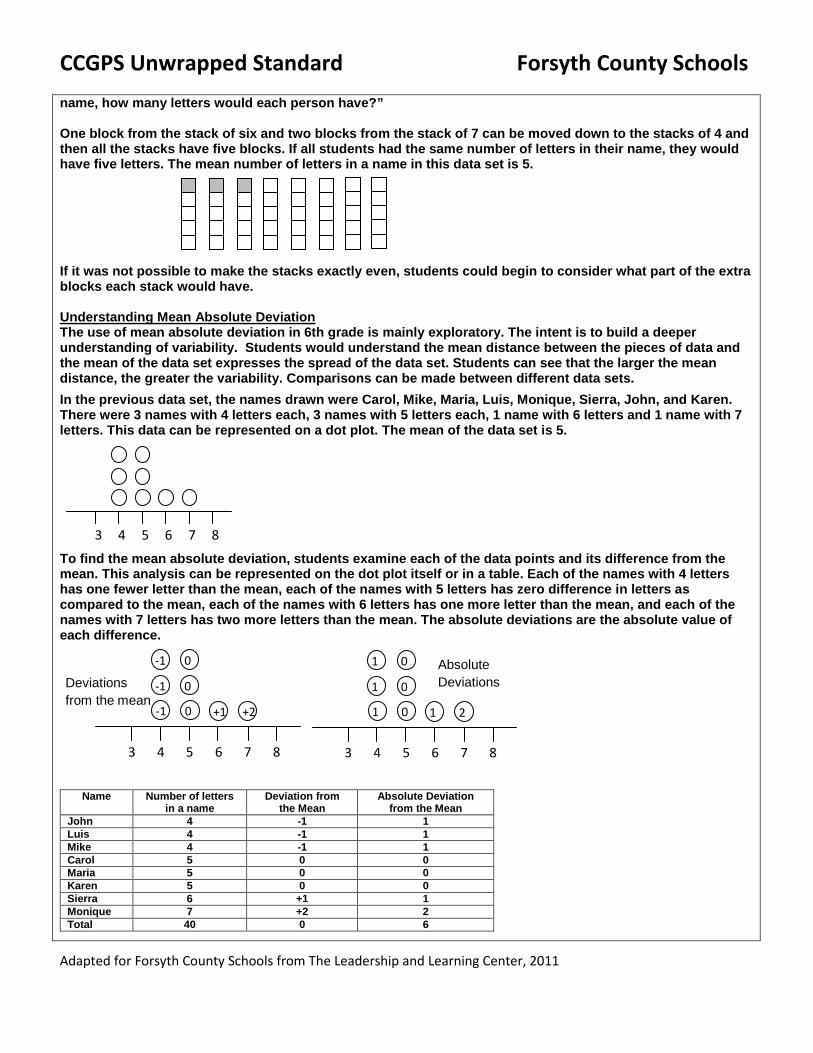
In the previous data set, the names drawn were Carol, Mike, Maria, Luis, Monique, Sierra, John, and Karen. There were 3 names with 4 letters each, 3 names with 5 letters each, 1 name with 6 letters and 1 name with 7 letters. This data can be represented on a dot plot. The mean of the data set is 5.
To find the mean absolute deviation, students examine each of the data points and its difference from the mean. This analysis can be represented on the dot plot itself or in a table. Each of the names with 4 letters has one fewer letter than the mean, each of the names with 5 letters has zero difference in letters as compared to the mean, each of the names with 6 letters has one more letter than the mean, and each of the names with 7 letters has two more letters than the mean. The absolute deviations are the absolute value of each difference.
Name Number of letters in a name
Deviation from the Mean
Absolute Deviation from the Mean
John 4 -1 1 Luis 4 -1 1 Mike 4 -1 1 Carol 5 0 0 Maria 5 0 0 Karen 5 0 0 Sierra 6 +1 1 Monique 7 +2 2 Total 40 0 6
3 4 5 6 7 8
3 4 5 6 7 8
-1
-1
-1
0
0
0
+1 +2
Deviations from the mean
3 4 5 6 7 8
1
1
1
0
0
0
1 2
Absolute Deviations
CCGPS Unwrapped Standard Forsyth County Schools
Adapted for Forsyth County Schools from The Leadership and Learning Center, 2011
The mean of the absolute deviations is found by summing the absolute deviations and dividing by the number of data points. In this case, the mean absolute deviation would be 6 ÷ 8 or ¾ or 0.75. The mean absolute deviation is a small number, indicating that there is little variability in the data set.
Consider a different data set also containing 8 names. If the names were Sue, Joe, Jim, Amy, Sabrina, Monique, Timothy, and Adelita. Summarize the data set and its variability. How does this compare to the first data set?
The mean of this data set is still 5. 5840
8)7773333(
==++++++
Name Number of letters
in a name Deviation from
the Mean Absolute Deviation
from the Mean 3 Sue -2 2
Joe 3 -2 2 Jim 3 -2 2 Amy 3 -2 2 Sabrina 7 +2 2 Timothy 7 +2 2 Adelita 7 +2 2 Monique 7 +2 2 Total 40 0 16
The mean deviation of this data set is 16 ÷ 8 or 2. Although the mean is the same, there is much more variability in this data set.
Students can also summarize and describe the center and variability in data sets using the median and a five number summary consisting of the minimum, quartiles, and maximum as seen in the box plot example in 6.SP.4. The median is the middle number of the data set with half the number below the median and half the numbers above the median. The quartiles partition the data set into four parts by dividing each of the halves of the data set into half again. Quartile 1 (Q1 or the lower quartile) is the middle value of the lower half of the data set and quartile 3 (Q3 or the upper quartile) is the middle value of the upper half of the data set. The median can also be referred to as quartile 2 (Q2). The range of the data is the difference between the minimum and maximum values. The interquartile range of the data is the difference between the lower and upper quartiles (Q3 – Q1). The interquartile range is a measure of the dispersion or spread of the data set: a small value indicates values that are clustered near the median whereas a larger value indicates values that are more distributed.
Understanding Medians and Quartiles
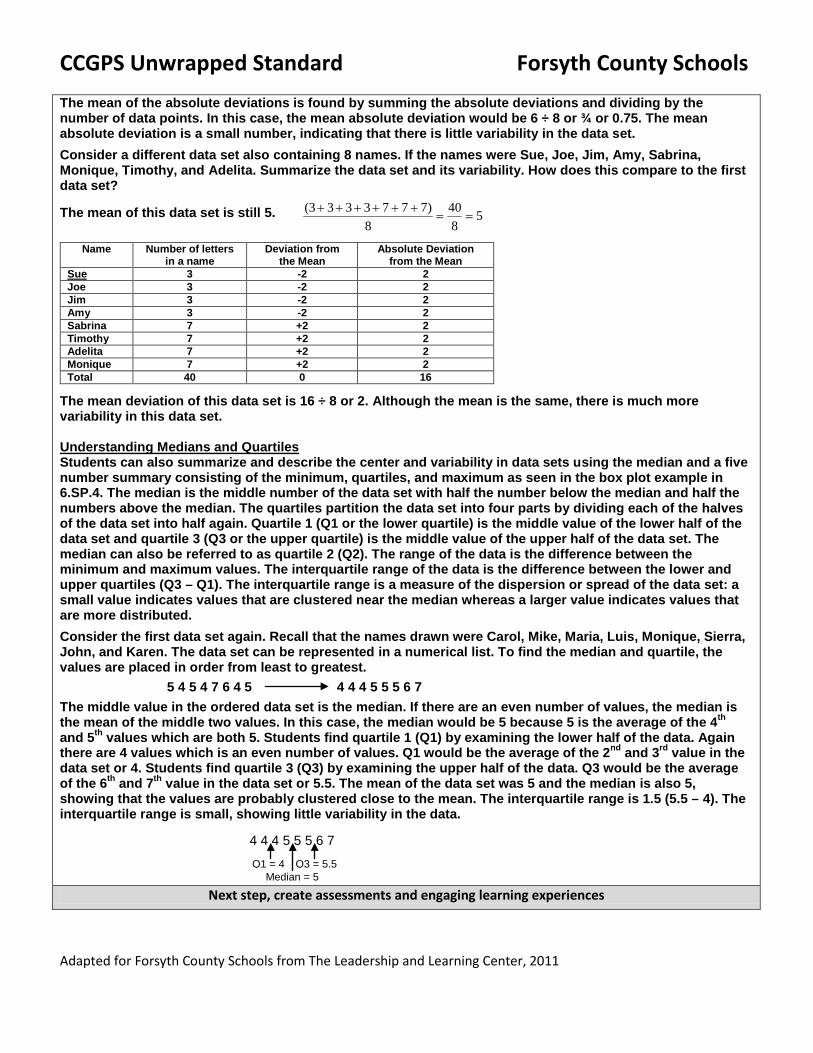
Consider the first data set again. Recall that the names drawn were Carol, Mike, Maria, Luis, Monique, Sierra, John, and Karen. The data set can be represented in a numerical list. To find the median and quartile, the values are placed in order from least to greatest.
5 4 5 4 7 6 4 5 4 4 4 5 5 5 6 7
The middle value in the ordered data set is the median. If there are an even number of values, the median is the mean of the middle two values. In this case, the median would be 5 because 5 is the average of the 4th and 5th values which are both 5. Students find quartile 1 (Q1) by examining the lower half of the data. Again there are 4 values which is an even number of values. Q1 would be the average of the 2nd and 3rd value in the data set or 4. Students find quartile 3 (Q3) by examining the upper half of the data. Q3 would be the average of the 6th and 7th value in the data set or 5.5. The mean of the data set was 5 and the median is also 5, showing that the values are probably clustered close to the mean. The interquartile range is 1.5 (5.5 – 4). The interquartile range is small, showing little variability in the data.
Next step, create assessments and engaging learning experiences Median = 5
Q1 = 4 Q3 = 5.5
4 4 4 5 5 5 6 7