Embed Size (px)
Citation preview
COMMON AGRICULTURAL COMMON AGRICULTURAL POLICYPOLICY
Development of the CAP European agricultural sector after World War II “Green pool”, Treaty of Rome
General Principles of CAP, measures, CAP Reform´s
Sico Mansholt - Memorandum 1964, Mc Sharry Reform 1992,
EUROPEAN AGRICULTURAL EUROPEAN AGRICULTURAL SECTOR AFTER WORLD WAR II SECTOR AFTER WORLD WAR II
Demand for food Rationing was the norm but it was undercut by
black markets
Food policies had been directed at maximising
agricultural production
REBILDING EUROPEAN ECONOMYREBILDING EUROPEAN ECONOMY
USA intervention - Marshall Plan - proposed a program designed to provide assistance to Europe in the form of monetary aid, food and raw materials
Organization for European Economic Cooperation (OEEC), and
European Coal and Steel Community (ECSC).
GOVERNMENT POLICIES OF GOVERNMENT POLICIES OF INCOM SUPPORTINCOM SUPPORT
Guarantee incomes Increase food supplies Substitute for imports coming from the dollar zone
As a result of this intervention, in every Western
European country, agriculture became a large subsidised and protected industry.
EUROPEAN AGRICULTURAL SECTOR EUROPEAN AGRICULTURAL SECTOR AFTER WORLD WAR IIAFTER WORLD WAR II
State intervention increased national governments sought to secure adequate
supplies of food by creating a comprehensive system of price controls and guarantees
this was seen in the protection of farmers and specific rules and regulations as to production, imports and exports etc.
GOVERNMENT POLICIES OF INCOM GOVERNMENT POLICIES OF INCOM SUPPORTSUPPORT
Government aid to the farming population. The policies varied slightly from one country to another.
Encouragement to productive improvements, through low rate credits, subsidies etc.
These had the effect of encouraging mechanisation and thus contributed to higher yields
GOVERNMENT POLICIES OF GOVERNMENT POLICIES OF INCOM SUPPORTINCOM SUPPORT
Effects?
productivity in agriculture grew! “Second agrarian revolution” - food supplies were
adequate and the level of consumption was satisfactory
GOVERNMENT POLICIES OF GOVERNMENT POLICIES OF INCOM SUPPORTINCOM SUPPORT
But…
incomes of people working in the agricultural sector lagged behind those of people employed in the other sectors
exodus from the countryside
GOVERNMENT POLICIES OF GOVERNMENT POLICIES OF INCOM SUPPORTINCOM SUPPORT
Why?
Downward trend of agricultural prices!
One of the reasons for the lag in incomes in the
countryside was the downward trend of agricultural
prices, and this was due to the fact that demand for
food was relatively income inelastic.
This means that although incomes grew very
rapidly, because of economic growth in the
industrialised world, people did not use their
higher income to buy more food, but to buy
other, higher-value commodities.
Only certain foodstuffs were in much greater demand,
such as meat. Meat prices in fact moved up, but
prices of all the other major foodstuffs, such as
wheat, sugar and diary products moved downwards.
GOVERNMENT POLICIES OF GOVERNMENT POLICIES OF INCOM SUPPORTINCOM SUPPORT
Farm incomes, therefore, were increasingly dependent on government aid.
Protection was important especially for those commodities that were most cheaply produced outside Europe
For grain for example - the European prices were higher by a considerable extent than prices in North America, Australia and Argentina. In other commodities such as meat, and diary products, many European products were competitive, so that the effect of protection was much less. There was a paradox here for wheat and cereals were the crops for which demand was more stagnant. By protecting them the governments were in effect encouraging surpluses and discouraging shifts to other crops and products, such as diary products and meat, for which larger export outlets could be found. This kind of distortion was greater in the countries which produced large quantities of cereals such as France, Germany, and much less prominent in countries were agriculture was heavily geared to specialised diary products such us the Netherlands
first attempt to solve agricultural problems through integration
THE "GREEN POOL"THE "GREEN POOL"
In 1951 the Minister for Agriculture in France (Pierre Pflimlin) took the initiative of launching a first scheme of integration couched in very similar terms: a High Authority with extensive supranational powers.
The idea was to form a common market for a number of key commodities such as wheat, sugar, wine, and dairy products in such as a way as to guarantee an “outlet” for French exports.
THE "GREEN POOL"THE "GREEN POOL"
At the same time the Dutch Minister of Agriculture, Sicco Mansholt, put forward his own plan, based on a common market in Western Europe in order to achieve efficiency and specialisation
THE "GREEN POOL"THE "GREEN POOL"
The two proposals generated a number of Conferences - known as the Green Pool talks - held in Paris between 1952 and 1954.
Fifteen countries were initially represented including Britain.
The disagreements between them, however, proved too great and nothing was achieved.
THE "GREEN POOL"THE "GREEN POOL"
Liberalisation in intra - European trade in agriculture was extremely slow and in fact in many cases non-existent throughout the Fifties.
BACKGROUND OF THE CAPBACKGROUND OF THE CAP
Low incomes Poor farm structure Surplus labour Rising production Export difficulties High level of government support France and Netherlands alliance: powerful lobby
When the Treaties of Rome were negotiated it was decided that for agricultural products as much as for manufactured goods barriers between the Six should fall in the course of the so-called “transitional period” (of 12-15 years). It was also said that a Common Market would be accompanied by a common policy, meaning that markets for agricultural commodities should be organised.
There was much disagreement on how this could be achieved!
RIVALRY: FRANCE - GERMANYRIVALRY: FRANCE - GERMANY
The large central powers of France and Germany held a lot of negotiating power. France had the largest agricultural sector of the original six and Germany had a vastly growing industrial sector. Both wanted access to the other at competitive prices. France still wanted to ensure Germany did not grow too powerful. In 1962, Charles de Gaulle of France and Konrad Adenauer of Germany struck a straight forward deal: France signed up to a free market and customs union that allowed German industry access to its lucrative markets, while Germany channelled subsidies to France's farmers via Brussels.
Therefore, the complex CAP was included in the Treaty, almost as a trade off between these two powers
THE FOUNDATION OF THE CAPTHE FOUNDATION OF THE CAP
1957. Treaty of Rome - social, economic and political resons
1958. Stresa Conference - principles 1962. CAP came into force
OBJECTIVES OF THE CAP:OBJECTIVES OF THE CAP: Article 39 of Treaty of Rome (1957) Article 39 of Treaty of Rome (1957)
to increase agricultural productivity to ensure a fair standard of living to stabilise markets; to assure the availability of supplies; to ensure that supplies reach consumers at
reasonable prices.
MAIN PRINCIPLES OF THE CAPMAIN PRINCIPLES OF THE CAP
a unified market - free-intra community trade Community preference financial solidarity
MARKET INSTRUMENTS OF THE CAPMARKET INSTRUMENTS OF THE CAP
Intervention purchases, when market price fell below an agreed "guarantee price"
Import quotas and levies in order to enforce minimum import prices
Export subsidies to sell surpluses on the world markets
Production quota (for sugar)
Protectionism!Protectionism!
The solution proposed was a reactionary one: protectionism. This would support farmers through maintaining artificially high prices. There would be a single market for agricultural products and EEC preference meant granting European producers privileges at the expense of overseas suppliers. A common system of price support and import controls was set up that was so complicated it became synonymous with bureaucracy, mismanagement and fraud.
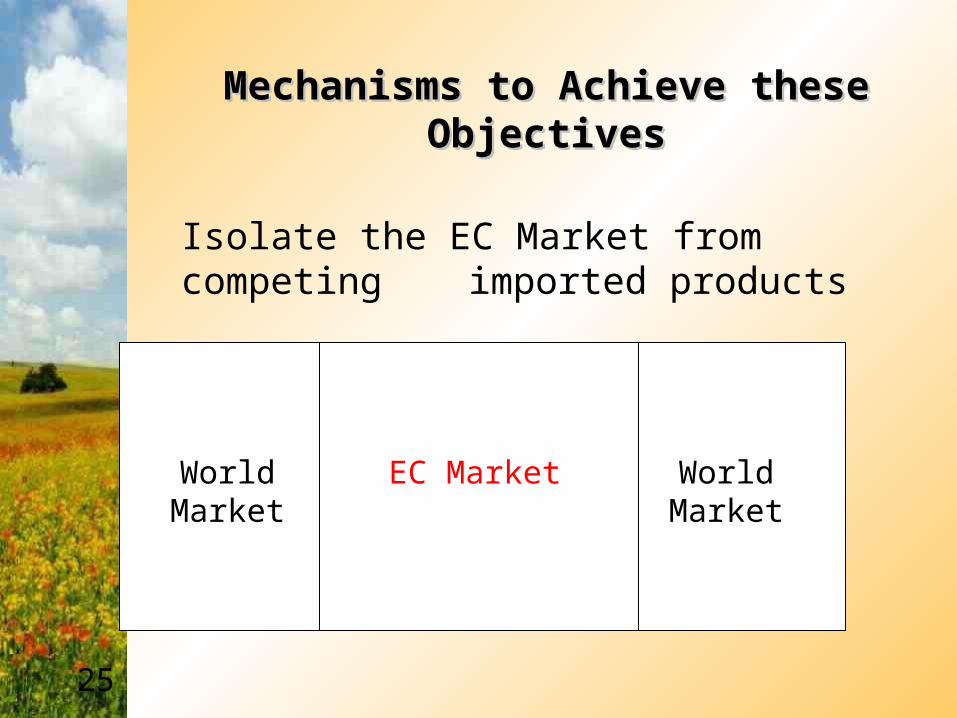
Mechanisms to Achieve these Mechanisms to Achieve these ObjectivesObjectives
Isolate the EC Market from competing imported products
EC MarketWorld Market
World Market
25
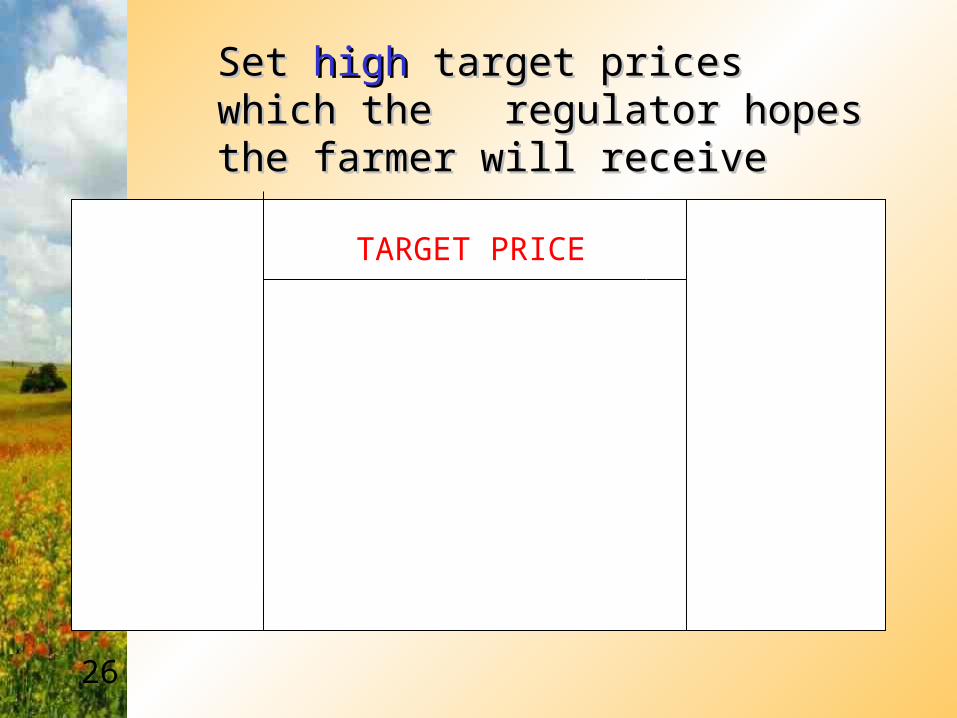
Set Set highhigh target prices which the target prices which the regulator hopes the farmer will receiveregulator hopes the farmer will receive
TARGET PRICE
26
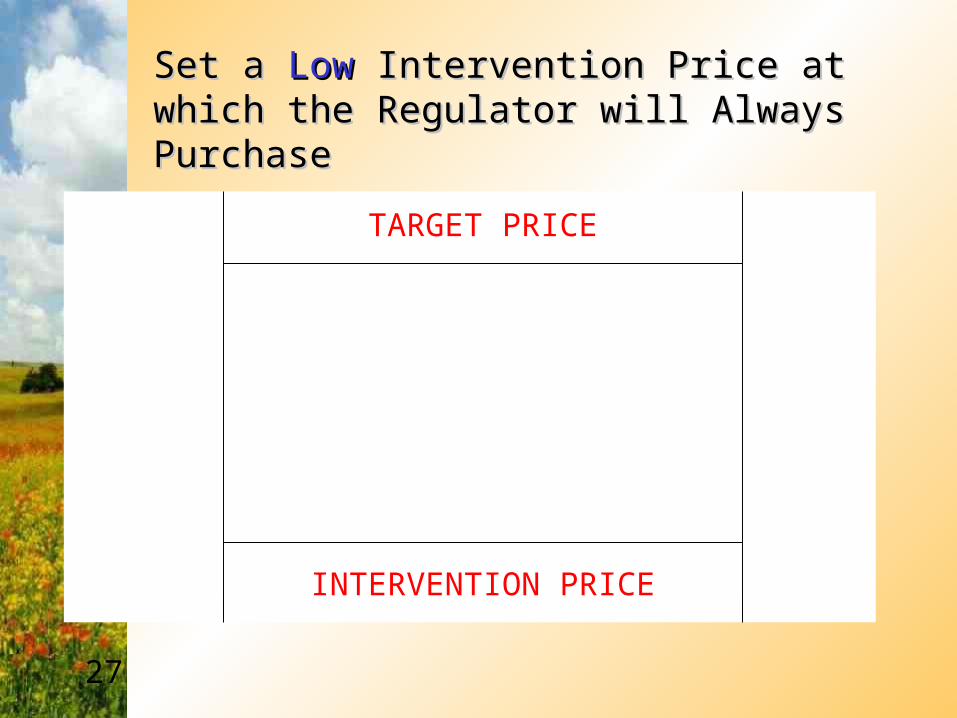
Set aSet a Low Low Intervention Price at which the Intervention Price at which the Regulator will Always PurchaseRegulator will Always Purchase
TARGET PRICE
INTERVENTION PRICE
27
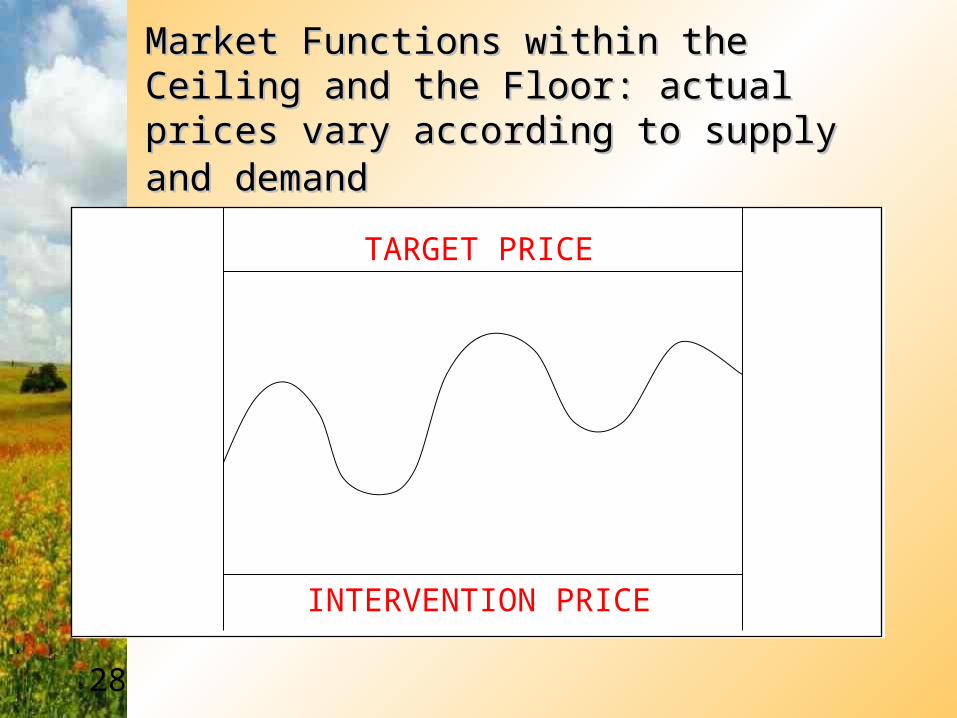
Market Functions within the Ceiling and the Market Functions within the Ceiling and the Floor: actual prices vary according to supply and Floor: actual prices vary according to supply and demanddemand
TARGET PRICE
INTERVENTION PRICE
28
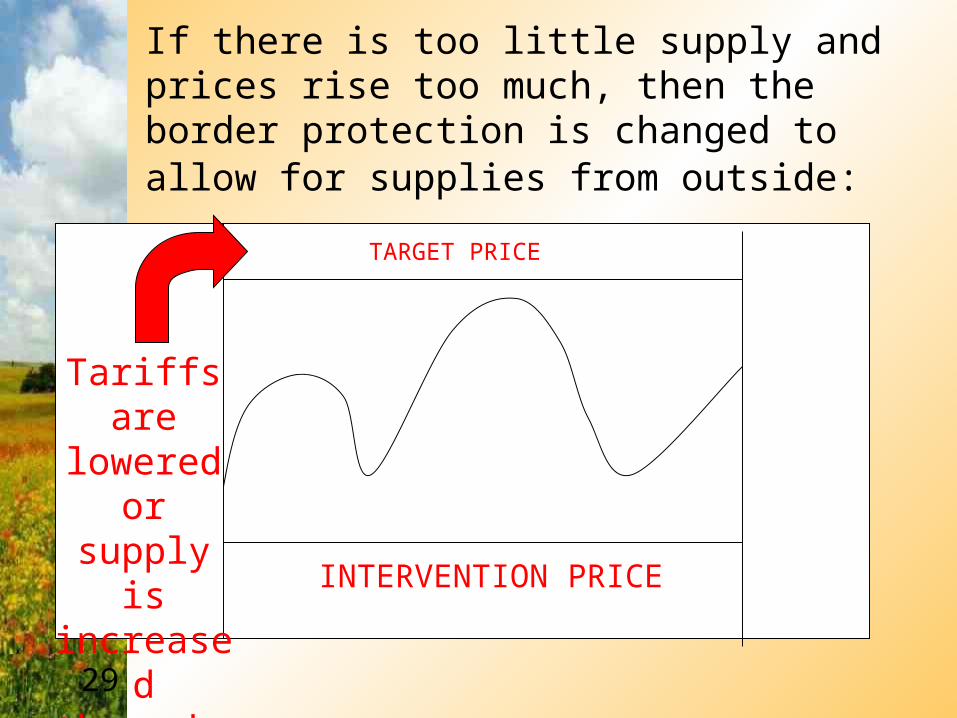
If there is too little supply and prices rise too much, then the border protection is changed to allow for supplies from outside:
INTERVENTION PRICE
TARGET PRICE
Tariffs are lowered or supply is increased through TRQs
29
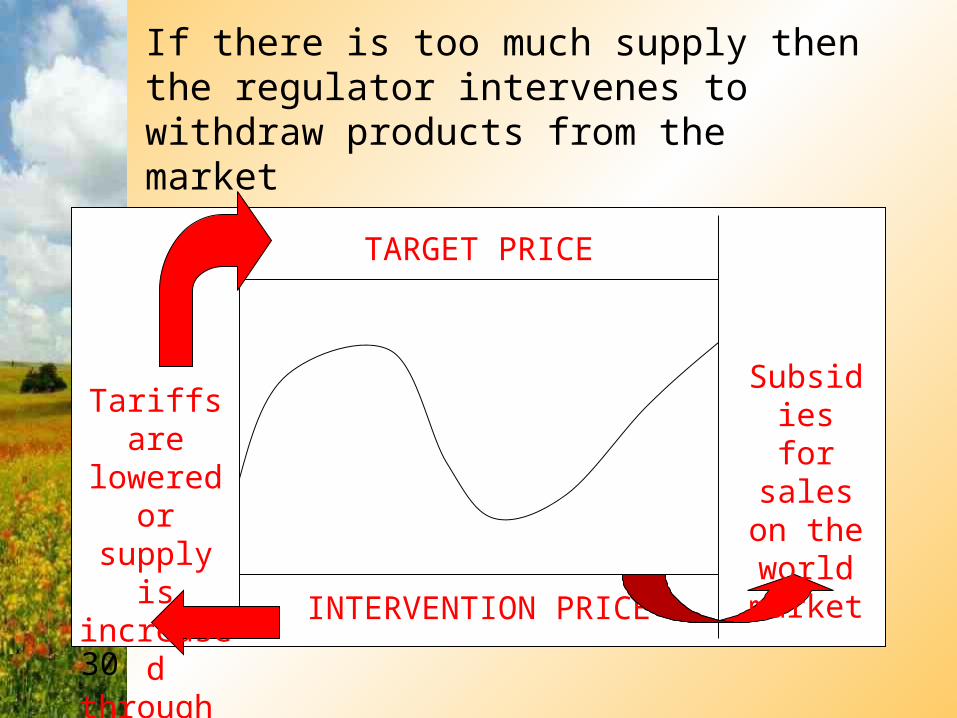
If there is too much supply then the regulator intervenes to withdraw products from the market
TARGET PRICE
INTERVENTION PRICE
Subsidies for sales on the world market
30
Tariffs are lowered or supply is increased through TRQs
This set the stage for a huge expansion of agricultural output that was to lead to the infamous meat and butter "mountains", wine "lakes" and the pouring of milk down drains.
BENEFITS FROM THE CAPBENEFITS FROM THE CAP
The creation of a highly protected area greatly benefited Community exports at the expense of exports from outside the Community. It was especially French and Dutch exports that benefited. The losers were Danish and US exports to the Community and especially to its largest market.
Because the CAP works by setting high prices, the farmers who benefited most were the large ones, or in the case of the Netherlands, the very productive ones, which were most of them.
BENEFITS FROM THE CAPBENEFITS FROM THE CAP
Self-sufficiency of food supplies in the Community - agricultural output increased greatly
Food security was assured Agricultural markets were stabilised Farmers enjoyed a fair standard of living -
although large farmers and farmers in the North of Europe benefited most from this situation
WHAT WENT WRONG?WHAT WENT WRONG?
Guaranteed prices - overproduction Problem of surpluses began to emerge Big farmers produced more and thereby earned
more money; small farmers needed assistance earned less;
In order to increase output - soil with excessive amount of fertilisers, herbicides: environmental problems
WHAT WENT WRONG?WHAT WENT WRONG?
Quotas, levies, tariffs in agricultural trade - problem for exporters to the EC and to promote open trade and further liberalisation
Dumping on world markets distorted prices and antagonised non-EU producers.
Consumers however lost out - high food prices
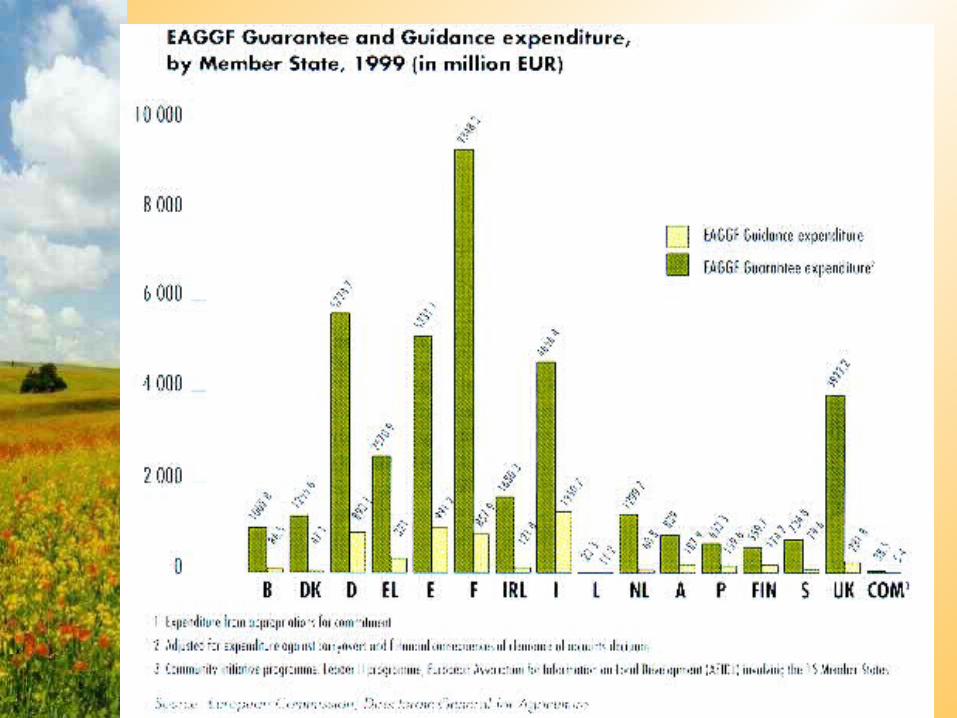
EUROPEAN AGRICULTURAL EUROPEAN AGRICULTURAL GUIDANCE AND GUARANTEE FUND GUIDANCE AND GUARANTEE FUND
(EAGGF)(EAGGF)
The CAP is financed from the EAGGF, which accounts for a substantial part of the Community budget. The EAGGF was set up in 1962 and separated in two sections in 1964.
EAGGFEAGGF
the Guidance Section, one of the structural funds, which contributes to the structural reforms in agriculture and the development of rural areas
the Guarantee Section, which funds expenditure concerning the common organisation of the markets
REFORMING THE CAPREFORMING THE CAP
Sico Mansholt - Memorandum in 1964Sico Mansholt - Memorandum in 1964
sweeping agricultural reforms-reduction of five million people in the workforce between 1970 and 1980 and a parallel cut of five million hectares in the agricultural land area.
Memorandum proposed a substantial long term cutback in CAP price supports and parallel expansion in structures policies to help small farmers with the process of adjustment.
the debate over the Mansholt Plan formed a foundation for the development of EC structural measures.
CAP STRUCTURAL POLICIESCAP STRUCTURAL POLICIES In the six founding Member States, average farm size
was small and the fragmentation of many holdings was inhibiting mechanisation, investment and improvements in productivity.
There were major disparities in farm incomes between different regions, and overall farm incomes lagged well behind those prevailing in manufacturing industry.
A structural policy was regarded as important to assist the modernisation of farms, increase productivity, and reduce disparities between regions, partly by providing special assistance to more marginal producers in poorer regions.
The first CAP budget for structural measures was established in 1964, later becoming the Guidance Section of FEOGA.
CAP STRUCTURAL POLICIESCAP STRUCTURAL POLICIES
Most of this was devoted to support for ad hoc projects, including rural electrification, road building, land consolidation, drainage, food processing, among others.
This was a relatively modest operation, with the Community funding only about 20 per cent of the cost of measures.
In the early 1970s, this pragmatic approach of assisting proposals put forward by national and regional authorities was to give way to ‘horizontal’ measures operating throughout the Community, providing assistance for farm modernisation, support for Less Favoured Areas, and other measures based on common EC Rules.
CAP STRUCTURAL POLICIESCAP STRUCTURAL POLICIES
In 1972, structural measures were introduced into the CAP, with the aim of modernising European agriculture.
Directive 72/159 on farm modernization provided aid for investments on farms considered "sutible for development" and able to generate an income comparable with other occupations for one or two labor units.
Directive 72/160 on farmer retirement ofered payments to outgoers in the form of annuities or lump sums to elderly farmers or premiums to younger ones.
Directive 72/161 on socio-economic guidance and training and education to the agricultural labour force, both for those who wanted to stay in the agricultural sector and for those who wanted to leave.
CAP OF THE 1970sCAP OF THE 1970s
Icome oriented agricultural price policies EU: from net-importer to a net exporter of
agricultutal goods Growing surpluses (cereals, milk, beef)
growing budget expenditures (2/3 of the total budget spent for agriculture)
subsequent expansions of the community, new members brought with them new problems. The most documented example is that of Great Britain. With a relatively small agricultural sector, only 3% employment, the UK felt it paid too much into the universal pocket for agriculture.
CAP OF THE 1980sCAP OF THE 1980s In 1983, the Commission made a proposal for
fundamental reform, formally expressed two years later, Green Paper on "Perspectives for the Common Agricultural Policy" (1985).
More restrictive price policy 1984 introduction of milk quotas 1988 established of the budget stabiliser regime strict limit on growt of EAGGF expenditure to 74%
of the growt of EU budget spending if the production exceeds specific levels reduction
of administrated prices in the following year introduction of voluntary set-aside and extensification programs
MAC SHARRY REFORMMAC SHARRY REFORMThe first reform to be forced by external as well as
internal forces was the McSharry Plans of 1992:
disproportionate percentage of the community budget being put into agriculture,
mounting tension between Europe and other trading nations, such as the USA
move from focus of assistance from prices to direct payment to farmers based on income
focus moved exclusively to poor farmers intervention prices were cut and some
compensation paid to farmers who improved the efficient capacity of their farms
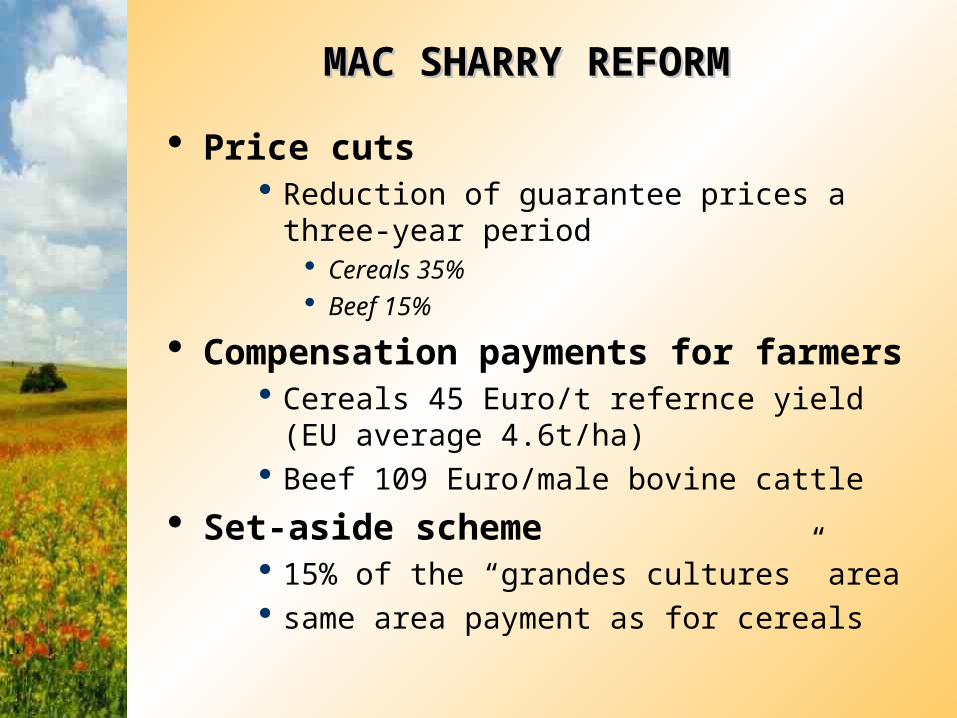
MAC SHARRY REFORM MAC SHARRY REFORM
Price cuts Reduction of guarantee prices a three-year
period Cereals 35% Beef 15%
Compensation payments for farmers Cereals 45 Euro/t refernce yield (EU average
4.6t/ha) Beef 109 Euro/male bovine cattle
Set-aside scheme 15% of the “grandes cultures” area same area payment as for cereals
ALSO...ALSO...
Accompanying measures
New aid programmes to promote:
Agri-environmental programs Afforestation Early retirement of farmers
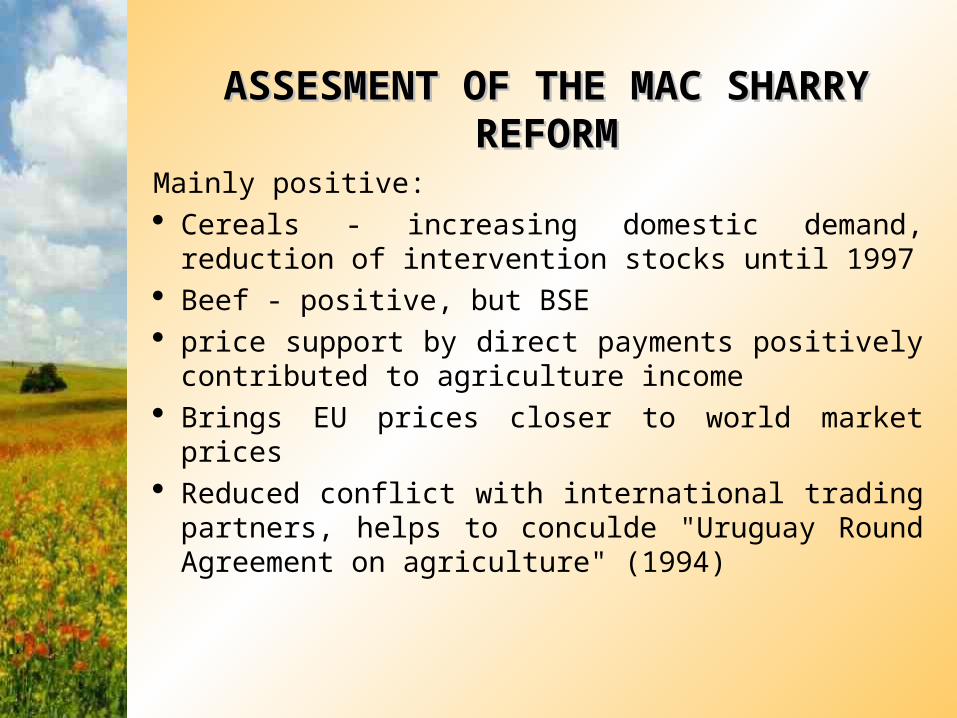
ASSESMENT OF THE MAC ASSESMENT OF THE MAC SHARRY REFORMSHARRY REFORM
Mainly positive: Cereals - increasing domestic demand, reduction
of intervention stocks until 1997 Beef - positive, but BSE price support by direct payments positively
contributed to agriculture income Brings EU prices closer to world market prices Reduced conflict with international trading
partners, helps to conculde "Uruguay Round Agreement on agriculture" (1994)
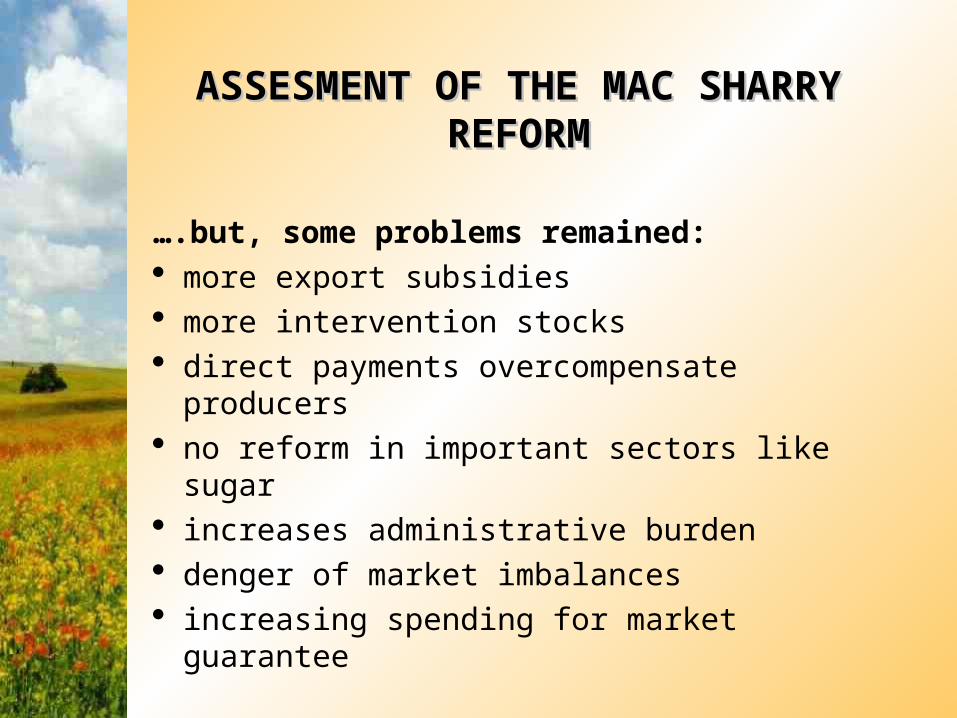
ASSESMENT OF THE MAC SHARRY ASSESMENT OF THE MAC SHARRY REFORMREFORM
….but, some problems remained: more export subsidies more intervention stocks direct payments overcompensate producers no reform in important sectors like sugar increases administrative burden denger of market imbalances increasing spending for market guarantee
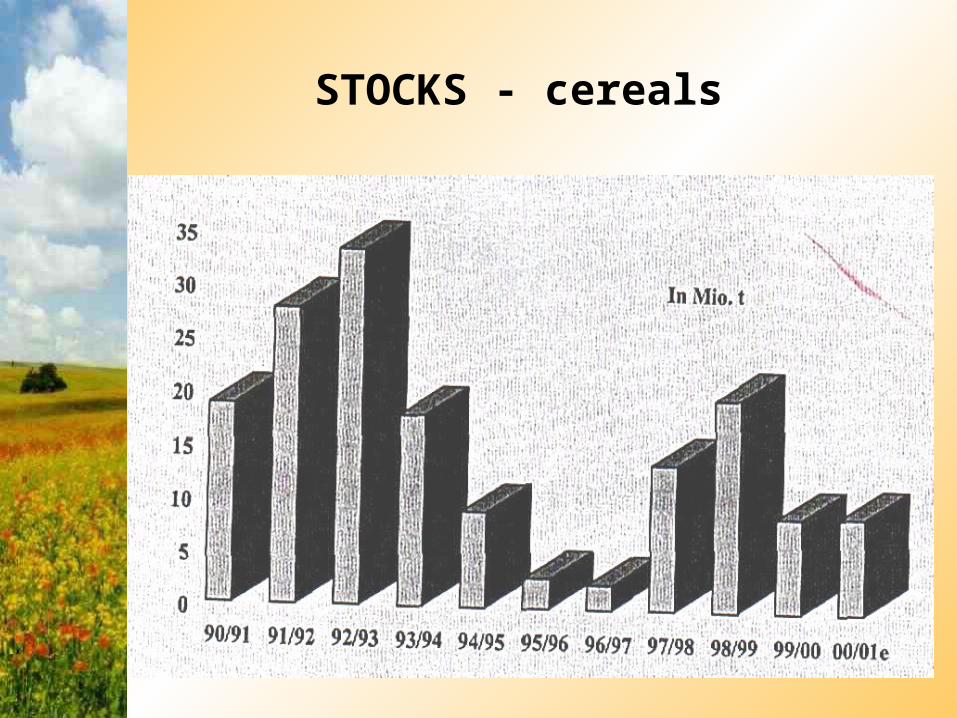
STOCKS - cereals
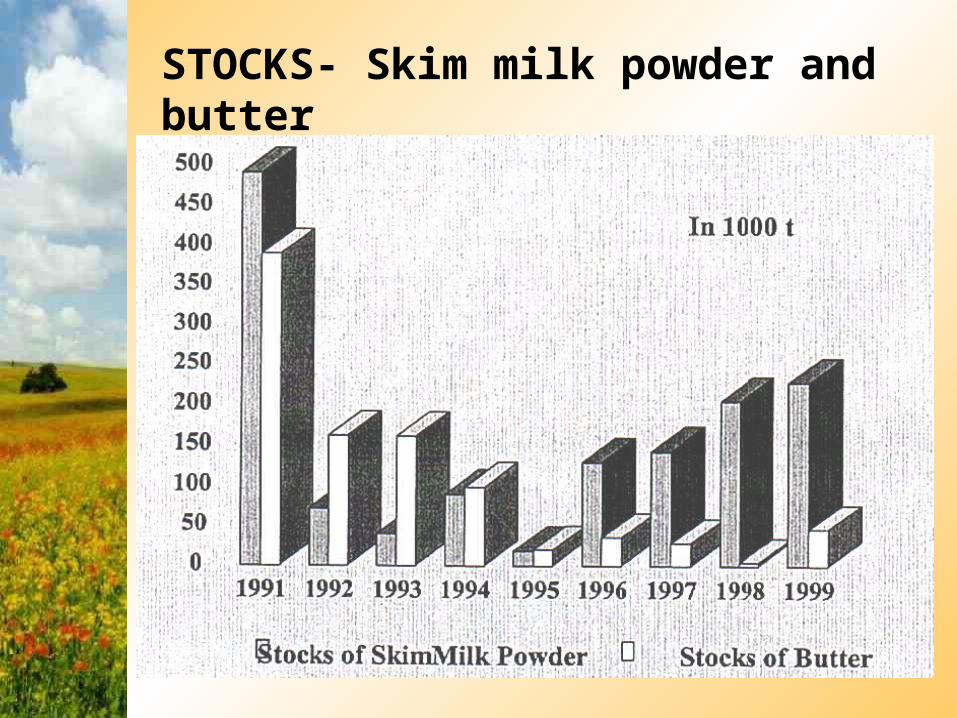
STOCKS- Skim milk powder and butter
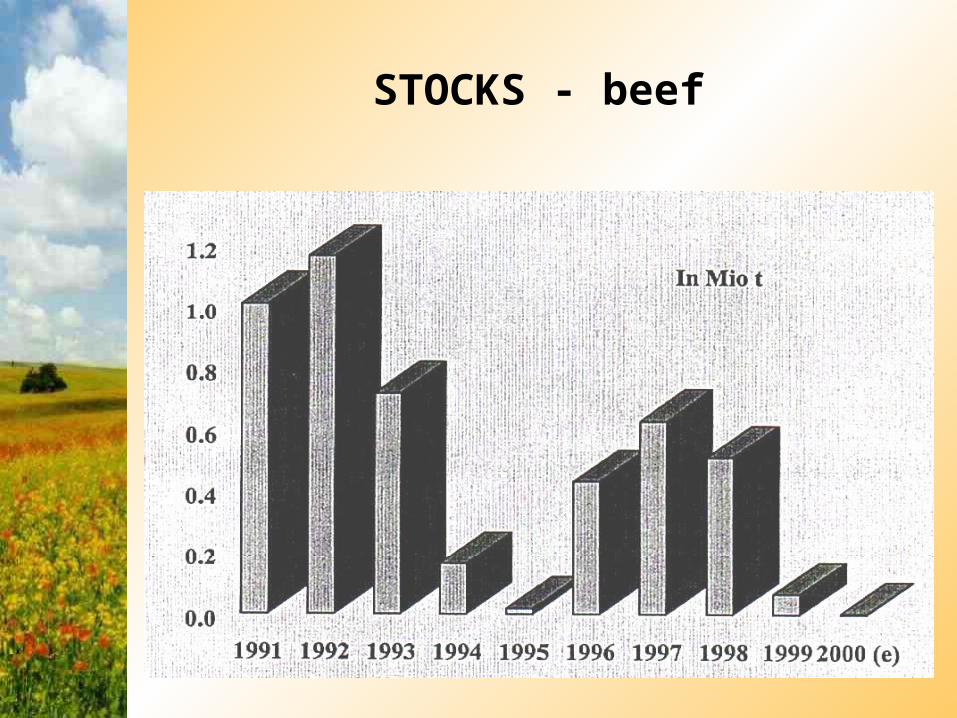
STOCKS - beef
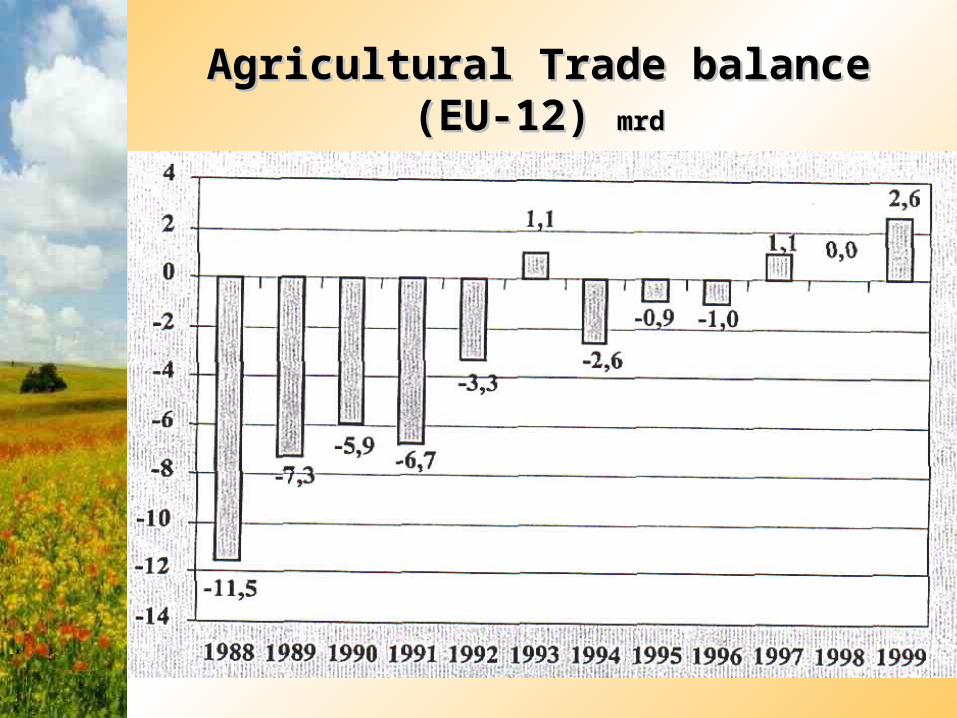
Agricultural Trade balance (EU-12) Agricultural Trade balance (EU-12) mrdmrd
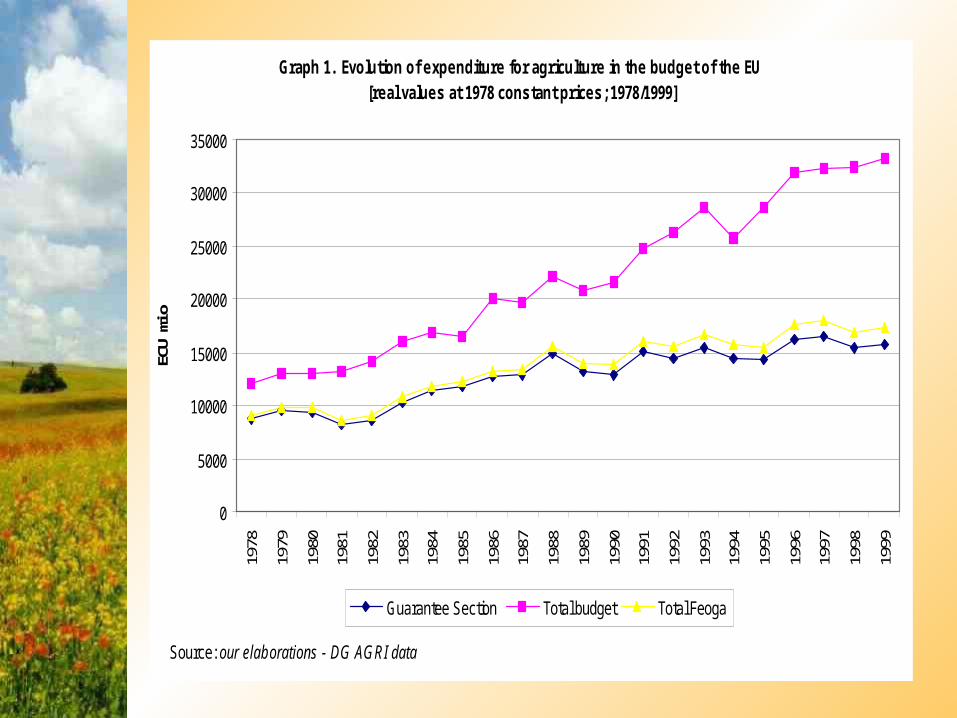
Graph 1. Evolution of expenditure for agriculture in the budget of the EU [real values at 1978 constant prices; 1978/1999]
0
5000
10000
15000
20000
25000
30000
35000
1978
1979
1980
1981
1982
1983
1984
1985
1986
1987
1988
1989
1990
1991
1992
1993
1994
1995
1996
1997
1998
1999
ECU
mio
Guarantee Section Total budget Total Feoga
Source: our elaborations - DG AGRI data
0%
20%
40%
60%
80%
100%
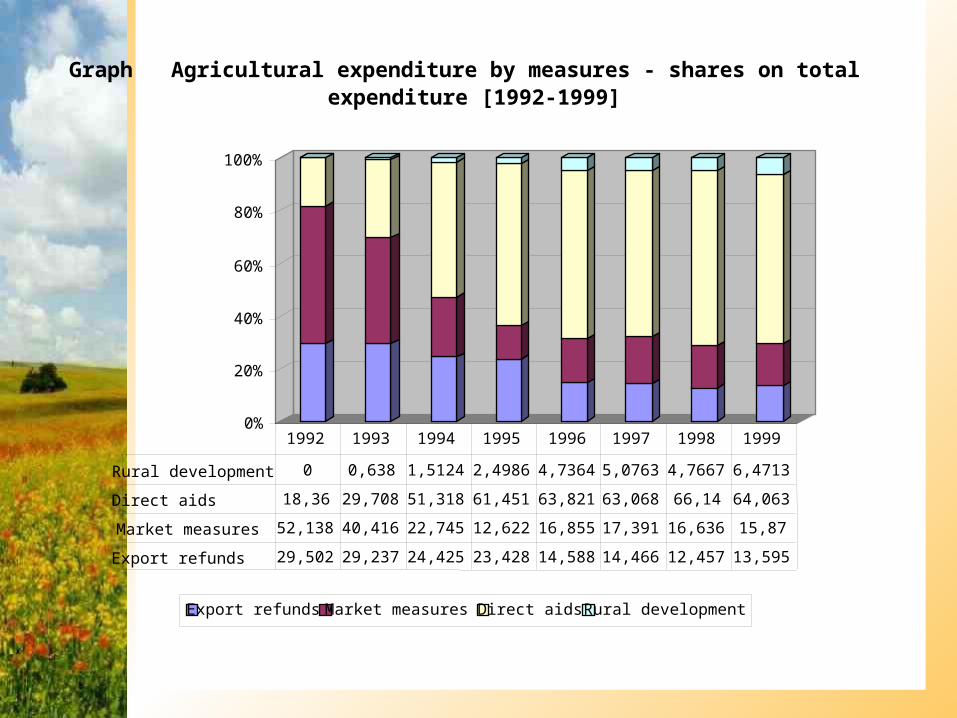
Graph Agricultural expenditure by measures - shares on total expenditure [1992-1999]
Export refunds Market measures Direct aids Rural development
Rural development 0 0,638 1,5124 2,4986 4,7364 5,0763 4,7667 6,4713
Direct aids 18,36 29,708 51,318 61,451 63,821 63,068 66,14 64,063
Market measures 52,138 40,416 22,745 12,622 16,855 17,391 16,636 15,87
Export refunds 29,502 29,237 24,425 23,428 14,588 14,466 12,457 13,595
1992 1993 1994 1995 1996 1997 1998 1999
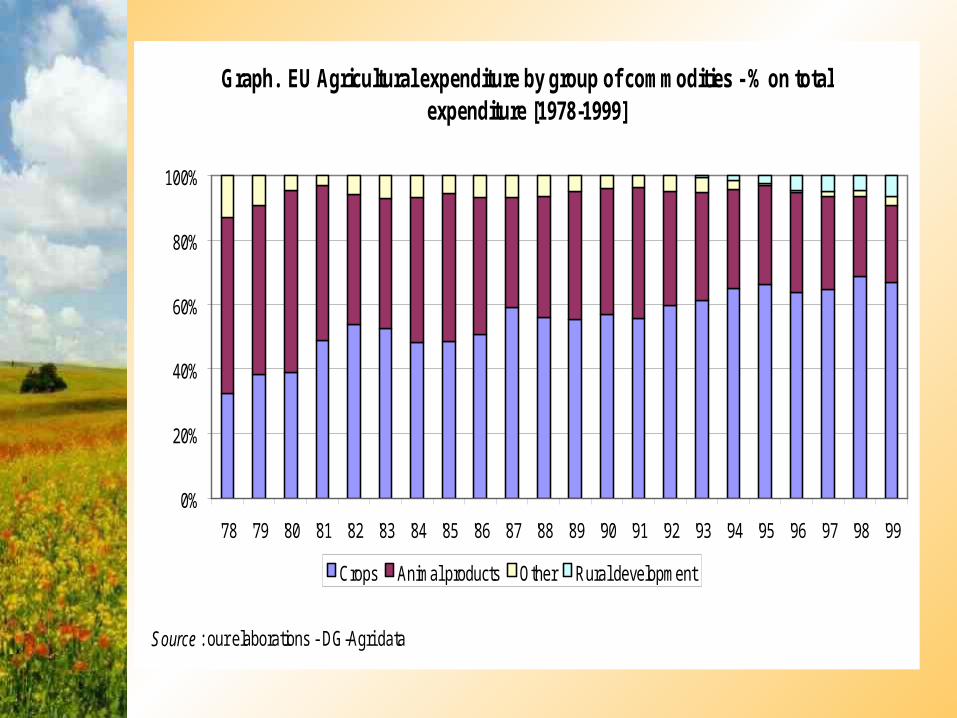
Graph. EU Agricultural expenditure by group of commodities - % on total expenditure [1978-1999]
0%
20%
40%
60%
80%
100%
'78 '79 '80 '81 '82 '83 '84 '85 '86 '87 '88 '89 '90 '91 '92 '93 '94 '95 '96 '97 '98 '99
Crops Animal products Other Rural development
Source : our elaborations - DG-Agri data
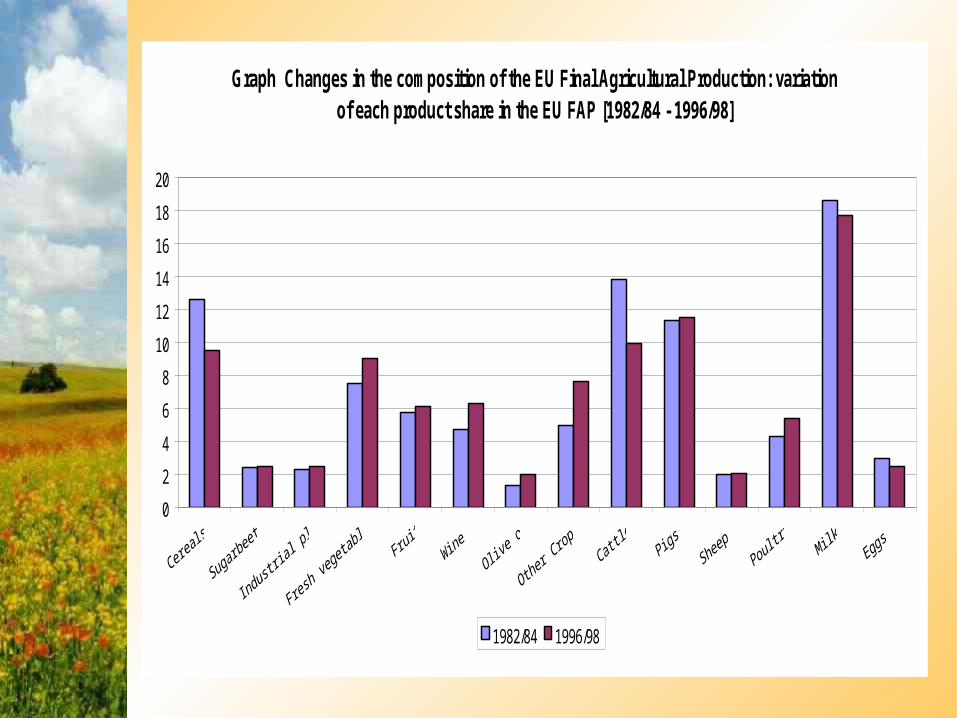
Graph Changes in the composition of the EU Final Agricultural Production: variation of each product share in the EU FAP [1982/84 - 1996/98]
0
2
4
6
8
10
12
14
16
18
20
1982/84 1996/98
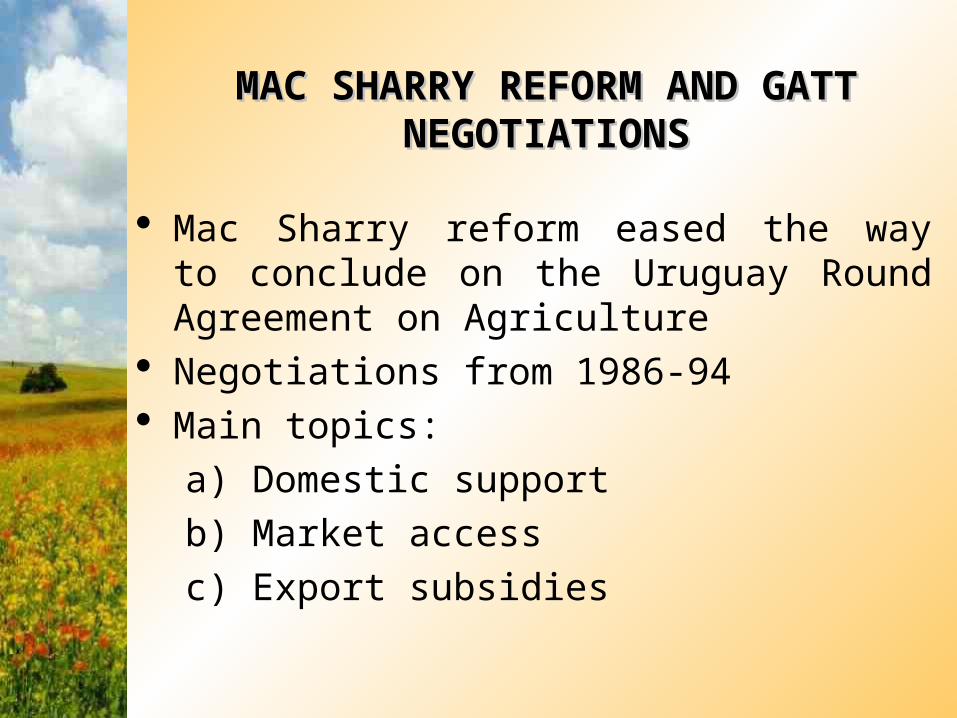
MAC SHARRY REFORM AND MAC SHARRY REFORM AND GATT NEGOTIATIONSGATT NEGOTIATIONS
Mac Sharry reform eased the way to conclude on the Uruguay Round Agreement on Agriculture
Negotiations from 1986-94 Main topics:
a) Domestic support
b) Market access
c) Export subsidies
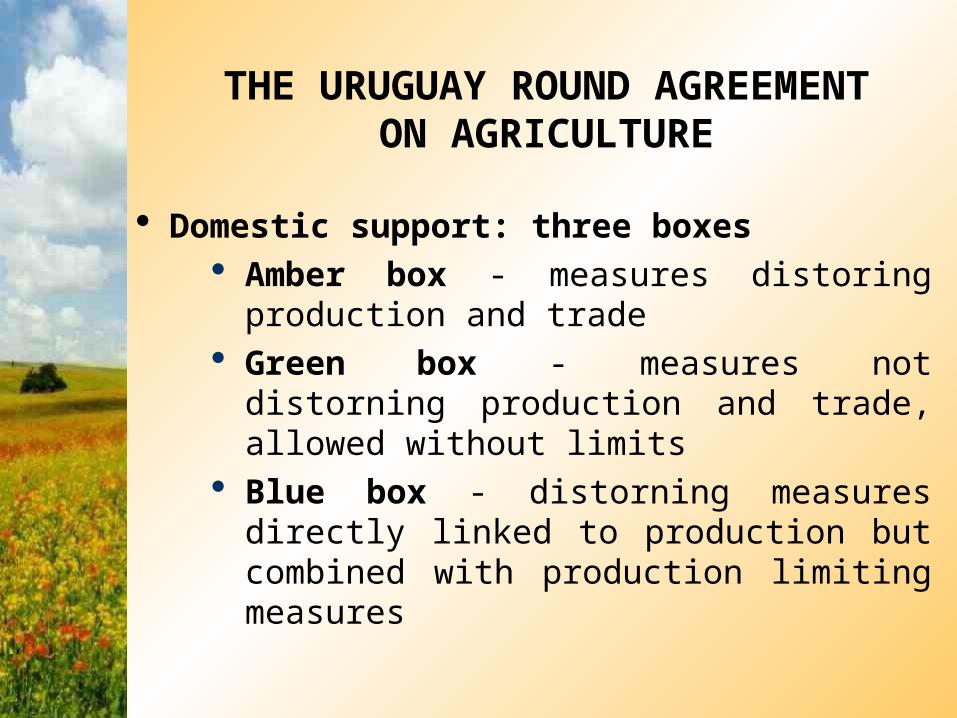
THE URUGUAY ROUND AGREEMENT ON AGRICULTURE
Domestic support: three boxes Amber box - measures distoring production
and trade Green box - measures not distorning
production and trade, allowed without limits Blue box - distorning measures directly
linked to production but combined with production limiting measures

THE URUGUAY ROUND AGREEMENT ON AGRICULTURE
Market access Tariffication of non tariff trade barrierss Tarif reduction:
a) -36% on average (1995/96 to 2000/01)
b) -15% minimum cut per product c) lower reduction commitments for
developing countries Minimum market access - 5% of domestic
demand (using tariff quotas)
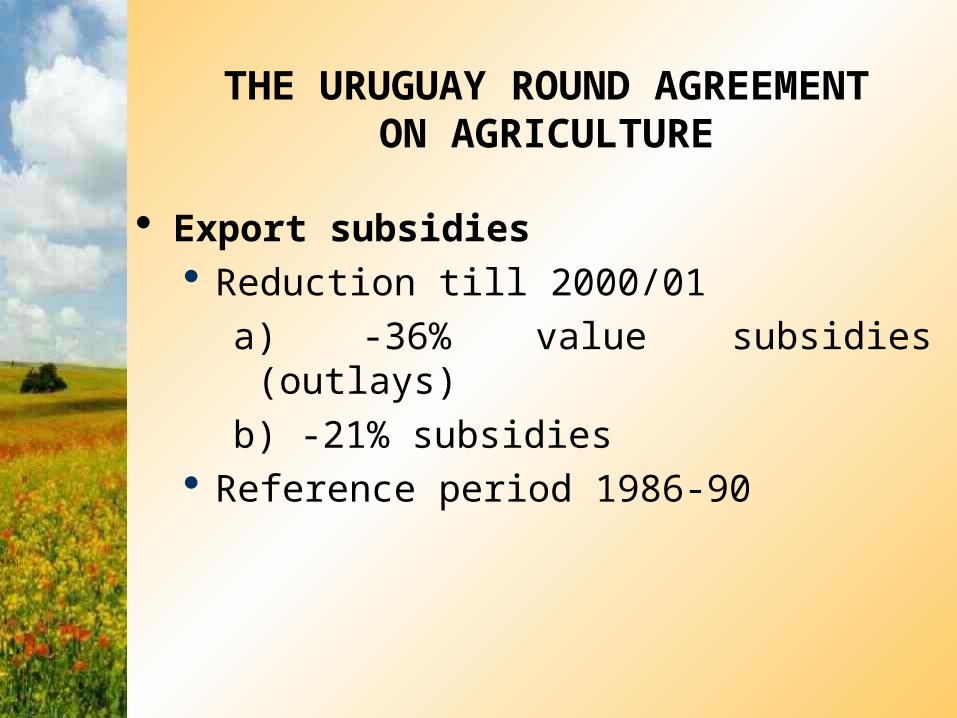
THE URUGUAY ROUND AGREEMENT ON AGRICULTURE
Export subsidies Reduction till 2000/01
a) -36% value subsidies (outlays)
b) -21% subsidies Reference period 1986-90
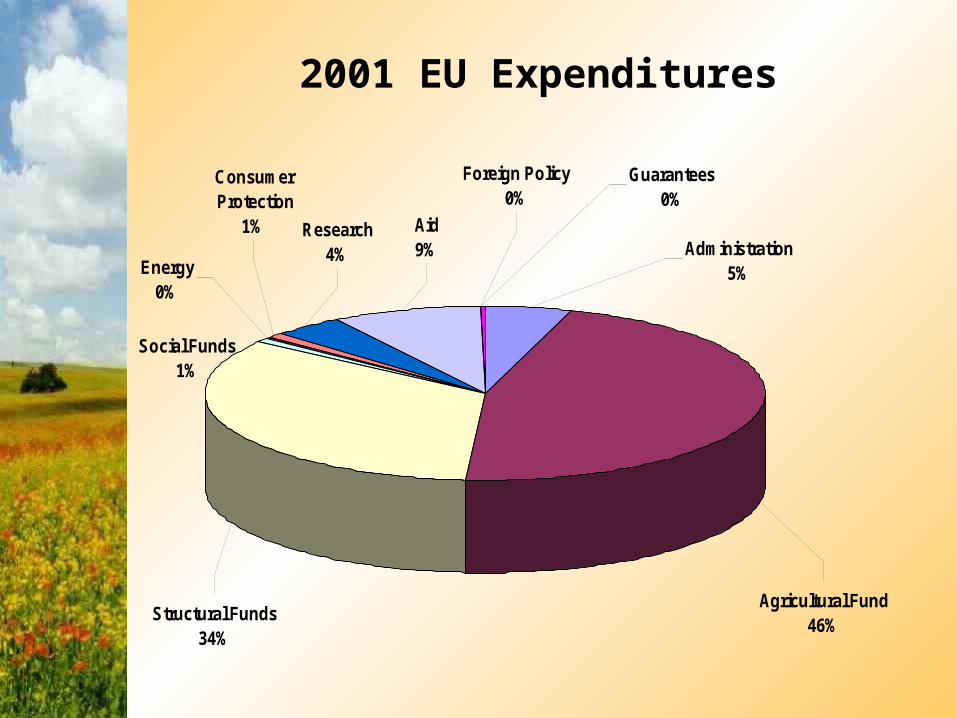
2001 EU Expenditures
Structural Funds34%
Agricultural Fund46%
Administration5%
Foreign Policy0%
Guarantees0%
Aid9%
Research4%
Energy0%
Social Funds1%
Consumer Protection
1%
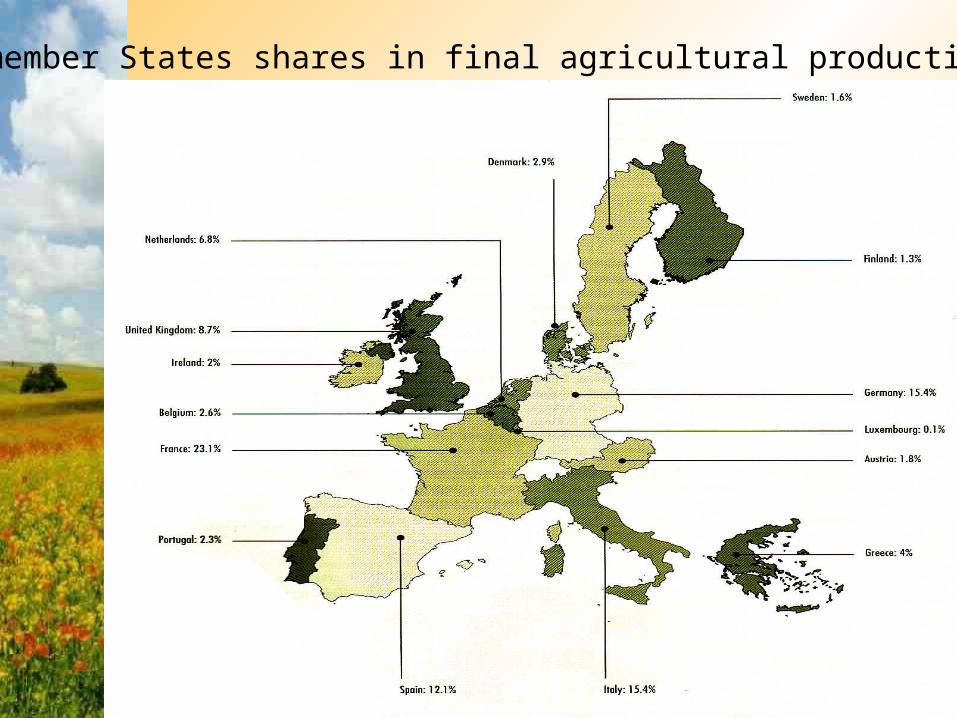
Individual member States shares in final agricultural production in the EU