Embed Size (px)
Citation preview
Recommendation ITU-R BT.1729(2005)
Common 16:9 or 4:3 aspect ratio digitaltelevision reference test pattern
BT Series
Broadcasting service(television)
ii Rec. ITU-R BT.1729
Foreword
The role of the Radiocommunication Sector is to ensure the rational, equitable, efficient and economical use of the radio-frequency spectrum by all radiocommunication services, including satellite services, and carry out studies without limit of frequency range on the basis of which Recommendations are adopted.
The regulatory and policy functions of the Radiocommunication Sector are performed by World and Regional Radiocommunication Conferences and Radiocommunication Assemblies supported by Study Groups.
Policy on Intellectual Property Right (IPR)
ITU-R policy on IPR is described in the Common Patent Policy for ITU-T/ITU-R/ISO/IEC referenced in Annex 1 of Resolution ITU-R 1. Forms to be used for the submission of patent statements and licensing declarations by patent holders are available from http://www.itu.int/ITU-R/go/patents/en where the Guidelines for Implementation of the Common Patent Policy for ITU-T/ITU-R/ISO/IEC and the ITU-R patent information database can also be found.
Series of ITU-R Recommendations
(Also available online at http://www.itu.int/publ/R-REC/en)
Series Title
BO Satellite delivery
BR Recording for production, archival and play-out; film for television
BS Broadcasting service (sound)
BT Broadcasting service (television)
F Fixed service
M Mobile, radiodetermination, amateur and related satellite services
P Radiowave propagation
RA Radio astronomy
RS Remote sensing systems
S Fixed-satellite service
SA Space applications and meteorology
SF Frequency sharing and coordination between fixed-satellite and fixed service systems
SM Spectrum management
SNG Satellite news gathering
TF Time signals and frequency standards emissions
V Vocabulary and related subjects
Note: This ITU-R Recommendation was approved in English under the procedure detailed in Resolution ITU-R 1.
Electronic Publication Geneva, 2013
ITU 2013
All rights reserved. No part of this publication may be reproduced, by any means whatsoever, without written permission of ITU.
Rec. ITU-R BT.1729 1
RECOMMENDATION ITU-R BT.1729*
Common 16:9 or 4:3 aspect ratio digital television reference test pattern
(Question ITU-R 97/6)
(2005)
Scope
This Recommendation specifies a reference test pattern which may be used with any of Recommendations ITU-R BT.601, ITU-R BT.1358, ITU-R BT.1543, ITU-R BT.1847 or ITU-R BT.709. The pattern is designed for use in either 16:9 aspect ratio or 4:3 aspect ratio.
The ITU Radiocommunication Assembly,
considering
a) that test patterns provide a convenient means of assessing chrominance and luminance performance in a television system;
b) that although the requirements for test patterns differ between standard-definition and high-definition television (HDTV) digital formats, it is possible to construct a single test signal which may be successfully used for all of these formats;
c) that such a common test pattern may be useful when broadcasting in multiple formats or when converting between formats;
d) that the use of a common test pattern for all these formats can simplify test procedures and reduce the opportunity for misinterpretation of signal parameters and misalignment of systems,
recommends
1 that the parameters defined in Annex 1 should be implemented and may be used for production and distribution purposes in standard-definition and HDTV digital formats.
* Radiocommunication Study Group 6 made editorial amendments to this Recommendation in May 2012
and in April 2013 in accordance with Resolution ITU-R 1.
2 Rec. ITU-R BT.1729
Annex 1
Common 16:9 or 4:3 aspect ratio digital television reference test pattern
Normative references
Recommendation ITU-R BS.645 Test signals and metering to be used on international sound programme connections.
Recommendation ITU-R BT.471 Nomenclature and description of colour bar signals.
Recommendation ITU-R BT.601 Studio encoding parameters of digital television for standard 4:3 and wide-screen 16:9 aspect ratios.
Recommendation ITU-R BT.709 Parameter values for the HDTV standards for production and international programme exchange.
Recommendation ITU-R BT.1358 Studio parameters of 625 and 525 line progressive scan television systems.
Recommendation ITU-R BT.1379 Safe areas of wide-screen 16:9 and standard 4:3 aspect ratio productions to achieve a common format during a transition period to wide-screen 16:9 broadcasting.
Recommendation ITU-R BT.1543 1 280 × 720, 16:9 progressively-captured image format for production and international programme exchange in the 60 Hz environment.
Recommendation ITU-R BT.1847 1 280 × 720, 16:9 progressively-captured image format for production and international programme exchange in the 50 Hz environment.
Purpose
The reference test pattern has several purposes:
– quality control of chrominance and luminance through the production chain;
– checking and adjusting the chrominance and luminance alignment of broadcast equipment, particularly video monitors;
– general testing of equipment for video production, emission and presentation;
– establish that a video circuit is active and that associated audio is available;
– check for audio-video synchronization;
– check for correct connection of audio channels and correct audio levels.
System types
The pattern described in this Recommendation is intended for use with Recommendations ITU-R BT.601, ITU-R BT.709, ITU-R BT.1358, ITU-R BT.1847 or ITU-R BT.1543. These systems are distinguished by the proportions of their colour encoding (or “colorimetry”) and by their resolution.
Zones of test pattern
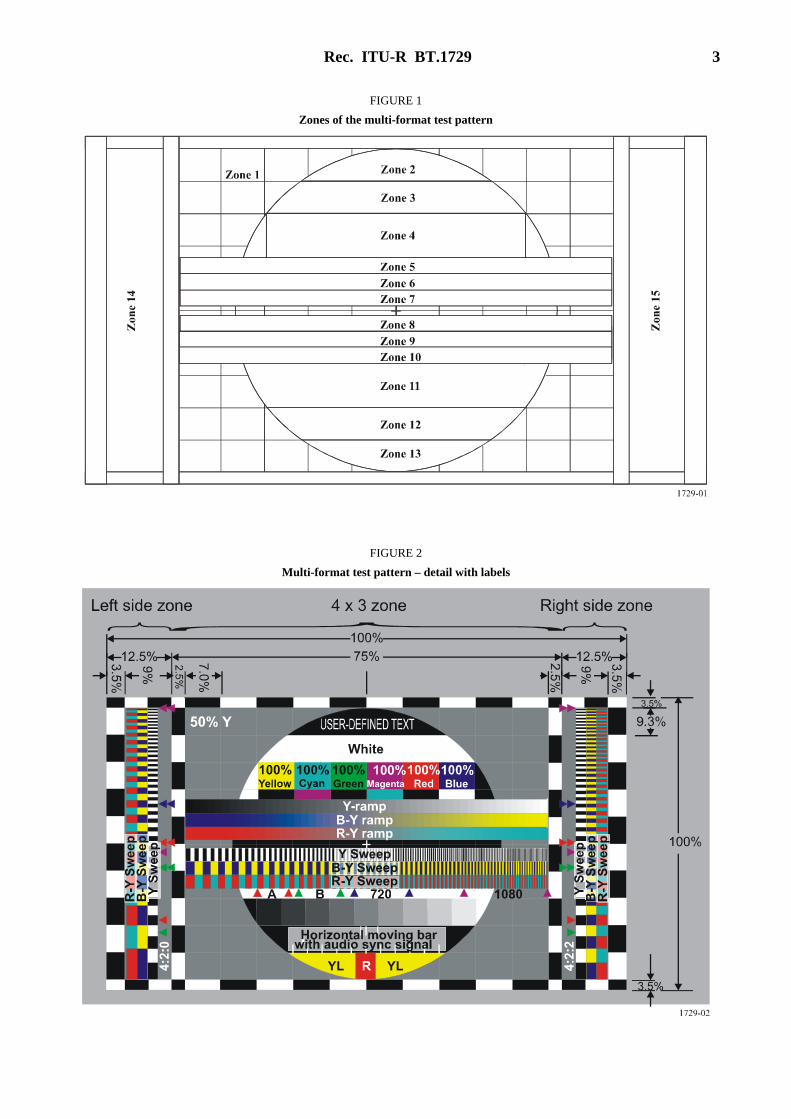
The zones of the multi-format test pattern are shown in Fig. 1. The test pattern is shown in detail with labels in Fig. 2. The test pattern is shown as it appears on screen in Fig. 3. An alternate format suited to 4:3 systems is shown in Fig. 4.
Rec. ITU-R BT.1729 3
FIGURE 1
Zones of the multi-format test pattern
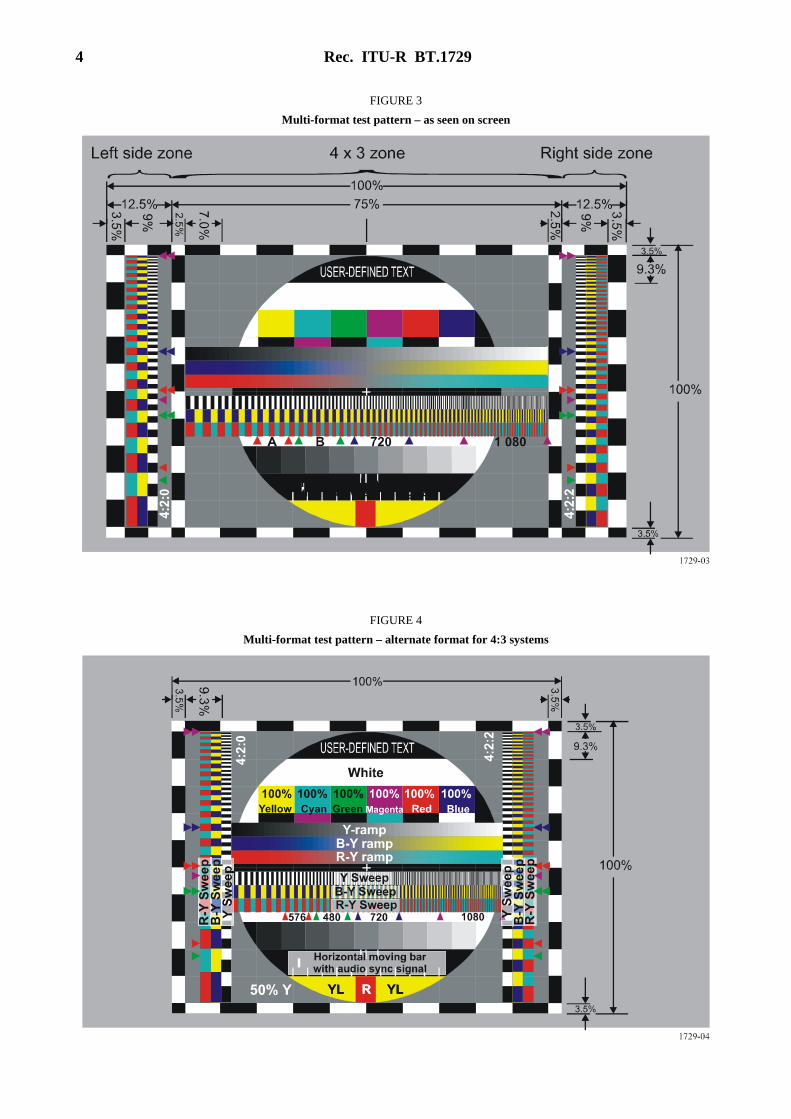
FIGURE 2
Multi-format test pattern – detail with labels
4 Rec. ITU-R BT.1729
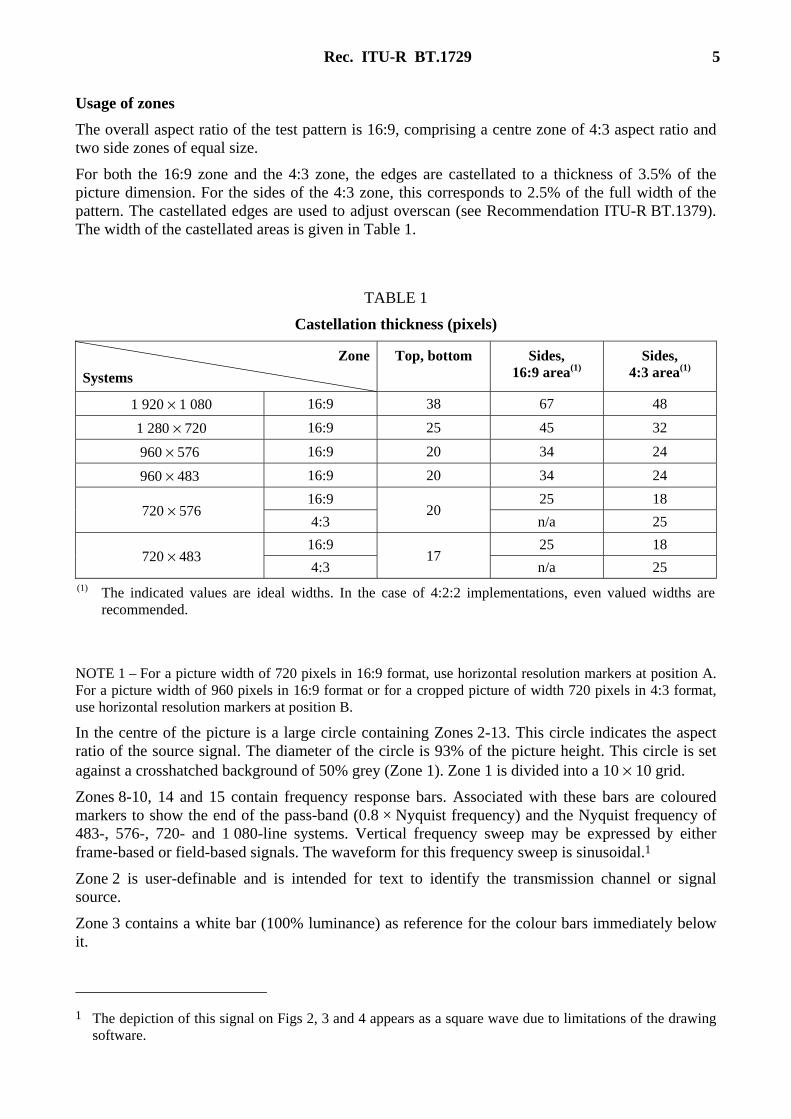
FIGURE 3
Multi-format test pattern – as seen on screen
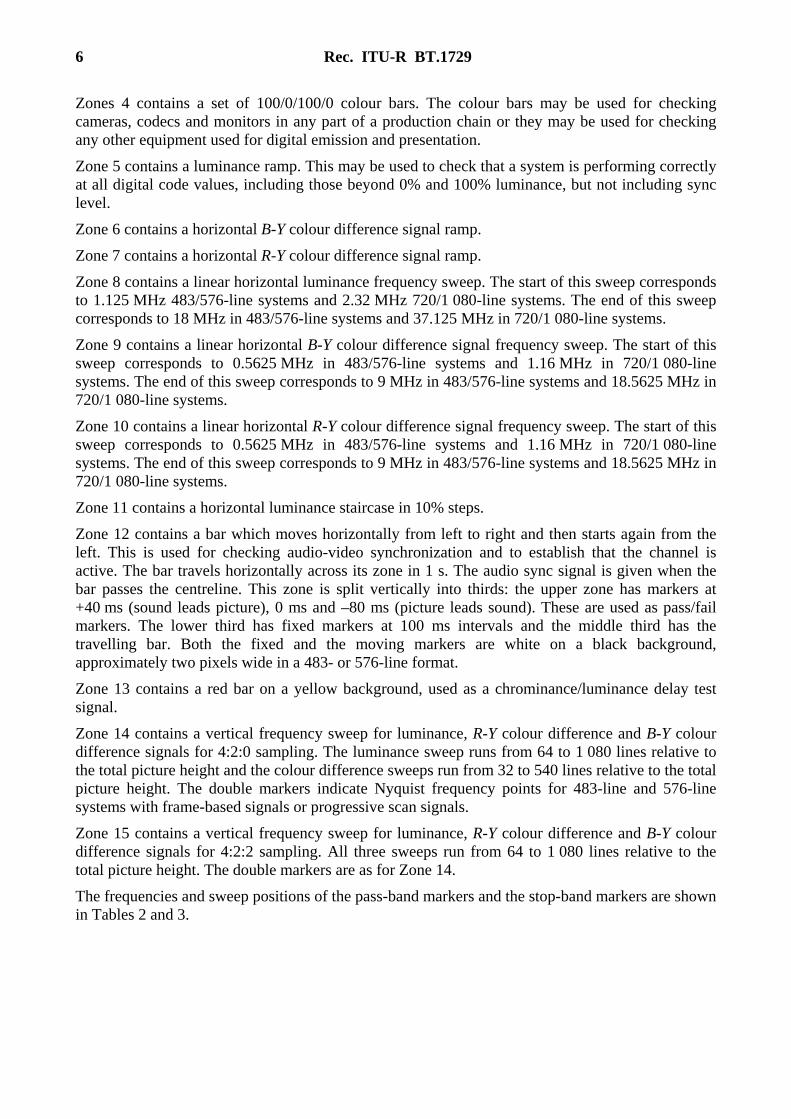
FIGURE 4
Multi-format test pattern – alternate format for 4:3 systems
Rec. ITU-R BT.1729 5
Usage of zones
The overall aspect ratio of the test pattern is 16:9, comprising a centre zone of 4:3 aspect ratio and two side zones of equal size.
For both the 16:9 zone and the 4:3 zone, the edges are castellated to a thickness of 3.5% of the picture dimension. For the sides of the 4:3 zone, this corresponds to 2.5% of the full width of the pattern. The castellated edges are used to adjust overscan (see Recommendation ITU-R BT.1379). The width of the castellated areas is given in Table 1.
TABLE 1
Castellation thickness (pixels)
Zone
Systems
Top, bottom Sides, 16:9 area(1)
Sides, 4:3 area(1)
1 920 × 1 080 16:9 38 67 48
1 280 × 720 16:9 25 45 32
960 × 576 16:9 20 34 24
960 × 483 16:9 20 34 24
720 × 576 16:9
20 25 18
4:3 n/a 25
720 × 483 16:9
17 25 18
4:3 n/a 25 (1) The indicated values are ideal widths. In the case of 4:2:2 implementations, even valued widths are
recommended.
NOTE 1 – For a picture width of 720 pixels in 16:9 format, use horizontal resolution markers at position A. For a picture width of 960 pixels in 16:9 format or for a cropped picture of width 720 pixels in 4:3 format, use horizontal resolution markers at position B.
In the centre of the picture is a large circle containing Zones 2-13. This circle indicates the aspect ratio of the source signal. The diameter of the circle is 93% of the picture height. This circle is set against a crosshatched background of 50% grey (Zone 1). Zone 1 is divided into a 10 × 10 grid.
Zones 8-10, 14 and 15 contain frequency response bars. Associated with these bars are coloured markers to show the end of the pass-band (0.8 × Nyquist frequency) and the Nyquist frequency of 483-, 576-, 720- and 1 080-line systems. Vertical frequency sweep may be expressed by either frame-based or field-based signals. The waveform for this frequency sweep is sinusoidal.1
Zone 2 is user-definable and is intended for text to identify the transmission channel or signal source.
Zone 3 contains a white bar (100% luminance) as reference for the colour bars immediately below it.
1 The depiction of this signal on Figs 2, 3 and 4 appears as a square wave due to limitations of the drawing software.
6 Rec. ITU-R BT.1729
Zones 4 contains a set of 100/0/100/0 colour bars. The colour bars may be used for checking cameras, codecs and monitors in any part of a production chain or they may be used for checking any other equipment used for digital emission and presentation.
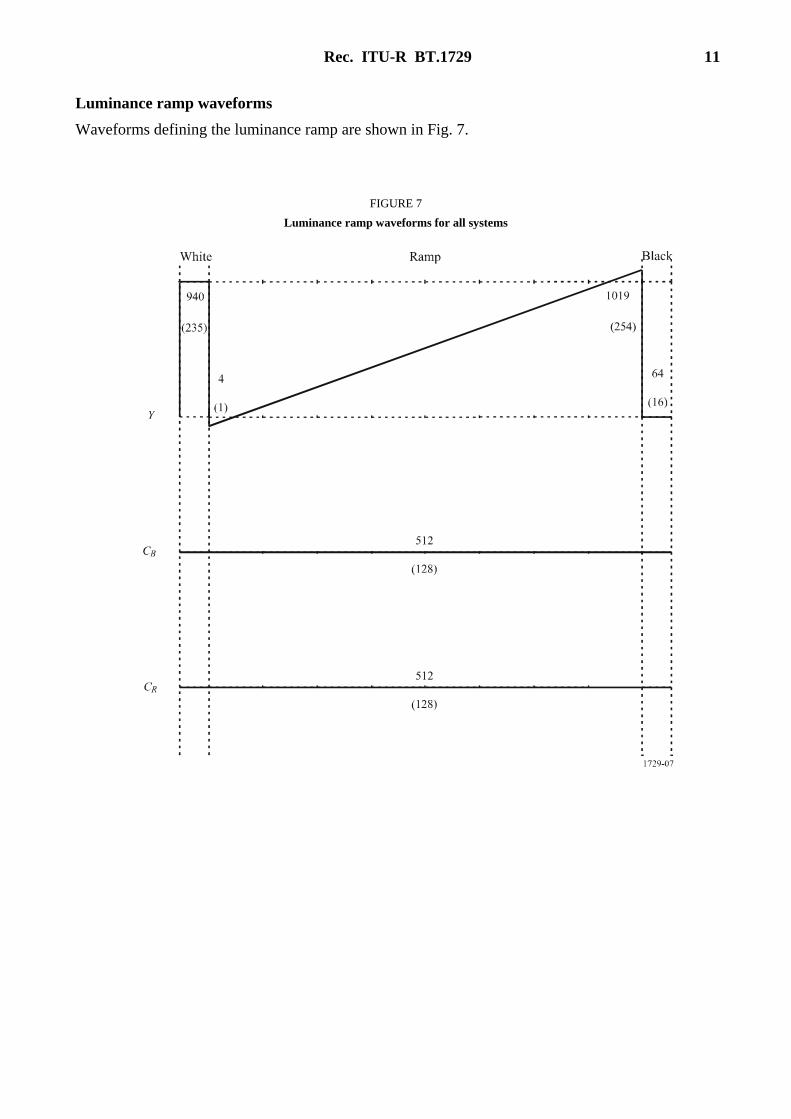
Zone 5 contains a luminance ramp. This may be used to check that a system is performing correctly at all digital code values, including those beyond 0% and 100% luminance, but not including sync level.
Zone 6 contains a horizontal B-Y colour difference signal ramp.
Zone 7 contains a horizontal R-Y colour difference signal ramp.
Zone 8 contains a linear horizontal luminance frequency sweep. The start of this sweep corresponds to 1.125 MHz 483/576-line systems and 2.32 MHz 720/1 080-line systems. The end of this sweep corresponds to 18 MHz in 483/576-line systems and 37.125 MHz in 720/1 080-line systems.
Zone 9 contains a linear horizontal B-Y colour difference signal frequency sweep. The start of this sweep corresponds to 0.5625 MHz in 483/576-line systems and 1.16 MHz in 720/1 080-line systems. The end of this sweep corresponds to 9 MHz in 483/576-line systems and 18.5625 MHz in 720/1 080-line systems.
Zone 10 contains a linear horizontal R-Y colour difference signal frequency sweep. The start of this sweep corresponds to 0.5625 MHz in 483/576-line systems and 1.16 MHz in 720/1 080-line systems. The end of this sweep corresponds to 9 MHz in 483/576-line systems and 18.5625 MHz in 720/1 080-line systems.
Zone 11 contains a horizontal luminance staircase in 10% steps.
Zone 12 contains a bar which moves horizontally from left to right and then starts again from the left. This is used for checking audio-video synchronization and to establish that the channel is active. The bar travels horizontally across its zone in 1 s. The audio sync signal is given when the bar passes the centreline. This zone is split vertically into thirds: the upper zone has markers at +40 ms (sound leads picture), 0 ms and –80 ms (picture leads sound). These are used as pass/fail markers. The lower third has fixed markers at 100 ms intervals and the middle third has the travelling bar. Both the fixed and the moving markers are white on a black background, approximately two pixels wide in a 483- or 576-line format.
Zone 13 contains a red bar on a yellow background, used as a chrominance/luminance delay test signal.
Zone 14 contains a vertical frequency sweep for luminance, R-Y colour difference and B-Y colour difference signals for 4:2:0 sampling. The luminance sweep runs from 64 to 1 080 lines relative to the total picture height and the colour difference sweeps run from 32 to 540 lines relative to the total picture height. The double markers indicate Nyquist frequency points for 483-line and 576-line systems with frame-based signals or progressive scan signals.
Zone 15 contains a vertical frequency sweep for luminance, R-Y colour difference and B-Y colour difference signals for 4:2:2 sampling. All three sweeps run from 64 to 1 080 lines relative to the total picture height. The double markers are as for Zone 14.
The frequencies and sweep positions of the pass-band markers and the stop-band markers are shown in Tables 2 and 3.
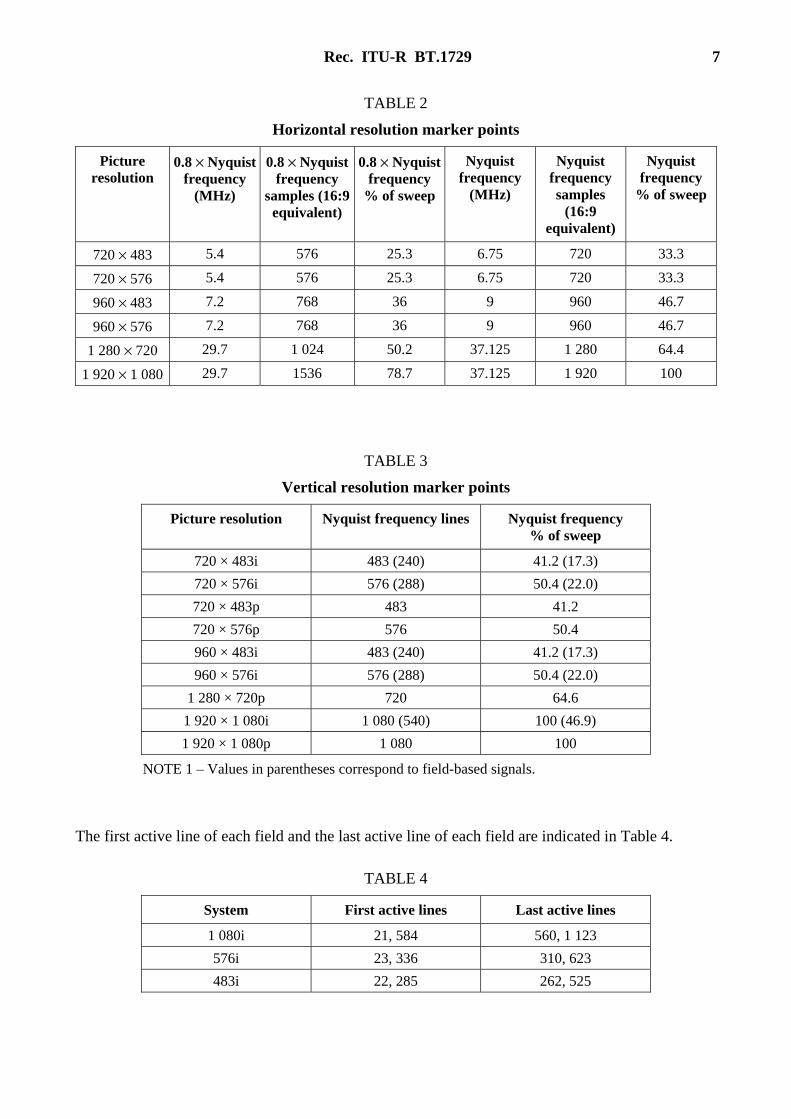
Rec. ITU-R BT.1729 7
TABLE 2
Horizontal resolution marker points
Picture resolution
0.8 × Nyquist frequency
(MHz)
0.8 × Nyquist frequency
samples (16:9 equivalent)
0.8 × Nyquist frequency
% of sweep
Nyquist frequency
(MHz)
Nyquist frequency samples
(16:9 equivalent)
Nyquist frequency
% of sweep
720 × 483 5.4 576 25.3 6.75 720 33.3
720 × 576 5.4 576 25.3 6.75 720 33.3
960 × 483 7.2 768 36 9 960 46.7
960 × 576 7.2 768 36 9 960 46.7
1 280 × 720 29.7 1 024 50.2 37.125 1 280 64.4
1 920 × 1 080 29.7 1536 78.7 37.125 1 920 100
TABLE 3
Vertical resolution marker points
Picture resolution Nyquist frequency lines Nyquist frequency % of sweep
720 × 483i 483 (240) 41.2 (17.3)
720 × 576i 576 (288) 50.4 (22.0)
720 × 483p 483 41.2
720 × 576p 576 50.4
960 × 483i 483 (240) 41.2 (17.3)
960 × 576i 576 (288) 50.4 (22.0)
1 280 × 720p 720 64.6
1 920 × 1 080i 1 080 (540) 100 (46.9)
1 920 × 1 080p 1 080 100
NOTE 1 – Values in parentheses correspond to field-based signals.
The first active line of each field and the last active line of each field are indicated in Table 4.
TABLE 4
System First active lines Last active lines
1 080i 21, 584 560, 1 123
576i 23, 336 310, 623
483i 22, 285 262, 525
8 Rec. ITU-R BT.1729
Rise and fall times of bar transitions
The 10% to 90% rise time and 90% to 10% fall time of the colour bars should be identical to each other and should be consistent with the frequency response specifications in Recommendations ITU-R BT.601, ITU-R BT.1358, ITU-R BT.1847, ITU-R BT.1543 or ITU-R BT.709, as appropriate to the format2. The shape of the leading and trailing edges should be similar to a raised cosine function.
Colour signal encoding
The derivation of luminance and colour difference signals from R′, G′ and B′ components should comply with Recommendation ITU-R BT.709 for 1 080-line systems or Recommendation ITU-R BT.601 or Recommendation ITU-R BT.1358 for 483/576-line systems and with Recommendations ITU-R BT.1543 and ITU-R BT.1847 for 720-line systems.
For 1 080/720-line systems these relationships are:
Y′ = 0.2126R′ + 0.7152G′ + 0.0722B′
BC′ = (B′ – Y′)/1.8556
RC′ = (R′ – Y′)/1.5748
For 483/576-line systems these relationships are:
Y′ = 0.299R′ + 0.587G′ + 0.114B′
BC′ = 0.564 (B′ – Y′)
RC′ = 0.713 (R′ – Y′)
Equipment designers and operators should be aware that an appropriate colorimetry conversion process is required when format conversions between the 1 080/720-line systems and the 483/576-line systems occur.
Audio signals
Audio signals of two types may be used in conjunction with the video test signal:
Type 1: Continuous sinewave tones on each channel, using the following frequencies3:
Left: 392 Hz (G)
Centre: 493.9 Hz (B)
Right: 587.3 Hz (D)
Surround (mono) or surround (left): 784 Hz (G)
Surround (right): 987.8 Hz (B)
LFE: 40 Hz
Type 2: As for Type 1 plus a 40 Hz tone on every channel.
The Type 1 tone is used for channel identification and for checking audio-video synchronization. The right channel tone should be muted once per second for 25 ms to coincide with the visual synchronizing indication. The synchronization point should be at the start of the mute period.
2 The rise-time should be consistent with a minimum-phase analogue system with the same amplitude-frequency response.
3 The frequencies of the identification tones may be varied slightly if desired: equal temperament tunings are given here but just tunings may be used instead.
Rec. ITU-R BT.1729 9
The Type 2 tone may be used for the same purposes as the Type 1 tone and for checking relative polarity of channels.
If two tones are used on a channel, they should be of equal level, 3 dB below alignment level4, so that the sum of the two tones produces alignment level.
If a single tone is used on a channel, it should be at alignment level.
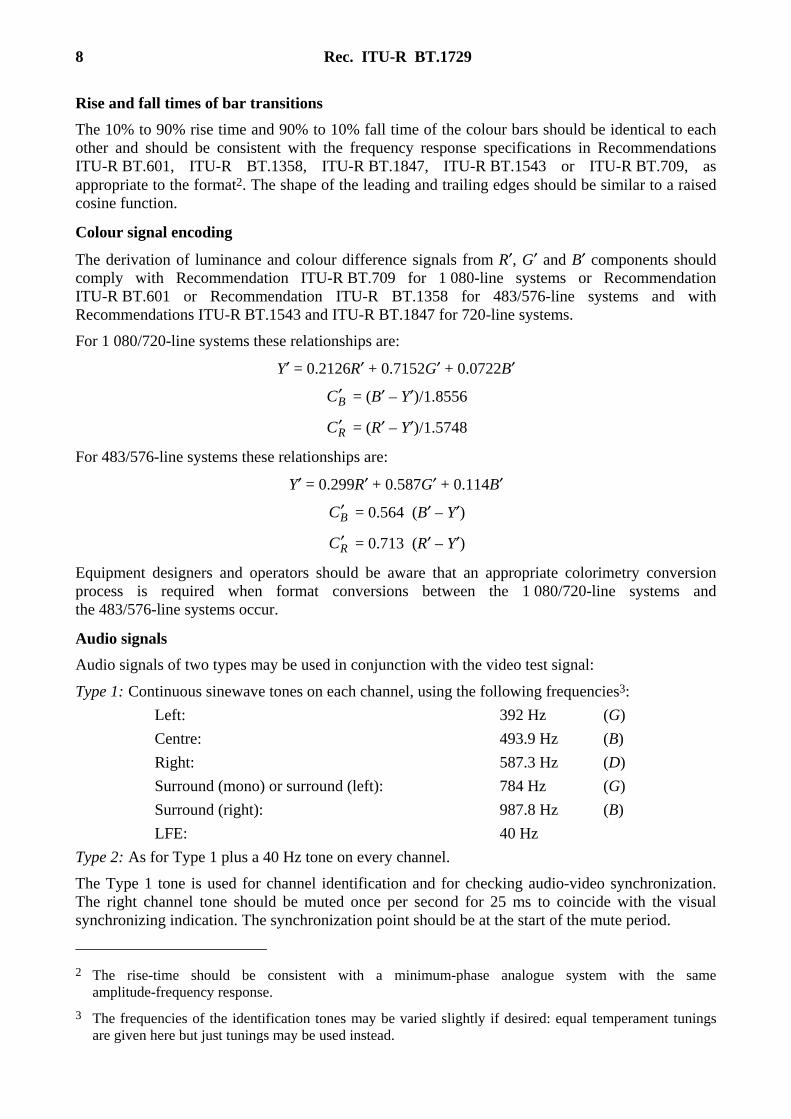
Waveforms for 1 080-/720-line systems
Analogue waveforms corresponding to the colour bar pattern in the test pattern for 1 080-line and 720-line systems are shown in Fig. 5. Values without parentheses are word-codes for a 10-bit digital system. Values shown in parentheses are for an 8-bit digital system. The width of each bar from 100% Yellow to 100% Blue inclusive is aligned with a 10 by 10 grid.
FIGURE 5
1 080/720-line systems, colour bar waveforms, 100/0/100/0 bars
4 Alignment level is defined in Recommendation ITU-R BS.645.
10 Rec. ITU-R BT.1729
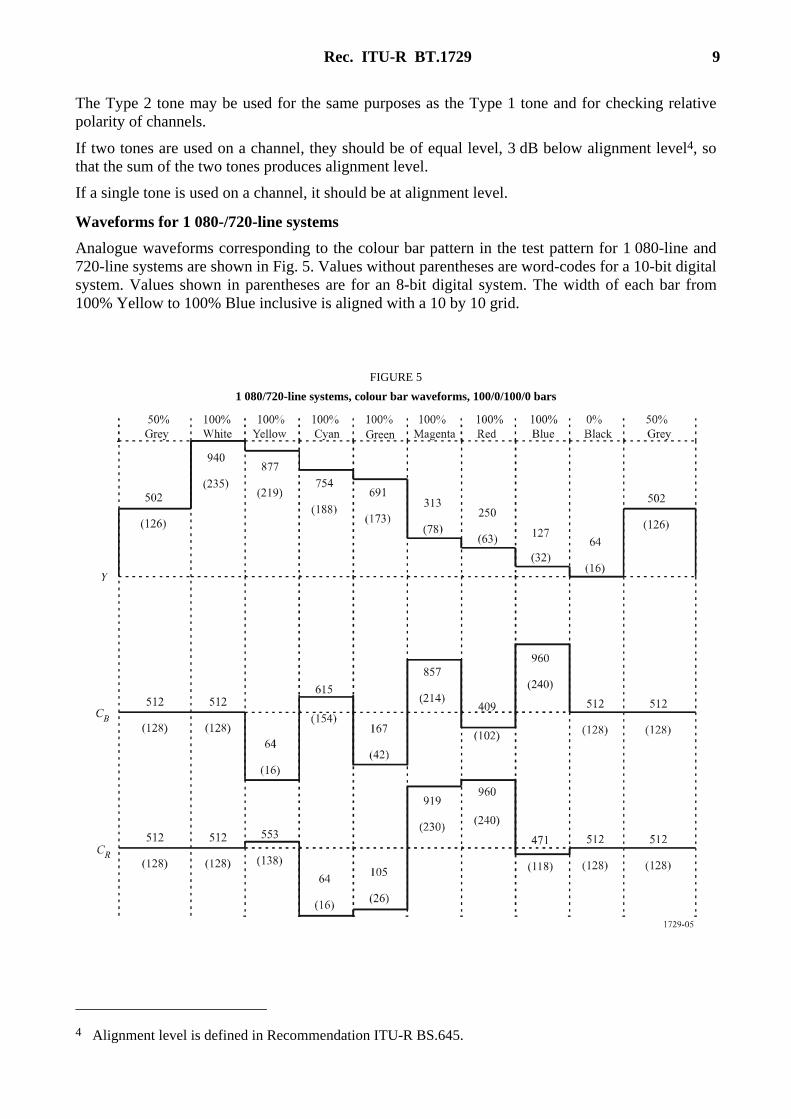
Colour bar waveform for 483/576-line systems
Analogue waveforms corresponding to the four patterns in the test pattern for the 720 × 576 and 720 × 483 digital systems are shown in Fig. 6. Values without parentheses are word-codes for a 10-bit digital system. Values shown in parentheses are for an 8-bit digital system. The width of each bar from 100% Yellow to 100% Blue inclusive is aligned with 10 × 10 grid.
FIGURE 6
483/576-line systems, colour bar waveforms, 100/0/100/0 bars
Rec. ITU-R BT.1729 11
Luminance ramp waveforms
Waveforms defining the luminance ramp are shown in Fig. 7.
FIGURE 7
Luminance ramp waveforms for all systems
12 Rec. ITU-R BT.1729
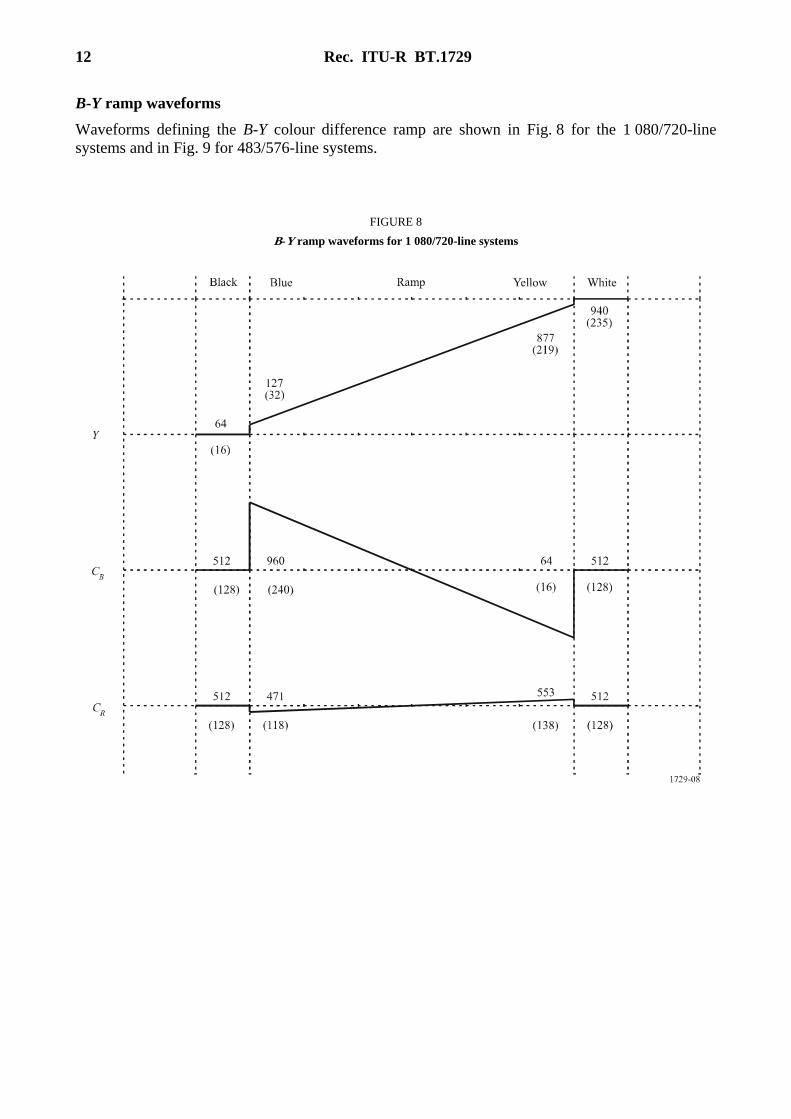
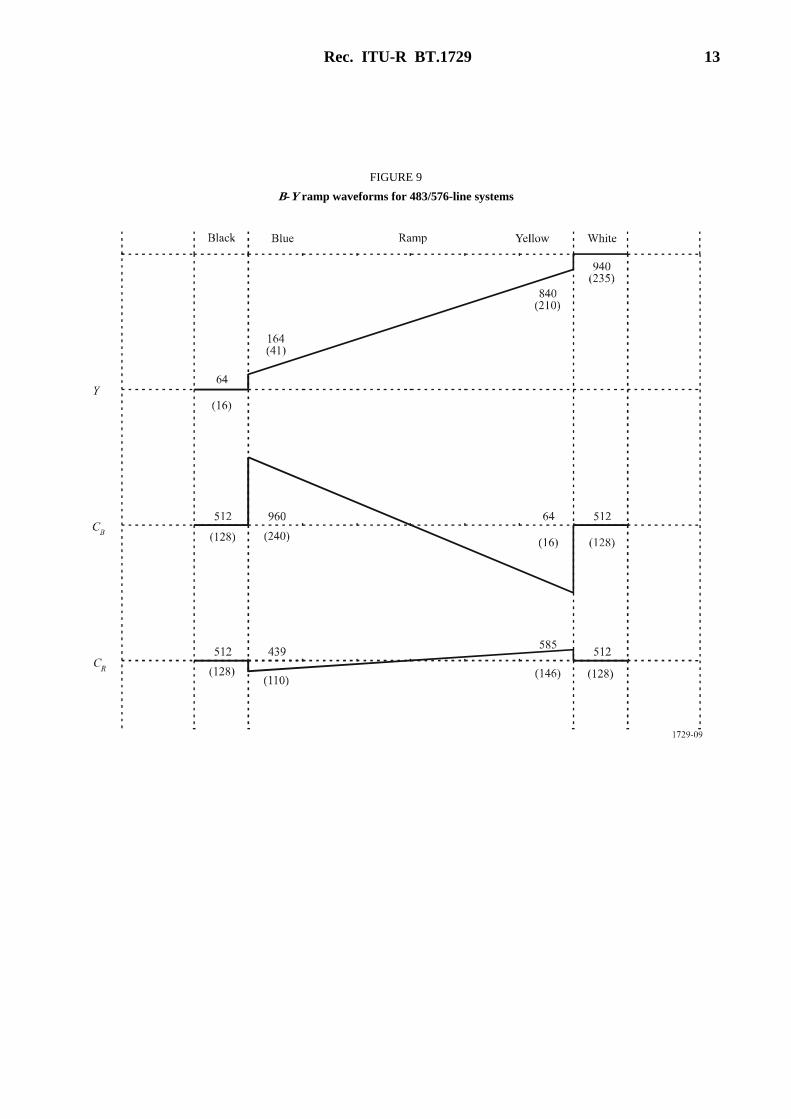
B-Y ramp waveforms
Waveforms defining the B-Y colour difference ramp are shown in Fig. 8 for the 1 080/720-line systems and in Fig. 9 for 483/576-line systems.
FIGURE 8
B-Y ramp waveforms for 1 080/720-line systems
Rec. ITU-R BT.1729 13
FIGURE 9
B-Y ramp waveforms for 483/576-line systems
14 Rec. ITU-R BT.1729
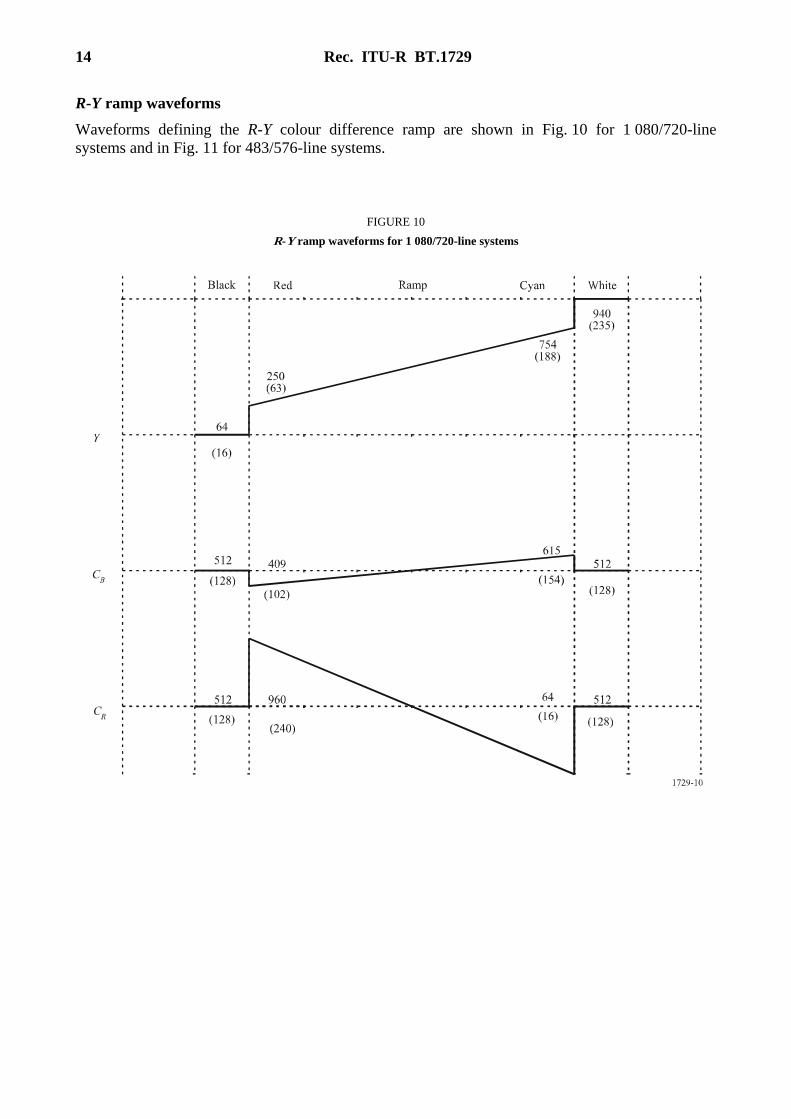
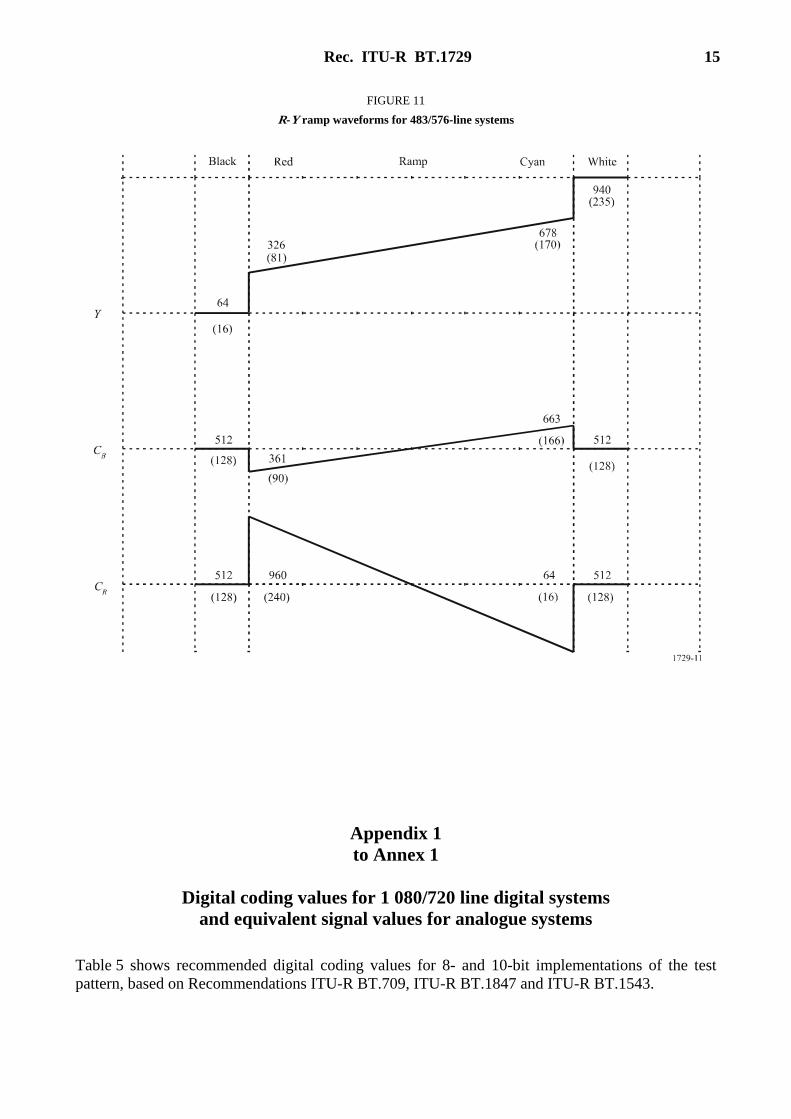
R-Y ramp waveforms
Waveforms defining the R-Y colour difference ramp are shown in Fig. 10 for 1 080/720-line systems and in Fig. 11 for 483/576-line systems.
FIGURE 10
R-Y ramp waveforms for 1 080/720-line systems
Rec. ITU-R BT.1729 15
FIGURE 11
R-Y ramp waveforms for 483/576-line systems
Appendix 1 to Annex 1
Digital coding values for 1 080/720 line digital systems
and equivalent signal values for analogue systems
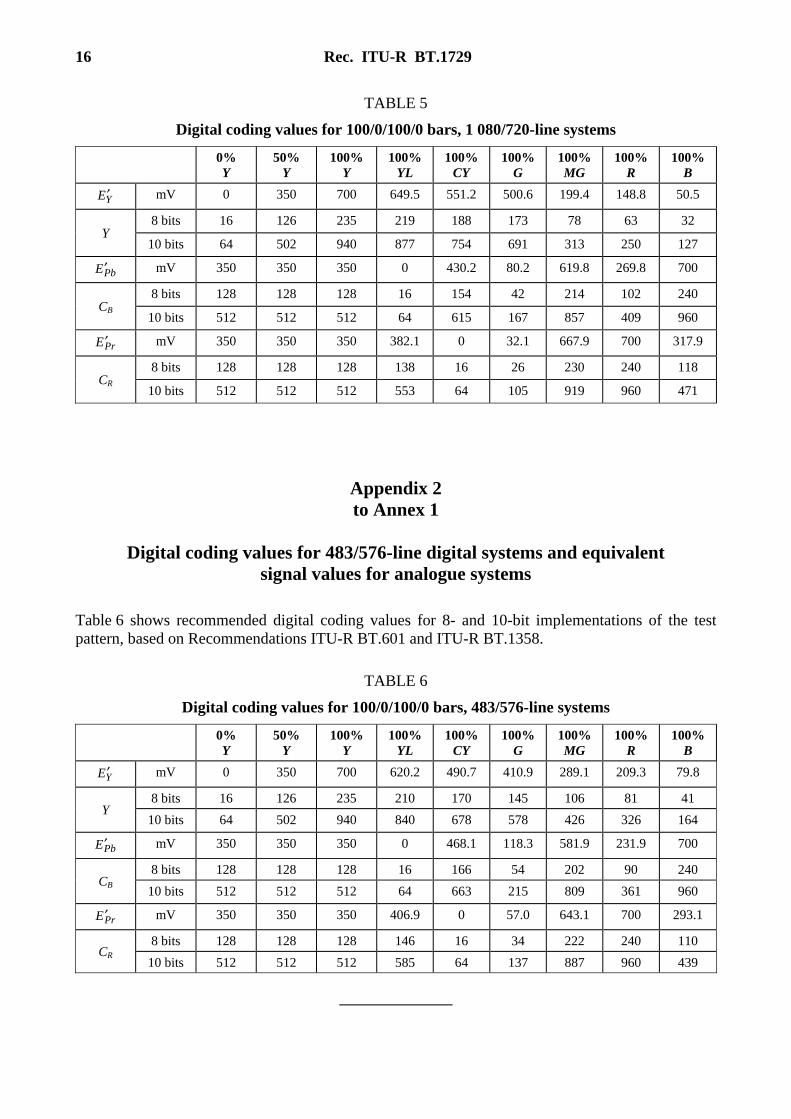
Table 5 shows recommended digital coding values for 8- and 10-bit implementations of the test pattern, based on Recommendations ITU-R BT.709, ITU-R BT.1847 and ITU-R BT.1543.
16 Rec. ITU-R BT.1729
TABLE 5
Digital coding values for 100/0/100/0 bars, 1 080/720-line systems
0% Y
50% Y
100% Y
100%YL
100%CY
100%G
100% MG
100% R
100%B
YE ′ mV 0 350 700 649.5 551.2 500.6 199.4 148.8 50.5
Y 8 bits 16 126 235 219 188 173 78 63 32
10 bits 64 502 940 877 754 691 313 250 127
PbE′ mV 350 350 350 0 430.2 80.2 619.8 269.8 700
CB 8 bits 128 128 128 16 154 42 214 102 240
10 bits 512 512 512 64 615 167 857 409 960
PrE ′ mV 350 350 350 382.1 0 32.1 667.9 700 317.9
CR 8 bits 128 128 128 138 16 26 230 240 118
10 bits 512 512 512 553 64 105 919 960 471
Appendix 2 to Annex 1
Digital coding values for 483/576-line digital systems and equivalent
signal values for analogue systems
Table 6 shows recommended digital coding values for 8- and 10-bit implementations of the test pattern, based on Recommendations ITU-R BT.601 and ITU-R BT.1358.
TABLE 6
Digital coding values for 100/0/100/0 bars, 483/576-line systems
0% Y
50% Y
100% Y
100%YL
100%CY
100%G
100% MG
100% R
100%B
YE ′ mV 0 350 700 620.2 490.7 410.9 289.1 209.3 79.8
Y 8 bits 16 126 235 210 170 145 106 81 41
10 bits 64 502 940 840 678 578 426 326 164
PbE′ mV 350 350 350 0 468.1 118.3 581.9 231.9 700
CB 8 bits 128 128 128 16 166 54 202 90 240
10 bits 512 512 512 64 663 215 809 361 960
PrE ′ mV 350 350 350 406.9 0 57.0 643.1 700 293.1
CR 8 bits 128 128 128 146 16 34 222 240 110
10 bits 512 512 512 585 64 137 887 960 439