Embed Size (px)
Citation preview

2009-10 Restaurant Commodity Outlook yWebinar
July 30, 2009
David MaloniPrincipalPrincipal
American Restaurant Association Inc.888-423-4411
www.AmericanRestaurantAssociation.comDavid.Maloni@AmericanRestaurantAssociation.com
© 2009 American Restaurant Association Inc. This presentation is protected under U.S. copyright law. Please do not redistribute without permission from American Restaurant Association Inc. Thank you. *This data and these comments are provided for information purposes only and are not intended to be used for specific trading strategies. Past financial results are not necessarily indicative of future performance. Any examples given are strictly hypothetical and no representation is being made that a person will or is likely to achieve profits or losses similar to those examples. Neither the information, nor any opinion expressed constitutes a solicitation to buy or sell futures or options on futures contracts or OTC products. Covered parties (as defined below) shall not be liable for any direct, indirect, incidental, special or p p ( ) y pconsequential damages of any kind, whatsoever (including attorney’s fees and lost profits or savings) in any way due to, resulting from, or arising in connection with this entire presentation, including it’s content, regardless of any negligence of the covered party including but not limited to technical inaccuracies and typographical errors. “Covered Parties” is defined as American Restaurant Association Inc., ARA Trading and the employees of both companies. Commodity trading involves risks, and you should fully understand those risks before trading.

C di U dCommodity Update
• Part I▫ Grain Price Inflation ▫ Grain Price Inflation
UpdateEthanol and Biodiesel
▫ Feed OutlookAcreage, supply and price projections
• Part II▫ Implications of General Grain Inflation for the
Restaurant IndustryRestaurant IndustryProtein and dairy supply and price expectations
G flGrain Inflation
h12
Annual US Grain Prices, Source NASS
• Why?▫ Inflated
crude oil▫ Limited 6
8
10
e(b
ush
el)
acreage and crop shortfalls
▫ BiofuelsUS d ll
0
2
4
Pri
ce
▫ US dollar2004 2005 2006 2007 2008
Wheat Corn Soybeans
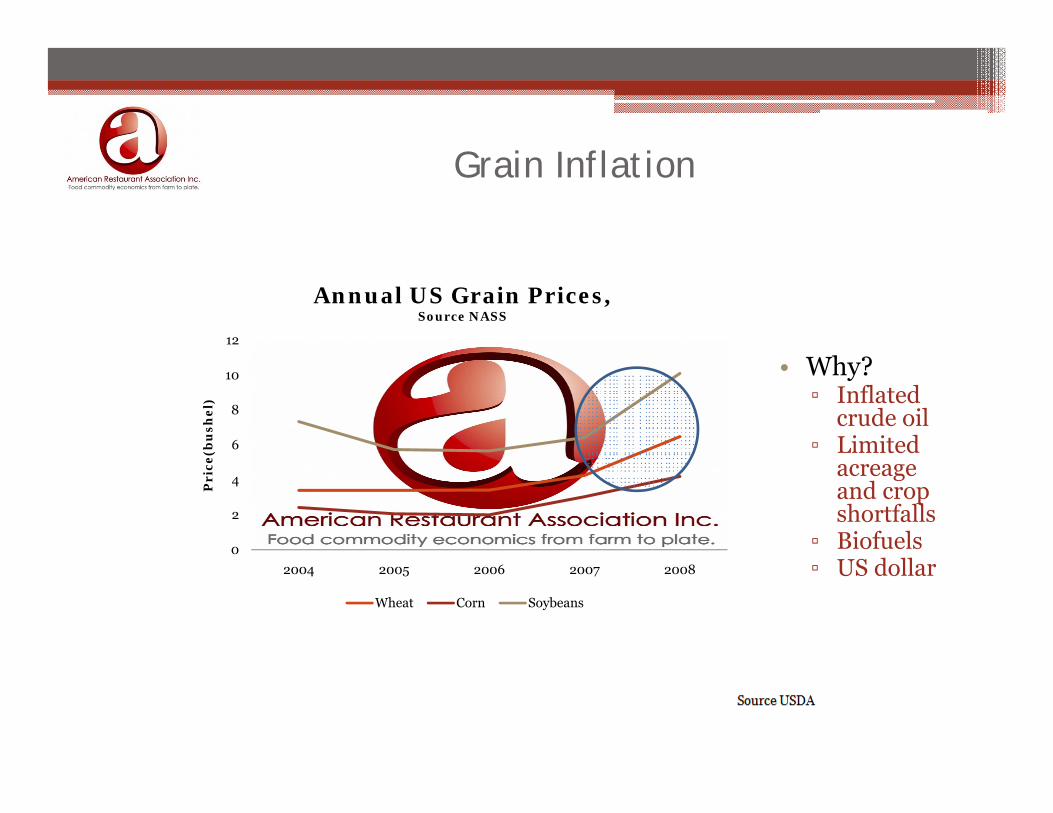
Ethanol UpdateEthanol Update▫ As of July 14th, per the Renewable
Fuels Association, ethanol capacity in , p ythe US was roughly 12.7 billion gallons per year with an additional 1.8 billion gallons per year of capacity under construction. Current ethanol capacity has more than doubled since 2005
0.600
0.800
US Ethanol Producer Profitability
has more than doubled since 2005.
▫ 12.7 billion gallon at full capacity would utilize an estimated 4.5 billion bushels of corn. The 1.8 billion gallons of capacity under construction could ‐0.200
0.000
0.200
0.400
$ pe
r gallo
n
Ethanolprofitability in notable trouble
p yutilize an additional 630 million bushels of corn.
▫ Is ethanol profitable? Margins have greatly improved as of late. Hedge
i i d DDG l h lik l
‐0.600
‐0.400
positions and DDG sales have likely caused profitability to be better than the model suggests. Crude, corn and natural gas prices will impact margins going forward.
Source ARA
g g

Economic IncentiveEconomic Incentive▫ Roughly 5.5 billion gallons are mandated
to be blended per the Clean Air Act .
▫ The rest is driven by economics…does it make more money to blend gasoline with ethanol?
▫ Roughly 20% of the ethanol capacity in the US is reported to be idled.
Economic Incentive to Blend Gasoline with Ethanol
▫ Gasoline blenders trading Renewable Identification Numbers (RIN’s) to get around the 10.5 billion gallon mandate in 2009 and 12 billion gallon mandate in 2010. Ethanol imports will help as well.
0 000
0.500
1.000
1.500
2.000
ollars per gallon
▫ Ag Secretary Vilsack is in favor of increasing the blend percentage of ethanol in gasoline. This needs to be monitored. Decision is made by the EPA.
▫ Current USDA forecast is for 3.65 billion
‐0.500
0.000
11/2/06
1/2/07
3/2/07
5/2/07
7/2/07
9/2/07
11/2/07
1/2/08
3/2/08
5/2/08
7/2/08
9/2/08
11/2/08
1/2/09
3/2/09
5/2/09
7/2/09
Do
bushels of use from the 2008/09 crop. 4.1 billion forecasted for 2009/10.
Source ARA
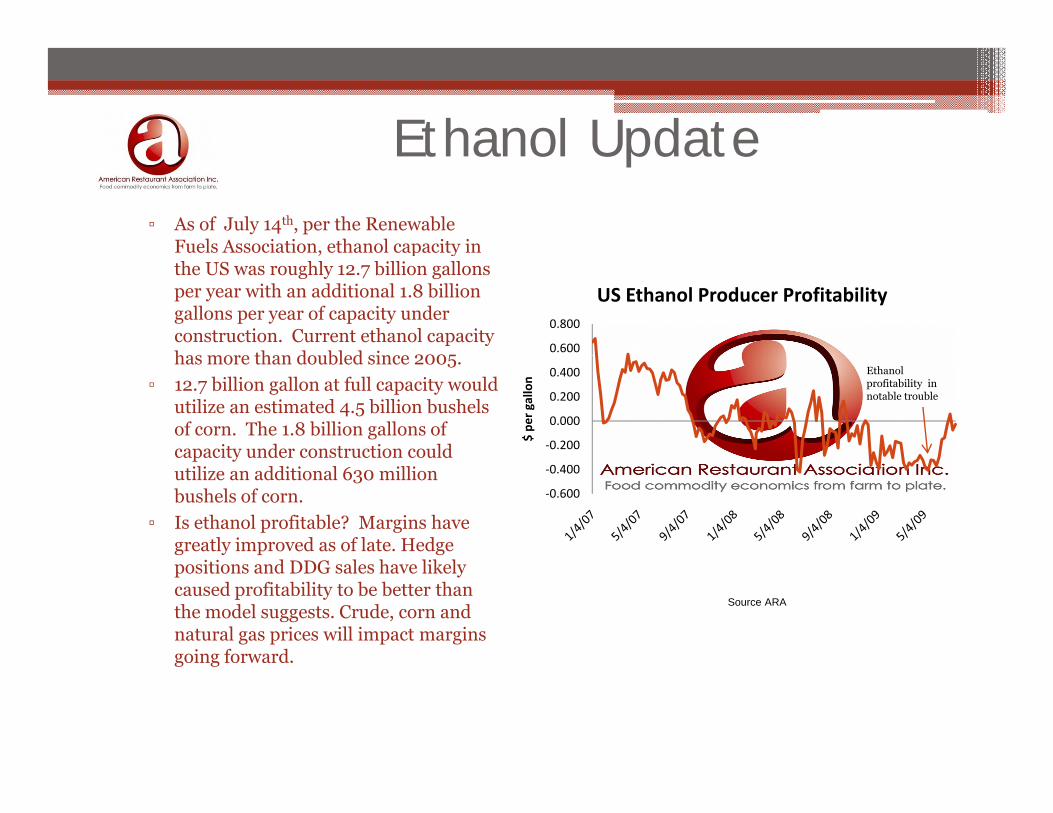
fl d lInflated Grain Price Implications• Total acreage for corn, soybean and wheat was a
record high for the 2008/09 crop and will remain elevated for 2009-10▫ However coming at the expense of other crops including vegetables dry beans etcHowever, coming at the expense of other crops including vegetables, dry beans, etc.
▫ Therefore, food inflation occurring in items including canned tomatoes, iceberg lettuce, and potatoes
California Tomato For Processing Contracted Price
70
80
90
Ton
Market has risen 64% in the last 3 years
30
40
50
60
70
Dollars Per
Sources: USDA, ARA
2006 2007 2008 2009

Wh O l kWheat Outlook/ ill i b i i t k 66 illi b h l• 2009/10 will experience beginning stocks - 669 million bushels
• Watch world production totals, exports and the US dollar• 2009 Dark Northern Spring wheat prices forecasted to average 30% below
2008 but still be 10% higher than the 5 year average 2008 but still be 10% higher than the 5 year average. ▫ 2009 dark northern spring wheat forecasted at $6.96, $10.44 in 2008, prior 3 year average of $5.10
▫ 2010 dark northern spring wheat forecasted at $7.36
30
Wheat Ending Stocks (May 31) as a Percent of Total Use
5
10
15
20
25
0
Hard Red
Hard Spring
Soft Red White Duram Total
2008/09 10 Year Avg 2009/10
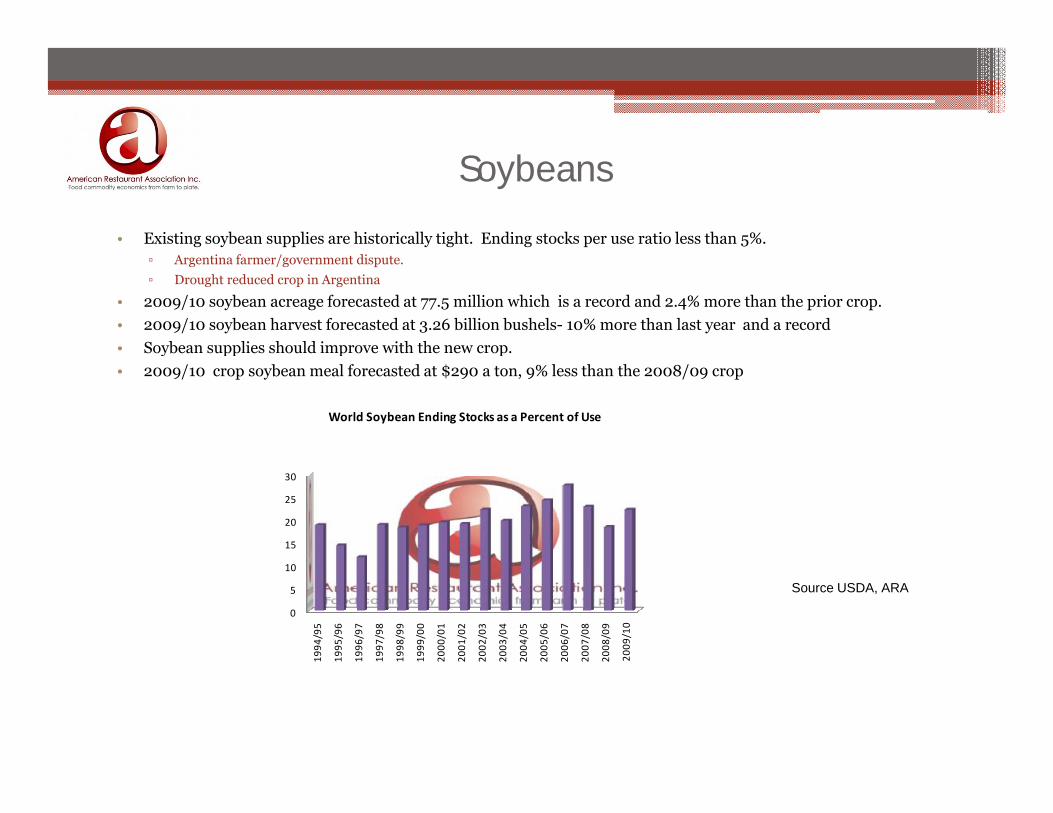
Soybeans
• Existing soybean supplies are historically tight. Ending stocks per use ratio less than 5%.▫ Argentina farmer/government dispute.
▫ Drought reduced crop in Argentina
• 2009/10 soybean acreage forecasted at 77.5 million which is a record and 2.4% more than the prior crop.
• 2009/10 soybean harvest forecasted at 3.26 billion bushels- 10% more than last year and a record
• Soybean supplies should improve with the new crop.y pp p p
• 2009/10 crop soybean meal forecasted at $290 a ton, 9% less than the 2008/09 crop
World Soybean Ending Stocks as a Percent of Use
15
20
25
30
Source USDA, ARA
0
5
10
1994
/95
1995
/96
1996
/97
1997
/98
1998
/99
1999
/00
2000
/01
2001
/02
2002
/03
2003
/04
2004
/05
2005
/06
2006
/07
2007
/08
2008
/09
2009
/10

Corn• Existing corn supplies are adequate.
• 2009/10 corn acreage forecasted at 86 million, virtually even with last year.9/ g , y y
• 2009/10 harvest forecasted at 12.3 billion bushels, 2% more than the current crop.
• Stocks should be adequate with the new crop.
• Ethanol use may gain steam
• Corn price forecasted at $3.65 a bushel, 8% less than the current crop
15000000
US Corn Harvest, Source NASS
7000000
9000000
11000000
13000000
15000000
1000
Acres
Source USDA, ARA5000000
7000000

Structural Shift
US Annual Average Farm Corn Price, Source USDA
3 5
4
4.5
US Annual Average Farm Corn Price, Source USDA
Ethanol
2
2.5
3
3.5
rice(
bush
el)
33 years
0
0.5
1
1.5Pr
34 years
29 yearsWorld War II Exports open to Asia
0
1908
1913
1918
1923
1928
1933
1938
1943
1948
1953
1958
1963
1968
1973
1978
1983
1988
1993
1998
2003
2008
e

F d O l kFeed OutlookCrude Oil, Corn, Wheat and Soybean Meal
1000
1200
150
170
he
l)
600
800
90
110
130
d D
oll
ars
(B
ush
lla
rs(B
arr
el)
0
200
400
30
50
70
Hu
nd
red
Do
l
3
Crude Oil Corn Soybean Meal Minn Wheat
Part II
• Implications of General Food Inflation for the Restaurant IndustryRestaurant Industry▫ Biggest Spends
Beef, Chicken, Dairy and Pork ee , C c e , a y a d o ▫ Feed prices pressure protein and dairy prices.
Output slowdowns occurringHigher protein and dairy prices coming?
• Attributes of successful supply chain operators.

Feed OutlookEstimated Cost to Produce One Pound of Chicken
0.3
0.35
0.2
0.25
Corn
oll
ars
0 05
0.1
0.15
Soybean Meal
Do
0
0.05 y
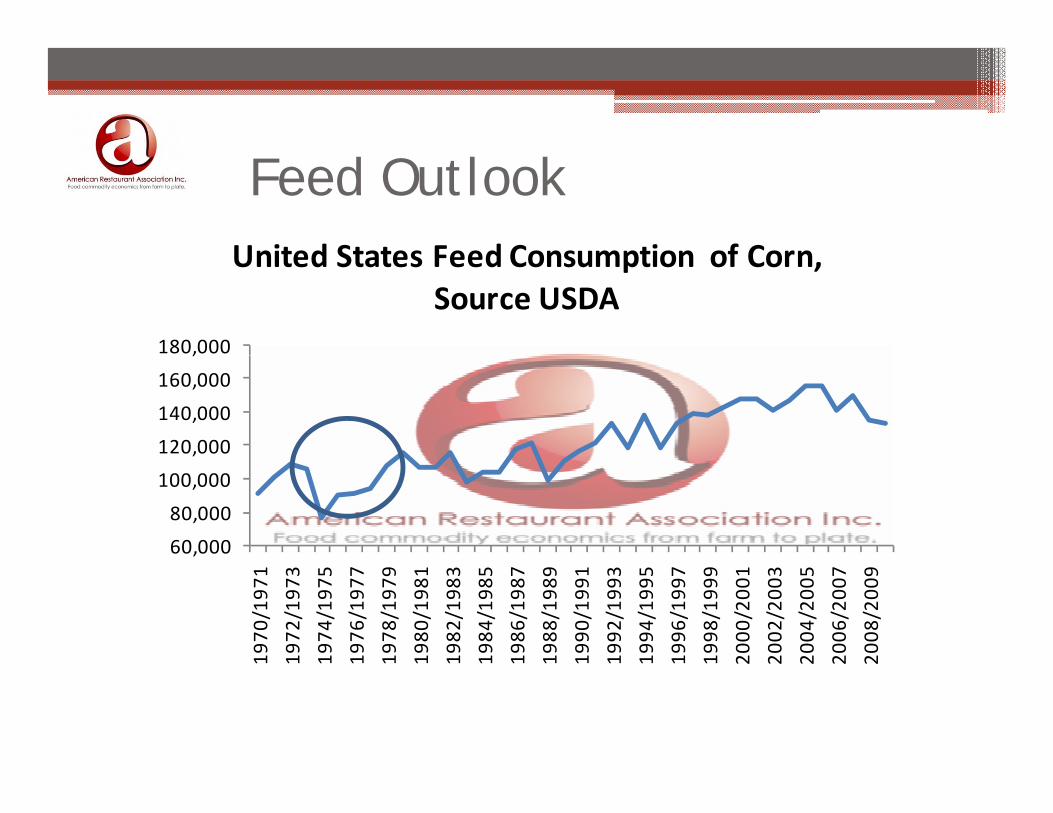
Feed OutlookUnited States Feed Consumption of Corn
180,000
United States Feed Consumption of Corn, Source USDA
120,000
140,000
160,000
,
60,000
80,000
100,000
1970
/197
1
1972
/197
3
1974
/197
5
1976
/197
7
1978
/197
9
1980
/198
1
1982
/198
3
1984
/198
5
1986
/198
7
1988
/198
9
1990
/199
1
1992
/199
3
1994
/199
5
1996
/199
7
1998
/199
9
2000
/200
1
2002
/200
3
2004
/200
5
2006
/200
7
2008
/200
9
1 1 1 1 1 1 1 1 1 1 1 1 1 1 1 2 2 2 2 2

Protein and Dairy Production The Protein and Dairy Production—The Tipping Point
• In the spring and summer of 2008 there were signals that the chicken, hog, cattle and dairy industries had all accelerated plans to curb future supplies due to declining margins. Those signals have continued and output cutbacks are underway.
• Chicken ▫ The 6 week moving average for broiler egg sets as of the middle of July was 4% less than a year ago and the lowest for The 6 week moving average for broiler egg sets as of the middle of July was 4% less than a year ago and the lowest for
the date in 5 years.Broiler eggs are set roughly 10 weeks before being sent to slaughter for chicken output and are a solid indicator of coming chicken production plans.Hatcher flock forecasted to be 6% smaller by December
• Hogs▫ Sow slaughter was strong last year but then waned. Signs are that sow slaughter is picking up.g g y g g p g p
Sow prices have declined 30% in recent weeks.Sows are adult female pigs and a good indicator of the size of the breeding herd.
• Cattle ▫ The July 1st US cattle and calf inventory was 1.5% less than a year ago. The July 1st calf inventory was 1.4% smaller than
last year. Cattle herd is typically building at this point but expansion has been cut short in part by higher feed costs.yp y g p p p y g
• Dairy▫ Milk cow slaughter last year trended well above prior year levels. Milk cow slaughter has been strong lately. Milk per
cow yield growth has been below average.A reduction in the milk cow herd will lessen the production of milk.Milk per cow yields typically grow at an annual rate of 1.5%. When margins suffer, farmers have a tendency to cut back on feed which can lessen milk per cow yields. Milk per cow yield growth so far this year has been around .5%.

Protein Output Expectations
2000
Change in Various Protein Production
0
500
1000
1500
Poun
ds Pork
B f
1500
‐1000
‐500
0
Million P Beef
Chicken
‐2000
‐1500SourceUSDA Baseline Stats and ARA
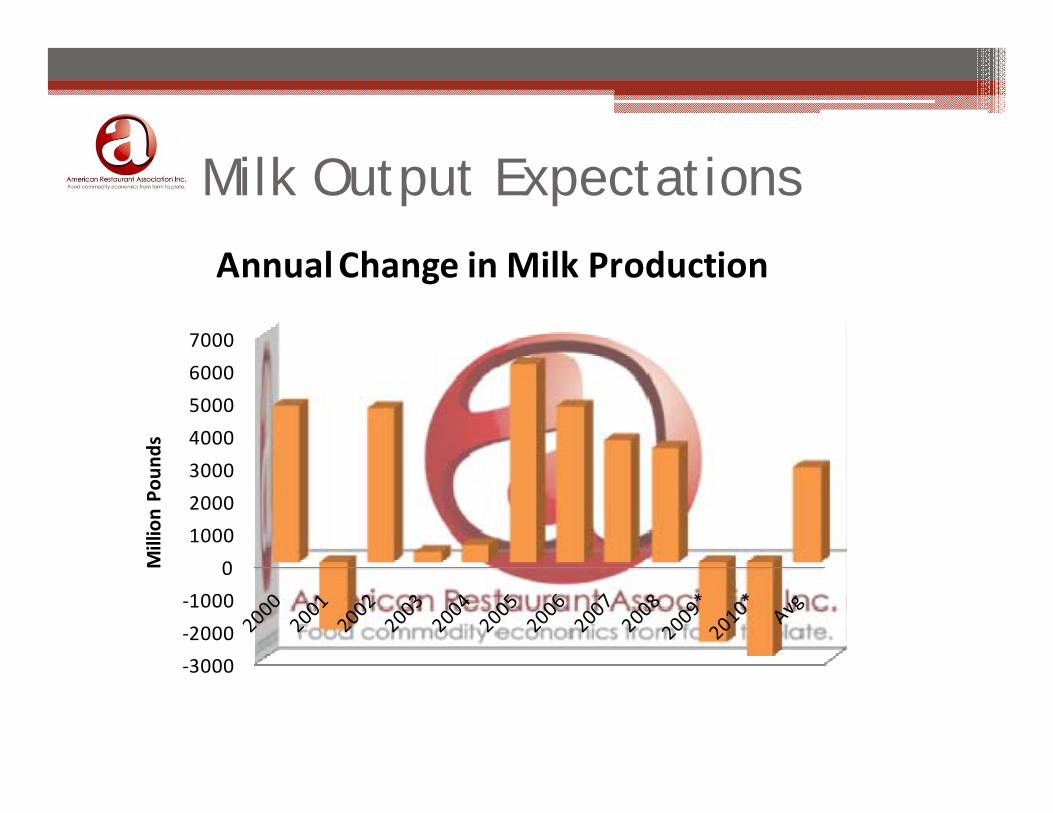
Milk Output Expectations
A lCh i Milk P d i
7000
Annual Change in Milk Production
4000
5000
6000
nds
1000
2000
3000
Million Po
un
3000
‐2000
‐1000
0M
‐3000

Is there Room for Food Inflation?
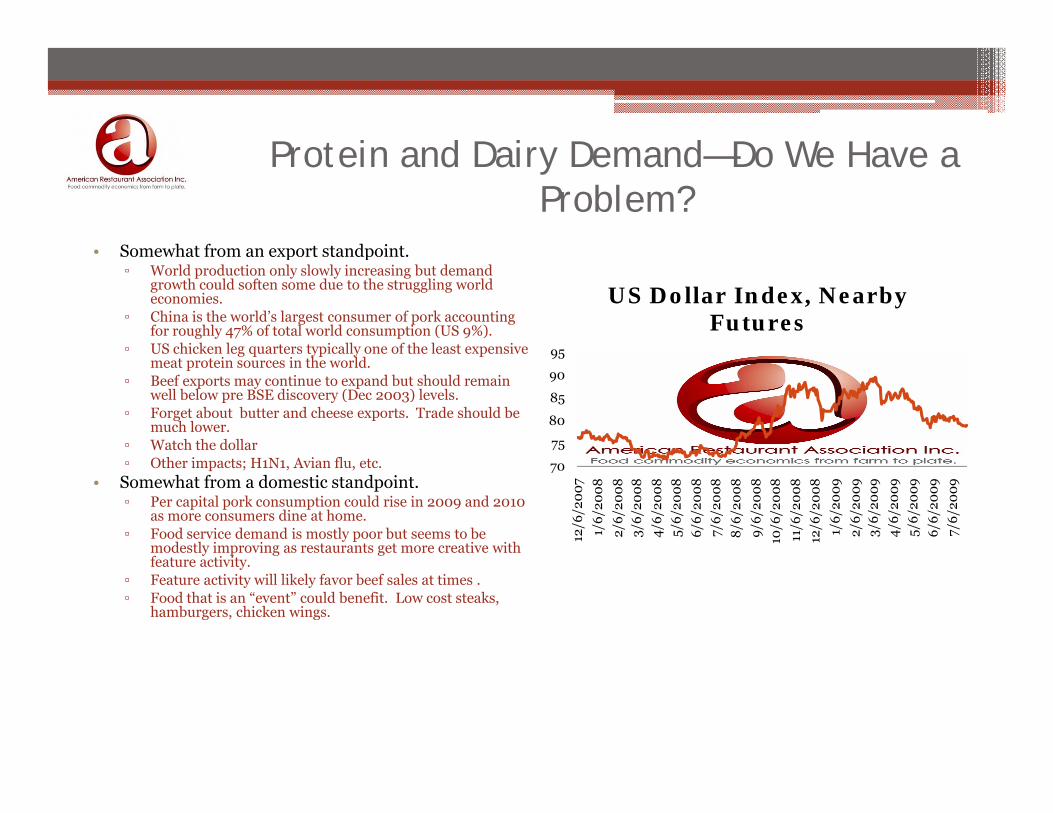
Protein and Dairy Demand Do We Have a Protein and Dairy Demand—Do We Have a Problem?
• Somewhat from an export standpoint • Somewhat from an export standpoint. ▫ World production only slowly increasing but demand
growth could soften some due to the struggling world economies.
▫ China is the world’s largest consumer of pork accounting for roughly 47% of total world consumption (US 9%).
▫ US chicken leg quarters typically one of the least expensive 95
US Dollar Index, Nearby Futures
g q yp y pmeat protein sources in the world.
▫ Beef exports may continue to expand but should remain well below pre BSE discovery (Dec 2003) levels.
▫ Forget about butter and cheese exports. Trade should be much lower.
▫ Watch the dollar O h i H N A i fl
75
80
85
90
95
▫ Other impacts; H1N1, Avian flu, etc. • Somewhat from a domestic standpoint.
▫ Per capital pork consumption could rise in 2009 and 2010 as more consumers dine at home.
▫ Food service demand is mostly poor but seems to be modestly improving as restaurants get more creative with feature activity
70
12/6
/20
07
1/6
/20
08
2/6/
200
8
3/6
/20
08
4/6
/20
08
5/6
/20
08
6/6
/20
08
7/6
/20
08
8/6
/20
08
9/6
/20
08
10/6
/20
08
11/6
/20
08
12/6
/20
08
1/6
/20
09
2/6/
200
93/
6/2
00
9
4/6
/20
09
5/6
/20
09
6/6
/20
09
7/6
/20
09
feature activity.▫ Feature activity will likely favor beef sales at times . ▫ Food that is an “event” could benefit. Low cost steaks,
hamburgers, chicken wings.

Protein and Dairy Wholesale Price Protein and Dairy Wholesale Price Expectations
• Market appreciation/depreciation will likely be mixed. • Chicken
▫ Key restaurant items such has boneless skinless chicken breast (8-15%) and wings (10-25%) could average higher than 2008 levels depending on production cutbacks and demand 2010 is expected to see 5-10% higher than 2008 levels depending on production cutbacks and demand. 2010 is expected to see 5 10% increases in chicken breast prices. Wing prices to remain at similar levels.
• Pork▫ Overall pork prices could be modestly lower (0-5%) if exports continue to suffer. 2010 could experience
significant pork market inflation for bellies and ribs due to production cutbacks.▫ Sows prices may remain deflated so long as deferred hog futures remain deflated.
f• Beef▫ Beef prices could be similar to less (0-5%) in 2009 compared to 2008 depending on demand. Watch the
dollar regarding grinds and trimmings. Middle meats watch overall choice production. Beef prices expected to be modestly higher in 2010 depending in a large part to the dollar and the economy.
• Dairy▫ Milk cheese and butter prices are expected to average substantially below (15-25%) 2008 levels due to notable Milk, cheese and butter prices are expected to average substantially below (15 25%) 2008 levels due to notable
deflation in the international dairy markets. Look for 15-30% higher prices in 2010 however.• Temporary Inflation?
▫ It is my belief that we have entered into a structural upward shift in food prices which started with grain. If the economy stabilizes or improves, look for higher prices, perhaps across the board, in 2010.If the economy worsens then all bets are off
h d l d ll d f dWatch crude oil, dollar and feed costs.
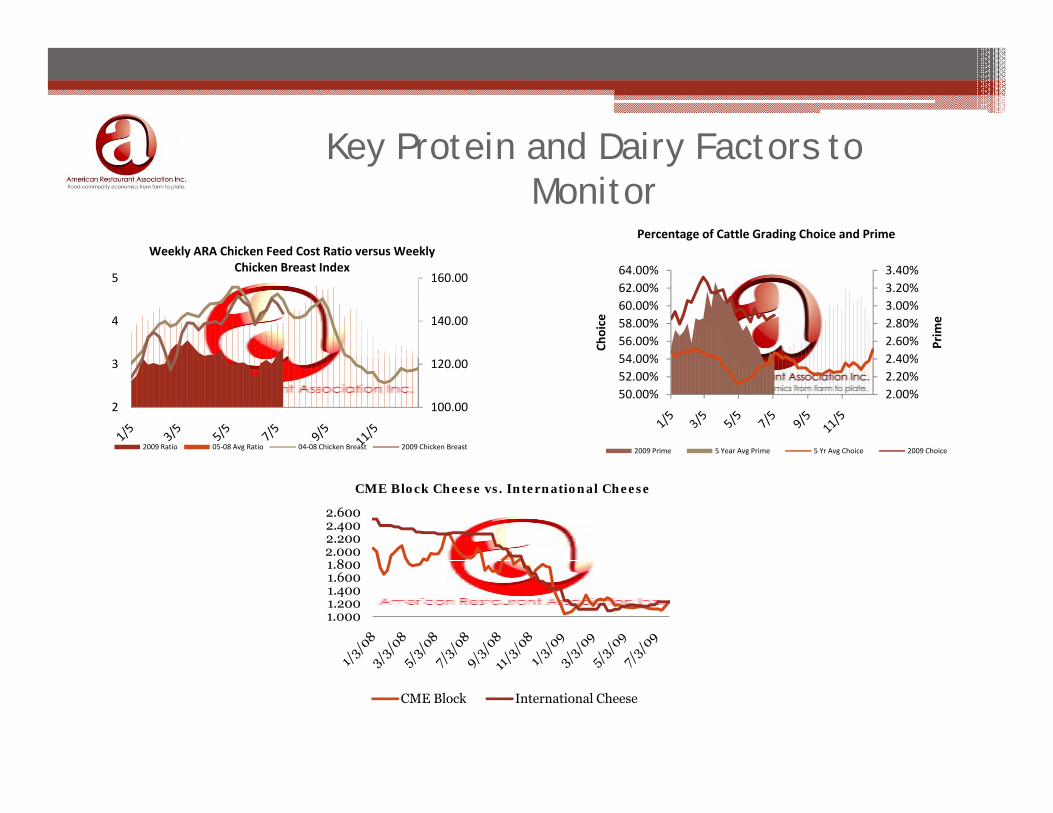
Key Protein and Dairy Factors to Key Protein and Dairy Factors to Monitor
Percentage of Cattle Grading Choice and PrimeWeekly ARA Chicken Feed Cost Ratio versus Weekly
2 40%2.60%2.80%3.00%3.20%3.40%
54 00%56.00%58.00%60.00%62.00%64.00%
Prim
e
Choice140.00
160.00
4
5
Weekly ARA Chicken Feed Cost Ratio versus Weekly Chicken Breast Index
2.00%2.20%2.40%
50.00%52.00%54.00%
2009 Prime 5 Year Avg Prime 5 Yr Avg Choice 2009 Choice
100.00
120.00
2
3
2009 Ratio 05‐08 Avg Ratio 04‐08 Chicken Breast 2009 Chicken Breast
82.0002.2002.4002.600
CME Block Cheese vs. International Cheese
1.0001.2001.4001.6001.800
CME Block International Cheese
Contracting
• What’s a restaurant chain to do?▫ Contracting Tools
Spot- day to dayCash Forward- locked in contractD i ti f t ti t ' Derivatives- futures, options, o.t.c.'s
▫ SuggestionsUse the market to dictate contracting not the fiscal budget.Manage risk do not just try to beat the market or last yearManage risk, do not just try to beat the market or last year.Use all of the tools available and get educated
You can hedge cheese, beef products, pork products, energies, fuel surcharge risk, grains and soybean oilT l il bl t th id d l t ti i t i Tools are available to cap the upside and let you participate in the downside. Work through your suppliers when possible.

SSummary
• Several factors expected to cause relatively elevated grain/feed prices to persist▫ Rising world demand▫ US biofuel policy▫ US dollar
• Implications of higher grain prices for the restaurant industryImplications of higher grain prices for the restaurant industry▫ Biggest Spends
Beef, Chicken, Dairy and Pork- tipping point for the protein industries is upon us. Beef, pork and chicken production all forecasted to decline in 2009
Milk production to decline as wellMilk production to decline as well
▫ Slowed demand could temper any increases or cause decreases with some products.▫ 2010 and beyond could be much different.▫ Watch crude oil, ethanol, feed and the value of the US dollar.

Thank YouDavid Maloni is the Principal and Chief Commodity Analyst for
American Restaurant Association Inc., a food commodity research, , y ,consulting and risk management organization founded in 1996 specifically directly to the US food service industry supply chain. His proficiency is directed to the protein, dairy, grain and biofuels markets and their impacts on the US food service industry especially in relation to restaurant and hotel buying. David is also a nationally distinguished food commodity market analyst a nationally distinguished food commodity market analyst, consultant and author with his expertise featured in The Weekly Commodity Report, The Food Commodity Outlook Report as well as several news sources and publications. David is a series 3 licensed commodity trader and the Principal and founder of ARA Trading Inc., a commodity brokerage directed to the US food service industry to assist clients in managing food commodity service industry to assist clients in managing food commodity market and contracting risk.
© 2009 American Restaurant Association Inc. This presentation is protected under U.S. copyright law. Please do not redistribute without permission from American Restaurant Association Inc. Thank you. *This data and these comments are provided for information purposes only and are not intended to be used for specific trading strategies. Past financial results are not necessarily indicative of future p p y p g g yperformance. Any examples given are strictly hypothetical and no representation is being made that a person will or is likely to achieve profits or losses similar to those examples. Neither the information, nor any opinion expressed constitutes a solicitation to buy or sell futures or options on futures contracts or OTC products. Covered parties (as defined below) shall not be liable for any direct, indirect, incidental, special or consequential damages of any kind, whatsoever (including attorney’s fees and lost profits or savings) in any way due to, resulting from, or arising in connection with this entire presentation, including it’s content, regardless of any negligence of the covered party including but not limited to technical inaccuracies and typographical errors. “Covered Parties” is defined as American Restaurant Association Inc., ARA Trading and the employees of both companies. Commodity trading involves risks, and you should fully understand those risks before trading.


![Working of Stock Exchanges 633 786[1] 982](https://img.pdfslide.us/doc/110x75/577d35841a28ab3a6b90a8f5/working-of-stock-exchanges-633-7861-982.jpg)