Embed Size (px)
Citation preview
Commodity Markets
Chap. 3, 4
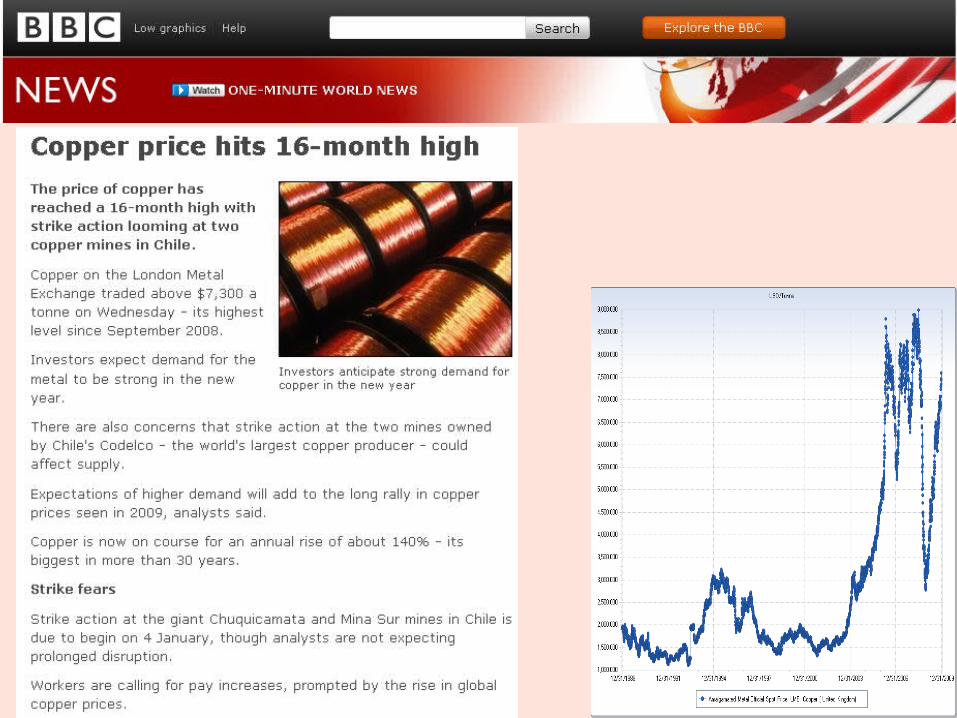
OilPrices
Link
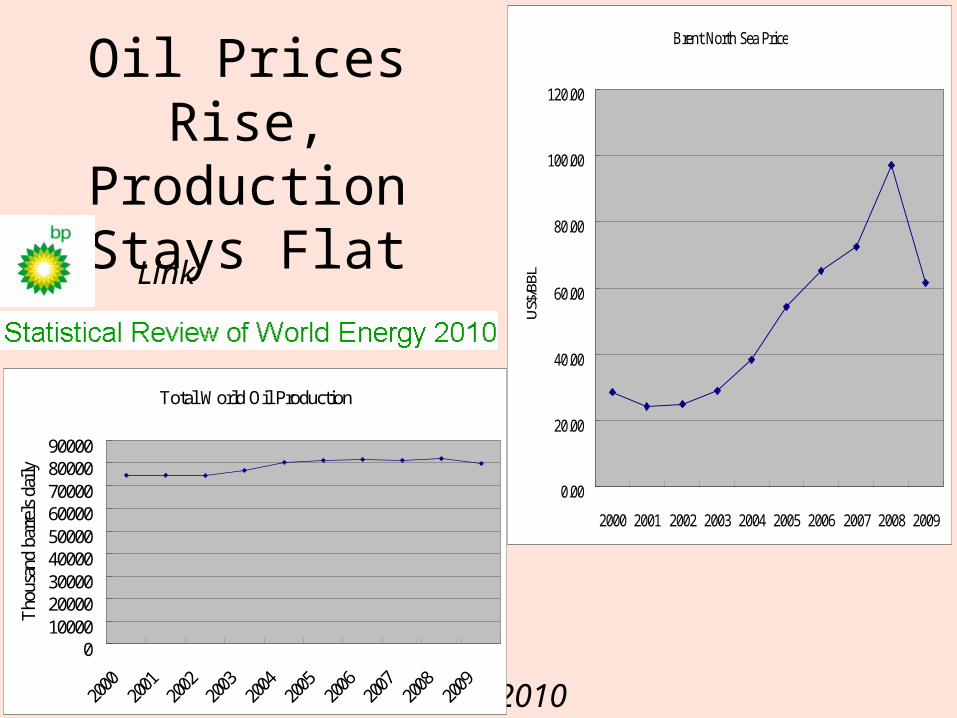
Oil Prices Rise, Production Stays
Flat
BP Statistical Review 2010
Total World Oil Production
0100002000030000400005000060000700008000090000
2000
2001
2002
2003
2004
2005
2006
2007
2008
2009
Tho
usan
d ba
rrel
s da
ilyBrent North Sea Price
0.00
20.00
40.00
60.00
80.00
100.00
120.00
2000 2001 2002 2003 2004 2005 2006 2007 2008 2009US
$/BB
LLink
Why are commodity prices so volatile?
• Prices are shifted by changes in supply and demand.
• The less price sensitive are supply and demand, the more volatile prices will be.
What determines price elasticity? Availability of Substitutes
• A price increase will lead to a shift away from the use of a product and toward other products.– Price elasticity will be stronger if there are readily
available substitutes for a good.
• A price increase for one good reduce income available for purchases for all goods– Price elasticity will be stronger if a good makes up a
big chunk of income.
World Bank Tobacco Download
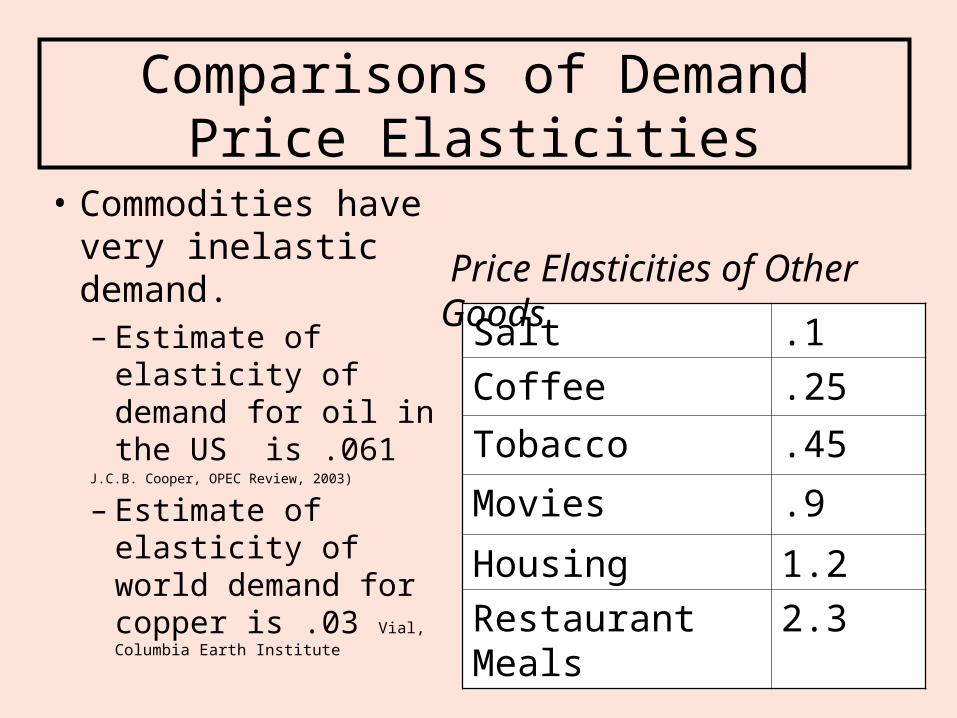
Comparisons of Demand Price Elasticities
• Commodities have very inelastic demand. – Estimate of elasticity
of demand for oil in the US is .061
J.C.B. Cooper, OPEC Review, 2003)
– Estimate of elasticity of world demand for copper is .03 Vial, Columbia
Earth Institute
Salt .1
Coffee .25
Tobacco .45
Movies .9
Housing 1.2
Restaurant Meals 2.3
Price Elasticities of Other Goods
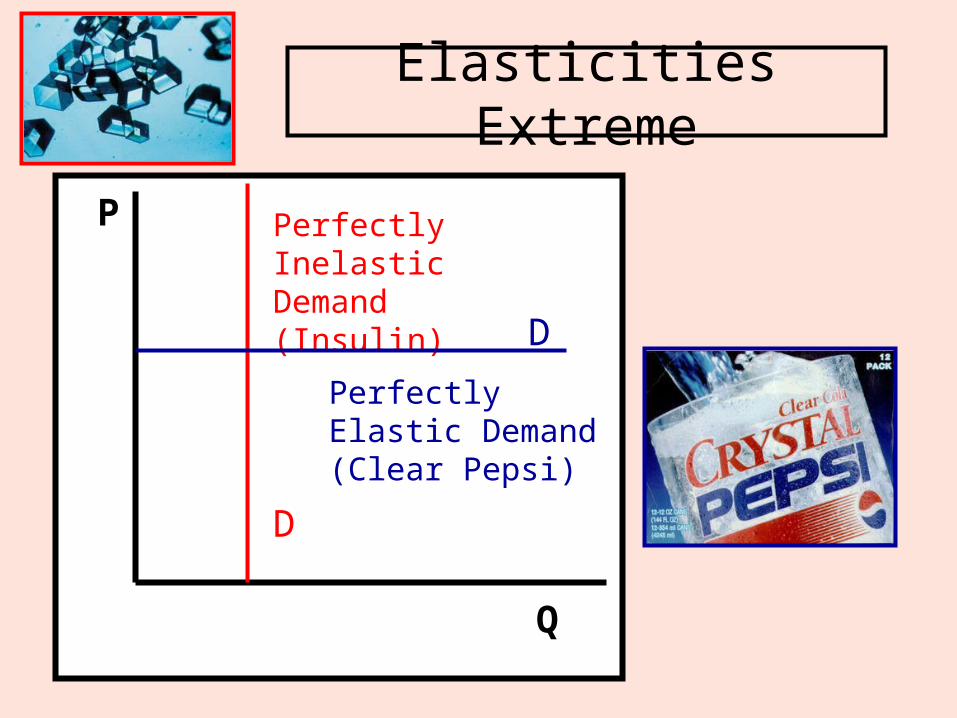
Elasticities Extreme
Perfectly Inelastic Demand (Insulin)
Perfectly Elastic Demand (Clear Pepsi)
P
Q
D
D
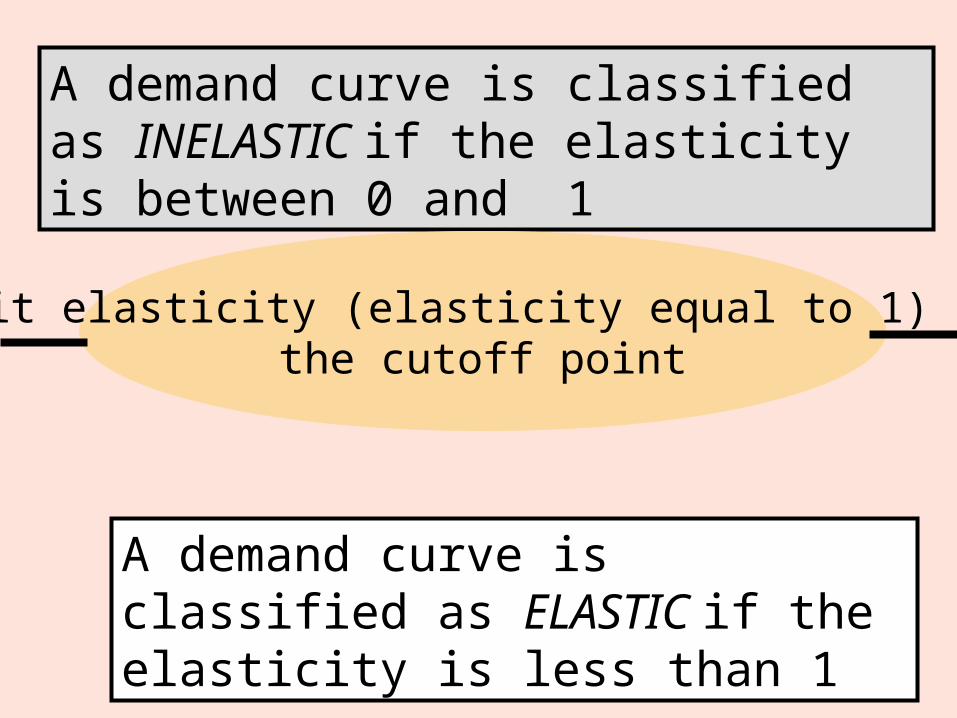
A demand curve is classified as INELASTIC if the elasticity is between 0 and 1
A demand curve is classified as ELASTIC if the elasticity is less than 1
Unit elasticity (elasticity equal to 1) is the cutoff point
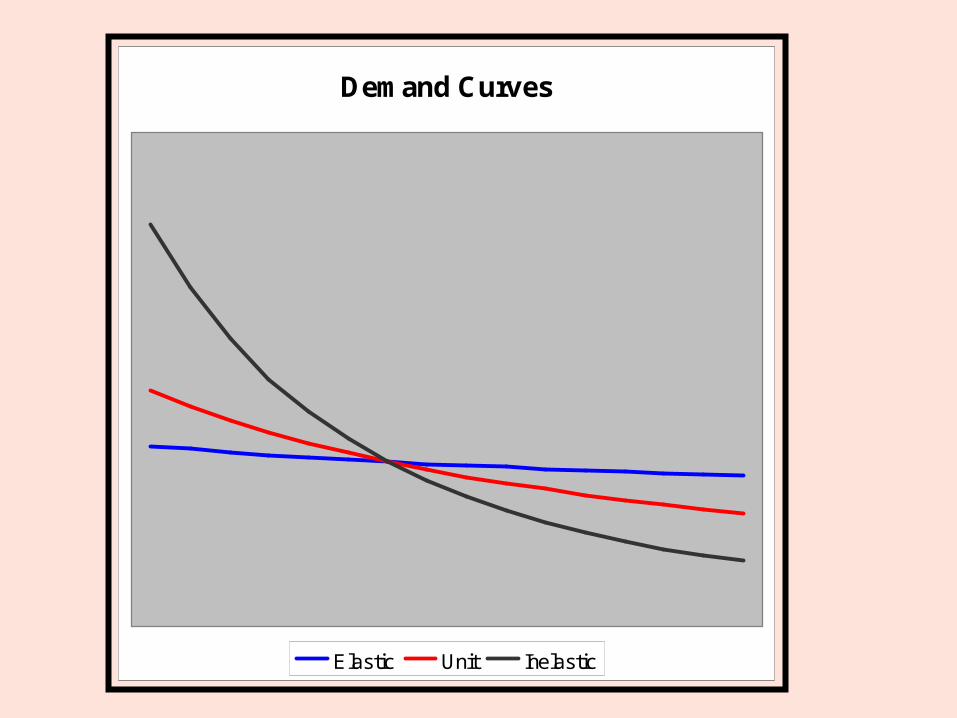
Demand Curves
Elastic Unit Inelastic
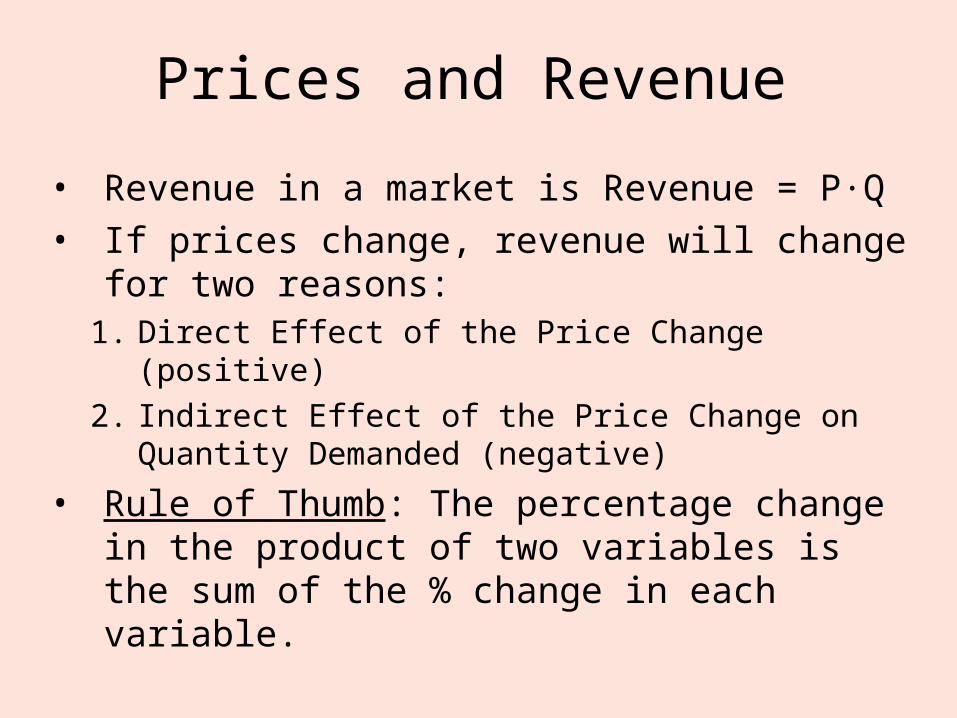
Prices and Revenue
• Revenue in a market is Revenue = P∙Q
• If prices change, revenue will change for two reasons:
1. Direct Effect of the Price Change (positive)
2. Indirect Effect of the Price Change on Quantity Demanded (negative)
• Rule of Thumb: The percentage change in the product of two variables is the sum of the % change in each variable.
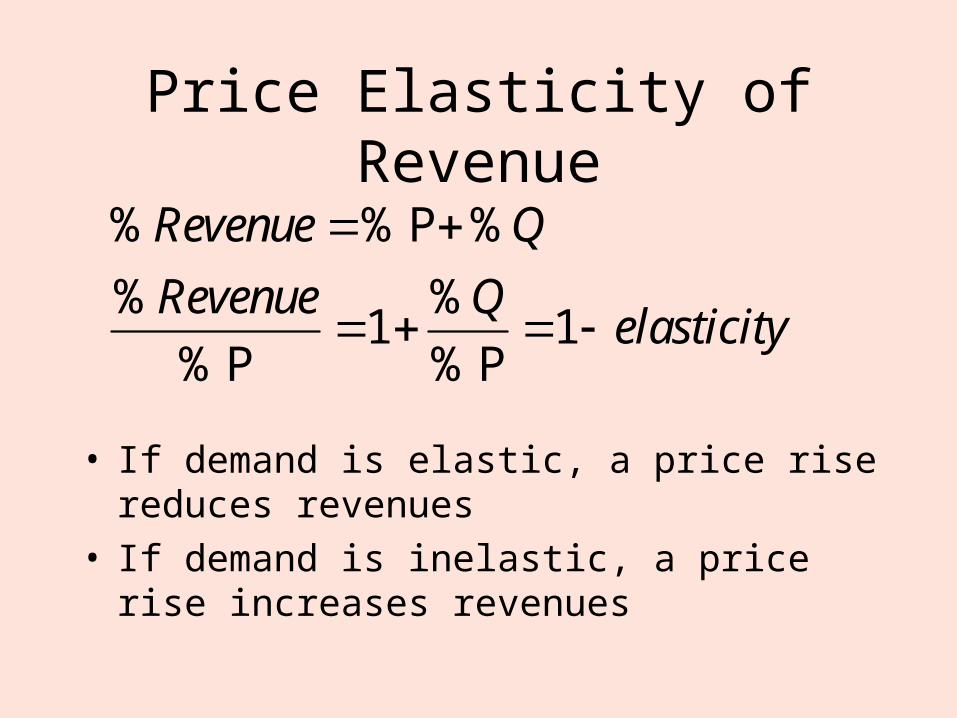
Price Elasticity of Revenue
% % P %
% %1 1
% P % P
Revenue Q
Revenue Qelasticity
• If demand is elastic, a price rise reduces revenues• If demand is inelastic, a price rise increases revenues
Elasticity of Supply
• Elasticity of supply curve depends on the ability of production sector to ramp up supply without increasing the marginal cost of production.
• A good that is produced with readily available factors w/o a need for time consuming investment will have an elastic supply curve.

Elasticities: Supply
Perfectly Inelastic Supply
(Van Gogh Paintings)
Perfectly Elastic Supply (Foot Massage)
P
Q
S
S
Price Elasticity and Time
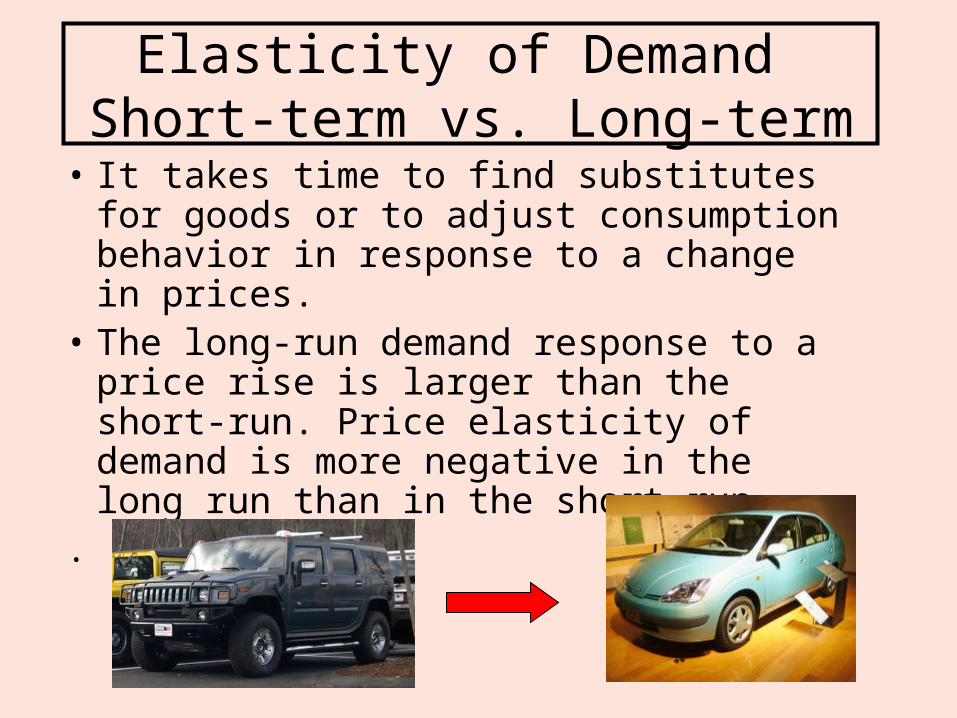
Elasticity of Demand Short-term vs. Long-term
• It takes time to find substitutes for goods or to adjust consumption behavior in response to a change in prices.
• The long-run demand response to a price rise is larger than the short-run. Price elasticity of demand is more negative in the long run than in the short run.
.
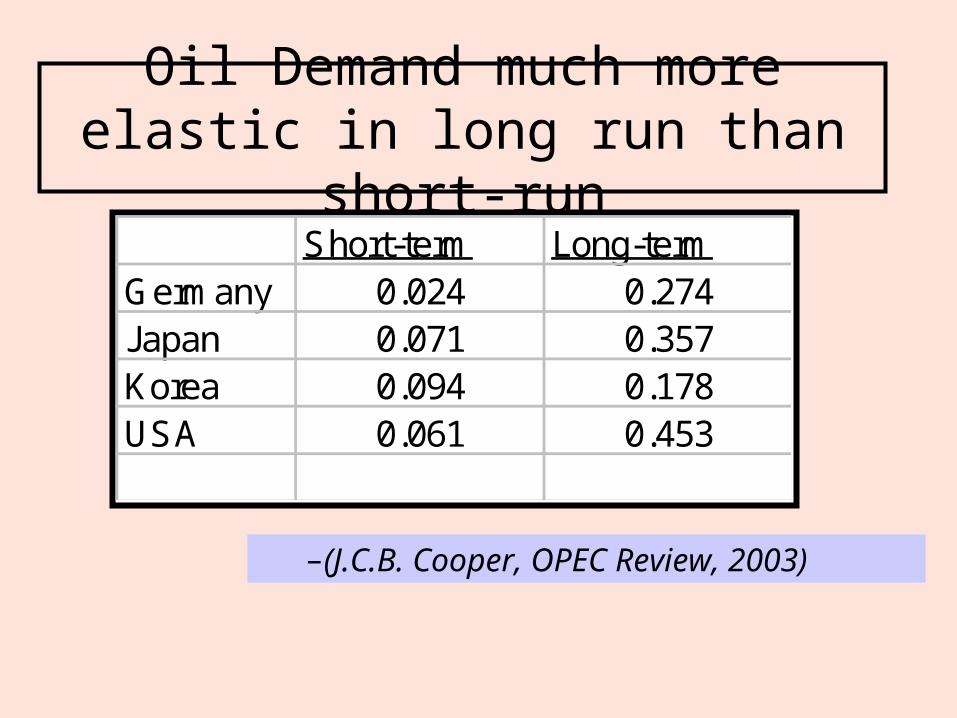
Oil Demand much more elastic in long run than short-run
Short-term Long-termGermany 0.024 0.274Japan 0.071 0.357Korea 0.094 0.178USA 0.061 0.453
–(J.C.B. Cooper, OPEC Review, 2003)
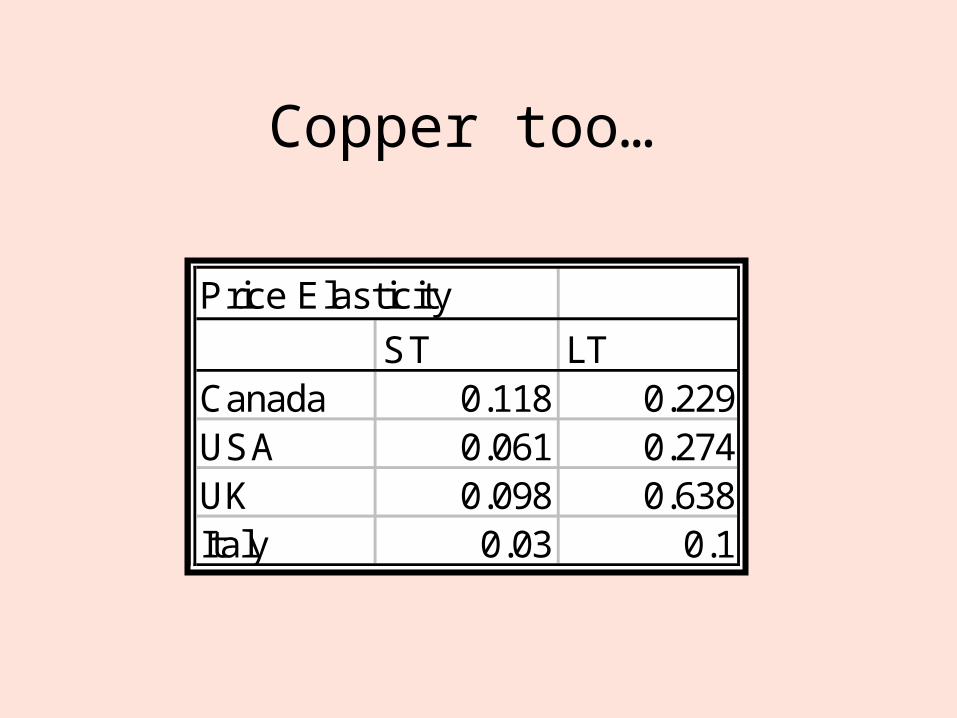
Copper too…
Price Elasticity
ST LTCanada 0.118 0.229USA 0.061 0.274UK 0.098 0.638Italy 0.03 0.1
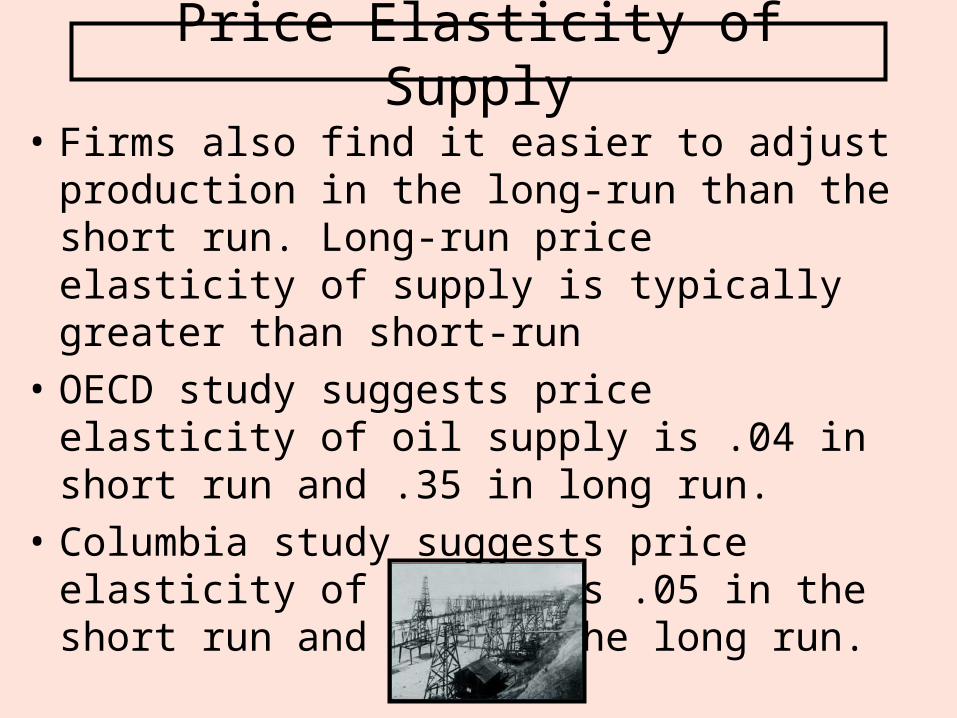
Price Elasticity of Supply
• Firms also find it easier to adjust production in the long-run than the short run. Long-run price elasticity of supply is typically greater than short-run
• OECD study suggests price elasticity of oil supply is .04 in short run and .35 in long run.
• Columbia study suggests price elasticity of copper is .05 in the short run and .15 in the long run.
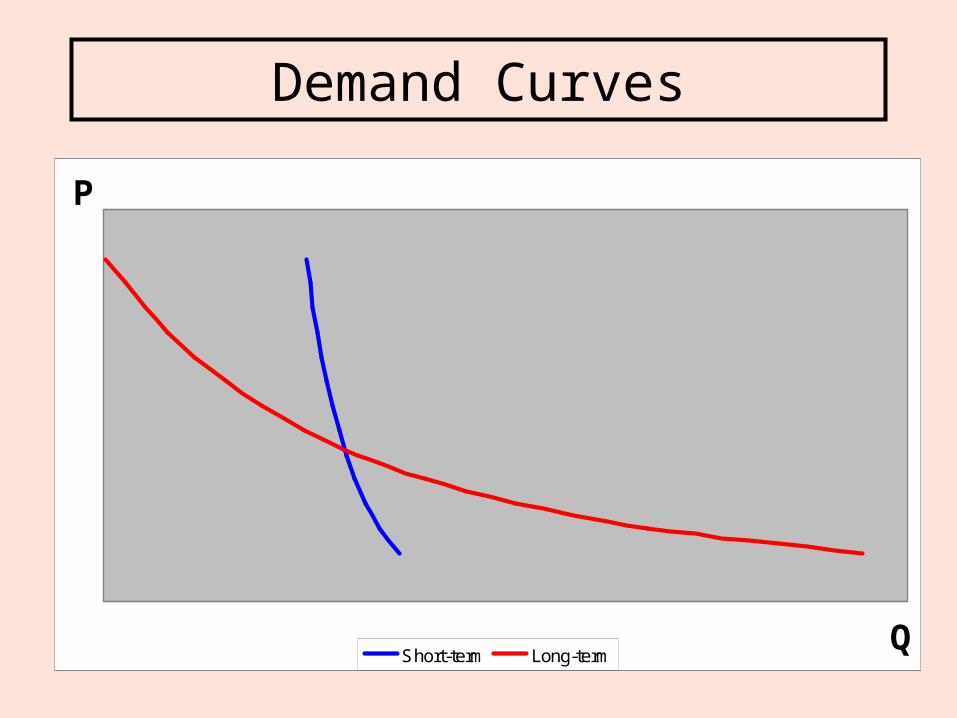
Demand Curves
Q
P
Short-term Long-term
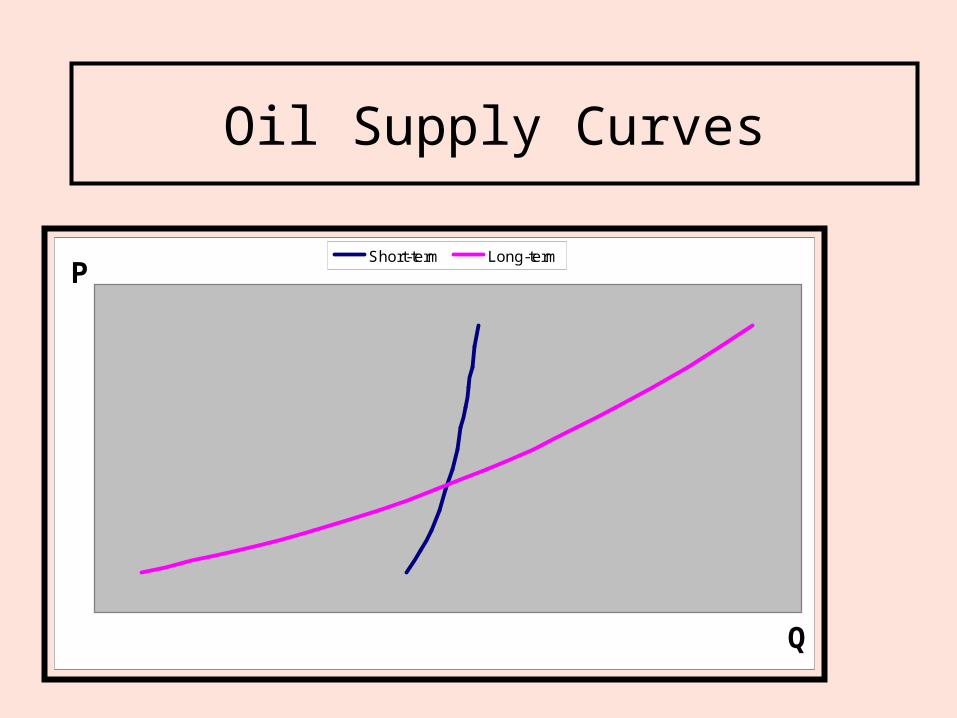
Oil Supply Curves
Q
PShort-term Long-term
Changing Equilibrium
Income Elasticity/ Cross Price Elasticity
What shifts a demand curve?
1. Changes in consumer preferences
2. Changes in (current or future) consumer income
3. Changes in the prices of other goods that are complementary to or substitutes for other goods.
Income Elasticity
• We measure the effect of income on demand for a good as % effect on demand of a 1% increase in income.
• For normal goods, income elasticity is positive.
• For inferior goods income elasticity is negative.

Luxuries vs. Necessities
• There are two types of normal goods.
• Luxuries take up an increasing share of income as your income grows.– Luxuries are income elastic - the income elasticity of
luxuries is greater than 1.
• Necessities take up a declining share of income as your income grows. – Necessities are income inelastic – the income elasticity
of luxuries is less than 1.
China’s Emerging Middle Class Download
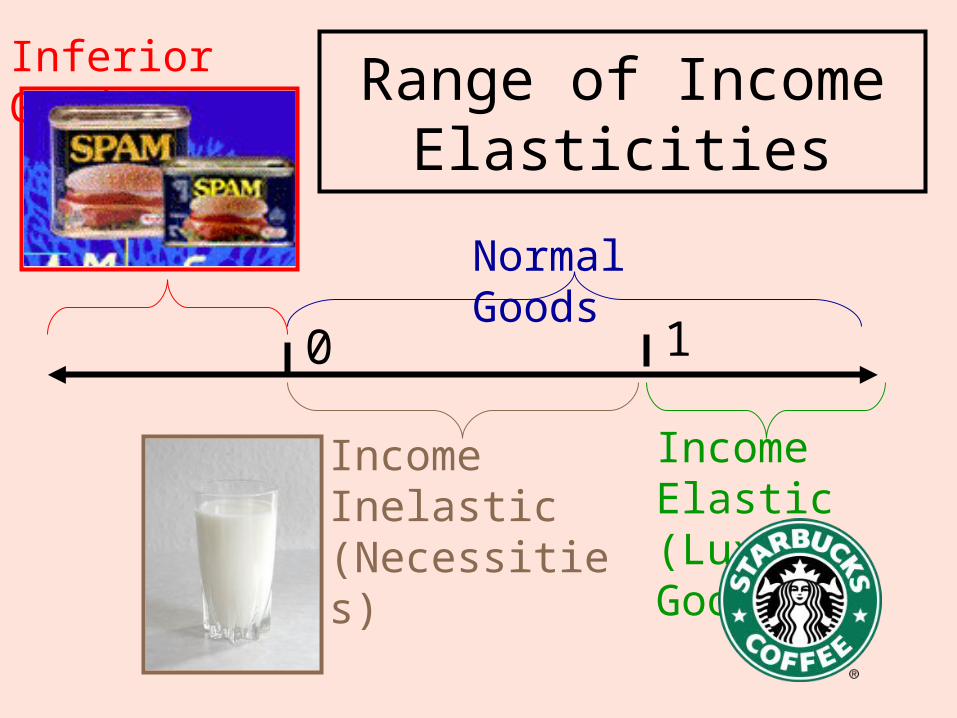
Range of Income Elasticities
0 1
Inferior Goods
Normal Goods
Income Elastic (Luxury Goods)
Income Inelastic (Necessities)
Source: OECD study
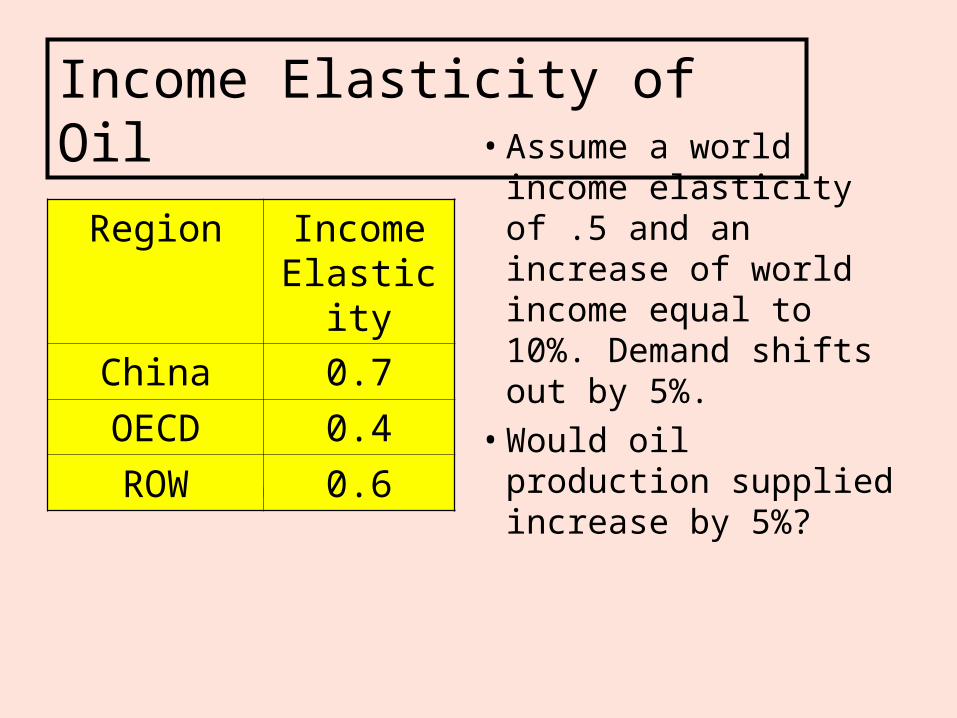
• Assume a world income elasticity of .5 and an increase of world income equal to 10%. Demand shifts out by 5%.
• Would oil production supplied increase by 5%?
Region Income Elasticity
China 0.7
OECD 0.4
ROW 0.6
Income Elasticity of Oil

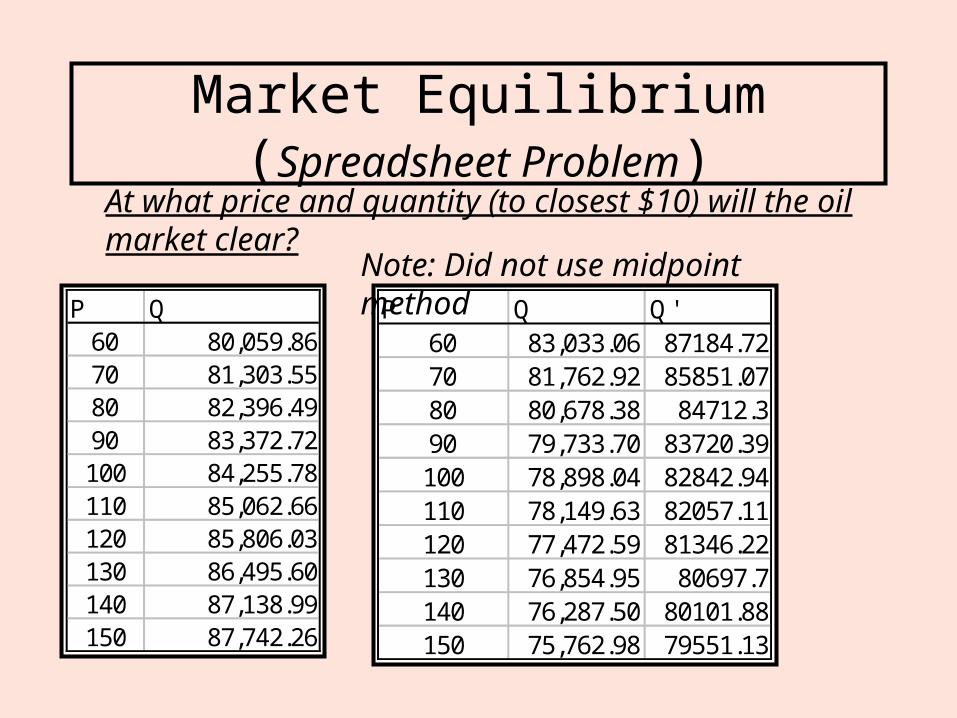
Market Equilibrium(Spreadsheet Problem)
At what price and quantity (to closest $10) will the oil market clear?
P Q Q'60 83,033.06 87184.7270 81,762.92 85851.0780 80,678.38 84712.390 79,733.70 83720.39100 78,898.04 82842.94110 78,149.63 82057.11120 77,472.59 81346.22130 76,854.95 80697.7140 76,287.50 80101.88150 75,762.98 79551.13
P Q60 80,059.8670 81,303.5580 82,396.4990 83,372.72100 84,255.78110 85,062.66120 85,806.03130 86,495.60140 87,138.99150 87,742.26
Note: Did not use midpoint method
Expected Income Effect
• Households are forward looking. If they expect income in the future they will increase spending today.
• Optimism (or pessimism) about future income will shift demand curve.
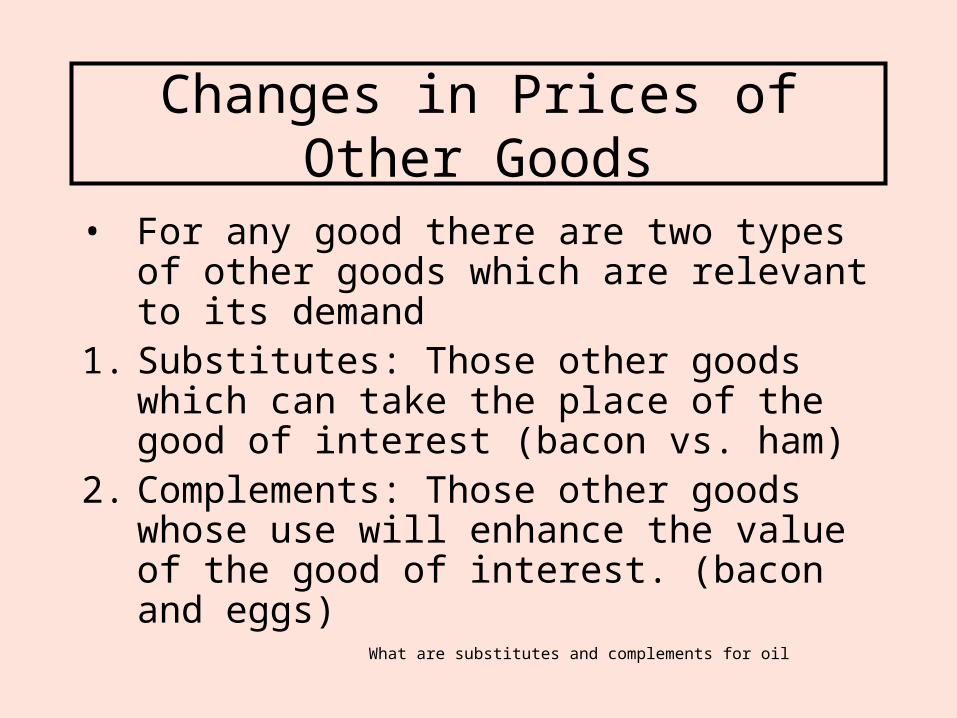
Changes in Prices of Other Goods
• For any good there are two types of other goods which are relevant to its demand
1. Substitutes: Those other goods which can take the place of the good of interest (bacon vs. ham)
2. Complements: Those other goods whose use will enhance the value of the good of interest. (bacon and eggs)
What are substitutes and complements for oil
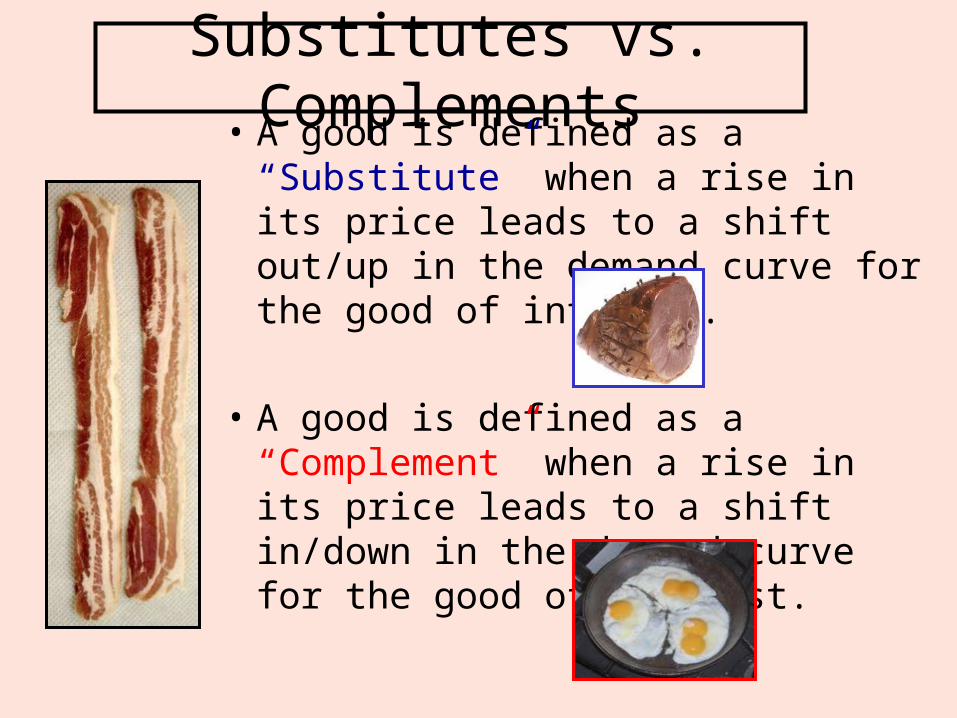
Substitutes vs. Complements• A good is defined as a “Substitute”
when a rise in its price leads to a shift out/up in the demand curve for the good of interest.
• A good is defined as a “Complement” when a rise in its price leads to a shift in/down in the demand curve for the good of interest.
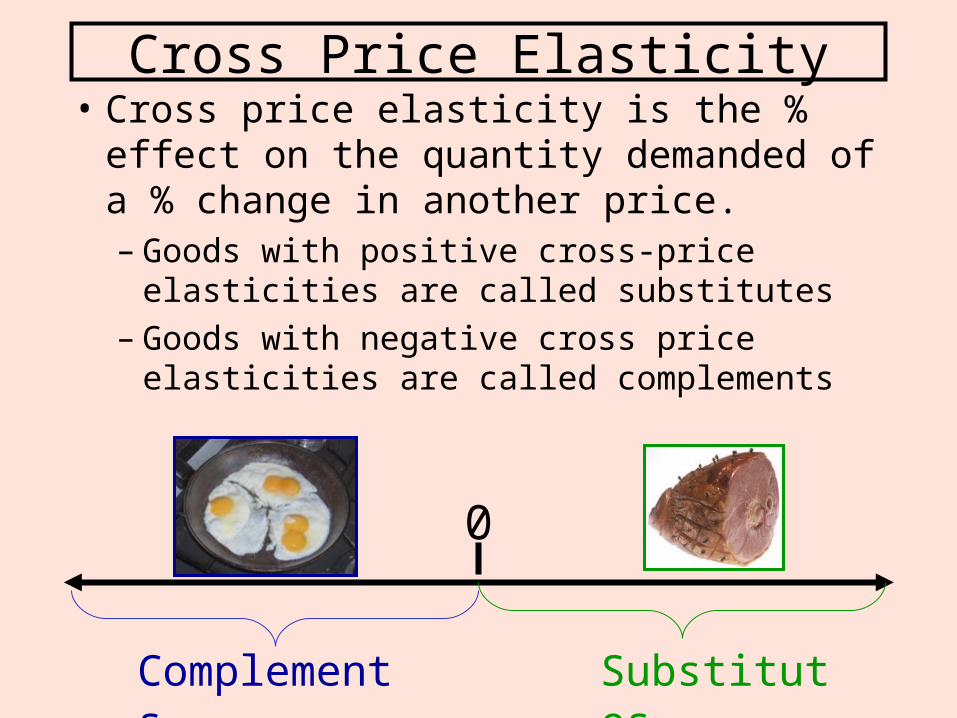
Cross Price Elasticity• Cross price elasticity is the % effect on the
quantity demanded of a % change in another price.– Goods with positive cross-price elasticities are
called substitutes– Goods with negative cross price elasticities are
called complements
0
SubstitutesComplements
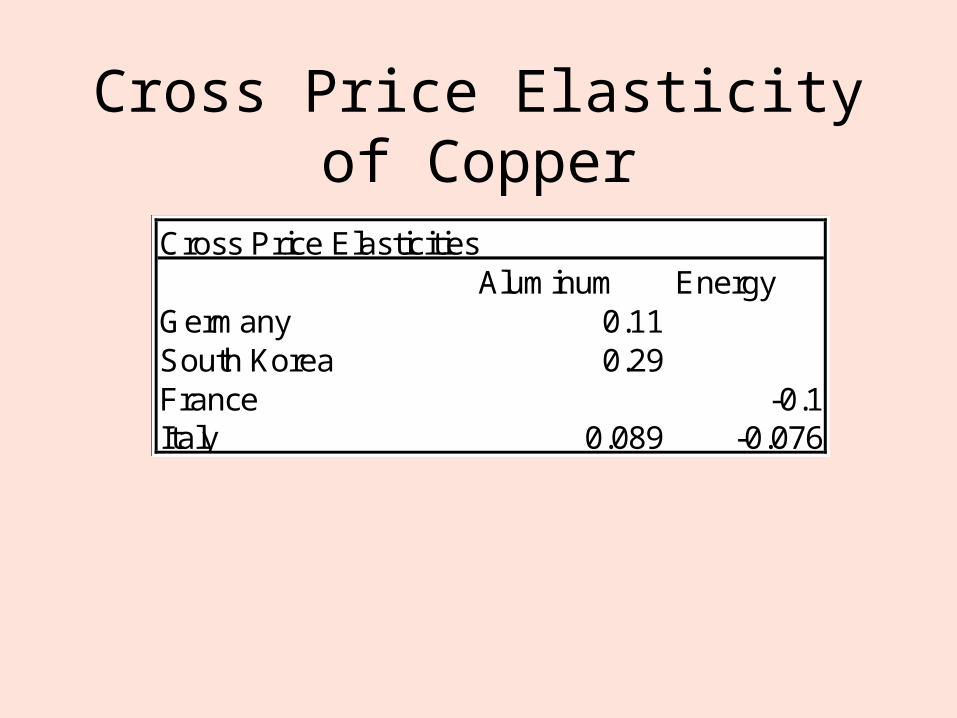
Cross Price Elasticity of Copper
Cross Price ElasticitiesAluminum Energy
Germany 0.11South Korea 0.29France -0.1Italy 0.089 -0.076
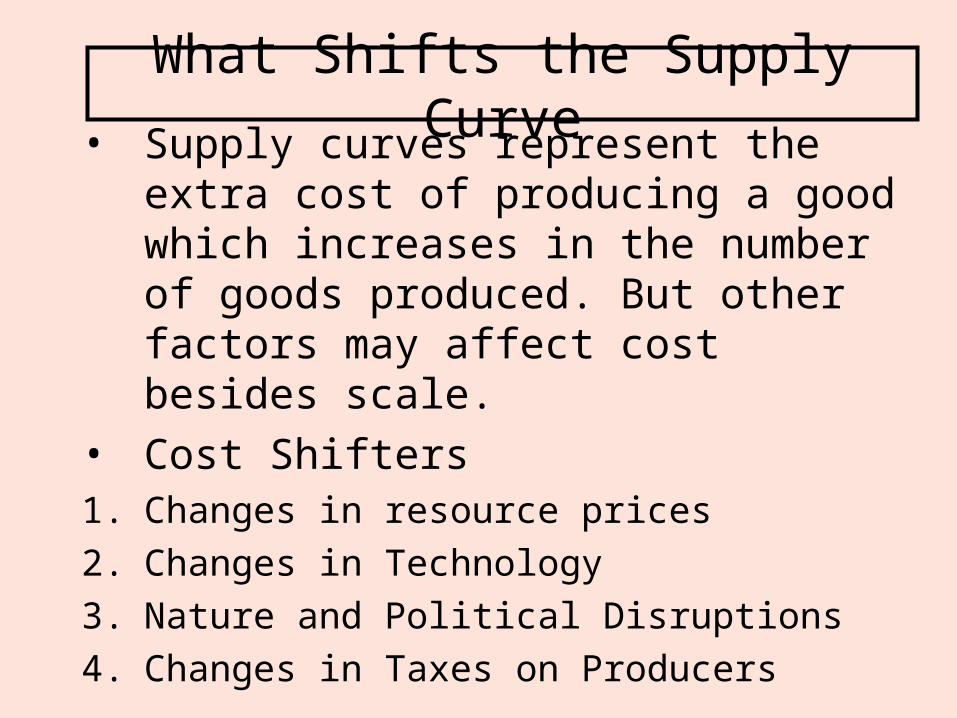
What Shifts the Supply Curve• Supply curves represent the extra cost of
producing a good which increases in the number of goods produced. But other factors may affect cost besides scale.
• Cost Shifters1. Changes in resource prices
2. Changes in Technology
3. Nature and Political Disruptions
4. Changes in Taxes on Producers
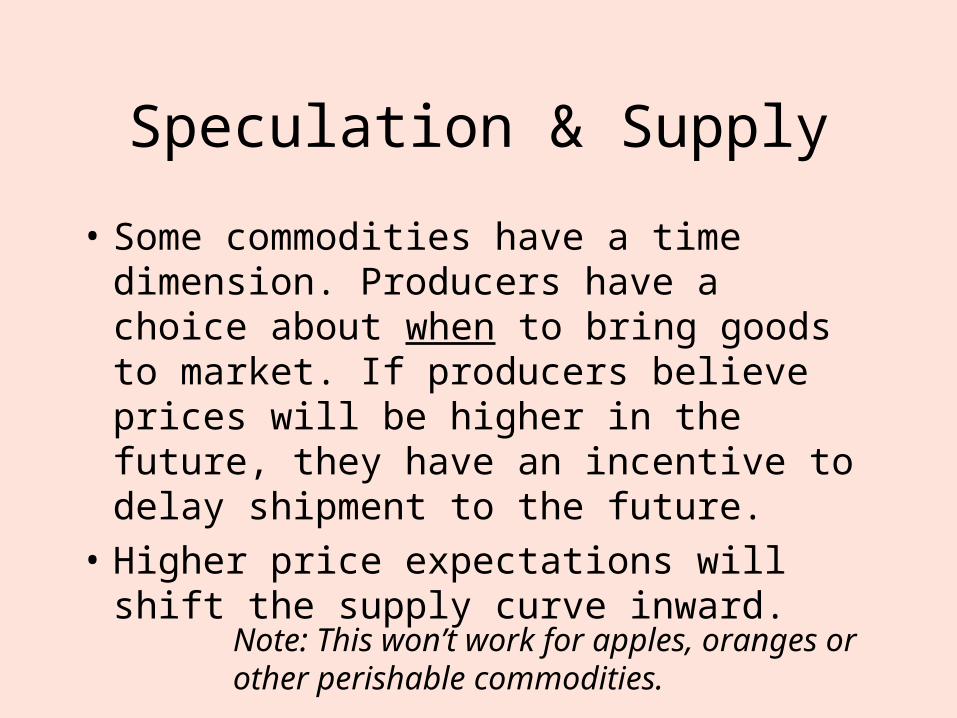
Speculation & Supply
• Some commodities have a time dimension. Producers have a choice about when to bring goods to market. If producers believe prices will be higher in the future, they have an incentive to delay shipment to the future.
• Higher price expectations will shift the supply curve inward.
Note: This won’t work for apples, oranges or other perishable commodities.
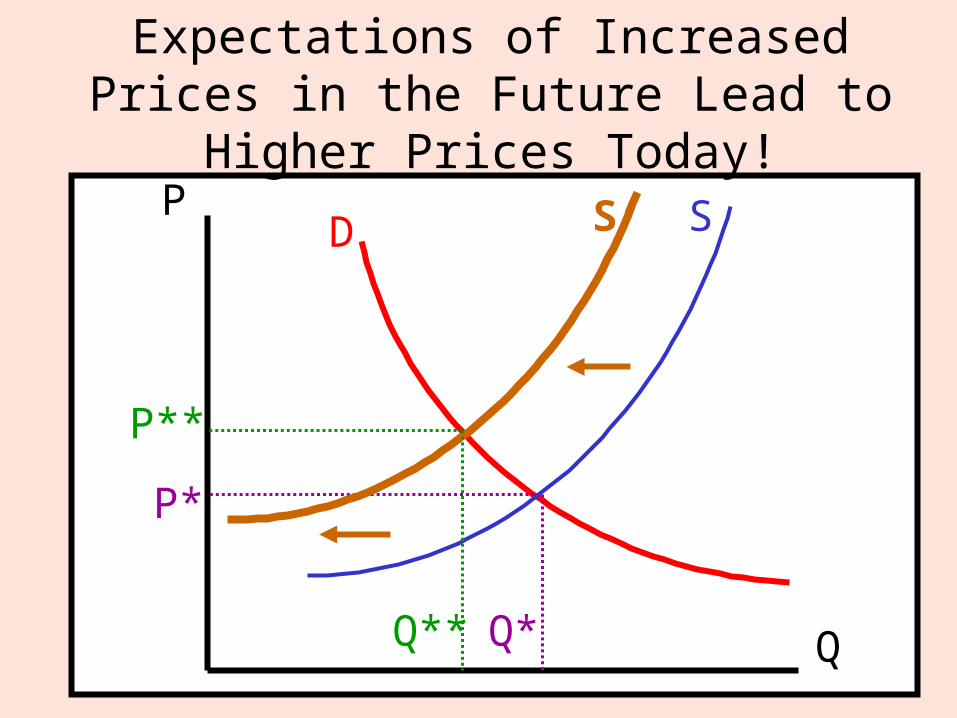
Expectations of Increased Prices in the Future Lead to Higher Prices Today!
SDP
Q
P*
Q*
P**
Q**
S′
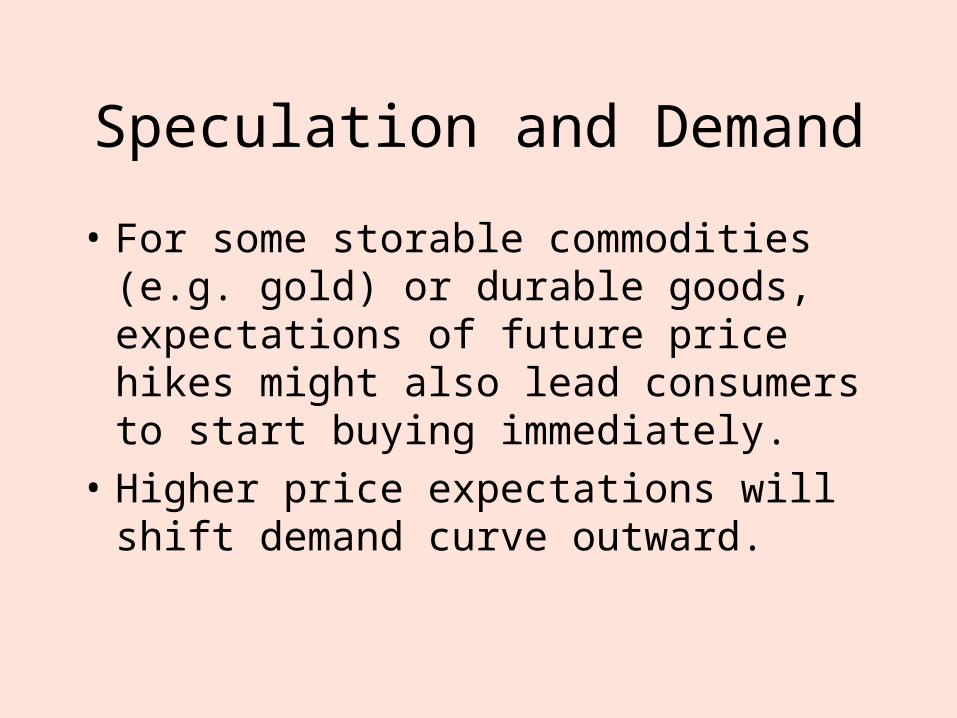
Speculation and Demand
• For some storable commodities (e.g. gold) or durable goods, expectations of future price hikes might also lead consumers to start buying immediately.
• Higher price expectations will shift demand curve outward.
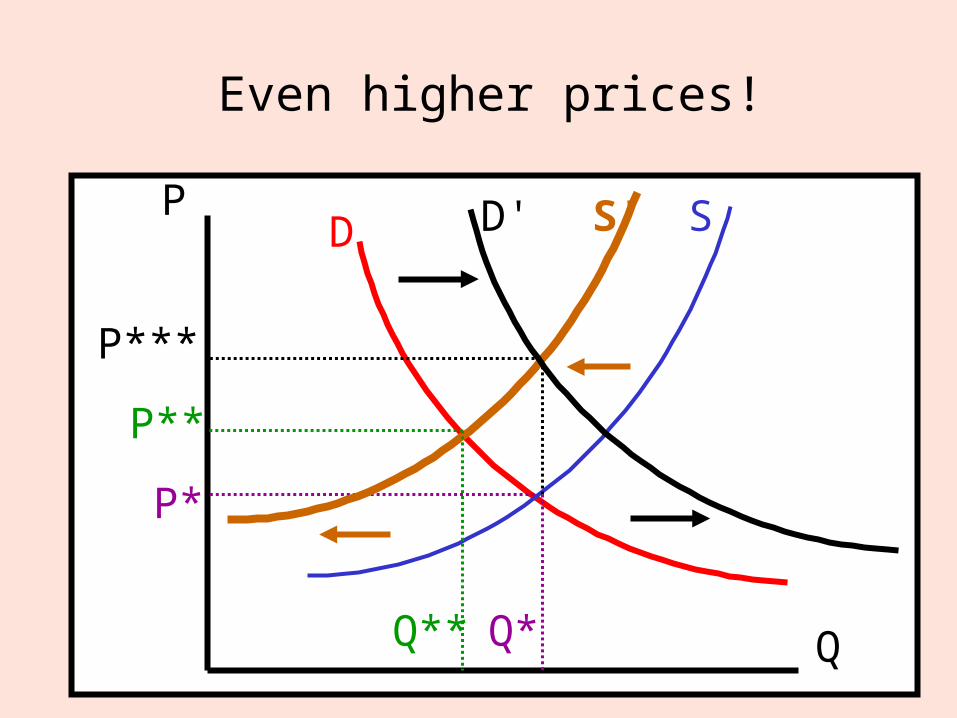
Even higher prices!
SDP
Q
P*
Q*
P**
Q**
S'D'
P***
Bubbles
• If current prices can be driven by expectations of even higher prices in the future…and…investors pile into commodities whose price has risen, then this could generate a feedback loop featuring rapidly rising prices
Think about for fun. Too theoretical for exam.
Learning Outcomes
• Distinguish substitutes/complements, luxuries/necessities/inferior goods.
• Identify the impact of demand & supply elasticity on price and quantity volatility in the short and long run.
• Identify the impact of expectations of the future on current prices.