Embed Size (px)
Citation preview
1
May 12, 2016 www.imf.org/commodities [email protected]
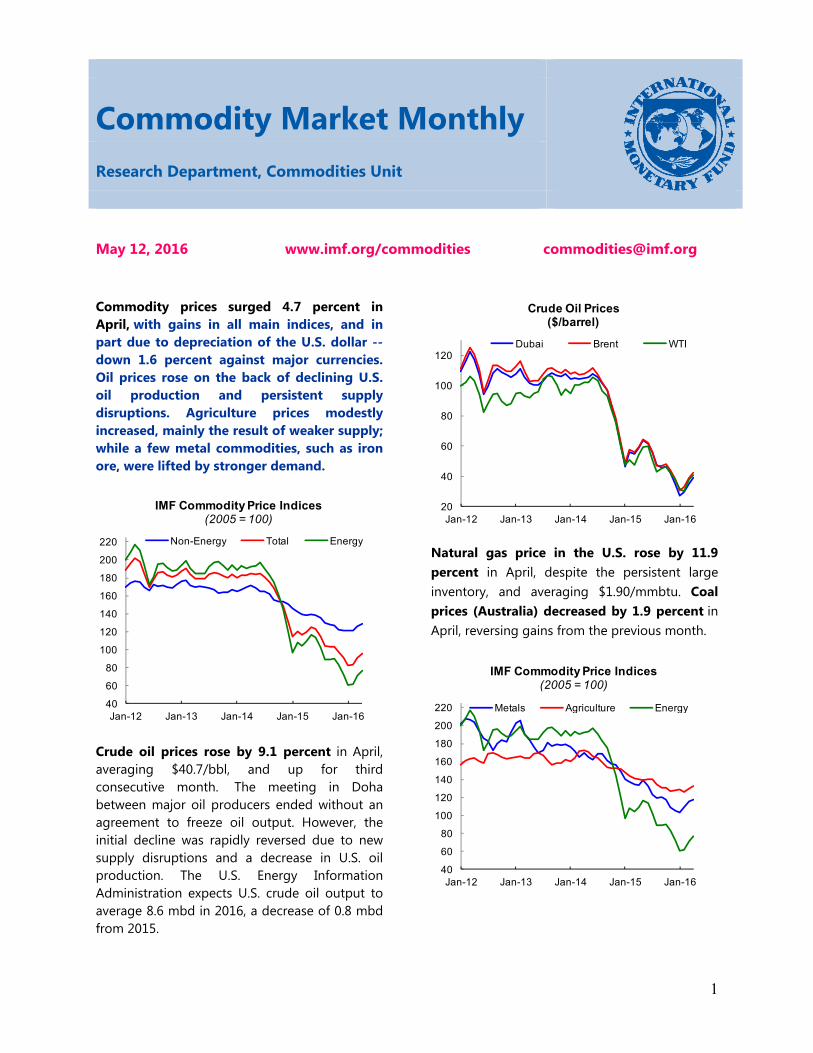
Commodity prices surged 4.7 percent in April, with gains in all main indices, and in part due to depreciation of the U.S. dollar -- down 1.6 percent against major currencies. Oil prices rose on the back of declining U.S. oil production and persistent supply disruptions. Agriculture prices modestly increased, mainly the result of weaker supply; while a few metal commodities, such as iron ore, were lifted by stronger demand.
Crude oil prices rose by 9.1 percent in April, averaging $40.7/bbl, and up for third consecutive month. The meeting in Doha between major oil producers ended without an agreement to freeze oil output. However, the initial decline was rapidly reversed due to new supply disruptions and a decrease in U.S. oil production. The U.S. Energy Information Administration expects U.S. crude oil output to average 8.6 mbd in 2016, a decrease of 0.8 mbd from 2015.
Natural gas price in the U.S. rose by 11.9 percent in April, despite the persistent large inventory, and averaging $1.90/mmbtu. Coal prices (Australia) decreased by 1.9 percent in April, reversing gains from the previous month.
Commodity Market Monthly
Research Department, Commodities Unit
40
60
80
100
120
140
160
180
200
220
Jan-12 Jan-13 Jan-14 Jan-15 Jan-16
Non-Energy Total Energy
IMF Commodity Price Indices(2005 = 100)
20
40
60
80
100
120
Jan-12 Jan-13 Jan-14 Jan-15 Jan-16
Dubai Brent WTI
Crude Oil Prices ($/barrel)
40
60
80
100
120
140
160
180
200
220
Jan-12 Jan-13 Jan-14 Jan-15 Jan-16
Metals Agriculture Energy
IMF Commodity Price Indices(2005 = 100)
2
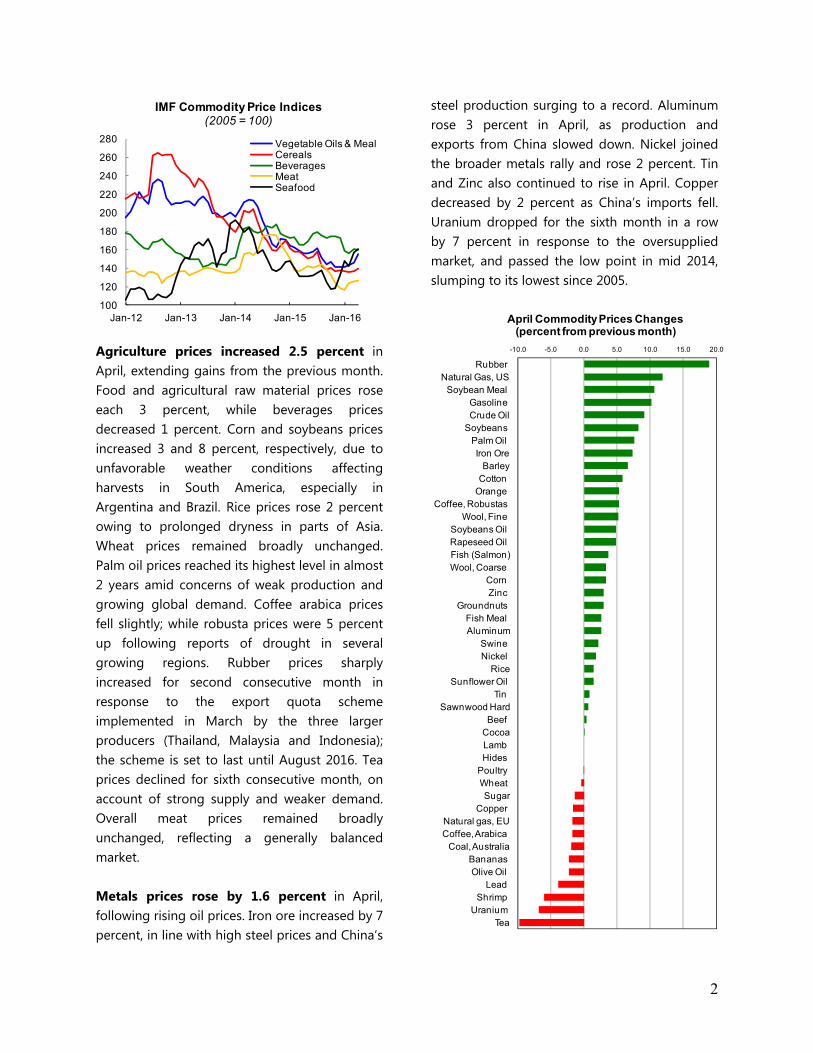
Agriculture prices increased 2.5 percent in April, extending gains from the previous month. Food and agricultural raw material prices rose each 3 percent, while beverages prices decreased 1 percent. Corn and soybeans prices increased 3 and 8 percent, respectively, due to unfavorable weather conditions affecting harvests in South America, especially in Argentina and Brazil. Rice prices rose 2 percent owing to prolonged dryness in parts of Asia. Wheat prices remained broadly unchanged. Palm oil prices reached its highest level in almost 2 years amid concerns of weak production and growing global demand. Coffee arabica prices fell slightly; while robusta prices were 5 percent up following reports of drought in several growing regions. Rubber prices sharply increased for second consecutive month in response to the export quota scheme implemented in March by the three larger producers (Thailand, Malaysia and Indonesia); the scheme is set to last until August 2016. Tea prices declined for sixth consecutive month, on account of strong supply and weaker demand. Overall meat prices remained broadly unchanged, reflecting a generally balanced market. Metals prices rose by 1.6 percent in April, following rising oil prices. Iron ore increased by 7 percent, in line with high steel prices and China’s
steel production surging to a record. Aluminum rose 3 percent in April, as production and exports from China slowed down. Nickel joined the broader metals rally and rose 2 percent. Tin and Zinc also continued to rise in April. Copper decreased by 2 percent as China’s imports fell. Uranium dropped for the sixth month in a row by 7 percent in response to the oversupplied market, and passed the low point in mid 2014, slumping to its lowest since 2005. 100
120
140
160
180
200
220
240
260
280
Jan-12 Jan-13 Jan-14 Jan-15 Jan-16
Vegetable Oils & MealCerealsBeveragesMeatSeafood
IMF Commodity Price Indices(2005 = 100)
-10.0 -5.0 0.0 5.0 10.0 15.0 20.0
TeaUranium
Shrimp Lead
Olive Oil Bananas
Coal, AustraliaCoffee, Arabica Natural gas, EU
Copper Sugar
Wheat Poultry Hides Lamb CocoaBeef
Sawnwood HardTin
Sunflower Oil Rice
Nickel Swine
AluminumFish Meal
Groundnuts Zinc Corn
Wool, Coarse Fish (Salmon)Rapeseed Oil Soybeans Oil
Wool, Fine Coffee, Robustas
Orange Cotton Barley
Iron OrePalm Oil
Soybeans Crude OilGasoline
Soybean Meal Natural Gas, US
Rubber
April Commodity Prices Changes(percent from previous month)

3
Units 2013 2014 2015 2015Q2 2015Q3 2015Q4 2016Q1 Mar-16 Apr-16
Food
Cereals
Wheat $/MT 265.8 242.5 185.6 196.3 178.8 162.3 162.6 164.0 163.4
Maize $/MT 259.0 192.9 169.8 168.4 169.4 167.1 159.9 159.1 164.4
Rice $/MT 518.8 426.5 380.0 381.8 374.0 357.7 367.7 370.5 376.0
Barley $/MT 206.4 146.1 127.9 128.1 127.9 123.2 119.7 121.1 129.1
Vegetable oils and protein meals
Soybeans $/MT 517.2 457.8 347.4 354.6 347.6 323.3 323.4 326.9 353.8
Soybean meal $/MT 477.3 467.0 352.7 348.0 369.3 320.8 294.9 296.2 327.7
Soybean oil $/MT 1011.1 812.7 672.2 715.4 638.3 638.6 686.9 713.9 748.5
Palm oil $/MT 764.2 739.4 565.1 599.9 514.6 518.0 586.9 633.1 681.1
Fish meal $/MT 1710.5 1921.5 1759.2 1744.2 1558.9 1701.9 1466.4 1387.8 1424.6
Sunflower Oil $/MT 1341.1 1080.3 1022.2 1062.3 1010.4 1042.1 1024.5 1013.9 1028.4
Olive oil $/MT 3816.7 3911.8 4927.1 4865.3 5616.4 4658.3 4418.8 4315.4 4219.0
Groundnuts $/MT 2314.5 2148.3 1946.2 2023.4 2012.9 1731.8 1821.3 1811.5 1865.3
Rapeseed oil $/MT 1081.2 904.4 774.6 772.6 772.7 798.1 774.7 767.4 804.6
Meat
Beef cts/lb 183.6 224.1 200.5 202.9 206.3 176.2 168.9 176.2 176.9
Lamb cts/lb 106.7 130.6 107.9 112.4 101.3 95.3 95.5 95.5 95.5
Swine Meat cts/lb 86.5 102.8 67.9 71.9 73.8 60.5 60.2 63.4 64.8
Poultry cts/lb 103.8 110.1 114.7 115.6 115.5 113.6 112.1 111.6 111.5
Seafood
Fish $/kg 6.8 6.6 5.3 5.1 5.3 5.3 6.5 6.9 7.2
Shrimp $/kg 14.0 16.6 14.1 15.7 15.0 10.0 11.0 11.0 10.4
Sugar
Free market cts/lb 17.7 17.1 13.2 12.6 11.6 14.7 14.3 15.4 15.2
United States cts/lb 21.2 24.9 24.9 24.6 24.5 25.5 25.9 26.3 27.9
EU cts/lb 26.0 27.4 25.4 25.5 25.8 25.2 23.8 23.7 23.7
Bananas $/MT 926.4 931.9 958.7 978.4 948.9 932.7 1028.2 1020.9 998.1
Oranges $/MT 967.3 782.5 675.0 616.9 652.1 732.6 686.2 677.8 713.8
Beverages
Coffee
Other milds cts/lb 141.1 202.8 160.5 161.0 153.2 150.8 150.7 156.9 154.2
Robusta cts/lb 100.5 105.6 94.2 96.7 90.9 87.9 82.1 83.2 87.6
Cocoa Beans $/MT 2439.1 3062.8 3135.2 3068.1 3252.8 3301.3 2980.8 3073.5 3075.7
Tea cts/kg 266.0 237.9 340.4 320.1 387.2 363.0 290.3 263.7 238.0
Agricultural raw materials
Timber
Hardwood
Logs 1/ $/M3 305.4 282.0 246.0 245.4 243.6 245.2 258.2 263.6 271.7
Sawnwood 1/ $/M3 852.8 897.9 833.3 834.8 844.9 827.1 780.3 775.0 780.0
Softwood
Logs 1/ $/M3 164.5 174.3 162.0 159.1 159.8 159.3 162.6 156.1 156.1
Sawnwood 1/ $/M3 301.4 307.3 308.7 298.0 310.4 319.6 227.2 183.6 183.6
Cotton cts/lb 90.4 83.1 70.4 72.3 71.0 69.5 66.9 65.5 69.3
Wool
Fine cts/kg 1197.7 1074.4 1005.8 1079.7 999.7 995.8 1023.4 1039.0 1092.9
Coarse cts/kg 1128.1 1030.4 922.8 962.7 942.0 898.9 960.1 992.0 1025.0
Rubber cts/lb 126.8 88.8 70.7 81.2 66.1 57.0 59.3 65.6 78.0
Hides cts/lb 94.7 110.2 87.6 96.8 76.1 71.7 70.0 70.0 70.01/ Provisional.2/ Average Petroleum Spot Price (APSP). Average of U.K. Brent, Dubai, and West Texas Intermediate, equally weighted.
Table 1. Market Prices for Non-Fuel and Fuel Commodities

4
Units 2013 2014 2015 2015Q2 2015Q3 2015Q4 2016Q1 Mar-16 Apr-16
Metals
Copper $/MT 7331.5 6863.4 5510.5 6056.6 5267.1 4884.9 4674.7 4953.8 4872.7
Aluminum $/MT 1846.7 1867.4 1664.7 1770.3 1592.4 1493.9 1514.5 1531.0 1571.2
Iron Ore $/MT 135.4 96.8 55.2 57.9 54.4 46.2 47.7 55.5 59.6
Tin $/MT 22281.6 21898.9 16066.6 15589.8 15229.5 15077.2 15438.6 16897.6 17032.7
Nickel $/MT 15030.0 16893.4 11862.6 13055.8 10578.9 9423.0 8507.7 8717.3 8878.9
Zinc $/MT 1910.2 2161.0 1931.7 2192.2 1842.8 1611.8 1677.3 1801.7 1855.4
Lead $/MT 2139.7 2095.5 1787.8 1942.2 1717.0 1681.7 1738.0 1802.2 1732.3
Uranium $/lb 38.6 33.5 36.8 36.8 36.4 36.0 32.6 29.6 27.6
Energy
Spot Crude 2/ $/bbl 104.1 96.2 50.8 60.4 48.8 42.2 32.8 37.3 40.7
U.K. Brent $/bbl 108.8 98.9 52.4 62.1 50.0 43.4 34.4 39.1 42.2
Dubai $/bbl 105.4 96.7 51.2 61.4 49.9 41.2 30.7 35.2 39.0
West Texas Intermediate $/bbl 97.9 93.1 48.7 57.8 46.5 42.0 33.3 37.8 41.0
Natural Gas
Russian in Germany $/mmbtu 11.2 10.5 7.3 7.4 6.6 5.9 4.7 4.1 4.0
Indonesian in Japan (LNG) $/mmbtu 17.3 17.0 11.0 9.6 9.8 10.0 8.0 7.5 7.0
US, domestic market $/mmbtu 3.7 4.4 2.6 2.7 2.7 2.1 2.0 1.7 1.9
Coal
Australian, export markets $/MT 90.6 75.1 61.6 63.2 61.6 56.1 54.5 55.9 54.81/ Provisional.2/ Average Petroleum Spot Price (APSP). Average of U.K. Brent, Dubai, and West Texas Intermediate, equally weighted.
Table 1. Market Prices for Non-Fuel and Fuel Commodities (Continued)
(weights) 1/ 2013 2014 2015 2015Q2 2015Q3 2015Q4 2016Q1 Mar-16 Apr-16
All Primary Commodities 2/ 100.0 183.3 171.8 111.2 122.4 107.5 97.2 86.1 91.4 95.7
Non-Fuel Commodities 36.9 169.0 162.3 133.9 138.6 131.1 123.5 122.7 125.7 128.6
Agriculture 26.2 163.3 161.5 137.1 139.9 135.2 128.7 128.1 129.7 132.9
Food 16.7 177.5 170.2 141.0 143.0 140.5 132.2 136.3 139.7 143.6
Cereals 3.6 218.2 180.2 149.0 152.5 146.1 138.2 136.5 137.1 139.3
Vegetable oils and protein meals 4.4 206.4 190.7 153.6 156.9 152.4 143.3 143.5 145.8 155.7
Meat 3.7 136.8 160.5 137.4 140.5 141.9 125.2 122.2 125.9 126.8
Seafood 3.2 160.1 162.0 131.7 131.6 132.5 123.0 149.1 157.0 160.7
Beverages 1.8 147.4 178.0 172.6 170.4 175.9 173.7 158.7 161.0 159.9
Agricultural raw materials 3/ 7.7 136.2 138.8 120.0 125.9 114.0 110.6 103.1 100.6 103.2
Timber 3.4 107.3 109.3 104.5 102.6 104.9 105.8 89.9 82.5 83.1
Metals 10.7 182.9 164.1 126.2 135.5 121.0 110.7 109.5 116.0 117.8
Edibles 4/ 18.5 174.6 171.0 144.1 145.7 144.0 136.3 138.5 141.8 145.2
Industrial Inputs 5/ 18.4 163.3 153.5 123.6 131.5 118.1 110.7 106.8 109.5 111.7
Energy 6/ 63.1 191.7 177.4 97.9 113.0 93.7 81.8 64.7 71.3 76.5
Petroleum 7/ 53.6 195.9 181.1 95.6 113.7 91.9 79.3 61.5 70.1 76.5
Natural Gas 6.9 164.9 159.9 106.8 102.4 97.5 90.6 72.9 65.8 63.9
Coal 2.6 176.8 149.1 121.3 125.4 120.1 110.0 107.8 110.7 109.1
3/ Includes Forestry Products.4/ Edibles comprised of Food and Beverages5/ Industrial (Non-Fuel) Inputs comprised of Agriculture and Metals6/ Includes Petroleum, Natural Gas and Coal7/ Average Petroleum Spot Price (APSP). Average of U.K. Brent, Dubai, and West Texas Intermediate, equally weighted.
Table 2. Indices of Market Prices for Non-Fuel and Fuel Commodities, 2013-2016(2005=100, in terms of U.S. dollars) 1/
1/ Weights based on 2002-2004 average world export earnings.2/ Non-Fuel Primary Commodities and Energy Index.

5
Commodity Prices Movements
Monthly (from 2005) Daily (from 2011)
25
50
75
100
125
150
05 07 09 11 13 15
Crude oil ($/bbl)
Brent
WTI
15
40
65
90
115
140
11 12 13 14 15 16
Crude oil ($/bbl)
Brent
WTI
0
5
10
15
20
05 07 09 11 13 15
Natural Gas ($/mmbtu)
Germany
United States
Sources: Energy Intelligence; Bloomberg , L.P.
Japan
0
5
10
15
11 12 13 14 15 16
Natural Gas ($/mmbtu)
Source: Bloomberg , L.P.
United States
Germany
0
25
50
75
100
125
150
175
200
05 07 09 11 13 15
Iron Ore ($/ton)
20
45
70
95
120
145
170
195
11 12 13 14 15 16
Iron Ore ($/ton)

6
Commodity Prices Movements (Continued)
Monthly (from 2005) Daily (from 2011)
2500
3500
4500
5500
6500
7500
8500
9500
05 07 09 11 13 15
Copper ($/ton)
3000
4000
5000
6000
7000
8000
9000
10000
11000
11 12 13 14 15 16
Copper ($/ton)
1000
1500
2000
2500
3000
3500
05 07 09 11 13 15
Aluminium ($/ton)
1300
1500
1700
1900
2100
2300
2500
2700
2900
11 12 13 14 15 16
Aluminium ($/ton)
0
10000
20000
30000
40000
50000
60000
05 07 09 11 13 15
Nickel ($/ton)
6000
11000
16000
21000
26000
11 12 13 14 15 16
Nickel ($/ton)

7
Commodity Prices Movements (Continued)
Monthly (from 2005) Daily (from 2011)
0
5000
10000
15000
20000
25000
30000
35000
05 07 09 11 13 15
Tin ($/ton)
50
100
150
200
250
300
350
05 07 09 11 13 15
Corn ($/ton)
10000
15000
20000
25000
30000
35000
11 12 13 14 15 16
Tin ($/ton)
100
150
200
250
300
350
400
11 12 13 14 15 16
Wheat ($/ton)
120
170
220
270
320
370
11 12 13 14 15 16
Corn ($/ton)
100
200
300
400
500
05 07 09 11 13 15
Wheat ($/ton)

8
Commodity Prices Movements (Continued)
Monthly (from 2005) Daily (from 2011)
1000
1500
2000
2500
3000
3500
4000
05 07 09 11 13 15
Cocoa ($/ton)
0
50
100
150
200
250
300
350
05 07 09 11 13 15
Coffee (cents/lb)
0
20
40
60
80
100
120
140
05 07 09 11 13 15
Swine (cents/lb)
40
50
60
70
80
90
100
110
120
130
140
11 12 13 14 15 16
Swine (cents/lb)
100
150
200
250
300
350
11 12 13 14 15 16
Coffee (cents/lb)
1800
2000
2200
2400
2600
2800
3000
3200
3400
3600
3800
11 12 13 14 15 16
Cocoa ($/ton)

9
Commodity Prices Movements (Continued)
Monthly (from 2005) Daily (from 2011)
75
100
125
150
175
200
225
250
275
05 07 09 11 13 15
Beef (cents/pound)
Source: Meat & Livestock Australia.
150
250
350
450
550
650
05 07 09 11 13 15
Soybeans ($/ton)
0
50
100
150
200
250
05 07 09 11 13 15
Cotton (cents/pound)
90
100
110
120
130
140
150
160
170
180
11 12 13 14 15 16
Beef (cents/lb)
Source: Bloomberg , L.P.
250
300
350
400
450
500
550
600
650
700
11 12 13 14 15 16
Soybeans ($/ton)
50
70
90
110
130
150
170
190
210
230
250
11 12 13 14 15 16
Cotton (cents/lb)

10
Commodity Prices Movements (Continued)Monthly (from 2005)
800
1300
1800
2300
2800
3300
3800
4300
05 07 09 11 13 15
Zinc ($/ton)
0
50
100
150
200
05 07 09 11 13 15
Coal ($/ton)
Australia
South Africa
0
20
40
60
80
100
120
140
160
05 07 09 11 13 15
Uranium($/lb)
100
200
300
400
500
05 07 09 11 13 15
Logs ($/cubic meter)
Soft
Hard
0
50
100
150
200
250
300
05 07 09 11 13 15
Rubber ($/lb)
250
500
750
1000
1250
1500
1750
2000
05 07 09 11 13 15
Wool (cents/kg)
Fine
Coarse

11
Commodity Prices Movements (Continued)Monthly (from 2005)
200
400
600
800
1000
1200
05 07 09 11 13 15
Rice ($/ton)
300
400
500
600
700
800
900
1000
1100
1200
05 07 09 11 13 15
Bananas ($/ton)
300
500
700
900
1100
1300
05 07 09 11 13 15
Palm Oil ($/ton)
6
8
10
12
14
16
18
20
05 07 09 11 13 15
Shrimp ($/kg)
5
10
15
20
25
30
05 07 09 11 13 15
Sugar (cents/pound)
150
200
250
300
350
400
450
05 07 09 11 13 15
Tea (cents/kg)
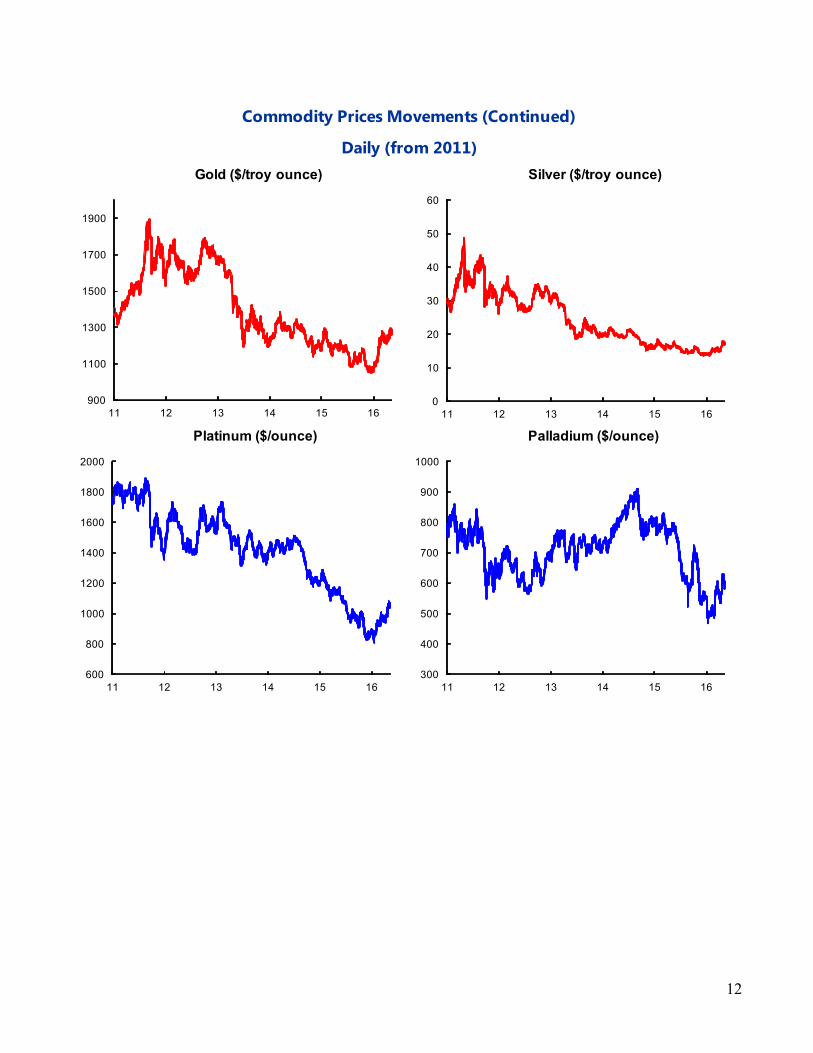
12
Commodity Prices Movements (Continued)
Daily (from 2011)
900
1100
1300
1500
1700
1900
11 12 13 14 15 16
Gold ($/troy ounce)
600
800
1000
1200
1400
1600
1800
2000
11 12 13 14 15 16
Platinum ($/ounce)
0
10
20
30
40
50
60
11 12 13 14 15 16
Silver ($/troy ounce)
300
400
500
600
700
800
900
1000
11 12 13 14 15 16
Palladium ($/ounce)