Embed Size (px)
Citation preview
1
April 7, 2020
Commodities Strategy | Metals Quarterly / Monthly
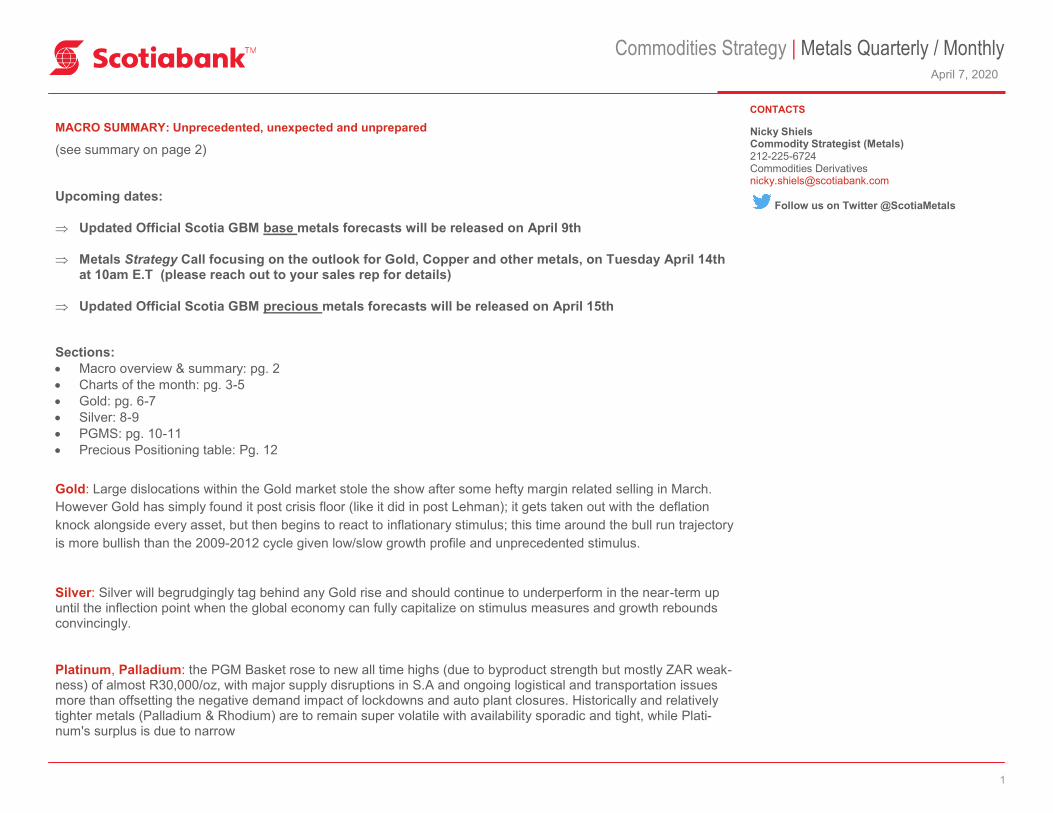
MACRO SUMMARY: Unprecedented, unexpected and unprepared
(see summary on page 2)
Upcoming dates:
Updated Official Scotia GBM base metals forecasts will be released on April 9th
Metals Strategy Call focusing on the outlook for Gold, Copper and other metals, on Tuesday April 14th at 10am E.T (please reach out to your sales rep for details)
Updated Official Scotia GBM precious metals forecasts will be released on April 15th Sections:
Macro overview & summary: pg. 2
Charts of the month: pg. 3-5
Gold: pg. 6-7
Silver: 8-9
PGMS: pg. 10-11
Precious Positioning table: Pg. 12
Gold: Large dislocations within the Gold market stole the show after some hefty margin related selling in March.
However Gold has simply found it post crisis floor (like it did in post Lehman); it gets taken out with the deflation
knock alongside every asset, but then begins to react to inflationary stimulus; this time around the bull run trajectory
is more bullish than the 2009-2012 cycle given low/slow growth profile and unprecedented stimulus.
Silver: Silver will begrudgingly tag behind any Gold rise and should continue to underperform in the near-term up until the inflection point when the global economy can fully capitalize on stimulus measures and growth rebounds convincingly.
Platinum, Palladium: the PGM Basket rose to new all time highs (due to byproduct strength but mostly ZAR weak-ness) of almost R30,000/oz, with major supply disruptions in S.A and ongoing logistical and transportation issues more than offsetting the negative demand impact of lockdowns and auto plant closures. Historically and relatively tighter metals (Palladium & Rhodium) are to remain super volatile with availability sporadic and tight, while Plati-num's surplus is due to narrow
Nicky Shiels Commodity Strategist (Metals) 212-225-6724 Commodities Derivatives [email protected]
Follow us on Twitter @ScotiaMetals
CONTACTS
2
April 7, 2020
Commodities Strategy | Metals Quarterly / Monthly
MACRO SUMMARY: Unprecedented, unexpected and unprepared
VIRUS: its been labeled the great leveler with eerie milestones met (well over 1m cases globally) but the rate of change seems to be rolling over, with risk re-maining around a 2nd wave (an “M” curve which is what happened during the Spanish flu and is occurring/feared in China with imported cases). Antibody tests/data in the near-term (vaccine in longer-term) and a relaxing of extreme national lockdowns could inject some balance into the economies.
CRISIS TYPES: it started as a health crisis, morphed into a economic one (and some argue a financial one but the Fed can counter liquidity issues, while it has a harder time countering or controlling equity market risks, credit and simply people getting sick). It is also a deflationary demand crisis, a supply chain crisis, a labor market crisis and an energy price crisis
GROWTH: markets and sentiment quickly cycled through varying shaped recoveries (“V-U-or L”, but also “↓” or “Nike Swoosh” recoveries). The standard base / low / high scenario analysis has given way to larger and growing tail risks (inflationary “Nike Swoosh” vs depressionary “↓”). Official Scotia forecasts hing-es largely on a “V-shaped” recovery later in 2H’20 (with recessionary stats for most economies in Q2); we remain a little more cautious
DATA: There has been limited recognition or no reaction to some of the high frequency data in the US (initial claims) or namesake ones that provide insight on consumer confidence & trends (NFP, auto sales). Risk markets tend to price in worse case scenarios and they’ve perhaps done that with added uncertainty; thus with some visibility returning with data, that’s (bizarrely) soothing for markets. In addition, theres simply no precedent, thus data is expected to be wild, un-interpretable and untradeable (as kneejerk algo reactions remain sidelined negatively impacting liquidity/volumes). Ultimately what go us into an economic crisis (a health crisis) will lead us out.
FISCAL & MONETARY POLICY RESPONSE: The once unthinkable very quickly became a reality but ‘too much’ was/is being done on policy action, because developed economies (Europe and US) acted ‘too late’ to stem the spread of the virus; swift pre-emptive totalitarian action by governments, creates an ugly precedent for authoritarian and permanently bigger government, surveillance states where airport health screenings become routine, borders remain closed, especially if 2nd waves reemerge. Unprecedented monetary & fiscal policy has started both earlier (before the Q2 recession) and ramped up faster than any-time beforehand (the US’ $2tn fiscal package dwarfs the 2008 package) and includes alternative new policies/method (‘Coronabonds’, which has been floated in Europe but not greenlighted and quasi-MMT—the Fed is using the bond market, not Treasury, as the main conduit, global ZIRP etc); unlimited QE, imminent negative interest rates is essentially here leading to unlimited deficits & a highly uncertain growth recovery with wider tail risks. Ultimately, a larger wealth gap (aggressive global monetary policy) and a need to hedge out massive inflationary response with real assets are the perhaps the obvious longer-term winners to such drastic measures. Oh and permanently slower growth. (See graph on page 3)
LIQUIDUITY VS the PERCEPTION OF LIQUIDITY: the irony is that even with extraordinary liquidity injections, the liquidity party (2010-2019) is over as banks and other providers (while much better capitalized vs 2008) remain hesitant about lending, as the markets await the economic/market casualties of Covid-19. The tide — of unlimited liquidity, at any cost (no growth—think WeWorks) spurred on by decades of globalism & international trade— has gone out. Quality now really matters.
GLOBALISM vs PROTECTIONISM: Trade wars was just the ugly cousin to this same phenomenon (borders-up protectionism). Global interdependence and globalization rests on the idea that the consumer can have anything ‘on-demand’ that spurred travel, free trade & low-cost imports from China. The age of ultra-mobility & ‘cheapest is best’ is behind us as society, companies & government will likely fundamentally change their thinking about security, global supply chains/reliance on China and what ‘critical interests’ are, respectively.
SOCIO-ECONOMIC IMPACT: many comparisons have been made—will 1H’2020 be remembered as 9/11 (best case?), the 1929 Great Crash or the end of WWII in 1945 — all major defining events that sparked radical changes in the way societies & economies were organized, some for generations
POLITICS: Less cooperation less coordination in a time of need. Policy action has been correlated NOT coordinated (theres a major difference). Trumps “American First” mantra has strengthened while the coherence of the Eurozone is once again looking fragile (as the proposal to mutualize debt via Coro-nabonds being resisted by Germanys Merkel & Netherlands). There is a US re-election and any lesson in international cooperation will likely be rejected (Trumps still calls it’s the Chinese virus)

3
April 7, 2020
Commodities Strategy | Metals Quarterly / Monthly
Chart of the month #1: an attempt to provide a quantitative real-time snapshot of the recent & quickly evolving fiscal (programs announced, LHS) & mone-
tary policies (rate cuts, RHS) announced by most major economics impacted by COVID-199 (as of April 2nd 2020) —> 800bps of global rate cuts (620 bps driven by G-10 CBs—see page 7) and almost $3 tn has been pledged by COVID-19 affected countries!

4
April 7, 2020
Commodities Strategy | Metals Quarterly / Monthly
Chart of the month #2 Before COVID-19 spread to the rest of the world, there were large (and sustainable) divergences across major asset classes; Slower and lower global growth in a post GFC work was being priced into commodities and Bonds (yields), while equities remained relative outperformers. Q1’2020 changed everything and lev-eled the playing field

5
April 7, 2020
Commodities Strategy | Metals Quarterly / Monthly
Chart of the month #3: Precious and base metal performance through escalating COVID-19 periods; Gold has relatively outperformed all industrial metals,
especially on risk adjusted basis.
60
70
80
90
100
110
120
130
140
150
Jan
/01
Jan
/03
Jan
/07
Jan
/09
Jan
/13
Jan
/15
Jan
/17
Jan
/21
Jan
/23
Jan
/27
Jan
/29
Jan
/31
Feb
/04
Feb
/06
Feb
/10
Feb
/12
Feb
/14
Feb
/18
Feb
/20
Feb
/24
Feb
/26
Feb
/28
Mar
/03
Mar
/05
Mar
/09
Mar
/11
Mar
/13
Mar
/17
Mar
/19
Mar
/23
Mar
/25
Mar
/27
Mar
/31
Gold Silver Platinum Palladium Nickel Aluminum Copper Zinc Tin
Chart: Precious and Base Metal Index Performance Since Jan 2020
WHO Declares Global Emergency WHO Declares Global Pandemic
Scotiabank Commodity (Metals) Strategy, Bloomberg and WHO
Date Gold Silver Platinum Palladium Nickel Aluminum Copper Zinc Tin
Feb-20 1,585.7$ 16.7$ 866.3$ 2,616.6$ 12,187.0$ 1,676.5$ 5,617.3$ 2,009.8$ 16,267.0$
Mar-20 1,577.2$ 14.0$ 723.1$ 2,363.1$ 11,434.5$ 1,492.5$ 4,938.8$ 1,894.8$ 14,667.0$
Difference 8.51-$ 2.69-$ 143.21-$ 253.44-$ 752.50-$ 184.00-$ 678.50-$ 115.00-$ 1,600.00-$
% Change -0.54% -16.15% -16.53% -9.69% -6.17% -10.98% -12.08% -5.72% -9.84%
Source: Scotiabank Commodity (Metals) Strategy, Bloomberg
Precious and Base Metal MoM Performance

6
April 7, 2020
Commodities Strategy | Metals Quarterly / Monthly
GOLD: Large dislocations within the Gold market stole the show after some hefty margin related selling in March. However Gold has
simply found it post crisis floor (like it did in post Lehman); it gets taken out with the deflation knock alongside every asset, but then
begins to react to inflationary stimulus; this time around the bull run trajectory is more bullish than the 2009-2012 cycle given
low/slow growth profile and unprecedented stimulus.
Gold prices whipsawed within a $250 range in March, but after technically finding solid support at $1450, reverted into a holding formation around $1580-1640. The narrative is a lot more constructive now:
Fast money positioning is clearly a lot cleaner, with COT taking down 1/3rd
of peak positioning (-7.4m oz) while ETFs continued to add in March (+3.6m oz)
Max macro fear has dialed back from extreme levels as risk appetite and some conviction in US equities return given massive global monetary and fiscal stimulus.
Headwinds are emerging in the US$ and funding pressures are relieved
Unprecedented structural themes have emerged faster than many believed (Unlimited QE, imminent negative interest rates, unlimited deficits & direct monetization, highly uncertain growth recovery outlooks with wider tail risks)
Gold should be through recent highs of $1700, as the market is beginning to acknowledge these drivers. However through a commodity & trading lens, gold demand is weak.
India – its largest consumer—is on lock down
EM CBs are likely to downsize the pace of their gold purchases given the negative impact of both oil and weaker currencies.
The general lack of short-term liquidity in the (gold) system - whether for EFPs or risk appetite for outright pricing - is bearish for outright gold, since its a liquidity product. Any potentially large player participant who could potentially be active in Gold as an alternative asset (vs Treasuries), could be a deterred.
Overall, the largescale inflow from Western retail & institutional should offset weaker physical demand and the short-term illiquidity headwinds.
The numerous large refineries closed in the Swiss canton of Ticino (until April 5th) have asked for permission to partially reopen; the ramp-up process has
started but will be gradual and slow (but arguably faster than reopening mines). Together with some primary supply being shut down (1% of global supply&
counting), the market seems to be calling for a gold shortage.... There is certainly a shortage of certain product (eg: 100 oz bar) in certain regions (Europe,
US), but not a global fundamental shortage, more so intermittent bottlenecks, that will be alleviated once refineries restart and new air/transportation
routes are formed.
Post Lehman crisis, gold repriced 94% in 2 years; that’s too lofty given its a $1600 asset (not a $800 one) but another a test of $1800 is in the cards, as prices attempt to find a footing to kick start a stronger bull run.

7
April 7, 2020
Commodities Strategy | Metals Quarterly / Monthly

8
April 7, 2020
Commodities Strategy | Metals Quarterly / Monthly
SILVER: Silver will begrudgingly tag behind any Gold rise and should continue to underperform in the near-term up until the inflection point when the global economy can fully capitalize on stimulus measures and growth rebounds convincingly.
Silver traversed a lot of ground in March, falling from ~$18, through $12 (levels not seen since 1H 2009), before settling down over 16% MoM. The massive underperformance vs Gold is evidenced in the Gold/Silver ratio repricing strongly out of a multi-decade range, from <100 to 124! That is not surprising , given:
1. Major dislocations across ALL asset classes in Q1, 2. The extent of the macro fear & uncertainty driving an overreach for safe / quality assets and USDs 3. Silvers relatively saturated fundamental profile and industrial properties (where consumer demand dropped off due to sudden economic stops) 4. The lack of CB demand in Silver, which supports Gold relatively better on any turn in paper/investor positioning
After reaching a high of $19 in Q1’20 driven by strong investor inflows, Silver came under similar margin related pressure in March (~210m oz of outflows largely from COT investors) which was no match for the renewed weakened physical and retail demand.
Record high exchange inventories continued to grow to 400m oz (~40% above recent highs) as markets priced in cascading global manufacturing and economic sudden stops leading to a recession in Western economies.
The known inability for the majority of the industry/producers to self-regulate supply, given Silver is by-product by nature (~65% of supply) creates addition-al headwinds. While other industrial metals have witnessed some supply response (S.A PGM producers on lockdown, some Latam Gold & Base metals producers curbing operations), there is no primary supply response in Silver.
The “return to cash costs” is a common theme that is party attributable to Silver (the all-in sustaining cost for primary Silver production in 2019 was $10.40); other methods to find sustainable floors in the short-term includes the model-implied Silver price with WTI at $22.50, putting it at $10.15
However, viewing silver through a precious lens, and given the overall very constructive Gold backdrop, its outlook should improve in the medium-longer-term. Increasingly lower yields, a slowing global growth outlook & uncertainty around the COVID-19 recovery, and unprecedented stimulus measures will drive decent demand for cheap precious or real asset exposure.

9
April 7, 2020
Commodities Strategy | Metals Quarterly / Monthly

10
April 7, 2020
Commodities Strategy | Metals Quarterly / Monthly
PGMs: the PGM Basket rose to new all time highs (due to byproduct strength but mostly ZAR weakness) of almost R30,000/oz, with major supply disruptions in S.A and ongoing logistical and transportation issues more than offsetting the negative demand impact of lockdowns and auto plant closures. Historically and relatively tighter metals (Palladium & Rhodium) are to remain super volatile with availability sporadic and tight, while Platinum's surplus is due to narrow
Platinum & Palladium put in a set of diverging and volatile performances in March with both coming under indiscriminate selling pressure in the 1st half, while Palladium was able to put in a “U”-shaped price recovery back up toward $2500, Platinums recovery was meek only rebounding through $700, after reaching dipping below 18year lows of $600.
The PGM industry saw a series of significant fundamental headlines and developments in March (Anglos converter explosion, BASFs 3way autocatalyst, large-scale auto plant shutdowns starting in China and not ending in Detroit, changes in Nornickels supply split output etc). The most significant develop-ment was South Africa announcing all mines to close for 21days due to a national lockdown. Overall, a very rough estimate indicates that a 21day shut-down of ALL operations in SA would result in a ~250K oz PT, 150k oz Pd & ~40K oz of Rhodium losses (which excludes the AMS force majeure which is expected to further impact production as it extends for much longer than 3 weeks). The risk is that further force majeures together with transportation and logistical difficulties impact the flow of material even further, which more than offsets the demand impact.
This affected/s the entire mining supply chain (primary production halted, refining & smelting operations on care & maintenance) that had an immediate effect on PGMs as its likely only a matter of weeks until WIP/ inventories are run down. Even with a ramp-up in Q2’20 after Easter, capacity won’t be oper-ating at 100% until perhaps Q3’20 which will likely be associated with some forced restructuring.
The sudden economic stop and shutdown of auto production and plants across predominantly Europe, S.A and US is largely viewed as temporary with the impact on both PGM demand (due to falling car sales) expected to hit hard in 1H’20; global auto sales in February have already dropped by > 20% YoY, vs Jan -10% YoY NSA, Chinas bottom was an -82% YoY drop seen in Feb with global auto sales likely to worsen in March AND April. However, note Chinas production lines are ramping back up (to ~40% capacity) and South Korea is also slowly starting up with even US & European automakers looking to se-cure (necessary) supplies in anticipation of a recovery later in the year.
Platinum lease rates have spiked (1m proxy at its highest level since 2008) and the curve has moved into a back (also first t ime since 2008) due to 1) the S.A lockdown, 2) perhaps some preemptive substitution from consumers (after the BASF announcement), 3) the return of the Chinese jewellery & invest-ment bod (SGE turnover has ramped up) , 4) further investment demand for ingots, 5) industrial user switching from leasing to outright buying.
Investors in platinum deleveraged a chunky 1.5m oz of Platinum throughout March (predominantly COT outflows) versus relatively smaller outflows in Pal-ladium of 500K oz (360K z of COT outflows vs ETF outflows of 140K oz). Overall, Palladium ETF & warehouse stocks have withdrawn ~140K oz of metal in March - that's large and precursor of further tightness. On the contrary, its tough to decipher whether Platinums 140k oz of ETF outflows is purely inves-tor liquidation (on price underperformance) or due to some recent tightening trends
Usually in bear risk markets or saturated commodity markets, there is asymmetric response to the fear of demand, over the fear of supply. I.E: in the short-term, the uncertainty over further demand destruction will negatively hang over platinum rallies, while it will likely have the opposite effect on Palladium & Rhodium (by inducing the little demand to be brought forward and tightening balances in the short-term). Any potential downside in PGMs is being curbed by arguably larger supply cuts due to S.A being on lockdown but that may change if national lockdowns are extended and auto plants remain offline for longer impacting demand side (more than supply).

11
April 7, 2020
Commodities Strategy | Metals Quarterly / Monthly

12
April 7, 2020
Commodities Strategy | Metals Quarterly / Monthly
Net COT Contracts ETF oz Net COT oz Total oz
2/28/2020 230,846 86,889,418 23,084,600 109,974,018
3/31/2020 157,409 90,538,605 15,740,900 106,279,505
Difference (73,437) 3,649,187 (7,343,700) (3,694,513)
% Change -31.81% 4.20% -31.81% -3.36%
Net COT Contracts ETF oz Net COT oz Total oz
2/28/2020 61,689 618,528,415 308,445,000 926,973,415
3/31/2020 14,011 648,873,994 70,055,000 718,928,994
Difference (47,678) 30,345,579 (238,390,000) (208,044,421)
% Change -77.29% 4.91% -77.29% -22.44%
Net COT Contracts ETF oz Net COT oz Total oz
2/28/2020 33,976 3,483,532 1,698,800 5,182,332
3/31/2020 10,999 3,146,310 549,950 3,696,260
Difference (22,977) (337,222) (1,148,850) (1,486,072)
% Change -67.63% -9.68% -67.63% -28.68%
Net COT Contracts ETF oz Net COT oz Total oz
2/28/2020 4,366 566,074 436,600 1,002,674
3/31/2020 753 424,875 75,300 500,175
Difference (3,613) (141,199) (361,300) (502,499)
% Change -82.75% -24.94% -82.75% -50.12%
Palladium
Gold
Silver
Platinum

13
April 7, 2020
Commodities Strategy | Metals Quarterly / Monthly
The information contained in this presentation is being provided for information and discussion purposes only. An investment decision should not be made solely on the basis of the contents of this
presentation. This presentation is being provided upon the express understanding that no representation or warranty, express or implied, is made, or responsibility of any kind accepted, by The Bank
of Nova Scotia, Scotiabank Europe plc, or any of their respective affiliates (“Scotiabank”TM), their directors, agents or employees with respect to the completeness or accuracy of the information, con-
clusions and opinions provided herein, or as to the achievement or reasonableness of any projections, targets, estimates, or forecasts and nothing in this presentation should be relied upon as a prom-
ise or representation as to the future. Past performance or simulated past performance is not a reliable indicator of future results. Forecasts are not a reliable indicator of future performance.. This
presentation has not been prepared (i) by a member of the research department of Scotiabank, or (ii) in accordance with the legal requirements designed to promote the independence of investment
research. It is considered a marketing communication for regulatory purposes and is solely for the use of sophisticated institutional investors. This presentation does not constitute investment advice or
any personal recommendation to invest in a financial instrument or “investment research” as defined by the UK Prudential Regulation Authority and the UK Financial Conduct Authority, and its content
is not subject to any prohibition on dealing ahead of the dissemination of investment research.
The information contained in this presentation reflects prevailing conditions and our judgment as of the date of the presentation, all of which are subject to change or amendment without notice, and
the delivery of any such amended information at any time does not imply that the information (whether amended or not) contained in this presentation is correct as of any time subsequent to its date.
Scotiabank undertakes no obligation to update or correct any information contained herein or otherwise to advise as to any future change to it. Scotiabank does not provide any applicable tax, ac-
counting or legal advice and in all cases independent professional advice should be sought in those areas.
This presentation incorporates information which is either non-public, confidential or proprietary in nature, and is being furnished on the express basis that this information will not be used in a manner
inconsistent with its confidential nature or be disclosed to anyone other than as may be required by law or to those who have been informed of the confidential and proprietary nature of this presenta-
tion. This presentation and its contents are strictly confidential to the person to whom it is delivered and may not be copied or distributed in whole or in part or disclosed by such persons to any other
person without the prior written consent of Scotiabank. This presentation and the information contained herein remain the property of Scotiabank.
This presentation is not and shall not be construed as an offer, invitation, recommendation or solicitation to sell, issue, purchase or subscribe any securities or bank debt in any jurisdiction or to enter
into any transaction. Nothing in this document contains a commitment by Scotiabank to sell, issue, purchase or subscribe for financial instruments, or securities, to provide debt or to invest in any way
in any transaction described herein, or otherwise provide monies to any party. Any participation by Scotiabank in any transaction would only be provided in writing after satisfactory legal, financial, tax,
accounting and commercial due diligence, as well as being subject to internal approval processes. Any transaction implementing any proposal discussed in this document shall be exclusively upon
the terms and subject to the conditions set out in the definitive agreement related thereto.
This presentation is not directed to or intended for use by any person resident or located in any country where the distribution of such information is contrary to the laws of such country. Scotiabank, its
directors, officers, employees or clients may currently or from time to time own or hold interests in long or short positions in any securities referred to herein, and may at any time make purchases or
sales of these securities as principal or agent. Scotiabank may also have provided or may provide investment banking, capital markets or other services to the companies referred to in this presenta-
tion.
TM Trademark of The Bank of Nova Scotia. Used under license, where applicable. Scotiabank, together with "Global Banking and Markets", is a marketing name for the global corporate and invest-
ment banking and capital markets businesses of The Bank of Nova Scotia and certain of its affiliates in the countries where they operate, including Scotia Capital Inc., Scotia Capital (USA) Inc., Sco-
tiabanc Inc.; Citadel Hill Advisors L.L.C.; The Bank of Nova Scotia Trust Company of New York; Scotiabank Europe plc; Scotiabank (Ireland) Designated Activity Company; Scotiabank Inverlat S.A.,
Institución de Banca Múltiple, Scotia Inverlat Casa de Bolsa S.A. de C.V., Scotia Inverlat Derivados S.A. de C.V. – all members of the Scotiabank Group and authorized users of the mark. The Bank of
Nova Scotia is incorporated in Canada with limited liability. Scotia Capital Inc. is a member of CIPF. Scotia Capital (USA) Inc. is a registered broker-dealer with the SEC and is a member of the NASD
and SIPC. The Bank of Nova Scotia is authorised and regulated by the Office of the Superintendent of Financial Institutions of Canada. Scotia Capital Inc. is authorised and regulated by the Invest-
ment Industry Regulatory Organization of Canada. The Bank of Nova Scotia and Scotiabank Europe plc. are authorised by the UK Prudential Regulation Authority. The Bank of Nova Scotia is subject
to regulation by the UK Financial Conduct Authority and limited regulation by the UK Prudential Regulation Authority. Scotiabank Europe plc is regulated by the UK Financial Conduct Authority and the
UK Prudential Regulation Authority. Details about the extent of The Bank of Nova Scotia 's regulation by the UK Prudential Regulation Authority are available upon request. Scotiabank Inverlat, S.A.,
Scotia Inverlat Casa de Bolsa, S.A. de C.V., and Scotia Derivados, S.A. de C.V., are each authorized and regulated by the Mexican financial authorities.
14
April 7, 2020
Commodities Strategy | Metals Quarterly / Monthly
The information contained in this presentation is being provided for information and discussion purposes only. An investment decision should not be made solely on the basis of the contents of this
presentation. This presentation is being provided upon the express understanding that no representation or warranty, express or implied, is made, or responsibility of any kind accepted, by The Bank of
Nova Scotia, Scotiabank Europe plc, or any of their respective affiliates (“Scotiabank”TM), their directors, agents or employees with respect to the completeness or accuracy of the information, conclu-
sions and opinions provided herein, or as to the achievement or reasonableness of any projections, targets, estimates, or forecasts and nothing in this presentation should be relied upon as a promise
or representation as to the future. Past performance or simulated past performance is not a reliable indicator of future results. Forecasts are not a reliable indicator of future performance.. This presenta-
tion has not been prepared (i) by a member of the research department of Scotiabank, or (ii) in accordance with the legal requirements designed to promote the independence of investment research. It
is considered a marketing communication for regulatory purposes and is solely for the use of sophisticated institutional investors. This presentation does not constitute investment advice or any person-
al recommendation to invest in a financial instrument or “investment research” as defined by the UK Prudential Regulation Authority and the UK Financial Conduct Authority, and its content is not sub-
ject to any prohibition on dealing ahead of the dissemination of investment research.
The information contained in this presentation reflects prevailing conditions and our judgment as of the date of the presentation, all of which are subject to change or amendment without notice, and the
delivery of any such amended information at any time does not imply that the information (whether amended or not) contained in this presentation is correct as of any time subsequent to its date. Sco-
tiabank undertakes no obligation to update or correct any information contained herein or otherwise to advise as to any future change to it. Scotiabank does not provide any applicable tax, accounting
or legal advice and in all cases independent professional advice should be sought in those areas.
This presentation incorporates information which is either non-public, confidential or proprietary in nature, and is being furnished on the express basis that this information will not be used in a manner
inconsistent with its confidential nature or be disclosed to anyone other than as may be required by law or to those who have been informed of the confidential and proprietary nature of this presenta-
tion. This presentation and its contents are strictly confidential to the person to whom it is delivered and may not be copied or distributed in whole or in part or disclosed by such persons to any other
person without the prior written consent of Scotiabank. This presentation and the information contained herein remain the property of Scotiabank.
This presentation is not and shall not be construed as an offer, invitation, recommendation or solicitation to sell, issue, purchase or subscribe any securities or bank debt in any jurisdiction or to enter
into any transaction. Nothing in this document contains a commitment by Scotiabank to sell, issue, purchase or subscribe for financial instruments, or securities, to provide debt or to invest in any way
in any transaction described herein, or otherwise provide monies to any party. Any participation by Scotiabank in any transaction would only be provided in writing after satisfactory legal, financial, tax,
accounting and commercial due diligence, as well as being subject to internal approval processes. Any transaction implementing any proposal discussed in this document shall be exclusively upon the
terms and subject to the conditions set out in the definitive agreement related thereto.
This presentation is not directed to or intended for use by any person resident or located in any country where the distribution of such information is contrary to the laws of such country. Scotiabank, its
directors, officers, employees or clients may currently or from time to time own or hold interests in long or short positions in any securities referred to herein, and may at any time make purchases or
sales of these securities as principal or agent. Scotiabank may also have provided or may provide investment banking, capital markets or other services to the companies referred to in this presentation.
TM Trademark of The Bank of Nova Scotia. Used under license, where applicable. Scotiabank, together with "Global Banking and Markets", is a marketing name for the global corporate and investment
banking and capital markets businesses of The Bank of Nova Scotia and certain of its affiliates in the countries where they operate, including Scotia Capital Inc., Scotia Capital (USA) Inc., Scotiabanc
Inc.; Citadel Hill Advisors L.L.C.; The Bank of Nova Scotia Trust Company of New York; Scotiabank Europe plc; Scotiabank (Ireland) Designated Activity Company; Scotiabank Inverlat S.A., Institución
de Banca Múltiple, Scotia Inverlat Casa de Bolsa S.A. de C.V., Scotia Inverlat Derivados S.A. de C.V. – all members of the Scotiabank Group and authorized users of the mark. The Bank of Nova Sco-
tia is incorporated in Canada with limited liability. Scotia Capital Inc. is a member of CIPF. Scotia Capital (USA) Inc. is a registered broker-dealer with the SEC and is a member of the NASD and SIPC.
The Bank of Nova Scotia is authorised and regulated by the Office of the Superintendent of Financial Institutions of Canada. Scotia Capital Inc. is authorised and regulated by the Investment Industry
Regulatory Organization of Canada. The Bank of Nova Scotia and Scotiabank Europe plc. are authorised by the UK Prudential Regulation Authority. The Bank of Nova Scotia is subject to regulation by
the UK Financial Conduct Authority and limited regulation by the UK Prudential Regulation Authority. Scotiabank Europe plc is regulated by the UK Financial Conduct Authority and the UK Prudential
Regulation Authority. Details about the extent of The Bank of Nova Scotia 's regulation by the UK Prudential Regulation Authority are available upon request. Scotiabank Inverlat, S.A., Scotia Inverlat
Casa de Bolsa, S.A. de C.V., and Scotia Derivados, S.A. de C.V., are each authorized and regulated by the Mexican financial authorities.


![Introduction - QUANTITATIVE RESEARCH AND TRADINGjonathankinlay.com › wp-content › uploads › Canonical...ETFs = TemporalData[ETFs] DateListPlot[ETFs] TemporalData 2008 2010 2012](https://img.pdfslide.us/doc/110x75/60be3b7b4d2c2d25820ec04a/introduction-quantitative-research-and-t-a-wp-content-a-uploads-a-canonical.jpg)