Embed Size (px)
Citation preview
1
COMMODITIES, PRICES AND RISK
THE CHANGING MARKET FOR NON-SLAVE PRODUCTS IN PRE-
ABOLITION IN WEST AFRICA
African economic history working paper series
No. 31/2016
Angus Dalrymple Smith, Wageningen University
Pieter Woltjer, Wageningen University

2
ISBN 978-91-981477-9-7
AEHN working papers are circulated for discussion and comment purposes. The papers have not been peer reviewed, but published at the discretion of the AEHN committee.
The African Economic History Network is funded by Riksbankens Jubileumsfond, Sweden

3
Commodities, Prices and Risk: The changing markets for non-slave products in pre-abolition West Africa
“…..procure some Palm Oil on reasonable terms which is likely to bear a great price here, we therefore wish you to purchase as much as you can with any of the cargo you may
have……”
Instructions from Thomas Leyland, Liverpool Merchant, to the captain of the slave ship Enterprise, 18031
Angus Dalrymple-Smith Wageningen University
Pieter Woltjer Wageningen University2
1. Introduction
In the decades before the abolition of the British slave trade in 1807, those campaigning for an end to the traffic in Africans to the Americas made regular mention of the potential for trade in ‘legitimate commerce’.3 They seemed to have shared the assumption with a number of modern scholars, in particular Rodney (1972) and Inikori (2007, 2011) that the transatlantic slave trade had effectively crowded out other forms of commerce and that these therefore required an active change in the way commerce with Africa was conducted by British merchants. However, some contributors to a recent volume (Law et al. 2013) have suggested that this may not have been the case. In the introduction, Law et al. argue that the trade in commodities continued and even grew in absolute, if not relative terms, throughout the 18th century (p10). Later in the same book Austin (2013) argues that from the 1780s the supply of slaves was generally falling while prices were rising suggesting that either supplies of captives were declining or there was a competing demand for slave labour in Africa (Whatley 2014). The former argument certainly fits the ‘gun-slave cycle’ thesis in which rising demand for slaves triggers more violence through slave raiding and warfare. This in turn led to more effective defences from those who were being raided which increased the costs of acquiring slaves who needed to be taken from ever increasing distances from the coast (Klein 2001). The demand side thesis is based on work by
1 LRO 387 MD 43 Leyland to Capt Caesar Lawson 18 July 1803 2 We gratefully acknowledge comments by the participants of the African Economic History Network, Wageningen 2015 and European Social Science History Conference in Valencia 2016. In particular, we thank Robin Law, Gareth Austin, Filipa Ribeiro da Silva, Ewout Frankema and Elise van Nederveen Meerkerk on previous versions of this paper. The research was supported by grants from the European Research Council and the Dutch Science Organisation (NWO, no. 276-53-005). We thank Anna van Dam for excellent research assistance. 3 See in particular Equiano (1794, pp356 – 358), Clarkson (1788, pp8 – 23)

4
Searing (2003, pp130 - 155) who argues that slave exports from the Senegambian region began to compete with local demands for slave labour. These included coastal industries such as salt and fishing, commercial agriculture further inland for export to the drier savannah and desert regions and the production of gum in the interior. A combination of famine and warfare exacerbated labour shortages which gradually diminished the pool of potential captives for export. Austin suggests that in certain parts of West Africa demand for coerced labour for agriculture, production of finished goods and mining may have begun to compete with the commerce in slave exports. For example, Lynn (1997, pp12,13) notes that palm oil exports were increasing in the regions around the Bight of Biafra from the 1760s. The reduction in the numbers of available slaves would therefore have pushed up prices.
However, as Austin (2013, p250) acknowledges, this hypothesis is not based on any firm data and even Searing’s conclusions are by his own admission, indirect. What is currently lacking in the literature is accurate quantitative data on the non-slave trade with Africa, which can be applied to a regional analysis of trade patterns, in the pre-abolition period. At present, the only quantitative data that exists on the non-slave trade with Africa are the statistics on British trade compiled by Johnson et al. (1990), which are based on the custom ledgers held at the National Archives in London. These ledgers contain the total recorded imports, exports and re-exports at Britain’s principal ports from 1699. They may not be the ideal source as they cannot account for smuggling, clerical errors, tax evasion and the fact that many ships bought and sold goods in other European countries. However, they still represent the most complete record of Africa’s commodity trade for the 18th century (Johnson et al. 1990, p8). Johnson’s work was a heroic achievement involving the inputting of between 30 and 35 thousand items of data onto individual punch cards which were then inputted onto a 1980s computer (Johnson et al. 1990, pp6-8). However, while providing a very useful overview of Britain’s commodity trade, the data has a number of significant limitations. Firstly, the precise volumes of goods are not recorded neither are current prices given. Instead, the official prices listed in the ledgers are used, which provide, as we argue below, a rather inaccurate picture of the actual patterns of trade. The records also do not provide any specific geographical details as the customs records, until the 19th century, did not record from which regions commodities were bought (Johnson et al. 1990, p 49). This in itself is not an unsurmountable hurdle as most of the commodities produced tended to come from specific regions. For example, gum senegal was almost exclusively bought from Senegambia (Webb 1985). However, Johnson aggregated the products under certain categories making it hard to know with any certainty where goods were coming from. For example, the ledgers list several different types of gums including gun animi, gum Arabic and gum copal, all of which sourced from different areas.
This chapter seeks to provide a dataset which offers two important improvements on the work of Johnson. Firstly, we provide a far better, if not entirely precise, geographical breakdown of regional patterns of trade. Individual commodities are disaggregated and recorded individually allowing us to better estimate where they came from.4 In addition, we have used new data from 4 The Johnson et al. (1990) dataset provides very little information about the geographical origin of the goods. This is in part because the customs records do not record where items were bought but also because goods are aggregated into groups. For example, Camwood, a product which almost exclusively came from Sierra Leone and Barwood/Redwood, which was sourced on the eastern side of African West Coast are listed together under
5
Eltis (2013) which records details of over 2,000 voyages undertaken by specialist commodity vessels which went to Africa to trade for non-slave products between the 1560s and 1807. By combining this data with our own, we are able to provide a more geographically precise analysis of the patterns of the non-slave trade as well as a better understanding of its operation and relationship to the slave trade. Secondly, we have constructed a time series of prices for commodities in both Africa and Europe over the 18th century. These, combined with the recorded volumes of goods, provide a far more accurate figure for the real value of the commodity trade and to understand how changing markets within the Atlantic world influenced the decisions of both African and European merchants.
Our paper also seeks to contribute to a growing body of literature which seeks to better understand the development of British trade with Africa in the 18th century. Behrendt (2001) has argued that patterns of trade were determined by changes in the climatic and agricultural seasons in Europe, Africa and the Americas and better supplies of food in certain regions such as the Gold Coast and the Bight of Biafra might have also played a role in the growth of slave exports (Dalrymple-Smith and Frankema 2016). The nature of credit systems in Africa (Lovejoy and Richardson 2004) and between the Caribbean and Europe (Radburn 2015) may have influenced where slaves were embarked and sold. Other studies have examined the rise of the slave trade in Liverpool and how investments in human capital5 and risk management strategies allowed this port to assume such a dominant position in the second half of the 18th century (McDade 2011, Richardson et al 2007, Haggerty (2009). One area that has been the subject of relatively little research during the apogee of the West African transatlantic slave trade in the later 18th century is the interaction between the trade in slaves and commodities. Non-slave products, such as ivory gold and pepper had been at least as important as slaves to British merchants until the late 17th century (Eltis 1994, Van den Boogaart 1992) and ‘legitimate commerce’ became, at least the in theory, the only items of trade with Britain after 1808. However, to date no study has quantitatively examined how the commodity trade developed and how it interacted with the trade in captives in the 18th century. This paper will be the first to provide an analysis of the patterns and growth of Africa’s non-slave exports to Britain in the decades before abolition.
Our results show that from the late 1770s, there appears to have been a significant shift in the focus and volume of commodity trading. From 1770 to 1808 there was a four-fold increase in the volume of non-slave goods traded substantially more than official figures indicate. Furthermore, and contrary to what current literature suggests (Law et al. 2013, pp9/10), the growth in the commodity trade was actually greater than that for slaves. Secondly, we show that the geographic focus of the commodity trade changed from one dominated by products from the western Senegambian region to one where the eastern side of the West African coast
‘dyestuffs’. Gums were overwhelmingly purchased in Senegambia (Curtin 1975), while palm oil, aggregated under ‘Oils and Fats’ most likely came almost exclusively from the regions around the Bight of Biafra (Lynn 1997). By entering each product separately, we solve the aggregation issue and with reference to other sources and literature can estimate, with reasonable accuracy, where the goods came from. Furthermore, through the use of a new dataset on specialist bilateral ships by Elits (2013), we are also able to show how the business of commodity trading developed over the 18th century. 5 In particular, knowledge of local African markets and the development of relations with merchants with contacts in the interior
6
became considerably more important. Our data indicates that until the 1770s the commodity trade with Africa (with the important exception of gold) was largely in the hands of specialist bilateral traders, principally working from London, focusing on Senegambia and in particular the gum trade. However, political and military events in the wider Atlantic region caused this trade to considerably diminish. From this point a far greater share of African commodities were being imported from the regions around the Bight of Biafra on the Eastern side of the coast. Thirdly we argue this it was principally slave traders, not specialist commodity merchants that were responsible for the purchasing these products. To our knowledge, this is the first time that this pattern has been both identified and quantitatively analysed.
The structure of the paper is as follows. Section two sets out our methodological and data contributions to the literature on trade with West Africa in the pre-abolition period. In section three we describe our main results with regard to the changing volume, structure and nature of Britain’s commodity trade over the course of the 18th century. We then seek to explain two important questions. Firstly, why it was that demand seemed to be growing for African products. Secondly why was it slave traders, and more specifically those going to the regions around the Bight of Biafra, not specialist bilateral commodity merchants, so motivated to purchase commodities in such increasing volumes. Firstly, we argue in British consumers during this period began purchasing increasing quantities of finished manufactures which required the primary products found across West Africa. Secondly commodity traders then seem to have been effectively crowded out of the new market by slave traders attracted to non-slave products. We suggest three reasons why this might have been the case. To begin with, slave traders began to face pressure to reduce crowding on their ships which may have encouraged them to buy other products to compensate. Secondly, the mark up on commodities was especially favourable. Prices at the coast seemed to have remained relatively stable, largely due to the fact that the most of commodities bought by Europeans, unlike slaves, were not particularly valuable in Africa. Furthermore, some merchants may have been using commodities as a means of attracting more business from slave ships and therefore were not motivated to raise prices. However, the value of ivory, palm oil and dyewoods was rising dramatically in Europe, probably due to inflationary pressures caused by warfare and due to increasing demand. Finally, commodities may have offered slave traders a means of reducing their credit risks as they could realise their profits much faster on non-slave products.
For this thesis, the most important result is that in the period before abolition there was rising demand in the Atlantic region for non-slave goods. Our data certainly suggests that these goods were coming in increasing quantities from the eastern end of the coast. However, the data does not allow us the level of precision necessary to compare exactly how the Gold Coast, Benin or regions around the Bight of Biafra responded to changing levels of demand over the 18th century. For this it is necessary to turn to other data and sources which will be the subject of the next chapter.
7
2. Methodology and data
To analyse the flow of commodities between Africa and Europe over the 18th century, we need a measure of the value of trade that is independent of changes in prices or changes in the value of the British Pound. The work of Marion Johnson et al (1990) on the English customs records does this through a so-called quantum index, which weights the quantities of commodities traded for each year on the basis of fixed, base period prices.6 These base period prices were based almost exclusively on official prices which were set in the late 17th century. This means that all goods imported and exported over the 18th and early 19th century were assigned a single, ‘official’ price by the customs, which was left unchanged for over a century and a half.7 This does make the value of import and export flows comparable over time. Unfortunately, the official prices turn out to be unrepresentative for the actual prices observed during the later years.
Index-number theory shows that fixing the base-period prices to a single year can cause serious distortions, particularly if this is done over long periods of time. This so-called ‘substitution bias’ is the result of consumers substituting away from goods when they increase in relative price and vice versa (Ehemann 2007, pp. 256-7). An index that relies on weights from some past period will thus overweight the goods that have decreased in price and underweight those that have suffered price increases, biasing the quantum index in the process. Table 1 provides a summary of the average prices observed for four important African commodities over several decades and compares them to the official prices.
6 Note that such a quantum index does not necessarily measure changes in volume or weight, instead it allows one to compare the ‘real’, total value of a range of goods over time. 7 Note that throughout this paper imports will refer to goods entering Britain, exports will refer to goods entering Africa.

8
Table 1. Average import prices vs official prices, 1730s-1810s
Decade Ivory Palm oil Beeswax Redwood (£/cwt) (£/cwt) (£/cwt) (£/ton)
1730s 5.3 2.2 2.8 3.7 1740s 5.8 2.6 2.8 6.2 1750s 7.1 2.8 3.4 2.8 1760s 10.0 3.3 3.3 2.3 1770s 14.9 3.0 3.4 2.1 1780s 15.7 4.1 4.6 2.0 1790s 11.8 4.9 5.4 2.6 1800s 21.9 5.9 6.7 4.5 1810s 23.5 2.8 9.2 5.5 Official 6.00 1.00 4.75 40.00 Sources: Johnson et al. (1990), see Table 3 for sources on current prices.
Clearly, the official prices – both in absolute and in relative terms – differed substantially from the observed prices, particularly for the later decades. Most notably for redwood, the official price does not correspond to the average prices observed from the 1730s onwards. What served as the basis for the official prices is not exactly clear, not even for the customs officers recording the trade flows at the end of the 18th century.8 In this study we revisit the English customs records and construct a quantum index that takes the changing prices into account, thus eliminating, or at least limiting the bias that plagues the official values used by Johnson et al. (1990). In addition, we will provide a much more detailed dataset of the commodities traded with Africa, which allows us to analyse the changing patterns of trade, both its composition and its geographical scope.
2.1 Quantum index
To re-estimate the real value, or so-called volume index of goods traded with Africa we augment the ‘official’ quantum index described above in two important respects. First, instead of weighting the various commodities by the official prices of 1697 we rely on nominal prices that were observed over the 18th and early 19th century. Second, we update these weights roughly every twenty years, linking the resulting separate indices using a procedure called
8 “The Estimates in this office by which the goods imported and exported are valued were made about the year 1697 probably by the first appointed officer, for the office was instituted in that year, upon what principle he formed his estimates it is difficult to ascertain at this day ….” TNA, CUST 17/12, 1790

9
‘chaining’. This chain index avoids the problem of out-of-date weights that currently plagues the available estimates of the volume of African trade.
Equation (1) provides an example of a basic, fixed-weight quantum index. This index captures the change in the volume (Q) of a composite basket of i goods between period 3 and the base period 0; p and q are the price and quantity of each good 𝑖𝑖 respectively.
𝑄𝑄𝐿𝐿 = ∑ 𝑝𝑝0𝑖𝑖𝑞𝑞3𝑖𝑖𝑖𝑖
∑ 𝑝𝑝0𝑖𝑖𝑞𝑞0𝑖𝑖𝑖𝑖
(1)
The fixed-weight volume index is thus the ratio of the total value of goods in period 3 measured at base-periods 0’s prices to the total value of goods in the base period itself. In this Laspeyres index, only prices for period 0 factor into the equation making it particularly sensitive to the choice of base-period. When there are substantial price changes over time, picking a different base year could significantly alter the results.
Equation (2) addresses this issue by linking a series of separate fixed-weight volume indices in which the base-period is continually changed. This chain index (Qc) still measures the change in aggregate volume between period 3 and the base period 0. This time, however, it does not rely solely on the base-period prices, it also factors in the prices for the intermittent periods 1 and 2 respectively.
𝑄𝑄𝐶𝐶 = �∑ 𝑝𝑝0𝑖𝑖𝑞𝑞1𝑖𝑖𝑖𝑖
∑ 𝑝𝑝0𝑖𝑖𝑞𝑞0𝑖𝑖𝑖𝑖� �
∑ 𝑝𝑝1𝑖𝑖𝑞𝑞2𝑖𝑖𝑖𝑖
∑ 𝑝𝑝1𝑖𝑖𝑞𝑞1𝑖𝑖𝑖𝑖� �
∑ 𝑝𝑝2𝑖𝑖𝑞𝑞3𝑖𝑖𝑖𝑖
∑ 𝑝𝑝2𝑖𝑖𝑞𝑞2𝑖𝑖𝑖𝑖� = �𝑄𝑄𝜏𝜏𝐿𝐿
3
𝜏𝜏=1
(2)
The volume index derived from equation (2) is no longer affected by the choice of base-period and will, if prices change over time, provide an answer different from the fixed-weight Laspeyres index in equation (1). A drawback of the chaining method, however, is that it is substantially more data-intensive. Whereas the fixed-weight method requires only a single set of prices, the chained volume index requires a different set of prices for each individual chain. Lacking prices for every year and product in our sample, instead of shifting weights every year, we shift weights every twenty years. We thus address the issue of out-dated weights while not posing too severe constraints on our dataset.
2.2 Data
To reconstruct the volume index of West African trade we need data on the quantity and prices of both imports originating from Africa and exports flowing into the region. For the quantities we rely on the British customs records (CUST) held at the National Archives in London. This source details the exact quantity of commodities traded between Britain and Africa on an annual basis in pounds, gallons, number etc. As opposed to the work of Johnson et al. (1990) we disregard the official prices, however, and do not sum the value of the individual products into
10
aggregate categories. This allows us to assign our own, up-to-date prices to these products as well as observe the composition of trade in full detail.
Our data on the prices of West African commodities is, to our knowledge the most extensive ever assembled for the 18th century. It includes 2,667 observations for the European market prices and 323 observations for prices on the West African coast, from a variety of British and Dutch merchant and government sources (see table 2).9 In order to get to a unit price for all of the goods and commodities it was necessary to standardise the weights and measures given in the sources.10 We converted all of our observations into either pounds (weight) or gallons (volume) and relied on Denzel (2010) to convert all currencies to British pounds.11 For British goods exported to Africa we have relied on the records of both crown protected12 and private traders13, supplemented by data on prices from secondary sources14, providing us with 1,464 observations for the period (Table 3). Lastly, for the prices of slaves in the Americas we have used the time series by Eltis et al. (2005) for the British Caribbean, and the yearly observations in the slave trade database of prices in Jamaica. For the African coast we rely on data by Lovejoy & Richardson (1995) and our own data on coastal slave prices from the records of the Middelburgse Commercie Compagnie from 1742 to 1803.15
9 For each of the price observations we have converted our data into a standard unit price of British £/lb, except for palm oil that is measured in British £/gallon and then taken an average price for the year. In years where we do not have observations we have extrapolated the price based on proxies and an estimation of the movement in the prices of goods. For our proxies we have relied on the dataset by Clark (2005) of the unit prices of goods in Britain. For palm oil we have used oil lamp and soap, the two products often manufactured from Palm Oil (see Lynn 2002). For African dyewoods we have used the series Wood, for Beeswax: Candles and for Maluguetta Pepper: Pepper 10 In the 18th century there was no standard system of measurement, so for example the weights used to measure goods in the Dutch town of Middleburg were different to those of Amsterdam. In the British sources beeswax could be listed as cakes, lbs or barrels and cloth might be given in yards or by weight. 11 The complete details of our workings and the full datasets are available on request from the authors. 12 The invoice books kept by the Company of Royal Adventurers Trading with Africa who ran the British Forts on the coast from 1768 - 1816. They received regular shipments of trade goods from England which were priced both by their prime unit cost in England and their price in Africa. 13 The account books of 28 Liverpool slave voyages from 1769 to 1808 14 Principally the time series of English prices by Clark (2005) 15 Our full datasets are available on request from the authors

11
Table 2. Observations of prices for African commodities, 1737-1816
Commodity Coast European
Market Total % of sample Beeswax 50 75 125 4.2 Gum 3 8 11 0.4 Ivory 197 2,439 2,636 88.2 Mallaguetta 24 8 32 1.1 Palm Oil 25 48 73 2.4 Redwood / Barwood 19 56 75 2.5 Camwood 1 14 15 0.5 Ebony 4 19 23 0.8 Total 323 2,667 2,990 100.0 Sources: Zeeuws Archief MCC, De Reizen 76 voyages, MCC Venduboeken 1738 - 1740, MCC Factuurboeken van verkochte retournen 1729 – 1736, LRO D/Dav Ivory Book, LRO D/Dav Waste Book, TNA T1/566, TNA T1/594 9 – 12, TNA T70/1583, TNA C107/6/11, Letter book, etc, of Robert Bostock 1779 - 1792 V1&2 LRO 387 MD 54/55, PP 1788 Report on the slave trade, PP 1816 (506) Report from the Select Committee on Papers Relating to the African Forts, Bennet & Brooks (1965), Sheriff (1987), Webb (1985)
Table 3. Observations of prices for British trade goods, 1768-1816
Trade Goods European
Market % of sample
Trade Goods European
Market % of sample Alcohol 96 6.6 Lead 32 2.2 Calico 29 2.0 Linen 108 7.4 Finished Cotton 103 7.0 Military Stores /Guns 116 7.9 Cowries 12 0.8 Pans / Rods 61 4.2 Gunpowder 76 5.2 Pewter 22 1.5 India Fabric 507 35.6 Tobacco 91 6.2 Iron 67 4.6 Woolens 105 7.2 Wrought Iron 39 2.7 Sources: TNA T70/928/929/930/931/932; LRO D/Dav Ships Accounts: Andromache & Hector 1769 – 1776, Swift, Deadnaught & Dalrymple 1772 – 1777, Lord Cassiles & May 1771 - 1776, Essex and Christopher 1784 – 1788, King George, King of Prussia 1767 - 1779, Preston 1780 - 1784, Quiote 1783 - 1785, Mars and Rover 1768 - 1787; LRO Thomas Leyland Records Account Books, La Convention 387 MD 40, Lottery 1798 – 1799 387 MD41, Lottery 1802 - 1811 387 MD 42, Enterprise 1803 – 1804 387 MD 43, Fortune 387 MD 44, TNA James Rogers Paper Morning Star C107/6 Notes: For certain products it is difficult to match them exactly to the categories in the Johnson dataset. We have therefore assumed Lead to equate to “Ball & Shot” as it was most commonly used in the creation of ammunition for muskets. Pans and Rods are equated to “Brass & Copper” and Pewter to “Other metals”.
12
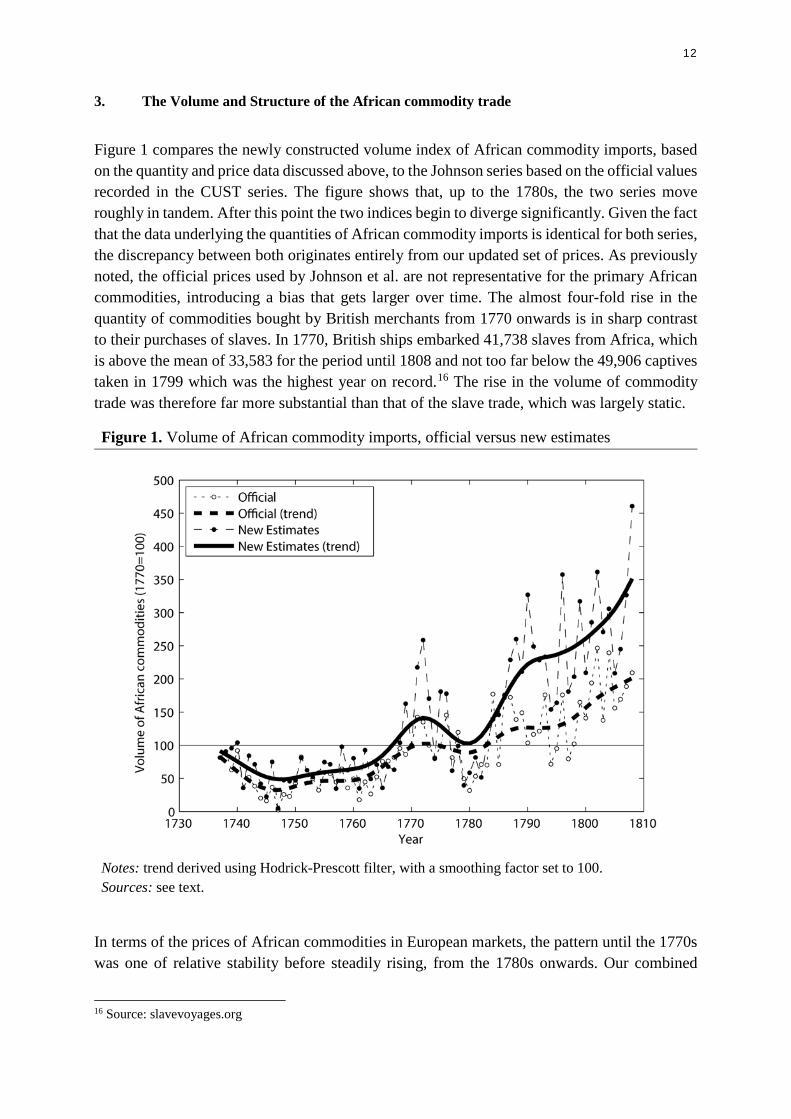
3. The Volume and Structure of the African commodity trade
Figure 1 compares the newly constructed volume index of African commodity imports, based on the quantity and price data discussed above, to the Johnson series based on the official values recorded in the CUST series. The figure shows that, up to the 1780s, the two series move roughly in tandem. After this point the two indices begin to diverge significantly. Given the fact that the data underlying the quantities of African commodity imports is identical for both series, the discrepancy between both originates entirely from our updated set of prices. As previously noted, the official prices used by Johnson et al. are not representative for the primary African commodities, introducing a bias that gets larger over time. The almost four-fold rise in the quantity of commodities bought by British merchants from 1770 onwards is in sharp contrast to their purchases of slaves. In 1770, British ships embarked 41,738 slaves from Africa, which is above the mean of 33,583 for the period until 1808 and not too far below the 49,906 captives taken in 1799 which was the highest year on record.16 The rise in the volume of commodity trade was therefore far more substantial than that of the slave trade, which was largely static.
Figure 1. Volume of African commodity imports, official versus new estimates
Notes: trend derived using Hodrick-Prescott filter, with a smoothing factor set to 100. Sources: see text.
In terms of the prices of African commodities in European markets, the pattern until the 1770s was one of relative stability before steadily rising, from the 1780s onwards. Our combined
16 Source: slavevoyages.org

13
indices of Africa prices show that by the beginning of the 19th century, commodity prices are growing faster and with less volatility than those of slaves (see Figure 2). This means that given the falling prices of the goods required to barter for goods on the coast17, by the time of abolition prices for commodities appeared to be more favourable than they were for slaves.
Figure 2. Price indices British trade with Africa
Sources: see text.
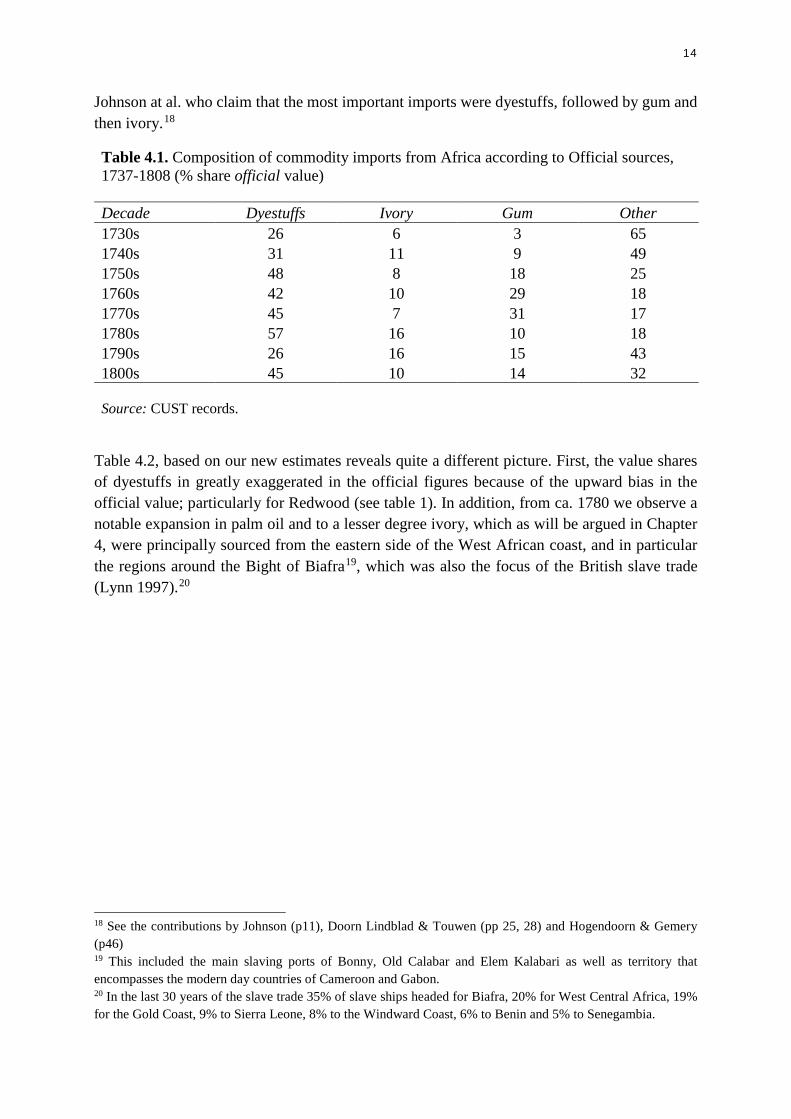
As for the origin and composition of the commodity trade, our data shows that there were two trends in the non-slave trade with Africa that have so far not been expressly noted in the literature. Firstly, there was a rapid growth in commodity trading in the eastern regions around the Bight of Biafra and secondly that it was largely slave traders who were responsible for the overall increase in the volume of the non-slave trade. The rapid expansion of commodity imports opened markets in Africa in areas that were previously focused on selling slaves. The new estimates, based on the revised price data discussed above, reveal that the composition of these commodity imports was quite different from the picture painted by Johnson et al. (1990), who rely on the official figures from the CUST records. Table 4.1 summarizes the findings by
17 We have assumed that commodities and slaves across West Africa are traded for a broadly similar range of goods. We do acknowledge that a different assortment of goods was required for some commodities, especially in the Cameroons and at Bonny. However, these tended to be low value items whose price trends mirrored those of our other goods.
14
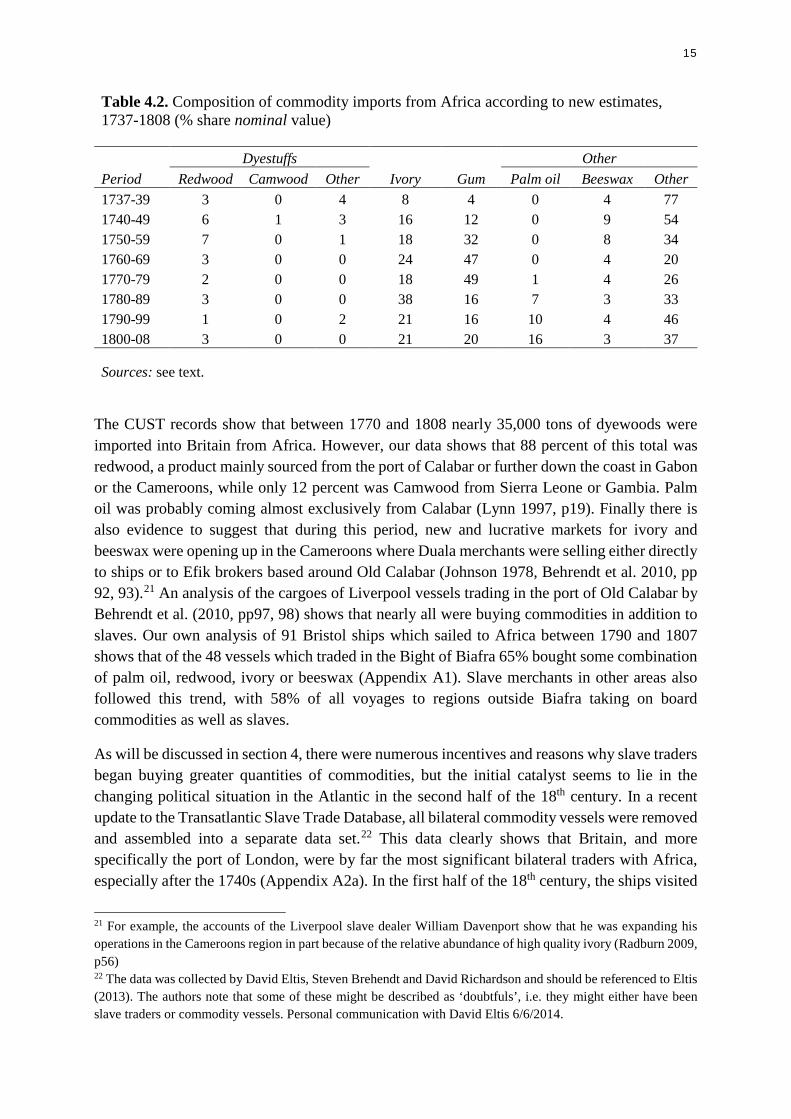
Johnson at al. who claim that the most important imports were dyestuffs, followed by gum and then ivory.18
Table 4.1. Composition of commodity imports from Africa according to Official sources, 1737-1808 (% share official value) Decade Dyestuffs Ivory Gum Other 1730s 26 6 3 65 1740s 31 11 9 49 1750s 48 8 18 25 1760s 42 10 29 18 1770s 45 7 31 17 1780s 57 16 10 18 1790s 26 16 15 43 1800s 45 10 14 32 Source: CUST records.
Table 4.2, based on our new estimates reveals quite a different picture. First, the value shares of dyestuffs in greatly exaggerated in the official figures because of the upward bias in the official value; particularly for Redwood (see table 1). In addition, from ca. 1780 we observe a notable expansion in palm oil and to a lesser degree ivory, which as will be argued in Chapter 4, were principally sourced from the eastern side of the West African coast, and in particular the regions around the Bight of Biafra19, which was also the focus of the British slave trade (Lynn 1997).20
18 See the contributions by Johnson (p11), Doorn Lindblad & Touwen (pp 25, 28) and Hogendoorn & Gemery (p46) 19 This included the main slaving ports of Bonny, Old Calabar and Elem Kalabari as well as territory that encompasses the modern day countries of Cameroon and Gabon. 20 In the last 30 years of the slave trade 35% of slave ships headed for Biafra, 20% for West Central Africa, 19% for the Gold Coast, 9% to Sierra Leone, 8% to the Windward Coast, 6% to Benin and 5% to Senegambia.
15
Table 4.2. Composition of commodity imports from Africa according to new estimates, 1737-1808 (% share nominal value) Dyestuffs Other Period Redwood Camwood Other Ivory Gum Palm oil Beeswax Other 1737-39 3 0 4 8 4 0 4 77 1740-49 6 1 3 16 12 0 9 54 1750-59 7 0 1 18 32 0 8 34 1760-69 3 0 0 24 47 0 4 20 1770-79 2 0 0 18 49 1 4 26 1780-89 3 0 0 38 16 7 3 33 1790-99 1 0 2 21 16 10 4 46 1800-08 3 0 0 21 20 16 3 37 Sources: see text.
The CUST records show that between 1770 and 1808 nearly 35,000 tons of dyewoods were imported into Britain from Africa. However, our data shows that 88 percent of this total was redwood, a product mainly sourced from the port of Calabar or further down the coast in Gabon or the Cameroons, while only 12 percent was Camwood from Sierra Leone or Gambia. Palm oil was probably coming almost exclusively from Calabar (Lynn 1997, p19). Finally there is also evidence to suggest that during this period, new and lucrative markets for ivory and beeswax were opening up in the Cameroons where Duala merchants were selling either directly to ships or to Efik brokers based around Old Calabar (Johnson 1978, Behrendt et al. 2010, pp 92, 93).21 An analysis of the cargoes of Liverpool vessels trading in the port of Old Calabar by Behrendt et al. (2010, pp97, 98) shows that nearly all were buying commodities in addition to slaves. Our own analysis of 91 Bristol ships which sailed to Africa between 1790 and 1807 shows that of the 48 vessels which traded in the Bight of Biafra 65% bought some combination of palm oil, redwood, ivory or beeswax (Appendix A1). Slave merchants in other areas also followed this trend, with 58% of all voyages to regions outside Biafra taking on board commodities as well as slaves.
As will be discussed in section 4, there were numerous incentives and reasons why slave traders began buying greater quantities of commodities, but the initial catalyst seems to lie in the changing political situation in the Atlantic in the second half of the 18th century. In a recent update to the Transatlantic Slave Trade Database, all bilateral commodity vessels were removed and assembled into a separate data set.22 This data clearly shows that Britain, and more specifically the port of London, were by far the most significant bilateral traders with Africa, especially after the 1740s (Appendix A2a). In the first half of the 18th century, the ships visited
21 For example, the accounts of the Liverpool slave dealer William Davenport show that he was expanding his operations in the Cameroons region in part because of the relative abundance of high quality ivory (Radburn 2009, p56) 22 The data was collected by David Eltis, Steven Brehendt and David Richardson and should be referenced to Eltis (2013). The authors note that some of these might be described as ‘doubtfuls’, i.e. they might either have been slave traders or commodity vessels. Personal communication with David Eltis 6/6/2014.
16
most parts of the coast in fairly even numbers although the primary destination was to have been the Gold Coast. The situation changed in the 1750s with a relatively rapid expansion of the bilateral trade with the Senegambia (Table 5). This is reflected in the customs records which show that during this period imports of gum, which was always Senegambia’s most important export (Webb 1985, p151), increased around 7 times to nearly 350,000 lbs in 1769.23 The reasons for this expansion seems to have been largely driven by a combination of politics and the fact that gum senegal was a uniquely attractive product. Gum comes from the exudate of some species of acacia tree which were only to be found in the Senegambian region.24 Gums were important in the production of paint, paper and in the cosmetics industries (Johnson et al. 1990, p48). However, the main use of gum senegal, was as a stabiliser in the dying industry and crucially there were no acceptable alternatives, which meant that controlling the source held out the prospect of a monopoly of a product crucial to one of the continent’s most important industries (Johnson et al. 1990, pp28,46, Inikori 1992, p397). 25
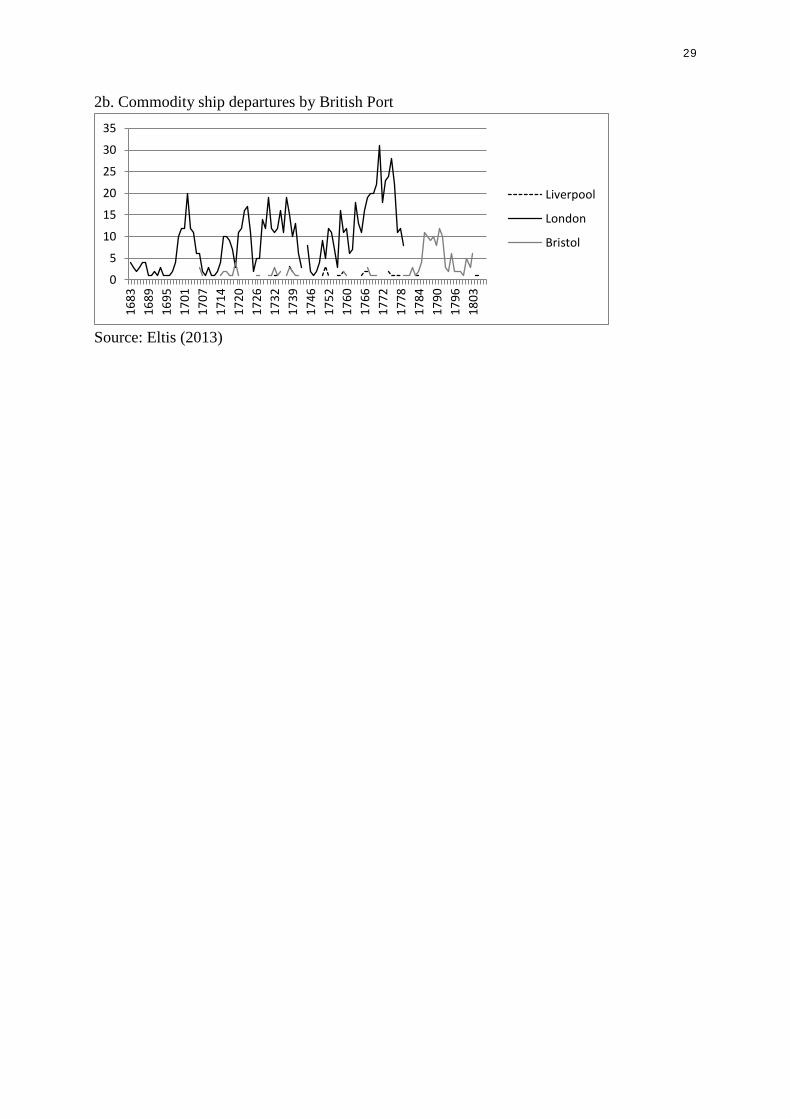
The British, with the active support of Manchester cotton manufacturers captured Senegambia’s principal port, Saint Louis in 1758 (Berg 2004, p 139, Inikori 1992, p398) which coincides with the rapid increase of gum imports. They were able to hold it until it was lost to the French in 1779 during the American wars of independence and bilateral trading to the region abruptly ceased (Table 5).26 This also led to a dramatic fall in investment in the specialist commodity trade with Africa. From this point, only the port of Bristol was active in sending a reduced number of non-slave ships to Africa (see Appendix 2b). These ships did not specialise in a particular region but instead adopted what was known as a ‘coasting strategy’ which involved sailing along the entire West African coast stopping at a number of different ports to purchase commodities (Lynn 1991, pp363 – 367, Lynn 1997, p88).27
23 Our data shows that gum imports would only exceed this total during a single year in 1840. The customs records also indicate that beeswax and ivory, both products found in the Senegambian, were also imported in greater numbers during the period when bilateral trading was expanding in the region. 24 During the period of this study the source for almost all of the gum imported came from around the Senegal river valley (Webb (1985, p 153). 25 The value of the trade can also be seen in the importance attached to retaining control of Senegambia during peace talks after the Seven Years War and the American war of Independence. The chief French negotiator in 1763 was told that “La traite de la gomme est l’objet le plus pressant qui fait cherir aux Anglais la possession du Senegal et qui rend sa restitution d’autant plus instante.” Britain’s representative at negotiations in the 1780s noted that “The real importance of Senegal arises almost wholly from its gum trade. There was imported in one year about 700 tons, and the average annual imports may be computed at about 400 tons. The price is now £270 - £270 / ton….there is more speculation or rather gaming in this article than in any other.” Quoted in Inikori (1992, pp399 &401). 26 The value of the trade can also be seen in the importance attached to retaining control of Senegambia during peace talks after the Seven Years War and the American war of independenceInikori (1992, pp399 &401). 27 The future abolitionist and scribe of ‘Amazing Grace’ John Newton describes such a voyage (Newton 1765, p83). It was also followed by the commodity ships of the Dutch Middleburgse Commercie Companie who typically traded first along the Windward Coast, then travelled to the Gold Coast and along to the Cameroons and Gabon (see for example, Zeeuws Archief MCC 196, 201 Afrikaanse Galey, 1149, 1168 De Vliegende Faam, 1371, 1379 Zanggodin)

17
Table 5. British commodity vessels’ destinations, 1650-1808 1650-
1700 1700-1719
1720-1739
1740-1759
1760-1779
1780-1808
Senegambia 28 9 48 49 268 3 Sierra Leone 12 17 27 9 5 15 Windward Coast 3 0 0 8 6 6 Gold Coast 2 19 50 11 1 14 Bight of Benin 0 0 20 0 4 0 Bight of Biafra 0 0 1 0 3 13 West Central /South East Africa 0 3 9 20 7 1 Unknown 25 128 173 116 102 70 Total 70 176 328 213 396 122 Source: Eltis (2013).
This decline in the bilateral commodities trade with Senegambia coincided with the aforementioned expansion of the overall quantity of the non-slave trade in the regions around the Bight of Biafra. After the end of the American War of Independence, the quantity of commodities imported from Africa recovered to pre-war levels only to fall again after the outbreak of the French revolutionary wars.28 After 1797 there was once more a sustained rise in the amount of commodity imports29, and in the years before abolition more African commodities were being bought than at any time during the previous century (Figure 3). These commodities must have been largely bought and transported on slave ships, given the fact that there were far fewer British bilateral traders operating during this period. From around 1712 until the 1770s, the ratio, of slave to commodity ships averaged at around 10:1 for British vessels. From the 1780s this changed significantly; rising to a high of 110:1 in 1798 and averaging at around 50:1 in the three decades before abolition.
28 This was consistent with the pattern of slave exports which also rose and fell in the outbreak of war and resumption of peace 29 Perhaps due to Britain establishing naval dominance over the French which meant its merchant shipping could set forth with greater security (Lance & Engerman 2006). According to the slave trade database the French captured 48 slave vessels in 1794, compared to only 9 the previous year. From this high point (from a French perspective) the number of ships captured fell to 1 in 1801 (slavevoyages.org).

18
Figure 3. Total quantity (lbs) of commodities imported into Great Britain
Note: trend is given by the 5-year moving average. Source: CUST records.
Surviving accounts from individual slaving voyages certainly indicate that the British captains and merchants were enthusiastic buyers of commodities as well as slaves. Slave merchants regularly instructed their captains, to buy both slaves and commodities. For example, in 1803 the Liverpool slave merchant Thomas Leyland wrote to the captain of his ship the Enterprise with instructions for his voyage to Bonny: “…barter at Bonny for prime Negroes, Ivory and Palm Oil…. procure some Palm Oil on reasonable terms which is likely to bear a great price here, we therefore wish you to purchase as much as you can with any of the cargo you may have.”30 The Bristol merchant James Rogers was an equally enthusiastic buyer of commodities, with his captains regularly writing back from Africa to inform him of their progress in the purchase of both slaves and non-slave products. For example, Richard Rogers wrote to inform him from Old Calabar in 1788 that he had “…. on board at present 48 slaves and 12 pawns…likewise have purchased about 300 cwt ivory and 3 ton redwood..”31 There were so many ships trading for commodities at Old Calabar that his ships were on at least one occasion forced to sail down to Gabon which was also a crowded market.32
4. Explaining the changes in the commodity trade from the 1770s
This section will analyse the patterns and development of the commodity trade in the later 18th century and the interactions between the exports of people and goods from Africa. The literature on the British slave trade in the later 18th century suggests that rising numbers of slave embarkations driven by increased demand and competition led to changes in how voyages were organised (Behrendt 2001, Richardson et al. 2007, Radburn 2015. We firstly address the
30 LRO 387 MD 43 Leyland to Capt Caesar Lawson 18 July 1803. Leyland had given a near identical order the year before for his ship Lottery in 1802 (LRO 387 MD 42 Leyland to Capt. Charles Kneal 21 May 1802). 31 TNA C107/11 Rogers to Rogers April 1788 32 TNA C107/6 Cod to Rogers February 1792
0100000020000003000000400000050000006000000700000080000009000000
10000000
1737
1740
1743
1746
1749
1752
1755
1758
1761
1764
1767
1770
1773
1776
1779
1782
1785
1788
1791
1794
1797
1800
1804
1807

19
question first why we observe such a dramatic uptake in the export of commodities from Africa and second why particularly slave merchants increasingly became engaged in the trade of these goods. In doing so we aim to further our understanding of what was motivating slave merchant decision making at the apogee of the transatlantic slave trade in West Africa.
4.1.Rising Demand in Europe
The literature on consumption patterns in Britain suggests that items that previously might have been the privilege of the wealthy few, were increasingly consumed by a greater number of households (McKendrick et al. 1985). This consumer revolution was driven in part by a willingness on the part of households to work harder to be able to afford to buy goods such as furniture, cutlery, decorations, ornaments which had become markers of success and respectability (DeVries 1994 & 2015, Pomeranz 2000, pp94/95). Furthermore, the end of the 18th century was a period of rising wages, especially in the growing urban centres of Britain which provided a ready market for status goods (Allen 2007, 2009). Berg (2002, 2004) has also persuasively argued that, especially within Britain and the Netherlands there was a desire to reproduce the luxuries of Asia using European technology and resources from their colonies and regions of trade.
Gum Senegal was one such example as it allowed printers to mimic the calicoes of Asia. However, after control of the gum trade was lost to the French, British traders found that there was a good deal of demand for the goods found in relative abundance on the eastern side of the coast. The elephants of the Cameroons and the regions around the Bight of Biafra provided the raw materials for the piano keys, billiard balls, knife handles and ivory combs that were becoming increasingly seen as signs of middle class respectability (Johnson 1978, p 548). Liverpool’s growing soap as well as Lancashire wool manufacturing sector provided a growing market for palm oil (Lynn 1997, p85)33 while redwood was in demand both as a dye in for the textile industry (Inikori 2002) and also for the manufacture of violin bows, knife handles and furniture.34 Finally, the Bight of Biafra also provided beeswax for candles and pepper to satisfy a growing desire for a more varied diet (Pomeranz 2000, p94). This increased demand must go some way to explaining why the volume of commodities was far greater than in the period from the 17th and early 18th centuries which was studied by Eltis (1994) and van den Boogaard (1992). However, it does not explain why it was slave merchants, instead of specialised bilateral traders, that were largely responsible for the expansion.
33 Norris (1789, p146) also noted that Palm Oil was used by “British wool-coombers” as well as “soap boilers” 34 Vegetable Substances; Materials of Manufactures. Published under the superintendence of the society of the diffusion of useful knowledge (London: Charles Knight) 1833, p362. Turning and Mechanical Manipulation intended as a work of general reference and practical instruction on the lathe and the various mechanical pursuits followed by amateurs.” By Charles Holtzapffel, Vol 1, London, 1843, pp73, 76.
20
4.2 The crowding out of the commodity traders
It seems that the expulsion of the British from much of the Senegambian region had a number of important consequences. Firstly, commodity ships faced considerably longer journey times in order to reach the growing markets on the eastern side of the coast. Atlantic trade winds and currents made the bilateral journey between Senegambia and Europe relatively simple. However, to get back from the Bight of Biafra, vessels were obliged to follow the trade winds down to the equator, across the sea to the Caribbean and then finally back to Europe. This meant far higher wage bills and unlike slave ships they did not have the advantage being able to sell a valuable cargo of captives in the Americas. Secondly, trading in the Biafran and Gold Coast regions, the most important embarkation points for British slaves in West Africa, put them in direct competition with large numbers of slave vessels for commodities. This hadn’t been the case in Senegambia, which was a relatively unimportant slave exporting region at this time. In the 1788 report on the slave trade to the British parliament35 Captain Dean, described as a “Commander of a Vessel in the Wood and Ivory trade” related how his business was “… much hurt from the Slave Ships purchasing the said Articles, which the Persons in his Branch of the African Trade go solely to bring home.” In 1792, the captain of another commodity ship, the Triton complained of having to compete with slave ships in Gabon “......we find great opposition here, there are no less than 12 sail & 4 of them are for Red Wood….”36
It seems that these factors put a good deal of strain on the potential profit margins of specialist commodity merchants. Syndenham Teaste, a commodity trader from Bristol told a parliamentary committee in 1788 that that “…his House is in the Trade, and therefore goes on with it; but if his Capital was out of it, he would not now go in to it….” due to the low profits he made (p73). This assessment is supported by the fact that by the end of the 1780s he seems to have been the only merchant in his city regularly investing in bilateral voyages to Africa. In an analysis of the Bristol Presentments shows that between 1790 and 1796 (the year Teaste seems to have retired) there were 16 merchants who invested in specialist bilateral traders from Bristol. Teaste was alone responsible for around 50% of the voyages and in some years (1795 and 1796) was the only trader. Among other investors during this time the majority only invested in one or two bilateral voyages, the exception by James Rogers who sent 5 commodity vessels in 1791 and 1792. It seems that this branch of trade was attracting little in the way of investment. The next question is why slave merchants were motivated to buy increasing quantities of non-slave goods. That slave ships bought both slaves and commodities was not in itself a new
35 PP Report Of The Lords of the Committee of Council appointed for the Consideration of all Matters relating to Trade and Foreign Plantations; Submitting To His Majesty's Consideration The Evidence and Information they have collected in consequence of his Majesty's Order in Council, dated the 11th of February 1788, concerning the present State of the Trade to Africa, and particularly the Trade in Slaves; and concerning the Effects and Consequences of this Trade, as well in Africa and the West Indies, as to the general Commerce of this Kingdom. 36 TNA C107/6 Letter from Prosser to Rogers April 1792
21
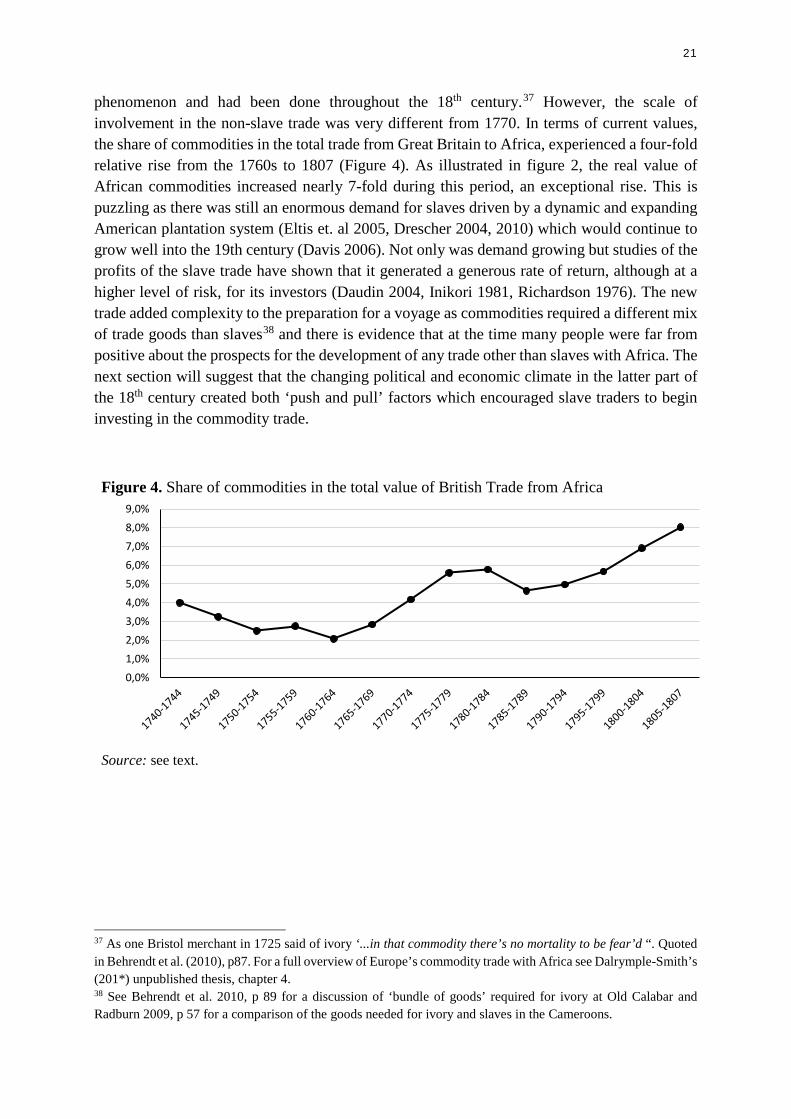
phenomenon and had been done throughout the 18th century.37 However, the scale of involvement in the non-slave trade was very different from 1770. In terms of current values, the share of commodities in the total trade from Great Britain to Africa, experienced a four-fold relative rise from the 1760s to 1807 (Figure 4). As illustrated in figure 2, the real value of African commodities increased nearly 7-fold during this period, an exceptional rise. This is puzzling as there was still an enormous demand for slaves driven by a dynamic and expanding American plantation system (Eltis et. al 2005, Drescher 2004, 2010) which would continue to grow well into the 19th century (Davis 2006). Not only was demand growing but studies of the profits of the slave trade have shown that it generated a generous rate of return, although at a higher level of risk, for its investors (Daudin 2004, Inikori 1981, Richardson 1976). The new trade added complexity to the preparation for a voyage as commodities required a different mix of trade goods than slaves38 and there is evidence that at the time many people were far from positive about the prospects for the development of any trade other than slaves with Africa. The next section will suggest that the changing political and economic climate in the latter part of the 18th century created both ‘push and pull’ factors which encouraged slave traders to begin investing in the commodity trade.
Figure 4. Share of commodities in the total value of British Trade from Africa
Source: see text.
37 As one Bristol merchant in 1725 said of ivory ‘...in that commodity there’s no mortality to be fear’d “. Quoted in Behrendt et al. (2010), p87. For a full overview of Europe’s commodity trade with Africa see Dalrymple-Smith’s (201*) unpublished thesis, chapter 4. 38 See Behrendt et al. 2010, p 89 for a discussion of ‘bundle of goods’ required for ivory at Old Calabar and Radburn 2009, p 57 for a comparison of the goods needed for ivory and slaves in the Cameroons.
0,0%1,0%2,0%3,0%4,0%5,0%6,0%7,0%8,0%9,0%

22
4.3. Legal Pressures
From the 1780s, merchants may also have been under pressure by parliamentary legislation designed to increase the space allotted to slaves (Thomas 1999, p 510, Klein 2010, p151). The Dolben Act was passed in 1788 and stipulated that ships of up to 201 tons could take no more than 1.67 slaves/ton and vessels of higher tonnage could only take one more slave for every addition tonnage of ship. Those who took more slaves would be required to pay a fine of £30 for every excess captive (Donnan II, 1965 p 583). This was then refined in 1799 to a requirement that each slave should be allotted a minimum of 8 square feet (Garland & Klein 1985, p 249). The trend in the slave/ton ratio does seem to broadly follow in the wake of these legislative acts and some slave merchants were instructing their captains not to take more slaves than permitted.39 However, an analysis of the slave trade database reveals that a reasonable proportion of merchants were prepared to take on more slaves than permitted by legislation.40 We would suggest that more commodities were bought because fewer slaves were purchased. However, it is not possible to say with confidence whether this was due to the fact that ships were forced to sail with fewer captives and therefore had more space and money for other purchases or if they were making an active choice to load up with relatively more commodities at the expense of slaves. For example, in his instructions to the master of his ship Lottery in 1798 Leyland tells him to sail to Bonny in the Bight of Biafra and purchase “…choice, young and healthy negroes…”.41 The Captain, John Whittle was eventually to purchase 502 slaves, which was within the legal limit. However, four years later in 1802 he wrote to the another Captain on the same ship also going to Bonny, directing him to “…barter for 290 Negroes, besides which we expect you will be able to procure a quantity of Palm Oil….”. This time ‘only’ 339 slaves were embarked.42 Yet regardless of whatever considerations were motivating slave merchants it is still clear that in general commodities were becoming of more attractive product to them. As noted in the introduction, merchants in ports such as Liverpool relied on highly skilled captains with in-depth knowledge of local African markets to manage the highly risky business of slave trading (Richardson et al. 2007, Klein 2010, p100), and therefore would not have invested capital in commodities unless they were sure it would yield a suitable return. In the next section we examine the potential returns on commodities.
39 For example, the Liverpool slave merchant Thomas Leyland told the captain of his ship the Enterprise to “…. barter at Bonny for prime Negroes, Ivory and Palm Oil. By law this vessel is allowed to carry 400 negroes and we request that they may all be males if possible to get them.” LRO 387 MD 43 Leyland to Capt Caesar Lawson 18 July 1803 40 For this analysis we took British ships which weight 201 tons or less from 1789 to 1799 and calculated slaves embarked / reported ton and slaves embarked* / standardised ton. The first calculation gave sample of 266 vessels and showed that 30% carried more than 1.67 slaves / ton. The second gave a larger sample of 874 ships and showed by 50% carried more than 1.67 slaves / ton. 41 LRO 387 MD 41 Leyland to Capt. John Whittle 2 July 1798 42 LRO 387 MD 42 Leyland to Capt. Charles Kneal 21 May 1802

23
Figure 5. Average number of slaves / standardised ton on British slave ships 1740 – 1808
Source: Slavevoyages.org.
4.4. Mark-ups and Prices
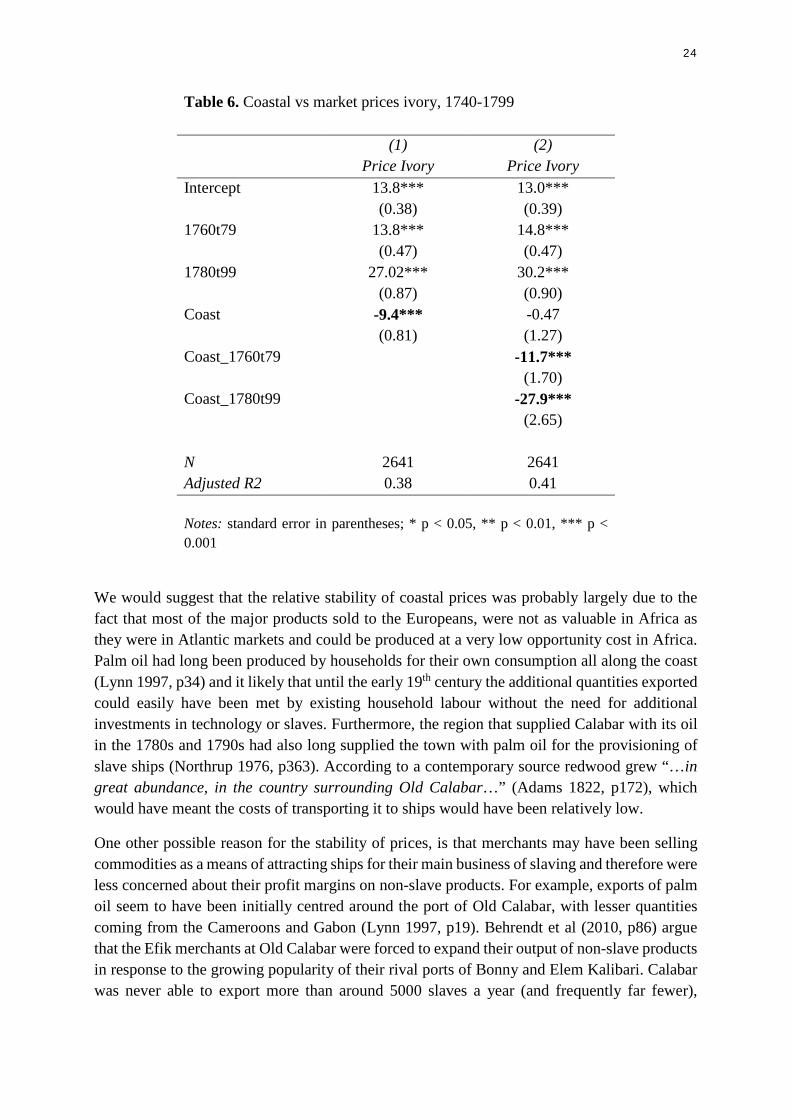
For British merchants, commodities became an especially favourable buy partly due to the fact that the coastal prices for African products remained relative stable over this period, in contrast to slaves which were becoming ever more expensive. This feature of the African market has, to our knowledge, never been identified. We start with our data on ivory, which yielded the greatest number of price observations both in Europe and in Africa. It is a very useful commodity to work with as it was traded from all parts of West Africa and had been a staple product in the portfolios of English merchants since the 17th century (Eltis 1994, Feinberg & Johnson 1982). Furthermore, the CUST records show that in 1760 only 50,000 lbs of ivory left Africa but by the 1790s up 300,000 lbs were imported yearly (see Appendix A3). Therefore, if increased demand did lead to price inflation across the region it would be evident in the prices paid to Africans for this product.
We ran a simple OLS regression on the observed prices for ivory in our dataset (Table 5). Model (1) includes a dummy for prices observed at the coast and period controls. The regression confirms the overall price rise discussed previously. Prices in 1760-79 and 1780-99 were significantly higher than the reference period: 1740-59. In addition, it shows that prices at the coast, over the entire period were well below the prices paid in European markets. Interacting the coastal dummy with the period dummies in model (2), we see that, from the 1760s onwards, there was a widening gap between the prices paid at the coast and in Europe for ivory. This pattern of relative stable prices at the coast when prices in European markets were rising rapidly was also found in our more limited datasets for other commodities. In addition, the standard deviation for slave prices was far greater than the one for any of the commodities traded for at the time (see Appendix A4).
1
1,2
1,4
1,6
1,8
2
2,2
24
Table 6. Coastal vs market prices ivory, 1740-1799 (1) (2) Price Ivory Price Ivory Intercept 13.8*** 13.0*** (0.38) (0.39) 1760t79 13.8*** 14.8*** (0.47) (0.47) 1780t99 27.02*** 30.2*** (0.87) (0.90) Coast -9.4*** -0.47 (0.81) (1.27) Coast_1760t79 -11.7*** (1.70) Coast_1780t99 -27.9*** (2.65) N 2641 2641 Adjusted R2 0.38 0.41 Notes: standard error in parentheses; * p < 0.05, ** p < 0.01, *** p < 0.001
We would suggest that the relative stability of coastal prices was probably largely due to the fact that most of the major products sold to the Europeans, were not as valuable in Africa as they were in Atlantic markets and could be produced at a very low opportunity cost in Africa. Palm oil had long been produced by households for their own consumption all along the coast (Lynn 1997, p34) and it likely that until the early 19th century the additional quantities exported could easily have been met by existing household labour without the need for additional investments in technology or slaves. Furthermore, the region that supplied Calabar with its oil in the 1780s and 1790s had also long supplied the town with palm oil for the provisioning of slave ships (Northrup 1976, p363). According to a contemporary source redwood grew “…in great abundance, in the country surrounding Old Calabar…” (Adams 1822, p172), which would have meant the costs of transporting it to ships would have been relatively low.
One other possible reason for the stability of prices, is that merchants may have been selling commodities as a means of attracting ships for their main business of slaving and therefore were less concerned about their profit margins on non-slave products. For example, exports of palm oil seem to have been initially centred around the port of Old Calabar, with lesser quantities coming from the Cameroons and Gabon (Lynn 1997, p19). Behrendt et al (2010, p86) argue that the Efik merchants at Old Calabar were forced to expand their output of non-slave products in response to the growing popularity of their rival ports of Bonny and Elem Kalibari. Calabar was never able to export more than around 5000 slaves a year (and frequently far fewer),
25
compared to Bonny which was able to send over 12,000 captives to the Americas in 1792.43 In addition Bonny offered better credit arrangements, lower transaction costs, and faster boarding times along with a reputation of supplying higher quality slaves (Lovejoy and Richardson 2004). This meant that Old Calabar needed to develop other exports which would attract foreign traders who might otherwise have visited its rivals. This was especially important in the aftermath of the American Wars of Independence which had severely disrupted merchant shipping and had had a particularly damaging impact on slave exports from the Bight of Biafra.44
Slaves were still the main business of traders in both Africa and Britain right up until 1807 and there is no evidence to suggest that British merchants were moving away from the export of captives to the Americas. While good returns on commodities may have been an incentive to buy more of them, it is unlikely to have been sufficient on its own. Studies of the slave trade have always noted that it was a risky enterprise and as noted in the introduction, ports such as Liverpool became successful due to their ability to minimise this risk (Haggerty 2009, McDade 2011). We will argue in the next section that the growing trade in commodities might have been use as an additional risk reduction strategy.
4.5.Changing economic environments
One area that was becoming increasingly problematic was the issue of credit and debt. A recent paper by Radburn (2015) has examined and quantified changes in the credit system known as bills of exchange which underlay the slave trade. In brief, merchants were able to exchange slaves for promissory which could be redeemed in England. This allowed planters in the West Indies time to recoup their investment before having to pay for slaves and slave traders a more efficient system of payment than exchange for plantation products. This system was probably crucial in the expansion of the trade in the second half of the 18th century (Pearson and Richardson 2008, p765). However, uncertainty across the Atlantic market caused by warfare and planter indebtedness led to increasingly longer dated bills meaning that during periods of particular instability slave traders had to wait up to two years to before they could cash their bills. This problem seems to have been widely recognised at the time45 and merchants responded with a variety of strategies. They could pass on their Bills of Exchange to other traders in exchange for goods that would stock their next voyages. This involved a discount and
43 From 1780 to 1808 an average of 6934 slaves were exported each year from Bonny compared with 2435 from Old Calabar 44 By 1780 the ports of Bonny, Old Calabar and Elem Kalabari had seen a 96% fall in slave embarkations since 1775. While numbers were to recover by around 1784, this represented a huge loss of income for the region’s merchants. 45 For example, Thomas Clarkson, in his “Essay on the impolicy of the African slave trade” (1788) wrote that: “The average time of a voyage is one year. At the expiration of the period, the vessel returns. On inspecting the bills which are bought home, and which have been received for the slaves, it appears that they are not payable on average, till two years after sight. The merchant therefore cannot enjoy the profits of his voyage till three years after he has sent his vessel to the coast. In the interim he is called upon to pay the goods for which he has shipped…” p28

26
meant lower profit margins but nonetheless ensured the business kept making money. One Liverpool slave merchant, William Davenport, was to do this with around 90 of his bills (Morgan 2005 p746). Radburn (2015) argues that another policy was for merchants to expand their range of American markets to areas that could offer shorted dated credit.
However, another strategy was to invest in other types of business that realised cash or at least shorter dated bills of exchange. Commodities could be exchanged for bills dated between 2 to 4 months46 allowing traders to realise fast and reliable profits, although at a lower rate of return, which provided a ready source of funds for their principle business of slaving. 47 In our sample of Bristol ships, the merchant who invested most heavily in commodities James Rogers was, according to one study, under mounting pressure from his creditors in the early 1790s (Morgan 2003). However, even more efficient traders seemed to have felt the need to supplement their slave business with commodities. James Anderson was one such trader who Richardson (1996) found to be the most effective in the city. Figure 8 below shows when he was sending ships back to Africa and when he could expect the remittance for bills of exchange from previous voyages.48
Figure 7. James Anderson, overview of business 1790 – 1796
Sources: Bristol Presentments, TNA C107/59, (Richardson 1996)
From 1790 to 1792 he outfitted 8 vessels for Africa, lost one and only received remittances from 4 previous voyages. It is in this period that we find his heaviest investment in commodities with 4 out of his 7 slaving vessels carrying additional produce cargo and he sent out a specialist commodities ship. From 1793 more of his bills for slave voyages matured and he began to move away from commodities to concentrate solely on slaves which brought a higher return. Even though he was to lose 3 ships to French privateering he could clearly afford to suffer the losses
46 James Rogers was given bills for between 2 to 4 months for sugar traded in the West Indies (TNA C107/59), while William Davenport exchanged his ivory for 3 month bills in England (Radburn 2009) 47 One detailed study of the accounts of the Liverpool slave merchant William Davenport argues that commodities were bought because of their short dated bills of exchange (Radburn 2009) 48 The analysis is based on the assumption that bills for slaves would mature in equal proportions at 24, 30 and 36 months based on correspondence and bills in the James Rogers papers (TNA C107/59) and those for commodities in 3 months based on the same sources and Radburn (2009)
0
1
2
3
4
1790 1791 1792 1793 1794 1795 1796
Departures
Ships Lost
Slave Bills Maturing
Commodities Bills Maturing
Commoditiy Vessels

27
without the use of alternative incomes. This was not, it seems his only strategy to handle the increased risks of the period. Like other merchants, he found ways to reduce his journey time (Ronnback & Solar 2015).49 In 1790 the two ships he outfitted and which also returned completed their journey in 13 and 22 months respectively.50 In 1792 the three ships tightened their running time to 12, 7 and 10 months while by 1794 this had further reduced to 7 and 8 months. Shorter voyages were more profitable for many reasons but crucially they meant less cash needed for wages, and more importantly meant creditors could be paid off faster. There were other strategies open to merchants seeking to minimise risk. Both Haggerty (2009) and Behrendt (2007) note that long term investment in human capital meant successful slave merchants could handle complex market conditions in both Europe and Africa. McDade (2011) argues that spreading risk across larger groups of investors was one of the keys to Liverpool success as a slave port. We would argue that commodity purchases were another strategy open to merchants seeking to navigate the hazardous waters of the slave trade in the three decades before abolition.
5. Conclusion
In this chapter, we have examined the changing market for African commodities in the decades before the British abolished their transatlantic slave trade. By constructing a new time series of the quantities and prices of goods imported from Africa in the customs ledgers we have shown that there was a far more substantial increase in the trade than the previous data suggested. Furthermore, we suggest that this was driven by slave traders and was primarily a phenomena of the Eastern and more specifically Biafran/Cameroonian region of the West African coast which was a significant reversal of the pattern of commodity trading until the 1770s. These traders also seem to have bought relatively fewer slaves while purchasing greater quantities of non-slave products. We hypothesise that this trend was driven by a number of different factors. Firstly, commodity prices were rising in Europe, while prices on the coast remained relatively stable, in marked contrast to slaves. In addition, the period saw increasing levels of risk and parliamentary legislation to reduce crowding on ships which may have further encouraged captains to purchase more commodities as a risk reduction, profit enhancing strategy.
Our new data suggests that the African commodity trade began to expand long before and independent of the Abolition Act of 1807, based on strong demand from European markets.
49 Liverpool merchants who were Britain’s most efficient carriers of slaves (2007) had managed to reduce their average journey time by around 15% between 1785 and 1805 (slavevoyages.org) 50 The Pilgrim and the Hector – Bristol Presentments

28
Appendix
A1 - Bristol Slaving Vessels carrying Just Slaves or Slaves and Commodities 1790 – 1807 by main region of slave embarkation
Source: Bristol Presentments 1790 – 1807
A2 – Bilateral commodity trade with Africa 1680 – 1808 2a. Number of commodity ships sent to Africa by nation 1680 to 1808
Source: Eltis 2013
0
5
10
15
20
25
30
35
Just slaves
Slaves andCommodities
0
5
10
15
20
25
30
35
1680
1687
1694
1701
1708
1716
1723
1730
1737
1744
1751
1758
1765
1772
1779
1786
1793
1800
1807
Denmark
France
Great Britain
Netherlands
Portugal
USA
29
2b. Commodity ship departures by British Port
Source: Eltis (2013)
0
5
10
15
20
25
30
3516
8316
8916
9517
0117
0717
1417
2017
2617
3217
3917
4617
5217
6017
6617
7217
7817
8417
9017
9618
03
Liverpool
London
Bristol

30
A3 - Quantity of Ivory (lbs) imported into Great Britain (1737 – 1808)
Source: CUST
A4 - Descriptive Statistics Coastal Prices of Commodities 1740 - 1793
Beeswax Camwood Ebony Gum Malluguetta Palm Oil Redwood
Mean 5.45 0.28 0.11 4.63 1.69 7.08 0.07 Median 5.87 0.28 0.11 4.02 1.63 6.87 0.05 Standard Deviation 1.12 0.04 0.01 2.44 0.69 3.38 0.09 Minimum 2.72 0.25 0.10 2.50 0.45 0.88 0.02 Maximum 7.32 0.30 0.12 8.00 2.83 13.75 0.35 Sample Size 22 2 2 4 14 10 13
Source: see text
Descriptive Statistics for the Coastal Prices of slaves in MCC archives, by Lovejoy & Richardson (1995) and for the average of the descriptive statistics for commodities
MCC ships 1742 - 1803
Lovejoy and Richardson (1995) 1784 – 1808
Average Commodities 1742 - 1793
Mean 12.26 22.51 2.76 Median 11.26 19.50 2.69 Standard Deviation 4.49 6.63 1.11 Minimum 5.32 15.60 0.99 Maximum 24.22 33.20 4.67 Sample Size 29 26 67
0
50000
100000
150000
200000
250000
300000
350000
400000
1737
1740
1743
1746
1749
1752
1755
1758
1761
1764
1767
1770
1773
1776
1779
1782
1785
1788
1791
1794
1797
1800
1804
1807
Ivor
y Im
port
ed lb
s