Embed Size (px)
Citation preview
Michael S Haigh Managing Director, Head of Commodities Research
Phone: +212 278 6020
Important Notice: The circumstances in which this publication has been produced are such that it is not appropriate to characterise it as independent
investment research as referred to in MiFID and that it should be treated as a marketing communication even if it contains a research recommendation. This
publication is also not subject to any prohibition on dealing ahead of the dissemination of investment research. However, SG is required to have policies to
manage the conflicts which may arise in the production of its research, including preventing dealing ahead of investment research.
March 2017
TOP DOWN AND BOTTOM UP IN COMMODITIES
Michael Haigh – MD / Head of Commodity Research 2
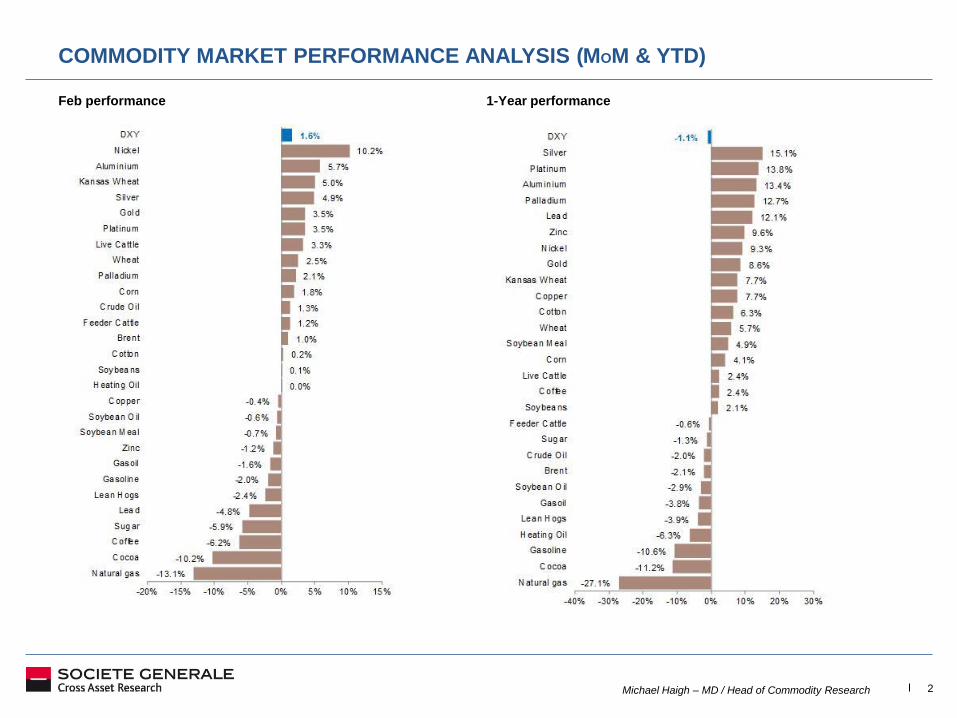
COMMODITY MARKET PERFORMANCE ANALYSIS (MOM & YTD)
Feb performance 1-Year performance
Michael Haigh – MD / Head of Commodity Research 3
OVERVIEW
General Commodity Outlook:
We are bullish on two of the four major commodity
subsectors on a 6-12m basis.
We expect the energy, industrial metals and precious metals
subsectors to outperform their respective 6-12m forward
prices. However, our bullish view on oil is critically
dependent on OPEC cutting output (900 kbd so far?), as the
global oil market would remain oversupplied without OPEC
action.
The price outlook for industrial metals as a group has turned
positive on the back of stronger-than-expected Chinese
demand stemming from its ongoing massive infrastructure
spending and President-elect Donald Trump’s plan to launch
a $1tn fiscal stimulus/infrastructure programme.
We are cautiously constructive on gold for political
uncertainties, especially from Europe – use gold as
insurance but fundamentally bearish (reduced forecast).
There are significant downside risks to our gold price
forecasts due to rising US real yields and the stronger US
dollar.
Our 6-12m price forecast for the agricultural subsector is
moderately bearish relative to forward prices, especially for
US grain. This year’s very large US grain crops, in a context
of global oversupply combined with a strong US dollar,
should make it difficult for grain prices to recover much next
year
Global Macroeconomic Outlook:
Our economists forecast global real GDP growth of 3.5% in
2017, after an expected 3.2% growth rate last year (based on
purchasing power parity country weights).
The US economy is forecast to grow 2.3% this year after
1.6% last year. Trump’s promises of substantial tax cuts and
infrastructure spending, if implemented, would boost
economic growth in late 2017 and 2018.
The US Fed is widely expected to implement 3 25bp hike in
March, June and December; and we expect another three
hikes next year, which should provide further support for the
US dollar.
Euro area GDP growth should come in at 1.5% this year after
1.4% last year. The ECB is likely to start tapering its QE
programme during 2017, but we do not expect a rate hike for
several years.
Our economists have increased their GDP forecasts for
China moderately. They now expect China’s GDP to expand
by 6.3% this year, after 6.7% last year.
While the recent tightening measures on housing and
shadow banking are bound to exert downward pressure on
economic growth in 1H17, Chinese policymakers are likely to
revert to credit and investment growth again at that time to
arrest the slowdown just before the leadership reshuffling at
the 17th National Congress of the Communist Party.
Michael Haigh – MD / Head of Commodity Research 4
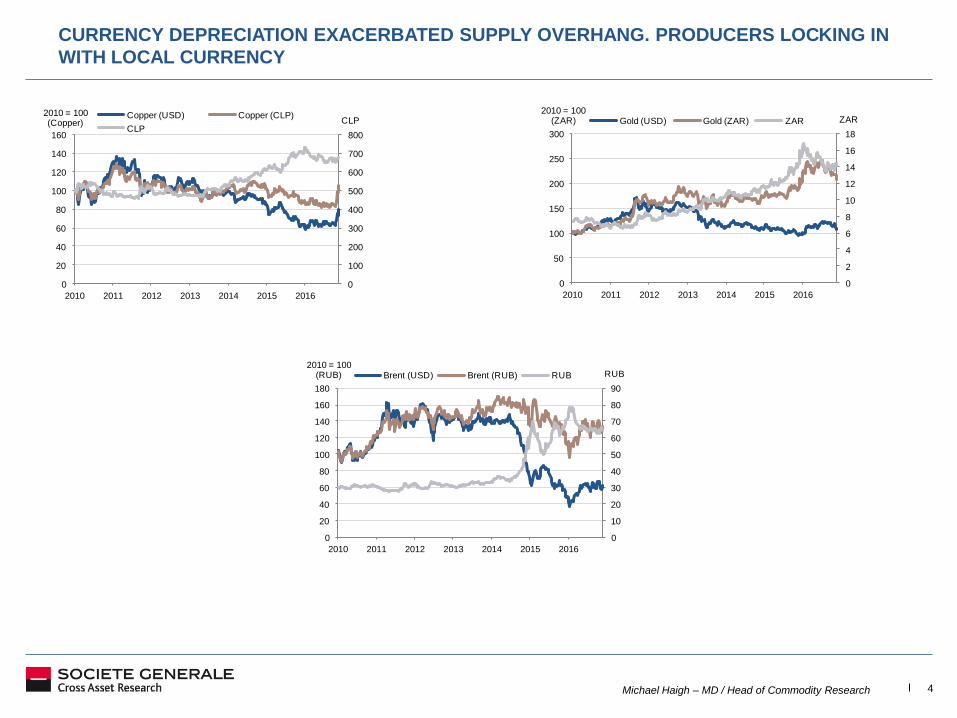
CURRENCY DEPRECIATION EXACERBATED SUPPLY OVERHANG. PRODUCERS LOCKING IN
WITH LOCAL CURRENCY
0
100
200
300
400
500
600
700
800
0
20
40
60
80
100
120
140
160
2010 2011 2012 2013 2014 2015 2016
CLP2010 = 100(Copper)
Copper (USD) Copper (CLP)
CLP
0
2
4
6
8
10
12
14
16
18
0
50
100
150
200
250
300
2010 2011 2012 2013 2014 2015 2016
ZAR2010 = 100
(ZAR) Gold (USD) Gold (ZAR) ZAR
0
10
20
30
40
50
60
70
80
90
0
20
40
60
80
100
120
140
160
180
2010 2011 2012 2013 2014 2015 2016
RUB2010 = 100
(RUB) Brent (USD) Brent (RUB) RUB
Michael Haigh – MD / Head of Commodity Research 5
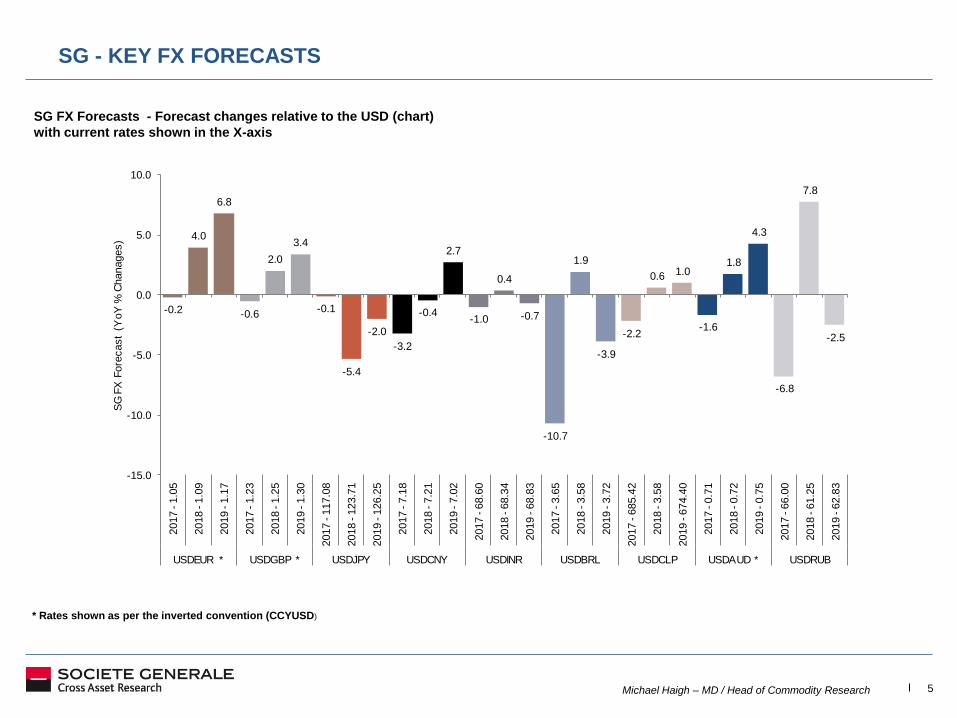
SG - KEY FX FORECASTS
SG FX Forecasts - Forecast changes relative to the USD (chart)
with current rates shown in the X-axis
* Rates shown as per the inverted convention (CCYUSD)
-0.2
4.0
6.8
-0.6
2.0
3.4
-0.1
-5.4
-2.0
-3.2
-0.4
2.7
-1.0
0.4
-0.7
-10.7
1.9
-3.9
-2.2
0.6 1.0
-1.6
1.8
4.3
-6.8
7.8
-2.5
-15.0
-10.0
-5.0
0.0
5.0
10.02017 -
1.0
5
2018 -
1.0
9
2019 -
1.1
7
2017 -
1.2
3
2018 -
1.2
5
2019 -
1.3
0
2017 -
117.0
8
2018 -
123.7
1
2019 -
126.2
5
2017 -
7.1
8
2018 -
7.2
1
2019 -
7.0
2
2017 -
68.6
0
2018 -
68.3
4
2019 -
68.8
3
2017 -
3.6
5
2018 -
3.5
8
2019 -
3.7
2
2017 -
685.4
2
2018 -
3.5
8
2019 -
674.4
0
2017 -
0.7
1
2018 -
0.7
2
2019 -
0.7
5
2017 -
66.0
0
2018 -
61.2
5
2019 -
62.8
3
USDEUR * USDGBP * USDJPY USDCNY USDINR USDBRL USDCLP USDAUD * USDRUB
SG
FX
Fore
cast
(YoY
% C
hanages)
Michael Haigh – MD / Head of Commodity Research 6
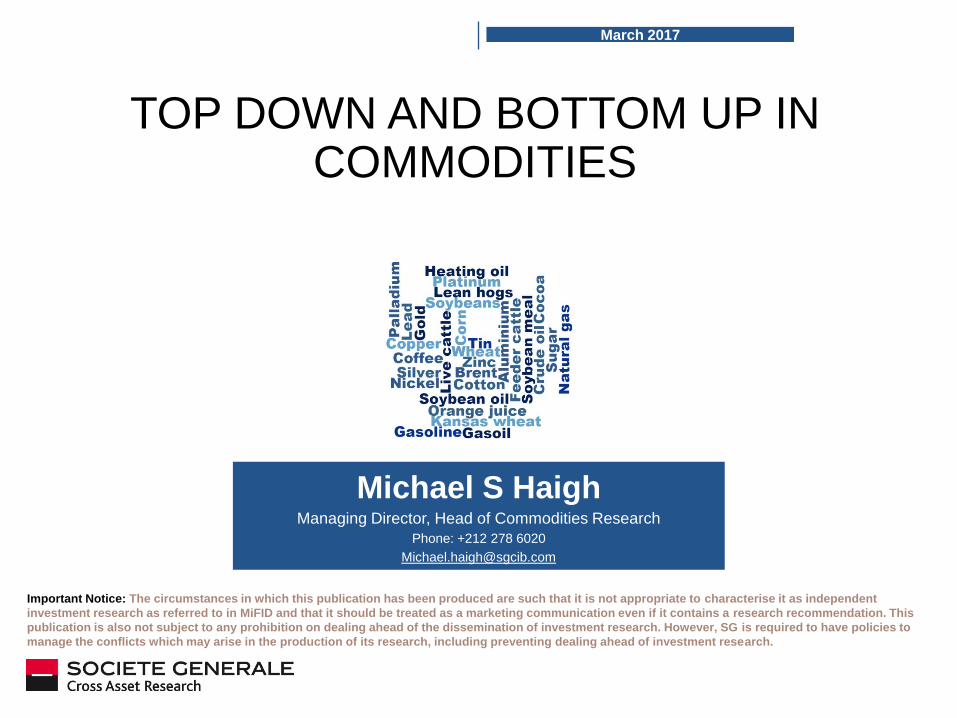
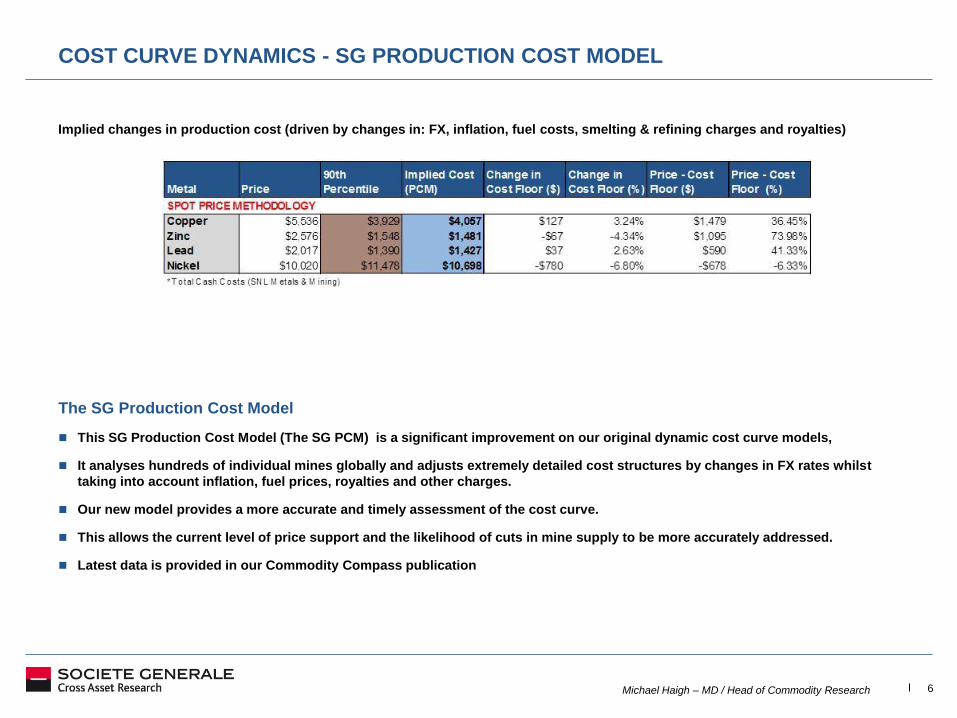
COST CURVE DYNAMICS - SG PRODUCTION COST MODEL
Implied changes in production cost (driven by changes in: FX, inflation, fuel costs, smelting & refining charges and royalties)
The SG Production Cost Model
This SG Production Cost Model (The SG PCM) is a significant improvement on our original dynamic cost curve models,
It analyses hundreds of individual mines globally and adjusts extremely detailed cost structures by changes in FX rates whilst
taking into account inflation, fuel prices, royalties and other charges.
Our new model provides a more accurate and timely assessment of the cost curve.
This allows the current level of price support and the likelihood of cuts in mine supply to be more accurately addressed.
Latest data is provided in our Commodity Compass publication
Michael Haigh – MD / Head of Commodity Research 7
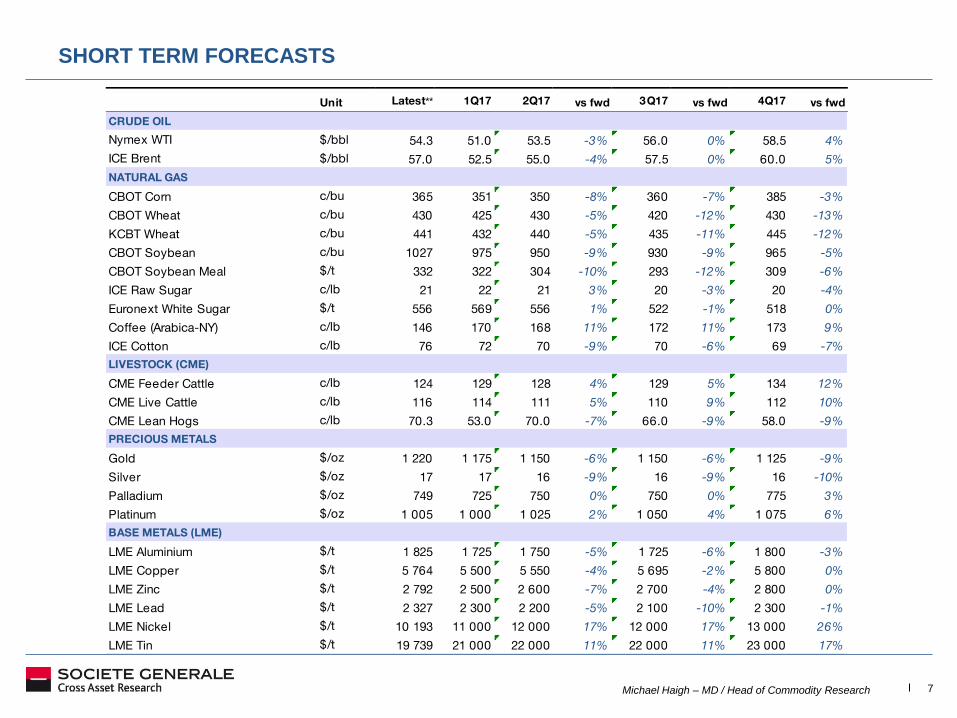
SHORT TERM FORECASTS
Unit Latest** 1Q17 2Q17 vs fwd 3Q17 vs fwd 4Q17 vs fwd
CRUDE OIL
Nymex WTI $/bbl 54.3 51.0 53.5 -3% 56.0 0% 58.5 4%
ICE Brent $/bbl 57.0 52.5 55.0 -4% 57.5 0% 60.0 5%
NATURAL GAS
CBOT Corn c/bu 365 351 350 -8% 360 -7% 385 -3%
CBOT Wheat c/bu 430 425 430 -5% 420 -12% 430 -13%
KCBT Wheat c/bu 441 432 440 -5% 435 -11% 445 -12%
CBOT Soybean c/bu 1027 975 950 -9% 930 -9% 965 -5%
CBOT Soybean Meal $/t 332 322 304 -10% 293 -12% 309 -6%
ICE Raw Sugar c/lb 21 22 21 3% 20 -3% 20 -4%
Euronext White Sugar $/t 556 569 556 1% 522 -1% 518 0%
Coffee (Arabica-NY) c/lb 146 170 168 11% 172 11% 173 9%
ICE Cotton c/lb 76 72 70 -9% 70 -6% 69 -7%
LIVESTOCK (CME)
CME Feeder Cattle c/lb 124 129 128 4% 129 5% 134 12%
CME Live Cattle c/lb 116 114 111 5% 110 9% 112 10%
CME Lean Hogs c/lb 70.3 53.0 70.0 -7% 66.0 -9% 58.0 -9%
PRECIOUS METALS
Gold $/oz 1 220 1 175 1 150 -6% 1 150 -6% 1 125 -9%
Silver $/oz 17 17 16 -9% 16 -9% 16 -10%
Palladium $/oz 749 725 750 0% 750 0% 775 3%
Platinum $/oz 1 005 1 000 1 025 2% 1 050 4% 1 075 6%
BASE METALS (LME)
LME Aluminium $/t 1 825 1 725 1 750 -5% 1 725 -6% 1 800 -3%
LME Copper $/t 5 764 5 500 5 550 -4% 5 695 -2% 5 800 0%
LME Zinc $/t 2 792 2 500 2 600 -7% 2 700 -4% 2 800 0%
LME Lead $/t 2 327 2 300 2 200 -5% 2 100 -10% 2 300 -1%
LME Nickel $/t 10 193 11 000 12 000 17% 12 000 17% 13 000 26%
LME Tin $/t 19 739 21 000 22 000 11% 22 000 11% 23 000 17%
Michael Haigh – MD / Head of Commodity Research 8
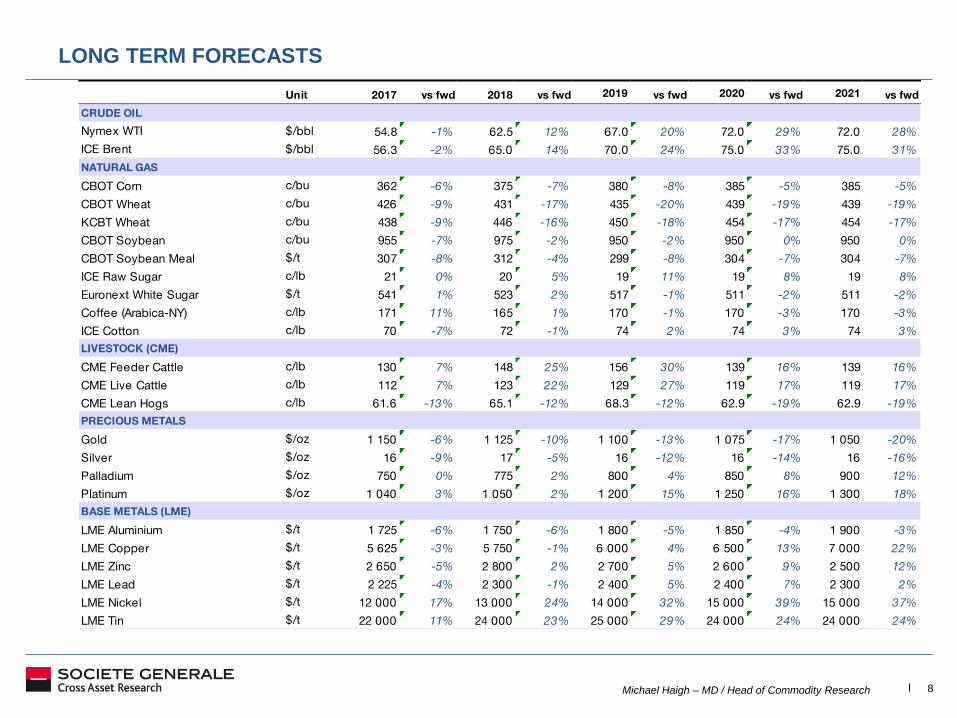
LONG TERM FORECASTS
Unit 2017 vs fwd 2018 vs fwd 2019 vs fwd 2020 vs fwd 2021 vs fwd
CRUDE OIL
Nymex WTI $/bbl 54.8 -1% 62.5 12% 67.0 20% 72.0 29% 72.0 28%
ICE Brent $/bbl 56.3 -2% 65.0 14% 70.0 24% 75.0 33% 75.0 31%
NATURAL GAS
CBOT Corn c/bu 362 -6% 375 -7% 380 -8% 385 -5% 385 -5%
CBOT Wheat c/bu 426 -9% 431 -17% 435 -20% 439 -19% 439 -19%
KCBT Wheat c/bu 438 -9% 446 -16% 450 -18% 454 -17% 454 -17%
CBOT Soybean c/bu 955 -7% 975 -2% 950 -2% 950 0% 950 0%
CBOT Soybean Meal $/t 307 -8% 312 -4% 299 -8% 304 -7% 304 -7%
ICE Raw Sugar c/lb 21 0% 20 5% 19 11% 19 8% 19 8%
Euronext White Sugar $/t 541 1% 523 2% 517 -1% 511 -2% 511 -2%
Coffee (Arabica-NY) c/lb 171 11% 165 1% 170 -1% 170 -3% 170 -3%
ICE Cotton c/lb 70 -7% 72 -1% 74 2% 74 3% 74 3%
LIVESTOCK (CME)
CME Feeder Cattle c/lb 130 7% 148 25% 156 30% 139 16% 139 16%
CME Live Cattle c/lb 112 7% 123 22% 129 27% 119 17% 119 17%
CME Lean Hogs c/lb 61.6 -13% 65.1 -12% 68.3 -12% 62.9 -19% 62.9 -19%
PRECIOUS METALS
Gold $/oz 1 150 -6% 1 125 -10% 1 100 -13% 1 075 -17% 1 050 -20%
Silver $/oz 16 -9% 17 -5% 16 -12% 16 -14% 16 -16%
Palladium $/oz 750 0% 775 2% 800 4% 850 8% 900 12%
Platinum $/oz 1 040 3% 1 050 2% 1 200 15% 1 250 16% 1 300 18%
BASE METALS (LME)
LME Aluminium $/t 1 725 -6% 1 750 -6% 1 800 -5% 1 850 -4% 1 900 -3%
LME Copper $/t 5 625 -3% 5 750 -1% 6 000 4% 6 500 13% 7 000 22%
LME Zinc $/t 2 650 -5% 2 800 2% 2 700 5% 2 600 9% 2 500 12%
LME Lead $/t 2 225 -4% 2 300 -1% 2 400 5% 2 400 7% 2 300 2%
LME Nickel $/t 12 000 17% 13 000 24% 14 000 32% 15 000 39% 15 000 37%
LME Tin $/t 22 000 11% 24 000 23% 25 000 29% 24 000 24% 24 000 24%
Michael Haigh – MD / Head of Commodity Research 9
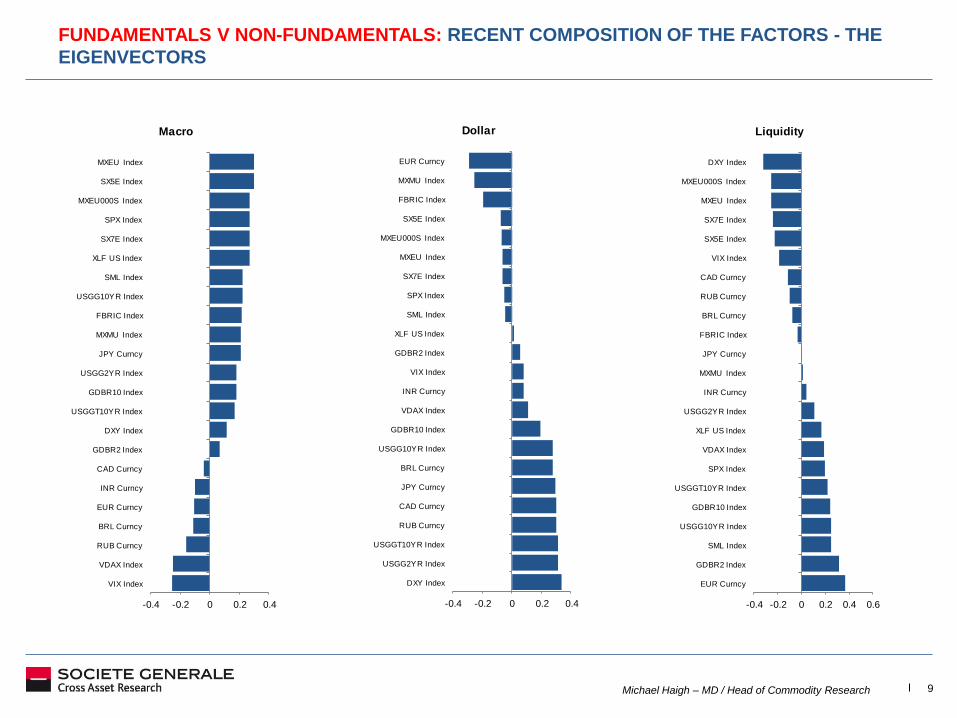
FUNDAMENTALS V NON-FUNDAMENTALS: RECENT COMPOSITION OF THE FACTORS - THE
EIGENVECTORS
-0.4 -0.2 0 0.2 0.4
VIX Index
VDAX Index
RUB Curncy
BRL Curncy
EUR Curncy
INR Curncy
CAD Curncy
GDBR2 Index
DXY Index
USGGT10YR Index
GDBR10 Index
USGG2YR Index
JPY Curncy
MXMU Index
FBRIC Index
USGG10YR Index
SML Index
XLF US Index
SX7E Index
SPX Index
MXEU000S Index
SX5E Index
MXEU Index
Macro
-0.4 -0.2 0 0.2 0.4
DXY Index
USGG2YR Index
USGGT10YR Index
RUB Curncy
CAD Curncy
JPY Curncy
BRL Curncy
USGG10YR Index
GDBR10 Index
VDAX Index
INR Curncy
VIX Index
GDBR2 Index
XLF US Index
SML Index
SPX Index
SX7E Index
MXEU Index
MXEU000S Index
SX5E Index
FBRIC Index
MXMU Index
EUR Curncy
Dollar
-0.4 -0.2 0 0.2 0.4 0.6
EUR Curncy
GDBR2 Index
SML Index
USGG10YR Index
GDBR10 Index
USGGT10YR Index
SPX Index
VDAX Index
XLF US Index
USGG2YR Index
INR Curncy
MXMU Index
JPY Curncy
FBRIC Index
BRL Curncy
RUB Curncy
CAD Curncy
VIX Index
SX5E Index
SX7E Index
MXEU Index
MXEU000S Index
DXY Index
Liquidity
Michael Haigh – MD / Head of Commodity Research 10
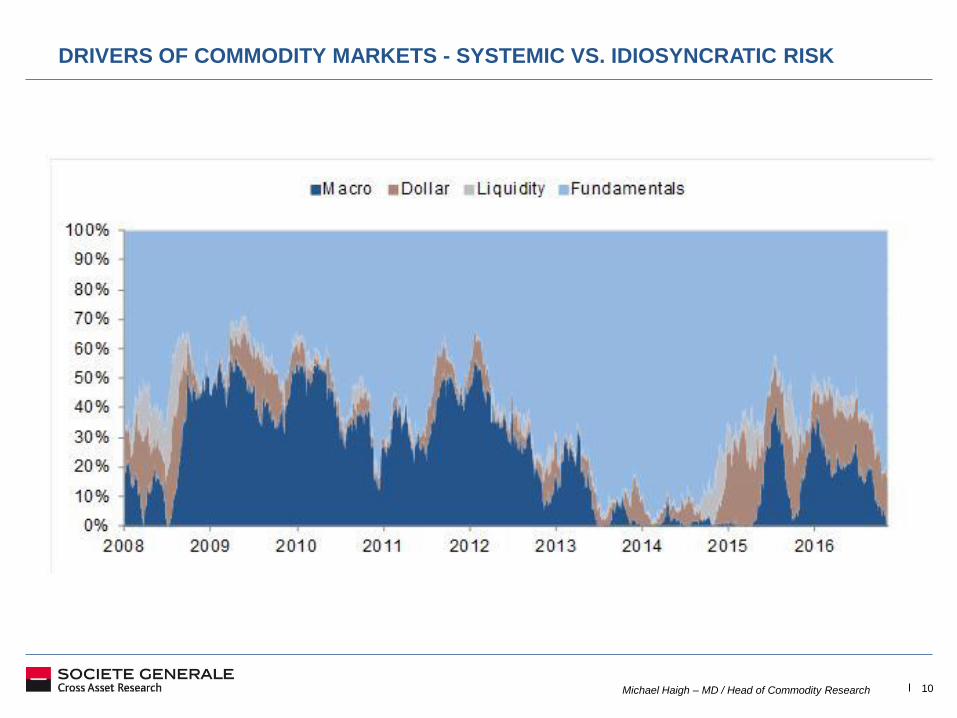
DRIVERS OF COMMODITY MARKETS - SYSTEMIC VS. IDIOSYNCRATIC RISK
Michael Haigh – MD / Head of Commodity Research 11
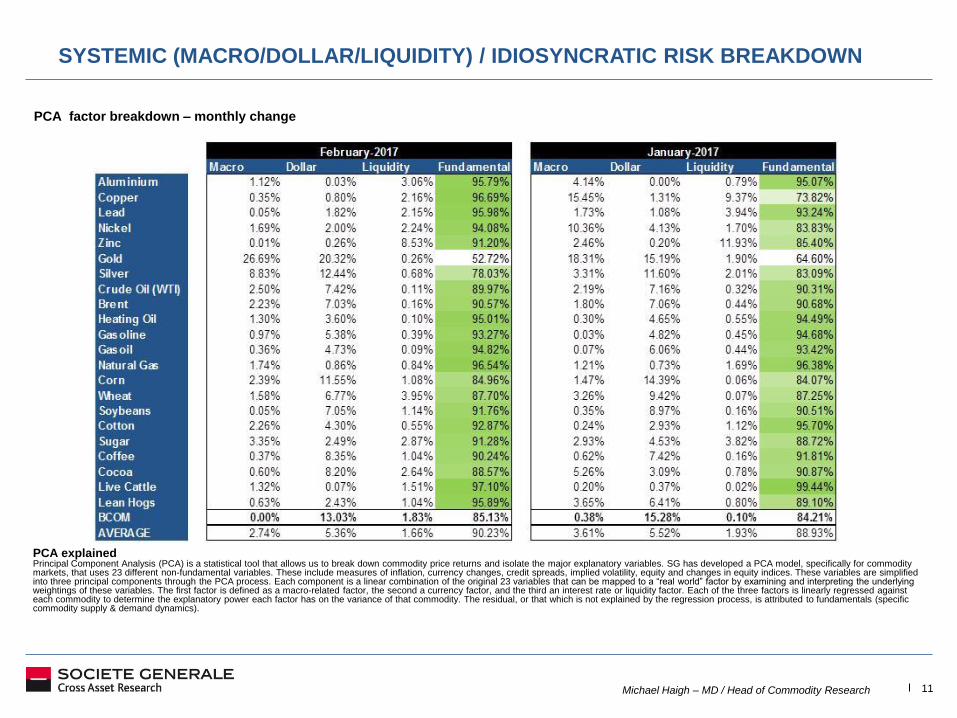
SYSTEMIC (MACRO/DOLLAR/LIQUIDITY) / IDIOSYNCRATIC RISK BREAKDOWN
PCA factor breakdown – monthly change
PCA explained Principal Component Analysis (PCA) is a statistical tool that allows us to break down commodity price returns and isolate the major explanatory variables. SG has developed a PCA model, specifically for commodity markets, that uses 23 different non-fundamental variables. These include measures of inflation, currency changes, credit spreads, implied volatility, equity and changes in equity indices. These variables are simplified into three principal components through the PCA process. Each component is a linear combination of the original 23 variables that can be mapped to a “real world” factor by examining and interpreting the underlying weightings of these variables. The first factor is defined as a macro-related factor, the second a currency factor, and the third an interest rate or liquidity factor. Each of the three factors is linearly regressed against each commodity to determine the explanatory power each factor has on the variance of that commodity. The residual, or that which is not explained by the regression process, is attributed to fundamentals (specific commodity supply & demand dynamics).
Michael Haigh – MD / Head of Commodity Research 12
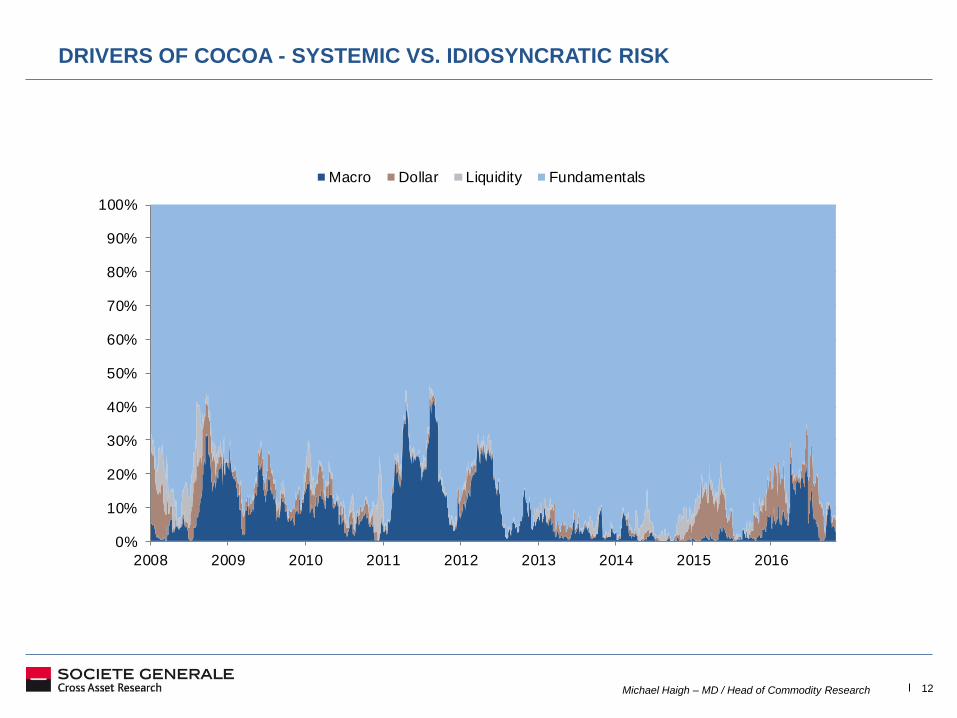
DRIVERS OF COCOA - SYSTEMIC VS. IDIOSYNCRATIC RISK
0%
10%
20%
30%
40%
50%
60%
70%
80%
90%
100%
2008 2009 2010 2011 2012 2013 2014 2015 2016
Macro Dollar Liquidity Fundamentals
Michael Haigh – MD / Head of Commodity Research 13
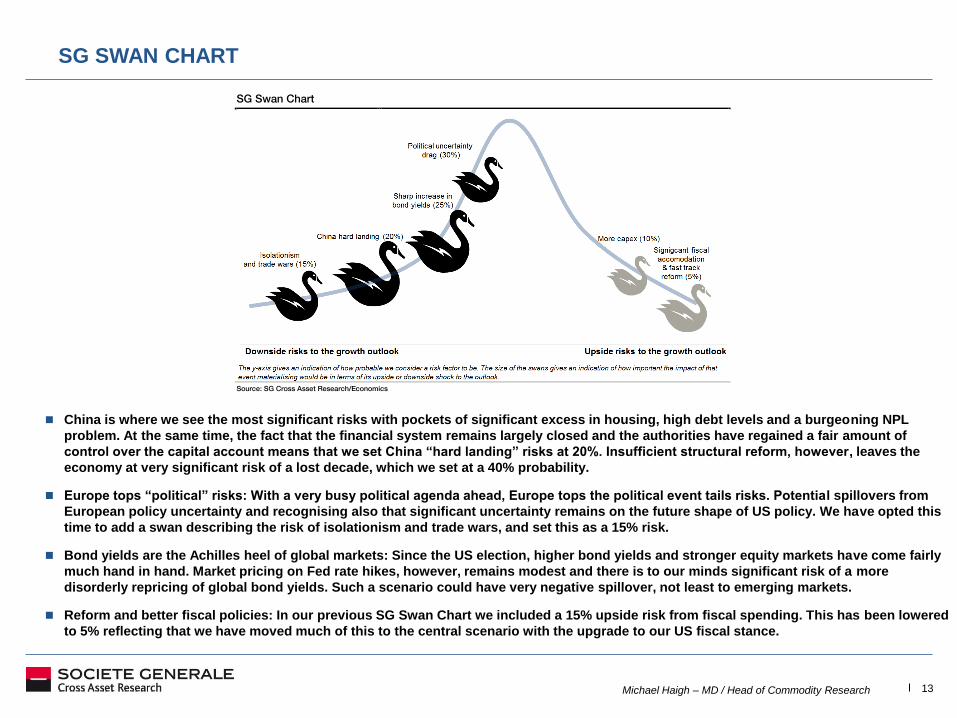
SG SWAN CHART
SG Swan Chart
Source: SG Cross Asset Research/Economics
China is where we see the most significant risks with pockets of significant excess in housing, high debt levels and a burgeoning NPL
problem. At the same time, the fact that the financial system remains largely closed and the authorities have regained a fair amount of
control over the capital account means that we set China “hard landing” risks at 20%. Insufficient structural reform, however, leaves the
economy at very significant risk of a lost decade, which we set at a 40% probability.
Europe tops “political” risks: With a very busy political agenda ahead, Europe tops the political event tails risks. Potential spillovers from
European policy uncertainty and recognising also that significant uncertainty remains on the future shape of US policy. We have opted this
time to add a swan describing the risk of isolationism and trade wars, and set this as a 15% risk.
Bond yields are the Achilles heel of global markets: Since the US election, higher bond yields and stronger equity markets have come fairly
much hand in hand. Market pricing on Fed rate hikes, however, remains modest and there is to our minds significant risk of a more
disorderly repricing of global bond yields. Such a scenario could have very negative spillover, not least to emerging markets.
Reform and better fiscal policies: In our previous SG Swan Chart we included a 15% upside risk from fiscal spending. This has been lowered
to 5% reflecting that we have moved much of this to the central scenario with the upgrade to our US fiscal stance.
Michael Haigh – MD / Head of Commodity Research 14
CL
NG
HO
XB
C
W
KW
S
GC
SI
HG
SB
CT
KC
CC
LC
LH
CL
NG
HO
XB
C
W
KW
S
GC
SI
HG
SB
CT
KC
CC
LC
LH
0%
25%
50%
75%
100%
-100% -75% -50% -25% 0% 25% 50% 75% 100%
Price %
of
Price R
ange
Short MM % Range Long MM % Range
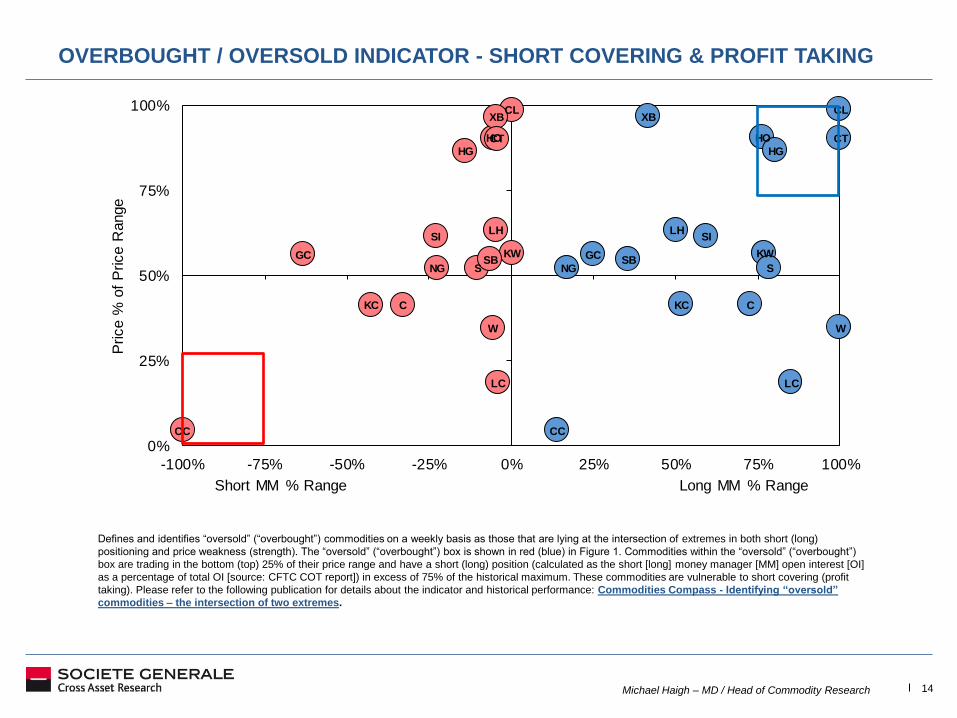
OVERBOUGHT / OVERSOLD INDICATOR - SHORT COVERING & PROFIT TAKING
Defines and identifies “oversold” (“overbought”) commodities on a weekly basis as those that are lying at the intersection of extremes in both short (long)
positioning and price weakness (strength). The “oversold” (“overbought”) box is shown in red (blue) in Figure 1. Commodities within the “oversold” (“overbought”)
box are trading in the bottom (top) 25% of their price range and have a short (long) position (calculated as the short [long] money manager [MM] open interest [OI]
as a percentage of total OI [source: CFTC COT report]) in excess of 75% of the historical maximum. These commodities are vulnerable to short covering (profit
taking). Please refer to the following publication for details about the indicator and historical performance: Commodities Compass - Identifying “oversold”
commodities – the intersection of two extremes.
Michael Haigh – MD / Head of Commodity Research 15
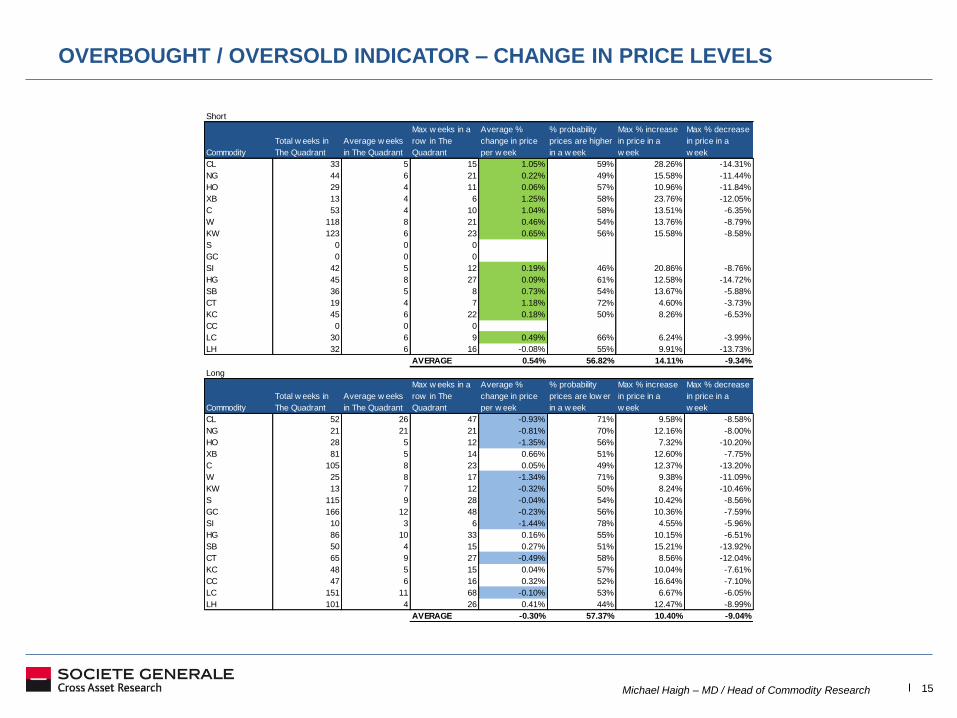
OVERBOUGHT / OVERSOLD INDICATOR – CHANGE IN PRICE LEVELS
Short
Commodity
Total w eeks in
The Quadrant
Average w eeks
in The Quadrant
Max w eeks in a
row in The
Quadrant
Average %
change in price
per w eek
% probability
prices are higher
in a w eek
Max % increase
in price in a
w eek
Max % decrease
in price in a
w eek
CL 33 5 15 1.05% 59% 28.26% -14.31%
NG 44 6 21 0.22% 49% 15.58% -11.44%
HO 29 4 11 0.06% 57% 10.96% -11.84%
XB 13 4 6 1.25% 58% 23.76% -12.05%
C 53 4 10 1.04% 58% 13.51% -6.35%
W 118 8 21 0.46% 54% 13.76% -8.79%
KW 123 6 23 0.65% 56% 15.58% -8.58%
S 0 0 0
GC 0 0 0
SI 42 5 12 0.19% 46% 20.86% -8.76%
HG 45 8 27 0.09% 61% 12.58% -14.72%
SB 36 5 8 0.73% 54% 13.67% -5.88%
CT 19 4 7 1.18% 72% 4.60% -3.73%
KC 45 6 22 0.18% 50% 8.26% -6.53%
CC 0 0 0
LC 30 6 9 0.49% 66% 6.24% -3.99%
LH 32 6 16 -0.08% 55% 9.91% -13.73%
AVERAGE 0.54% 56.82% 14.11% -9.34%
Long
Commodity
Total w eeks in
The Quadrant
Average w eeks
in The Quadrant
Max w eeks in a
row in The
Quadrant
Average %
change in price
per w eek
% probability
prices are low er
in a w eek
Max % increase
in price in a
w eek
Max % decrease
in price in a
w eek
CL 52 26 47 -0.93% 71% 9.58% -8.58%
NG 21 21 21 -0.81% 70% 12.16% -8.00%
HO 28 5 12 -1.35% 56% 7.32% -10.20%
XB 81 5 14 0.66% 51% 12.60% -7.75%
C 105 8 23 0.05% 49% 12.37% -13.20%
W 25 8 17 -1.34% 71% 9.38% -11.09%
KW 13 7 12 -0.32% 50% 8.24% -10.46%
S 115 9 28 -0.04% 54% 10.42% -8.56%
GC 166 12 48 -0.23% 56% 10.36% -7.59%
SI 10 3 6 -1.44% 78% 4.55% -5.96%
HG 86 10 33 0.16% 55% 10.15% -6.51%
SB 50 4 15 0.27% 51% 15.21% -13.92%
CT 65 9 27 -0.49% 58% 8.56% -12.04%
KC 48 5 15 0.04% 57% 10.04% -7.61%
CC 47 6 16 0.32% 52% 16.64% -7.10%
LC 151 11 68 -0.10% 53% 6.67% -6.05%
LH 101 4 26 0.41% 44% 12.47% -8.99%
AVERAGE -0.30% 57.37% 10.40% -9.04%
Michael Haigh – MD / Head of Commodity Research 16
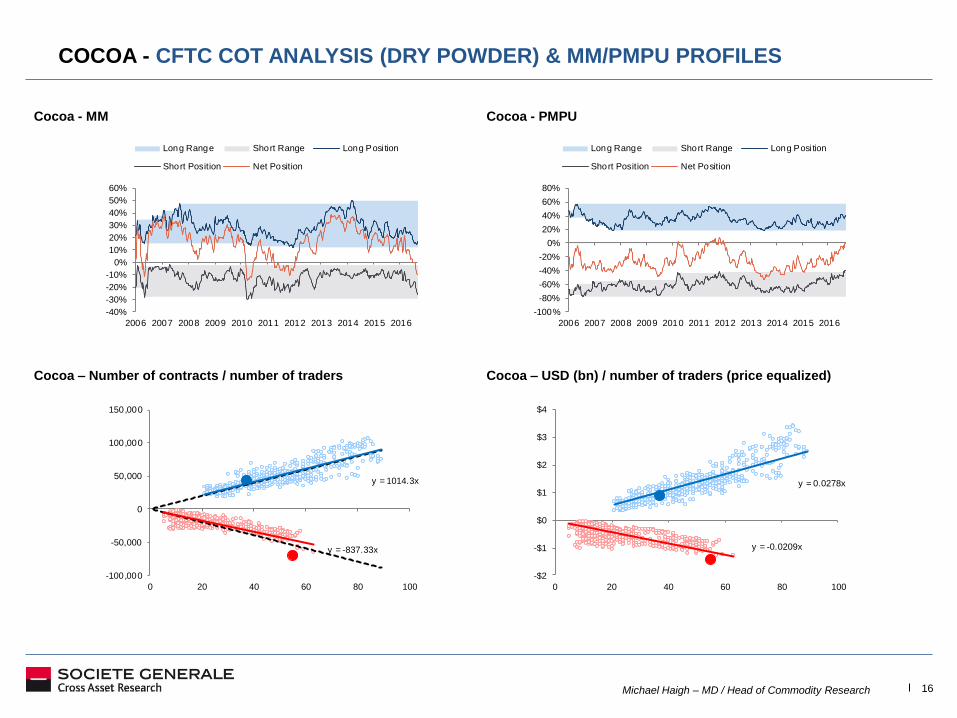
COCOA - CFTC COT ANALYSIS (DRY POWDER) & MM/PMPU PROFILES
Cocoa - MM Cocoa - PMPU
Cocoa – Number of contracts / number of traders Cocoa – USD (bn) / number of traders (price equalized)
y = 1014.3x
y = -837.33x
-100,000
-50,000
0
50,000
100,000
150,000
0 20 40 60 80 100
y = 0.0278x
y = -0.0209x
-$2
-$1
$0
$1
$2
$3
$4
0 20 40 60 80 100
-40%
-30%
-20%
-10%
0%
10%
20%
30%
40%
50%
60%
2006 2007 2008 2009 2010 2011 2012 2013 2014 2015 2016
Long Range Short Range Long Posi tion
Short Position Net Position
-100%
-80%
-60%
-40%
-20%
0%
20%
40%
60%
80%
2006 2007 2008 2009 2010 2011 2012 2013 2014 2015 2016
Long Range Short Range Long Posi tion
Short Position Net Position
Michael Haigh – MD / Head of Commodity Research 17
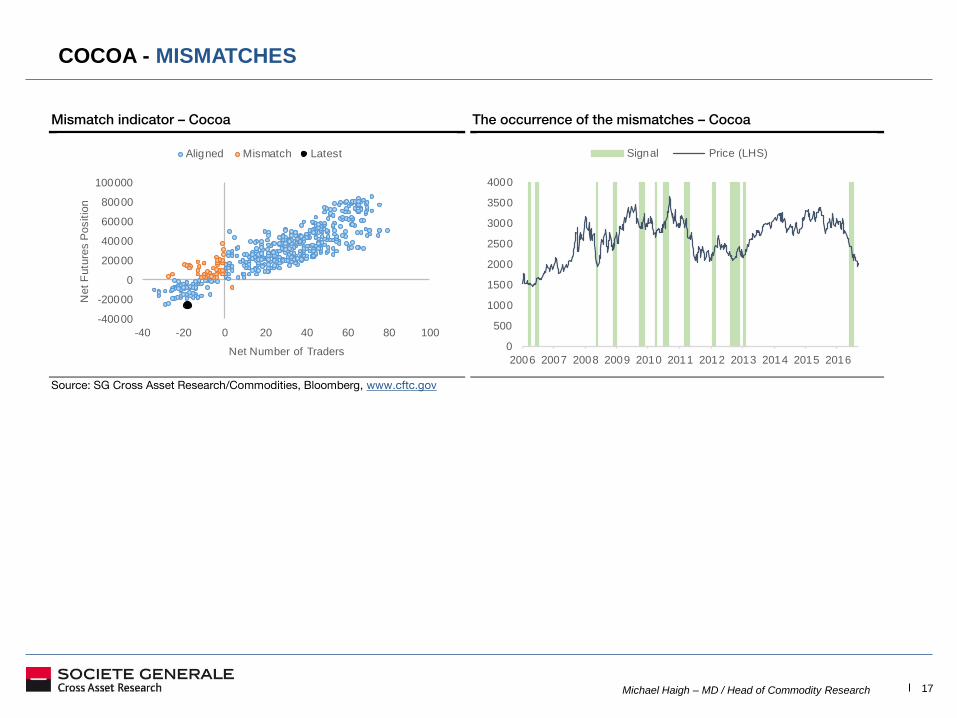
COCOA - MISMATCHES
Mismatch indicator – Cocoa The occurrence of the mismatches – Cocoa
Source: SG Cross Asset Research/Commodities, Bloomberg, www.cftc.gov
-40000
-20000
0
20000
40000
60000
80000
100000
-40 -20 0 20 40 60 80 100
Net
Futu
res
Pos
itio
n
Net Number of Traders
Aligned Mismatch Latest
0
500
1000
1500
2000
2500
3000
3500
4000
2006 2007 2008 2009 2010 2011 2012 2013 2014 2015 2016
Signal Price (LHS)
Michael Haigh – MD / Head of Commodity Research 18
Copper
AluminiumZinc
Lead
NickelTin
Copper
AluminiumZinc
Lead
NickelTin
0%
25%
50%
75%
100%
-100% -75% -50% -25% 0% 25% 50% 75% 100%
Price %
of
Price R
ange
Short MM % Range Long MM % Range
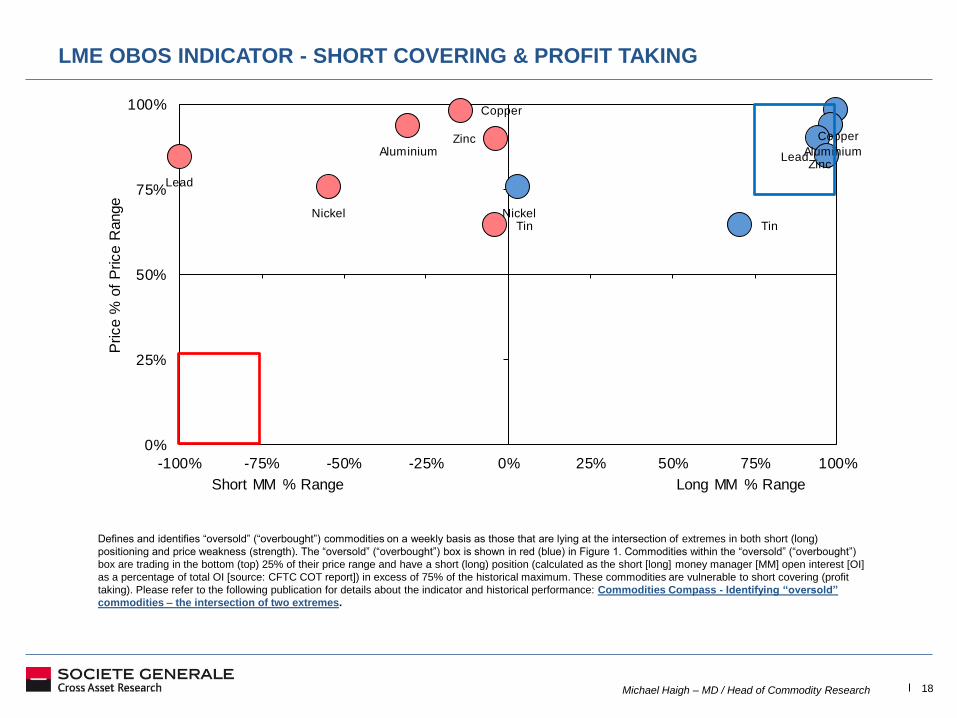
LME OBOS INDICATOR - SHORT COVERING & PROFIT TAKING
Defines and identifies “oversold” (“overbought”) commodities on a weekly basis as those that are lying at the intersection of extremes in both short (long)
positioning and price weakness (strength). The “oversold” (“overbought”) box is shown in red (blue) in Figure 1. Commodities within the “oversold” (“overbought”)
box are trading in the bottom (top) 25% of their price range and have a short (long) position (calculated as the short [long] money manager [MM] open interest [OI]
as a percentage of total OI [source: CFTC COT report]) in excess of 75% of the historical maximum. These commodities are vulnerable to short covering (profit
taking). Please refer to the following publication for details about the indicator and historical performance: Commodities Compass - Identifying “oversold”
commodities – the intersection of two extremes.
Michael Haigh – MD / Head of Commodity Research 19
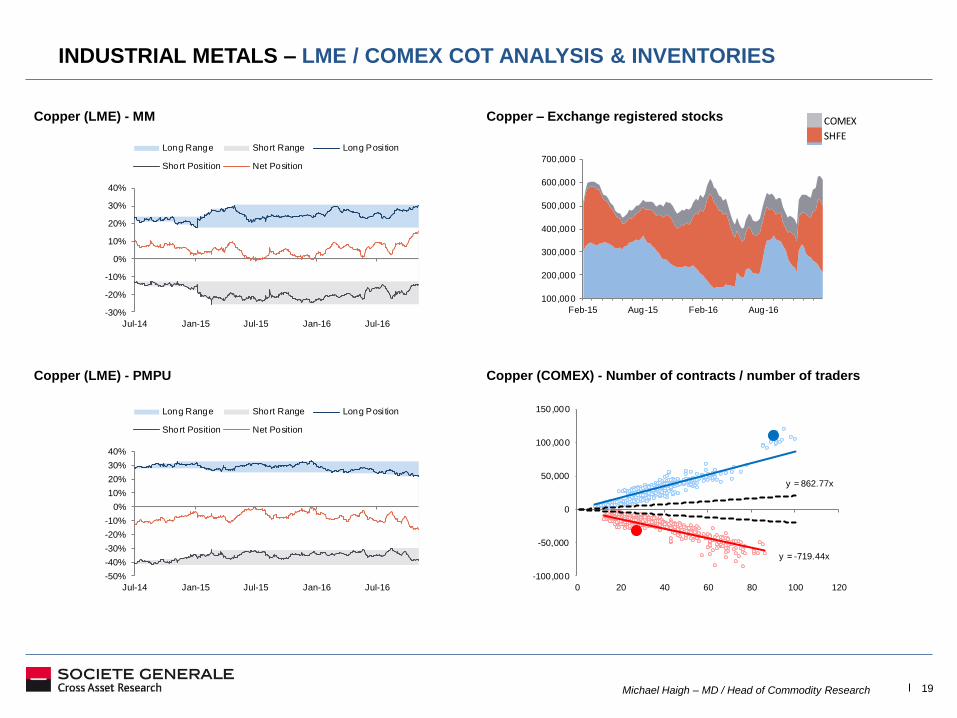
INDUSTRIAL METALS – LME / COMEX COT ANALYSIS & INVENTORIES
Copper (LME) - MM Copper – Exchange registered stocks
Copper (LME) - PMPU Copper (COMEX) - Number of contracts / number of traders
-30%
-20%
-10%
0%
10%
20%
30%
40%
Jul-14 Jan-15 Jul-15 Jan-16 Jul-16
Long Range Short Range Long Posi tion
Short Position Net Position
y = 862.77x
y = -719.44x
-100,000
-50,000
0
50,000
100,000
150,000
0 20 40 60 80 100 120
COMEX
SHFE
LME
-50%
-40%
-30%
-20%
-10%
0%
10%
20%
30%
40%
Jul-14 Jan-15 Jul-15 Jan-16 Jul-16
Long Range Short Range Long Posi tion
Short Position Net Position
100,000
200,000
300,000
400,000
500,000
600,000
700,000
Feb-15 Aug-15 Feb-16 Aug-16
Michael Haigh – MD / Head of Commodity Research 20
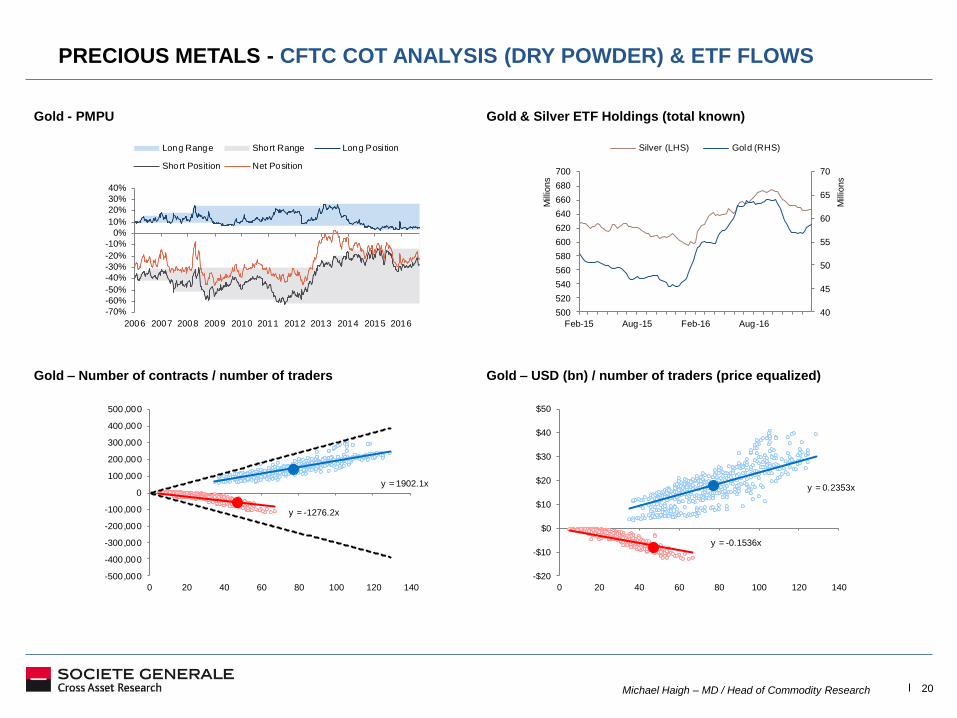
PRECIOUS METALS - CFTC COT ANALYSIS (DRY POWDER) & ETF FLOWS
Gold - PMPU Gold & Silver ETF Holdings (total known)
Gold – Number of contracts / number of traders Gold – USD (bn) / number of traders (price equalized)
y = 1902.1x
y = -1276.2x
-500,000
-400,000
-300,000
-200,000
-100,000
0
100,000
200,000
300,000
400,000
500,000
0 20 40 60 80 100 120 140
y = 0.2353x
y = -0.1536x
-$20
-$10
$0
$10
$20
$30
$40
$50
0 20 40 60 80 100 120 140
-70%
-60%
-50%
-40%
-30%
-20%
-10%
0%
10%
20%
30%
40%
2006 2007 2008 2009 2010 2011 2012 2013 2014 2015 2016
Long Range Short Range Long Posi tion
Short Position Net Position
40
45
50
55
60
65
70
500
520
540
560
580
600
620
640
660
680
700
Feb-15 Aug-15 Feb-16 Aug-16
Mill
ions
Mill
ions
Silver (LHS) Gold (RHS)
Michael Haigh – MD / Head of Commodity Research 21
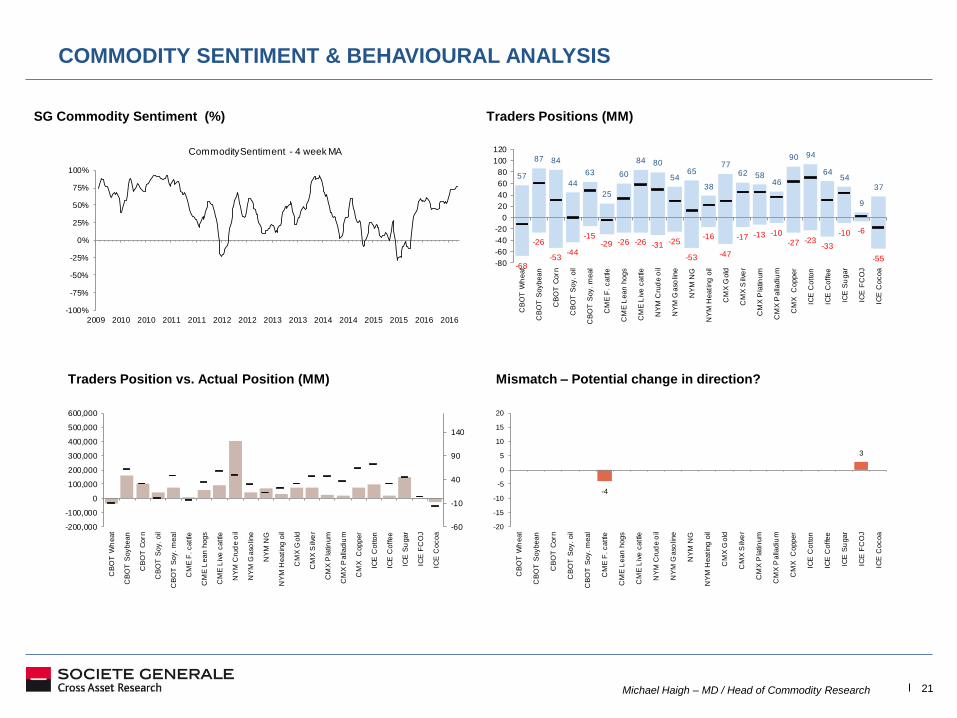
COMMODITY SENTIMENT & BEHAVIOURAL ANALYSIS
-100%
-75%
-50%
-25%
0%
25%
50%
75%
100%
2009 2010 2010 2011 2011 2012 2012 2013 2013 2014 2014 2015 2015 2016 2016
Commodity Sentiment - 4 week MA
57
87 84
44
63
25
60
84 80
5465
38
7762 58
46
90 94
6454
9
37
-68
-26
-53-44
-15-29 -26 -26 -31 -25
-53
-16
-47
-17 -13 -10
-27 -23-33
-10 -6
-55-80
-60
-40
-20
0
20
40
60
80
100
120
CB
OT
Wh
ea
t
CB
OT
Soybean
CB
OT
Corn
CB
OT
Soy. oil
CB
OT
Soy. m
eal
CM
E F
. c
attle
CM
E L
ea
n h
og
s
CM
E L
ive
ca
ttle
NY
M C
rud
e o
il
NY
M G
aso
line
NY
M N
G
NY
M H
eati
ng
oil
CM
X G
old
CM
X S
ilve
r
CM
X P
latin
um
CM
X P
alla
diu
m
CM
X C
op
pe
r
ICE
Co
tto
n
ICE
Coffee
ICE
Su
gar
ICE
FC
OJ
ICE
Coc
oa
-60
-10
40
90
140
-200,000
-100,000
0
100,000
200,000
300,000
400,000
500,000
600,000
CB
OT
Wh
eat
CB
OT
So
yb
ea
n
CB
OT
Co
rn
CB
OT
Soy. oil
CB
OT
So
y. m
ea
l
CM
E F
. cattle
CM
E L
ean
hog
s
CM
E L
ive
ca
ttle
NY
M C
rud
e o
il
NY
M G
aso
line
NY
M N
G
NY
M H
eati
ng
oil
CM
X G
old
CM
X S
ilve
r
CM
X P
latin
um
CM
X P
alla
diu
m
CM
X C
opper
ICE
Cotton
ICE
Co
ffe
e
ICE
Su
gar
ICE
FC
OJ
ICE
Co
co
a
-4
3
-20
-15
-10
-5
0
5
10
15
20
CB
OT
Wh
eat
CB
OT
So
yb
ea
n
CB
OT
Co
rn
CB
OT
Soy. oil
CB
OT
Soy. m
eal
CM
E F
. c
attle
CM
E L
ea
n h
og
s
CM
E L
ive c
attle
NY
M C
rud
e o
il
NY
M G
aso
line
NY
M N
G
NY
M H
eati
ng
oil
CM
X G
old
CM
X S
ilve
r
CM
X P
latin
um
CM
X P
alla
diu
m
CM
X C
op
pe
r
ICE
Co
tto
n
ICE
Coffee
ICE
Su
gar
ICE
FC
OJ
ICE
Co
co
a
Mismatch – Potential change in direction? Traders Position vs. Actual Position (MM)
SG Commodity Sentiment (%) Traders Positions (MM)
Michael Haigh – MD / Head of Commodity Research 22
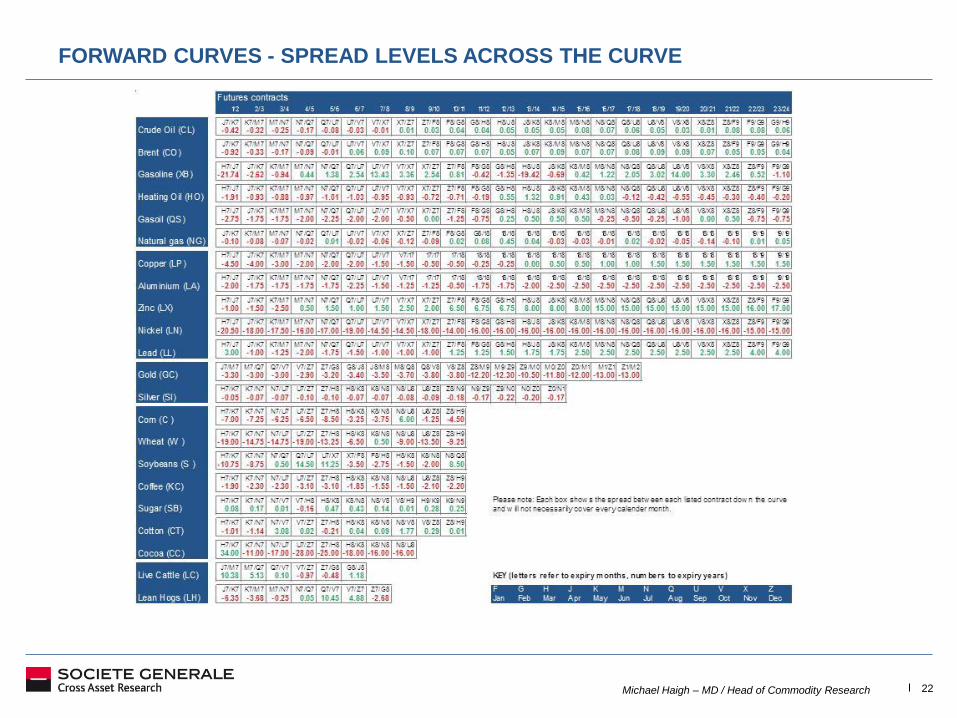
FORWARD CURVES - SPREAD LEVELS ACROSS THE CURVE
Michael Haigh – MD / Head of Commodity Research 23
UNDER PRESSURE – AN ANALYSIS OF FUTURES TRADING ALONG THE CRUDE CURVE AND
HOW HEDGING/TRADING PRESSURE COULD IMPACT STRUCTURE
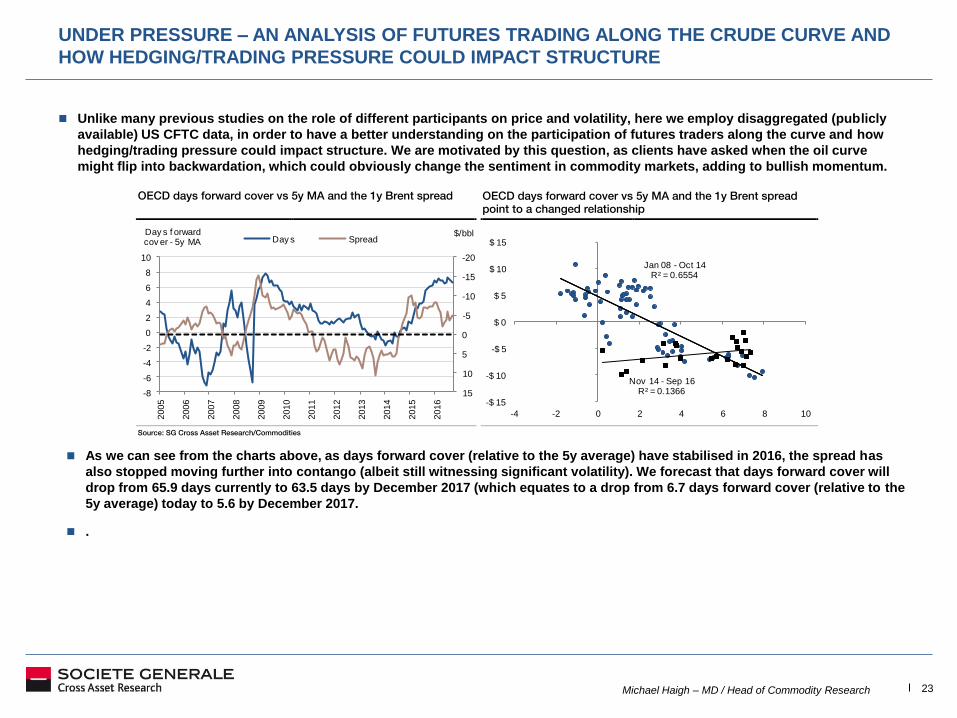
Unlike many previous studies on the role of different participants on price and volatility, here we employ disaggregated (publicly
available) US CFTC data, in order to have a better understanding on the participation of futures traders along the curve and how
hedging/trading pressure could impact structure. We are motivated by this question, as clients have asked when the oil curve
might flip into backwardation, which could obviously change the sentiment in commodity markets, adding to bullish momentum.
OECD days forward cover vs 5y MA and the 1y Brent spread OECD days forward cover vs 5y MA and the 1y Brent spread
point to a changed relationship
Source: SG Cross Asset Research/Commodities
-20
-15
-10
-5
0
5
10
15-8
-6
-4
-2
0
2
4
6
8
10
2005
2006
2007
2008
2009
2010
2011
2012
2013
2014
2015
2016
$/bblDay s f orward cov er - 5y MA Day s Spread
Jan 08 - Oct 14R² = 0.6554
Nov 14 - Sep 16R² = 0.1366
-$ 15
-$ 10
-$ 5
$ 0
$ 5
$ 10
$ 15
-4 -2 0 2 4 6 8 10
As we can see from the charts above, as days forward cover (relative to the 5y average) have stabilised in 2016, the spread has
also stopped moving further into contango (albeit still witnessing significant volatility). We forecast that days forward cover will
drop from 65.9 days currently to 63.5 days by December 2017 (which equates to a drop from 6.7 days forward cover (relative to the
5y average) today to 5.6 by December 2017.
.
Michael Haigh – MD / Head of Commodity Research 24
UNDER PRESSURE
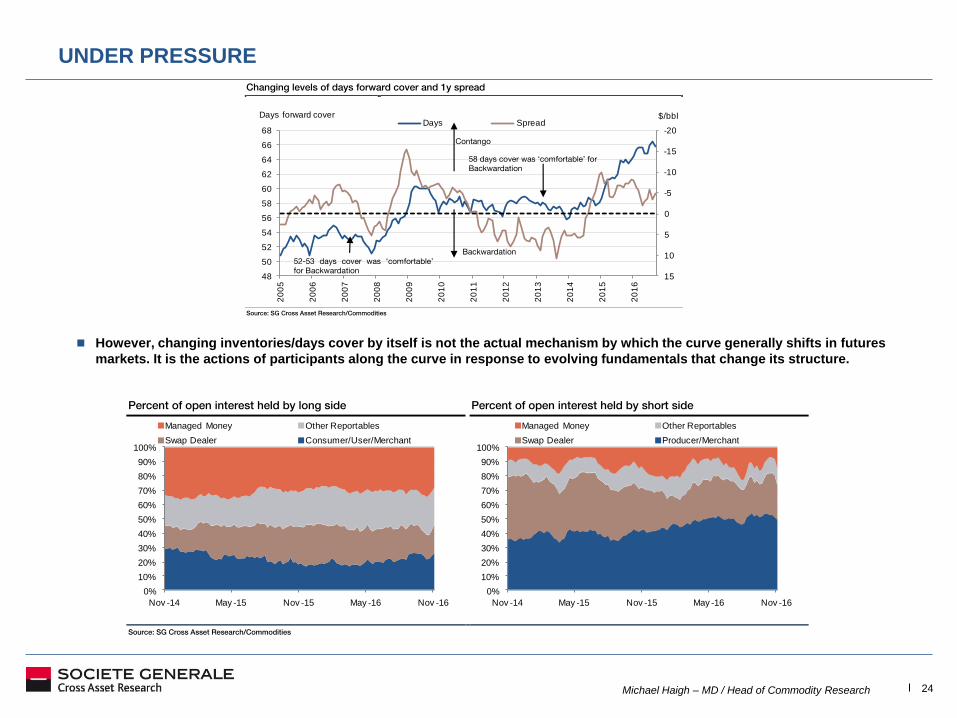
However, changing inventories/days cover by itself is not the actual mechanism by which the curve generally shifts in futures
markets. It is the actions of participants along the curve in response to evolving fundamentals that change its structure.
Changing levels of days forward cover and 1y spread
Source: SG Cross Asset Research/Commodities
-20
-15
-10
-5
0
5
10
1548
50
52
54
56
58
60
62
64
66
68
20
05
20
06
20
07
20
08
20
09
20
10
20
11
20
12
20
13
20
14
20
15
20
16
$/bblDays forward cover Days Spread
Contango
Backwardation
52-53 days cover was ‘comfortable’
for Backwardation
58 days cover was ‘comfortable’ for
Backwardation
Percent of open interest held by long side Percent of open interest held by short side
Source: SG Cross Asset Research/Commodities
0%
10%
20%
30%
40%
50%
60%
70%
80%
90%
100%
Nov -14 May -15 Nov -15 May -16 Nov -16
Managed Money Other Reportables
Swap Dealer Consumer/User/Merchant
0%
10%
20%
30%
40%
50%
60%
70%
80%
90%
100%
Nov -14 May -15 Nov -15 May -16 Nov -16
Managed Money Other Reportables
Swap Dealer Producer/Merchant
Michael Haigh – MD / Head of Commodity Research 25
UNDER PRESSURE – NOV 2016
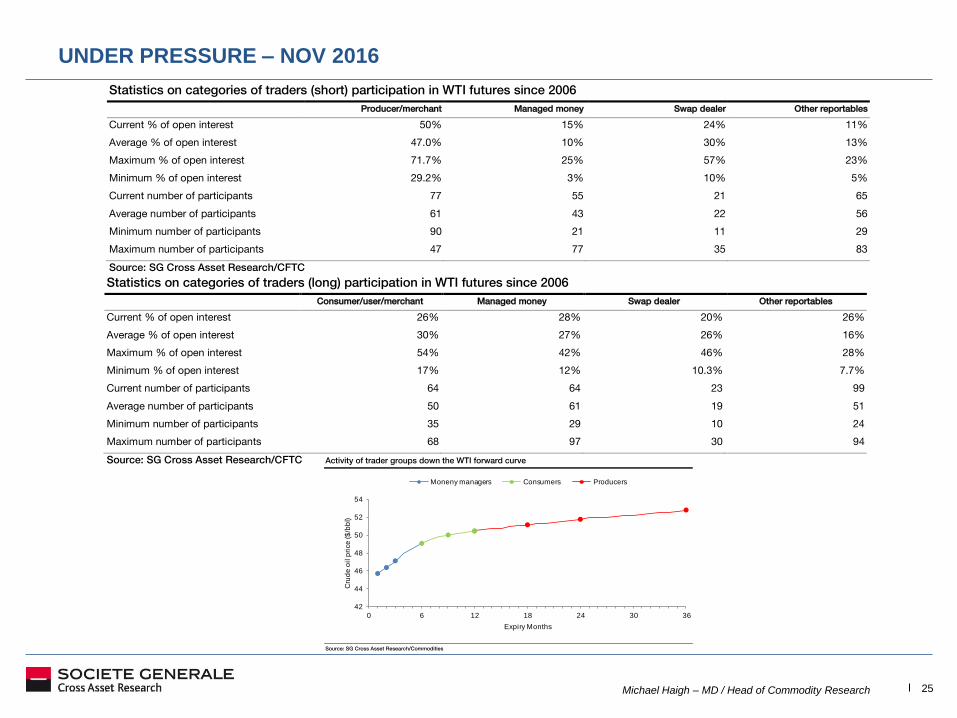
Statistics on categories of traders (short) participation in WTI futures since 2006
Producer/merchant Managed money Swap dealer Other reportables
Current % of open interest 50% 15% 24% 11%
Average % of open interest 47.0% 10% 30% 13%
Maximum % of open interest 71.7% 25% 57% 23%
Minimum % of open interest 29.2% 3% 10% 5%
Current number of participants 77 55 21 65
Average number of participants 61 43 22 56
Minimum number of participants 90 21 11 29
Maximum number of participants 47 77 35 83
Source: SG Cross Asset Research/CFTC
Statistics on categories of traders (long) participation in WTI futures since 2006
Consumer/user/merchant Managed money Swap dealer Other reportables
Current % of open interest 26% 28% 20% 26%
Average % of open interest 30% 27% 26% 16%
Maximum % of open interest 54% 42% 46% 28%
Minimum % of open interest 17% 12% 10.3% 7.7%
Current number of participants 64 64 23 99
Average number of participants 50 61 19 51
Minimum number of participants 35 29 10 24
Maximum number of participants 68 97 30 94
Source: SG Cross Asset Research/CFTC Activity of trader groups down the WTI forward curve
Source: SG Cross Asset Research/Commodities
42
44
46
48
50
52
54
0 6 12 18 24 30 36
Cru
de
oil
pri
ce
($
/bb
l)
Expiry Months
Moneny managers Consumers Producers
Michael Haigh – MD / Head of Commodity Research 26
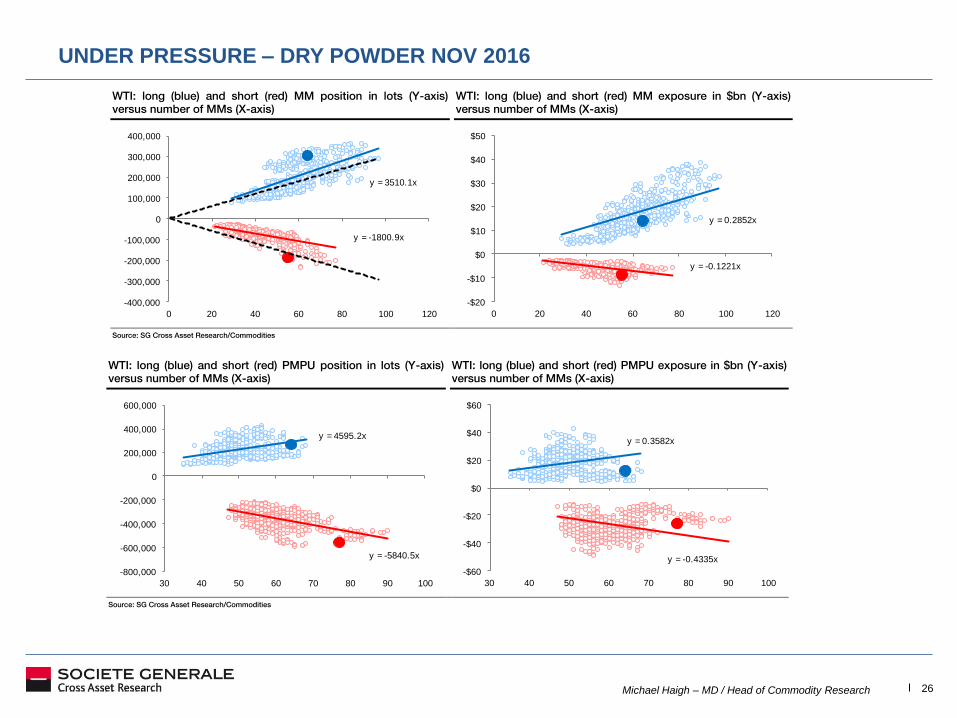
UNDER PRESSURE – DRY POWDER NOV 2016
WTI: long (blue) and short (red) MM position in lots (Y-axis)
versus number of MMs (X-axis)
WTI: long (blue) and short (red) MM exposure in $bn (Y-axis)
versus number of MMs (X-axis)
Source: SG Cross Asset Research/Commodities
y = 3510.1x
y = -1800.9x
-400,000
-300,000
-200,000
-100,000
0
100,000
200,000
300,000
400,000
0 20 40 60 80 100 120
y = 0.2852x
y = -0.1221x
-$20
-$10
$0
$10
$20
$30
$40
$50
0 20 40 60 80 100 120
WTI: long (blue) and short (red) PMPU position in lots (Y-axis)
versus number of MMs (X-axis)
WTI: long (blue) and short (red) PMPU exposure in $bn (Y-axis)
versus number of MMs (X-axis)
Source: SG Cross Asset Research/Commodities
y = 4595.2x
y = -5840.5x
-800,000
-600,000
-400,000
-200,000
0
200,000
400,000
600,000
30 40 50 60 70 80 90 100
y = 0.3582x
y = -0.4335x
-$60
-$40
-$20
$0
$20
$40
$60
30 40 50 60 70 80 90 100
Michael Haigh – MD / Head of Commodity Research 27
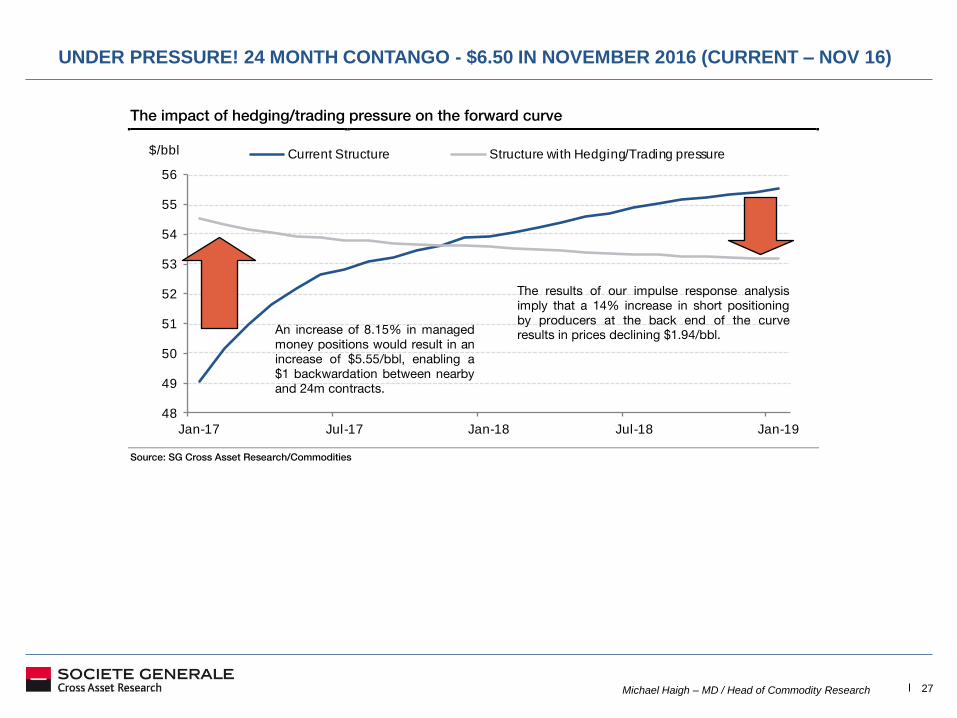
UNDER PRESSURE! 24 MONTH CONTANGO - $6.50 IN NOVEMBER 2016 (CURRENT – NOV 16)
The impact of hedging/trading pressure on the forward curve
Source: SG Cross Asset Research/Commodities
48
49
50
51
52
53
54
55
56
Jan-17 Jul-17 Jan-18 Jul-18 Jan-19
$/bbl Current Structure Structure with Hedging/Trading pressure
The results of our impulse response analysis
imply that a 14% increase in short positioning
by producers at the back end of the curve
results in prices declining $1.94/bbl. An increase of 8.15% in managed
money positions would result in an
increase of $5.55/bbl, enabling a
$1 backwardation between nearby
and 24m contracts.
Michael Haigh – MD / Head of Commodity Research 28
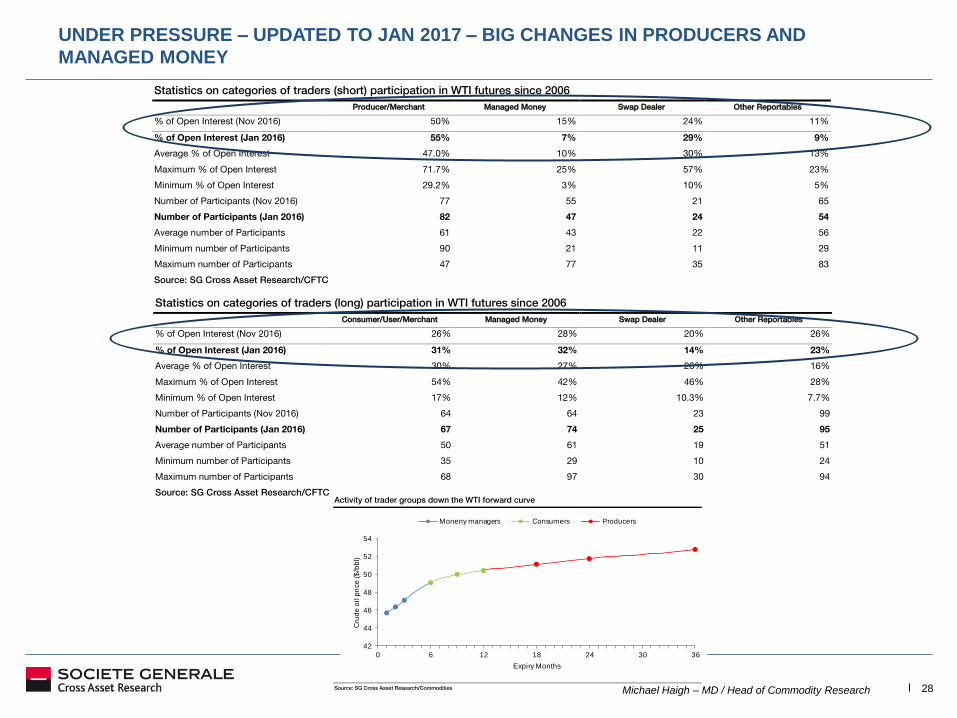
UNDER PRESSURE – UPDATED TO JAN 2017 – BIG CHANGES IN PRODUCERS AND
MANAGED MONEY
Activity of trader groups down the WTI forward curve
Source: SG Cross Asset Research/Commodities
42
44
46
48
50
52
54
0 6 12 18 24 30 36
Cru
de
oil
pri
ce
($
/bb
l)
Expiry Months
Moneny managers Consumers Producers
Statistics on categories of traders (long) participation in WTI futures since 2006
Consumer/User/Merchant Managed Money Swap Dealer Other Reportables
% of Open Interest (Nov 2016) 26% 28% 20% 26%
% of Open Interest (Jan 2016) 31% 32% 14% 23%
Average % of Open Interest 30% 27% 26% 16%
Maximum % of Open Interest 54% 42% 46% 28%
Minimum % of Open Interest 17% 12% 10.3% 7.7%
Number of Participants (Nov 2016) 64 64 23 99
Number of Participants (Jan 2016) 67 74 25 95
Average number of Participants 50 61 19 51
Minimum number of Participants 35 29 10 24
Maximum number of Participants 68 97 30 94
Source: SG Cross Asset Research/CFTC
Statistics on categories of traders (short) participation in WTI futures since 2006
Producer/Merchant Managed Money Swap Dealer Other Reportables
% of Open Interest (Nov 2016) 50% 15% 24% 11%
% of Open Interest (Jan 2016) 55% 7% 29% 9%
Average % of Open Interest 47.0% 10% 30% 13%
Maximum % of Open Interest 71.7% 25% 57% 23%
Minimum % of Open Interest 29.2% 3% 10% 5%
Number of Participants (Nov 2016) 77 55 21 65
Number of Participants (Jan 2016) 82 47 24 54
Average number of Participants 61 43 22 56
Minimum number of Participants 90 21 11 29
Maximum number of Participants 47 77 35 83
Source: SG Cross Asset Research/CFTC
Michael Haigh – MD / Head of Commodity Research 29
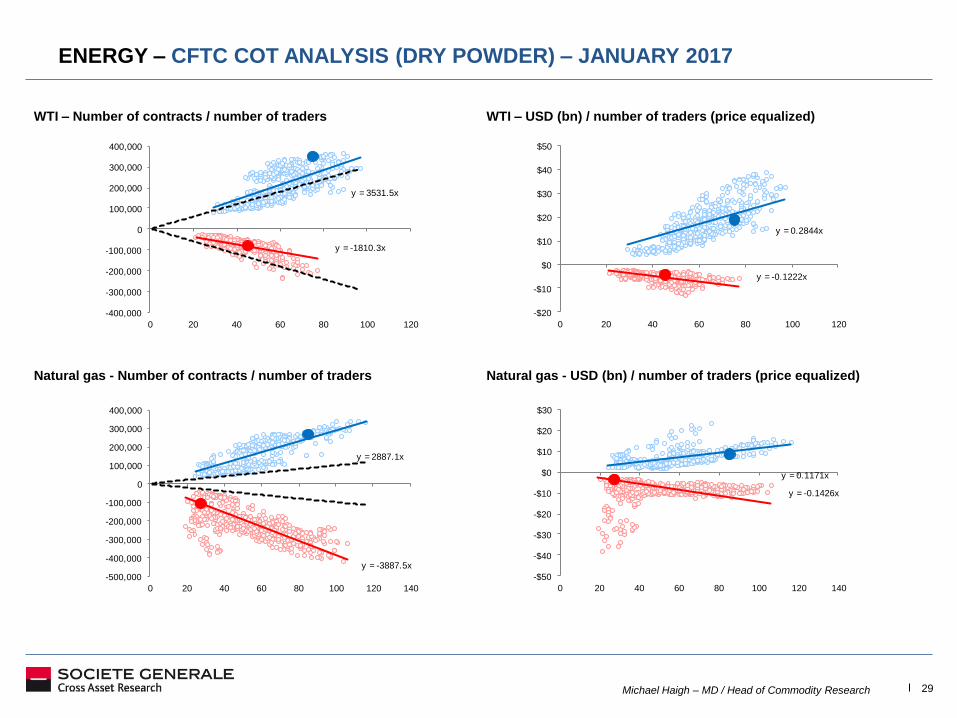
ENERGY – CFTC COT ANALYSIS (DRY POWDER) – JANUARY 2017
WTI – Number of contracts / number of traders WTI – USD (bn) / number of traders (price equalized)
Natural gas - Number of contracts / number of traders Natural gas - USD (bn) / number of traders (price equalized)
y = 3531.5x
y = -1810.3x
-400,000
-300,000
-200,000
-100,000
0
100,000
200,000
300,000
400,000
0 20 40 60 80 100 120
y = 0.2844x
y = -0.1222x
-$20
-$10
$0
$10
$20
$30
$40
$50
0 20 40 60 80 100 120
y = 2887.1x
y = -3887.5x
-500,000
-400,000
-300,000
-200,000
-100,000
0
100,000
200,000
300,000
400,000
0 20 40 60 80 100 120 140
y = 0.1171x
y = -0.1426x
-$50
-$40
-$30
-$20
-$10
$0
$10
$20
$30
0 20 40 60 80 100 120 140
Michael Haigh – MD / Head of Commodity Research 30
UNDER PRESSURE! CURVE FLATTENED AS PRODUCERS SHORTED AND FRONT LIFTED AS
FUNDS ENTERED
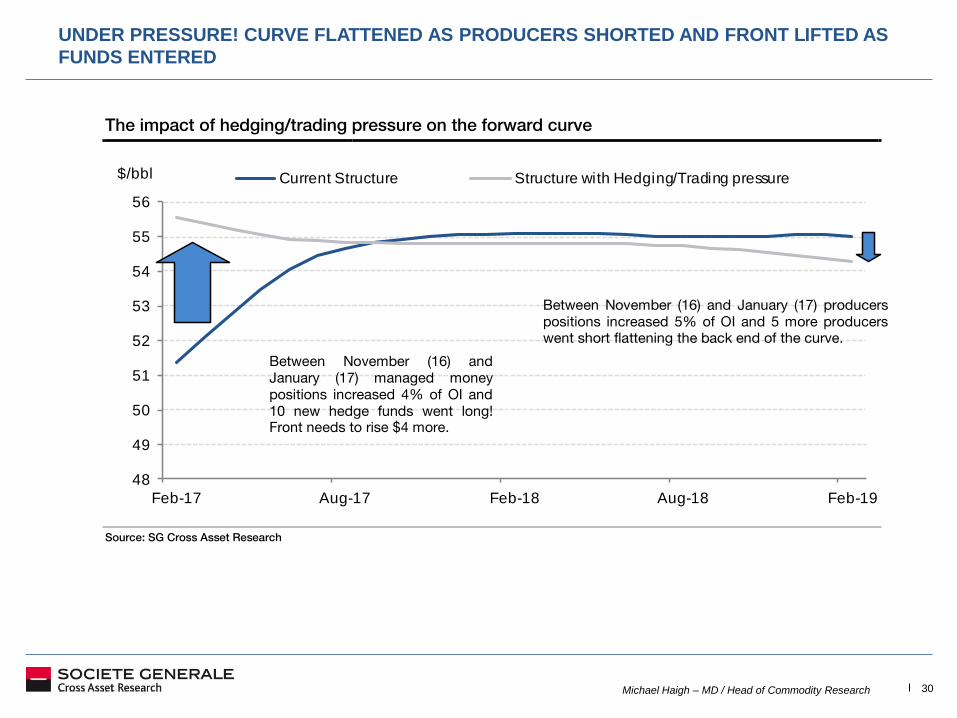
The impact of hedging/trading pressure on the forward curve
Source: SG Cross Asset Research
48
49
50
51
52
53
54
55
56
Feb-17 Aug-17 Feb-18 Aug-18 Feb-19
$/bbl Current Structure Structure with Hedging/Trading pressure
Between November (16) and January (17) producers
positions increased 5% of OI and 5 more producers
went short flattening the back end of the curve.
Between November (16) and
January (17) managed money
positions increased 4% of OI and
10 new hedge funds went long! Front needs to rise $4 more.
Michael Haigh – MD / Head of Commodity Research 31
ENERGY – CFTC COT ANALYSIS (DRY POWDER) – END OF FEB 2017
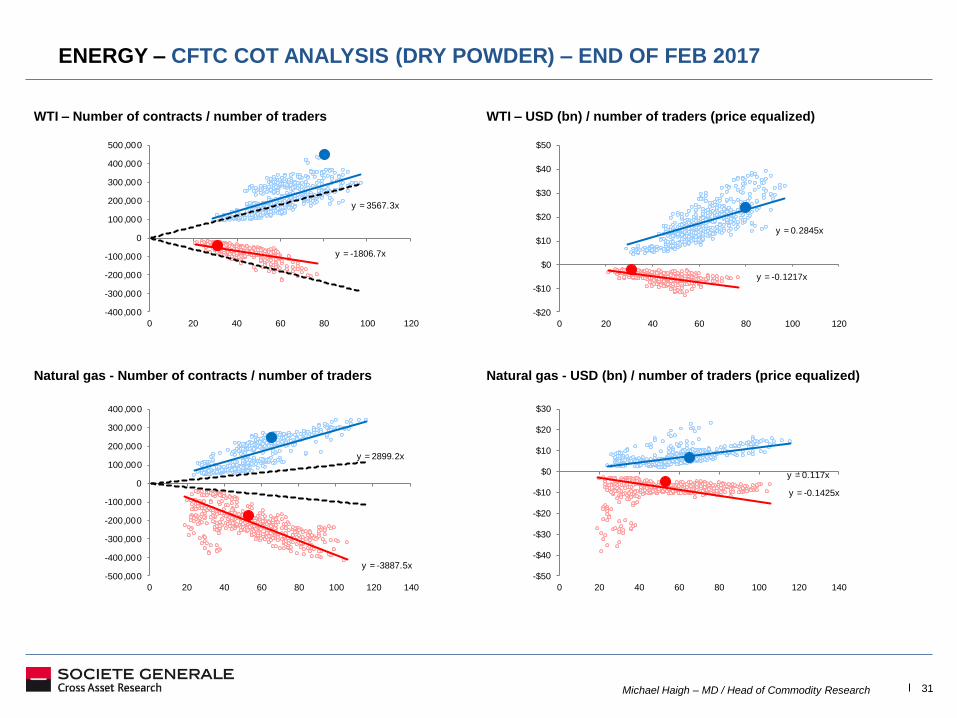
WTI – Number of contracts / number of traders WTI – USD (bn) / number of traders (price equalized)
Natural gas - Number of contracts / number of traders Natural gas - USD (bn) / number of traders (price equalized)
y = 3567.3x
y = -1806.7x
-400,000
-300,000
-200,000
-100,000
0
100,000
200,000
300,000
400,000
500,000
0 20 40 60 80 100 120
y = 0.2845x
y = -0.1217x
-$20
-$10
$0
$10
$20
$30
$40
$50
0 20 40 60 80 100 120
y = 2899.2x
y = -3887.5x
-500,000
-400,000
-300,000
-200,000
-100,000
0
100,000
200,000
300,000
400,000
0 20 40 60 80 100 120 140
y = 0.117x
y = -0.1425x
-$50
-$40
-$30
-$20
-$10
$0
$10
$20
$30
0 20 40 60 80 100 120 140
Michael Haigh – MD / Head of Commodity Research 32 Michael Haigh- MD / Head of Commodity Research
A NEW GENERATION OF RSI – MEASURING WHEN THE WTI CURVE FLIPS
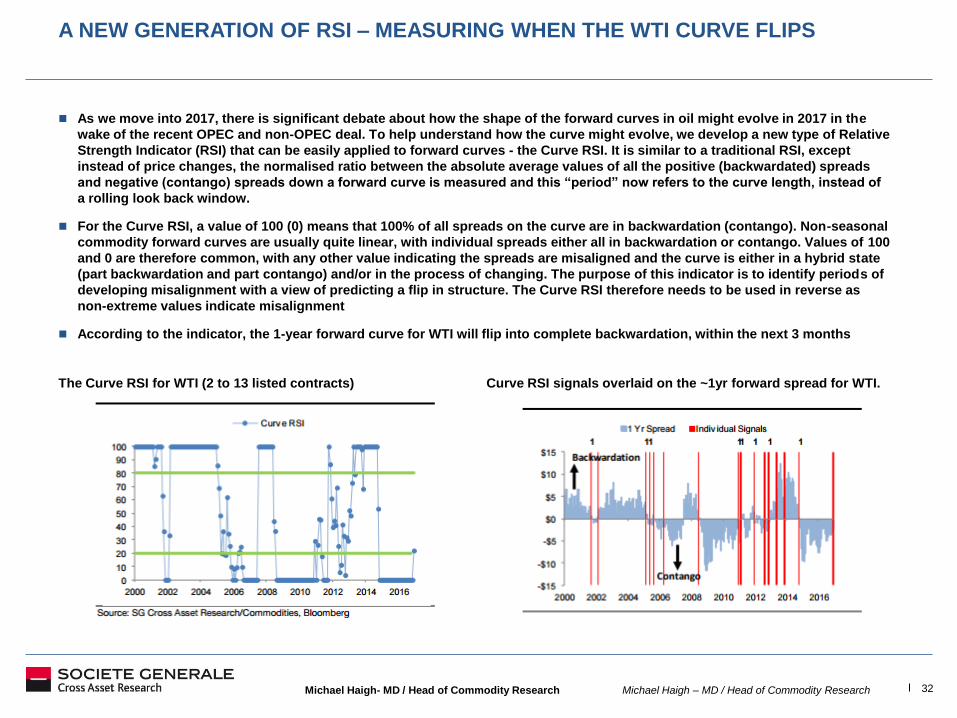
As we move into 2017, there is significant debate about how the shape of the forward curves in oil might evolve in 2017 in the
wake of the recent OPEC and non-OPEC deal. To help understand how the curve might evolve, we develop a new type of Relative
Strength Indicator (RSI) that can be easily applied to forward curves - the Curve RSI. It is similar to a traditional RSI, except
instead of price changes, the normalised ratio between the absolute average values of all the positive (backwardated) spreads
and negative (contango) spreads down a forward curve is measured and this “period” now refers to the curve length, instead of
a rolling look back window.
For the Curve RSI, a value of 100 (0) means that 100% of all spreads on the curve are in backwardation (contango). Non-seasonal
commodity forward curves are usually quite linear, with individual spreads either all in backwardation or contango. Values of 100
and 0 are therefore common, with any other value indicating the spreads are misaligned and the curve is either in a hybrid state
(part backwardation and part contango) and/or in the process of changing. The purpose of this indicator is to identify periods of
developing misalignment with a view of predicting a flip in structure. The Curve RSI therefore needs to be used in reverse as
non-extreme values indicate misalignment
According to the indicator, the 1-year forward curve for WTI will flip into complete backwardation, within the next 3 months
The Curve RSI for WTI (2 to 13 listed contracts) Curve RSI signals overlaid on the ~1yr forward spread for WTI.
Michael Haigh – MD / Head of Commodity Research 33 Michael Haigh- MD / Head of Commodity Research
A NEW GENERATION OF RSI – MEASURING WHEN THE WTI AND BRENT CURVE
FLIPS
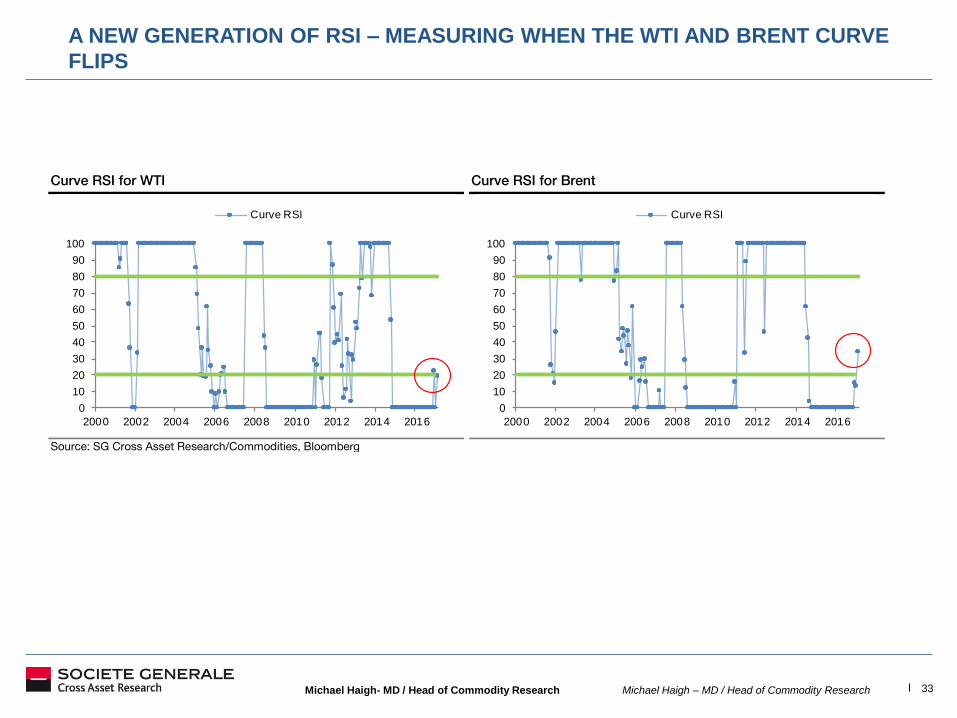
Curve RSI for WTI Curve RSI for Brent
Source: SG Cross Asset Research/Commodities, Bloomberg
0
10
20
30
40
50
60
70
80
90
100
2000 2002 2004 2006 2008 2010 2012 2014 2016
Curve RSI
0
10
20
30
40
50
60
70
80
90
100
2000 2002 2004 2006 2008 2010 2012 2014 2016
Curve RSI
Michael Haigh – MD / Head of Commodity Research 34
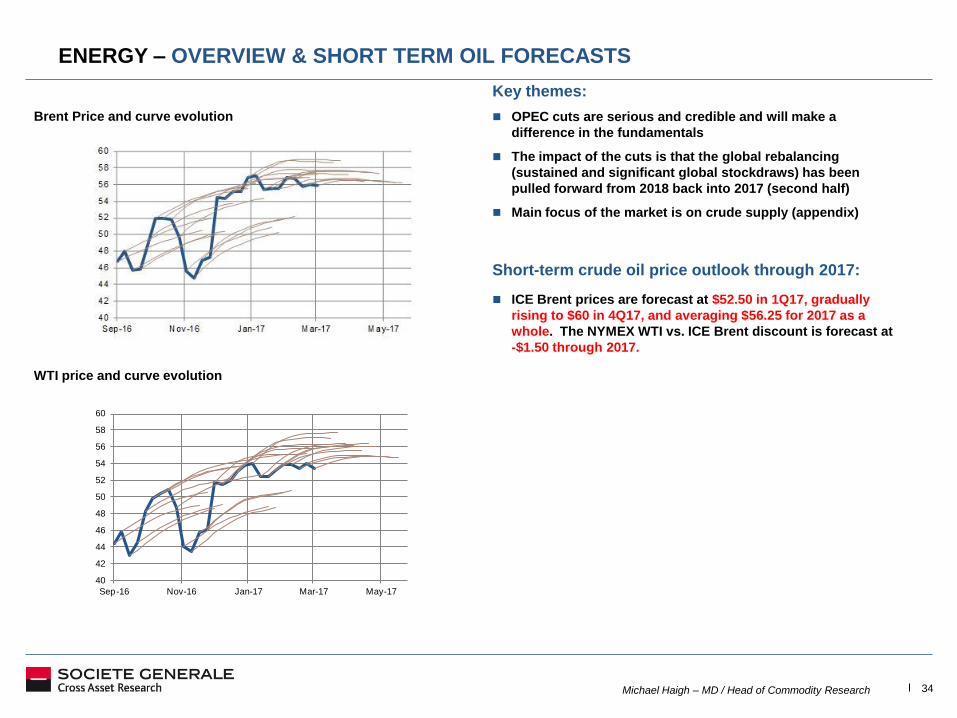
ENERGY – OVERVIEW & SHORT TERM OIL FORECASTS
Key themes:
OPEC cuts are serious and credible and will make a
difference in the fundamentals
The impact of the cuts is that the global rebalancing
(sustained and significant global stockdraws) has been
pulled forward from 2018 back into 2017 (second half)
Main focus of the market is on crude supply (appendix)
Short-term crude oil price outlook through 2017:
ICE Brent prices are forecast at $52.50 in 1Q17, gradually
rising to $60 in 4Q17, and averaging $56.25 for 2017 as a
whole. The NYMEX WTI vs. ICE Brent discount is forecast at
-$1.50 through 2017.
Brent Price and curve evolution
WTI price and curve evolution
40
42
44
46
48
50
52
54
56
58
60
Sep-16 Nov-16 Jan-17 Mar-17 May-17
Michael Haigh – MD / Head of Commodity Research 35
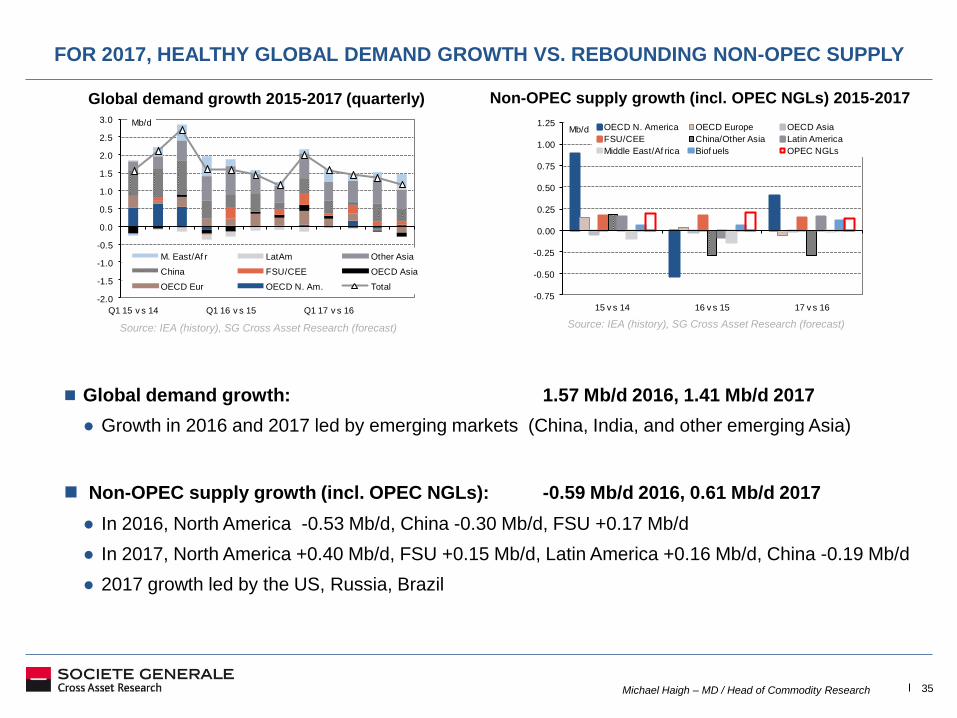
Global demand growth: 1.57 Mb/d 2016, 1.41 Mb/d 2017
● Growth in 2016 and 2017 led by emerging markets (China, India, and other emerging Asia)
Non-OPEC supply growth (incl. OPEC NGLs): -0.59 Mb/d 2016, 0.61 Mb/d 2017
● In 2016, North America -0.53 Mb/d, China -0.30 Mb/d, FSU +0.17 Mb/d
● In 2017, North America +0.40 Mb/d, FSU +0.15 Mb/d, Latin America +0.16 Mb/d, China -0.19 Mb/d
● 2017 growth led by the US, Russia, Brazil
Global demand growth 2015-2017 (quarterly)
Non-OPEC supply growth (incl. OPEC NGLs) 2015-2017
FOR 2017, HEALTHY GLOBAL DEMAND GROWTH VS. REBOUNDING NON-OPEC SUPPLY
Source: IEA (history), SG Cross Asset Research (forecast) Source: IEA (history), SG Cross Asset Research (forecast)
-2.0
-1.5
-1.0
-0.5
0.0
0.5
1.0
1.5
2.0
2.5
3.0
Q1 15 v s 14 Q1 16 v s 15 Q1 17 v s 16
Mb/d
M. East/Af r LatAm Other Asia
China FSU/CEE OECD Asia
OECD Eur OECD N. Am. Total-0.75
-0.50
-0.25
0.00
0.25
0.50
0.75
1.00
1.25
15 v s 14 16 v s 15 17 v s 16
Mb/d OECD N. America OECD Europe OECD Asia
FSU/CEE China/Other Asia Latin America
Middle East/Af rica Biof uels OPEC NGLs
Michael Haigh – MD / Head of Commodity Research 36
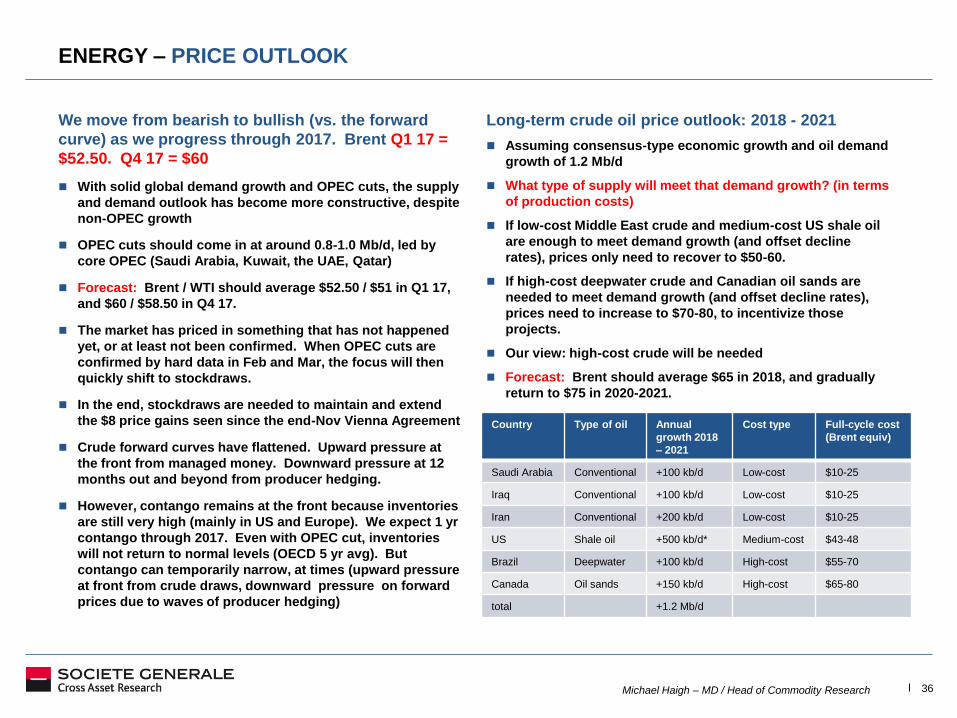
ENERGY – PRICE OUTLOOK
We move from bearish to bullish (vs. the forward
curve) as we progress through 2017. Brent Q1 17 =
$52.50. Q4 17 = $60
With solid global demand growth and OPEC cuts, the supply
and demand outlook has become more constructive, despite
non-OPEC growth
OPEC cuts should come in at around 0.8-1.0 Mb/d, led by
core OPEC (Saudi Arabia, Kuwait, the UAE, Qatar)
Forecast: Brent / WTI should average $52.50 / $51 in Q1 17,
and $60 / $58.50 in Q4 17.
The market has priced in something that has not happened
yet, or at least not been confirmed. When OPEC cuts are
confirmed by hard data in Feb and Mar, the focus will then
quickly shift to stockdraws.
In the end, stockdraws are needed to maintain and extend
the $8 price gains seen since the end-Nov Vienna Agreement
Crude forward curves have flattened. Upward pressure at
the front from managed money. Downward pressure at 12
months out and beyond from producer hedging.
However, contango remains at the front because inventories
are still very high (mainly in US and Europe). We expect 1 yr
contango through 2017. Even with OPEC cut, inventories
will not return to normal levels (OECD 5 yr avg). But
contango can temporarily narrow, at times (upward pressure
at front from crude draws, downward pressure on forward
prices due to waves of producer hedging)
Long-term crude oil price outlook: 2018 - 2021
Assuming consensus-type economic growth and oil demand
growth of 1.2 Mb/d
What type of supply will meet that demand growth? (in terms
of production costs)
If low-cost Middle East crude and medium-cost US shale oil
are enough to meet demand growth (and offset decline
rates), prices only need to recover to $50-60.
If high-cost deepwater crude and Canadian oil sands are
needed to meet demand growth (and offset decline rates),
prices need to increase to $70-80, to incentivize those
projects.
Our view: high-cost crude will be needed
Forecast: Brent should average $65 in 2018, and gradually
return to $75 in 2020-2021.
Country Type of oil Annual
growth 2018
– 2021
Cost type Full-cycle cost
(Brent equiv)
Saudi Arabia Conventional +100 kb/d Low-cost $10-25
Iraq Conventional +100 kb/d Low-cost $10-25
Iran Conventional +200 kb/d Low-cost $10-25
US Shale oil +500 kb/d* Medium-cost $43-48
Brazil Deepwater +100 kb/d High-cost $55-70
Canada Oil sands +150 kb/d High-cost $65-80
total +1.2 Mb/d
Michael Haigh – MD / Head of Commodity Research 37
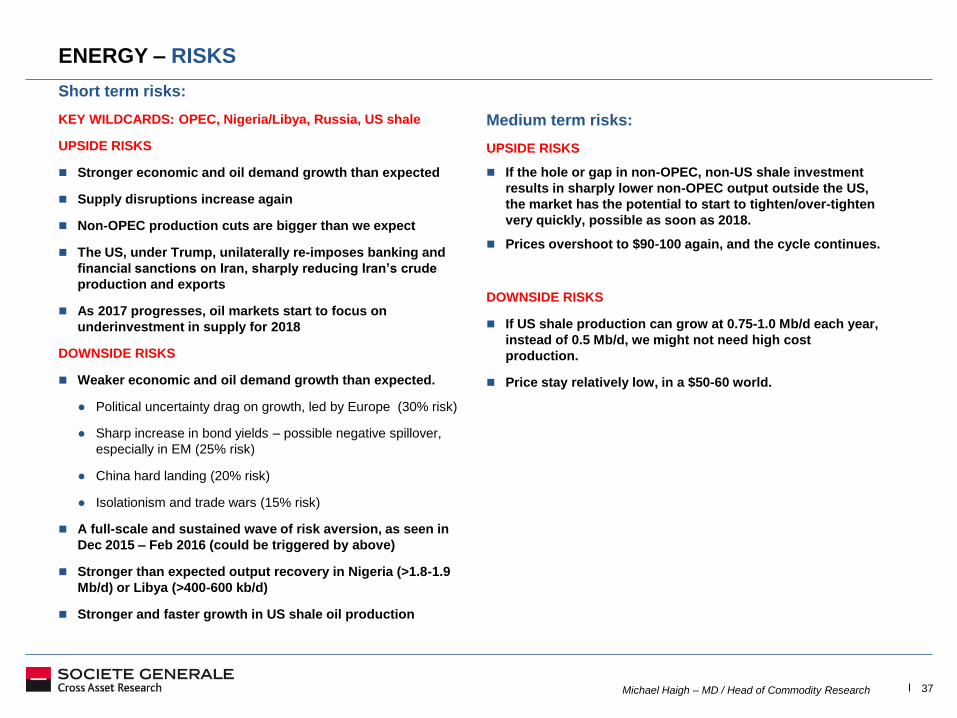
ENERGY – RISKS
Short term risks:
KEY WILDCARDS: OPEC, Nigeria/Libya, Russia, US shale
UPSIDE RISKS
Stronger economic and oil demand growth than expected
Supply disruptions increase again
Non-OPEC production cuts are bigger than we expect
The US, under Trump, unilaterally re-imposes banking and
financial sanctions on Iran, sharply reducing Iran’s crude
production and exports
As 2017 progresses, oil markets start to focus on
underinvestment in supply for 2018
DOWNSIDE RISKS
Weaker economic and oil demand growth than expected.
● Political uncertainty drag on growth, led by Europe (30% risk)
● Sharp increase in bond yields – possible negative spillover,
especially in EM (25% risk)
● China hard landing (20% risk)
● Isolationism and trade wars (15% risk)
A full-scale and sustained wave of risk aversion, as seen in
Dec 2015 – Feb 2016 (could be triggered by above)
Stronger than expected output recovery in Nigeria (>1.8-1.9
Mb/d) or Libya (>400-600 kb/d)
Stronger and faster growth in US shale oil production
Medium term risks:
UPSIDE RISKS
If the hole or gap in non-OPEC, non-US shale investment
results in sharply lower non-OPEC output outside the US,
the market has the potential to start to tighten/over-tighten
very quickly, possible as soon as 2018.
Prices overshoot to $90-100 again, and the cycle continues.
DOWNSIDE RISKS
If US shale production can grow at 0.75-1.0 Mb/d each year,
instead of 0.5 Mb/d, we might not need high cost
production.
Price stay relatively low, in a $50-60 world.
Michael Haigh – MD / Head of Commodity Research 38
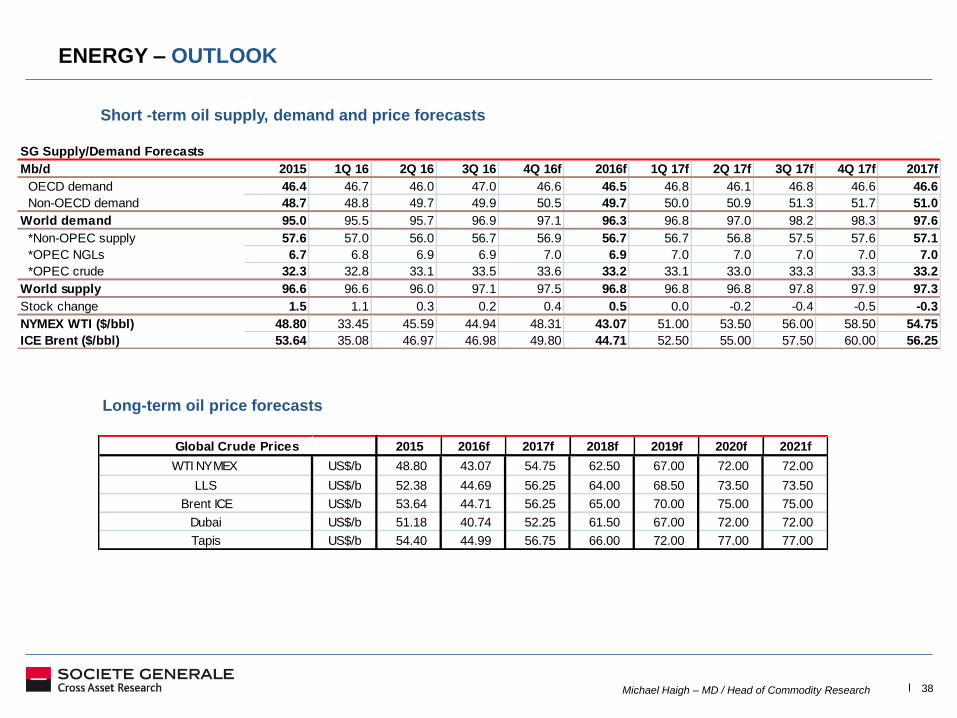
ENERGY – OUTLOOK
SG Supply/Demand Forecasts
Mb/d 2015 1Q 16 2Q 16 3Q 16 4Q 16f 2016f 1Q 17f 2Q 17f 3Q 17f 4Q 17f 2017f
OECD demand 46.4 46.7 46.0 47.0 46.6 46.5 46.8 46.1 46.8 46.6 46.6
Non-OECD demand 48.7 48.8 49.7 49.9 50.5 49.7 50.0 50.9 51.3 51.7 51.0
World demand 95.0 95.5 95.7 96.9 97.1 96.3 96.8 97.0 98.2 98.3 97.6
*Non-OPEC supply 57.6 57.0 56.0 56.7 56.9 56.7 56.7 56.8 57.5 57.6 57.1
*OPEC NGLs 6.7 6.8 6.9 6.9 7.0 6.9 7.0 7.0 7.0 7.0 7.0
*OPEC crude 32.3 32.8 33.1 33.5 33.6 33.2 33.1 33.0 33.3 33.3 33.2
World supply 96.6 96.6 96.0 97.1 97.5 96.8 96.8 96.8 97.8 97.9 97.3
Stock change 1.5 1.1 0.3 0.2 0.4 0.5 0.0 -0.2 -0.4 -0.5 -0.3
NYMEX WTI ($/bbl) 48.80 33.45 45.59 44.94 48.31 43.07 51.00 53.50 56.00 58.50 54.75
ICE Brent ($/bbl) 53.64 35.08 46.97 46.98 49.80 44.71 52.50 55.00 57.50 60.00 56.25
2015 2016f 2017f 2018f 2019f 2020f 2021f
WTI NYMEX US$/b 48.80 43.07 54.75 62.50 67.00 72.00 72.00
LLS US$/b 52.38 44.69 56.25 64.00 68.50 73.50 73.50
Brent ICE US$/b 53.64 44.71 56.25 65.00 70.00 75.00 75.00
Dubai US$/b 51.18 40.74 52.25 61.50 67.00 72.00 72.00
Tapis US$/b 54.40 44.99 56.75 66.00 72.00 77.00 77.00
Global Crude Prices
Short -term oil supply, demand and price forecasts
Long-term oil price forecasts
Michael Haigh – MD / Head of Commodity Research 39
TRUMP AND OIL: REPUBLICAN PROPOSAL FOR BORDER TAX ADJUSTMENT
The proposal by Republican Speaker of the House Paul Ryan is from August 2016. Politics is quite complicated and
traditional conservative Republicans – the source of the proposal – do not appear to be in agreement with Trump on
this issue. There is no draft legislation currently. Long process – hypothetically would not become law before 2018.
But the odds are against it. For oil: the main impact would be that the cost of crude imported in to the US would be
increased by 20% relative to domestic crude (20% comes from the new corporate tax rate).
SHORT RUN IMPACT
A global (Brent) crude price of $50 would become $60. WTI immediately jumps to parity with Brent, because US
producers would charge US refiners the same price that the refiners would have to pay for competing crude. Prices
across the entire global crude and products complex would increase.
ADJUSTMENTS
US producers would benefit and invest more. US refiners would suffer domestically (with differences by region). In
a $50-60 world, retail gasoline prices estimated to increase by $0.30-0.36/gallon. Hypothetically, US refiners would
adapt by investing to run more light sweet domestic / less med/hvy sour imported crude. However, this is key,
refinery cycle is 5 years or more. Cannot adapt fast and still needs sour imports.
LONG RUN IMPACT
US production growth would be strong in any case. The US needs to import less and less crude IF refiners could
adapt to using more sweet. In addition, with the same or lower global demand (higher prices), something has got to
give. Brent drops to a discount against WTI, and investment and production in other crudes suffers. Bottom line:
US production growth “crowds out” more expensive crude elsewhere.
However, the reality is refiners cycle and shale cycle is very different (many years versus few months). As oil prices
jump, US shale increases and gets exported (export restrictions lifted in Dec 2015) and global oil prices get pushed
further down. WTI, export prices and Brent prices (etc) go down. US production also crowds out more expensive oil
production in this case too. We are back to the same world as before Nov 2014 (where large scale global oversupply
led by US puts higher cost projects at risk).
Michael Haigh – MD / Head of Commodity Research 40 Michael Haigh- MD / Head of Commodity Research
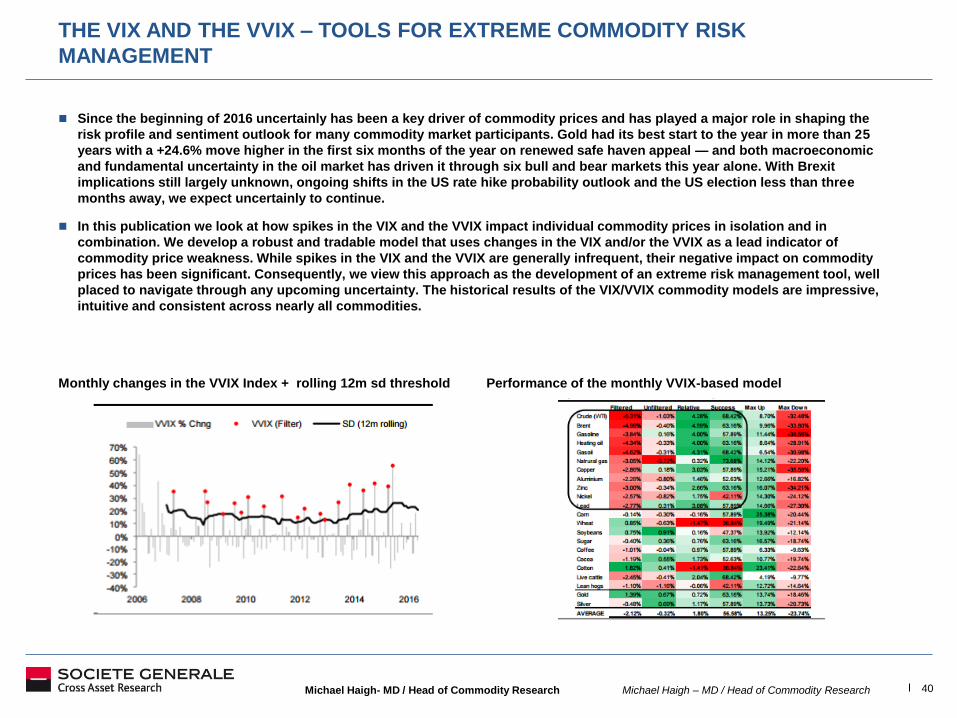
THE VIX AND THE VVIX – TOOLS FOR EXTREME COMMODITY RISK
MANAGEMENT
Since the beginning of 2016 uncertainly has been a key driver of commodity prices and has played a major role in shaping the
risk profile and sentiment outlook for many commodity market participants. Gold had its best start to the year in more than 25
years with a +24.6% move higher in the first six months of the year on renewed safe haven appeal — and both macroeconomic
and fundamental uncertainty in the oil market has driven it through six bull and bear markets this year alone. With Brexit
implications still largely unknown, ongoing shifts in the US rate hike probability outlook and the US election less than three
months away, we expect uncertainly to continue.
In this publication we look at how spikes in the VIX and the VVIX impact individual commodity prices in isolation and in
combination. We develop a robust and tradable model that uses changes in the VIX and/or the VVIX as a lead indicator of
commodity price weakness. While spikes in the VIX and the VVIX are generally infrequent, their negative impact on commodity
prices has been significant. Consequently, we view this approach as the development of an extreme risk management tool, well
placed to navigate through any upcoming uncertainty. The historical results of the VIX/VVIX commodity models are impressive,
intuitive and consistent across nearly all commodities.
Monthly changes in the VVIX Index + rolling 12m sd threshold Performance of the monthly VVIX-based model
Michael Haigh – MD / Head of Commodity Research 41
APPENDIX - DISCLAIMER
ANALYST CERTIFICATION
Each author of this research report listed on the cover hereby certifies that the views expressed in the research report accurately reflect his or her personal views, including views about subject securities or issuers mentioned in the report, if any. No part of his or her compensation was, is or will be related, directly or indirectly to the specific recommendations or views expressed in this report.
The analyst(s) who author research are employed by SG and its affiliates in locations, including but not limited to, Paris, London, New York, Hong Kong, Tokyo, Bangalore, Madrid, Milan, Warsaw and Moscow.
CONFLICTS OF INTEREST
This research contains the views, opinions and recommendations of Société Générale (SG) credit research analysts and/or strategists. To the extent that this research contains trade ideas based on macro views of economic market conditions or relative value, it may differ from the fundamental credit opinions and recommendations contained in credit sector or company research reports and from the views and opinions of other departments of SG and its affiliates. Credit research analysts and/or strategists routinely consult with SG sales and trading desk personnel regarding market information including, but not limited to, pricing, spread levels and trading activity of a specific fixed income security or financial instrument, sector or other asset class. Trading desks may trade, or have traded, as principal on the basis of the research analyst(s) views and reports. In addition, research analysts receive compensation based, in part, on the quality and accuracy of their analysis, client feedback, trading desk and firm revenues and competitive factors. As a general matter, SG and/or its affiliates normally make a market and trade as principal in fixed income securities discussed in research reports.
IMPORTANT DISCLAIMER: The information herein is not intended to be an offer to buy or sell, or a solicitation of an offer to buy or sell, any securities and has been obtained from, or is based upon, sources believed to be reliable but is not guaranteed as to accuracy or completeness. Material contained in this report satisfies the regulatory provisions concerning independent investment research as defined in MiFID. Information concerning conflicts of interest and SG’s management of such conflicts is contained in the SG’s Policies for Managing Conflicts of Interests in Connection with Investment Research which is available at https://www.sgresearch.com/Content/Compliance/Compliance.aspx SG does, from time to time, deal, trade in, profit from, hold, act as market-makers or advisers, brokers or bankers in relation to the securities, or derivatives thereof, of persons, firms or entities mentioned in this document and may be represented on the board of such persons, firms or entities. SG does, from time to time, act as a principal trader in equities or debt securities that may be referred to in this report and may hold equity or debt securities positions. Employees of SG, or individuals connected to them, may from time to time have a position in or hold any of the investments or related investments mentioned in this document. SG is under no obligation to disclose or take account of this document when advising or dealing with or on behalf of customers. The views of SG reflected in this document may change without notice. In addition, SG may issue other reports that are inconsistent with, and reach different conclusions from, the information presented in this report and is under no obligation to ensure that such other reports are brought to the attention of any recipient of this report. To the maximum extent possible at law, SG does not accept any liability whatsoever arising from the use of the material or information contained herein. This research document is not intended for use by or targeted to retail customers. Should a retail customer obtain a copy of this report he/she should not base his/her investment decisions solely on the basis of this document and must seek independent financial advice.
The financial instruments discussed in this report may not be suitable for all investors and investors must make their own informed decisions and seek their own advice regarding the appropriateness of investing in financial instruments or implementing strategies discussed herein. The value of securities and financial instruments is subject to currency exchange rate fluctuation that may have a positive or negative effect on the price of such securities or financial instruments, and investors in securities such as ADRs effectively assume this risk. SG does not provide any tax advice. Past performance is not necessarily a guide to future performance. Estimates of future performance are based on assumptions that may not be realized. Investments in general, and derivatives in particular, involve numerous risks, including, among others, market, counterparty default and liquidity risk. Trading in options involves additional risks and is not suitable for all investors. An option may become worthless by its expiration date, as it is a depreciating asset. Option ownership could result in significant loss or gain, especially for options of unhedged positions. Prior to buying or selling an option, investors must review the "Characteristics and Risks of Standardized Options" at http://www.optionsclearing.com/about/publications/character-risks.jsp. or from your SG representative. Analysis of option trading strategies does not consider the cost of commissions. Supporting documentation for options trading strategies is available upon request.
.
Michael Haigh – MD / Head of Commodity Research 42
APPENDIX – DISCLAIMER (CONT’D)
Notice to French Investors: This publication is issued in France by or through Société Générale ("SG") which is authorised and supervised by the Autorité de Contrôle Prudentiel et de Résolution (ACPR) and regulated by the Autorité des Marchés Financiers (AMF).
Notice to U.K. Investors: Société Générale is a French credit institution (bank) authorised by the Autorité de Contrôle Prudentiel (the French Prudential Control Authority) and the Prudential Regulation Authority and subject to limited regulation by the Financial Conduct Authority and Prudential Regulation Authority. Details about the extent of our authorisation and regulation by the Prudential Regulation Authority, and regulation by the Financial Conduct Authority are available from us on request.
Notice to Swiss Investors: This document is provided in Switzerland by or through Société Générale Paris, Zürich Branch, and is provided only to qualified investors as defined in article 10 of the Swiss Collective Investment Scheme Act (“CISA”) and related provisions of the Collective Investment Scheme Ordinance and in strict compliance with applicable Swiss law and regulations. The products mentioned in this document may not be suitable for all types of investors. This document is based on the Directives on the Independence of Financial Research issued by the Swiss Bankers Association (SBA) in January 2008.
Notice to Polish Investors: This document has been issued in Poland by Societe Generale S.A. Oddzial w Polsce (“the Branch”) with its registered office in Warsaw (Poland) at 111 Marszałkowska St. The Branch is supervised by the Polish Financial Supervision Authority and the French ”Autorité de Contrôle Prudentiel”. This report is addressed to financial institutions only, as defined in the Act on trading in financial instruments. The Branch certifies that this document has been elaborated with due dilligence and care.
Notice to U.S. Investors: For purposes of SEC Rule 15a-6, SG Americas Securities LLC (“SGAS”) takes responsibility for this research report. This report is intended for institutional investors only. Any U.S. person wishing to discuss this report or effect transactions in any security discussed herein should do so with or through SGAS, a broker-dealer registered with the SEC and a member of FINRA, with its registered address at 245 Park Avenue, New York, NY, 10167. (212)-278-6000.
Notice to Canadian Investors: This document is for information purposes only and is intended for use by Permitted Clients, as defined under National Instrument 31-103, Accredited Investors, as defined under National Instrument 45-106, Accredited Counterparties as defined under the Derivatives Act (Québec) and "Qualified Parties" as defined under the ASC, BCSC, SFSC and NBSC Orders
Notice to Singapore Investors: This document is provided in Singapore by or through Société Générale ("SG"), Singapore Branch and is provided only to accredited investors, expert investors and institutional investors, as defined in Section 4A of the Securities and Futures Act, Cap. 289. Recipients of this document are to contact Société Générale, Singapore Branch in respect of any matters arising from, or in connection with, the document. If you are an accredited investor or expert investor, please be informed that in SG's dealings with you, SG is relying on the following exemptions to the Financial Advisers Act, Cap. 110 (“FAA”): (1) the exemption in Regulation 33 of the Financial Advisers Regulations (“FAR”), which exempts SG from complying with Section 25 of the FAA on disclosure of product information to clients; (2) the exemption set out in Regulation 34 of the FAR, which exempts SG from complying with Section 27 of the FAA on recommendations; and (3) the exemption set out in Regulation 35 of the FAR, which exempts SG from complying with Section 36 of the FAA on disclosure of certain interests in securities.
Notice to Hong Kong Investors: This report is distributed in Hong Kong by Société Générale, Hong Kong Branch which is licensed by the Securities and Futures Commission of Hong Kong under the Securities and Futures Ordinance (Chapter 571 of the Laws of Hong Kong) ("SFO"). This document does not constitute a solicitation or an offer of securities or an invitation to the public within the meaning of the SFO. This report is to be circulated only to "professional investors" as defined in the SFO.
Notice to Japanese Investors: This publication is distributed in Japan by Societe Generale Securities (North Pacific) Ltd., Tokyo Branch, which is regulated by the Financial Services Agency of Japan. This document is intended only for the Specified Investors, as defined by the Financial Instruments and Exchange Law in Japan and only for those people to whom it is sent directly by Societe Generale Securities (North Pacific) Ltd., Tokyo Branch, and under no circumstances should it be forwarded to any third party. The products mentioned in this report may not be eligible for sale in Japan and they may not be suitable for all types of investors.
Notice to Korean Investors: This report is distributed in Korea by SG Securities Korea Co., Ltd which is regulated by the Financial Supervisory Service and the Financial Services Commission.
Notice to Australian Investors: Societe Generale is exempt from the requirement to hold an Australian financial services licence (AFSL) under the Corporations Act 2001 (Cth) in respect of financial services, in reliance on ASIC Class Order 03/8240, a copy of which may be obtained at the web site of the Australian Securities and Investments Commission, http://www.asic.gov.au. The class order exempts financial services providers with a limited connection to Australia from the requirement to hold an AFSL where they provide financial services only to wholesale clients in Australia on certain conditions. Financial services provided by Societe Generale may be regulated under foreign laws and regulatory requirements, which are different from the laws applying in Australia.
http://www.sgcib.com. Copyright: The Société Générale Group 2014. All rights reserved.
This publication may not be reproduced or redistributed in whole in part without the prior consent of SG or its affiliates.