Embed Size (px)
Citation preview

Comment on Baily-Montalbano,
“Why is U.S. Productivity Growth So Slow?
Possible Explanations & Policy Responses,”
Presented by Barry Bosworth
Masahiro KawaiGraduate School of Public Policy
University of Tokyo
Macro Economy Research Conference
“Productivity, Technology, and Growth”
Nomura Foundation
Tokyo, 16 November 2016
1

1. What the paper does
• It reviews the trend of US labor productivity and
MFP growth particularly since the early 1970s
and explains how such growth has evolved over
time by also looking at manufacturing and
services sub-sectors
• It argues that the most recent growth slowdown
took place in 2004 and onward
• It finds that the sectors that grew fast in the
1995-2004 were the sectors that contributed to
slowdown in the 2004-14 period
• It then tries to identify factors that have
contributed to growth slowdown in the 2004-14
period (or since 1973)2

0.5
1.7
0.5
2.1
0.5
1.2
0.8
1.0
0.2
0.3
0.2
0.2
0.0 0.5 1.0 1.5 2.0 2.5 3.0 3.5
2004-2015
1995-2004
1973-1995
1948-1973
Growth Rate (percent)
MFP Capital Deepening Labor Composition
3.3
1.6
3.2
1.3
Changes in labor productivity by
contribution over time
Source: Baily and Montalbano (2016) 3

Industry multifactor productivity
Source: Baily and Montalbano (2016)
4

Manufacturing multifactor productivity
Source: Baily and Montalbano (2016) 5
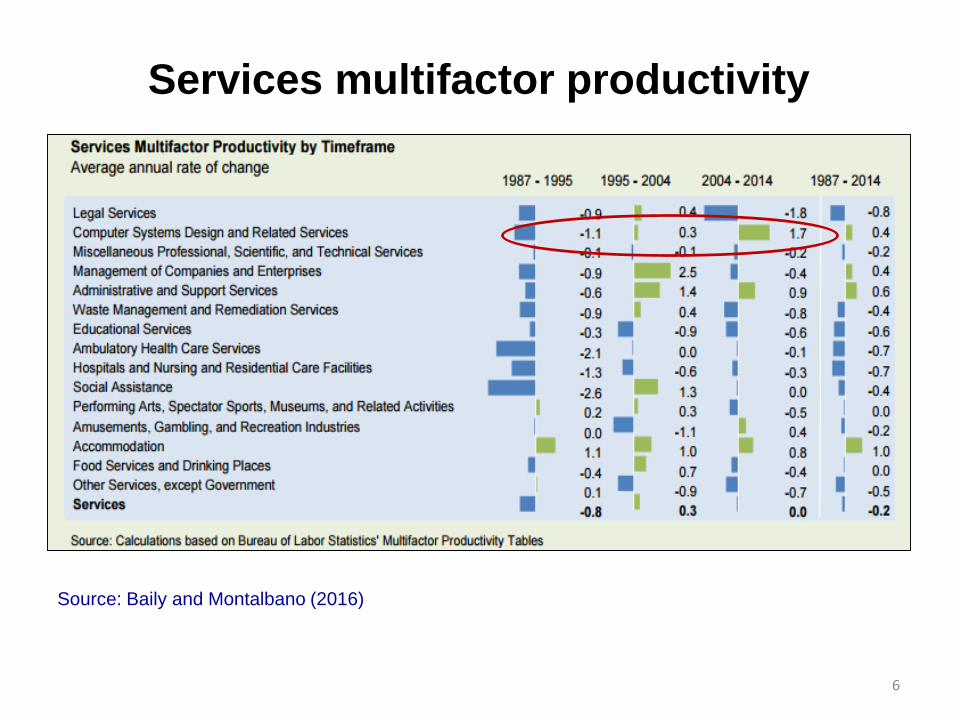
Services multifactor productivity
Source: Baily and Montalbano (2016)
6

Difference in the contribution by industry to MFP growth, 2004-14 minus 1995-2004
Source: Baily and Montalbano (2016) 7

Negative relations between productivity
growth in 1995-2004 and 2004-14 periods
Source: Baily and Montalbano (2016)8

Observations from firm level data
• Increased productivity dispersion across
firms within industries The frontier is moving out, but many or most firms
are not keeping pace with the frontier
• Declining dynamism (fewer startups and less
productivity-enhancing reallocation of
production among firms)
• Decline in the contribution to overall
productivity growth due to “reallocation”
9

Summary of key findings
• MFP growth and the contribution of capital services move together.
Since 2004, there has been slow MFP growth and a very small
contribution from increased capital services per hour worked
• Contributions to the acceleration of US productivity growth after
1995 were heavily concentrated in two sectors, services
(particularly health) and manufacturing (particularly in computers
and semiconductors)
• The deceleration of US productivity growth after 2004 was heavily
concentrated in manufacturing (particularly in computers and
semiconductors) and in wholesale and retail trade
• The industries that accelerated the most after 1995 are also the
industries that decelerated after 2004. This suggests that an
earlier productivity surge impacted some but not all industries.
Once the effect of this surge was passed, the industries that had
grown rapidly fell back to their previous slow growth path.
• The gap between the most productive firms and the less
productive firms has widened over time.
• There has been declining dynamism in the US economy10

Why the widening gap between best practices of
frontier firms and the rest?• Mismeasurement of productivity
Measurement error does not explain the post-2004 slowdown
Nonetheless measurement error is an important issue from the
long-run perspective
• No more major innovations to be found (Gordon) The paper rejects the extreme technological pessimism of Gordon
• Barriers that prevent diffusion to Lack of competition ← anti-trust policy
Economic regulation ← deregulation
Capacity constraints (managerial skills, worker skills)
• Other factors Weak aggregate demand ← infrastructure investment
Declining manufacturing ← corporate tax reduction, R&D support11
Explanations of chronically slow
productivity growth

2. The value of the paper
• Very useful paper on data and debate on US
labor productivity and MFP growth
• Analysis on sectoral data on MFP growth
very useful
• It summarizes some findings obtained by
other authors on firm level data
• It offers various explanations for productivity
slowdown since 2004 (and since 1973)
• It provides policy recommendations
12

3. Questions and comments
• What is the rationale for dividing the entire period
into several sub-sample periods? 1948-73, 1973-95 (or 1987-95), 1995-2004, 2004-2015
Did the most recent productivity growth slowdown take
place in 2004? Not in 2003, or 2005, or 2008?
Has secular stagnation taken place since 2004, not
after the global financial crisis?
All OECD countries for which data are available have
seen productivity growth slowdown since the global
financial crisis except for Ireland and Spain
• Is it valid to call the post-1973 period a period of
productivity slowdown? The productivity growth of 3.2% in the 1995-2004
period is as high as in the 1948-73 period (3.3%)
13

Labor productivity trend growth in G-7 countries, total economy
Source: Baily and Montalbano (2016) 14

Labor productivity growth (GDP per hour worked, % per year) in G-7 countries
-0.5
0.0
0.5
1.0
1.5
2.0
2.5
3.0
3.5
4.0
4.5
5.0
5.5
1973 1978 1983 1988 1993 1998 2003 2008 2013
Canada France Germany
Italy Japan United Kingdom
United States
Note: 5-year averages except in 2014 (3-year average) and 2015 (single year data)
Source: OECD data on labor productivityhttp://stats.oecd.org/viewhtml.aspx?datasetcode=PDB_GR&lang=en 15

Productivity growth (GDP per hour
worked, % per year) in OECD countries
-2
-1
0
1
2
3
4
5
6
7
8Ir
ela
nd
Kore
aP
ola
nd
Slo
vak R
epublic
Hungary
Chile
Latv
iaS
pain
Austr
alia
United S
tate
sC
zech R
epublic
Canada
Port
ugal
Isra
el
Austr
iaJapan
Germ
any
Fra
nce
Sw
eden
New
Zeala
nd
Neth
erlands
Belg
ium
Sw
itzerland
Denm
ark
United K
ingdom
Slo
venia
Italy
Norw
ay
Luxem
bourg
Fin
land
Mexic
oG
reece
2000-07 20008-15
Source: OECD data on labor productivityhttp://stats.oecd.org/viewhtml.aspx?datasetcode=PDB_GR&lang=en 16

Questions and comments (cont’d)
• The negative relationship between growth in 1995-
2004 and 2004-14 is an interesting observation, but
does not explain factors causing declines in 2004-14
• Factors that explain productivity growth slowdown
since 2004 are not always clearly separated from
those since 1973
• Do authors regard the secular stagnation view of
Lawrence Summers as valid for the post-GFC
period?
• Authors seem to implicitly support at least part of Mr.
Trump’s macroeconomic policy agenda, corporate
tax cut (from 35% to 15%, which affects all firms, not
simply manufacturing ones) and infrastructure
investment: How should they be financed?
17
4. Summary
• An interesting, useful paper
• However, criteria for choosing sub-periods are
not clear
• It is not clear from the paper that the US
economy entered a period of slower productivity
slowdown in 1973
• The paper has not provided clear views as to
whether the secular stagnation proposition a la
Lawrence Summers is a valid one or not
• How should the corporate tax cut and
infrastructure investment be financed?
18


![[01]UNCOPUOS SentinelAsia Final · Sep. 1993 Tokyo, Japan Tokyo, Japan Tokyo, Japan Tokyo, Japan Ulanbator, Mongolia Tsukuba, Japan Tokyo, Japan Kuala Lumpur, Malaysia Daejeon, Korea](https://img.pdfslide.us/doc/110x75/600d276b3d3e78250500e5e2/01uncopuos-sentinelasia-final-sep-1993-tokyo-japan-tokyo-japan-tokyo-japan.jpg)


![Vol. x9o3 XX'] 1 DUTCtfER AND BAILY, [2rabt'ls of ghe ... · Vol. x9o3 XX'] _1 DUTCtfER AND BAILY, [2rabt'ls of ghe lferrln• Gull. 417 side view of head of three nestling stages--primaries](https://img.pdfslide.us/doc/110x75/5f4325639c55e05c99332f10/vol-x9o3-xx-1-dutctfer-and-baily-2rabtls-of-ghe-vol-x9o3-xx-1-dutctfer.jpg)