Embed Size (px)
Citation preview
Committee on Planning and Budget, Fall RetreatNovember 16, 2012
Overview ofCampus Budget, Budget Model, and Budget Process
I. Budget Overview
II. Budget Model
III. Budget Process
Presentation Outline
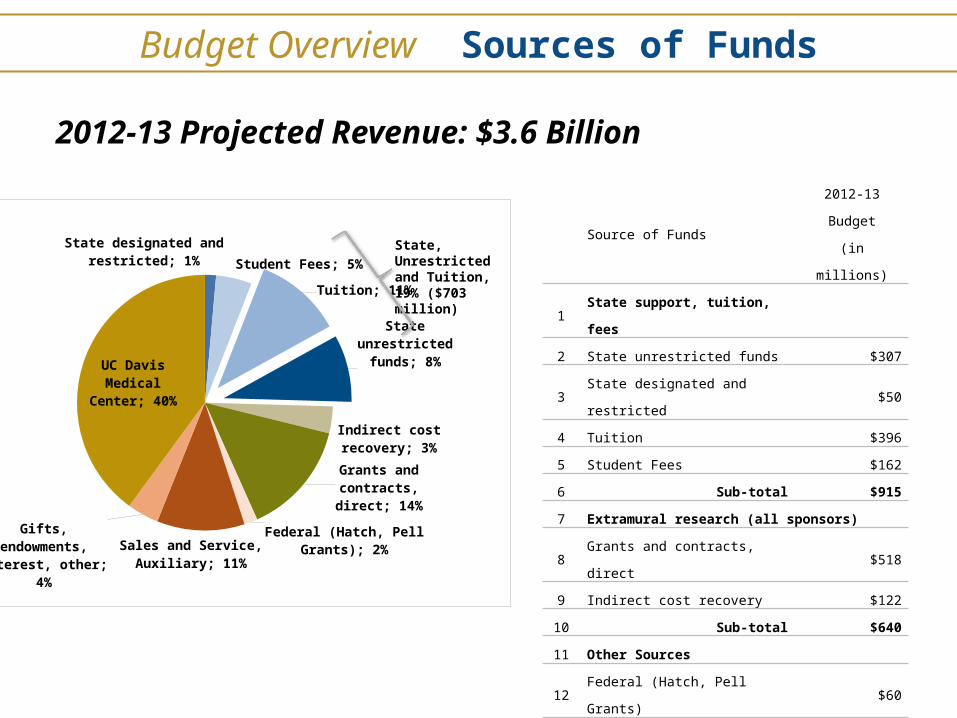
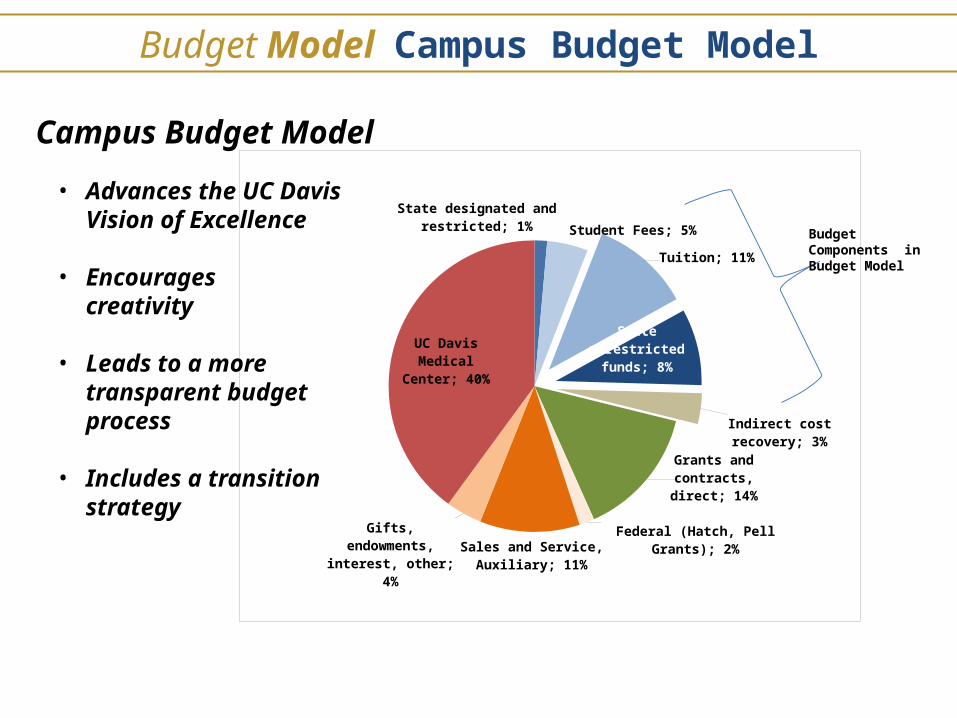
State designated and restricted; 1% Student Fees; 5%
Tuition; 11%
State unrestricted funds; 8%
Indirect cost recovery; 3%
Grants and contracts, direct; 14%
Federal (Hatch, Pell Grants); 2%Sales and Service, Auxiliary; 11%
Gifts, endowments, interest, other; 4%
UC Davis Medical Center; 40%
2012-13 Projected Revenue: $3.6 Billion
State, Unrestricted and Tuition, 19% ($703 million)
Budget Overview Sources of Funds
Source of Funds
2012-13
Budget
(in millions)
1State support, tuition,
fees
2 State unrestricted funds $307
3State designated and
restricted$50
4 Tuition $396
5 Student Fees $162
6 Sub-total $915
7 Extramural research (all sponsors)
8 Grants and contracts, direct $518
9 Indirect cost recovery $122
10 Sub-total $640
11 Other Sources
12 Federal (Hatch, Pell Grants) $60
13 Sales and Service, Auxiliary $397
14Gifts, endowment, interest,
other$143
15 Sub-total $600
16 UC Davis Medical Center $1,431
17 TOTAL $3,586
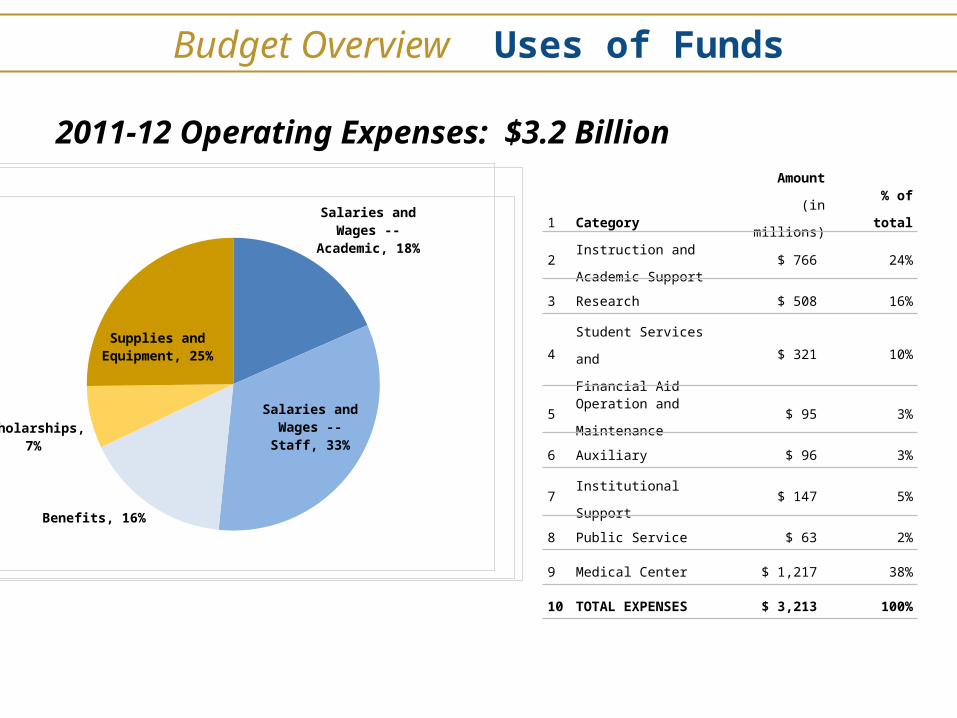
2011-12 Operating Expenses: $3.2 Billion
1 Category
Amount
(in millions) % of total
2Instruction and
Academic Support$ 766 24%
3 Research $ 508 16%
4Student Services and
Financial Aid$ 321 10%
5Operation and
Maintenance$ 95 3%
6 Auxiliary $ 96 3%
7 Institutional Support $ 147 5%
8 Public Service $ 63 2%
9 Medical Center $ 1,217 38%
10 TOTAL EXPENSES $ 3,213 100%
Budget Overview Uses of Funds
Salaries and Wages --
Academic, 18%
Salaries and Wages -- Staff, 33%
Benefits, 16%
Scholarships, 7%
Supplies and Equipment, 25%
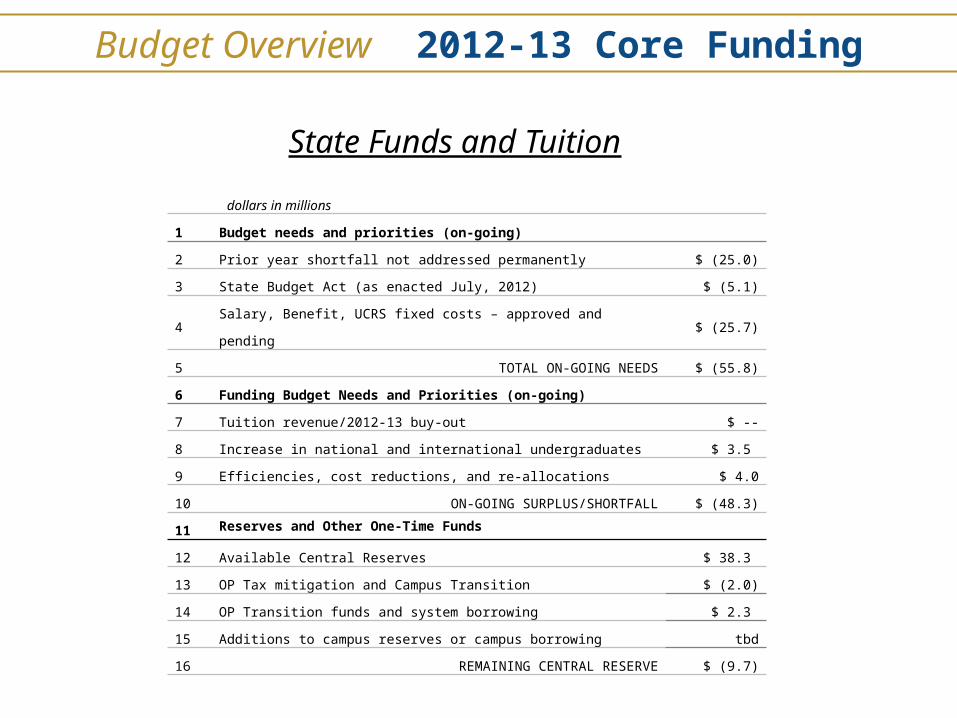
Budget Overview 2012-13 Core Funding
dollars in millions
1 Budget needs and priorities (on-going)
2 Prior year shortfall not addressed permanently $ (25.0)
3 State Budget Act (as enacted July, 2012) $ (5.1)
4 Salary, Benefit, UCRS fixed costs – approved and pending $ (25.7)
5 TOTAL ON-GOING NEEDS $ (55.8)
6 Funding Budget Needs and Priorities (on-going)
7 Tuition revenue/2012-13 buy-out $ --
8 Increase in national and international undergraduates $ 3.5
9 Efficiencies, cost reductions, and re-allocations $ 4.0
10 ON-GOING SURPLUS/SHORTFALL $ (48.3)
11 Reserves and Other One-Time Funds
12 Available Central Reserves $ 38.3
13 OP Tax mitigation and Campus Transition $ (2.0)
14 OP Transition funds and system borrowing $ 2.3
15 Additions to campus reserves or campus borrowing tbd
16 REMAINING CENTRAL RESERVE $ (9.7)
State Funds and Tuition
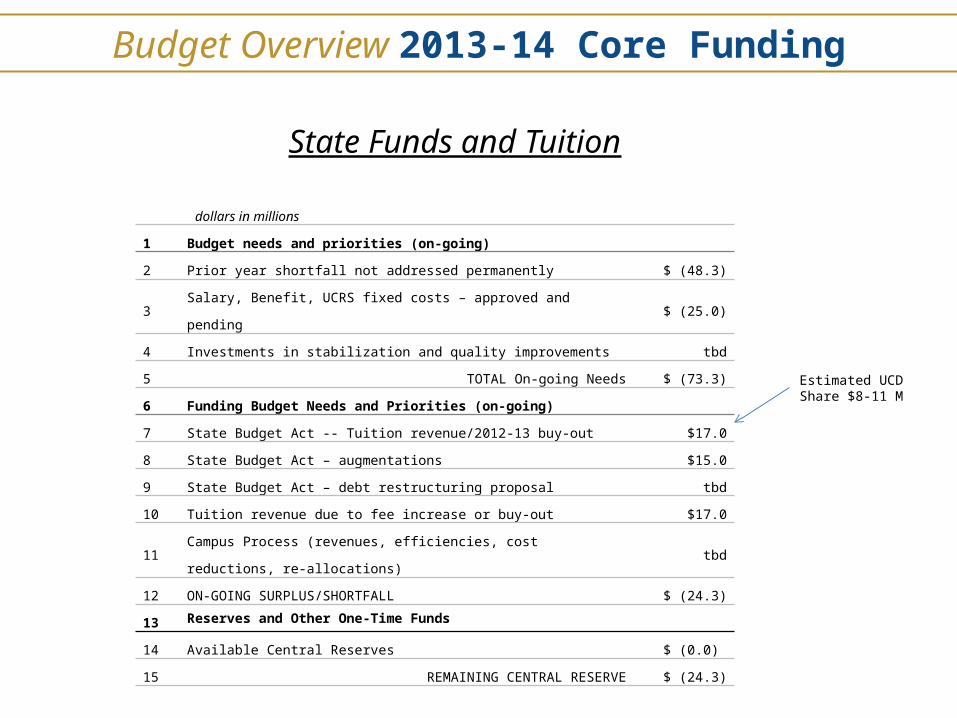
Budget Overview 2013-14 Core Funding
dollars in millions
1 Budget needs and priorities (on-going)
2 Prior year shortfall not addressed permanently $ (48.3)
3 Salary, Benefit, UCRS fixed costs – approved and pending $ (25.0)
4 Investments in stabilization and quality improvements tbd
5 TOTAL On-going Needs $ (73.3)
6 Funding Budget Needs and Priorities (on-going)
7 State Budget Act -- Tuition revenue/2012-13 buy-out $17.0
8 State Budget Act – augmentations $15.0
9 State Budget Act – debt restructuring proposal tbd
10 Tuition revenue due to fee increase or buy-out $17.0
11Campus Process (revenues, efficiencies, cost reductions, re-
allocations)tbd
12 ON-GOING SURPLUS/SHORTFALL $ (24.3)
13 Reserves and Other One-Time Funds
14 Available Central Reserves $ (0.0)
15 REMAINING CENTRAL RESERVE $ (24.3)
Estimated UCD Share $8-11 M
State Funds and Tuition
State designated and restricted; 1% Student Fees; 5%
Tuition; 11%
State unrestricted funds; 8%
Indirect cost re-covery; 3%
Grants and contracts, direct; 14%
Federal (Hatch, Pell Grants); 2%Sales and Service, Auxiliary; 11%
Gifts, endowments, interest, other; 4%
UC Davis Medical Center; 40%
Budget Model Campus Budget Model
• Advances the UC DavisVision of Excellence
• Encouragescreativity
• Leads to a moretransparent budget process
• Includes a transitionstrategy
Budget Components in Budget Model
Campus Budget Model
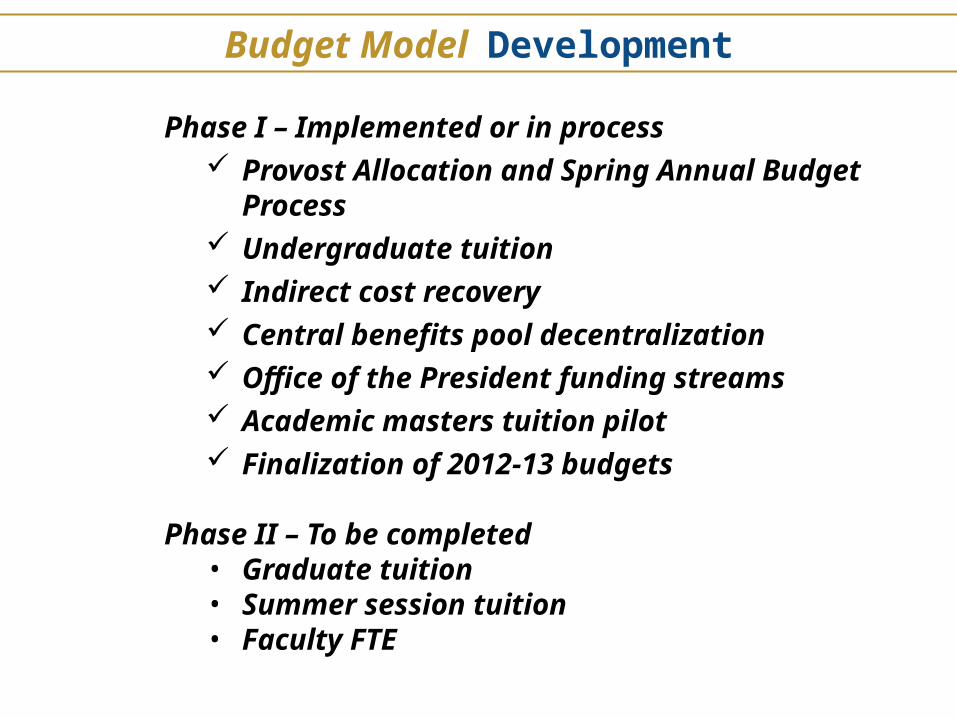
Phase I – Implemented or in process Provost Allocation and Spring Annual
Budget Process Undergraduate tuition Indirect cost recovery Central benefits pool decentralization Office of the President funding
streams Academic masters tuition pilot Finalization of 2012-13 budgets
Phase II – To be completed• Graduate tuition• Summer session tuition• Faculty FTE
Budget Model Development
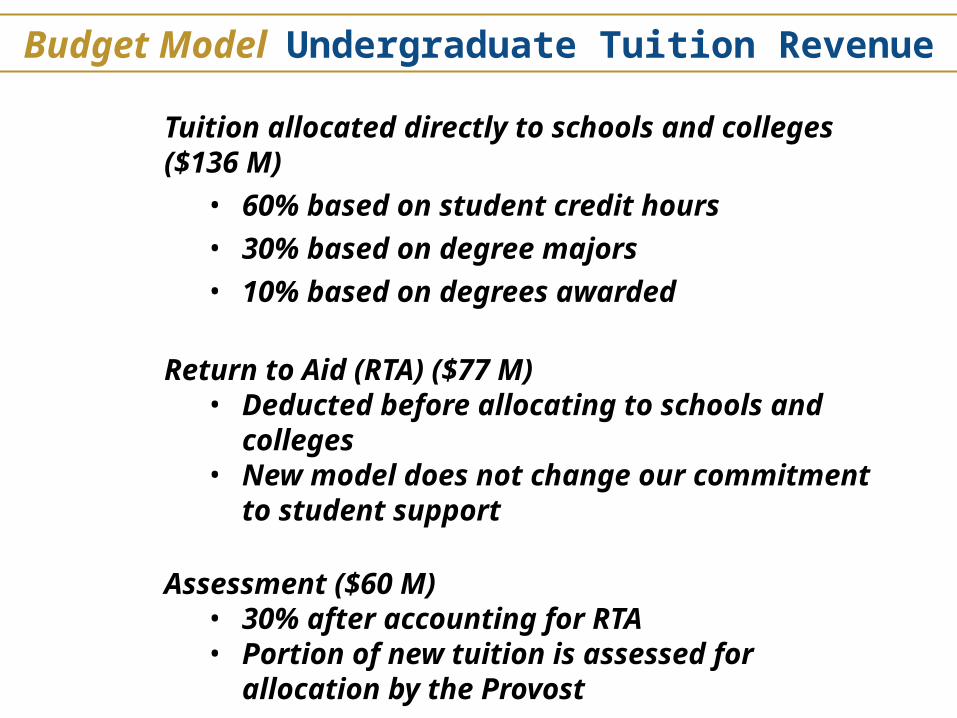
Budget Model Undergraduate Tuition Revenue
Tuition allocated directly to schools and colleges ($136 M)• 60% based on student credit hours• 30% based on degree majors• 10% based on degrees awarded
Return to Aid (RTA) ($77 M)• Deducted before allocating to schools
and colleges• New model does not change our
commitment to student support
Assessment ($60 M)• 30% after accounting for RTA• Portion of new tuition is assessed for
allocation by the Provost
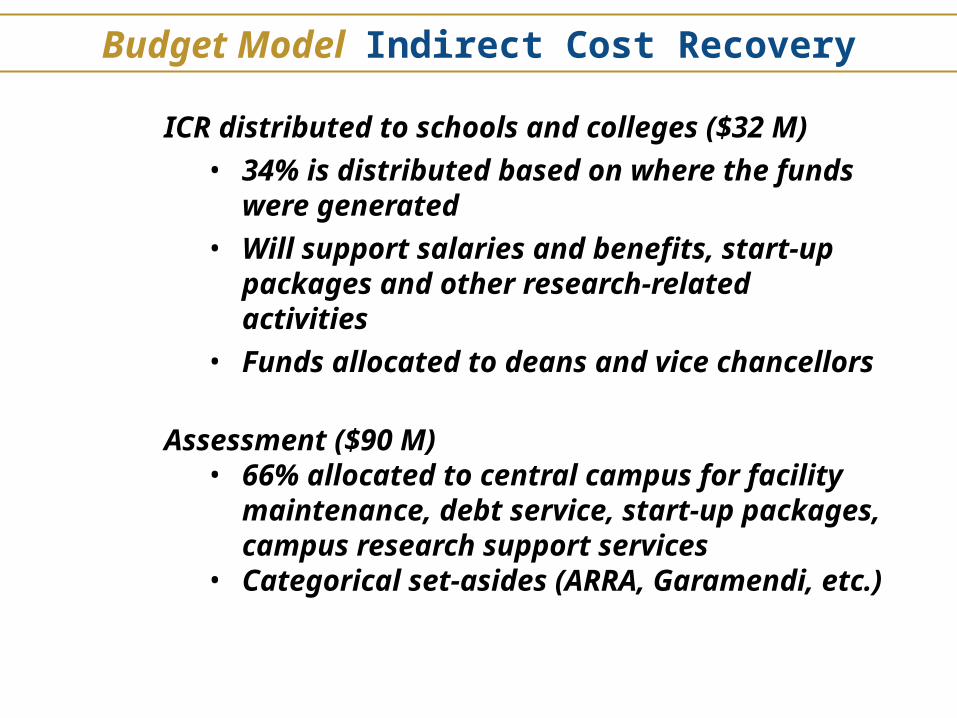
Budget Model Indirect Cost Recovery
ICR distributed to schools and colleges ($32 M)• 34% is distributed based on where the
funds were generated• Will support salaries and benefits,
start-up packages and other research-related activities
• Funds allocated to deans and vice chancellors
Assessment ($90 M)• 66% allocated to central campus for
facility maintenance, debt service, start-up packages, campus research support services
• Categorical set-asides (ARRA, Garamendi, etc.)
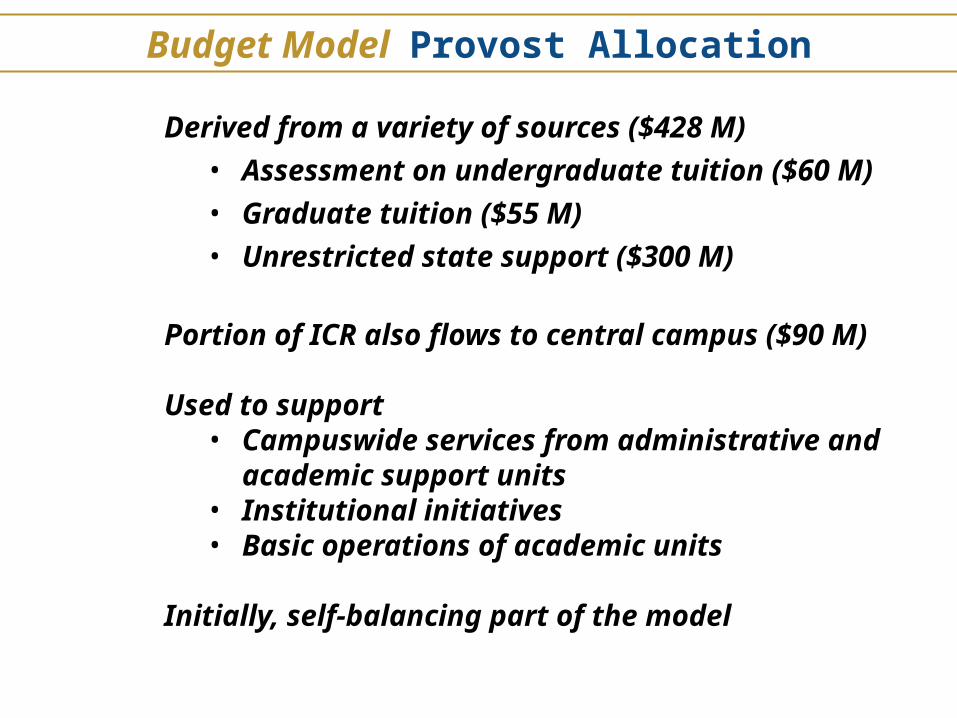
Budget Model Provost Allocation
Derived from a variety of sources ($428 M)• Assessment on undergraduate tuition
($60 M)• Graduate tuition ($55 M)• Unrestricted state support ($300 M)
Portion of ICR also flows to central campus ($90 M)
Used to support • Campuswide services from
administrative and academic support units
• Institutional initiatives• Basic operations of academic units
Initially, self-balancing part of the model
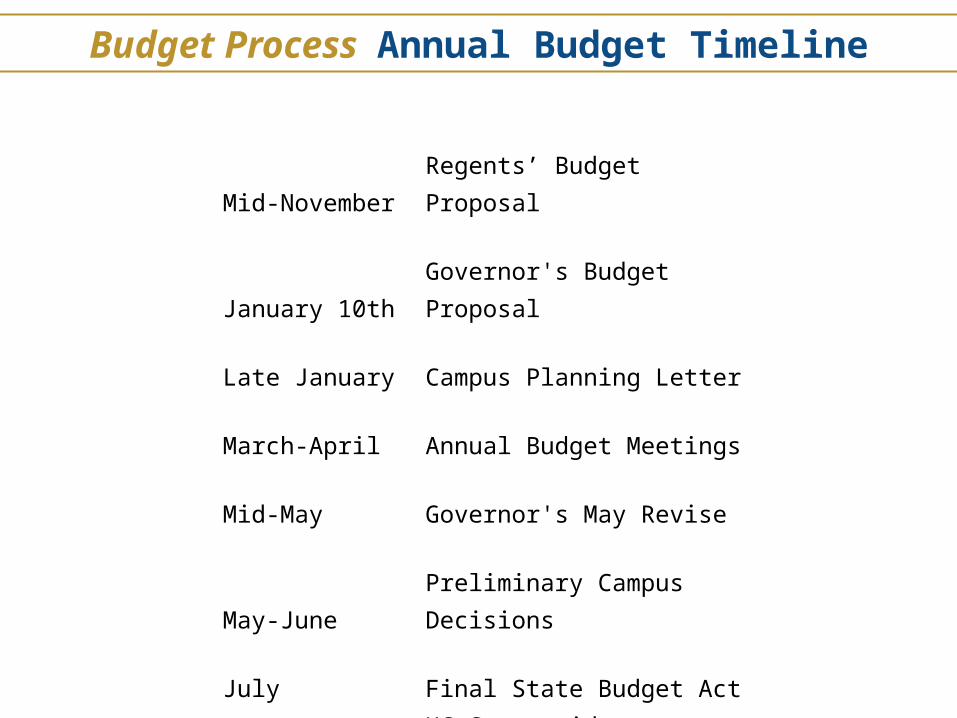
Budget Process Annual Budget Timeline
Mid-November Regents’ Budget Proposal
January 10thGovernor's Budget Proposal
Late January Campus Planning Letter
March-April Annual Budget Meetings
Mid-May Governor's May Revise
May-JunePreliminary Campus Decisions
July Final State Budget ActUC Systemwide AllocationsFinal Campus Allocations
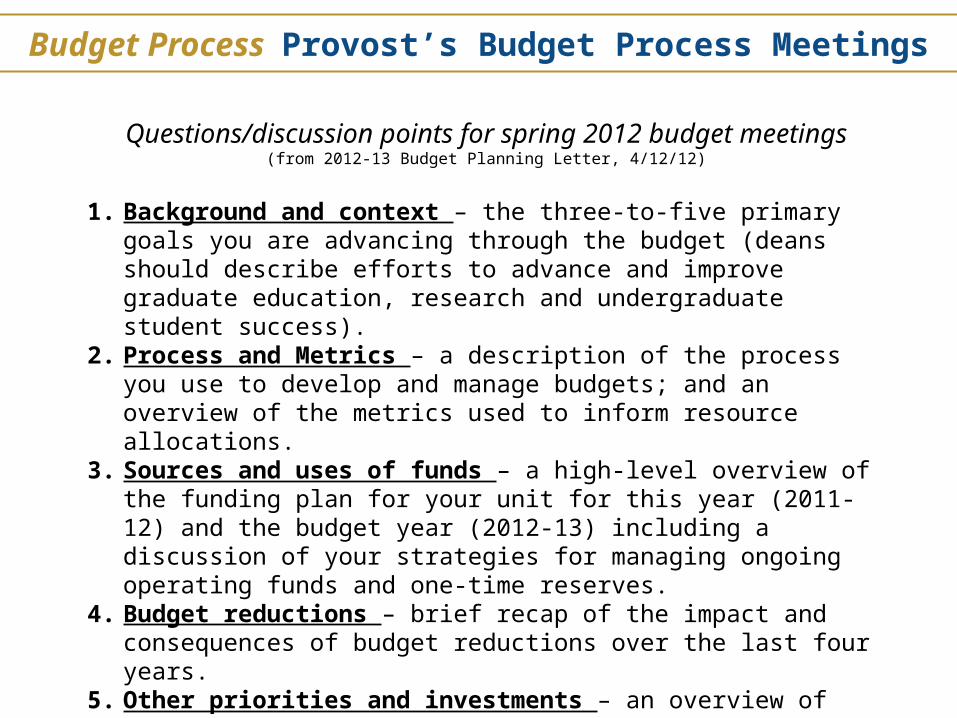
Questions/discussion points for spring 2012 budget meetings
(from 2012-13 Budget Planning Letter, 4/12/12)
1. Background and context – the three-to-five primary goals you are advancing through the budget (deans should describe efforts to advance and improve graduate education, research and undergraduate student success).
2. Process and Metrics – a description of the process you use to develop and manage budgets; and an overview of the metrics used to inform resource allocations.
3. Sources and uses of funds – a high-level overview of the funding plan for your unit for this year (2011-12) and the budget year (2012-13) including a discussion of your strategies for managing ongoing operating funds and one-time reserves.
4. Budget reductions – brief recap of the impact and consequences of budget reductions over the last four years.
5. Other priorities and investments – an overview of additional investments you anticipate.
Budget Process Provost’s Budget Process Meetings
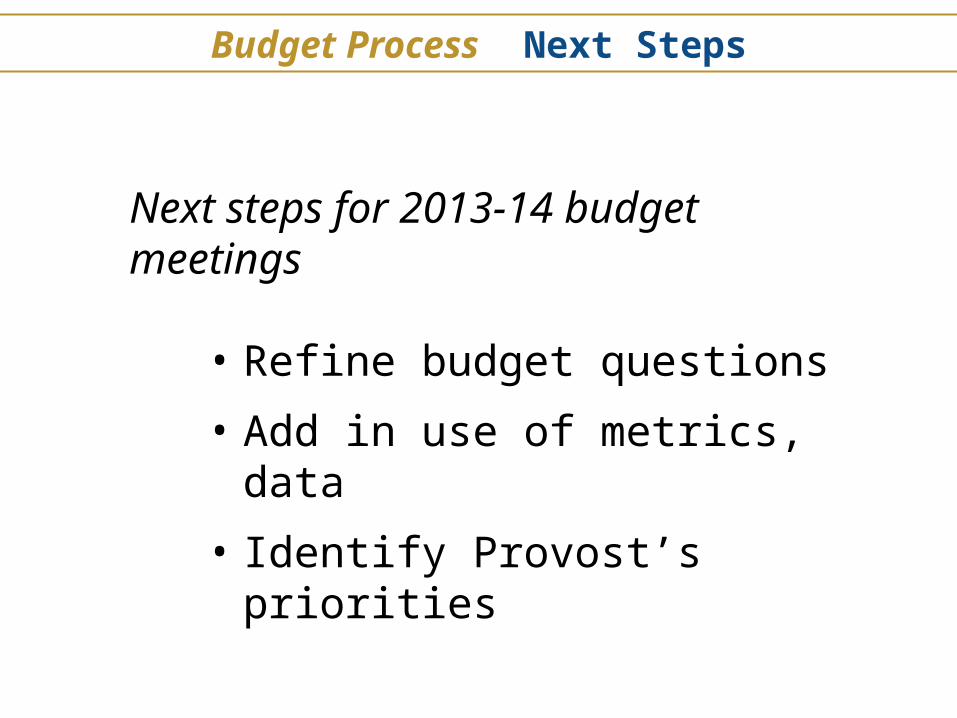
Next steps for 2013-14 budget meetings
• Refine budget questions
• Add in use of metrics, data
• Identify Provost’s priorities
Budget Process Next Steps
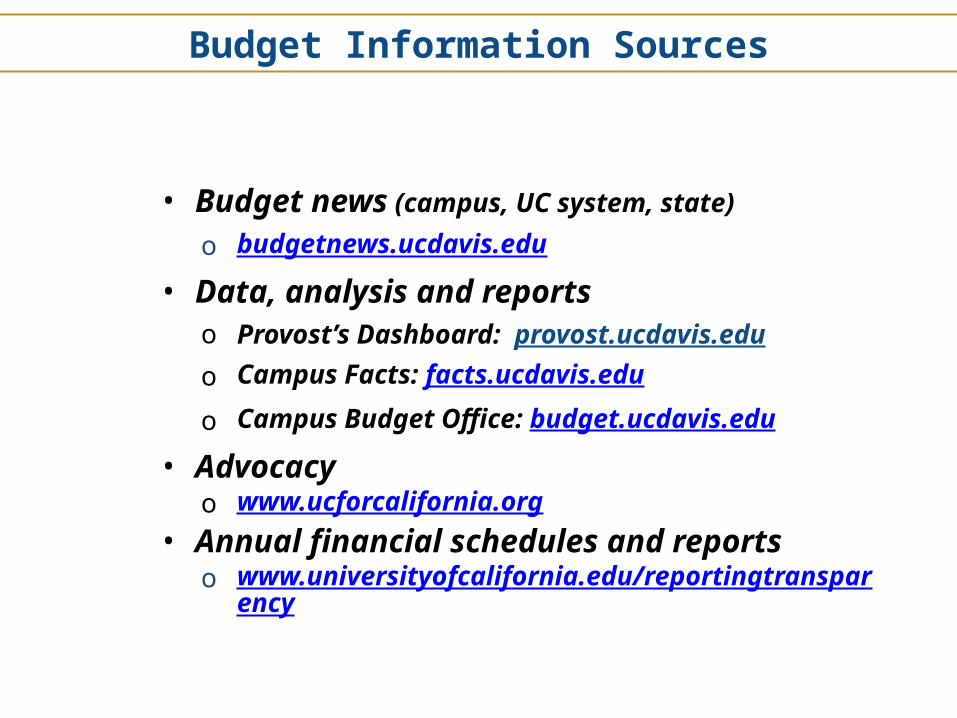
• Budget news (campus, UC system, state)o budgetnews.ucdavis.edu
• Data, analysis and reportso Provost’s Dashboard:
provost.ucdavis.eduo Campus Facts: facts.ucdavis.edu o Campus Budget Office:
budget.ucdavis.edu
• Advocacy o www.ucforcalifornia.org
• Annual financial schedules and reportso www.universityofcalifornia.edu/reportingt
ransparency
Budget Information Sources
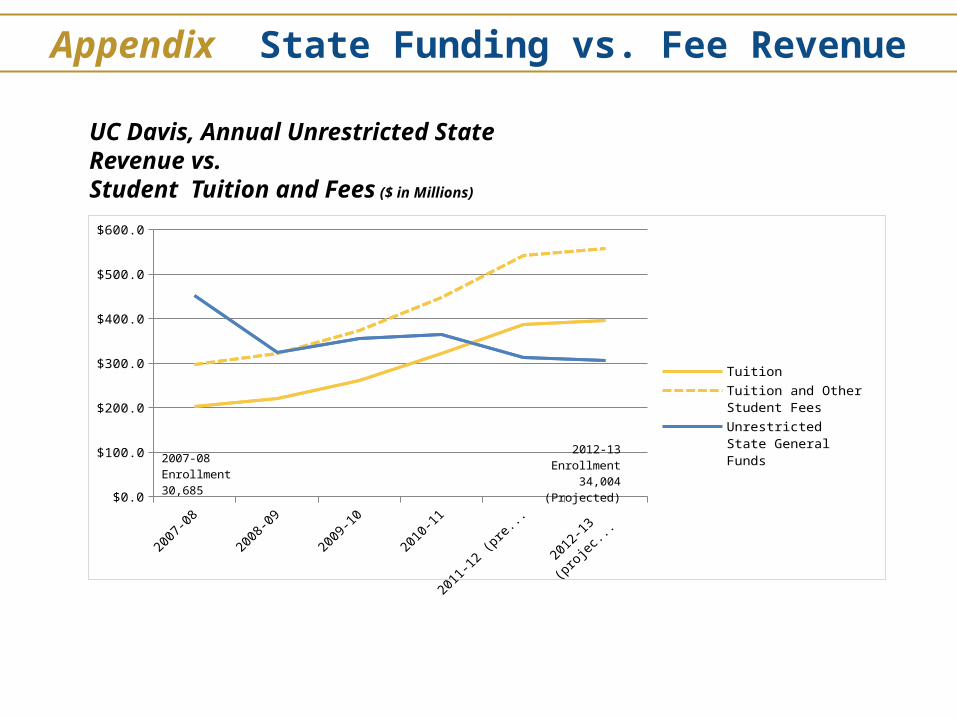
Appendix State Funding vs. Fee Revenue
$0.0
$100.0
$200.0
$300.0
$400.0
$500.0
$600.0
Tuition
Tuition and Other Student Fees
Unrestricted State General Funds
2007-08 Enrollment 30,685
2012-13 Enrollment34,004 (Projected)
UC Davis, Annual Unrestricted State Revenue vs. Student Tuition and Fees ($ in Millions)
Notes:1. Amounts include health insurance ($1,380 undergrad and $2,280
graduate). Amounts for undergraduates exclude course material fees.2. Fee levels as of September 2012; Fees subject to change.
Appendix 2012-13 Student Tuition and Fees
Total Fees and Tuition Resident
National &
International
Undergraduate $15,257 $38,135
Graduate $15,387 $30,489
Selected Professional Degree Programs:
Law (JD) $49,564 $58,815
Management (MBA) $38,727 $50,972
Medicine (MD) $39,652 $51,897
Nursing (MS) $23,127 $35,372
Veterinary Medicine (DVM) $33,091 $45,336
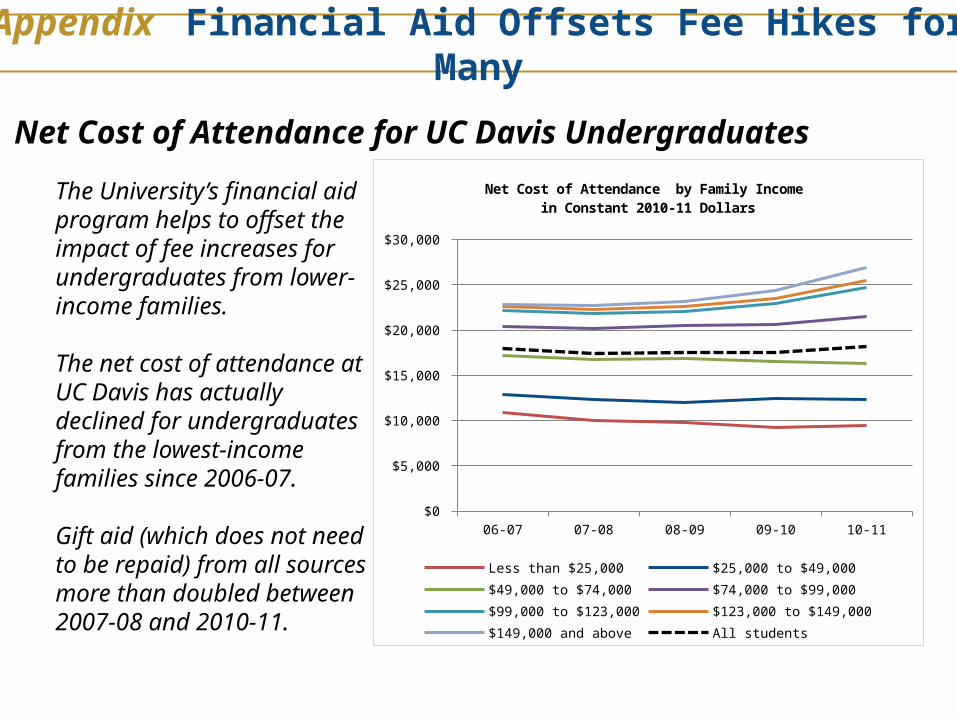
The University’s financial aid program helps to offset the impact of fee increases for undergraduates from lower-income families.
The net cost of attendance at UC Davis has actually declined for undergraduates from the lowest-income families since 2006-07.
Gift aid (which does not need to be repaid) from all sources more than doubled between 2007-08 and 2010-11.
06-07 07-08 08-09 09-10 10-11$0
$5,000
$10,000
$15,000
$20,000
$25,000
$30,000
Net Cost of Attendance by Family Income in Constant 2010-11 Dollars
Less than $25,000 $25,000 to $49,000$49,000 to $74,000 $74,000 to $99,000$99,000 to $123,000 $123,000 to $149,000$149,000 and above All students
Net Cost of Attendance for UC Davis Undergraduates
Appendix Financial Aid Offsets Fee Hikes for Many
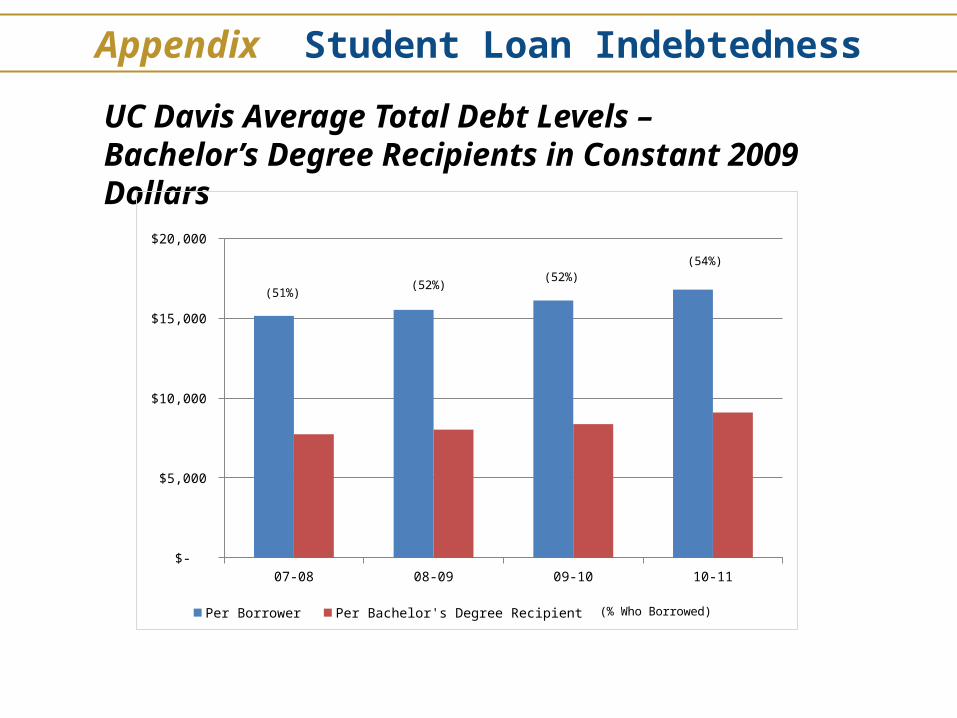
UC Davis Average Total Debt Levels – Bachelor’s Degree Recipients in Constant 2009 Dollars
Appendix Student Loan Indebtedness
07-08 08-09 09-10 10-11 $-
$5,000
$10,000
$15,000
$20,000
Per Borrower Per Bachelor's Degree Recipient
(51%)(52%)
(52%)(54%)
(% Who Borrowed)
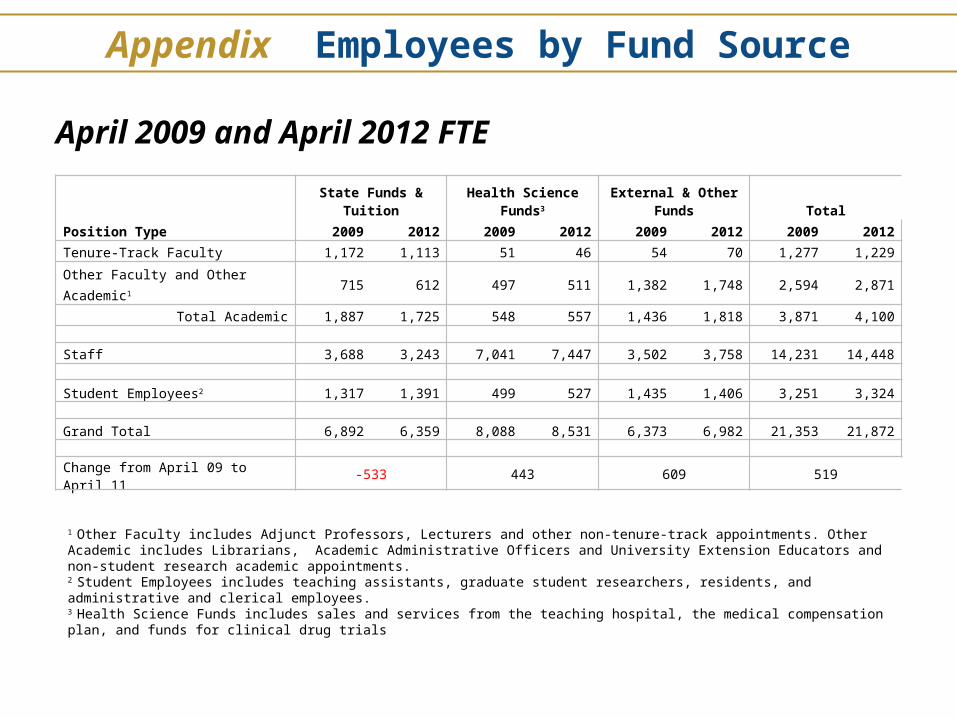
April 2009 and April 2012 FTE
Appendix Employees by Fund Source
1 Other Faculty includes Adjunct Professors, Lecturers and other non-tenure-track appointments. Other Academic includes Librarians, Academic Administrative Officers and University Extension Educators and non-student research academic appointments. 2 Student Employees includes teaching assistants, graduate student researchers, residents, and administrative and clerical employees.3 Health Science Funds includes sales and services from the teaching hospital, the medical compensation plan, and funds for clinical drug trials
State Funds & Tuition Health Science Funds3 External & Other Funds Total
Position Type 2009 2012 2009 2012 2009 2012 2009 2012
Tenure-Track Faculty 1,172 1,113 51 46 54 70 1,277 1,229
Other Faculty and Other Academic1 715 612 497 511 1,382 1,748 2,594 2,871
Total Academic 1,887 1,725 548 557 1,436 1,818 3,871 4,100
Staff 3,688 3,243 7,041 7,447 3,502 3,758 14,231 14,448
Student Employees2 1,317 1,391 499 527 1,435 1,406 3,251 3,324
Grand Total 6,892 6,359 8,088 8,531 6,373 6,982 21,353 21,872 Change from April 09 to April 11 -533 443 609 519
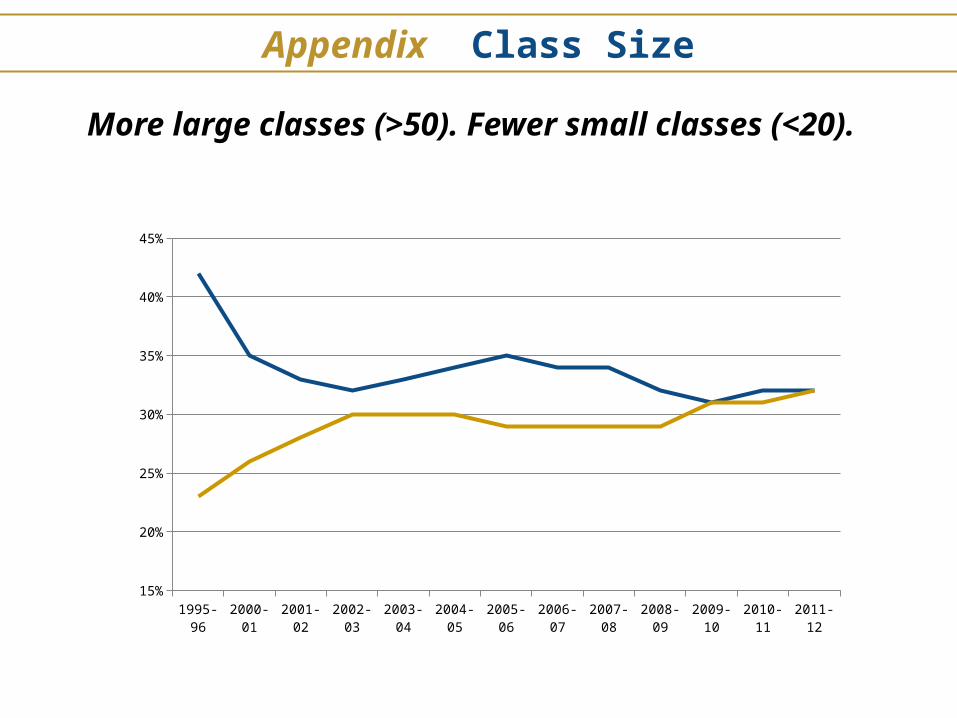
More large classes (>50). Fewer small classes (<20).
Appendix Class Size
1995-96 2000-01 2001-02 2002-03 2003-04 2004-05 2005-06 2006-07 2007-08 2008-09 2009-10 2010-11 2011-12
Under 20
0.42 0.35 0.33 0.32 0.33 0.34 0.35 0.34 0.34 0.32 0.31 0.32 0.32
Over 50
0.23 0.26 0.28 0.3 0.3 0.3 0.29 0.29 0.29 0.29 0.31 0.31 0.32
18%
23%
28%
33%
38%
43%
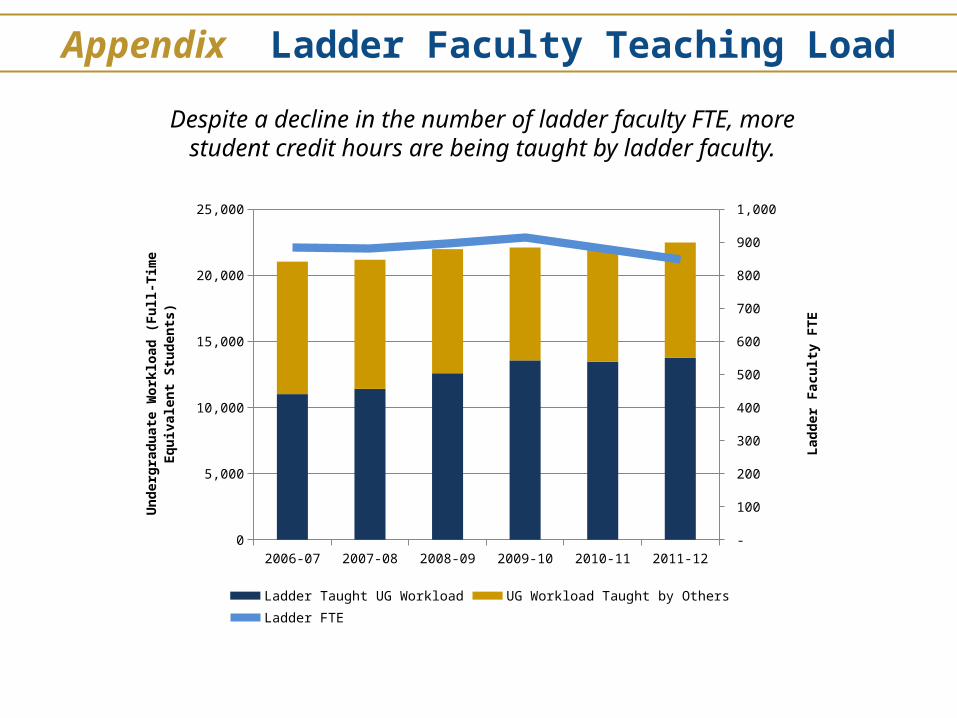
Despite a decline in the number of ladder faculty FTE, more student credit hours are being taught by ladder
faculty.
Appendix Ladder Faculty Teaching Load
2006-07 2007-08 2008-09 2009-10 2010-11 2011-120
5,000
10,000
15,000
20,000
25,000
-
100
200
300
400
500
600
700
800
900
1,000
Ladder Taught UG Workload UG Workload Taught by Others Ladder FTE
Unde
rgra
duat
e W
orkl
oad
(Ful
l-Tim
e Eq
uiva
lent
Stu
dent
s)
Ladd
er F
acul
ty F
TE