Embed Size (px)
Citation preview

Tech Subcommittee 2d Annual Meeting 2019 Page 1 of 4
COMMITTEE ON MATERIALS AND PAVEMENTS
Meeting Annual Date August 8th, 2019 Scheduled Time 8:00 – 9:30 AM Technical Subcommittee & Name 2d – Proportioning of Asphalt-Aggregate Mixtures Chair Name and (State) Oak Metcalfe (MT) Vice Chair Name and (State) Greg Milburn (WY) Research Liaison Name and (State) N/A
I. Introduction and Housekeeping
II. Call to Order and Opening Remarks
A. The primary goals of this meeting are to address the results of the two 2019 TS ballots
III. Roll Call of Voting Members
Present Member Name State Present Member Name State ☐ George Scott AL ☐ Darin Tedford NV ☐ Mike San Angelo AK ☐ Chuck Dusseault NH ☐ Jesus Sandoval-Gil AZ ☐ Russel Thielke NY ☐ Michael Benson AR ☐ Eric Biehl OH ☐ Craig Wieden CO ☐ Matt Romero OK ☐ Bob Lauzon CT ☐ Sean Parker OR ☐ Jennifer Pinkerton DE ☐ Tim Ramirez PA ☐ Wasi Khan D.C. ☐ Michael Byrne RI ☐ Wayne Rilko FL ☐ Joe Feller SD ☐ Anita Joaquin HI ☐ Brain Egan TN ☐ Mike Santi ID ☐ Scott Nussbaum UT ☐ Brian Pfeifer IL ☐ Aaron Schwartz VT ☐ Matt Beeson IN ☐ Robert Crandol VA ☐ Rick Barezinsky KS ☐ Kurt Williams WA ☐ Allen Myers KY ☐ Barry Paye WI ☐ Derek Nener-Plante ME ☐ Greg Milburn WY ☐ Sejal Barot MD ☐ ☐ John Grieco MA ☐ ☐ Curt Turgeon MN ☐ ☐ Brett Trautmann MO ☐ ☐ Oak Metcalfe MT ☐
Quorum Rules Met? Annual Meeting: Simple majority of voting members (☐y/ ☐n)
A. Review of Membership (New members, exiting members, etc.)
IV. Approval of Technical Subcommittee Minutes
See attachment #1
V. Old Business
A. Items from 2018 COMP Ballot 1. T 312 Published with updates to language regarding heating compaction surfaces.

Tech Subcommittee 2d Annual Meeting 2019 Page 2 of 4
2. Preparation of Small Cylindrical Performance Test Specimens Using the Superpave Gyratory Compactor (SGC) and Field Cores published as PP 99. Left flatness and perpendicularity reporting requirement as mandatory for the time being. Decided on 50 mm minimum core thickness at mid-year meeting.
3. Determining Dynamic Modulus using IDT published as TP 131. 4. Determining Dynamic Modulus with Small Specimens using AMPT published as TP 132 5. Determining Damage Curve and Failure Criterion with Small Specimens using the AMPT published as TP
133. 6. SSR published as TP 134.
B. No outstanding COMP Ballot Items
C. Technical Subcommittee Ballots TS Ballot # Standard
Results (neg/affirm) Comments/Negatives Action
19-02 R - BMD 2/25 See Attachments #2 & #3 19-02 M - BMD 4/23 See Attachments #4 & #5 19-02 M.I.S.T. 0/27 See Attachments #6 & #7 19-02 Nflex 1/26 See Attachments #8 & #9 19-03 TP 116 0/26 See Attachments #10 & 11 19-03 TP 124 0/26 See Attachments #10, #12, & #13
D. Reconfirmation Ballots (Attachment #14) Reconf. Ballot # Standard
Results (neg/affirm) Comments/Negatives Action
19-01 R30 1/31 1. Would eventually like to see "HMA" changed to "asphalt mixture." 2. In 2.1, PP 3 doesn't exist and footnote 2 says last published in 2002. 3. Only refers to gyratory compactor. Should include T 209 correct, especially since R 68 references R 30.
19-01 R68 0/32 19-01 T167 0/32 19-01 T245 0/32 19-01 T246 0/32 19-01 T247 0/32 19-01 T340 0/32 19-01 T342 0/32 19-01 PP76 0/32 19-01 TP105 0/32 19-01 TP116 0/32 19-01 TP117 0/32
E. Note in R35 discussing using Kerosene as a wetting agent. Did not address with 1a yet. Since R35 already refers to T100 will leave as is until coordinating with 1a.
F. TP 105 a. There was indeed an error in equation #7, which has been corrected. Followed up with Drs. Louay
Mohammed (LSU) and Mihai Marasteanu (UMN) to get correct equation and Publications will make the change. (Attachment #15)
b. Open question on machining tolerance for SCB/FIT fixtures. TP 105 tolerance 0.05mm and TP 124 tolerance 0.1mm. Do we need to be that exact on TP 105? Can they both be 0.1mm?
G. Task Force Reports c. No active Task Forces
VI. New Business
A. AASHTO re:source/CCRL/NTPEP - None
B. Presentation by Industry/Academia – TBD?

Tech Subcommittee 2d Annual Meeting 2019 Page 3 of 4
C. Revisions/Work on Standards for Coming Year R30 Task Force? Not aware of any work on list of standards up for reconfirmation other than what has already been addressed
above (Attachment #16)
D. Review of Stewardship List Tennessee volunteered for R 68 and T 245, still need stewards for other standards
E. Proposed New Standards - None
F. NCHRP Issues RNS from AFK10 on Plastics in Asphalt
G. Correspondence, Calls, Meetings - None
H. Proposed New Task Forces (Include list of volunteers to lead and/or join TF.)
I. New TS Ballots 1.
VII. Open Discussion
A.
B.
VIII. Adjourn
TS Meeting Summary
Meeting Summary Items Approved by the TS for Ballot (Include reconfirmations.)
Standard Designation Summary of Changes Proposed Ballot Type
☐TS ☐COMP ☐CONCURRENT ☐TS ☐COMP ☐CONCURRENT ☐TS ☐COMP ☐CONCURRENT ☐TS ☐COMP ☐CONCURRENT ☐TS ☐COMP ☐CONCURRENT ☐TS ☐COMP ☐CONCURRENT ☐TS ☐COMP ☐CONCURRENT ☐TS ☐COMP ☐CONCURRENT ☐TS ☐COMP ☐CONCURRENT ☐TS ☐COMP ☐CONCURRENT ☐TS ☐COMP ☐CONCURRENT New Task Forces Formed
Task Force Name Summary of Task TF Member Names and (States)
Research Proposals (Include number/title/states interested.)

Tech Subcommittee 2d Annual Meeting 2019 Page 4 of 4
Meeting Summary Other Action Items

Tech Section 2d
Page 1 of 9
COMMITTEE ON MATERIALS & PAVEMENTS
2018 - 2019 Mid Year Meeting (Webinar) Friday, February 8th, 2019
2:00 – 4:00 PM EST
TECHNICAL SECTION 2d Proportioning of Asphalt – Aggregate Mixtures
I. Introduction and Housekeeping (AASHTO Liaison)
II. Call to Order and Opening Remarks
Goals for webinar: 1. Address COMP/Concurrent Ballot items for publication 2. Determine need for presentations on proposed new standards from TS Ballot
III. Roll Call
Voting states present: MT (C), AZ, CO, ID, IL, IN, KS, KY, MD, MA, MO, NV, PA, TN, UT, VT Last Name First Name Email
Akisetty Chandra [email protected]
Anderson Howard [email protected]
Aschenbrener Tim [email protected]
Barezinsky Rick [email protected]
Beeson Matt [email protected]
Bergold Desna [email protected]
Brum Mark [email protected]
Burch Paul [email protected]
Corrigan Matthew [email protected]
Doran mike [email protected]
Gagulic Mladen [email protected]
Heiser Steven [email protected]
Horan Robert [email protected]
Huber Gerry [email protected]
Knake Maria [email protected]
Lawrence Bill [email protected]
Mensching David [email protected]
Metcalfe Oak [email protected]
Mohseni Ala [email protected]
Morrison Clark [email protected]
Myers Allen [email protected]
Nussbaum Scott [email protected]
PAN CHANGLIN [email protected]
Petros Katherine [email protected]

Tech Section 2d
Page 2 of 9
Ramirez Timothy [email protected]
Rilko Wayne [email protected]
Santi Mike [email protected]
Schumaker Clayton [email protected]
Schwartz Aaron [email protected]
Speer Daniel [email protected]
Stanford Michael [email protected]
Trautman Brett [email protected]
Trepanier Jim [email protected]
West Randy [email protected]
Wieden Craig [email protected]
Withee Jeffrey [email protected]
Woods Victoria [email protected]
Wu Peter [email protected]
Zwanka Merrill [email protected]
syslo mick [email protected]
Andrus Scott [email protected]
Biehl Eric [email protected]
Davis Jason [email protected]
Kane Tom [email protected]
Kennedy Kevin [email protected]
Salomon Delmar [email protected]
Streeter Don [email protected]
Willis Richard [email protected]
Short Temple SC
Pfeifer Brian IL
Zehr Tom IL
Hill Brian IL
Egan Brian TN
Hall Heather TN
Chandler Matthew TN
Park Hong TN
Wilson Craig AZ
Approval of Technical Section Minutes Attachment #1 Motion to approve minutes: CO
Second: TN Minutes approved as written
IV. Old Business A. COMP Ballot Items (see pages 3-4 of this agenda)
1. Item #28 – No Negatives, no comments, proceed with changes to T 312 (exact language on page 19 of 102 in the minutes of COMP meeting in Cincinnati – attachment #1)
2. Item #29 – No Negatives, editorial comments from VT, PA, & FL

Tech Section 2d
Page 3 of 9
- Comments 1-3 from PA are easily addressed but item 4 needs to go back to the authors before publishing.
- Item from FL was a question as to whether there should be a minimum core thickness? The TS needs to agree on a thickness and the update will be balloted
- This standard will be sent to publications with the changes that can go through but the other items will need to be balloted
3. Item #30 – No Negatives, no comments, proceed with publishing new draft standard 4. Item #31 – No Negatives, comments from MO - Comment from MO and FHWA contribution: agreement with MO that the comment may have resulted
from an oversight and that the asterisks should read 1.0. Dave from FHWA will circle back. The asterisks should have said “1” because otherwise it doesn’t make sense.
5. Item #32 – No Negatives, no comments, proceed with publishing new draft standard B. TS Ballots
1. Results from Task 406 1. New Provisional Practice
- Do these comments go back to the original author or does the TS deal with them? The comments are fairly substantial and it may take time to work through them.
- VT withdraws negative because the sentence that he commented on is in the standard practice but not the specification
- When this research originally came through it was heavily supported by the TS and COMP so the end product is important
- Randy West (Auburn) will work with Oak to help resolve some of the issues - TN is willing to w/draw negative. - There will probably be another round of balloting before these can be moved to publications.
2. New Provisional Spec
- There are several negatives that Oak will work on with Randy (auburn) - The original problem statement from this task… the practice was one of the deliverables but the spec
came from that organically 2. Proposed new method – Nflex Factor - This is brand new and the first time seeing it for many members - This standard seems close to the IDEAL-CT - Auburn: the NFLEX and IDEAL are similar but the specimens are different. One of the key differences is
that you use new samples for one and existing specimens for others. - Randy West agreed to give a presentation on these topics 3. Proposed new method – M.I.S.T. - This method was approved in 2017 but it was pulled by pubs because of the similarity to ASTM - The authors revamped it and this is the new balloted version - The comments will be addressed and reviewed at the annual meeting in Baltimore and we will see if the
standard can go to COMP ballot from there. 4. Note for R35 (See RE:source observations below)
C. Reconfirmation Ballots 1. Revise or Reconfirm
1. R30 2. R68 3. T167 4. T245 5. T246 6. T247 7. T340 8. T342
2. Revise or Extend

Tech Section 2d
Page 4 of 9
1. PP076 2. TP105 3. TP116 4. TP117
V. New Business
A. AASHTO Re:source/CCRL - Observations from Assessments? Proposed note for R35 indicating kerosene is a better wetting agent. Currently there is a note in T100 indicating the same. From T 100 “Kerosene is a better wetting agent than water for most soils and may be used in place of distilled or deionized water for oven-dried samples. If kerosene is used in place of water, a temperature correction factor based on the relative density of kerosene should be used in place of Table 1.” What is the pleasure of the TS? Is a Note in R35 necessary if R35 references T100 and the note is already there?
- Use of T100 for determining the spg of mineral filler. Since kerosene is widely used as a wetting agent would it be best to include the use of R35 in T100.
- Comments boiled down to: if R35 already references T100 then is it necessary to have a separate note in R35?
- Discussion: re:source: the concern is what happens if T100 changes to no longer allow kerosene? T100 is a soil test and not necessarily meant for use of mineral filler.
- PA withdraws their negative - AI: this will be discussed at the summer meeting. Oak will work with 1a to draft agreeable language for
both standards B. NCHRP Issues
How to proceed when deliverables from research projects are not accepted by the Technical Section? - Auburn will continue their involvement to help resolve the comments
C. Correspondence, calls, meetings (pages 5-6 of this agenda) 1. TP 131-18 Error. Section 9.2.1 should state the recommended gauge length is 50.8 +/- 1.0mm. - There is an error in TP 131. Dr. Kim agreed that the change should be made. Oak will make this change
as an editorial. Since this is a correction to the standard it’s editorial in nature. 2. TP 105. Two issues. One is a dimension. The other is a question on equation 7. Not sure where to start
on this. Have reached out to Dr. Mohammed at LSU and will reach out to Illinois DOT to get a contact at University of Illinois since they developed the IFIT based on SCB geometry.
- Oak will reach out to the researcher to ensure that the sign in the equation is correct before proceeding.
D. Revisions/Work on Standards for Coming Year 1. None other than have been or will be discussed today.
E. Proposed New Standards 1. Permission forms for drawings/photos
- Please be sure to get original art work, drawings, and photos for publications so they have their written permission and ability to edit.
F. Proposed New Task Forces? G. New TS Ballots?
1. TP 116 – Dr. Haleh Azari has proposed some changes for TP 116 but I wasn’t able to share those with the group in time for discussion at this meeting. Therefore, I will put out a TS ballot and schedule a time for Dr. Azari to present on the proposed changes in the future. TP 116 is up for reconfirmation this year.
2. P&B Statement for TP 124. ILDOT has compiled quite a bit of data and is proposing adding a P&B statement. Since this will have to be voted on by the entire COMP before we can publish, I’ll put out a TS ballot and schedule a time for ILDOT to present on the P&B in the future. I will probably combine the TP 116 and TP 124 presentations into a single webinar, depending on the time needed by the presenters.
- The plan moving forward is to send info and wording to the TS ahead of time. After that the H. Technical Subcommittee membership?
- If you would like to be a member of this committee, please email Oak and Casey

Tech Section 2d
Page 5 of 9
- Stewardship: the standards need to be thoroughly reviewed before reconfirmation. The routine revision work needs to be shared throughout the TS. Please be in touch with Oak if you are interested in being a steward.
- We will share the list of standards requiring review as well as the hand-out that’s available for those that want to be stewards.
VI. Open Discussion - Auburn: NCHRP task 406 report deliverable was also developing RPS for the gaps that exist in
implementation of balanced mix design. What is the process by which problem statements like this can move forward. How should RNS that come from the results of these
VII. Adjourn

Tech Section 2d
Page 6 of 9
Sponsored by Technical Subcommittee 2d
Item Number: 28
Description: COMP ballot to revise T 312. Ballot item to address "if required" language in AASHTO T 312. See pages 1, 18-19 of 102 of meeting minutes.
Decisions: Affirmative: 43 of 51 Negative: 0 of 51 No Vote: 8 of 51
Item Number: 29
Description: Concurrent ballot item for proposed new provisional standard for preparation of small specimens for use in the AMPT. See pages 2, 34-47 of 102 of meeting minutes.
Decisions: Affirmative: 43 of 51 Negative: 0 of 51 No Vote: 8 of 51
Agency (Individual Name) Comments
Vermont Agency of Transportation (Aaron Schwartz) ([email protected])
Should the first sentence of Section 10.3.2 actually state the following: "Determine Gmb of the 38-mm (1.50 in.) test specimen in accordance with T 166 or T 331." The language should be consistent with Section 9.5.2 in the event there is more than 2.0% absorption.
Pennsylvania Department of Transportation (Timothy Ramirez) ([email protected])
Comments: 1) In Section 3.1, 1st line, add space after the ending parenthesis in two locations. 2) In Section 6.5, revise from "(4in.)" to "(4 in.)" and from "(6in.)" to "(6 in.)". 3) In Section 6.6, suggest revising from "1mm" to "1.0 mm". 4) In Sections 11.1.12 (end flatness) and 11.1.13 (end perpendicularity), consider making these two items as "(optional)" to report. What is there to report? If the specimens are being prepared properly, the ends should be flat and perpendicular meeting the tolerances of Table 1.
Florida Department of Transportation (Timothy J. Ruelke) ([email protected])
Page 38 of 102, Section 3.1 should read, "...a 150-mm (5.91 in.) diameter by 180-mm (7.09 in.) tall..." Page 44 of 102, Figure 4, field cores. Should a minimum core thickness be specified when cutting nominal 38 mm horizontal specimens?
Item Number: 30
Description: Concurrent ballot item for proposed new provisional standard for determining dynamic modulus using small specimens in the AMPT. See pages 2, 34-35, 48-57 of 102 of the meeting minutes.
Decisions: Affirmative: 43 of 51 Negative: 0 of 51 No Vote: 8 of 51

Tech Section 2d
Page 7 of 9
Item Number: 31
Description: Concurrent ballot item for proposed new provisional standard for determining damage curve and failure criterion using small specimens in the AMPT. See pages 2, 34-35, 58-82 of 102 of meeting minutes.
Decisions Affirmative: 43 of 51 Negative: 0 of 51 No Vote: 8 of 51
Agency (Individual Name) Comments Missouri Department of Transportation (Brett Steven Trautman) ([email protected])
Affirmative vote with a comment: In Table 3, on Page 69 of 102, it appears to indicate through the asterisks and footnote that the test machine could not return to temperature, following a 5-minute setup time, however, could return to test temperature following a 10 minute setup time at the same delta T. It appears the asterisks may need to be replaced by "1.00" in the table.
Item Number: 32
Description: Concurrent ballot item for proposed new provisional standard for stress sweep rutting (SSR) using the AMPT. See pages 83-100 of 102 of meeting minutes.
Decisions: Affirmative: 43 of 51 Negative: 0 of 51 No Vote: 8 of 51
Date: 2/1/2019
Hello Oak and Greg, I hope that you are both doing well. I wanted to provide you with a minor suggestion for AASHTO R35- perhaps this can be discussed during the next meeting. R35 requires the use of T100 for determining the specific gravity of mineral filler. Our assessment staff have observed in the field that water does not work well for many mineral fillers when performing the specific gravity determination. Many mineral fillers float in water and it can be very difficult to get a clear line of demarcation on the flask and remove air from the sample. There is a note in T100 that states that kerosene is a better wetting agent and can be used in place of water if corrections are made in accordance with Table 1. We have found that kerosene, nasty stuff though it may be, does work a lot better for many types of mineral filler- especially those with baghouse fines. I was thinking it might be helpful to put a similar note regarding the possible use of kerosene in Section 6.6 of R35. I have included Andy Babish from TS 1a on this email as well. If T100 is going to continue to be used for determining specific gravity of mineral filler, it would be nice to have another alternative to kerosene… just throwing it out there. 😊😊 -Maria Maria Knake Manager, Laboratory Assessment Program

Tech Section 2d
Page 8 of 9
Hi Mike, I am sorry for the late reply. I've been in Italy since Dec. 5. Thank you for picking up this error. Section 9.2.1 should state that the recommended gauge length is 50.8 +/- 1.0 mm. ____________________________________ Y. Richard Kim, Ph.D., P.E., F.ASCE, F.KAST On Wed, Dec 19, 2018 at 9:01 PM Lusher, Steven Michael <[email protected]> wrote:
Dear Dr. Kim,
We may be running TP 131-18 (E* using IDT method) in the near future and I’ve got a question about one of the items in the spec. In section 9.2.1, it states, “The recommended gauge length is 101.6 +/- 1.0 mm…”. However, the geometric coefficients in Table 4 do not include values associated with the 101.6 mm gauge length. Am I missing something?
I appreciate your help in this matter.
Steven Michael Lusher, Ph.D. (Missouri Univ. of Sci & Tech)
Good morning Maria, Thank you for your insight! If you could forward the following information to the COMP subcommittee chair that would be helpful. Specifically there is a fixture dimension tolerance that is different between TP 105 and TP 124. TP 105 lists the dimension between the two rollers as 120.00 +/- 0.05mm. TP 124 dimension is 120.0 +/- 0.1mm While that doesn’t seem like a big difference, from a manufacturer’s point of view that can cause confusion. Also it seems that there is other inconsistencies between those two standards in the other dimensions, specifically the roller diameter. Of course I am assuming that both these TP standards are referencing the same SCB fixture. Also, the ASTM D8044 standard has different dimensions as compared to the AASHTO standard, but I can bring this up at the upcoming December meeting. Thanks for always answering my questions, have a great weekend! Jennifer Hanley Technical Support Specialist

Tech Section 2d
Page 9 of 9
-----Original Message----- > From: Hossam El-Din Sallam ([email protected]) > Sent: Monday, December 10, 2018 4:23 PM > > Dear Mr./Mrs. It gives me a great pleasure to write this e-mail > regarding the sign of second term in Equation # 7 in AASHTO TP 105-13 > (2015). When we compared this Equation with the original one suggested > by Lime et al., 1994, see "DOI of our paper: > 10.1080/10298436.2018.1555332". We stated that "This means that the > sign of the second term in Eq. 7 in AASHTO TP105-13 may not be correct > and should be verified. Furthermore, we suggested that if the relation > between the crack mouth opening displacement and the corresponding > stress intensity factor will be added to the above specification this > will be more useful for readers. Finally, please .accept my most > sincere greetings. Best regards H.E.M. Sallam, professor Jazan > University

Agency (Individual Name)
Decision Comments Responses
D'Angelo Consulting, LLC (John Anthony Dangelo)
This does not look like a standard specification but just a compilation of what some states have done. there is no discussion of how the criteria could be adjusted based on climate, location in the pavement, etc. There have been many cases where one agency tried to use criteria from another agency with very poor results. details on how the criteria should be set based on validation and experimentation is needed not just a list.
The objective of the proposed standard specification is to provide DOTs with a list of alternative mixture performance tests for use in BMD along with a summary of test criteria that are currently used by different state highway agencies. Agencies interested in implementing BMD should use this specification as a reference to help them make informative decisions on the selection of mixture performance tests and criteria.
Kansas Department of Transportation (Richard A Barezinsky)
Affirmative 2.1 Reference Documents - TP107, TP 124 names have changed.
Document names corrected.
Ohio Department of Transportation (Eric R Biehl)
Affirmative 1. I do not recommend put state DOTs testing requirements and criteria into the standard as this would require the standard to change every time a state mentioned changes their requirement. I wouldn't do this as a Note either. You may list the states that use the test in the notes and let the person contact the DOT for more info if needed.
After consulting with the ballot manager and AASHTO Publications, NCAT decided to move all the sections on “State DOTs Testing Requirements and Criteria” into a Non-mandatory Appendix. Such information would be helpful for state agencies that are interested in adding performance tests in their mix design specifications or implementing BMD.
2. Section 4.1 says that this standard's approach is for traffic greater than 3 million ESALs. Why is this? Appears there are state DOT requirements for mixes less than 3 million.
At this point, little work has been completed on the selection of performance test criteria for mixes with design traffic less than 0.3 million ESALs. Further, in the NCHRP 20-07/Task 406 survey, several state DOTs indicated that it is more appropriate to use BMD on moderate- and high-traffic mixes and use volumetric mix design

on low-traffic mixes. Therefore, the proposed standard specification only includes performance test criteria for mixes with design traffic greater than 3 million ESALs. Section 4.1 states, “This approach is only applicable to pavements with design traffic greater than 3 million ESALs or high stress non-highway applications.”
3. Specimen Conditioning and Aging sections: Would it be better to say to refer to AASHTO R 30 for conditioning of loose mix in case R 30 ever changes?
Suggested changes accepted. When appropriate, the “Specimen Conditioning and Aging” section now states, “condition loose mix test samples in accordance to R 30, Section 7.2 Short Term Conditioning for Mechanical Property Testing.”
Illinois Department of Transportation (Brian Pfeifer)
Affirmative All rutting and cracking test sections do not specify AASHTO R 30 for mixture/specimen conditioning.
Suggested changes accepted. When appropriate, the “Specimen Conditioning and Aging” section now states, “condition loose mix test samples in accordance to R 30, Section 7.2 Short Term Conditioning for Mechanical Property Testing.”
It is suggested to add this reference to the document. Section 1.1 uses the term “performance-based test results”. Consider using “performancebased/ related test results” because many of the rutting and cracking performance tests use performance-related results.
Suggested change accepted.
Section 6.6 references the I-FIT procedure and Section 6.6.1 states that no specimen conditioning or aging procedure has been recommended. However, Illinois DOT uses 1 or
This information was added to Section 6.6.1 as Note 9.
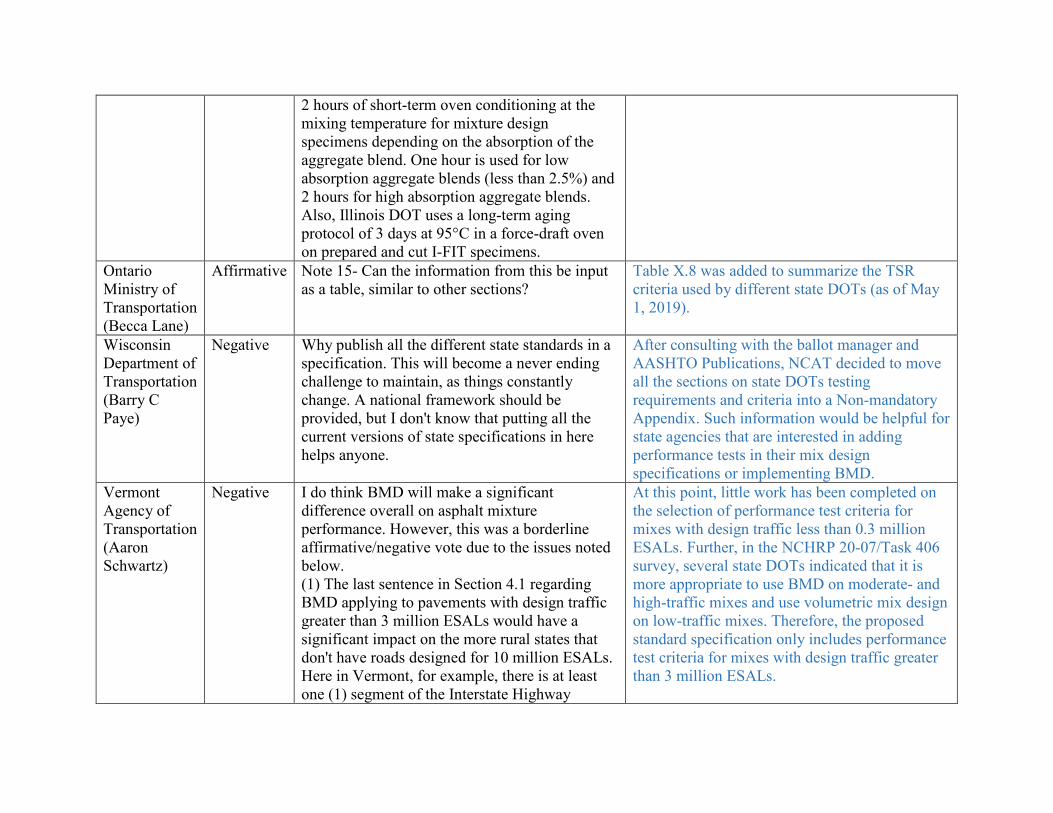
2 hours of short-term oven conditioning at the mixing temperature for mixture design specimens depending on the absorption of the aggregate blend. One hour is used for low absorption aggregate blends (less than 2.5%) and 2 hours for high absorption aggregate blends. Also, Illinois DOT uses a long-term aging protocol of 3 days at 95°C in a force-draft oven on prepared and cut I-FIT specimens.
Ontario Ministry of Transportation (Becca Lane)
Affirmative Note 15- Can the information from this be input as a table, similar to other sections?
Table X.8 was added to summarize the TSR criteria used by different state DOTs (as of May 1, 2019).
Wisconsin Department of Transportation (Barry C Paye)
Negative Why publish all the different state standards in a specification. This will become a never ending challenge to maintain, as things constantly change. A national framework should be provided, but I don't know that putting all the current versions of state specifications in here helps anyone.
After consulting with the ballot manager and AASHTO Publications, NCAT decided to move all the sections on state DOTs testing requirements and criteria into a Non-mandatory Appendix. Such information would be helpful for state agencies that are interested in adding performance tests in their mix design specifications or implementing BMD.
Vermont Agency of Transportation (Aaron Schwartz)
Negative I do think BMD will make a significant difference overall on asphalt mixture performance. However, this was a borderline affirmative/negative vote due to the issues noted below. (1) The last sentence in Section 4.1 regarding BMD applying to pavements with design traffic greater than 3 million ESALs would have a significant impact on the more rural states that don't have roads designed for 10 million ESALs. Here in Vermont, for example, there is at least one (1) segment of the Interstate Highway
At this point, little work has been completed on the selection of performance test criteria for mixes with design traffic less than 0.3 million ESALs. Further, in the NCHRP 20-07/Task 406 survey, several state DOTs indicated that it is more appropriate to use BMD on moderate- and high-traffic mixes and use volumetric mix design on low-traffic mixes. Therefore, the proposed standard specification only includes performance test criteria for mixes with design traffic greater than 3 million ESALs.

System that doesn't see more than 2,500 vehicles per day, which when designing for a 20-year design life may be at or below 3 million ESALs. Moreover, some of the tables summarizing design criteria used by state DOTs (Table 2, North Carolina, for example) do have criteria for roads designed for less than 3 million ESALs.
Section 4.1 states, “This approach is only applicable to pavements with design traffic greater than 3 million ESALs or high stress non-highway applications.”
(2) The state DOT criteria in each table should be double-checked before moving forward, as it's likely changes were made after the literature review in Chapter 3 of the report was completed.
After consulting with the ballot manager and AASHTO Publications, NCAT decided to move all the sections on state DOTs testing requirements and criteria into a Non-mandatory Appendix. Such information would be helpful for state agencies that are interested in adding performance tests in their mix design specifications or implementing BMD. All test criteria included have been double-check and should be accurate as of May 1, 2019.
(3) It may be premature to include placeholder tables for traffic level (Table 1, for example) without further research being done.
For all mixture performance tests without nationally accepted criteria, the “Test Criteria” section is modified to read as follows: “compare the test results with the criteria in Table x, or criteria specified by the state highway agency.”
Tennessee Department of Transportation (Brian K. Egan)
Negative All the Tables that reference current State Criteria (i.e. Tables 2,4, 6, and 8) need to be removed since all are subject to change. They could be placed as an Appendix or revise the notes to reference the NCHRP 20-07/Task 406 for State Criteria and Specifications.
Suggested change accepted. After consulting with the ballot manager and AASHTO Publications, NCAT decided to move all the sections on state DOTs testing requirements and criteria into a Non-mandatory Appendix. Such information would be helpful for state agencies that are interested in adding performance tests in their mix design specifications or implementing BMD.

Pennsylvania Department of Transportation (Timothy L Ramirez)
Negative 1) There is too high a frequency of "TBD" used in the standard for many of the performance tests. This will not adequately support the different approaches in the R xx-xx, Balanced Design of Asphalt Mixtures standard.
The objective of the proposed standard practice and specification is to provide a framework for balanced design of asphalt mixtures based on mixture volumetric properties and/or performance-based/related test results. The two documents are envisioned to provide mix designers with an overview and guidance on how to establish a BMD job mix design using four alternate design approaches and how to select mixture performance tests and criteria. Because this is only a framework at this point, additional information with regards to performance criteria (based on findings and recommendations from many ongoing research studies on this topic) should be added as they become available in the near future.
2) For several of the TBD performance criteria, individual state criteria is provided within the body of the standard. These individual state criteria should be included in an Appendix (nonmandatory). Also, who and how will each individual state's performance testing criteria be maintained within this standard? This would seem impossible to keep these criteria updated to the current individual state specifications.
Suggested change accepted. After consulting with the ballot manager and AASHTO Publications, NCAT decided to move all the sections on state DOTs testing requirements and criteria into a Non-mandatory Appendix. Such information would be helpful for state agencies that are interested in adding performance tests in their mix design specifications or implementing BMD.
3) In Section 6.7.3, is there a standard practice to reference for determining master relaxation modulus curve and fracture parameters? If so, can it be included here?
Refences added. Section 6.7.3 now states, “However, the test data can be input into an Excel spreadsheet (LTSTRESS) to determine master relaxation modulus curve and fracture parameters and predict the critical thermal cracking temperature

based on a given cooling rate (Hiltunen and Roque, 1994; Christensen, 1998). The critical thermal cracking temperature can be compared to the expected low pavement temperature for the project location using LTPP Bind at given levels of reliability.”
4) In Section 7.3.2, this conditioning is for laboratory mixed, laboratory compacted specimens and not for field (plant) -mixed, laboratory compacted specimens as specified in T 283.
Comment noted. Because the proposed standard specification is about balanced design of asphalt mixtures, all included discussions on “specimen condition and aging” correspond to laboratory-mixed, laboratory-compacted (LMLC) specimens, not plant-mixed, laboratory-compacted (PMLC) specimens.

© 2017 by the American Association of State Highway and Transportation Officials. All rights reserved. Duplication is a violation of applicable law. This file has been provided for standard development purposes only; no duplication, redistribution, or sales are permitted.
TS-2d M xxx-0 AASHTO
Standard Specification for
Balanced Mix Design
AASHTO Designation: M XXX-XX
Technical Section: 2d, Proportioning of Asphalt–Aggregate Mixtures
American Association of State Highway and Transportation Officials 444 North Capitol Street N.W., Suite 249 Washington, D.C. 20001
© 2017 by the American Association of State Highway and Transportation Officials. All rights reserved. Duplication is a violation of applicable law. This file has been provided for standard development purposes only; no duplication, redistribution, or sales are permitted.
TS-2d M xxx-1 AASHTO
Standard Specification for
Balanced Mix Design
AASHTO Designation: M XXX-XX Technical Section: 2d, Proportioning of Asphalt–Aggregate Mixtures
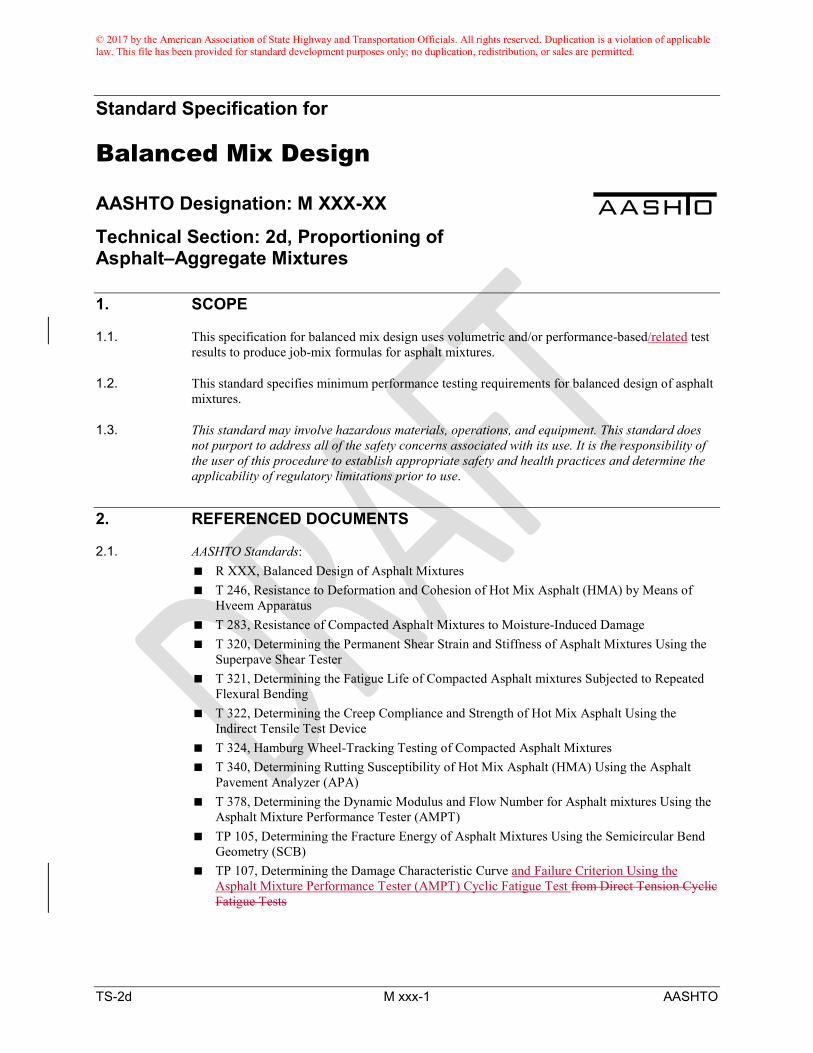
1. SCOPE
1.1. This specification for balanced mix design uses volumetric and/or performance-based/related test results to produce job-mix formulas for asphalt mixtures.
1.2. This standard specifies minimum performance testing requirements for balanced design of asphalt mixtures.
1.3. This standard may involve hazardous materials, operations, and equipment. This standard does not purport to address all of the safety concerns associated with its use. It is the responsibility of the user of this procedure to establish appropriate safety and health practices and determine the applicability of regulatory limitations prior to use.
2. REFERENCED DOCUMENTS
2.1. AASHTO Standards: R XXX, Balanced Design of Asphalt Mixtures T 246, Resistance to Deformation and Cohesion of Hot Mix Asphalt (HMA) by Means of
Hveem Apparatus T 283, Resistance of Compacted Asphalt Mixtures to Moisture-Induced Damage T 320, Determining the Permanent Shear Strain and Stiffness of Asphalt Mixtures Using the
Superpave Shear Tester T 321, Determining the Fatigue Life of Compacted Asphalt mixtures Subjected to Repeated
Flexural Bending T 322, Determining the Creep Compliance and Strength of Hot Mix Asphalt Using the
Indirect Tensile Test Device T 324, Hamburg Wheel-Tracking Testing of Compacted Asphalt Mixtures T 340, Determining Rutting Susceptibility of Hot Mix Asphalt (HMA) Using the Asphalt
Pavement Analyzer (APA) T 378, Determining the Dynamic Modulus and Flow Number for Asphalt mixtures Using the
Asphalt Mixture Performance Tester (AMPT) TP 105, Determining the Fracture Energy of Asphalt Mixtures Using the Semicircular Bend
Geometry (SCB) TP 107, Determining the Damage Characteristic Curve and Failure Criterion Using the
Asphalt Mixture Performance Tester (AMPT) Cyclic Fatigue Test from Direct Tension Cyclic Fatigue Tests
© 2017 by the American Association of State Highway and Transportation Officials. All rights reserved. Duplication is a violation of applicable law. This file has been provided for standard development purposes only; no duplication, redistribution, or sales are permitted.
TS-2d M xxx-2 AASHTO
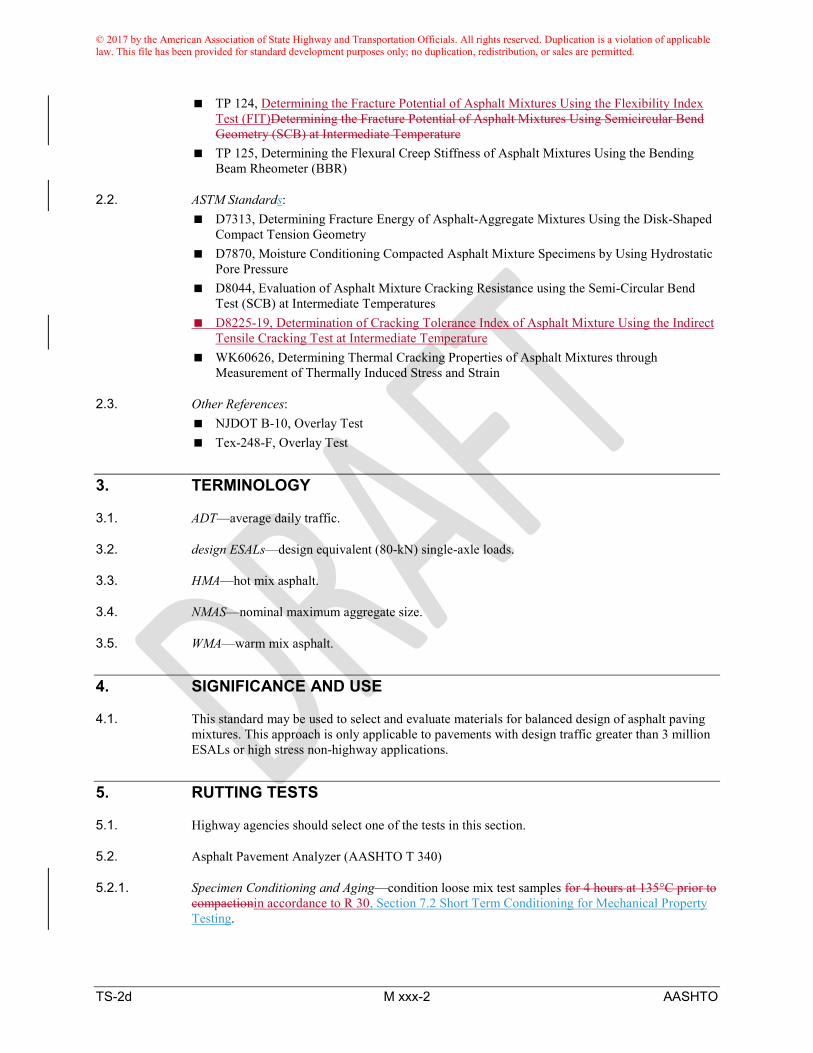
TP 124, Determining the Fracture Potential of Asphalt Mixtures Using the Flexibility Index Test (FIT)Determining the Fracture Potential of Asphalt Mixtures Using Semicircular Bend Geometry (SCB) at Intermediate Temperature
TP 125, Determining the Flexural Creep Stiffness of Asphalt Mixtures Using the Bending Beam Rheometer (BBR)
2.2. ASTM Standards: D7313, Determining Fracture Energy of Asphalt-Aggregate Mixtures Using the Disk-Shaped
Compact Tension Geometry D7870, Moisture Conditioning Compacted Asphalt Mixture Specimens by Using Hydrostatic
Pore Pressure D8044, Evaluation of Asphalt Mixture Cracking Resistance using the Semi-Circular Bend
Test (SCB) at Intermediate Temperatures D8225-19, Determination of Cracking Tolerance Index of Asphalt Mixture Using the Indirect
Tensile Cracking Test at Intermediate Temperature WK60626, Determining Thermal Cracking Properties of Asphalt Mixtures through
Measurement of Thermally Induced Stress and Strain
2.3. Other References: NJDOT B-10, Overlay Test Tex-248-F, Overlay Test
3. TERMINOLOGY
3.1. ADT—average daily traffic.
3.2. design ESALs—design equivalent (80-kN) single-axle loads.
3.3. HMA—hot mix asphalt.
3.4. NMAS—nominal maximum aggregate size.
3.5. WMA—warm mix asphalt.
4. SIGNIFICANCE AND USE
4.1. This standard may be used to select and evaluate materials for balanced design of asphalt paving mixtures. This approach is only applicable to pavements with design traffic greater than 3 million ESALs or high stress non-highway applications.
5. RUTTING TESTS
5.1. Highway agencies should select one of the tests in this section.
5.2. Asphalt Pavement Analyzer (AASHTO T 340)
5.2.1. Specimen Conditioning and Aging—condition loose mix test samples for 4 hours at 135°C prior to compactionin accordance to R 30, Section 7.2 Short Term Conditioning for Mechanical Property Testing.

© 2017 by the American Association of State Highway and Transportation Officials. All rights reserved. Duplication is a violation of applicable law. This file has been provided for standard development purposes only; no duplication, redistribution, or sales are permitted.
TS-2d M xxx-3 AASHTO
5.2.2. Test Temperature—set the test temperature to the high temperature of the standard Superpave performance-graded (PG) binder identified by the specifying agency for the project for which the asphalt paving mixture is intended (Note 1).
Note 1—different test temperatures with a range of 40 to 67°C are currently being used by state DOTs.
5.2.3. Test Criteria—compare the test results with the criteria given in Table 1 (Note 2), or criteria specified by the state highway agency.
Table 1. Asphalt Pavement Analyzer Criteria Traffic Level, Million ESALs Criteria
3 to < 10 TBD 10 to < 30 TBD
≥ 30 TBD
Note 2—Table X.1 summarizes the APA criteria used by different state DOTs.
5.3. Flow Number Test (AASHTO T 378)
5.3.1. Specimen Conditioning and Aging—condition loose mix test samples for 4 hours at 135°C for hot mix asphalt (HMA) and 2 hours at field compaction temperature for warm mix asphalt (WMA) prior to compaction.
5.3.2. Test Temperature—select a test temperature as the high-adjusted PG temperature determined using the LTPP Bind software.
5.3.3. Test Criteria—compare the test results with the criteria given in Table 2, or criteria specified by the state highway agency.
Table 2. Flow Number Test Criteria Traffic Level, million
ESALs HMA Minimum Average
Flow Number* WMA Minimum Average
Flow Number# 3 to < 10 50 30
10 to < 30 190 105 ≥30 740 415
*recommended criteria from NCHRP report 673, page 142 (AAT, 2011); #recommended criteria from NCHRP report 691, page 80 (Bonaquist, 2011).
5.4. Hamburg Wheel-Tracking Test (AASHTO T 324)
5.4.1. Specimen Conditioning and Aging—condition loose mix test samples in accordance to R 30, Section 7.2 Short Term Conditioning for Mechanical Property Testingfor 4 hours at 135°C prior to compaction.
5.4.2. Test Temperature—select a test temperature based on the applicable specifications (Note 3).
Note 3—different test temperatures with a range of 40 to 56°C are currently being used by state DOTs. As shown in Table X.2, some agencies use a temperature of 50°C for all mixtures, while others require the adjustment of test temperature based on the binder high temperature PG. Future research should consider setting the test temperature based on the predicted design pavement temperature from the LTPP Bind software.
© 2017 by the American Association of State Highway and Transportation Officials. All rights reserved. Duplication is a violation of applicable law. This file has been provided for standard development purposes only; no duplication, redistribution, or sales are permitted.
TS-2d M xxx-4 AASHTO
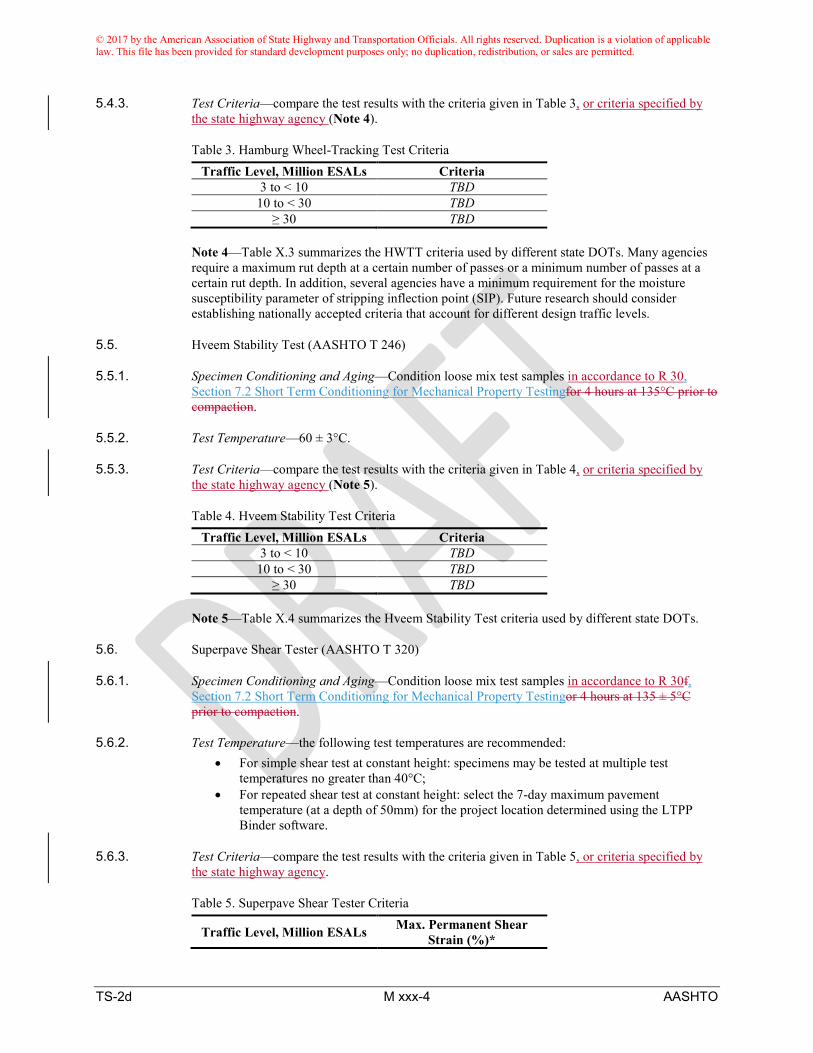
5.4.3. Test Criteria—compare the test results with the criteria given in Table 3, or criteria specified by the state highway agency (Note 4).
Table 3. Hamburg Wheel-Tracking Test Criteria Traffic Level, Million ESALs Criteria
3 to < 10 TBD 10 to < 30 TBD
≥ 30 TBD
Note 4—Table X.3 summarizes the HWTT criteria used by different state DOTs. Many agencies require a maximum rut depth at a certain number of passes or a minimum number of passes at a certain rut depth. In addition, several agencies have a minimum requirement for the moisture susceptibility parameter of stripping inflection point (SIP). Future research should consider establishing nationally accepted criteria that account for different design traffic levels.
5.5. Hveem Stability Test (AASHTO T 246)
5.5.1. Specimen Conditioning and Aging—Condition loose mix test samples in accordance to R 30, Section 7.2 Short Term Conditioning for Mechanical Property Testingfor 4 hours at 135°C prior to compaction.
5.5.2. Test Temperature—60 ± 3°C.
5.5.3. Test Criteria—compare the test results with the criteria given in Table 4, or criteria specified by the state highway agency (Note 5).
Table 4. Hveem Stability Test Criteria Traffic Level, Million ESALs Criteria
3 to < 10 TBD 10 to < 30 TBD
≥ 30 TBD
Note 5—Table X.4 summarizes the Hveem Stability Test criteria used by different state DOTs.
5.6. Superpave Shear Tester (AASHTO T 320)
5.6.1. Specimen Conditioning and Aging—Condition loose mix test samples in accordance to R 30f, Section 7.2 Short Term Conditioning for Mechanical Property Testingor 4 hours at 135 ± 5°C prior to compaction.
5.6.2. Test Temperature—the following test temperatures are recommended: • For simple shear test at constant height: specimens may be tested at multiple test
temperatures no greater than 40°C; • For repeated shear test at constant height: select the 7-day maximum pavement
temperature (at a depth of 50mm) for the project location determined using the LTPP Binder software.
5.6.3. Test Criteria—compare the test results with the criteria given in Table 5, or criteria specified by the state highway agency.
Table 5. Superpave Shear Tester Criteria
Traffic Level, Million ESALs Max. Permanent Shear Strain (%)*

© 2017 by the American Association of State Highway and Transportation Officials. All rights reserved. Duplication is a violation of applicable law. This file has been provided for standard development purposes only; no duplication, redistribution, or sales are permitted.
TS-2d M xxx-5 AASHTO
3 to < 10 3.4 10 to < 30 2.1
≥ 30 0.8 *recommended criteria for the repeated shear at constant height test from NCHRP report 673, page 144 (AAT, 2011).
6. CRACKING TESTS
6.1. Highway agencies should select one of the tests in this section.
6.2. BBR Mixture Bending Test (AASHTO TP 125)
6.2.1. Specimen Conditioning and Aging—no specimen conditioning and aging procedure has been recommended at this time.
6.2.2. Test Temperature—for quality control, select the temperature 10°C above the specified binder low-temperature grade used in the mixture. For performance prediction, select at least three temperatures at 6°C intervals. The test temperatures of 4°C, 10°C, and 16°C above the specified binder grade used in the mixtures have been successfully used. Other temperatures can also be used depending on the project requirements.
6.2.3. Test Criteria—compare the test results with the criteria given in Table 6, or criteria specified by the state highway agency (Note 6).
Table 6. BBR Mixture Bending Test Criteria Traffic Level, Million ESALs Criteria
3 to < 10 TBD 10 to < 30 TBD
≥ 30 TBD
Note 6—researchers at the University of Utah proposed a preliminary failure envelope on the creep modulus versus m-value Black Space diagram that was able to identify asphalt mixtures susceptible to thermal cracking (Romero, 2016).
6.3. Direct Tension Cyclic Fatigue Test (AASHTO TP 107)
6.3.1. Specimen Conditioning and Aging—condition loose mix test samples for 4 hours at 135°C prior to compactionin accordance to R 30, Section 7.2 Short Term Conditioning for Mechanical Property Testing.
6.3.2. Test Temperature—select the test temperature as the 98 percent reliability climatic PG determined based on LTPP Bind software at the location of interest, but not exceeding 21°C.
6.3.3. Test Criteria—compare the test results with the criteria given in Table 7, or criteria specified by the state highway agency (Note 7).
Table 7. Direct Tension Cyclic Fatigue Test Criteria Traffic Level, Million ESALs Criteria
3 to < 10 TBD 10 to < 30 TBD
≥ 30 TBD
Note 7—no criteria has been established at this time.
© 2017 by the American Association of State Highway and Transportation Officials. All rights reserved. Duplication is a violation of applicable law. This file has been provided for standard development purposes only; no duplication, redistribution, or sales are permitted.
TS-2d M xxx-6 AASHTO
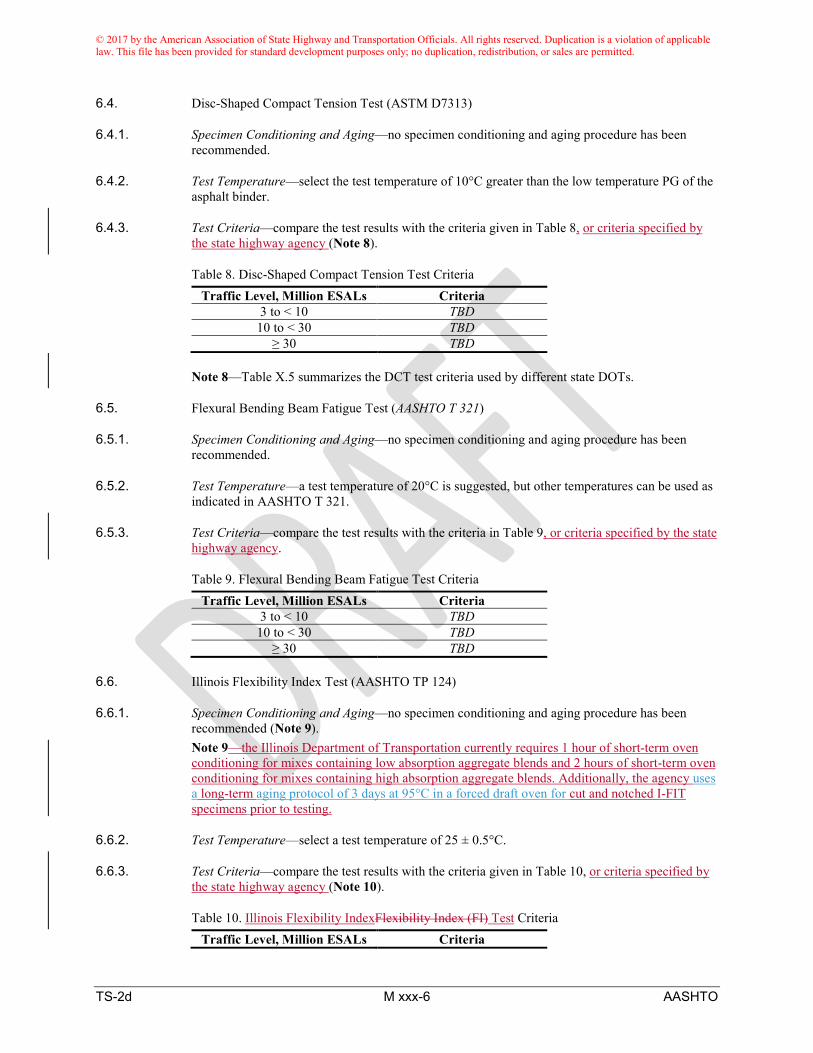
6.4. Disc-Shaped Compact Tension Test (ASTM D7313)
6.4.1. Specimen Conditioning and Aging—no specimen conditioning and aging procedure has been recommended.
6.4.2. Test Temperature—select the test temperature of 10°C greater than the low temperature PG of the asphalt binder.
6.4.3. Test Criteria—compare the test results with the criteria given in Table 8, or criteria specified by the state highway agency (Note 8).
Table 8. Disc-Shaped Compact Tension Test Criteria Traffic Level, Million ESALs Criteria
3 to < 10 TBD 10 to < 30 TBD
≥ 30 TBD
Note 8—Table X.5 summarizes the DCT test criteria used by different state DOTs.
6.5. Flexural Bending Beam Fatigue Test (AASHTO T 321)
6.5.1. Specimen Conditioning and Aging—no specimen conditioning and aging procedure has been recommended.
6.5.2. Test Temperature—a test temperature of 20°C is suggested, but other temperatures can be used as indicated in AASHTO T 321.
6.5.3. Test Criteria—compare the test results with the criteria in Table 9, or criteria specified by the state highway agency.
Table 9. Flexural Bending Beam Fatigue Test Criteria Traffic Level, Million ESALs Criteria
3 to < 10 TBD 10 to < 30 TBD
≥ 30 TBD
6.6. Illinois Flexibility Index Test (AASHTO TP 124)
6.6.1. Specimen Conditioning and Aging—no specimen conditioning and aging procedure has been recommended (Note 9). Note 9—the Illinois Department of Transportation currently requires 1 hour of short-term oven conditioning for mixes containing low absorption aggregate blends and 2 hours of short-term oven conditioning for mixes containing high absorption aggregate blends. Additionally, the agency uses a long-term aging protocol of 3 days at 95°C in a forced draft oven for cut and notched I-FIT specimens prior to testing.
6.6.2. Test Temperature—select a test temperature of 25 ± 0.5°C.
6.6.3. Test Criteria—compare the test results with the criteria given in Table 10, or criteria specified by the state highway agency (Note 10).
Table 10. Illinois Flexibility IndexFlexibility Index (FI) Test Criteria Traffic Level, Million ESALs Criteria

© 2017 by the American Association of State Highway and Transportation Officials. All rights reserved. Duplication is a violation of applicable law. This file has been provided for standard development purposes only; no duplication, redistribution, or sales are permitted.
TS-2d M xxx-7 AASHTO
3 to < 10 TBD 10 to < 30 TBD
≥ 30 TBD
Note 10—the Illinois Department of Transportation currently uses a preliminary minimum flexibility index (FFI) threshold of 8.0 for acceptance of asphalt mixtures (Illinois Department of Transportation, 2015).
6.7. Indirect Tensile Asphalt Cracking Test (ASTM D8225-19)
6.7.1. Specimen Conditioning and Aging—condition loose mix test samples in accordance to R 30, Section 7.2 Short Term Conditioning for Mechanical Property Testing.
6.7.2. Test Temperature—the typical target test temperature is 25°C, but other target intermediate test temperatures can be used. One choice for the target intermediate test temperature is PG IT defined in M 320, or M 332 and provided in Equation 1.
PG IT =PG HT + PG LT
2
Equation 1
where: PG IT = intermediate performance grade temperature (°C), PG HT = climatic high-performance grade temperature (°C), and PG LT = climatic low-performance grade temperature (°C).
6.7.3. Test Criteria—compare the test results with the criteria given in Table 11, or criteria specified by the state highway agency (Note 11).
Table 11. Indirect Tensile Asphalt Cracking Test Criteria Traffic Level, Million ESALs Criteria
3 to < 10 TBD 10 to < 30 TBD
≥ 30 TBD
Note 11— the Virginia Department of Transportation currently uses a preliminary minimum cracking tolerance index (CTindex) of 70 for acceptance of high RAP content surface mixtures designed using performance criteria (Virginia Department of Transportation, 2019).
6.7.6.8. Indirect Tensile Creep Compliance and Strength Test (AASHTO T 322)
6.7.1.6.8.1. Specimen Conditioning and Aging—no specimen conditioning and aging procedure has been recommended.
6.7.2.6.8.2. Test Temperature—select three temperatures at 10°C intervals. The following test temperatures are recommended:
• For mixtures made using binder grades PG XX-34 or softer: –30, –20, and –10°C; • For mixtures made using binder grades PG XX-28 and PG XX-22, or mixtures for which
binder grade is unknown: –20, –10, and 0°C; • For mixtures made using binder grades PG XX-16 or harder: –10, 0, and +10°C; and • For mixtures subjected to severe age hardening, the test temperatures should be increased
by 10°C. The test temperatures of 4°C, 10°C, and 16°C above the specified binder grade used in the mixtures have been successfully used. Other temperatures can also be used depending on the project requirements.

© 2017 by the American Association of State Highway and Transportation Officials. All rights reserved. Duplication is a violation of applicable law. This file has been provided for standard development purposes only; no duplication, redistribution, or sales are permitted.
TS-2d M xxx-8 AASHTO
6.7.3.6.8.3. Test Criteria—no criteria has yet been established for the creep compliance, tensile strength, and Poisson’s ratio results. However, the test data can be used input into an Excel spreadsheet (LTSTRESS) to determine master relaxation modulus curve and fracture parameters and to predict the critical thermal cracking temperature based on a given cooling rate (Hiltunen and Raoque, 1994; Christensen, 1998). The critical thermal cracking temperature can be compared to the expected low pavement temperature for the project location using LTPP Bind at given levels of reliability.
6.8.6.9. Indirect Tensile Energy Ratio Test
6.8.1.6.9.1. Specimen Conditioning and Aging—condition loose mix test samples for 4 hours at 135°C prior to compactionin accordance to R 30, Section 7.2 Short Term Conditioning for Mechanical Property Testing.
6.8.2.6.9.2. Test Temperature—select a test temperature of 10 ± 1°C
6.8.3.6.9.3. Test Criteria—compare the test results with the criteria given in Table 12, or criteria specified by the state highway agency (Note 12).
Table 12. Indirect Tensile Energy Ratio Test Criteria Traffic Level, Million ESALs Criteria
3 to < 10 TBD 10 to < 30 TBD
≥ 30 TBD
Note 12—Table X.6 summarizes the Energy Ratio Test criteria recommended by the University of Florida.
6.9.6.10. Indirect Tensile Fracture Energy Test (AASHTO Draft Procedure, NCHRP Research Report 843)
6.9.1.6.10.1. Specimen Conditioning and Aging—condition loose mix test samples for 4 hours at 135°C prior to compactionin accordance to R 30, Section 7.2 Short Term Conditioning for Mechanical Property Testing.
6.9.2.6.10.2. Test Temperature—select a test temperature of 20°C.
6.9.3.6.10.3. Test Criteria—compare the test results with the criteria given in Table 13, or criteria specified by the state highway agency (Note 13).
Table 13. Indirect Tensile Fracture Energy Test Criteria Traffic Level, Million ESALs Criteria
3 to < 10 TBD 10 to < 30 TBD
≥ 30 TBD
Note 13—no test criteria has yet been established.
6.10.6.11. Overlay Test (Tex-248-F and NJDOT B-10)
6.10.1.6.11.1. Specimen Conditioning and Aging—condition loose mix test samples for 2 hours at compaction temperature for HMA and 4 hours at 135°C for WMA prior to compaction.
6.10.2.6.11.2. Test Temperature—select a test temperature of 25°C.

© 2017 by the American Association of State Highway and Transportation Officials. All rights reserved. Duplication is a violation of applicable law. This file has been provided for standard development purposes only; no duplication, redistribution, or sales are permitted.
TS-2d M xxx-9 AASHTO
6.10.3.6.11.3. Test Criteria—compare the test results with the criteria given in Table 14, or criteria specified by the state highway agency (Note 14).
Table 14. Overlay Test Criteria Traffic Level, Million ESALs Criteria
3 to < 10 TBD 10 to < 30 TBD
≥ 30 TBD
Note 14—Table X.7 summarizes the OT criteria used by Texas DOT and New Jersey DOT.
6.11.6.12. Semi-Circular Bend Test at Intermediate Temperature (ASTM D8044)
6.11.1.6.12.1. Specimen Conditioning and Aging—age the compacted test specimens for 5 days at 85°C.
6.11.2.6.12.2. Test Temperature—25°C.
6.11.3.6.12.3. Test Criteria—compare the test results with the criteria given in Table 15, or criteria specified by the state highway agency (Note 15).
Table 15. Semi-Circular Bend Intermediate Temperature Test Criteria Traffic Level, Million ESALs Criteria
3 to < 10 TBD 10 to < 30 TBD
≥ 30 TBD
Note 15—The Louisiana Transportation Research Center currently requires a minimum SCB Jc value of 0.6 and 0.5 kJ/m2 for high traffic mix and medium/low traffic mix, respectively.
6.12.6.13. Semi-Circular Bend Test at Low Temperature (AASHTO TP 105)
6.12.1.6.13.1. Specimen Conditioning and Aging—condition loose mix test samples in accordance to R 30for 4 hours at 135°C prior to compaction.
6.12.2.6.13.2. Test Temperature—two test temperatures are recommended: 10°C above the PG lower limit of the asphalt binder used in the asphalt mixture, and 2°C below the PG lower limit.
6.12.3.6.13.3. Test Criteria—compare the test results with the criteria given in Table 16, or criteria specified by the state highway agency (Note 16).
Table 16. SCB Low Temperature Test Criteria Traffic Level, Million ESALs Criteria
3 to < 10 TBD 10 to < 30 TBD
≥ 30 TBD
Note 16—no criteria has yet been established.
6.13.6.14. Uniaxial Thermal Stress and Strain Test (ASTM WK60626)
6.13.1.6.14.1. Specimen Conditioning and Aging—no specimen conditioning and aging procedure has been recommended.

© 2017 by the American Association of State Highway and Transportation Officials. All rights reserved. Duplication is a violation of applicable law. This file has been provided for standard development purposes only; no duplication, redistribution, or sales are permitted.
TS-2d M xxx-10 AASHTO
6.13.2.6.14.2. Test Temperature—start at 20°C and then apply thermal loading at 10°C per hour through - 40°C.
6.13.3.6.14.3. Test Criteria—no criteria has yet been established for the coefficient of thermal contraction, fracture strength, fracture temperature, crack initiation stress, and UTSST resistance index results. However, the test data can be used to characterize the thermos-viscoelastic and thermal-volumetric properties of asphalt mixtures at various thermal transition zones, which are required to model thermal cracking in asphalt pavements and design thermal cracking resistance mixtures.
7. MOISTURE DAMAGE TESTS
7.1. Highway agencies should select one of the tests in this section.
7.2. Hamburg Wheel-Tracking Test (AASHTO T 324)—refer to section 5.4.
7.3. Indirect Tensile Strength Test (AASHTO T 283)
7.3.1. Specimen Conditioning and Aging—condition loose mix test samples for 2 hours at room temperature, followed by 16 hours at 60°C and then 2 hours at the compaction temperature prior to compaction.
7.3.2. Test Temperature—select a test temperature of 25°C.
7.3.3. Test Criteria—compare the test results with a minimum TSR criterion of 80% (Note 17).
Note 17—several highway agencies also require a minimum threshold of dry and/or wet IDT strength values in addition to TSR. Table X.8 summarizes the TSR criteria used by different state DOTs.
7.4. Moisture Induced Stress Tester (ASTM D7870)
7.4.1. Specimen Conditioning and Aging—no specimen conditioning and aging procedure has been recommended.
7.4.2. Test Temperature—select a test temperature of 60°C for mixtures containing binder high-temperature grades higher than 60. Select a temperature of 50°C for mixtures containing binder high-temperature grades lower than 60 and all WMA mixtures.
7.4.3. Test Criteria—no criteria has yet been established (Note 18).
Note 18—the test is commonly used as a moisture conditioning procedure for compacted asphalt mixture specimens that are subject to mechanical and tensile strength tests. The changes in the test results before and after the conditioning are then used to assess the mixture’s resistance to moisture damage.
8. KEYWORDS
8.1. Job mix formulas; Superpave; performance testing; rutting; cracking; moisture damage.
© 2017 by the American Association of State Highway and Transportation Officials. All rights reserved. Duplication is a violation of applicable law. This file has been provided for standard development purposes only; no duplication, redistribution, or sales are permitted.
TS-2d M xxx-11 AASHTO
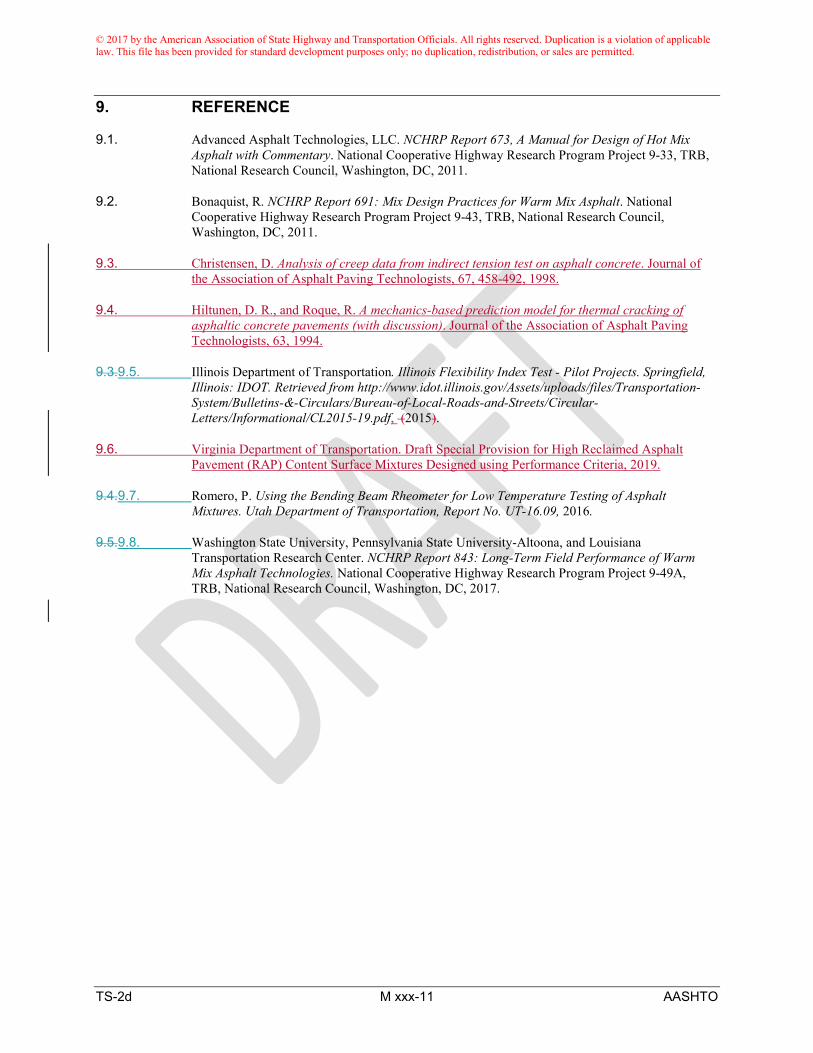
9. REFERENCE
9.1. Advanced Asphalt Technologies, LLC. NCHRP Report 673, A Manual for Design of Hot Mix Asphalt with Commentary. National Cooperative Highway Research Program Project 9-33, TRB, National Research Council, Washington, DC, 2011.
9.2. Bonaquist, R. NCHRP Report 691: Mix Design Practices for Warm Mix Asphalt. National Cooperative Highway Research Program Project 9-43, TRB, National Research Council, Washington, DC, 2011.
9.3. Christensen, D. Analysis of creep data from indirect tension test on asphalt concrete. Journal of the Association of Asphalt Paving Technologists, 67, 458-492, 1998.
9.4. Hiltunen, D. R., and Roque, R. A mechanics-based prediction model for thermal cracking of asphaltic concrete pavements (with discussion). Journal of the Association of Asphalt Paving Technologists, 63, 1994.
9.3.9.5. Illinois Department of Transportation. Illinois Flexibility Index Test - Pilot Projects. Springfield, Illinois: IDOT. Retrieved from http://www.idot.illinois.gov/Assets/uploads/files/Transportation-System/Bulletins-&-Circulars/Bureau-of-Local-Roads-and-Streets/Circular-Letters/Informational/CL2015-19.pdf, (2015).
9.6. Virginia Department of Transportation. Draft Special Provision for High Reclaimed Asphalt Pavement (RAP) Content Surface Mixtures Designed using Performance Criteria, 2019.
9.4.9.7. Romero, P. Using the Bending Beam Rheometer for Low Temperature Testing of Asphalt Mixtures. Utah Department of Transportation, Report No. UT-16.09, 2016.
9.5.9.8. Washington State University, Pennsylvania State University-Altoona, and Louisiana Transportation Research Center. NCHRP Report 843: Long-Term Field Performance of Warm Mix Asphalt Technologies. National Cooperative Highway Research Program Project 9-49A, TRB, National Research Council, Washington, DC, 2017.

© 2017 by the American Association of State Highway and Transportation Officials. All rights reserved. Duplication is a violation of applicable law. This file has been provided for standard development purposes only; no duplication, redistribution, or sales are permitted.
TS-2d M xxx-12 AASHTO
APPENDIX X.1 – SUMMARY OF MIXTURE PERFORMANCE TEST CRITERIA USED BY STATE HIGHWAY AGENCIES (NON-MANDATORY)
X.1. Rutting Tests
X.1.1. Asphalt Pavement Analyzer (AASHTO T 340)
Table X.1. Summary of Asphalt Pavement Analyzer Criteria used by State DOTs (as of May 1, 2019)
States Binder/Mixture Types Criteria (rut depth at 8000 cycles) Alabama 10 to 30 million ESALs Max. 4.5mm at 67°C Alaska all Max. 3.0mm at 40°C
Arkansas 75 and 115 gyrations Max. 8.0mm at 64°C 160 and 205 gyrations Max. 5.0mm at 64°C
Georgia 19- & 25-mm NMAS Max. 5.0mm at 49°C 9.5- & 12.5-mm NMAS Max. 5.0mm at 64°C
Idaho 75 and 100 gyrations Max. 5.0mm at binder high PG temperature
North Carolina
9.5mm NMAS, < 0.3 million ESALs Max. 11.5mm at binder high PG temperature
9.5mm NMAS, 0.3 to 3 million ESALs Max. 9.5mm at binder high PG temperature
9.5mm NMAS, 3 to 30 million ESALs Max. 6.5mm at binder high PG temperature
9.5mm NMAS, > 30 million ESALs Max. 4.5mm at binder high PG temperature
12.5mm NMAS, 3 to 30 million ESALs Max. 6.5mm at binder high PG temperature
12.5mm NMAS, > 30 million ESALs Max. 4.5mm at binder high PG temperature
New Jersey
High performance thin overlay
Max. 4.0mm at 64°C (mix design) Max. 5.0mm at 64°C (production)
Bituminous rich intermediate course
Max. 6.0mm at 64°C (mix design) Max. 7.0mm at 64°C (production)
Bridge deck waterproof surface course Max. 3.0mm at 64°C
Bituminous rich base course Max. 5.0mm at 64°C High recycled asphalt
pavement mix, PG 64-22 Max. 7.0mm at 64°C
High recycled asphalt pavement mix, PG 76-22 Max. 4.0mm at 64°C
Ohio
Non-polymer mix Max. 5.0mm at 48.9°C Heavy surface & high stress
mix Max. 3.0mm at 54.4°C
Bridge deck waterproofing mix Max. 4.0mm at 64°C
Oregon
80 gyrations, PG 58-xx 80 gyrations, PG 64-xx Max. 6.0mm at 64°C
80 gyrations, PG 70-xx 100 gyrations, PG 64-xx Max. 5.0mm at 64°C
100 gyrations, PG 70-xx 100 gyrations, PG 76-xx Max. 4.0mm at 64°C
PG 76-22 Max. 3.0mm at 64°C

© 2017 by the American Association of State Highway and Transportation Officials. All rights reserved. Duplication is a violation of applicable law. This file has been provided for standard development purposes only; no duplication, redistribution, or sales are permitted.
TS-2d M xxx-13 AASHTO
South Carolina PG 64-22 Max. 5.0mm at 64°C
South Dakota
Truck ADT < 75 Max. 8.0mm at binder high PG temperature Truck ADT 76 to 250 Max. 7.0mm at binder high PG temperature Truck ADT 251 to 650 Max. 6.0mm at binder high PG temperature
Truck ADT > 651 Max. 5.0mm at binder high PG temperature
X.1.2. Hamburg Wheel-Tracking Test (AASHTO T 324)
Table X.2. Summary of Hamburg Wheel-Tracking Test Temperature used by State DOTs (as of May 1, 2019)
States Binder Grades Test Temperatures California all 50°C
Colorado PG 58-xx 45°C PG 64-xx 50°C
PG 70-xx, PG 76-xx 55°C
Iowa PG 58-xx 40°C PG 64-xx (or higher) 50°C
Illinois all 50°C Louisiana all 50°C
Maine all 50°C Massachusetts all 50°C
Montana PG 58-xx 44°C PG 64-xx 50°C PG 70-xx 56°C
Oklahoma all 50°C Texas all 50°C
Utah PG 58-xx 46°C PG 64-xx 50°C PG 70-xx 54°C
Washington all 50°C
Table X.3. Summary of Hamburg Wheel-Tracking Test Criteria used by State DOTs (as of May 1, 2019)
States Binder/Mixture Types Criteria
California
PG 58-xx Min. 10,000 passes at 12.5mm rut depth PG 64-xx Min. 15,000 passes at 12.5mm rut depth PG 70-xx Min. 20,000 passes at 12.5mm rut depth PG 76-xx Min. 25,000 passes at 12.5mm rut depth
Colorado all Max. 4.0mm rut depth at 10,000 passes
Iowa all Max. 8.0mm rut depth at 8,000 passes Min. 10,000 or 14,000 passes with no SIP
Illinois
PG 58-xx (or lower) Max. 12.5mm rut depth at 5,000 passes PG 64-xx Max. 12.5mm rut depth at 7,500 passes PG 70-xx Max. 12.5mm rut depth at 15,000 passes
PG 76-xx (or higher) Max. 12.5mm rut depth at 20,000 passes
Louisiana Level 1 high traffic Max. 6.0mm rut depth at 20,000 passes Level 2 medium/low traffic Max. 10.0mm rut depth at 20,000 passes
Maine all Max. 12.5mm rut depth at 20,000 passes Min. 15,000 passes with no SIP
Massachusetts all Max. 12.5mm rut depth at 20,000 passes Min. 15,000 passes with no SIP
Montana all Max. 13.0mm rut depth at 15,000 passes

© 2017 by the American Association of State Highway and Transportation Officials. All rights reserved. Duplication is a violation of applicable law. This file has been provided for standard development purposes only; no duplication, redistribution, or sales are permitted.
TS-2d M xxx-14 AASHTO
Oklahoma PG 64-xx Min. 10,000 passes at 12.5mm rut depth PG 70-xx Min. 15,000 passes at 12.5mm rut depth PG 76-xx Min. 20,000 passes at 12.5mm rut depth
Texas PG 64-xx Min. 10,000 passes at 12.5mm rut depth PG 70-xx Min. 15,000 passes at 12.5mm rut depth PG 76-xx Min. 20,000 passes at 12.5mm rut depth
Utah Ndesign > 75 Max. 10.0mm rut depth at 20,000 passes
Washington all Max. 10.0mm rut depth at 15,000 passes Min. 15,000 passes with no SIP
X.1.3. Hveem Stability Test
Table X.4. Summary of Hveem Stability Test Criteria used by State DOTs (as of May 1, 2019) States Binder/Mixture Types Minimum Criteria
California*
Type A No. 4 and 3/8" gradings 30 Type A 1/2" and 3/4" gradings 37 Type B No. 4 and 3/8" gradings 30 Type B 1/2" and 3/4" gradings 35
Type RHMA-G 23
Nevada Type 2 35
Type 2C 37 Type 3 30
* Caltrans 2010 Specification
X.2. Cracking Tests
X.2.1. Disc-Shaped Compact Tension Test (ASTM D7313)
Table X.5. Summary of Disc-Shaped Compact Tension Test Criteria used by State DOTs (as of May 1, 2019)
States Mixture Types Min. Fracture Energy Criteria Iowa All 400 J/m2
Minnesota Design traffic: < 3 million ESALs 400 J/m2 Design traffic: 3 to 30 million ESALs 450 J/m2
X.2.2. Indirect Tensile Energy Ratio Test
Table X.6. Summary of Indirect Tensile Energy Ratio Test Criteria recommended by the University of Florida (as of May 1, 2019)
States Traffic ESALs Criteria
None
<250,000 1.0 Min <500,000 1.3 Min
<1000,000 1.95 Min DSCEHMA 0.75 KJ/m3 Min
X.2.3. Overlay Test (Tex-248-F and NJDOT B-10)
Table X.7. Summary of Overlay Test Criteria used by State DOTs (as of May 1, 2019) States Binder/Mixture Types Criteria (cycles to failure)
New Jersey High performance thin overlay Min. 600 cycles
Bituminous rich intermediate course Min. 700 cycles (mix design) Min. 650 cycles (production)

© 2017 by the American Association of State Highway and Transportation Officials. All rights reserved. Duplication is a violation of applicable law. This file has been provided for standard development purposes only; no duplication, redistribution, or sales are permitted.
TS-2d M xxx-15 AASHTO
High recycled asphalt pavement surface mix, PG 64-22 Min. 150 cycles
High recycled asphalt pavement surface mix, PG 76-22 Min. 175 cycles
High cycled asphalt pavement intermediate and base mix, PG 64-22 Min. 100 cycles
High cycled asphalt pavement intermediate and base mix, PG 76-22 Min. 125 cycles
Texas
Porous friction course Min. 200 cycles Stone matrix asphalt Min. 200 cycles
Thin overlay mix Min. 300 cycles Hot in-place recycled mix Min. 150 cycles
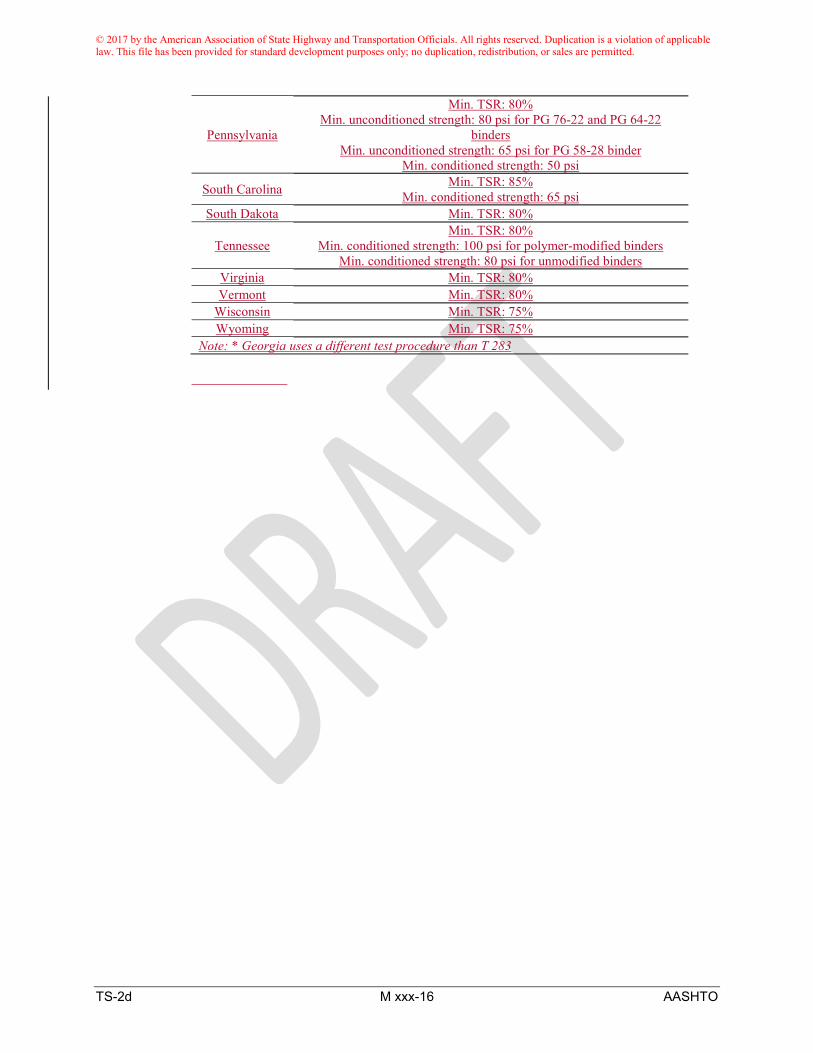
X.3. Moisture Damage Tests
X.3.1. Tensile Strength Ratio (AASHTO T 324)
Table X.8. Summary of Tensile Strength Ratio Criteria used by State DOTs (as of May 1, 2019) States Criteria
Alabama Min. 80% TSR
California Min. conditioned strength: 70 psi Min. unconditioned strength: 100 psi
Colorado Min. TSR: 70% Connecticut Min. TSR: 80%
Florida Min. TSR: 80%
Georgia*
Min. TSR: 80% Min. unconditioned and conditioned strength: 60 psi
Or, Min. TSR: 70% Min. unconditioned and conditioned strength: 100 psi
Illinois Min. TSR: 85% Indiana Min. TSR: 80% Kansas Min. TSR: 80%
Kentucky Min. TSR: 80% Maryland Min. TSR: 85% Michigan Min. TSR: 80%
Minnesota Min. TSR: 80% for contractor Min. TSR: 70% for agency
Missouri Min. TSR: 80% Mississippi Min. TSR: 85%
Montana Min. TSR: 70%
North Carolina Min. TSR: 85% for surface and intermediate mixes Min. TSR: 80% for base mix
Nebraska Min. TSR: 80% New Hampshire Min. TSR: 80%
New Jersey Min. TSR: 80% New Mexico Min. TSR: 85%
Nevada Min. TSR: 70% New York Min. TSR: 80%
Ohio Min. TSR: 80% Oklahoma Min. TSR: 80%
Oregon Min. TSR: 80% for mix design Min. TSR: 70% for production
© 2017 by the American Association of State Highway and Transportation Officials. All rights reserved. Duplication is a violation of applicable law. This file has been provided for standard development purposes only; no duplication, redistribution, or sales are permitted.
TS-2d M xxx-16 AASHTO
Pennsylvania
Min. TSR: 80% Min. unconditioned strength: 80 psi for PG 76-22 and PG 64-22
binders Min. unconditioned strength: 65 psi for PG 58-28 binder
Min. conditioned strength: 50 psi
South Carolina Min. TSR: 85% Min. conditioned strength: 65 psi
South Dakota Min. TSR: 80%
Tennessee Min. TSR: 80%
Min. conditioned strength: 100 psi for polymer-modified binders Min. conditioned strength: 80 psi for unmodified binders
Virginia Min. TSR: 80% Vermont Min. TSR: 80%
Wisconsin Min. TSR: 75% Wyoming Min. TSR: 75%
Note: * Georgia uses a different test procedure than T 283
Agency (Individual Name)
Decision Comments Responses
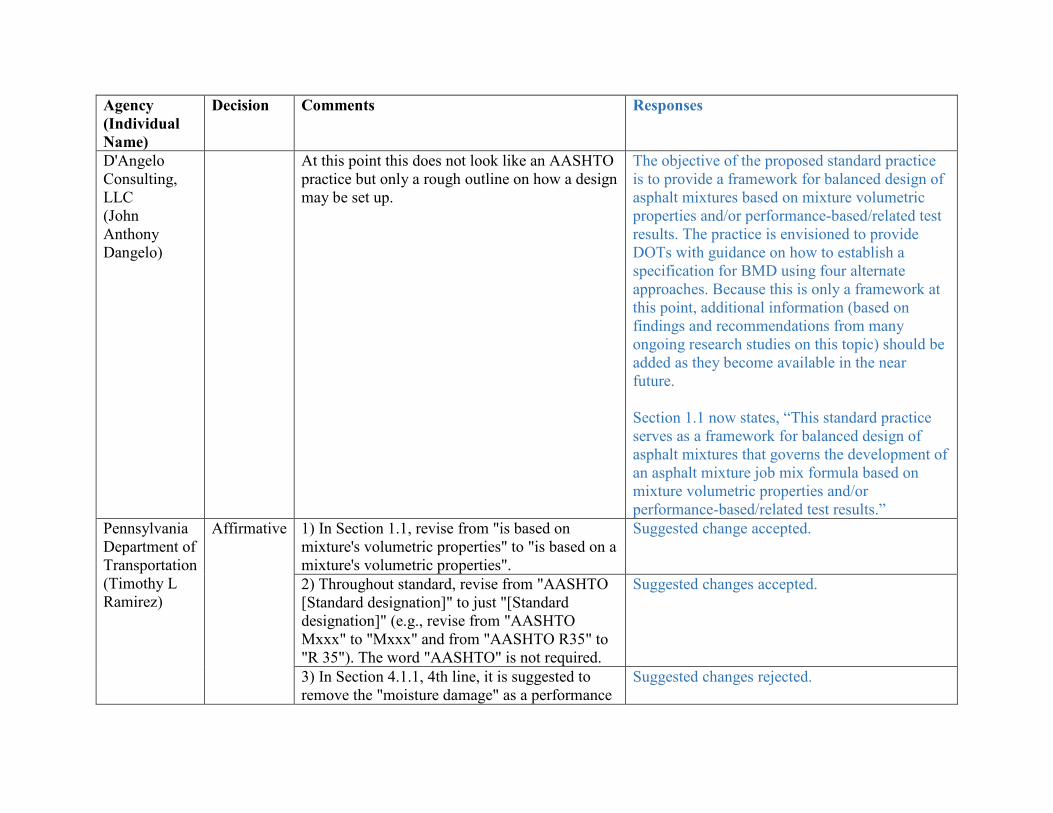
D'Angelo Consulting, LLC (John Anthony Dangelo)
At this point this does not look like an AASHTO practice but only a rough outline on how a design may be set up.
The objective of the proposed standard practice is to provide a framework for balanced design of asphalt mixtures based on mixture volumetric properties and/or performance-based/related test results. The practice is envisioned to provide DOTs with guidance on how to establish a specification for BMD using four alternate approaches. Because this is only a framework at this point, additional information (based on findings and recommendations from many ongoing research studies on this topic) should be added as they become available in the near future. Section 1.1 now states, “This standard practice serves as a framework for balanced design of asphalt mixtures that governs the development of an asphalt mixture job mix formula based on mixture volumetric properties and/or performance-based/related test results.”
Pennsylvania Department of Transportation (Timothy L Ramirez)
Affirmative 1) In Section 1.1, revise from "is based on mixture's volumetric properties" to "is based on a mixture's volumetric properties".
Suggested change accepted.
2) Throughout standard, revise from "AASHTO [Standard designation]" to just "[Standard designation]" (e.g., revise from "AASHTO Mxxx" to "Mxxx" and from "AASHTO R35" to "R 35"). The word "AASHTO" is not required.
Suggested changes accepted.
3) In Section 4.1.1, 4th line, it is suggested to remove the "moisture damage" as a performance
Suggested changes rejected.

test, as R 35 already references moisture susceptibility as a criteria of the basic mix design. R 35 includes T 283 (with conditioning and acceptance criteria) and now includes a reference to T 324 in Note 18. Removing "moisture damage" here can allow removal from existing Sections 6.5 and 6.6 as criteria and methods seem to be the same. This will result in less confusion and allow Approach A to only focus on the rutting and cracking tests.
Following the recommendation of several AASHTO ballot members, the standard practice, when referring to volumetric mix design method, was modified to include both Marshall and Hveem designs in addition to Superpave design. Because Marshall and Hveem designs have no requirement on the evaluation of moisture susceptibility, it is important to require the testing of mixture rutting, cracking, and moisture damage at the optimum binder content for the BMD approach.
4) In Section 4.1.1, 3rd and 4th lines, suggest revising from "preliminary asphalt binder content" to "preliminary optimum asphalt binder content" and then in 6th line, revise from "identified as the optimum" to "identified as the final optimum asphalt binder content". The use of "preliminary asphalt binder content" here is somewhat confusing as there is an "initial trial binder content" referenced in R 35 and additionally as written, it does not relay to the user that R 35 can be used in its entirety except that the optimum asphalt binder content coming out of R 35 is just a preliminary optimum asphalt binder content. Section 7.1 refers to "preliminary optimum asphalt binder content".
Suggested changes accepted.
5) In Section 4.1.3, 2nd line, indicates " to establish a preliminary aggregate structure and binder content", but then in 3rd and 4th lines, it indicates "to adjust either the preliminary binder content or mix component properties or proportions". The "preliminary aggregate structure" does not seem same as "preliminary
Suggested changes accepted. Section 4.1.3 now states, “This approach begins with the current volumetric mix design method (i.e., Superpave, Marshall, or Hveem) to establish initial component material properties, proportions, and binder content.”

mix component properties or proportions". In 2nd line, perhaps revise from "to establish a preliminary aggregate structure and binder content" to "establish preliminary component material properties, proportions, and binder content" for better clarity. 6) In Section 6.1.1, suggest revising completely to read "Design asphalt mixture in accordance with R 35". There does not seem to be a need to limit this to R 35, Sections 6 to 10 only.
Suggested change accepted. Section 6.1 now states, “Design asphalt mixture in accordance with R 35 or the current volumetric mix design method specified by the state highway agency, or use an existing approved mix design.”
7) Suggest deleting existing Sections 6.5 and 6.6 as the moisture susceptibility performance tests are already referenced and included in the existing R 35 volumetric mix design procedure.
Suggested change rejected. Please see responses to comment #3.
8) In Section 7.1, revise from "in accordance to R 35, Section 6 to Section 10" to "in accordance with R 35". There does not seem to be a need to limit this to R 35, Sections 6 to 10 only.
Suggested change accepted. Section 7.1 now states, “Select a preliminary optimum asphalt binder content and volumetric properties in accordance to R 35 or the current volumetric mix design specified by the state highway agency, or use an existing approved mix design.”
9) In Section 7.3, consider revising from "at intervals of 0.25 to 0.5%" to "at intervals of +/- 0.25 to +/- 0.5%" due to later text in that indicates to "bracket the preliminary optimum binder content".
Suggested change accepted. Section 7.3 now states, “Conduct the rutting and cracking tests at the preliminary optimum binder content determined in Section 7.1 and two or more additional binder contents at intervals of +/- 0.3% to +/- 0.5% that bracket the preliminary optimum binder content.”
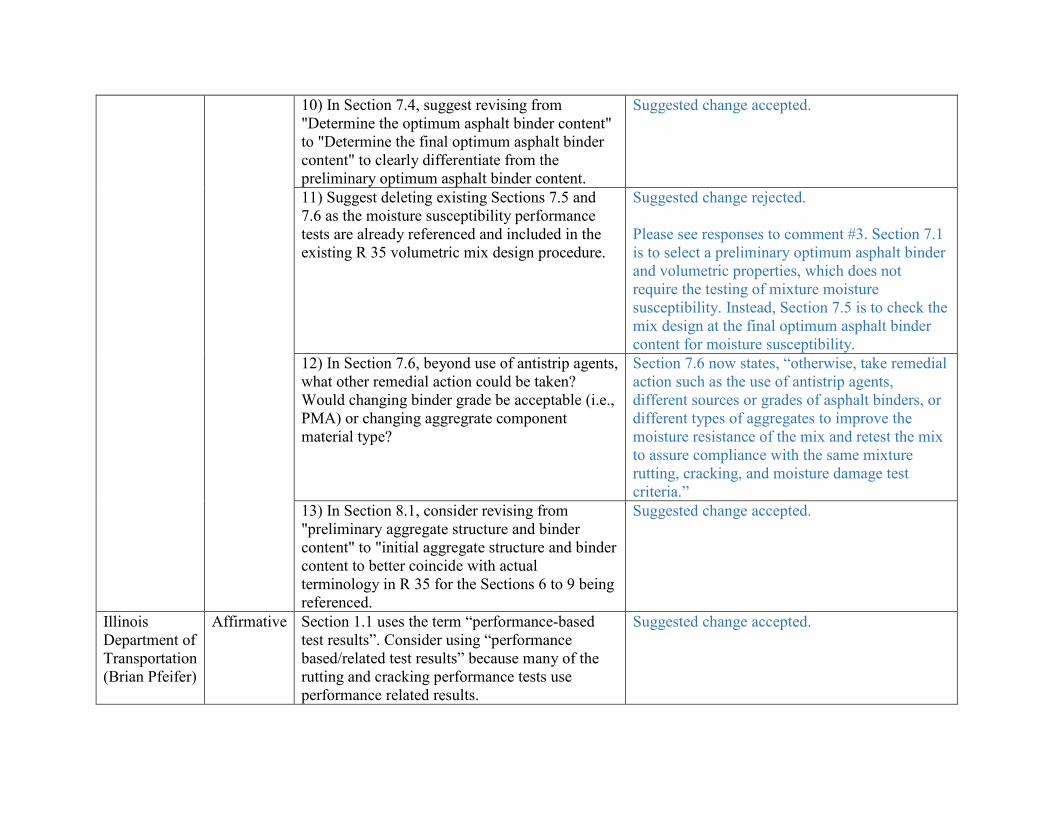
10) In Section 7.4, suggest revising from "Determine the optimum asphalt binder content" to "Determine the final optimum asphalt binder content" to clearly differentiate from the preliminary optimum asphalt binder content.
Suggested change accepted.
11) Suggest deleting existing Sections 7.5 and 7.6 as the moisture susceptibility performance tests are already referenced and included in the existing R 35 volumetric mix design procedure.
Suggested change rejected. Please see responses to comment #3. Section 7.1 is to select a preliminary optimum asphalt binder and volumetric properties, which does not require the testing of mixture moisture susceptibility. Instead, Section 7.5 is to check the mix design at the final optimum asphalt binder content for moisture susceptibility.
12) In Section 7.6, beyond use of antistrip agents, what other remedial action could be taken? Would changing binder grade be acceptable (i.e., PMA) or changing aggregrate component material type?
Section 7.6 now states, “otherwise, take remedial action such as the use of antistrip agents, different sources or grades of asphalt binders, or different types of aggregates to improve the moisture resistance of the mix and retest the mix to assure compliance with the same mixture rutting, cracking, and moisture damage test criteria.”
13) In Section 8.1, consider revising from "preliminary aggregate structure and binder content" to "initial aggregate structure and binder content to better coincide with actual terminology in R 35 for the Sections 6 to 9 being referenced.
Suggested change accepted.
Illinois Department of Transportation (Brian Pfeifer)
Affirmative Section 1.1 uses the term “performance-based test results”. Consider using “performance based/related test results” because many of the rutting and cracking performance tests use performance related results.
Suggested change accepted.

The term “effective binder content” is used in Section 3.4. Consider adding a definition of effective binder content in Section 3.5.
Section 3.4 – effective binder content (Pbe) added.
The final sentence of Section 4.1.1 states “or mix proportions until all of the performance criteria are satisfied”. Consider modifying this phrase to “or mix proportions until all of the volumetric and performance criteria are satisfied”.
Suggested change accepted.
Section 6.3 states that the mix design should be checked for rutting and cracking resistance. Consider changing the word “check” to “evaluate”.
Suggested change accepted.
The third line of Section 6.6 uses the phrase “moisture susceptibility”. It may be more appropriate to use the phrase “moisture resistance” in reference to improving properties. This modification is suggested in Sections 7.6, 8.6, and 9.8.
Suggested changes accepted.
Section 7.3 states that two or more additional contents at intervals of 0.25 to 0.5% should be used. Consider adding the word “binder” between the words “additional” and “contents”.
Suggested change accepted.
Section 9.1 references using LTPPBind software to determine the asphalt binder grade. Why is this only suggested for Approach D?
The other three approaches are primarily based on the performance verification or optimization of an existing volumetric mix design. In such cases, the asphalt binder grade should have already been determined. However, Approach D – Performance Design does not require volumetric mix design; instead, it is envisioned to establish and adjust mixture components and proportions entirely based on performance-based/related test results. Therefore, guidance is
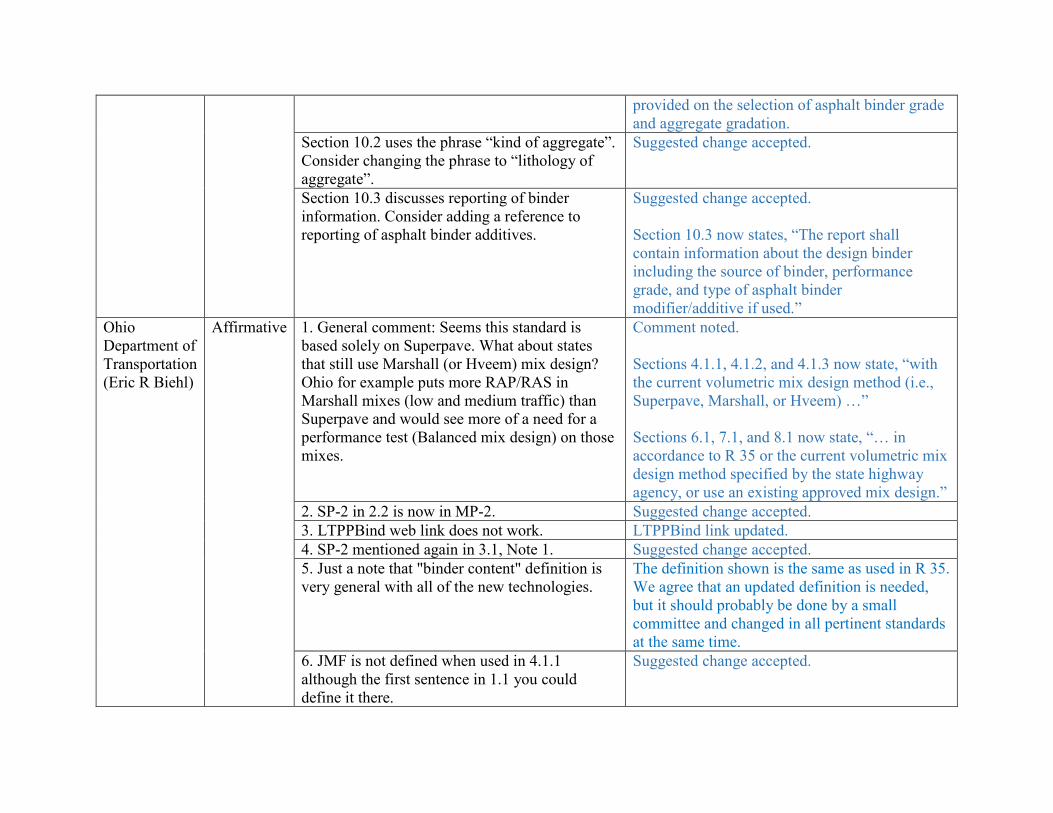
provided on the selection of asphalt binder grade and aggregate gradation.
Section 10.2 uses the phrase “kind of aggregate”. Consider changing the phrase to “lithology of aggregate”.
Suggested change accepted.
Section 10.3 discusses reporting of binder information. Consider adding a reference to reporting of asphalt binder additives.
Suggested change accepted. Section 10.3 now states, “The report shall contain information about the design binder including the source of binder, performance grade, and type of asphalt binder modifier/additive if used.”
Ohio Department of Transportation (Eric R Biehl)
Affirmative 1. General comment: Seems this standard is based solely on Superpave. What about states that still use Marshall (or Hveem) mix design? Ohio for example puts more RAP/RAS in Marshall mixes (low and medium traffic) than Superpave and would see more of a need for a performance test (Balanced mix design) on those mixes.
Comment noted. Sections 4.1.1, 4.1.2, and 4.1.3 now state, “with the current volumetric mix design method (i.e., Superpave, Marshall, or Hveem) …” Sections 6.1, 7.1, and 8.1 now state, “… in accordance to R 35 or the current volumetric mix design method specified by the state highway agency, or use an existing approved mix design.”
2. SP-2 in 2.2 is now in MP-2. Suggested change accepted. 3. LTPPBind web link does not work. LTPPBind link updated. 4. SP-2 mentioned again in 3.1, Note 1. Suggested change accepted. 5. Just a note that "binder content" definition is very general with all of the new technologies.
The definition shown is the same as used in R 35. We agree that an updated definition is needed, but it should probably be done by a small committee and changed in all pertinent standards at the same time.
6. JMF is not defined when used in 4.1.1 although the first sentence in 1.1 you could define it there.
Suggested change accepted.
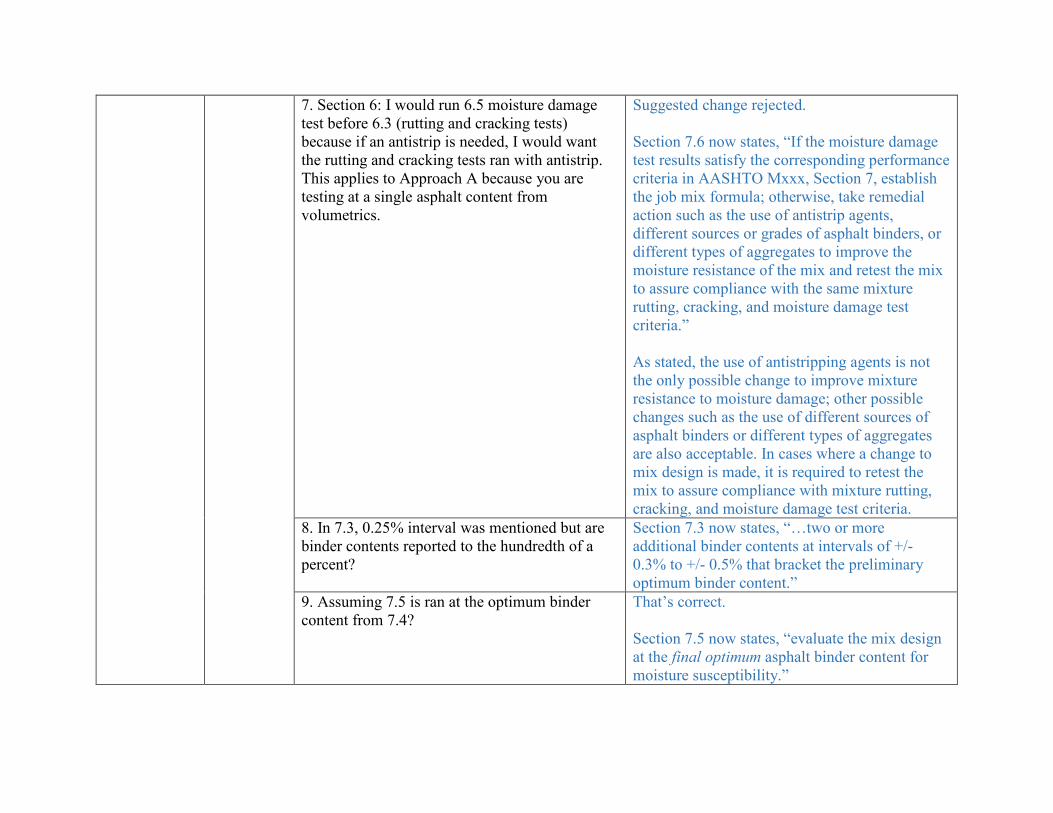
7. Section 6: I would run 6.5 moisture damage test before 6.3 (rutting and cracking tests) because if an antistrip is needed, I would want the rutting and cracking tests ran with antistrip. This applies to Approach A because you are testing at a single asphalt content from volumetrics.
Suggested change rejected. Section 7.6 now states, “If the moisture damage test results satisfy the corresponding performance criteria in AASHTO Mxxx, Section 7, establish the job mix formula; otherwise, take remedial action such as the use of antistrip agents, different sources or grades of asphalt binders, or different types of aggregates to improve the moisture resistance of the mix and retest the mix to assure compliance with the same mixture rutting, cracking, and moisture damage test criteria.” As stated, the use of antistripping agents is not the only possible change to improve mixture resistance to moisture damage; other possible changes such as the use of different sources of asphalt binders or different types of aggregates are also acceptable. In cases where a change to mix design is made, it is required to retest the mix to assure compliance with mixture rutting, cracking, and moisture damage test criteria.
8. In 7.3, 0.25% interval was mentioned but are binder contents reported to the hundredth of a percent?
Section 7.3 now states, “…two or more additional binder contents at intervals of +/- 0.3% to +/- 0.5% that bracket the preliminary optimum binder content.”
9. Assuming 7.5 is ran at the optimum binder content from 7.4?
That’s correct. Section 7.5 now states, “evaluate the mix design at the final optimum asphalt binder content for moisture susceptibility.”

10. Section 10.1 should include mix type. Mix design number may not be available to the mix designer until approved by the highway agency.
Suggested change accepted. Section 10.1 now states, “The report shall include the identification of the project number, traffic level, mix type, and mix design number if available.”
Wisconsin Department of Transportation (Barry C Paye)
Affirmative Both the R and the M seem similar. Do we need both? Do we need a practice and a specification?
The R-designation practice and M-designation specification were put together following the current AASHTO format requirements for Superpave volumetric design – R35 as standard practice and M323 as standard specification. The R-designation practice is to provide an overview of four alternate BMD approaches and provide a list of key steps required to complete the design for each approach, while the M-designation specification is to provide detailed information on the selection of mixture performance tests and criteria for use in establishing a BMD job mix formula.
Ontario Ministry of Transportation (Becca Lane)
Affirmative Section 4.1.4- Recommend changing 'maybe' to 'may be'.
Suggested change accepted.
Unclear which performance criteria need to be met after the use of anti-stripping in sections 6.6,7.6,8.6&9.8
Sections 6.6, 7.6, 8.6, and 9.8 now state, “retest the mix to assure compliance with the same mixture rutting, cracking, and moisture damage test criteria.”
Vermont Agency of Transportation (Aaron Schwartz)
Negative Refer to comments for simultaneous negative vote (Item #2) on the draft AASHTO Standard Specification (AASHTO Mxxx BMD).
Please see responses to the comment to the draft AASHTO Standard Specification.
Tennessee Department of Transportation
Negative We agree with the Approach but the standard is written around M 323 and it appears that many states do not follow M323 and have a "modified"
Suggested changes accepted.
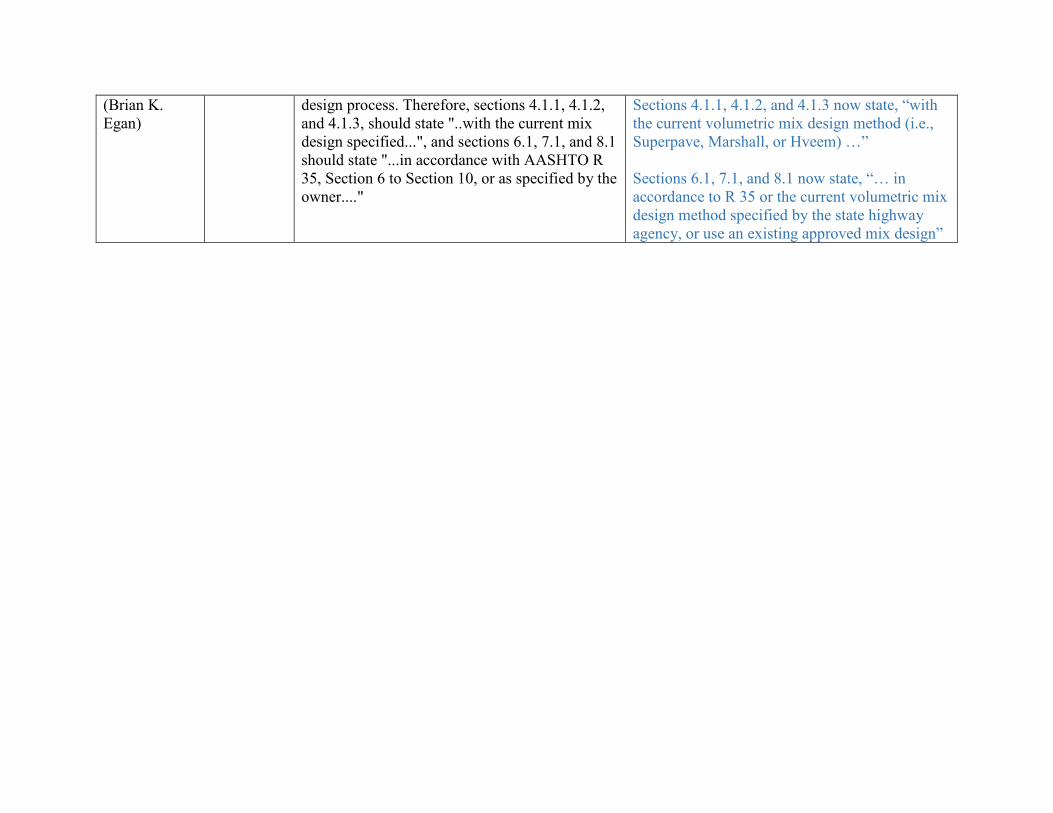
(Brian K. Egan)
design process. Therefore, sections 4.1.1, 4.1.2, and 4.1.3, should state "..with the current mix design specified...", and sections 6.1, 7.1, and 8.1 should state "...in accordance with AASHTO R 35, Section 6 to Section 10, or as specified by the owner...."
Sections 4.1.1, 4.1.2, and 4.1.3 now state, “with the current volumetric mix design method (i.e., Superpave, Marshall, or Hveem) …” Sections 6.1, 7.1, and 8.1 now state, “… in accordance to R 35 or the current volumetric mix design method specified by the state highway agency, or use an existing approved mix design”

© 2017 by the American Association of State Highway and Transportation Officials. All rights reserved. Duplication is a violation of applicable law. This file has been provided for standard development purposes only; no duplication, redistribution, or sales are permitted.
TS-2d R xxx-0 AASHTO
Standard Practice for
Balanced Design of Asphalt Mixtures
AASHTO Designation: R xx-xx
Technical Section: 2d, Proportioning of Asphalt–Aggregate Mixtures
American Association of State Highway and Transportation Officials 444 North Capitol Street N.W., Suite 249 Washington, D.C. 20001

© 2017 by the American Association of State Highway and Transportation Officials. All rights reserved. Duplication is a violation of applicable law. This file has been provided for standard development purposes only; no duplication, redistribution, or sales are permitted.
TS-2d R xxx-1 AASHTO
Standard Practice for
Balanced Design of Asphalt Mixtures
AASHTO Designation: R xx-xx Technical Section: 2d, Proportioning of Asphalt–Aggregate Mixtures
1. SCOPE
1.1. This standard practice serves as a framework for balanced design of asphalt mixtures that governs the development of for mix design uses mixture properties to develop an asphalt mixture job mix formula. The mix design is based on mixture's volumetric properties and/or performance-based/related test results.
1.2. This standard practice may also be used to provide a preliminary selection of mix parameters as a starting point for performance prediction analyses.
1.3. This standard practice may involve hazardous materials, operations, and equipment. This standard practice does not purport to address all of the safety concerns, if any, associated with its use. It is the responsibility of the user of this procedure to establish appropriate safety and health practices and determine the applicability of regulatory limitations prior to use.
2. REFERENCED DOCUMENTS
2.1. AASHTO Standards: M 323, Superpave Volumetric Mix Design M XXX, Standard Specification for Balanced Mix Design R 35, Standard Practice for Superpave Volumetric Design for Asphalt Mixtures
2.2. Asphalt Institute StandardPublication: MSP-2, AsphaltSuperpave Mix Design Methods
2.3. Other References: LTPP Seasonal Asphalt Concrete Pavement Temperature Models, LTPP Bind 3.1 software,
https://infopave.fhwa.dot.gov/Page/Index/LTPP_BINDhttp://www.ltppbind.com
3. TERMINOLOGY
3.1. air voids (Va)—the total volume of the small pockets of air between the coated aggregate particles throughout a compacted paving mixture, expressed as a percent of the bulk volume of the compacted paving mixture (Note 1).

© 2017 by the American Association of State Highway and Transportation Officials. All rights reserved. Duplication is a violation of applicable law. This file has been provided for standard development purposes only; no duplication, redistribution, or sales are permitted.
TS-2d R xxx-2 AASHTO
Note 1—Term defined in Asphalt Institute Manual Publication MSP-2, Superpave Asphalt Mix Design Methods.
3.2. balanced mix design (BMD)—asphalt mix design using performance tests on appropriately conditioned specimens that address multiple modes of distress taking into consideration mix aging, traffic, climate and location within the pavement structure (Note 2). Note 2—Term defined by the FHWA Expert Task Group on Mixtures and Construction in 2015.
3.3. binder content (Pb)—the percent by mass of binder in the total mixture, including binder and aggregate.
3.4. effective binder content (Pbe)—the percent by mass of binder in the total mixture that is not absorbed into the aggregate.
3.4.3.5. voids in the mineral aggregate (VMA)—the volume of the intergranular void space between the aggregate particles of a compacted paving mixture that includes the air voids and the effective binder content, expressed as a percent of the total volume of the specimen (Note 1).
4. SUMMARY OF THE PRACTICE
4.1. Optimal Balanced Mix Design Approaches
4.1.1. Approach A - Volumetric Design with Performance Verification. This approach starts with the current volumetric Superpave mix design method (i.e., Superpave, Marshall, or Hveem) for determining an optimum asphalt binder content. The mixture is then tested with selected performance tests to assess its resistance to rutting, cracking, and moisture damage at the optimum binder content. If the mix design meets the performance test criteria, the JMF job mix formula is established and production begins; otherwise, the entire mix design process is repeated using different materials (e.g., aggregates, asphalt binders, recycled materials, and additives) or mix proportions until all of the volumetric and performance criteria are satisfied.
4.1.2. Approach B - Volumetric Design with Performance Optimization. This approach is an expanded version of Approach A. It also starts with the current Superpave volumetric mix design method (i.e., Superpave, Marshall, or Hveem) for determining a preliminary optimum asphalt binder content. Mixture performance tests are then conducted on the mix design at the preliminary optimum asphalt binder content and two or more additional contents. The asphalt binder content that satisfies all of the cracking, rutting, and moisture damage criteria is finally identified as the final optimum asphalt binder contentoptimum. In cases where a single binder content does not exist, the entire mix design process needs to be repeated using different materials (e.g., aggregates, asphalt binders, recycled materials, and additives) or mix proportions until all of the performance criteria are satisfied.
4.1.3. Approach C - Performance-Modified Volumetric Mix Design. This approach begins with the Superpave current volumetric mix design method (i.e., Superpave, Marshall, or Hveem) to establish a initialpreliminary component material properties, proportions, aggregate structure and binder content. The performance test results are then used to adjust either the preliminaryinitial binder content or mix component properties or proportions (e.g., aggregates, asphalt binders, recycled materials, and additives) until the performance criteria are satisfied. For this approach, the final design is primarily focused on meeting performance test criteria and may not be required to meet all of the Superpave volumetric criteria.
4.1.4. Approach D - Performance Design. This approach establishes and adjusts mixture components and proportions based on performance analysis with limited or no requirements for volumetric properties. Minimum requirements may be set for asphalt binder and aggregate properties. Once

© 2017 by the American Association of State Highway and Transportation Officials. All rights reserved. Duplication is a violation of applicable law. This file has been provided for standard development purposes only; no duplication, redistribution, or sales are permitted.
TS-2d R xxx-3 AASHTO
the laboratory test results meet the performance criteria, the mixture volumetrics may be checked for use in production.
5. SIGNIFICANCE AND USE
5.1. The procedure described in this standard practice is used to produce asphalt mixtures that satisfy balanced mix design requirements.
_____________________________________________________________________________
APPROACH A
6. VOLUMETRIC DESIGN WITH PERFORMANCE VERIFICATION
6.1. Design asphalt mixture in accordance with Select the optimum asphalt binder content and volumetric properties in accordance to AASHTO R 35 or the current volumetric mix design method specified by the state highway agency, Section 6 to Section 10, or use an existing approved mix design.
6.2. Select one rutting test and one cracking test from AASHTO Mxxx, Section 5 and Section 6, respectively.
6.3. Check Evaluate the mix design at the optimum binder content for rutting and cracking resistance.
6.4. If the rutting and cracking test results satisfy the corresponding performance criteria in AASHTO Mxxx, Section 5 and Section 6, proceed to Section 6.5; otherwise, return to Section 6.1 and repeat the mix design process using different materials (e.g., aggregates, asphalt binders, recycled materials, and additives) or mix proportions.
6.5. Select one moisture damage test from AASHTO Mxxx, Section 7, and evaluate the mix design for moisture susceptibility.
6.6. If the moisture damage test results satisfy the corresponding performance criteria in AASHTO Mxxx, Section 7, establish the job mix formula; otherwise, take remedial action such as the use of antistrip agents, different sources or grades of asphalt binders, or different types of aggregates to improve the moisture susceptibility resistance of the mix and retest the mix to assure compliance with the same mixture rutting, cracking, and moisture damage testperformance criteria.
_____________________________________________________________________________________
APPROACH B
7. VOLUMETRIC DESIGN WITH PERFORMANCE OPTIMIZATION
7.1. Select a preliminary optimum asphalt binder content and volumetric properties in accordance to AASHTO R 35, Section 6 to Section 10, or the current volumetric mix design method specified by the state highway agency, or use an existing approved mix design.
7.2. Select one rutting test and one cracking test from AASHTO Mxxx, Section 5 and Section 6, respectively.
7.3. Conduct the rutting and cracking tests at the preliminary optimum binder content determined in Section 7.1 and two or more additional binder contents at intervals of +/- 0.253% to +/- 0.56% that bracket the preliminary optimum binder content.

© 2017 by the American Association of State Highway and Transportation Officials. All rights reserved. Duplication is a violation of applicable law. This file has been provided for standard development purposes only; no duplication, redistribution, or sales are permitted.
TS-2d R xxx-4 AASHTO
7.4. Determine the final optimum asphalt binder content that satisfies both the rutting and cracking criteria in AASHTO Mxxx, Section 5 and Section 6. In cases where a single binder content does not satisfy all criteria, return to Section 7.1 and repeat the mix design process using different materials (e.g., aggregates, asphalt binders, recycled materials, and additives) or mix proportions.
7.5. Select one moisture damage test from AASHTO Mxxx, Section 7, and evaluate the mix design at the final optimum asphalt binder content for moisture susceptibility.
7.6. If the moisture damage test results satisfy the corresponding performance criteria in AASHTO Mxxx, Section 7, establish the job mix formula; otherwise, take remedial action such as the use of antistrip agents, different sources or grades of asphalt binders, or different types of aggregates to improve the moisture susceptibility resistance of the mix and retest the mix to assure compliance with the same mixture rutting, cracking, and moisture damage test performance criteria.
_____________________________________________________________________________________
APPROACH C
8. PERFORMANCE-MODIFIED VOLUMETRIC MIX DESIGN
8.1. Determine an initialpreliminary aggregate structure and binder content in accordance to AASHTO R 35, Section 6 to Section 9 or the current volumetric mix design method specified by the state highway agency, or use an existing approved mix design.
8.1. .
8.2. Select one rutting test and one cracking test from AASHTO Mxxx, Section 5 and Section 6, respectively.
8.3. Check Evaluate the mix design at the preliminaryinitial aggregate structure and binder content for rutting and cracking resistance.
8.4. If the mix design satisfies the performance criteria in AASHTO Mxxx, Section 5 and Section 6, proceed to Section 8.5; otherwise, adjust the preliminaryinitial binder content or use different mix component properties or proportions (e.g., aggregates, asphalt binders, recycled materials, and additives) and then repeat Section 8.3 until the performance criteria are satisfied.
8.5. Select one moisture damage test from AASHTO Mxxx, Section 7, and evaluate the mix design for moisture susceptibility.
8.6. If the moisture damage test results satisfy the corresponding performance criteria in AASHTO Mxxx, Section 7, proceed to Section 8.7; otherwise, take remedial action such as the use of antistrip agents, different sources or grades of asphalt binders, or different types of aggregates to improve the moisture susceptibility resistance of the mix and retest the mix to assure compliance with the same mixture rutting, cracking, and moisture damage test performance criteria.
8.7. Check and report the volumetric properties of the mix design at the optimum binder content (Note 3). Note 3—highway agencies should decide which existing volumetric criteria could be relaxed or eliminated without sacrificing mixture performance.
_____________________________________________________________________________________
APPROACH D

© 2017 by the American Association of State Highway and Transportation Officials. All rights reserved. Duplication is a violation of applicable law. This file has been provided for standard development purposes only; no duplication, redistribution, or sales are permitted.
TS-2d R xxx-5 AASHTO
9. PERFORMANCE DESIGN
9.1. Consider using LTPP Bind software to select the appropriate asphalt binder grade for the mixture.
9.2. Consider using an aggregate gradation conforming to Table 4 in AASHTO M 323.
9.3. Select three or more design binder contents at intervals of 0.325 to 0.5%.
9.4. Select one rutting test and one cracking test from AASHTO Mxxx, Section 5 and Section 6, respectively.
9.5. Conduct the rutting and cracking tests at the selected aggregate structure and binder contents.
9.6. Determine the optimum asphalt binder content that satisfies both the rutting and cracking criteria in AASHTO Mxxx, Section 5 and Section 6. In cases where a single binder content does not satisfy all criteria, repeat Section 9.5 using different mix component properties or proportions (e.g., aggregates, asphalt binders, recycled materials, and additives).
9.7. Select one moisture damage test from AASHTO Mxxx, Section 7, and evaluate the mix design for moisture susceptibility.
9.8. If the moisture damage test results satisfy the corresponding performance criteria in AASHTO Mxxx, Section 7, proceed to Section 9.9; otherwise, take remedial action such as the use of antistrip agents, different sources or grades of asphalt binders, or different types of aggregates to improve the moisture susceptibility resistance of the mix and retest the mix to assure compliance with the same mixture rutting, cracking, and moisture damage test performance criteria.
9.9. Check and report the volumetric properties of the mix design at the optimum binder content (Note 3).
10. REPORT
10.1. The report shall include the identification of the project number, traffic level, and mix type, and mix design number if available.
10.2. The report shall include information on the design aggregate structure including the source of aggregate, kind lithology of aggregate, required quality characteristics, and gradation.
10.3. The report shall contain information about the design binder including the source of binder, and the performance grade, and type of asphalt binder modifier/additive if used.
10.4. The report shall contain information about the design asphalt mixture including selected laboratory performance tests, optimum asphalt binder content, volumetric properties with specifications, and performance test results and criteria.
11. KEYWORDS
11.1. Asphalt mix design; Superpave; volumetric mix design; balanced mix design; performance testing.

Reponses to Comments Regarding Draft Standard “Moisture Sensitivity Using Hydrostatic Pore Pressure to Determine Cohesion and Adhesion Strength of Compacted Asphalt Mixture Specimens” (Ballot Start Date: 01/18/2019)
Pennsylvania Department of Transportation
1) Comment: In Section 2.2 and Section 8.3, delete "D6857" since "T 331" and "T 209" are already included in Section 2.1. There is no need to reference ASTM D6857 since there are AASHTO standards that can be referenced and are likely more acceptable by state agencies.
Response: For clarification, D6857 is for vacuum sealing to measure Gmm, not Gmb. Because no AASHTO standard currently allows vacuum sealing to measure Gmm, we removed the reference to D6857.
2) Comment: In Section 8.5, last line, include reference to a specific Section of T 283 here as the "testing" being referenced here is only the tensile strength and tensile strength ratio testing in T 283 and not the conditioning Sections in T 283.
Response: Added reference to T 283 Section 11.
3) Comment: In Section 10.1.1, why have this statement if there is statement at end of previous Section 10.1 to dry the sample to constant weight according to R 79? Also, suggest deleting Section 10.1.2 as this is not needed if following Section T 166 or T 331 as specified in Section 10.1.
Response: We modified Section 10 by creating conditional statements in the subsections for measuring Gmb with T 166 or T 331 (see below).
10.1. Measure the bulk specific gravity (Gmb_final) of the specimen after conditioning according to T 166 or T 331.
10.1.1. If using T 166, use the same dry weight as the one used to determine the initial bulk specific gravity in Section 8.3.
10.1.2. If using T 331, dry the sample to constant weight according to R79 before vacuum sealing specimen.
10.2. Measure the tensile strength of both the dry and wet subsets of specimens in accordance with T 283 Section 11.
Kansas Department of Transportation
1) Comment: Check title of AASHTO T 166.
Response: All titles have been review and updated.
Illinois Department of Transportation
1) Comment: It is suggested to add a Section 2.3 to reference academic research to identify adhesive vs. cohesive strength.
Response: A section of references (Section 15) has been added with the following references.
Hicks, R. G., L. Santucci, and T. Ashchenbrener. Introduction and Seminar Objectives on Moisture Sensitivity of Asphalt Pavements. Transportation Research Board National Seminar, National Research Council, San Diego, California, 2003, pp. 3-19. Causes of moisture damage. LaCroix, A. T., A. Regimand, and L. James. Proposed Approach for Evaluation of Cohesive and Adhesive Properties of Asphalt Mixtures for Determination of Moisture Sensitivity. In Transportation Research Record 2575, TRB, National Research Council, Washington, DC, 2016, pp. 61-69. Results showing the benefits of this standard test method. Little D. N., and D. R. Jones, IV. Chemical and Mechanical Processes of Moisture Damage in Hot-Mix Asphalt Pavements. Transportation Research Board National Seminar, National Research Council, San Diego, California, 20 15.4. Discussion of adhesive and cohesive moisture damage. Schram, S. and R. C. William. Ranking of HMA Moisture Sensitivity Tests in Iowa. FHWA SP&R Project #PB10-012 Report, August 2012.03, pp. 37-74. Results show high positive correlation between the percentage change of the bulk specific gravity (swell) and moisture sensitive mixtures. 2) Comment: Section 5: recommend providing a modified Figure 1 with dimensions and tolerances.
Response: The device in Figure 1 is a generic schematic of the required device. The only dimensions required in the draft standard are the specimen dimensions, which are specified in Sections 6.2 and 7.2. Therefore, dimensions are not listed to allow for different manufacturer designs.
3) Comment Section 5.6 details the use of thermometers. It may be appropriate to add a reference to a thermometer standard.
Response: A note has been added after Section 5.8 that states “See E1 for selecting a liquid-in-glass thermometer or E2877 for selecting a digital contact thermometer.”
4) Comment: Section 5 does not provide any details regarding the tensile strength testing system. Consider adding a reference to the T 283 tensile strength testing equipment.
Response: Sections 5.9 and 5.10 have been added. They state:
5.9. Load frame equipment described in T 283 Section 5.10 capable of accurately applying a vertical deformation, including 50 mm/min (2 in./min).
5.10. Steel loading strips with a concave surface having a radius of curvature equal to the nominal radius of the test specimen as described in T 283 Section 5.11.
5) Comment: Section 6.3: suggest adding a reference to R 30.
Response: Reference added.
6) Comment: Section 11.2 states “calculate the tensile (IDT) strength ratio”. Consider modifying this statement to “calculate the tensile strength ratio (TSR)”.
Response: Language was standardized to “tensile strength” and “tensile strength ratio (TSR)” throughout standard.
Colorado Department of Transportation
1) Comment: Section 9.1. This section indicates that all WMA mixtures use a conditioning temperature of 50 degrees C (122 degrees F). Do we want a WMA utilizing PG 76-28 to be conditioned at the same temp as a PG 58-28?
Response:
Table 1 has been added that includes conditioning temperature requirements based on the required high PG of the mixture.
Table 1 ̶ Moisture Conditioning Temperature Requirements
High PG Grade of Asphalt Mixture a Conditioning Temperature PG grade ≥ PG 64 60°C [140°F] PG grade ≤ PG 58 45°C [113°F]
a See Table 1 in PP78 for guidance for estimating the high PG for asphalt mixtures with reclaimed asphalt pavement (RAP), reclaimed asphalt shingles (RAS), or both that may increase the stiffness of the asphalt binder and thereby the asphalt mixture.
Wisconsin Department of Transportation
1) Comment: - Add a temperature tolerance of +/-1 C for the top to bottom of the conditioning chamber.
Response: Given the size of the sample chamber and mass of the samples, it is difficult to maintain ± 1 C at all times. Although the chamber will maintain ± 1 C variation during most of the conditioning period, we suggest and have added a tolerance of ± 2C in Section 5.4.3. This is a very reasonable range and will not affect the performance and results of the test.
2) Comment: The test temperatures are too high. 50C for at PG 52 or 58 is too close to the softening point, leading to mixture flow. This similar to the problem of running a wheel tracker at 50C with northern asphalt mixes. WisDOT is running it at a lower temperature as a state procedure, but it would be nice if we didn't have to do it as an exception (we aren't the only northern state.).
Response: Table 1 has been modified to account for this. Please see response above to Colorado DOT, comment #1.
1
Standard Method of Test for
Moisture Sensitivity Using Hydrostatic Pore Pressure to Determine Cohesion and Adhesion Strength of Compacted Asphalt Mixture Specimens
AASHTO Designation: TP xxx-yy1 Release: Group n (Month yyyy)
American Association of State Highway and Transportation Officials 444 North Capitol Street N.W., Suite 249 Washington, D.C. 20001
2
Standard Method of Test for
Moisture Sensitivity Using Hydrostatic Pore Pressure to Determine Cohesion and Adhesion Strength of Compacted Asphalt Mixture Specimens
AASHTO Designation: TP xxx-yy Release: Group n (Month yyyy)
1. SCOPE
1.1. This test method includes procedures for preparing compacted asphalt mixture specimens, exposing the specimens to prolonged exposure to moisture and hydrostatic pore pressure inside an enclosed chamber and testing the effect of water on the tensile strength and swell of the specimens.
1.2. Units—The values stated in either SI units or U.S. Customary units are to be regarded separately as standard. The values stated in each system may not be exact equivalents; therefore, each system shall be used independently of the other. Combining values from the two systems may result in non-conformance with the standard.
1.3. This standard may involve hazardous materials, operations, and equipment. It does not purport to address all of the safety concerns associated with its use. It is the responsibility of the user of this standard to establish appropriate safety and health practices and determine the applicability of regulatory limitations prior to use.
2. REFERENCED DOCUMENTS
2.1. AASHTO Standards: M 231, Weighing Devices Used in the Testing of Materials PP 78, Design Considerations When Using Reclaimed Asphalt Singles (RAS) in Asphalt Mixtures R 30, Mixture Conditioning of Hot Mix Asphalt (HMA) R 47, Reducing Samples of Hot Mix Asphalt (HMA) to Testing Size R 68, Preparation of Asphalt Mixtures by Means of the Marshall Apparatus R 79, Vacuum Drying Compacted Asphalt Specimens T 166, Bulk Specific Gravity (Gmb) of Compacted Hot Mix Asphalt (HMA) Using Saturated-Dry
Specimens T 168, (D979) Sampling Bituminous Paving Mixtures T 209, Theoretical Maximum Specific Gravity (Gmm) and Density of Hot Mix Asphalt (HMA) T 247, Preparation of Test Specimens of Hot Mix Asphalt (HMA) by Means of California Kneading
Compactor T 269, Percent Air Voids in Compacted Dense and Open Asphalt Mixtures T 283, Resistance of Compacted Asphalt Mixtures to Moisture-Induced Damage T 312, Preparing and Determining the Density of Asphalt Mixture Specimens by Means of the
Superpave Gyratory Compactor

3
T 331, Bulk Specific Gravity (Gmb) and Density of Compacted Hot Mix Asphalt (HMA) Using Automatic Vacuum Sealing Method
2.2. ASTM Standards: D3549 Thickness or Height of Compacted Asphalt Mixture Specimens D4867 Effect of Moisture on Asphalt Concrete Paving Mixtures E1 Specification for ASTM Liquid-in-Glass Thermometers E2877 Guide for Digital Contact Thermometers
3. SUMMARY OF TEST METHOD
3.1. Asphalt mixture specimens are prepared using the methods described in R 68, T 247 or T 312. The bulk specific gravity (Gmb) of each specimen is measured using T 166 or T 331. A subset of specimens is moisture conditioned by exposing them to moisture at high temperature for 20 hours to test for adhesion strength and then using cyclically increasing and decreasing hydrostatic pore pressure to test for cohesion strength. After conditioning, the Gmb of each specimen is measured and compared to the Gmb obtained prior to conditioning to determine the swell or change in bulk specific gravity of the specimen. Then, the tensile strength is measured for each conditioned and unconditioned specimen. The tensile strength ratio (TSR) for these specimens is calculated to evaluate the effect of moisture damage on the mixture specimens. Finally, a visual or surface evaluation of moisture damage is performed. The extended exposure to moisture at high temperature and cyclic pressure helps in determining moisture damage susceptibility of the specimens from both adhesion and cohesion failures that can occur in the field.
4. SIGNIFICANCE AND USE
4.1. This test method provides an accelerated conditioning method for moisture exposure that can cause adhesive and cohesive strength failures in asphalt mixtures. The mixture response to moisture exposure is amplified by using high temperature and cyclic hydrostatic loading. The system described in the apparatus section is capable of operating at higher than normal temperatures and creating hydrostatic pore pressure within a compacted asphalt mixture to achieve an acceleration of the effects that a mixture would experience over time from traffic at normal temperatures and moisture conditions. The accelerated conditioning in this method is intended to simulate the stresses induced in a wet pavement by a passing vehicle tire.
4.2. The factors that influence the potential for moisture damage to occur in asphalt mix include aggregate mineralogy, mixture air voids, water, cyclic applied stress, and elevated temperature. This test method provides a method and apparatus that is capable of producing three of these factors: water, stress, and high temperature.
4.3. Specimens conditioned in this test method are evaluated using the tensile strength ratio, percentage of swell, visual inspection and surface evaluation of stripped aggregates.
.
5. APPARATUS1
5.1. Equipment for compacting specimens according to R 68, T 247, or T 312.
1 The sole source of supply of the apparatus known to the committee at this time is InstroTek, Inc., 1 Triangle Drive, Research Triangle Park, N.C. If you are aware of alternative suppliers, please provide this information to AASHTO. Your comments will receive careful consideration at a meeting of the responsible technical committee,1 which you may attend.

4
5.2. Balance in accordance with M 231.
5.3. Water bath capable of maintaining a temperature of 25 ± 1°C [77 ± 2°F].
5.4. System (schematic shown in Fig. 1) having a pressure chamber and capable of applying cyclic hydrostatic pressure to condition specimens. The system shall be capable of conditioning a total of three 100 mm [4 in.] in diameter and 63.5 ± 2.5 mm [2.5 ± 0.10 in.] high specimens or two 150 mm [6 in.] in diameter and 95 ± 5 mm [3.75 ± 0.20 in.] high specimens. The system shall be capable of applying cyclic hydrostatic pressure with a peak pressure within ±30 kPa [±4 psi] of the pressure set point and a pressure duration of 2.0 +/- 1.0 s at or above one-half of the maximum peak pressure.
Figure 1 ̶ Moisture Conditioning System
5.4.1. The pressure chamber shall be capable of withstanding pressures of up to 485 kPa [70 psi].
5.4.2. The system shall be capable of producing and controlling cyclic pressures within the pressure chamber between 200 and 420 kPa [30 to 50 psi] with measurements accurate to within ±30 kPa [±4 psi].
5.4.3. The system shall be capable of heating the water and controlling the temperature between 30 and 70°C [86 to 158°F] with measurements accurate to within ±1°C [±2°F] for a predetermined period of time. The variation in temperature of the pressure chamber shall be within ±2°C [±4°F] of the temperature setpoint. Then, it shall automatically start the cyclic hydrostatic pressure conditioning.
5.4.4. The system shall be equipped with the ability to automatically purge and remove air from the pressure chamber, and then replace the accessible air void spaces with water.
5.4.5. The system shall have plates and spacers to prevent a specimen from resting on another specimen during conditioning.
5.5. One or more containers sufficient in size to hold water and specimen(s) at 25 ±1°C [77 ±2°F] to perform T 166 or T 331.
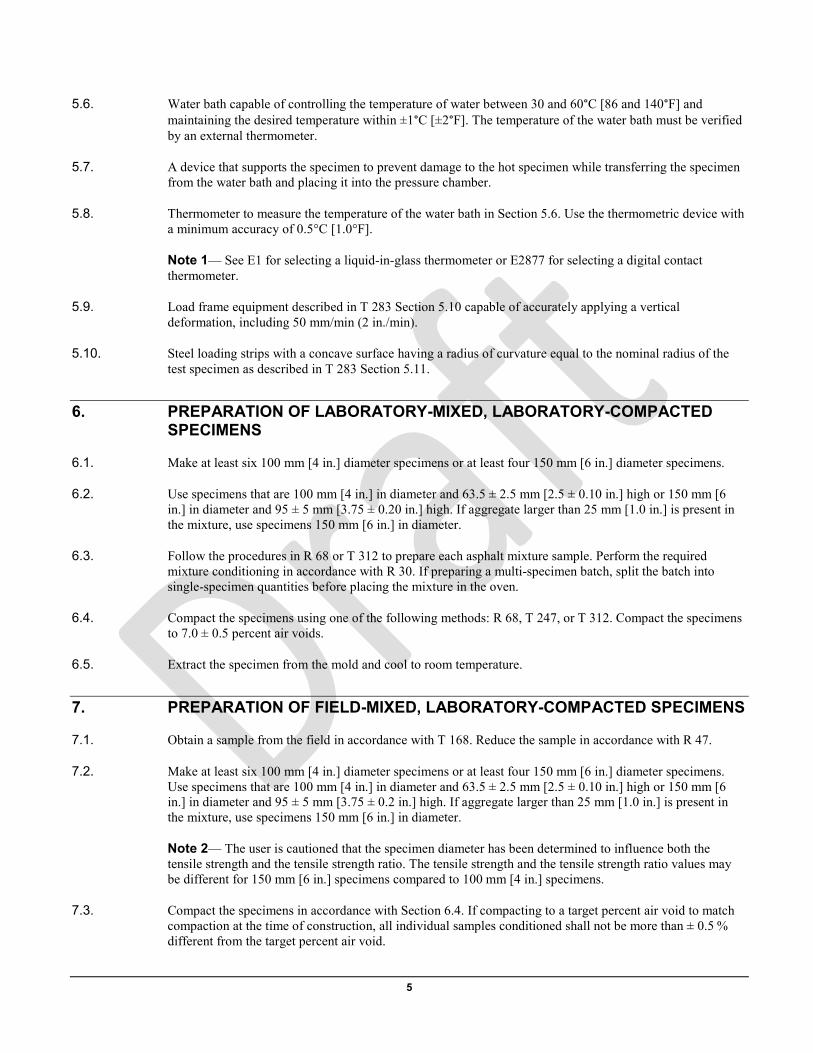
5
5.6. Water bath capable of controlling the temperature of water between 30 and 60°C [86 and 140°F] and maintaining the desired temperature within ±1°C [±2°F]. The temperature of the water bath must be verified by an external thermometer.
5.7. A device that supports the specimen to prevent damage to the hot specimen while transferring the specimen from the water bath and placing it into the pressure chamber.
5.8. Thermometer to measure the temperature of the water bath in Section 5.6. Use the thermometric device with a minimum accuracy of 0.5°C [1.0°F].
Note 1— See E1 for selecting a liquid-in-glass thermometer or E2877 for selecting a digital contact thermometer.
5.9. Load frame equipment described in T 283 Section 5.10 capable of accurately applying a vertical deformation, including 50 mm/min (2 in./min).
5.10. Steel loading strips with a concave surface having a radius of curvature equal to the nominal radius of the test specimen as described in T 283 Section 5.11.
6. PREPARATION OF LABORATORY-MIXED, LABORATORY-COMPACTED SPECIMENS
6.1. Make at least six 100 mm [4 in.] diameter specimens or at least four 150 mm [6 in.] diameter specimens.
6.2. Use specimens that are 100 mm [4 in.] in diameter and 63.5 ± 2.5 mm [2.5 ± 0.10 in.] high or 150 mm [6 in.] in diameter and 95 ± 5 mm [3.75 ± 0.20 in.] high. If aggregate larger than 25 mm [1.0 in.] is present in the mixture, use specimens 150 mm [6 in.] in diameter.
6.3. Follow the procedures in R 68 or T 312 to prepare each asphalt mixture sample. Perform the required mixture conditioning in accordance with R 30. If preparing a multi-specimen batch, split the batch into single-specimen quantities before placing the mixture in the oven.
6.4. Compact the specimens using one of the following methods: R 68, T 247, or T 312. Compact the specimens to 7.0 ± 0.5 percent air voids.
6.5. Extract the specimen from the mold and cool to room temperature.
7. PREPARATION OF FIELD-MIXED, LABORATORY-COMPACTED SPECIMENS
7.1. Obtain a sample from the field in accordance with T 168. Reduce the sample in accordance with R 47.
7.2. Make at least six 100 mm [4 in.] diameter specimens or at least four 150 mm [6 in.] diameter specimens. Use specimens that are 100 mm [4 in.] in diameter and 63.5 ± 2.5 mm [2.5 ± 0.10 in.] high or 150 mm [6 in.] in diameter and 95 ± 5 mm [3.75 ± 0.2 in.] high. If aggregate larger than 25 mm [1.0 in.] is present in the mixture, use specimens 150 mm [6 in.] in diameter.
Note 2— The user is cautioned that the specimen diameter has been determined to influence both the tensile strength and the tensile strength ratio. The tensile strength and the tensile strength ratio values may be different for 150 mm [6 in.] specimens compared to 100 mm [4 in.] specimens.
7.3. Compact the specimens in accordance with Section 6.4. If compacting to a target percent air void to match compaction at the time of construction, all individual samples conditioned shall not be more than ± 0.5 % different from the target percent air void.

6
8. DENSITY, THICKNESS AND GROUPING OF SPECIMENS
8.1. Record the specimen thickness (t) in accordance with D3549.
8.2. Record the nominal diameter of each specimen.
8.3. Determine the theoretical maximum specific gravity of each specimen using T 209. Determine the bulk specific gravity of each specimen (Gmb) using T 166 or T 331.
8.4. Calculate the percent air voids using T 269.
8.5. Separate the specimens into two subsets, of at least two specimens of 150 mm [6.0 in.] in diameter or three specimens of 100 mm [4.0 in.] in diameter for each subset, so that the average air voids of the two subsets are approximately equal. One subset will be conditioned using the apparatus in Section 5.4 and the other subset will not be conditioned before testing according to T 283 Section 11.
9. CONDITIONING PROCEDURE
9.1. Select the conditioning temperature from Table 1.
Table 1 ̶ Moisture Conditioning Temperature Requirements
High PG Grade of Asphalt Mixture a Conditioning Temperature PG grade ≥ PG 64 60°C [140°F] PG grade ≤ PG 58 45°C [113°F]
a See Table 1 in PP78 for guidance for estimating the high PG for asphalt mixtures with reclaimed asphalt pavement (RAP), reclaimed asphalt shingles (RAS), or both that may increase the stiffness of the asphalt binder and thereby the asphalt mixture.
9.2. The pressure chamber of the system or an external water bath system can be used to perform the non-cyclic conditioning. Set the temperature controller to the temperature required in Section 9.1.
9.3. Perform the hot water conditioning.
9.3.1. Using an external water bath -
9.3.1.1. Place the specimens on transfer devices and insert them into the water bath.
9.3.1.2. Condition the specimens for 20 hours ± 15 minutes at the conditioning temperature required in Section 9.1. The temperature should be controlled to within ±1°C [± 2°F].
9.3.2. Using the pressure chamber of the system -
9.3.2.1. Place the specimens into the chamber and fill the chamber with water according to the manufacture’s recommendations.
9.3.2.2. Start the system according to the manufacture’s recommendations. The system should heat the water to the conditioning temperature and maintain the temperature to within ±1°C [± 2°F] for 20 hours ± 15 minutes.
9.4. Prepare specimens for the cyclic hydrostatic pressure conditioning.
9.4.1. Using an external water bath -

7
9.4.1.1. Before moving the specimens into the pressure chamber of the system, pour hot water from the water bath into the pressure chamber. Follow manufacturer’s recommendations for filling the pressure chamber with hot water.
9.4.1.2. Place the specimens in the pressure chamber using the transfer device according to the manufacturer’s recommendations and fill with sufficient water at 35 [95°F] up to the test temperature to cover the specimens.
Note 3 — The specimens can be easily deformed at elevated test temperatures. Use extreme care when moving the specimens from the water bath to the pressure chamber.
9.4.2. If using the pressure chamber to perform the hot water conditioning, the samples will remain in the pressure chamber and the system will automatically start the cyclic hydrostatic pressure conditioning.
9.5. Perform the cyclic hydrostatic pressure conditioning by exposing the specimens to 3500 cycles of hydrostatic pressure with a peak pressure of 275 kPa [40 psi] while maintaining the conditioning temperature.
9.6. When the cyclic hydrostatic pressure conditioning is completed, the drain valve should open and allow all water to drain.
9.7. Pour sufficient tap water, 10 to 27°C [50 to 80°F], in the pressure chamber to cover the specimens. Allow the specimens to cool for at least 2 minutes after submersion with tap water. This will help reduce the specimens’ temperature and to ensure the specimens do not fall apart during removal from the chamber.
9.8. Carefully remove the specimens from the pressure chamber and place the specimens in a water container capable of maintaining a temperature of 25 ± 1°C [77 ± 2°F] for 2 h to 3 h. Specimens shall not be stacked directly on top of each other at any time during or after the conditioning process.
10. TESTING PROCEDURE
10.1. Measure the bulk specific gravity (Gmbfinal) of the specimen after conditioning according to T 166 or T 331.
10.1.1. If using T 166, use the same dry weight as the one used to determine the initial bulk specific gravity in Section 8.3.
10.1.2. If using T 331, dry the sample to constant weight according to R79 before vacuum sealing specimen.
10.2. Measure the tensile strength of both the dry and wet subsets of specimens in accordance with T 283 Section 11.
10.3. Record the visual moisture damage according to T 283.
11. CALCULATIONS
11.1. Calculate the tensile strength of each specimen in accordance with T 283.
11.2. Calculate the tensile strength ratio (TSR) of the average of each subset in accordance with T 283.
11.3. Calculate the percent change in bulk specific gravity of the specimen after conditioning compared to before conditioning as follows:

8
𝐺𝐺𝐺𝐺𝐺𝐺 𝑆𝑆𝑆𝑆𝑆𝑆𝑆𝑆𝑆𝑆 (%) = 𝐺𝐺𝐺𝐺𝐺𝐺−𝐺𝐺𝐺𝐺𝐺𝐺𝑓𝑓𝑓𝑓𝑓𝑓𝑓𝑓𝑓𝑓𝐺𝐺𝐺𝐺𝐺𝐺
∗ 100 (1)
where:
Gmb Swell ̶ percentage change in bulk specific gravity of specimen (%);
Gmb ̶ bulk specific gravity before conditioning; and
Gmbfinal ̶ bulk specific gravity after conditioning.
12. REPORT
12.1. Report the following information:
12.1.1. Type of samples tested (laboratory-mixed, laboratory-compacted or plant-mixed, laboratory compacted) and description of mixture (such as nominal maximum aggregate size, gradation, binder type).
12.1.2. The measured height and nominal diameter of each specimen, to the nearest 1 mm.
12.1.3. Test temperature, to the nearest 1°C [2°F].
12.1.4. Maximum load of each specimen, to the nearest 50 N [10 lbs.]
12.1.5. Average air voids of each subset.
12.1.6. The tensile strength of each of the replicate specimens and the average tensile strength for the set of specimens, to the nearest 5 kPa [1 psi].
12.1.7. Report the tensile strength ratio (TSR), to the nearest 0.01.
12.1.8. The Gmb swell of each of the replicate specimens and the average swell for the set of specimens, to the nearest 0.1%.
12.1.9. Report the visual moisture damage rating (Scale of “0” to “5” with “5” being the most stripped).
13. PRECISION AND BIAS
13.1. The within-laboratory single-user repeatability standard deviation for the tensile strength test for a conditioned sample has been determined to be 77 kPa [11 psi]. This standard deviation was calculated from 9 mixtures from North Carolina. The mixtures included nominal maximum sized aggregate (NMSA) between 9.5 and 25 mm [3/8 and 1 inch] for low, moderate, and high traffic pavements. The between-laboratory reproducibility of this test method is being determined and will be available before August 2021. Therefore, this Standard should not be used for acceptance or rejection of materials for purchasing purposes.
13.2. The within-laboratory repeatability standard deviation for the percentage change in bulk specific gravity has been determined to be 0.2% based on the same mixtures described in Section 13.1. The between-laboratory reproducibility of this test method is being determined and will be available before August 2021. Therefore, this Standard should not be used for acceptance or rejection of materials for purchasing purposes.

9
14. KEYWORDS
14.1. asphalt mixture; cyclic stress; moisture sensitivity; moisture conditioning; hydrostatic pore pressure; tensile strength; swell;
15. REFERENCES
15.1. Hicks, R. G., L. Santucci, and T. Ashchenbrener. Introduction and Seminar Objectives on Moisture Sensitivity of Asphalt Pavements. Transportation Research Board National Seminar, National Research Council, San Diego, California, 2003, pp. 3-19.
15.2. LaCroix, A. T., A. Regimand, and L. James. Proposed Approach for Evaluation of Cohesive and Adhesive Properties of Asphalt Mixtures for Determination of Moisture Sensitivity. In Transportation Research Record 2575, TRB, National Research Council, Washington, DC, 2016, pp. 61-69.
15.3. Little D. N., and D. R. Jones, IV. Chemical and Mechanical Processes of Moisture Damage in Hot-Mix Asphalt Pavements. Transportation Research Board National Seminar, National Research Council, San Diego, California, 2003, pp. 37-74
15.4. Schram, S. A. and R. C. William. Ranking of HMA Moisture Sensitivity Tests in Iowa. FHWA SP&R Project #PB10-012 Report, August 2012.

Agency (Individual Name)
Decision Comments Responses
Pennsylvania Department of Transportation (Timothy L Ramirez)
Affirmative 1) In Section 9.3, the referenced "(see Figure 4)" does not exist in the standard.
Figure number was corrected.
Illinois Department of Transportation (Brian Pfeifer)
Affirmative Suggest adding a reference to R 30 in Section 2.1 as it is referenced in Section 9.1.
Reference was added.
Section 4, Figure 1: it is challenging to read the dimensions of the specimens.
Figure 1 was updated.
Consider increasing the resolution of the image and adding the dimensions and tolerances of the loading heads.
Figure 1 was updated.
Section 10.2.2 details the loading in the test. Is there a seating load applied prior to the beginning at the test? Most test procedures use a seating load to avoid dynamic effects.
It is anticipated that the Nflex Factor test can be conducted using table-top screw driven load frames. In such cases, a seating load is not required.
Section 11.5 describes the determination of the brittleness slope. Consider modifying the section to: “The slope at the inflection point is determined by taking the first derivative of the polynomial equation fitted to the stress-estimated strain data and evaluating the first derivative at the estimated inflection point strain.”
Section 11.5 now states, “The slope at the inflection point is determined by taking the first derivative of the polynomial equation fitted to the stress-estimated strain data at the post-peak inflection point determined in Section 11.4.”
Section 11.6 states that the Toughness is determined by integrating the best-fit equation. Is this pure integration or using the trapezoidal rule?
Using the pure integration approach. Section 11.6 now states, “The Toughness of the specimen is determined by mathematically integrating the best-fit polynomial equation from the start of the test to the post-peak inflection point.”

In Section 12.1.3, the thickness is reported to the nearest 0.1 mm. However, Section 9.5 states measurements are taken to the nearest 1 mm. Consider matching Sections 9.5 and 12.1.3.
Suggested change was accepted. Section 9.5 now states, “Measure and record the thickness of each specimen to the nearest 0.1 mm in accordance with ASTM D 3549/D 3549M.”
Colorado Department of Transportation (Craig Wieden)
Affirmative Sections 9.6, 10.2, and 10.2.1 all use the word "alinement". Should this be replaced with "alignment"?
Suggested changes were accepted.
Tennessee Department of Transportation (Brian K. Egan)
Affirmative -Section 11.3, should "R2 (squared)" be added after "coefficient of determination".
Suggested change was accepted.
- On Figure 2, identify the terms described in Sections 11.4, 11.5, 11.6, and 11.7
Suggested changes to Figure 2 were accepted.
Wisconsin Department of Transportation (Barry C Paye)
Affirmative 6.3 - the first paragraph should be enough. Sections 6.3.1 to 6.3.4 should be deleted. Are we going to keep updating this as equipment changes?
The level of detail on the testing machine, including test fixture, displacement measuring device, and data acquisition system, is important to ensure the good quality of raw test data for the calculation of Nflex Factor.
8.1 - this is not specific enough to add any value. Either put specific targets, or delete the note.
Section 8.1 now states, “Verify the capability of the water bath to maintain a constant and uniform temperature (within ± 0.5°C from the test temperature).”
9.1 - Delete "at the present time" to start this section.
Suggested change was accepted.
10.2.2 - Note 2 – Delete Suggested change was accepted. 11.3 - R^2 of 0.95 is very tight. Does the data back this up.
Yes, most of the Nflex Factor test data from NCAT had a R2 value above 0.95.
Ontario Ministry of Transportation (Becca
Affirmative Figure 1- Dimensions provided are not legible, recommend increasing font size
Suggested changes to Figure 1 were accepted.
Section 6- Addition of double bladed saw as a viable method for cutting SGC specimen.
Section 6.1 now states, “Laboratory saw capable of cutting through a 150 mm diameter SGC

Lane) specimen and producing test specimens with smooth, parallel faces.”
Addition of an alignment jig (which is mentioned in section 9)
A new section on alignment jig was added.
Section 9 - Clarification on use of curing (curing or aging?)
Section 9.1 now states, “Condition laboratory produced mixtures in accordance to R 30. For plant produced mixtures, follow the agency of jurisdiction’s standard practice for conditioning of the mixture prior to laboratory compaction. If no such standard practice is provided, place the mixture in an oven at the compaction temperature used in mix design for the shortest time period necessary to bring the mixture to the compaction temperature.”
See Figure 4 should be see Figure 1 Figure number was corrected. Section 10 - change to 25 ±0.5°C - Suggest following T283
Suggested changes were accepted.
Section 12- Verification on units of toughness (normally J/m3)
Unit of toughness was corrected.
Ohio Department of Transportation (Eric R Biehl)
Negative Needs discussed more as this is the first I've ever heard of this test. If this is similar to IDEAL-CT (looks very close) will there be issues getting IDEAL-CT as a standard if we wish to recreate the ASTM version (if they approved it in their last ballot)?
The proposed IDT Nflex Factor test is similar to the IDEAL-CT test in many aspects. One major difference between the two test methods is that the Nflex Factor test requires the testing of Ndesign specimens while the IDEAL-CT test requires specimens compacted to a target air void content (7 ± 0.5%). Considering that the current asphalt mix design and QC/QA practices require the testing of Ndesign specimens for volumetric properties, using the same specimens for performance testing would greatly reduce the sample preparation time and therefore make the test much easier to implement into practice. Results from the Nflex Factor test have been

found to correlate well with the field cracking data from the FHWA ALF experiment (West et al., 2017).
Standard Method of Test for
Determining the Indirect Tensile Nflex Factor to Assess the Cracking Resistance of Asphalt Mixtures
AASHTO Designation: TP XXX-XX (2017)
Draft Version 1.1 (03-14-2017)
American Association of State Highway and Transportation Officials 444 North Capitol Street N.W., Suite 249 Washington, D.C. 20001

TS-2d TP XXX-XX (Draft revised on 03-14-2017) AASHTO
Standard Method of Test for
Determining the Indirect Tensile Nflex Factor to Assess the Cracking Resistance of Asphalt Mixtures AASHTO Designation: TP XXX-XX
1. SCOPE
1.1. This test method covers the determination of cracking resistance of asphalt mixtures using the indirect tensile (IDT) geometry at 25°C. The Toughness (area beneath the stress-estimated strain data) and Brittleness Slope (post peak stress-estimated strain rate) are used to calculate a parameter referred to as the Nflex Factor which may be a useful indicator of load-related cracking of asphalt pavement layers.
1.2. This procedure applies to test specimens having a nominal maximum aggregate size (NMAS) of 19 mm or less. Lab compacted specimens or field core specimens can be used.
1.3. This standard does not purport to address all of the safety concerns, if any, associated with its use. It is the responsibility of the user of this standard to establish and follow appropriate health and safety practices and determine the applicability of regulatory limitations prior to use.
2. REFERENCED DOCUMENTS
2.1. AASHTO Standards: R 30, Mixture Conditioning of Hot Mix Asphalt (HMA) T 166, Bulk Specific Gravity (Gmb) of Compacted Hot Mix Asphalt (HMA) Using Saturated
Surface-Dry Specimens T 209, Theoretical Maximum Specific Gravity (Gmm) and Density of Hot Mix Asphalt
(HMA) T 269, Percent Air Voids in Compacted Dense and Open Asphalt Mixtures T 283, Resistance of Compacted Asphalt Mixtures to Moisture-Induced Damage T 312, Preparing and Determining the Density of Asphalt Mixture Specimens by Means of the
Superpave Gyratory Compactor
2.2. ASTM Standards: D 8, Standard Terminology Relating to Materials for Roads and Pavements D 3549/D 3549M, Standard Test Method for Thickness or Height of Compacted Bituminous
Paving Mixture Specimens D 5361/D 5361M, Standard Practice for Sampling Compacted Bituminous Mixtures for
Laboratory Testing
D 6931, Standard Test Method for Indirect Tensile (IDT) Strength of Bituminous Mixtures

TS-2d TP XXX-XX (Draft revised on 03-14-2017) AASHTO
3. TERMINOLOGY
3.1. Definitions:
3.1.1. linear variable displacement transducer, LVDT—sensor device for measuring linear displacement.
3.1.2. vertical displacement, Y, —the total displacement of the specimen during testing measured in the direction of the load application.
3.1.3. Brittleness Slope, m, — the slope of the equation fitted to the stress-estimated strain data at the first inflection point following the peak stress.
3.1.4. Toughness, T, —the area under a stress-estimated strain plot to a particular point of interest. In this method, Toughness is determined from the initiation of load through the first inflection point following the peak stress.
3.1.5. Nflex Factor —an index property of an asphalt mixture which has been correlated to cracking resistance (West et al., 2017). Nflex Factor is calculated by dividing Toughness by the Brittleness Slope.
4. SUMMARY OF METHOD
4.1. An asphalt mixture compacted in the Superpave Gyratory Compactor (SGC) to the number of gyrations specified for mix design (Ndesign) is cut to obtain specimens 50 mm in thickness. After conditioning to the test temperature (i.e., 25°C), the specimen is positioned in the indirect tension fixture and a load is applied along the vertical diameter of the specimen. The load is applied such that a constant vertical deformation rate of 50 mm/min is maintained for the duration of the test. The load and vertical displacement are measured during the entire duration of the test. A minimum of three specimens are tested to determine the average results for a mixture. The test fixture and specimen geometry are shown in Figure 1.
4.2. Toughness (T) and Brittleness sSlope (m) are determined from an equation fitted to the stress-estimated strain data at the first inflection point past the peak stress. Toughness divided by the Brittleness Slope is referred to as the Nflex fFactor.

TS-2d TP XXX-XX (Draft revised on 03-14-2017) AASHTO
Figure 1— IDT test specimen and configuration (dimensions in millimeters)
5. SIGNIFICANCE AND USE
5.1. Specimens for this test may be cut from 150 mm diameter SGC samples compacted for determining volumetric properties such as samples used for mix design, quality control, and/or acceptance testing.
5.2. The IDT test is used to measure loads and displacements from which parameters related to toughness and brittleness of asphalt mixture at 25°C. Specimen dimensions, load, and displacement data are used to calculate the tensile stress and estimated horizontal strain at the center of the specimens through the duration of the test.
5.3. A fifth or sixth order polynomial equation is fitted through the estimated strain versus stress (x vs. y) data and verified to have an acceptable fit to the data points. The second derivative of the polynomial equation is used to determine the location of the first inflection point (change in curvature) past the peak stress. The first derivative of the initial polynomial equation at the inflection point is the slope (m) of that equation. That slope is the Brittleness Slope. The Toughness is determined by integrating the initial polynomial equation from zero strain to the inflection point previously determined. The Nflex Factor for each specimen is determined by dividing the Toughness by the slope (m) at the inflection point.
5.4. This test method is being investigated as a simple method to evaluate the cracking resistance of asphalt mixtures containing virgin and recycled materials, and possibly containing different asphalt contents and/or grades, or other mix additives.
IDT Specimen Dimensions IDT Specimen and Fixture
TS-2d TP XXX-XX (Draft revised on 03-14-2017) AASHTO
6. APPARATUS
6.1. Wet Saw—LA water-cooled laboratory saw with a diamond-impregnated blade capable of cutting through a 150 mm diameter SGC specimen in a single passand producing . The saw shall be capable of producing test specimens with smooth, parallel faces.
6.2. Water Bath—A water bath for conditioning the specimens to the test temperature. The water bath shall be capable of uniformly maintaining a temperature of 25 ± 0.5°C throughout the bath. An environmental chamber may be used in lieu of a water bath provided that the same temperature requirements are satisfied.
6.2.6.3. Testing Machine—A test frame, fixture, and data acquisition system consisting of an axial loading device, a load cell, a deformation measurement device, and a control and data acquisition system. The test frame shall be capable of capable of delivering loads in compression with minimum capacity of 50 kN, and controlling the vertical deformation rate at 50 ± 1 mm/min throughout the duration of the test. The test frame may be electromechanical, screw-driven, or a closed-loop, servo-hydraulic load frame. The displacement measurement can be performed using the machine’s stroke (position) transducer if the resolution of the stroke is sufficient (0.01 mm or lower).
6.2.1.6.3.1. Indirect Tensile Test Fixture—The fixture shall conform to the requirements of ASTM D 6931 Section 5.2.
6.2.2.6.3.2. Internal Displacement Measuring Device— The vertical displacement device shall have a minimum stroke of 50 mm and precision of 0.01 mm. The displacement data may be corrected for system compliance and specimen compression by performing a calibration of the testing system.
6.2.3.6.3.3. External Displacement Measuring Device— If an internal displacement measuring device does not exist or has insufficient precision, an externally mounted displacement measurement device such as a linear variable differential transducer (LVDT) can be used.
6.3.4. Control and Data Acquisition System—A minimum data acquisition frequency of 5 Hz is recommended in order to obtain sufficient load and displacement data for analysis.
6.3.6.4. Alignment Jig—A jig for aligning specimens in the indirect tensile test fixture.
7. HAZARDS
7.1. Standard laboratory caution should be used in handling, compacting and fabricating asphalt mixtures test specimens in accordance with AASHTO T 312.
8. CALIBRATION AND STANDARDIZATION
8.1. Verify the capability of the water bath to maintain a constant and uniform temperature (within ± 0.5°C from the test temperature).
8.2. Verify the calibration of all measurement components (such as load cells and LVDTs) of the testing system.
8.3. If any of the verifications yield data that does not comply with the accuracy specified, correct the problem prior to proceeding with testing. Appropriate action may include maintenance of system components, calibration of system components (using an independent calibration agency, service by the manufacturer, or in-house resources), or replacement of the system components.

TS-2d TP XXX-XX (Draft revised on 03-14-2017) AASHTO
9. PREPARATION OF TEST SPECIMENS
9.1. Laboratory Aging (Conditioning) — At the present time, mCondition laboratory prepared mixtures in accordance to ixtures prepared in the laboratory shall be short-term aged in accordance with R 30 as the standard practice for volumetric mix design. For plant produced mixtures, follow the agency of jurisdiction’s standard practice for curing conditioning of the mixture prior to laboratory compaction. If no such standard practice is provided, place the mixture in an oven at the compaction temperature used in mix design for the shortest time period necessary to bring the mixture to the compaction temperature.
Note 1— Research is underway to evaluate methods for conditioning of uncompacted loose mixtures or compacted specimens to represent long-term in-service aging of asphalt pavements.
9.2. SGC Specimens— Compact SGC specimens according to T 312 to the number of gyrations specified for the mixture, Ndesign.
9.3. Cutting of SGC Specimens— Cut the SGC specimen to obtain two smaller cylinders approximately 55 mm in thickness (see Figure 14). Trim the uncut faces of the specimens to obtain final test specimens with smooth parallel faces with a thickness of 50 ± 5 mm and a diameter of 150 ± 1 mm.
9.4. Determining the Bulk Specific Gravity—Determine the bulk specific gravity of the test specimens according to AASHTO T 166.
9.5. Determining Specimen Dimensions—Measure and record the thickness of each specimen to the nearest 0.1 mm in accordance with ASTM D 3549/D 3549M.
9.6. Marking the specimen for alignement—Using a paint pen and alinement jig, mark both faces of the specimen to indicate where the specimen will contact the top and bottom loading strips.
10. TEST PROCEDURE
10.1. Conditioning—Test specimens shall be conditioned to the test temperature using a water bath at 25 ± 0.5 °C for 2 ± 0.5 hours. Specimens shall be sealed in individual leak-proof bags prior to being submerged in the water bath.
10.1.1. Temperature Control —The temperature of the specimen shall be maintained within ± 0.5°C offrom the desired test temperature (25 °C) throughout the conditioning and testing periods. Testing shall be completed within 5 minutes after removal from the environmental chamber or water bath.
10.2. Specimen alignement— Place the test specimen in the IDT fixture and ensure the specimen is centered and aligned on the loading strips on each face of the specimen.
10.2.1. Fixture alignement— Place the specimen and IDT fixture in the testing machine and ensure the fixture is properly aligned with the load cell.
10.2.2. Loading—Engage the testing machine to move the loading platen at a constant rate of 50 ± 1 mm/min. Record the load and vertical deformation until the specimen breaks apart.
Note 2— Research is underway to explore alternative loading rates (e.g. 0.5 and 5.0 mm/min) and evaluate the effect on Nflex Factor results.
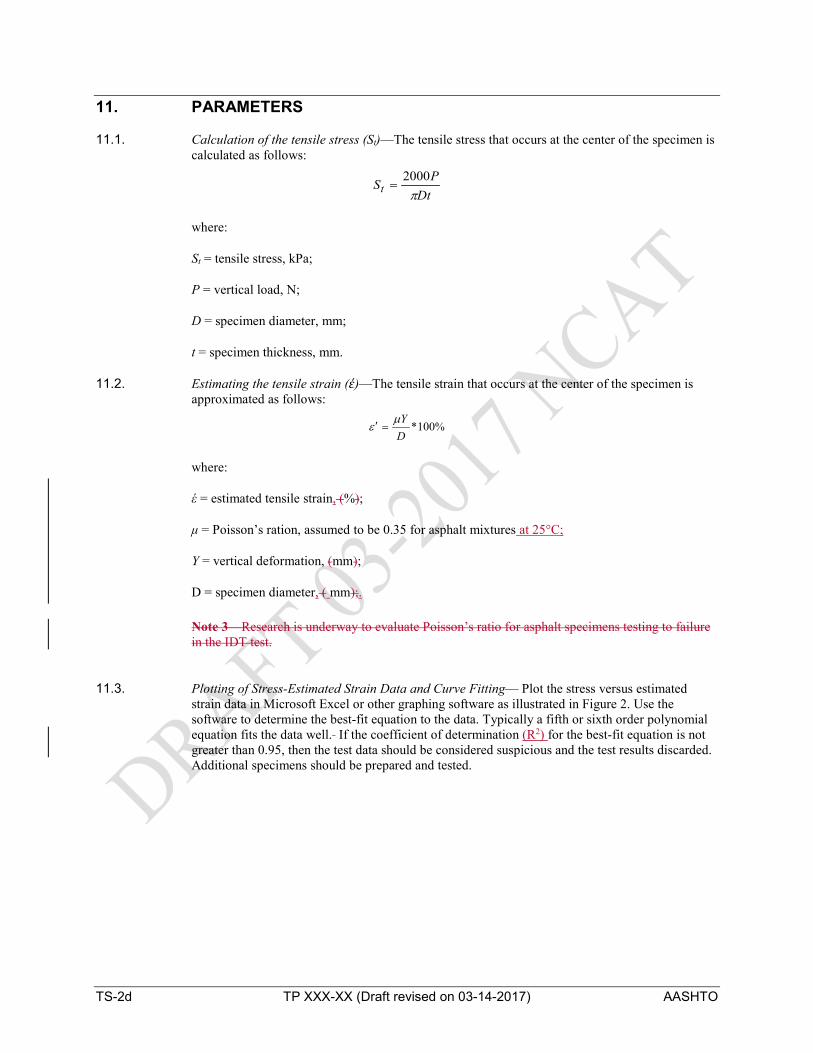
TS-2d TP XXX-XX (Draft revised on 03-14-2017) AASHTO
11. PARAMETERS
11.1. Calculation of the tensile stress (St)—The tensile stress that occurs at the center of the specimen is calculated as follows:
DtPSt π
2000=
where:
St = tensile stress, kPa;
P = vertical load, N;
D = specimen diameter, mm;
t = specimen thickness, mm.
11.2. Estimating the tensile strain (έ)—The tensile strain that occurs at the center of the specimen is approximated as follows:
%100*DYµ
ε =′
where:
έ = estimated tensile strain, (%);
μ = Poisson’s ration, assumed to be 0.35 for asphalt mixtures at 25°C;
Y = vertical deformation, (mm);
D = specimen diameter, ( mm);. Note 3—Research is underway to evaluate Poisson’s ratio for asphalt specimens testing to failure in the IDT test.
11.3. Plotting of Stress-Estimated Strain Data and Curve Fitting— Plot the stress versus estimated strain data in Microsoft Excel or other graphing software as illustrated in Figure 2. Use the software to determine the best-fit equation to the data. Typically a fifth or sixth order polynomial equation fits the data well. If the coefficient of determination (R2) for the best-fit equation is not greater than 0.95, then the test data should be considered suspicious and the test results discarded. Additional specimens should be prepared and tested.
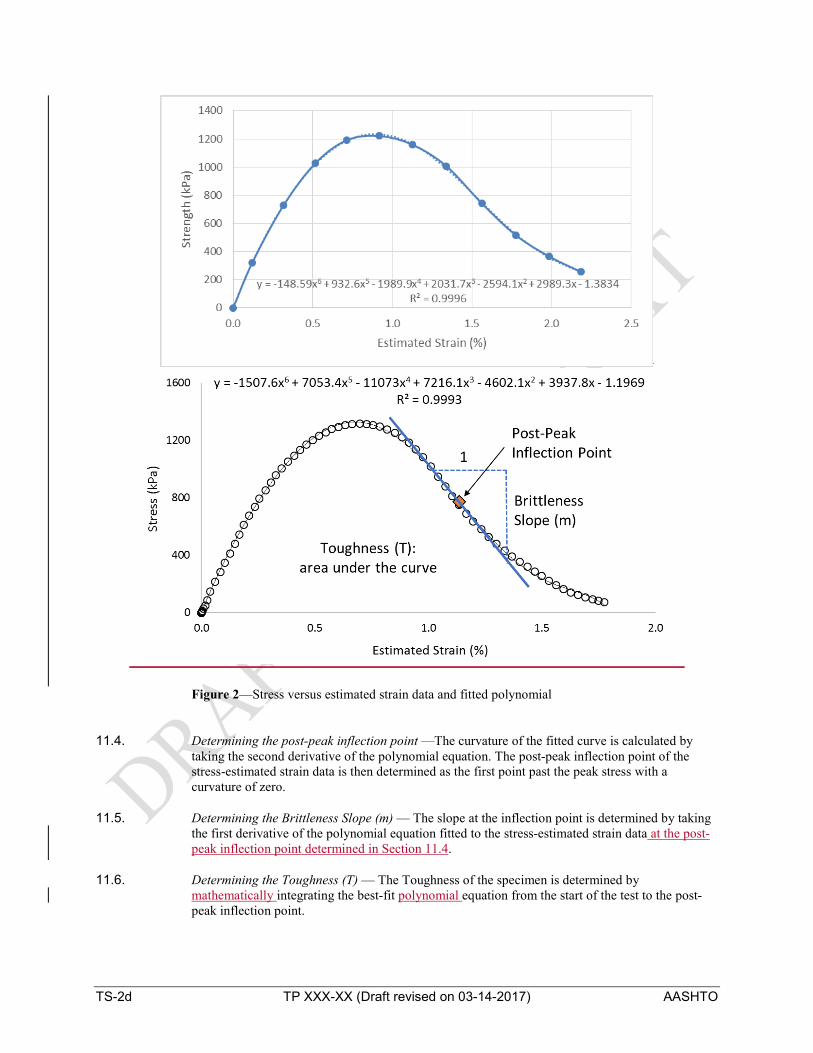
TS-2d TP XXX-XX (Draft revised on 03-14-2017) AASHTO
Figure 2—Stress versus estimated strain data and fitted polynomial
11.4. Determining the post-peak inflection point —The curvature of the fitted curve is calculated by taking the second derivative of the polynomial equation. The post-peak inflection point of the stress-estimated strain data is then determined as the first point past the peak stress with a curvature of zero.
11.5. Determining the Brittleness Slope (m) — The slope at the inflection point is determined by taking the first derivative of the polynomial equation fitted to the stress-estimated strain data at the post-peak inflection point determined in Section 11.4.
11.6. Determining the Toughness (T) — The Toughness of the specimen is determined by mathematically integrating the best-fit polynomial equation from the start of the test to the post-peak inflection point.

TS-2d TP XXX-XX (Draft revised on 03-14-2017) AASHTO
11.7. Nflex Factor — the Nflex Factor is calculated by dividing the Toughness by the Brittleness Slope as shown in the following equation.
mTFactorN flex =
12. REPORT
12.1. Report the following information:
12.1.1. Bulk specific gravity of each specimen tested, to the nearest 0.001;
12.1.2. Air void content of each specimen tested, to the nearest 0.1%;
12.1.3. Thickness (t) of each specimen tested tested, to the nearest 0.1 mm;
12.1.4. The plot of tensile stress versus estimated tensile strain data for each specimen tested including the best fit polynomial and the coefficient of determination (R2) for the fitted equation;.
12.1.5. Toughness (T) of each specimen tested, to the nearest 0.10.1 J/m3s;
12.1.6. Brittleness sSlope (m) of each specimen tested, to the nearest 0.1 J/m3;.
12.1.7. Nflex Factor of each specimen tested, to the nearest 0.01;
12.1.6. Average and coefficient of variation of the Brittleness slope (m);
12.1.8. Average and coefficient of variation of Toughness (T) to the nearest 0.11 J/m23;.
12.1.9. Average and coefficient of variation of the Brittleness Slope (m), to the nearest 0.1 J/m3;
12.1.7.12.1.10. Average and coefficient of variation of Nflex Ffactor to the nearest 0.01.
13. PRECISION AND BIAS
13.1. Precision— The research required to develop precision estimates has not been conducted.
13.2. Bias— The research required to establish the bias of this method has not been conducted.
14. KEYWORDS
14.1. Asphalt mixture; indirect tension test; toughness; brittleness slope; Nflex factor.
15. REFERENCES
15.1. West, R.C., Van Winkle, C., Maghsoodloo, S., and Dixon, S. (2017) “Relationships between Simple Asphalt Mixture Cracking Tests using Ndesign Specimens and Fatigue Cracking at FHWA’s Accelerated Loading Facility.” Accepted for publication in the Journal of the Association of Asphalt Paving Technologists, Volume 86.West, R.C., Winkle, C.V., Maghsoodloo, S., & Dixon,

TS-2d TP XXX-XX (Draft revised on 03-14-2017) AASHTO
S. (2017). Relationships between simple asphalt mixture cracking tests using Ndesign specimens and fatigue cracking at FHWA’s accelerated loading facility. Road Materials and Pavement Design, 18(sup4), 428-446.

AASHTO Electronic Balloting System Ballot Detail Report
Ballot Detail
Ballot Name: Revisions to TP 116 and TP 124
Ballot Manager: Ross Oak Metcalfe
Ballot Start Date: 3/18/2019
Ballot Due Date: 4/19/2019
Revisions to TP 116 and TP 124
Item Number: 1
Description: Revisions to TP 116: 1. Inclusion of iRLPD fatigue cracking test 2. For rutting test, a new sample size is added 3. Volumetric samples may be used for both rutting and fatigue tests 4. For rutting test, high-temperature PG determination is added 5. Design traffic level is now related to high-temperature PG using LTPPBind grade bump 6. References are updated and new references added
Decisions: Affirmative: 26 of 38 Negative: 0 of 38 No Vote: 12 of 38
Agency (Individual Name) Comments
Heritage Research Group (Gerald Anton Huber) ([email protected])
Section 4.4 50 mm is 2 inches high, not 2.5 inches. Fixed. Section 9.2.1 Currently states "H = 0 for surface layer, depth to top of layer for base layer." Suggest changing word "base" to "lower" as follows: "H = 0 for surface layer, depth to top of layer for lower layer." Fixed. Note 4 allows 2-inch high fatigue specimens to be compacted to 4% air voids in a gyratory compactor instead of being cut from a taller (115 mm?) specimen. Are test results expected to be the same from either scenario? If not, some indication should be made of the difference. We conducted a study of both sample types (compacted vs. cut one face or cut both faces) but we could not find a difference in results between different methods. So, the test method allows cutting one face, two face or no cut (as compacted). Section 9.2.2.1 and 9.2.2.2 I am confused by the selection of test temperature based on properties of the asphalt binder. Changing properties of the asphalt mixture by changing properties of the asphalt binder, i.e. PG graded selected or influence of reclaimed asphalt binder, might change fatigue properties but does not change the environment in which the mixture is to perform. Why is test temperature not selected based on LTPP Bind plus depth from surface? Testing at the intermediate temperature is suggested for the fatigue test and we have done a large number of tests on binder, mastic and mixture, which showed the mixture is most vulnerable to fatigue cracking at the intermediate temperature (IT). Interesting enough, at the standard highway load level, the IT of virgin mixture is the same as IT of its binder. When modifiers and RAP/RAS and rejuvenators are used, the IT changes and does not follow M 320 anymore. For this reason, we have developed a material characterization test on mastic using a rheometer that can find IT of the mixture. The critical temperature for fatigue is the temperatures around IT (when m* is the maximum). At temperatures lower than IT, material is stiff and has low strains (m* is lower) and at temperatures higher than IT, material is ductile and would not crack. Similarly, for determining a fatigue life, the number of hours at the IT temperature of the mixture (critical fatigue temperature) in the environment at which the material is placed needs to be taken into consideration (similar to the high temperature test).

Section 9.4.1.5 Should this specify that for Method B the confining stress should be maintained. Method A has no confining stress. Good point. Will add text to specify this. Section 10.3.3.1 This seems to be the only reference made to the fatigue parameter. It is not very clear about how to determine this value. Fatigue does seem to be well documented in Section 10. Good point. A graph is added to show the fatigue parameter.
D'Angelo Consulting, LLC (John Anthony Dangelo) ([email protected])
For the method A procedure with the small upper platen, this is similar to an EU norm test. it is purely empirical, and confinement supplied by the outer portion of the specimen is highly variable depending on the gradation and binder content. This method should not be used on coarse mixes or SMA. Agreed. The smaller platen size for the proposed Method A is merely an editorial mistake remaining from the earlier version of the method prepared for ASTM. The actual platen size is 150 mm as was presented in the TS 2d webinar in April. Four years ago we researched the EN test method and at some point prepared a test method in ASTM format suggesting use of 89 mm diameter platen for self-confinement. However, during our recent study, which led to the proposed revisions to TP 116, we reached a conclusion that the level of confinement for different materials is inconsistent. Therefore, we abandoned the small platen loading. The proposed rutting Method A is simply an unconfined test on the volumetric samples where the entire upper face is loaded (see below picture from the presentation). The results that we presented during the TS 2d webinar in April were based on the 150-mm platen loading. The text of the test method is now corrected to 150mm platen size (instead of 89mm). Slide 13 of the presentation (below) shows the test criteria and the picture shows the unconfined volumetric sample setup.
Maine Department of Transportation (Richard L Bradbury) ([email protected])
I suggest deleting sections 10.3.2.4 and 11.1.6.2. These sections go beyond what should be contained in a test procedure and refer to compliance with a materials specification. The main output of the rutting test is material constant ”b” , which is converted to continuous PG (equation 8). However, this PG is only compatible with M 320. Table 1, derived from LTPPBind, converts the continuous PG (M 320) to the environment PG and traffic level similar to M 332. ESAL estimation was removed from 10.3.2.4. and 11.1.6.2 and replaced with environment PG with traffic.
Pennsylvania Department of Transportation (Timothy L Ramirez) ([email protected])
Affirmative with comments: 1) In Section 2.1, 3rd bullet, revise from "AASHTO T 378" to "T 378". 2) In Section 2.1, 4th bullet, revise from "AASHTO T 312" to "T 312". 3) In Section 6.6, revise from "AASHTO T 378" to "T 378" 4) In Section 9,2.2.1, revise from "AASHTO R 29" to "R 29". 5) In Section 9.2.2.2, revise from "AASHTO R29" to "R 29".

6) In Section 9.3.1, suggest revising from "For Methods A" to "For rutting Method A". 7) In Section 9.3.2, suggest revising from "For Method B" to "For rutting Method B". 8) In Section 9.3.5, revise from "AASHTO T 378" to "T 378". Agreed. All editorials in this section have been corrected.
Florida Department of Transportation (Timothy J. Ruelke) ([email protected])
Page TP 116-1, 2.1: Be consistent with previously listed AASHTO standards, ‘AASHTO T 378’ should be ‘T 378’ and ‘AASHTO T 312’ should be ‘T 312’. ‘R 29’ would be correct. Page TP 116-2, 3.1.4: ‘.loading’ Remove period. Page TP 116-2, 4.3: Remove one space between ‘stage’ and ‘of’. Page TP 116-4, 8.1: Shouldn’t ‘T 378’ be referred to as ‘AASHTO T 378’? Page TP 116-4, 9.1.4: ‘Fatigue’ should be all lower case. Page TP 116-5, 9.2.2.2: ‘AASHTO R29’' should be ‘AASHTO R 29’ (remove extra space). Page TP 116-5, 9.3.3: ‘Fatigue’ should be all lower case. Page TP 116-5, 9.3.4: ‘.For’. Remove period. Page TP 116-6, 9.3.5: Remove one space between ‘T’ and ‘(378)’. Page TP 116-10, 9.5.7: ‘reach’ should be ‘reaches’. Page TP 116-10, 9.5.10: Remove one space between ‘Sections’ and ‘(9.5.7)’. Page TP 116-13, Table 1: Change table font to match text font. Agreed. All editorials in this section have been corrected.
Missouri Department of Transportation (Brett Steven Trautman) ([email protected])
Affirmative vote with editorial comments: 1) In Section 5.2, the third line, recommend adding the word 'The' in front of the of the term 'm*' so it reads as: "...tire pressure. The m* is used for performance..." 2) In Section 6.2, the first line, recommend the word 'testing' be capitalized so it reads as: "Dynamic Testing System (DTS) - A dynamic test..." 3) In Section 9.1.4, the first line, recommend the word 'Fatigue' not be capitalized to be consistent with the rest of the specification. The line would read as: "For fatigue, testing shall be performed on..." 4) In Section 9.1.4, the second line, recommend the word 'into' be replaced with the word 'to' so it reads as: "...fabricated in accordance with T 312 and cut to size." 5) In Section 9.3.1, the first line, recommend removing the letter 's' from the word 'Methods' so it reads as: "For Method A, the lower platen shall be..." 6) In Section 9.3.3, the first line, recommend the word 'Fatigue' not be capitalized to be consistent with the rest of the specification. The line would read as: "For fatigue, the lower platen shall be 150-mm..." 7) In Section 9.5.2, the first line, recommend making the word 'test' plural by adding the letter 's' so it reads as: " For the fatigue tests the following levels..." There is only one method for fatigue test. 8) On Page 10, the section number '9.5.13' was deleted but most of the information was left in the specification. Need to add a new section number. It appears the section should be numbered '9.6.5'. Could not respond to this comment since Section 9.5.13 does not exist. 9) In Section 10.3.3, recommend the word 'Fatigue' not be capitalized to be consistent with the rest of the specification. The line would read as: "For the fatigue calculations:" Agreed with all other comments in this section and incorporated them in the test method.
Item Number: 2
Description: Revisions to TP 124, specifically, the addition of a precision and bias statement.
Decisions: Affirmative: 26 of 38 Negative: 0 of 38 No Vote: 12 of 38
Agency (Individual Name) Comments
Heritage Research Group (Gerald Anton Huber) ([email protected])
No comments, except that the variability is much larger than expected. But am glad it is being reported as is. Solid basis for statement.
Maine Department of Transportation (Richard L Bradbury) ([email protected])
Note 4: replace "bricks" with "specimens". Figures X1.1 - X1.3 should be revised to improve clarity.
Florida Department of Transportation (Timothy J. Ruelke) ([email protected])
Page TP 124-6, 6.1.6: This section should indicate two saws are necessary, an asphalt specimen saw, and a tile saw. This is correctly described in Note 3, “A typical laboratory saw for mixture specimen preparation can be used to obtain cylindrical discs with smooth parallel surfaces. A tile saw is recommended for cutting the 15 ± 1 mm notch in the individual I-FIT specimens.” I have not seen one saw that can successfully make all the cuts for testing. Page TP 124-9, 7.1: ‘T 312’ should be ‘AASHTO T 312’. This is consistent with the next subsection, 8.1, ‘AASHTO T 283’. Page TP 124-9 Note 4: Replace the word ‘brick’ with either ‘cylinder’ or ‘specimen’ (four instances in the note). Page TP 124-10, 9.1.2: ‘R 67’ should be ‘AASHTO R 67’ to be consistent with previous AASHTO references. Page TP 124-10, 9.2: ‘T 166’ should be ‘AASHTO T 166’ to be consistent with previous AASHTO references.
Kansas Department of Transportation (Richard A Barezinsky) ([email protected])
Note 4: Change "bricks" to "specimen(s)".
Ontario Ministry of Transportation (Becca Lane) ([email protected])
Change last sentence of section 4.1 to: "The I-FIT specimen geometry for an SGC laboratory compacted specimen is shown in Figure 1."
Missouri Department of Transportation (Brett Steven Trautman) ([email protected])
Affirmative vote with editorial comments: 1) Recommend checking with AASHTO Re:source to see what the protocol is for utilizing a state's name in a test method. 2) In Note 4, the words 'bricks' and 'brick' are utilized are few times in this note. Recommend using the words 'specimens' and 'specimen' to be consistent with language used in T312 and R35.
Oak, Thank you for your response to my TP-124 questions. I looked through the TS ballot responses and have a couple thoughts. • The majority of the comments pertain to using the word “brick(s)” to refer to the “Gyratory Cylinder”. “Brick” is most likely a state-only or regional term and, I agree, is not the best description to be used here as a “standard” term. However, to distinguish between the 3) “stages” of the specimen from compaction to testing, I think it is beneficial to use some variation of the following terms when referring to these “stages”: o “Compacted Cylinder” to refer to the specimen as extruded from the gyratory mold. o “Disc” to refer to the 50mm thick specimen after the initial cuts on the “gyratory compacted cylinder”, and o “Specimen or test specimen” to refer to the fully prepared semi-circular test specimen that will be tested in the I-FIT machine. This is somewhat different, for example, than the specimen in AASHTO T312 where the final test specimen is a cylinder as well as the as-compacted specimen. • The comment by Timothy Ruelke from Florida regarding Section 6.1.6 is correct - The procedure does require 2 saws and should be noted. o Cutting the discs from the gyratory cylinder should be accomplished using a typical laboratory saw. o The semi-circular test specimens can be cut from the discs using either a typical laboratory saw or a tile saw. o The notch cannot be cut with a typical laboratory saw (because the saw blade is too wide) and so the tile saw is most practical. I have heard that a variation of a band saw with a flexible diamond blade could be used to cut the notch (and should be allowed) but this is a significantly more expensive option than the tile saw, and not necessarily better. • Also the comment by Becca Lane, from Ontario Ministry of Transportation, is correct. A previous version of Figure 1 did contain both a diagram of the I-FIT specimen geometry and also a picture of the TestQuip machine. Since the TestQuip machine is only one option for the testing machine, that picture was removed. • I’m guessing that calling this test (AASHTO TP-124) the “Illinois Flexibility Index Test” is similar to calling ASTM D1883 the “California Bearing Ratio” Test. I am pleased that these comments were this straight forward. Thank you for all your help in moving the TP 124 spec forward. Best Regards, Tom

Standard Method of Test for
Rutting and Fatigue Resistance of Asphalt Mixtures Using Incremental Repeated Load Permanent Deformation (iRLPD)
AASHTO Designation: TP 116-151
Technical Section: 2d, Bituminous Materials
Release: Group 3 (August)
American Association of State Highway and Transportation Officials 444 North Capitol Street N.W., Suite 249 Washington, D.C. 20001

TS-2d TP 116-1 AASHTO
Standard Method of Test for
Rutting and Fatigue Resistance of Asphalt Mixtures Using Incremental Repeated Load Permanent Deformation (iRLPD)
AASHTO Designation: TP 116-151 Technical Section: 2d, Bituminous Materials
Release: Group 3 (August)
1. SCOPE
1.1. This standard describes a test method for measuring the resistance of asphalt mixtures to rutting and fatigue cracking using Minimum Strain Rates (MSRm*) from an incremental Repeated Load Permanent Deformation (iRLPD) Test conducted by means of an Asphalt Mixture Performance Tester (AMPT) System Dynamic Testing System (DTS). This practice is intended for dense- and gap-graded mixtures with nominal maximum aggregate sizes to 37.5 mm.
1.2. This standard may involve hazardous materials, operations, and equipment. This standard does not purport to address all of the safety concerns associated with its use. It is the responsibility of the user of this procedure to establish appropriate safety and health practices and to determine the applicability of regulatory limitations prior to its use.
2. REFERENCED DOCUMENTS
2.1. AASHTO Standards: AASHTO R 30, Mixture Conditioning of Hot Mix Asphalt (HMA) AASHTO R 83, Preparation of Cylindrical Performance Test Specimens Using the Superpave
Gyratory Compactor (SGC) AASHTO T 378, Standard Method of Test for Determining the Dynamic Modulus and Flow
Number for Asphalt Mixtures Using the Asphalt Mixture Performance Tester (AMPT) AASHTO T 312, Standard Method of Test for Preparing and Determining the Density of
Asphalt Mixture Specimens by Means of Superpave Gyratory Compactor AASHTO R 29 Standard Practice for Grading or Verifying the Performance Grade (PG) of
an Asphalt Binder EN 12697-25:2005 (E) Bituminous mixtures - Test methods for hot mix asphalt- Part 25:
Cyclic compression test.
3. TERMINOLOGY
3.1. Definitions:
3.1.1. confining pressure—stress applied to all surfaces in a confined test.

TS-2d TP 116-2 AASHTO
3.1.2. contact stress—the constant axial stress applied to hold the specimen in place.
3.1.3. deviator stress—difference between the total axial stress and the confining pressure in a confined test
3.1.3.3.1.4. .loading increment—500 cycles of a repeated load . in the rutting test and 100 cycles of a repeated load in the fatigue test.
3.1.4.3.1.5. minimum strain rate (MSRm*)—the lowest permanent strain per cycle in a loading increment, which is the permanent strain rate due to the 500th last cycle of a loading increment. in the secondary stage.
3.1.5.3.1.6. permanent deformation—non-recovered deformation in a repeated load test.
3.1.6.3.1.7. repeated load cycle—loading of 0.1 second followed by 0.9-second rest period.
3.1.7.3.1.8. secondary loading stage—the loading cycles where the permanent axial strain rate is stable.
3.1.8.3.1.9. strain rate—the permanent axial strain due to one repeated load cycle.
3.1.9.3.1.10. strain acceleration—the rate of change of the strain rate.
4. SUMMARY OF THE TEST METHOD
4.1. This test method describes procedures for evaluating resistance of asphalt mixtures to rutting and fatigue cracking by measuring the Minimum Strain Rate (MSRm*) at the critical temperature and various stress and temperature combinationsload levels using the iRLPD testmethod.
4.2. The iRLPD test is conducted at one test temperature and confining pressure in four 500-cycleand in several increments. The deviator stress load is held constant during each increment and is increased for each subsequent increment. The load pulse is 0.1 sec every 1.0 sec. Permanent axial strains due to each load cycle (permanent strain rate) are measured by the actuator. The minimum strain rate for each increment is defined as the permanent axial strain due to the last (500th) cycle.
4.3. in There are two methods of conducting the rutting test. The mMethod A is conducted on 150-mm (6.0-in) diameter by 60115-mm (4.5-in) high diskvolumetric specimen without applying confinement. (3.5-in)supplied The mMethod B is conducted on 100-mm (4.0-in) diameter by 150-mm (6.0-in) high cylinder with 69 kPa (10 psi) confinement. The method A test is conducted in one increment of 500 cycles and method B is conducted in four increments of 500 cycles each. The increments of the rutting test always remain in the secondary stage ofstage of deformation and never reach tertiary flow.
4.2.4.4. The fatigue test shall beis conducted in seventwelve increments of 100 cycles each using an indirect-tensile (IDT) setup on 150-mm (6.0-in) diameter. by 50-mm (2.05-in) high disk. The fatigue test. is always carried to failure.
5. SIGNIFICANCE AND USE
5.1. The Minimum Strain Rate (m*) is the permanent deformation property of asphalt mixtures and represents the unit rutting damage at high temperature or fatigue resistance at intermediate temperature due to a repeated heavy-axle load.
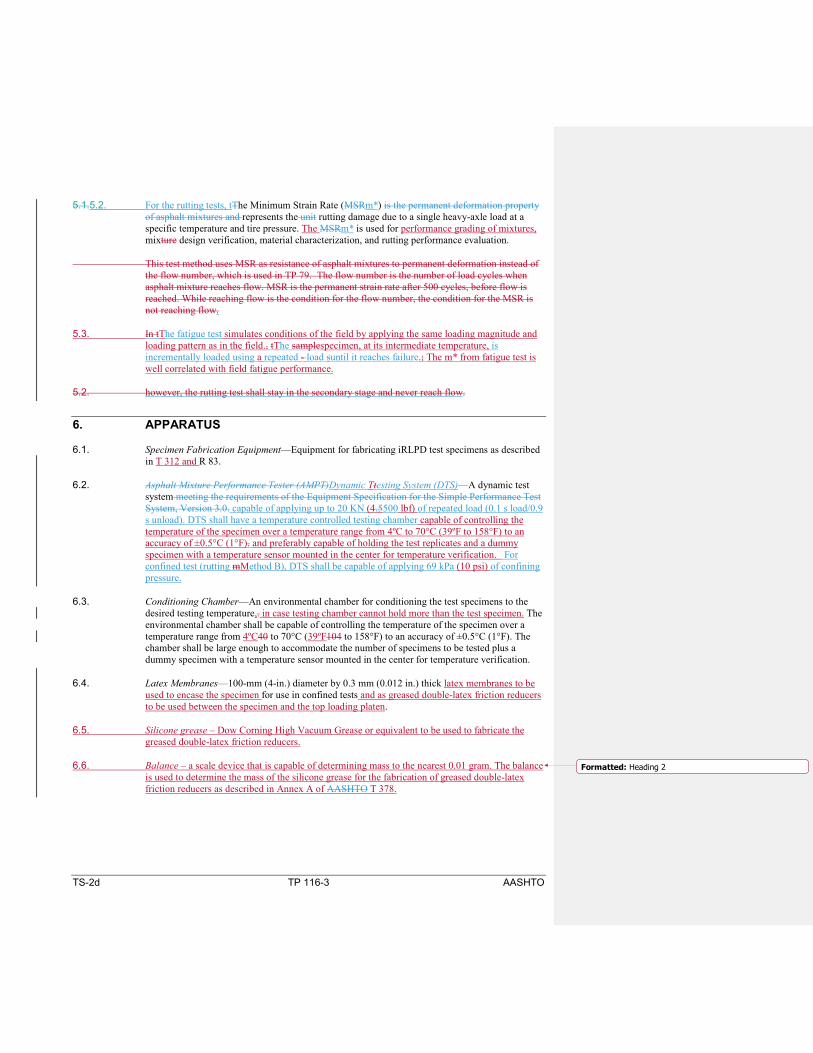
TS-2d TP 116-3 AASHTO
5.1.5.2. For the rutting tests, tThe Minimum Strain Rate (MSRm*) is the permanent deformation property of asphalt mixtures and represents the unit rutting damage due to a single heavy-axle load at a specific temperature and tire pressure. The MSRm* is used for performance grading of mixtures, mixture design verification, material characterization, and rutting performance evaluation.
This test method uses MSR as resistance of asphalt mixtures to permanent deformation instead of the flow number, which is used in TP 79. The flow number is the number of load cycles when asphalt mixture reaches flow. MSR is the permanent strain rate after 500 cycles, before flow is reached. While reaching flow is the condition for the flow number, the condition for the MSR is not reaching flow.
5.3. In tThe fatigue test simulates conditions of the field by applying the same loading magnitude and loading pattern as in the field., tThe samplespecimen, at its intermediate temperature, is incrementally loaded using a repeated - load suntil it reaches failure.; The m* from fatigue test is well correlated with field fatigue performance.
5.2. however, the rutting test shall stay in the secondary stage and never reach flow.
6. APPARATUS
6.1. Specimen Fabrication Equipment—Equipment for fabricating iRLPD test specimens as described in T 312 and R 83.
6.2. Asphalt Mixture Performance Tester (AMPT)Dynamic Ttesting System (DTS)—A dynamic test system meeting the requirements of the Equipment Specification for the Simple Performance Test System, Version 3.0. capable of applying up to 20 KN (4.5500 lbf) of repeated load (0.1 s load/0.9 s unload). DTS shall have a temperature controlled testing chamber capable of controlling the temperature of the specimen over a temperature range from 4ºC to 70°C (39ºF to 158°F) to an accuracy of ±0.5°C (1°F). and preferably capable of holding the test replicates and a dummy specimen with a temperature sensor mounted in the center for temperature verification. For confined test (rutting mMethod B), DTS shall be capable of applying 69 kPa (10 psi) of confining pressure.
6.3. Conditioning Chamber—An environmental chamber for conditioning the test specimens to the desired testing temperature,. in case testing chamber cannot hold more than the test specimen. The environmental chamber shall be capable of controlling the temperature of the specimen over a temperature range from 4ºC40 to 70°C (39ºF104 to 158°F) to an accuracy of ±0.5°C (1°F). The chamber shall be large enough to accommodate the number of specimens to be tested plus a dummy specimen with a temperature sensor mounted in the center for temperature verification.
6.4. Latex Membranes—100-mm (4-in.) diameter by 0.3 mm (0.012 in.) thick latex membranes to be used to encase the specimen for use in confined tests and as greased double-latex friction reducers to be used between the specimen and the top loading platen.
6.5. Silicone grease – Dow Corning High Vacuum Grease or equivalent to be used to fabricate the greased double-latex friction reducers.
6.6. Balance – a scale device that is capable of determining mass to the nearest 0.01 gram. The balance is used to determine the mass of the silicone grease for the fabrication of greased double-latex friction reducers as described in Annex A of AASHTO T 378.
Formatted: Heading 2

TS-2d TP 116-4 AASHTO
7. HAZARDS
7.1. This test and associated standards involve handling of hot asphalt binder, aggregates, and asphalt mixtures. It also includes the use of sawing and coring machinery and servo-hydraulic testing equipment. Use standard safety precautions, equipment, and clothing when handling hot materials and operating machinery.
8. STANDARDIZATIONSTANDARDIZATION
8.1. Items associated with this test that require calibration are included in the documents referenced in AASHTO Section 2.2T 378. Refer to the pertinent section of the referenced documents for information concerning calibration.
8.1.8.2. The guidelines provided in equipment manufacture's manual shall be followed to ensure that all equipment is calibrated properly.
9. PROCEDURE
9.1. Test Specimen Preparation (Rutting Method A):
9.1.1. For rutting Method A, Ttesting shall be performed on 150-mm (6.0-in.) diameter by 60115-mm (64.5-in.) tallhigh testvolumetric specimens fabricated in accordance with T 312. 312 and cut into size.
9.1.1.
9.1.2. Note 1— A target air void content for Method A specimens is 4%±0.5.of 7.0 percent and tolerance of ± 0.5 percent is .Note 1—Cylindrical test specimens of 150-mm diameter by 60-mm tall may be compacted to the size instead of being cut from 150-mm-diameter specimens using T 312.
9.2. Test Specimen Preparation (Rutting Method B):
9.2.1.9.1.3. For rutting Method B, Testing testing shall be performed on 100-mm (4.0-in.) diameter by 150-mm (6.0-in.) tall test specimens fabricated in accordance with R 83 and aged in accordance with R 30. Note 12—Cylindrical test specimens of 100-mm diameter by 150-mm tall may be compacted to the size instead of being cut and cored from 150-mm-diameter specimens using R 83. For this purpose, T 312 procedure may be followed with the exception that 100-mm-diameter SGC mold is used instead of a 150-mm mold. The SGC stress of 600 kPa at 30 gyrations per minute may be utilized to compact the loose mixture to the proper height. The loose mixture weight should be adjusted for the 100-mm mold so that the desired air void is achieved.
9.1.3.1. Note 23— A target air void content of 7.0 percent and tolerance of ± 0.5 percent is selected. for the Method B specimens based on a typical in-place density specification for a project. For typical in-place density specifications a target air void content of 7.0 percent and tolerance of ± 0.5 percent is reasonable.
Test Specimen Preparation (Fatigue):
9.1.4. For fatigue, Ttesting shall be performed on 150-mm (6.0-in.) diameter by 50-mm (2.0-in.) tall high test volumetric specimens fabricated in accordance with T 312 and cut into size. Air void shall be 4%±+-0.5.
Formatted: Heading 3
Formatted: Heading 4

TS-2d TP 116-5 AASHTO
Note 24—Cylindrical test specimens of 150-mm diameter by 50-mm (2.0-in.) tall may be compacted to the size in accordance with T 312 instead of being cut from 150-mm (6.0-in.) diameter specimens using T 312.
9.2.2.9.1.5. Prepare at least three two test specimens at the target air void content and aging condition.
9.2.3. The target air void content should be selected based on the in-place density specification for the project. Note 2—For typical in-place density specifications a target air void content of 7.0 percent and tolerance of ± 0.5 percent is reasonable.
9.2. Test Temperatureture (Rutting):
9.2.1. For rutting, The test temperature is calculated from the Degree-Days (DD) parameter of the construction site using LTPPBind V3.1 software and the following equation:
T = 58 + 7 × DD – 15 × log(H + 45) (1)
where: T = Test Temperature, °C; DD = Degree-Days > 10°C (×1000) from LTPPBind V 3.1; and H = 0 for surface layer, depth to top of layer for lowerbase layer.
Note 45—When the location of the construction is not known, the most reasonable effective temperature for the region may be used. The effective temperatures in the United States generally vary between 50 and 60°C. Therefore, the most reasonable test temperature for a moderate climate is 55°C. However, 50°C for a cold climate and 60°C for a hot climate are more reasonable.
9.2.2. For fatigue, Test Temperature (Fatigue): The test temperature is the intermediate temperature of the mixture.
9.2.2.1. For mixtures with unmodified binder and no additives, the intermediate temperature of the mixture is the same as the intermediate temperature of the binder, determined by R 29.
9.2.2.2. For mixtures with modified binder or with additives such as RAP/ RAS, rejuvenators, etc., the intermediate temperature of the mixture is the intermediate temperature of the extracted binder determined in accordance with R 29.
9.3. Loading Platens and End-Friction Reducers
9.3.1. For rutting Method A, the lower and upper platen shall be 150-mm (6-in) diameter (2.4-in) .
9.3.2. For rutting Method B, the lower and upper platens shall be100-mm (4.0-in) diameter.
9.3.3. For fatigue, the lower platen shall be 150-mm (6-in) diameter and the upper platen shall be 89-mm (2.4-in.) diameter.
9.2.4. For both Method A and Method Ball methods, the top platen shall not be free to rotate.
Formatted: Heading 4

TS-2d TP 116-6 AASHTO
9.3.4.
Prepare one gGreased double latex end-friction reducers for each test specimen using the procedure specified in Annex A of T 378. It is recommended that new friction reducers be used for each test.
9.3.5.
9.2.5.1.1.1. Assemble each specimen to be tested with platens and membrane as follows. Place the specimen on the bottom platen. Stretch the membrane over the specimen and bottom loading platen. Install the lower O-ring seal. Stretch the membrane over the top platen. Install the upper O-ring seal.
9.2.6.1.1.1. Encase the dummy specimen in a membrane.
9.2.7.1.1.1. Place the specimen and platen assembly in the environmental chamber with the dummy specimen, and monitor the temperature of the dummy specimen to determine when testing can begin.
9.2.8.1.1.1. Turn on the Asphalt Mixture Performance Test (AMPT) System, set the temperature control to the desired testing temperature, and allow the testing chamber to equilibrate at the testing temperature for at least one hour.
9.2.9.1.1.1. When the dummy specimen and the testing chamber reach the target temperature, open the testing chamber, remove a test specimen and platen assembly, and quickly place it in the testing chamber. Note 3—When confined tests are performed, the specimen must be vented to atmospheric pressure through the drainage lines. Properly connect the drainage lines to the loading platens, making sure that they are vented to atmospheric pressure through the bubble chamber in order to identify leaks.
9.2.10.1.1.1. Close the testing chamber and allow the chamber temperature to return to testing temperature.
9.2.11.1.1.1. Ensure that steps in Sections 9.1.8 and 9.1.9, including return of the test chamber to the target temperature, shall be completed within 5 minutes.
9.3.1.1. Test Temperature:
9.3.1.1.1.1. The test temperature is calculated from the Degree-Days (DD) parameter of the construction site using LTPPBind V3.1 software and the following equation:
T = 58 + 7 × DD – 15 × log(H + 45) (1)
where: T = Test Temperature, °C; DD = Degree-Days > 10°C (×1000) from LTPPBind V 3.1; and H = 0 for surface layer, depth to top of layer for base layer.
Note 4—When the location of the construction is not known, the most reasonable effective temperature for the region may be used. The effective temperatures in the United States generally vary between 50 and 60°C. Therefore, the most reasonable test temperature for a moderate climate is 55°C. However, 50°C for a cold climate and 60°C for a hot climate are more reasonable.

TS-2d TP 116-7 AASHTO
9.4. Test Description
9.4.1. For the rutting method A test the following levels of variables shall be used:
9.4.1.1. The test is conducted using one increment of 500 cycles.
9.4.1.2. The stress level for the test increment is 600 kPa.
9.4.1.3. The contact stress for each increment is 5 percent of the deviator stress.
9.4.9.4.2. For the rutting mMethod B test,s the following levels of variables shall be used: (Rutting):
9.4.1.9.4.2.1. The test is conducted using one conditioning increment of 500 cycles and three consecutive test increments of increasing deviatoric stress for 500 cycles each.
9.4.2.9.4.2.2. The stress level for the conditioning increment is 200 kPa.
9.4.3.9.4.2.3. The stress levels for testing increments are 400, 600, and 800 kPa.
9.4.4.9.4.2.4. The contact stress for each increment is 5 percent of the deviator stress.
9.4.5.9.4.2.5. The confining pressure of 69 kPa is used throughout the test.
9.4.6.1.1.1.1. Follow the software prompts to begin the test. The Asphalt Mixture Performance Test System will automatically unload when the test is complete.
9.4.7.1.1.1.1. Upon completion of the test, open the test chamber, and remove the tested specimen.
9.4.8.1.1.1.1. Repeat steps in Sections 9.3.6 and 9.3.7 for the remaining test specimens.
9.4.3. For the fatigue test the following levels of variables shall be used:
Test Description (Fatigue):
9.4.3.1. The test is conducted using one conditioning increment of 100 cycles and ten consecutive test increments of increasing deviatoric stress load for 100 cycles each.
9.4.3.2. The load level for the conditioning increment is 3 KN.
9.4.3.3. The load levels for testing increments are 3.5 to 8 KN every 0.5 KN.
9.4.3.4. The contact load for each increment is 5 percent of the deviator load.
9.5. Test Procedure
9.5.1. For rutting Method A , assemble each specimen to be tested with platens and end-friction reducer as follows: place the specimen on the bottom platen. Place the double latex end-friction reducer at center top of the specimen. Place the upper platen on top of the friction reducer membrane.
Formatted: Font: (Default) Times New Roman, 10 pt, NotItalic
Formatted: Heading 3
Formatted: Heading 4

TS-2d TP 116-8 AASHTO
Figure 1- Testing 150-mm cylindrical specimens in accordance with the iRLPD rutting test (Method A) using DTS
9.4.9. For rutting Method B, Assemble assemble each specimen to be tested with platens and membrane as follows. Place the bottom greased double latex friction reducer and the specimen on the bottom platen. Stretch the membrane over the specimen and bottom loading platen. Install the lower O-ring seal. Place the top friction reducer and top platen on top of the specimen. Stretch the membrane over the top platen. Install the upper O-ring seal. Encase the dummy specimen in a membrane as well.
9.5.2.
9.4.10. Encase the dummy specimen in a membrane.
9.4.11. For the fatigue test, assemble the diametral specimen with planes and membranes as follows: Place bottom greased double latex friction reducer and the specimen on the 150-mm (6-in) lower platen. Place the top friction reducer and the 89-mm (3.5-in.) diameter upper platen on top of the specimens.
9.5.3.
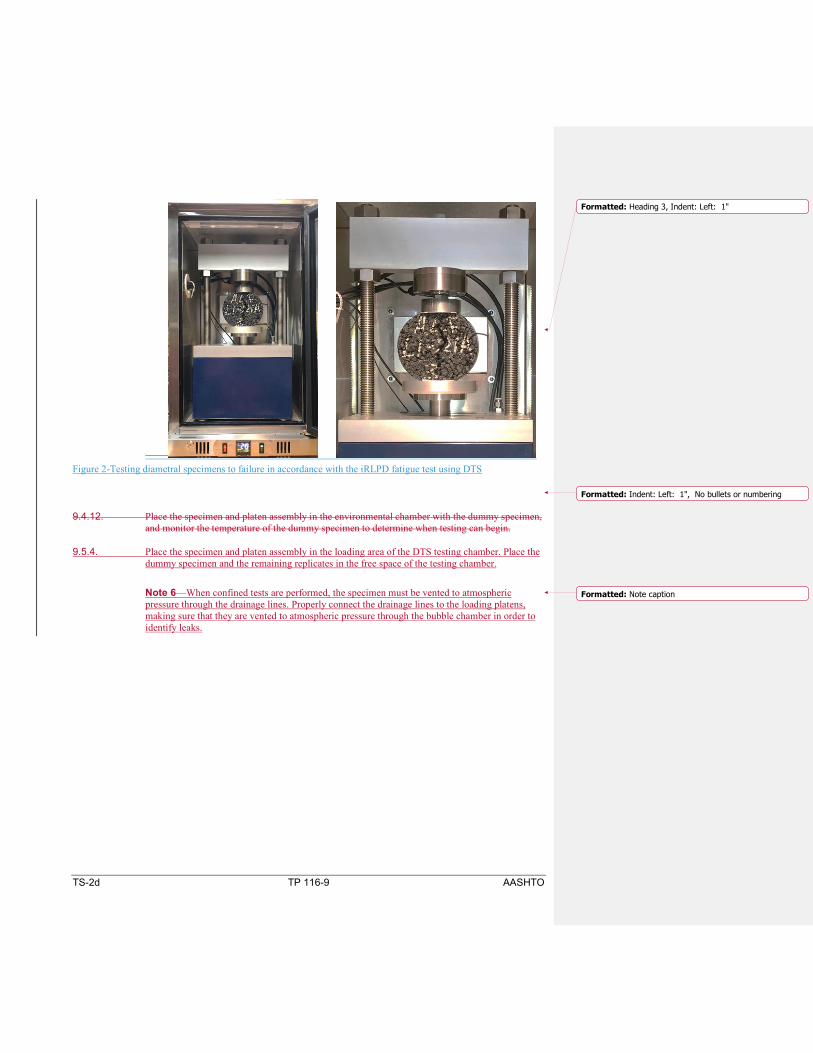
TS-2d TP 116-9 AASHTO
Figure 2-Testing diametral specimens to failure in accordance with the iRLPD fatigue test using DTS
9.4.12. Place the specimen and platen assembly in the environmental chamber with the dummy specimen, and monitor the temperature of the dummy specimen to determine when testing can begin.
9.5.4. Place the specimen and platen assembly in the loading area of the DTS testing chamber. Place the dummy specimen and the remaining replicates in the free space of the testing chamber. Note 6—When confined tests are performed, the specimen must be vented to atmospheric pressure through the drainage lines. Properly connect the drainage lines to the loading platens, making sure that they are vented to atmospheric pressure through the bubble chamber in order to identify leaks.
Formatted: Heading 3, Indent: Left: 1"
Formatted: Indent: Left: 1", No bullets or numbering
Formatted: Note caption

TS-2d TP 116-10 AASHTO
Figure 3- Testing chamber for holding test specimen, the second replicate, and the dummy specimen
9.4.13. Turn on the Asphalt Mixture Performance TestDTS (AMPT) System, set the temperature control to the desired testing temperature, and allow the testing chamber to equilibrate at the testing temperature. for at least one hour. Mmonitor the temperature of the dummy specimen to determine when testing can begin.
9.4.14. When the dummy specimen and the testing chamber reach the target temperature, open the testing chamber, remove a test specimen and platen assembly, and quickly place it in the testing chamber.
9.5.5. Note 3—When confined tests are performed, the specimen must be vented to atmospheric pressure through the drainage lines. Properly connect the drainage lines to the loading platens, making sure that they are vented to atmospheric pressure through the bubble chamber in order to identify leaks.
9.4.15. Close the testing chamber and allow the chamber temperature to return to testing temperature.
9.4.16. Ensure that steps in Sections 9.1.8 and 9.1.9, including return of the test chamber to the target temperature, shall be completed within 5 minutes.
9.5.6. Enter the required identification and control information into the software.
9.5.7. When the dummy specimen reaches the target temperature, follow the software prompts to begin the test.
9.5.8. DTS will automatically unload when the test is complete.
9.5.9. Upon completion of the test, open the test chamber, remove the tested specimen, and place the next specimen in the loading area.
9.5.10. Repeat steps in Sections 9.5.7 and 9.5.10 for testing the remaining specimens.
Formatted: No bullets or numbering
Formatted: Indent: Left: 0", Hanging: 1", No bullets ornumbering
Formatted: Indent: Left: -1"
Formatted: Heading 3
Formatted: Normal
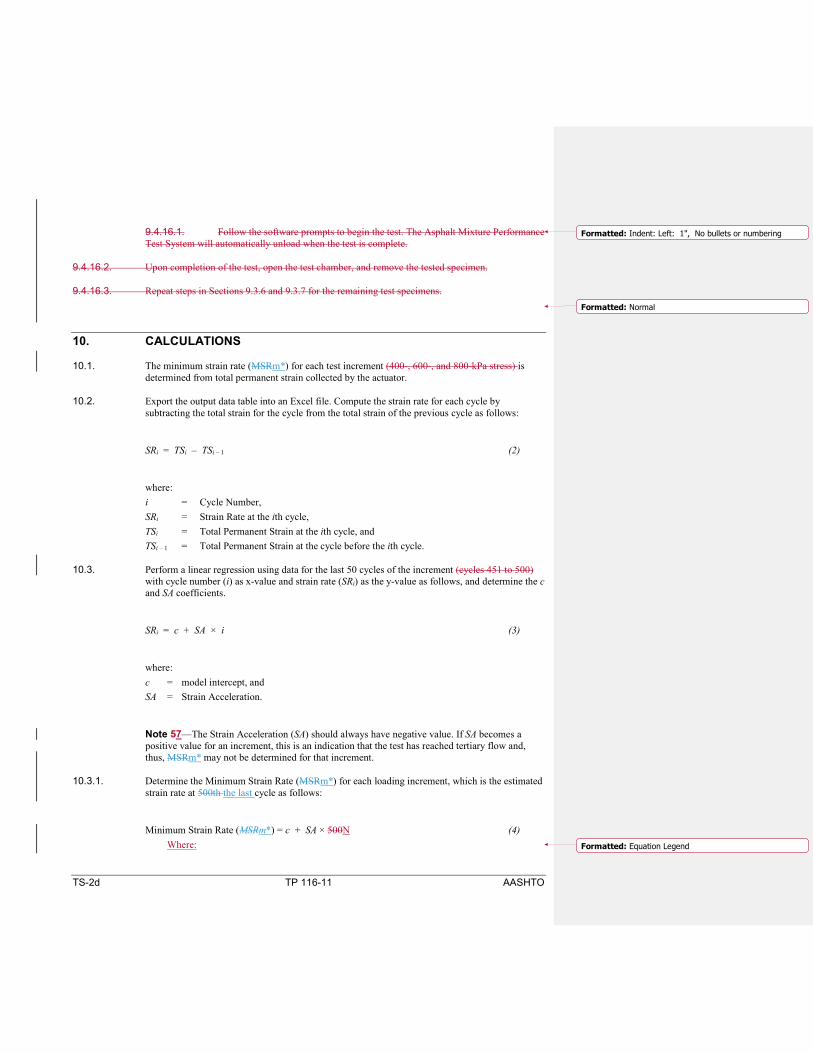
TS-2d TP 116-11 AASHTO
9.4.16.1. Follow the software prompts to begin the test. The Asphalt Mixture Performance Test System will automatically unload when the test is complete.
9.4.16.2. Upon completion of the test, open the test chamber, and remove the tested specimen.
9.4.16.3. Repeat steps in Sections 9.3.6 and 9.3.7 for the remaining test specimens.
10. CALCULATIONS
10.1. The minimum strain rate (MSRm*) for each test increment (400-, 600-, and 800-kPa stress) is determined from total permanent strain collected by the actuator.
10.2. Export the output data table into an Excel file. Compute the strain rate for each cycle by subtracting the total strain for the cycle from the total strain of the previous cycle as follows:
SRi = TSi – TSi – 1 (2)
where: i = Cycle Number, SRi = Strain Rate at the ith cycle, TSi = Total Permanent Strain at the ith cycle, and TSi – 1 = Total Permanent Strain at the cycle before the ith cycle.
10.3. Perform a linear regression using data for the last 50 cycles of the increment (cycles 451 to 500) with cycle number (i) as x-value and strain rate (SRi) as the y-value as follows, and determine the c and SA coefficients.
SRi = c + SA × i (3)
where: c = model intercept, and SA = Strain Acceleration.
Note 57—The Strain Acceleration (SA) should always have negative value. If SA becomes a positive value for an increment, this is an indication that the test has reached tertiary flow and, thus, MSRm* may not be determined for that increment.
10.3.1. Determine the Minimum Strain Rate (MSRm*) for each loading increment, which is the estimated strain rate at 500th the last cycle as follows:
Minimum Strain Rate (MSRm*) = c + SA × 500N (4) Where:
Formatted: Indent: Left: 1", No bullets or numbering
Formatted: Normal
Formatted: Equation Legend

TS-2d TP 116-12 AASHTO
N= Total number of cycles in one increment (500 for rutting and 100 for fatigue)
10.3.2. For the rutting calculations:
10.3.2.10.3.2.1. The graph of MSRm* versus Test Temperature (T) × Deviator Stress (P) for three increments is called the MSRm* master curve. The equation is as follows:
MSRm* = a x (T × P)b (5)
where: T = Test temperature, °C; P = Deviator stress, MPa; and a, b = Model coefficients.
Note 68—The MSRm* master curve explains the permanent deformation at any temperature and stress level.
10.3.2.2. The b coefficient may be estimated using the MSRm* at 600 kPa (MSRm*600) and assuming value of 0.001 for the “a” coefficient as follows:
𝑚𝑚600∗ = 0.001 �
𝑇𝑇 × 6001000
�𝑏𝑏
6006000.001
1000
bTMSR × =
(6)
𝑏𝑏 =log(𝑚𝑚600
∗ × 1000)log(0.6 × 𝑇𝑇)
Formatted: Heading 4
Formatted: Normal

TS-2d TP 116-13 AASHTO
( )( )
600log 1000
log 0.6
MSRb
T
×=
×
(7) Note 79—Note 7—The “b” coefficient is open ended but usually ranges between 2.0 and 3.0 and can be used for ranking of mixtures. A b value of 2.0 is an indication of a very stiff material and a b value of 3.0 is an indication of a very soft material.
10.3.2.3. Determine the high-temperature PG of the mixture using the "b" coefficient as follows:
PG = -42.345 x b + 174.14 (8)
10.3.2.4. The mixture PG determined using Equation 8 is compatible with the binder high-temperature PG in M 320. can be compared with the requiredUse PG values in Table 1 to determine if the mixture PG is suitable for the intended traffic level and environment similar to M 332. For example, if the continuous PG determined from equation 8 is 73, then the environment PG with traffic is either 70S, 64H, 58V, or 52E. In Table 1, the environment PG is 98% reliability PG without grade bumping from LTPPBind V. 3.1
The allowable traffic level at a certain effective temperature may be determined from MSRm* at 600 kPa (MSRm*600) calculated from the test data or the master curve. Use Equation 9 or Table 1 to determine the allowable traffic.
Note 810— To ensure durability of the mixture, it is recommended that the required PG in Table 1 does not exceed PG of the next traffic level or environment. For example, for PG 58 environment and heavy traffic (cell 58H), the required PG is 67 but not to exceed 73.
Formatted: Normal
Formatted: Ital
Formatted: Heading 4
Formatted: Normal

TS-2d TP 116-14 AASHTO
log(ESAL) = 1.7 – 0.07 × MSRm*600 (8) ( )6001.7 0.0710 MSRESAL − ×= (9)
where: ESAL = Allowable ESAL, millions; and MSRm*600 = Minimum Strain Rate at 600 kPa and effective temperature. Table 1— Required PG of the mixtures for Rutting (based on the Design traffic level and the Environment 98% reliability High temperature PG from LTPPBind V3.1)
Traffic Level Design ESAL (million)
Environment PG (LTPPBind 98% reliability PG no Bump)
PG 52 PG 58 PG64 PG 70
Standard (S) >1 to 3 52 58 64 70
Heavy (H) >3 to 10 62 67 71 76
Very Heavy (V) >10 to 30 69 73 77 81
Extreme (E) >30 71 75 79 83
Table 1—Maximum MSRm* Value by Traffic Level
Traffic Level Design ESALs (million) Maximum
MSRm* Value Light ≤1 24 Standard >1 to 3 17 Heavy >3 to 10 10 Very Heavy >10 to 30 3 Extreme >30 1
10.3.3. Note 8—If the test is not conducted at the effective temperature of the site, then MSRm* for this temperature must be determined using the MSRm* master curve equation.For the fatigue calculations:
10.3.3.1. The MSRm* of the increment before the increment in which tertiary flow occurs is the measure of fatigue resistance and referred to as fatigue index (FI). Figure 4 shows an example of FI determinations for three ALF mixtures. Lane 1 is the control section with the highest FI (37). Lane 5 with 50% RAP has FI of 20 and FI for lane 3 with 20% RAS has the lowest FI ofis 19.
Formatted: Table Placeholder
Formatted: Font: (Default) +Headings CS (Times NewRoman), 10 pt
Formatted: Centered
Formatted: Font: (Default) +Headings CS (Times NewRoman), 10 pt
Formatted: Centered
Formatted: Font: (Default) +Headings CS (Times NewRoman), 10 pt
Formatted: Centered
Formatted: Font: (Default) +Headings CS (Times NewRoman), 10 pt
Formatted: Centered
Formatted: Font: (Default) +Headings CS (Times NewRoman), 10 pt
Formatted: Centered
Formatted: Heading 4
Formatted: Font: Italic

TS-2d TP 116-15 AASHTO
Figure 4 – Example of Fatigue Index (FI) determination using m*
11. REPORTING
11.1. Report the following:
11.1.1. iRLPD test type: rutting (Method A or Method B) or fatigue.
Rutting test method: Method A or Method B.
11.1.1.11.1.2. Test temperature for each increment.
11.1.2.11.1.3. Average applied deviator stress load for each test increment.
11.1.3.11.1.4. Average applied confining pressure for Method B.
11.1.4.11.1.5. Minimum Strain Rate (MSRm*) for each increment.
11.1.6. For the rutting test:
11.1.6.1. "b" power coefficient of the MSRm* master curve.
11.1.5. Mixture high-temperature continuous PG
11.1.6.2. Estimated Estimated Allowable ESALMixture environment PG with traffic level (from Table 1)
11.1.6.11.1.7. Fatigue index (highest m* from the fatigue test)for the test temperature.
11.1.7.11.1.8. iRLPD software summary report for each specimen tested.
Lane 1 Control PG64-22
Lane 3 20% RAS
Lane 5 40% RAP
Strain rate
Number of Cycles
iRLPD Fatigue Index for ALF Fatigue Study Formatted: Normal, Centered
Formatted: Font: Italic
Formatted: Font: Italic
Formatted: Heading 4

TS-2d TP 116-16 AASHTO
12. KEYWORDS
12.1. Asphalt mixture rutting test; incremental Repeated Load Permanent Deformation; iRLPD; Minimum Strain Rate; MSRm*.
13. REFERENCES
13.1. LTPPBind V 3.1, Developed by Pavement Systems LLC (PaveSys) LTPPBind.com
13.2. Mohseni, A., and H. Azari. Effective Temperature for Permanent Deformation Testing of Asphalt Mixtures. In ISAP 2014. International Society for Asphalt Pavements, Lino Lakes, MN, 2014.
13.3. Equipment Specification for the Simple Performance Test System, Version 3.0. Prepared for National Cooperative Highway Research Program (NCHRP), October 16, 2007.
13.4. Azari, H., and M. Mohseni. Incremental Repeated Load Permanent Deformation Testing of Asphalt Mixtures. TRB No. 12-4381. Transportation Research Board, Washington, DC, 2012.
13.5. Azari, H., and M. Mohseni. Permanent Deformation Characterization of Asphalt Mixtures using Incremental Repeated Load Testing. In Asphalt Materials and Mixtures, Vol. 4. Transportation Research Board, Washington, DC, 2013.
13.6. Azari, H., and M. Mohseni. Effect of Short-Term Conditioning and Long-Term Aging on Permanent Deformation Characteristics of Asphalt Mixtures. In AAPT Journal, Vol. 82. Association of Asphalt Pavement Technologists, Lino Lakes, MN, 2013.
13.6.13.7. Mohseni, A., and H. Azari. High-Temperature Characterization of Highly Modified Asphalt Binders and Mixtures. Transportation Research Record: Journal of the Transportation Research Board, Issue 2444, pp 38–51 2014.
1 This provisional standard was first published in 2015.Figure 2-Testing diametral specimens to failure in accordance with the iRLPD fatigue test using DTS Figure 1- Testing 150-mm cylindrical specimens in accordance with the iRLPD rutting test ( Method A) using DTS Figure 2- Test chamber for holding test specimen, the second replicate, and the dummy specimen

02-15-19
Changes to AASHTO TP 124-18
• Changed title to “Illinois Flexibility Index Test” • Replaced All references to “FIT” with “I-FIT” • Added AASHTO R30 as a referenced document (for LTA of I-FIT specimens) • Replaced Figure 1 (I-FIT Specimen Configuration) to show changing the Notch Width from 1.5 ±
0.5mm to ≤ 2.25 mm • Section 9.1.1, Note 4 – Clarification of Specimen Preparation • Section 9.3 – Added Note 6 to use AASHTO R30 when Long-Term Aging is done on I-FIT
specimens • Note 6 & 7 – Renumbered • Section 14.2 & 14.3 – Precision Statement added • Section 14.4 – Revised to explain no Bias information being provided

Standard Method of Test for
Determining the Fracture Potential of Asphalt Mixtures Using the Illinois Flexibility Index Test (I-FIT)
AASHTO Designation: TP 124-181
Technical Section: 2d, Bituminous Materials
Release: Group 3 (August)
American Association of State Highway and Transportation Officials 444 North Capitol Street N.W., Suite 249 Washington, D.C. 20001
TS-2d TP 124-1 AASHTO
Standard Method of Test for
Determining the Fracture Potential of Asphalt Mixtures Using the Illinois Flexibility Index Test (I-FIT)
AASHTO Designation: TP 124-181 Technical Section: 2d, Bituminous Materials
Release: Group 3 (August)
1. SCOPE
1.1. This test method covers the determination of Mode I (tensile opening mode during crack propagation) cracking resistance properties of asphalt mixtures at intermediate test temperatures. Specimens are tested in the semicircular bend geometry, which is a half disc with a notch parallel to the direction of load application. The data analysis procedure associated with this test determines the fracture energy (Gf) and post peak slope (m) of the load–load line displacement (LLD) curve. These parameters are used to develop a Flexibility Index (FI) to predict the fracture resistance of an asphalt mixture at intermediate temperatures. The FI can be used as part of the asphalt mixture approval process.
1.2. These procedures apply to test specimens having a nominal maximum aggregate size (NMAS) of 19 mm or less. Lab compacted and pavement core specimens can be tested according to this test procedure. A thickness correction factor will need to be developed and applied for pavement cores tested at a thickness less than 45 mm.
1.3. This standard does not purport to address all of the safety concerns, if any, associated with its use. It is the responsibility of the user of this standard to establish and follow appropriate health and safety practices and determine the applicability of regulatory limitations prior to use.
2. REFERENCED DOCUMENTS
2.1. AASHTO Standards: R 30, Mixture Conditioning of Hot Mix Asphalt (HMA) R 67, Sampling Asphalt Mixtures after Compaction (Obtaining Cores) T 166, Bulk Specific Gravity (Gmb) of Compacted Hot Mix Asphalt (HMA) Using Saturated
Surface-Dry Specimens T 209, Theoretical Maximum Specific Gravity (Gmm) and Density of Hot Mix Asphalt (HMA) T 269, Percent Air Voids in Compacted Dense and Open Asphalt Mixtures T 283, Resistance of Compacted Asphalt Mixtures to Moisture-Induced Damage T 312, Preparing and Determining the Density of Asphalt Mixture Specimens by Means of the
Superpave Gyratory Compactor TP 105, Determining the Fracture Energy of Asphalt Mixtures using Semicircular Bend
Geometry (SCB)

TS-2d TP 124-2 AASHTO
2.2. ASTM Standards: D8, Standard Terminology Relating to Materials for Roads and Pavements D3549/D3549M, Standard Test Method for Thickness or Height of Compacted Bituminous
Paving Mixture Specimens
2.3. Other Publications: Al-Qadi, I. L., H. Ozer, J. Lambros, A. El Khatib, P. Singhvi, T. Khan, and B. Doll. 2015.
Testing Protocols to Ensure Performance of High Asphalt Binder Replacement Mixes Using RAP and RAS, FHWA ICT-15-07. Illinois Center for Transportation, Rantoul, IL.
Doll. B., H. Ozer, J. Rivera-Perez, J. Lambros, and I. L. Al-Qadi. 2016. Investigation of Viscoelastic Fracture Fields in Asphalt Mixtures using Digital Image Correlation. International Journal of Fracture, Vol. 205, No. 1, pp. 37–56.
Ozer, H., I. L. Al-Qadi, J. Lambros, A. El-Khatib, P. Singhvi, and B. Doll. 2016a. Development of the Fracture-Based Flexibility Index for Asphalt Concrete Cracking Potential Using Modified Semi-Circle Bending Test Parameters. Construction and Building Materials, Vol. 115, pp. 390–401.
Ozer, H., and P. Singhvi, T. Khan, J. Rivera, I. L. Al-Qadi. 2016b. Fracture Characterization of Asphalt Mixtures with RAP and RAS Using the Illinois Semi-Circular Bending Test Method and Flexibility Index. Transportation Research Record, Transportation Research Board, National Research Council, Washington, DC, Vol. 2575, pp. 130–137.
Ozer, H., I. L. Al-Qadi, P. Singhvi, J. Bausano, R. Carvalho, X. Li, and N. Gibson. 2017. Assessment of Asphalt Mixture Performance Tests to Predict Fatigue Cracking in an Accelerated Pavement Testing Trial. International Journal of Pavement Engineering, Special Issue for Cracking in Flexible Pavements and Asphalt Mixtures: Theories to Modeling, and Testing to Mitigation.
RILEM Technical Committee 50-FMC. 1985. “Determination of the Fracture Energy of Mortar and Concrete by Means of Three-Point Bend Tests on Notched Beams.” Materials and Structures, Springer Netherlands for International Union of Laboratories and Experts in Construction Materials, Systems and Structures (RILEM), Dordrecht, The Netherlands, No. 106, July–August 1985, pp. 285–290.
3. TERMINOLOGY
3.1. Definitions:
3.1.1. critical displacement, u1—displacement at the intersection of the post-peak slope with the displacement-axis.
3.1.2. displacement at peak load, u0—recorded displacement at peak load.
3.1.3. final displacement, ufinal—recorded displacement at the 0.1 kN cut-off load.
3.1.4. flexibility index, FI—index intended to characterize the cracking resistance of asphalt mixture, calculated by multiplying the ratio of fracture energy to post-peak slope by a constant multiplier.
3.1.5. fracture energy, Gf—energy required to create a unit surface area of a crack.
3.1.6. ligament area, Arealig—cross-sectional area of specimen through which the crack propagates, calculated by multiplying ligament width (test specimen thickness) and ligament length.
3.1.7. linear variable displacement transducer (LVDT)—sensor device for measuring linear displacement.

TS-2d TP 124-3 AASHTO
3.1.8. load line displacement (LLD)—displacement measured in the direction of the load application.
3.1.9. post-peak slope, m—slope at the first inflection point of the load–LLD curve after the peak.
3.1.10. semicircular bend (SCB) geometry—a half disc with a notch parallel to the direction of load application.
3.1.11. work of fracture (Wf)—calculated as the area under the load–LLD curve.
4. SUMMARY OF METHOD
4.1. A Superpave Gyratory Compactor (SGC) compacted asphalt mixture specimen or an asphalt pavement core is trimmed and cut in half to create a semicircular test specimen. A notch is sawn in the flat side of the semicircular specimen opposite the curved edge. The specimen is conditioned and maintained through testing at 25 ± 0.5°C. The specimen is positioned in the fixture with the notched side down centered on two rollers. A load is applied along the vertical radius of the specimen and the load and load line displacement (LLD) are measured during the entire duration of the test. The load is applied such that a constant LLD rate of 50 mm/min is obtained and maintained for the duration of the test. The I-FIT fixture and I-FIT specimen geometry for an SGC laboratory compacted specimen are shown in Figure 1.
4.2. Fracture energy (Gf), post-peak slope (m), displacement at peak load (u0), critical displacement (u1), and a flexibility index (FI) are calculated from the load and LLD results.

TS-2d TP 124-4 AASHTO
Figure 1—I-FIT SGC Laboratory Compacted Specimen Configuration (dimensions in millimeters)
5. SIGNIFICANCE AND USE
5.1. The I-FIT is used to determine fracture resistance parameters of an asphalt mixture at an intermediate temperature (Al-Qadi et al. (2015), Ozer et al. (2016a), Ozer et al. (2016b)). From the fracture parameters of Gf and m obtained, the FI of an asphalt mixture is calculated. The FI provides a means to identify brittle mixtures that may be prone to premature cracking. The range for an acceptable FI will vary according to local environmental conditions, application of mixture, nominal maximum aggregate size (NMAS), asphalt binder content, asphalt binder performance grade (PG), air voids, and expectation of service life, etc. (Al-Qadi et al. (2015), Ozer et al. (2016a), Ozer et al. (2016b), Ozer et al. (2017)).

TS-2d TP 124-5 AASHTO
5.2. The calculated FI indicates an asphalt mixture’s overall capacity to resist cracking related damage (Al-Qadi et al. (2015)). Generally, a mixture with higher FI can resist crack propagation for longer time duration under tensile stress. The FI should not be directly used in structural design and analysis of pavements. FI values, obtained using this procedure, are used in ranking the cracking resistance of alternative mixtures for a given layer in a structural design. The Gf parameter is dependent on specimen size, loading time, and is temperature dependent. Fracture mechanisms for viscoelastic materials are influenced by crack front viscoelasticity and bulk material (far from the crack front) viscoelasticity. Total calculated Gf from this test includes the amount of energy dissipated by crack propagation, viscoelastic mechanisms away from the crack front, and other inelastic irreversible processes (frictional and damage processes at the loading support points) (Doll et al., 2016).
5.3. Gf is one of the parameters used to calculate the FI, which is further used to predict AC mixture fracture potential. It also represents the main parameter input in more complex analyses based on a theoretical crack (cohesive zone) model. In order to be used as part of a cohesive zone model, fracture energy as calculated from the experiment shall be corrected to determine energy associated with crack propagation only. A correction factor may be used to eliminate other sources of inelastic energy contributing to the total fracture energy calculated directly from the experiment.
5.4. This test method and FI can be used to rank the cracking resistance of asphalt mixtures containing various asphalt binders, modifiers of asphalt binders, aggregate blends, fibers, and recycled materials.
5.5. The specimens can be readily obtained from SGC compacted cylinders or from pavement cores with a diameter of 150 mm.
6. APPARATUS
6.1. Testing Machine—An I- FIT system consists of a closed-loop axial loading device, a load measuring device, a bend test fixture, specimen deformation measurement devices, and a control and data acquisition system. A constant displacement-rate device, such as a closed loop, feedback-controlled servo-hydraulic load frame, shall be used. Note 1—An electromechanical, screw-driven machine may be used if results are comparable to a closed loop, feedback-controlled servo-hydraulic load frame.
6.1.1. Axial Loading Device—The loading device shall be capable of delivering loads in compression with a maximum resolution of 10 N and a capacity of at least 10 kN.
6.1.2. Bend Test Fixture—The fixture is composed of a loading head, a steel base plate, and two steel rollers with a nominal diameter (D) of 25 mm. The tip of the loading head has a contact curvature with a radius of 12.5 ± 0.05 mm. The horizontal loading head shall pivot relative to the vertical loading axis to conform to slight specimen variations. The length of the two roller supports in Figure 2 and Figure 3 shall be a minimum of 65 mm. Illustrations of the loading and supports are shown in Figures 2 and 3.
6.1.2.1. Method A—Typically two steel rollers with a nominal diameter of 25 mm are mounted on bearings through their axis of rotation and attached to the steel base plate with brackets. One of the steel rollers may pivot on an axis perpendicular to the axis of loading to conform to slight specimen variations. A distance of 120 ± 0.1 mm between the two steel rollers is maintained throughout the test.
6.1.2.2. Method B—An alternate fixture design uses two steel rollers with a nominal diameter of 25 mm that each rotate in a U-shaped roller support steel block. The initial roller position is fixed by
TS-2d TP 124-6 AASHTO
springs and backstops that establish the initial test span dimension of 120 ± 0.1 mm. The support rollers are allowed to rotate away from the backstops during the test; but remain in contact with the sample.
6.1.3. Internal Displacement Measuring Device—The displacement measurement can be performed using the machine’s stroke (position) transducer if the resolution of the stroke is sufficient (0.01 mm or lower). The fracture test displacement data may be corrected for system compliance, loading-pin penetration and specimen compression by performing a calibration of the testing system.
6.1.4. External Displacement Measuring Device—If an internal displacement measuring device does not exist or has insufficient precision, an externally applied displacement measurement device such as a linear variable differential transducer (LVDT) accurate to 0.01 mm can be used (Figure 2 and Figure 3).
6.1.5. Control and Data Acquisition System—Time and load, and LLD (using external and/or internal displacement measurement device) are recorded. The control data acquisition system is required to apply a constant LLD rate at a precision of 50 ± 1 mm/min and collect data at a minimum sampling frequency of 20 Hz in order to obtain a smooth load–LLD curve. Note 2—The use of two LLD transducers 180 degrees from one another and on each side of a test specimen may be used. In this approach, an average LLD value is computed to control the test. Controlling the test using an average LLD value may reduce test variability.
6.1.6. Saw—Laboratory saw capable of cutting asphalt specimens; must be capable of cutting the notch described in Figure 1.
6.1.7. Conditioning Chamber—Water bath or environmental chamber capable of maintaining specimen temperature as described in Section 10.1.
6.1.8. Measuring Device—Caliper or ruler accurate to ±0.1 mm for specimen thickness and area measurement.
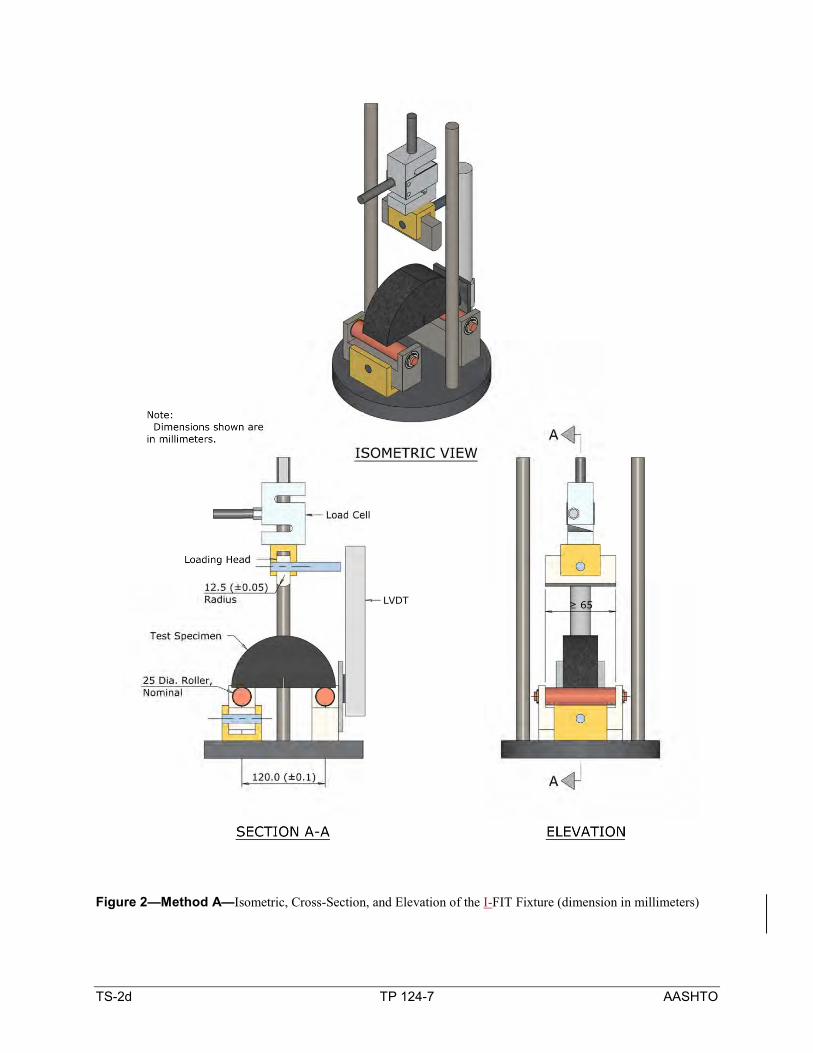
TS-2d TP 124-7 AASHTO
Figure 2—Method A—Isometric, Cross-Section, and Elevation of the I-FIT Fixture (dimension in millimeters)

TS-2d TP 124-8 AASHTO
Figure 3—Method B—Isometric, Cross-Section, and Elevation of the I-FIT Fixture (dimension in millimeters)

TS-2d TP 124-9 AASHTO
7. HAZARDS
7.1. Standard laboratory caution should be used in handling, compacting, and fabricating asphalt mixtures test specimens in accordance with T 312 and when using a saw for cutting specimens.
8. CALIBRATION AND STANDARDIZATION
8.1. A water bath as used in AASHTO T 283 or an environmental chamber will be used to maintain the specimen at a constant and uniform temperature.
8.2. Verify the calibration of all measurement components (such as load cells and LVDTs) of the testing system.
8.3. If any of the verifications yield data that does not comply with the accuracy specified, correct the problem prior to proceeding with testing. Appropriate action may include maintenance of system components, calibration of system components (using an independent calibration agency, service by the manufacturer, or in-house resources), or replacement of the system components.
9. PREPARATION OF TEST SPECIMENS AND PRELIMINARY DETERMINATIONS
9.1. Test Specimen Size—For mixtures with a NMAS of 19 mm or less, prepare the test specimens from a lab compacted SGC specimen or from pavement cores. If laboratory compacted SGC specimens are used, the final I-FIT specimens shall have smooth parallel faces with a thickness of 50 ± 1 mm and a diameter of 150 ± 1 mm (see Figure 4). If pavement cores are used, refer to Figure 1 for the notch width and notch length dimensions and tolerances. The final pavement core I-FIT specimen dimensions shall be 150 ± 8 mm in diameter with smooth parallel faces 25 to 50 ± 1 mm thick depending on available field layer thickness. Note 3—A typical laboratory saw for mixture specimen preparation can be used to obtain cylindrical discs with smooth parallel surfaces. A tile saw is recommended for cutting the 15 ± 1 mm notch in the individual I-FIT specimens. Diamond-impregnated cutting faces and water cooling are recommended to minimize damage to the specimen. When cutting the I-FIT specimens into semi-circular halves, it is recommended not to push the two halves against each other because it may create an uneven base surface of the test specimen that can affect the I-FIT results.
9.1.1. SGC Specimens—Prepare one laboratory SGC specimen according to T 312 in the SGC with the compaction height a minimum of 160 mm ± 1 mm. From the middle of each 160 mm ± 1 mm tall specimen, obtain two cylindrical 50 ± 1 mm thick discs with smooth, parallel faces by saw cutting (see Figure 4). For laboratory compacted specimens, the air voids shall be determined for each of the two circular discs according to T 269. The air voids for each disc shall be 7.0 ± 1.0 percent. Cut each disc into two identical halves resulting in four individual I-FIT specimens. A minimum of three individual test specimens are required for one I-FIT result. Note 4— The height of the gyratory compacted bricks should be 160 ± 1 mm to achieve a target 7.0 ± 1.0% air voids in each individual semi-circular test specimen (see Figure 4). If a lab does not have the capability to compact 160 ± 1 mm tall gyratory bricks, then two 115 ± 1 mm tall gyratory bricks may be compacted and used instead to replace each 160 ± 1 mm tall gyratory brick. It is suggested that the height of the gyratory compacted specimens should be a minimum 160 ± 1 mm height to achieve the target 7.0 ± 1.0 percent air voids in each of the top and bottom discs (see Figure 4). If target air voids cannot be achieved for each disc with 160 ± 1 mm height of the compacted specimens, then the specimen height can be increased. If specimen height cannot be increased or if a SGC has difficulty in compacting 160 ± 1 mm tall specimens, then two SGC specimens, each at least 115 ± 1 mm tall, may be compacted and used instead. A 50 ± 1 mm thick disc will be cut from the middle of each gyratory specimen, which will result in four individual I-FIT specimens (see Figure 4).

TS-2d TP 124-10 AASHTO
OR
Figure 4—Specimen preparation from 160 mm or 115 mm Tall SGC specimens
9.1.2. Pavement Cores—Obtain pavement cores in accordance with R 67. Obtain one 150 mm diameter pavement core if the lift thickness is greater than or equal to 100 mm, or two 150 mm diameter pavement cores if the lift thickness is less than 100 mm.
9.1.2.1. Pavement Core Specimen Preparation—Prepare four replicate I-FIT specimens using pavement cores obtained from a pavement lift, with smooth, parallel surfaces that conform to the height and diameter requirements specified herein. To preserve and maximize core thickness, the as-compacted face shall be utilized as well as a sawed face. The thickness of test specimens in most cases for pavement cores may vary from 25 to 50 ± 1 mm. If the lift thickness is less than 50 ± 1 mm, test specimens should be prepared as thick as possible but in no case be less than two times the nominal maximum aggregate size of the mixture or 25 ± 1 mm, whichever is greater. If lift thickness is greater than 50 ± 1 mm, a 50 ± 1 mm disc shall be prepared as specified in Section 9.1. Cores from pavements with lifts greater than 75 ± 1 mm may be cut to provide two cylindrical specimens of equal thickness. In the upper-most pavement layer when cored, the as-compacted face will remain intact and one cut will be made to produce a disc at least two times the nominal maximum aggregate size of the mixture or 25 ± 1 mm, whichever is greater. In all subsequent discs cut from that pavement core, two sawed faces may be used to produce smooth, parallel surfaces. The air void contents of each disc shall be determined according to T 269. Pavement cores will not be subject to air void content tolerances. Cut each cylindrical specimen exactly in half to produce two identical, semicircular specimens. Each disc of the pavement core shall have parallel smooth faces.
9.2. Determining the Bulk Specific Gravity—Determine the bulk specific gravity directly on the discs obtained from SGC specimens or pavement cores according to T 166.
9.3. Notch Cutting—Cut a notch along the axis of symmetry of each individual semicircular specimen to a depth of 15 ± 1 mm and ≤ 2.25 1.5 ± 0.5 mm in width (see Figure 1).

TS-2d TP 124-11 AASHTO
Note 5—If the notch terminates in an aggregate particle 9.5 mm or larger on both faces of the specimen, the specimen shall be discarded.
9.4. Determining Specimen Dimensions—Measure the notch depth on both faces of the specimen and record the average value to the nearest 0.5 mm. Measure and record the ligament length (see Figure 1) and thickness of each specimen. The ligament length may be measured directly on both faces of the specimen with the average value recorded, or the ligament length may be measured indirectly by subtracting the notch depth from the entire width (radius) of the specimen on both faces of the specimen and averaging the two measurements. Measure the specimen thickness approximately 19.0 mm on either side of the notch and on the curved edge directly across from the notch. Average the three measurements and record as the average thickness to the nearest 0.1 mm. Note 6-If testing for the effects of long-term aging (LTA) is to be conducted, the procedure specified in AASHTO R30 should be used.
10. TEST PROCEDURE
10.1. Conditioning—Test specimens shall be conditioned in a water bath or an environmental chamber at 25 ± 0.5 °C for 2 h ± 10 min.
10.1.1. Test Temperature Control—Immediately after removing the test specimen from the conditioning water bath or environmental chamber, complete positioning and testing of the I-FIT specimen within 5 ± 1 min to ensure that the specimen temperature is maintained.
10.2. Position Specimen—Position the test specimen in the test fixture on the rollers so that it is centered in both the “x” and the “y” directions and so that the vertical axis of loading is aligned to pass from the center of the top radius of the specimen through the middle of the notch.
10.3. Contact Load—First, impose a contact load of 0.1 ± 0.01 kN in stroke control with a loading rate of 0.05 kN/s.
10.3.1. Record Contact Load—Record the contact load to ensure it is achieved.
10.3.2. Loading—After the contact load of 0.1 kN is reached, the test is conducted using LLD control at a rate of 50 mm/min. The test stops when the load drops below 0.1 kN.
10.3.3. Repeat Sections 10.1 through 10.3.2 for each test specimen.
11. PARAMETERS
11.1. Determining Work of Fracture (Wf)—The work of fracture is calculated as the area under the load–LLD curve (see Figure 5). If the test is stopped prior to reaching 0.1 kN, the remainder of the load–LLD curve should be produced by extrapolation techniques. The area under the load–LLD curve is calculated using a numerical integration technique. In order to apply the numerical integration, raw load-displacement data shall be divided into two curves described by an appropriate fitting equation. A polynomial equation with a degree of six is sufficient for the curve prior to peak load (Equation 1). An exponential-based function (Equation 2) is used for the post-peak load portion of the curve. Then, analytical integration shall be applied to calculate the area under each curve (Equation 3). For displacements (u) prior to the peak load (Pmax):

TS-2d TP 124-12 AASHTO
6 5 4 3 2 11 1 2 3 4 5 6 7( )P u c u c u c u c u c u c u c= × + × + × + × + × + × + (1)
where: ci = polynomial coefficients. For displacements (u) after the peak load (Pmax) to the cut-off displacement (ufinal):
d
4
2
2( ) exp
n ii
i i
u eP u d
f
= −= −∑
(2)
where: d, e, f = polynomial coefficients, n is the number of exponential terms. Work of fracture can be analytically or numerically calculated using the integral equation below and boundaries of displacement:
( ) ( )0 final
0
1 20
u u
fu
W P u du P u du= +∫ ∫ (3)
where: u0 = displacement at the peak load; ufinal = displacement at the 0.1 kN cut-off load. Note 67—Due to the relative difference between the compliance of testing frame and specimen, displacement recorded may vary. A correction factor may need to be considered to correct recorded displacements when applicable.
Figure 5—Recorded Load (P)–Load Line Displacement (u) Curve
11.2. Fracture Energy (Gf)—The fracture energy Gf, determined as per the RILEM TC 50-FMC (1985) approach, is calculated by dividing the work of fracture (the area under the load–LLD curve; see Figure 5) by the ligament area (the product of the ligament length and the thickness of the specimen) of the I-FIT specimen prior to testing:
Peak Load
Slope at Inflection Point ( m)
CriticalDisplacement(u1)
Final Displacement(ufinal)
Displacement, u (mm)
Load
,P (k
N)
0 1 2 3 4 5 60
1
2
3
4

TS-2d TP 124-13 AASHTO
6
lig10
Areaf
fW
G = × (4)
where: Gf = fracture energy (Joules/m2); Wf = work of fracture (Joules); P = load (kN); u = load line displacement (mm); Arealig = ligament area = (r – a) × t, (mm2); r = specimen radius (mm); a = notch length (mm); t = specimen thickness (mm). Note 78—Gf is a size dependent property. This specification does not aim at calculating size independent Gf. Therefore, cracking resistance of asphalt mixtures quantified with Gf may vary when the notch length to radius ratio changes.
11.3. Determining Post-Peak Slope (m)—The inflection point is determined on the load–LLD curve (Figure 5) after the peak load. The slope of the tangential curve drawn at the inflection point represents post-peak slope.
11.4. Determining Displacement at Peak Load (u0)—The displacement when peak load is reached.
11.5. Determining Critical Displacement (u1)—Intersection of the tangential post-peak slope with the displacement axis yields the critical displacement value. A straight line is drawn connecting the inflection point and displacement axis with a slope m.
11.6. Flexibility Index (FI)—FI can be calculated from the parameters obtained using the load–LLD curve (Al-Qadi et al. (2015), Ozer et al. (2016a), Ozer et al. (2016b)). The factor A is used for unit conversion and scaling. A is equal to 0.01. Complete details of the analysis procedure are provided in Appendix A.
fGFI A
m= × (5)
where: |m| = absolute value of post-peak load slope m (kN/mm).
12. CORRECTION FACTORS
12.1. Correction Factors for Flexibility Index—Flexibility index correction factors for pavement core specimen thickness and differences between field and lab compaction may be needed. A thickness correction factor may be applied for pavement cores tested at thickness less than 45 mm. The correction factors may require local calibration to consider locally available materials and mixture design requirements.
13. REPORT
13.1. Report the following information:
13.1.1. Bulk specific gravity of each specimen tested, to the nearest 0.001;
13.1.2. Air void content of each disc, to the nearest 0.1 percent;
13.1.3. The number of cut faces for each specimen tested, if pavement cores were used.

TS-2d TP 124-14 AASHTO
13.1.4. Average thickness t and average ligament length of each specimen tested, to the nearest 0.1 mm;
13.1.5. Initial notch length a, to the nearest 0.5 mm;
13.1.6. Average and coefficient of variation (COV) of peak load, to the nearest 0.1 kN;
13.1.7. Average and COV of recorded time at peak load, to the nearest 0.1 s;
13.1.8. Average and COV of load-line displacement at the peak load (u0), to the nearest 0.1 mm;
13.1.9. Average and COV of critical displacement (u1), to the nearest 0.1 mm;
13.1.10. Average and COV of post-peak slope (m), to the nearest 0.1 kN/mm;
13.1.11. Average and COV of fracture energy Gf, to the nearest 1 J/m2; and
13.1.12. Average and COV of flexibility index to the nearest 0.1.
14. PRECISION AND BIAS
14.1. Precision:
14.2. —The research required to develop precision estimates has not been conducted.Single-Operator Precision – The single-operator coefficient of variation of flexibility index has been found to be 27.1%. Therefore, results of two properly conducted tests by the same operator on the same material are not expected to differ from each other by more than 75.9% of their average.
14.3. Multi-laboratory Precision – The multi-laboratory coefficient of variation of flexibility index has been found to be 34.1%. Therefore, results of two properly conducted tests by two different laboratories on specimens of the same material are not expected to differ from each other by more than 95.5% of their average.
Table 1 – Precision Estimatesa
Material Average FI
Components of Variance Variances
Single Operator Between Laboratory Single Operator Multi-Laboratory
2017 5.2 2.36 0.49 2.36 2.85
2018 23.1 36.85 7.64 36.85 44.49
2019 9.6 5.90 9.55 5.90 15.44
Material Average FI
Standard Deviations Coefficients of Variation (%)
Single Operator Multi-Laboratory Single Operator Multi-Laboratory
2017 5.2 1.54 1.69 29.6 32.5
2018 23.1 6.07 6.67 26.3 28.9
2019 9.6 2.43 3.93 25.3 41.0

TS-2d TP 124-15 AASHTO
a Based on a multi-laboratory study of state departments of transportation, private, and academic laboratories in 2017, 2018, and 2019. Three materials (All 9.5 mm NMAS mixtures) with varying contents of RAP were used (a different mixture was used each year). and aApproximately 12 specimens were tested per material on at least 30 devices per year.
Table 1-Precision Estimatesa
14.4. Bias—The research required to establish the bias of this method has not been conducted.No information can be presented on the bias of the procedure because no material having an accepted reference value is available.
15. KEYWORDS
15.1. Asphalt mixture; flexibility index; flexibility index test (FIT); fracture energy; semicircular bend (SCB); stiffness; work of fracture.
APPENDIX
X1. CALCULATIONS
X1.1. SCOPE:
X1.1.1. This appendix presents the framework and algorithms used to process the load–LLD curve and to compute the critical variables such as fracture energy, slope (after the crack begins propagating), and flexibility index. The algorithm consists of the following steps:
X1.1.1.1. Preprocessing the raw load–LLD curve;
X1.1.1.2. Pre-peak calculations; and
X1.1.1.3. Post-peak calculations.
X1.2. PREPROCESSING:
X1.2.1. The algorithm starts with preprocessing the raw test output file containing the load and displacement datX1. The first step of pre-processing is to trim the tail of the curve. The data points whose load values are smaller than 0.1 kN are removed. Because the load–LLD curve exhibits different characteristics before and after the peak load, the trimmed load–LLD curve is divided into two parts: pre-peak and post-peak. To do this, the peak load at which maximum load value is reached is identified. The values of the load–LLD curve before the peak load are assigned to the pre-peak segment; the remaining data are assigned to the post-peak segment. The calculations required for pre-peak and post-peak segments are explained in Sections X1.3 and X1.4.
X1.3. PRE-PEAK CALCULATIONS:
X1.3.1. The following steps are completed to process the pre-peak segment of the load–LLD curve:

TS-2d TP 124-16 AASHTO
X1.3.1.1. The beginning (ui, Pi) and end (u0, Pmax) coordinates of the load–LLD curve are captured.
X1.3.1.2. A polynomial equation with a degree of six is fitted to the pre-peak segment of the load–LLD curve (Equation X1.1).
6 5 4 3 2 11 1 2 3 4 5 6 7( )P u c u c u c u c u c u c u c= × + × + × + × + × + × + (X1.1)
where: ci = polynomial coefficients.
X1.3.1.3. A new set of data is generated with equal displacement increments using the polynomial function bounded by the beginning and end points found in Section X1.3.1.1. The increments used to divide the data are found by dividing the displacement at the peak load by 1000. A new displacement vector (upre) is generated from ui to u0 with calculated increments. The new loading vector is computed by substituting the value of the displacement vector in Equation X1.1. The purpose of generating a dataset with higher resolution is to increase the accuracy of the numerical integration described in Section X1.3.1.4.
X1.3.1.4. Numerical integration is applied to calculate area under the pre-peak segment of the load–LLD curve. The integral for area calculation is given in Equation X1.2. A trapezoidal integration technique is used for the numerical integration of Equation X1.2. When analytical integration tools are available, analytical integration is recommended to improve accuracy.
0
10
(pre-peak) ( )u
fW P u du= ∫ (X1.2)
X1.3.1.5. When the load–LLD curve starts with a residual load at zero displacement, the curve needs to be extrapolated to modify the area calculated in the previous step. In such cases, the curve is linearly extrapolated to the displacement coordinate where the load is zero. The displacement at the zero load (ur) is found. The area under the extrapolated segment is added to calculate total pre-peak area X1. Numerical integration is applied to find the residual area shown by the additional term in Equation X1.3. The second part of the sum comes from the additional area of extrapolation.
0
10
(pre-peak) ( ) 0.5u
f r rW P u du u P= + × ×∫ (X1.3)
where: Pr = residual load at zero displacement; and ur = calculated displacement at zero load.
X1.4. POST-PEAK CALCULATIONS:
X1.4.1. An algorithm was developed to process the post-peak segment of the load–LLD curve to calculate area under the curve as well as the inflection point and slope at the inflection point. Explanations of each step are given in Sections X1.4.1.1 through X1.4.1.3.
X1.4.1.1. The beginning (u0, P0) and end (uf, Pf) coordinates of the post-peak load–LLD curve are captured (see Figure X1.1). The raw data records are stored in two vectors as upost = {u0, …, uf} and Ppost = {P0,…, Pf}.
X1.4.1.2. In this step, candidate lower bounds for parameter f in Equation X1.4 are initialized and kept in a vector. This parameter can govern the first derivative of the post-peak segment resulting in abnormal slope values. For example, if a lower bound is not defined for this parameter, it may go

TS-2d TP 124-17 AASHTO
to zero, which creates a spike-like, spurious slope. On the other hand, if the bound is defined too high, accuracy of the fitted curve may be compromised. Therefore, candidate values for the lower bounds for this parameter were found to be f bounds = {0.9, 0.7, 0.5, 0.3, 0.1, 0.05, 0.01, 0.005, 0.001}. The optimum value is found iteratively looping over the values initialized in the f bounds. The order of the values should be descending.
4
2
2( ) exp
n ii
i i
u eP u d
f
= −= −∑
(X1.4)
where: d, e, f = polynomial coefficients, and n = number of exponential terms.
X1.4.1.3. All model parameters in Equation X1.4 are regularized by setting lower and upper bounds for each of them. Upper and lower bounds for each parameter except f are initialized as 10 and –10, respectively. Because of the limitations of the regression function used in MATLAB (the function called “fit”), the regularization had to be conducted in a heuristic way.
X1.4.1.3.1. A regression function that input upost and Ppost are developed by fitting the Gaussian function (Equation X1.4) to the post-peak segment of the data bounded by the limits defined in Section X1.4.1. The number of Gaussian terms is selected as four. Then, the inflection points at which the second derivative of the fitted equation becomes zero are extracted, and the first derivatives indicating the slopes (mi) are computed at the extracted inflection points (ui).
X1.4.1.3.2. It is possible that the second derivative of the fitted equation P2(u) may not have any roots (i.e., there is no inflection point; hence, no slope can be found). If P2(u) does not have any roots, the next value in the vector fbounds should be selected before proceeding with the remaining steps. If a root or roots of P2(u) exists, proceed to the next step.
X1.4.1.3.3. At each inflection point found, draw the tangential slope by extrapolating a line intersecting the displacement axis, as shown in Figure X1.1. The first derivative value at the inflection is defined as the post-peak slope (m) as shown below.
2
inf
( )P um
u u u
∂=
∂ =
(X1.5)

TS-2d TP 124-18 AASHTO
Figure X1.1—Demonstration of Pre-Peak and Post-Peak Segments
X1.4.1.3.4. It is common that the fitted equation may produce more than one slope when there is more than one root found in the previous step. There is only one slope considered consistent with the definition of the tests; the remaining slopes are spurious and need to be eliminated. To find the most representative slope and eliminate the unrealistic slope(s), three visual based criteria are implemented. The criteria, grading, and elimination processes are as follows:
Criterion 1—Incremental displacement values (un) are generated with equal increments between u0 and ui. A linear slope equation, S(u), is described by using the slope (see Equation X1.5) and passing through the inflection point (ui). The mean value of difference between slope equation and post-peak load–LLD curve is calculated using Equation X1.6.
( ) ( )[ ]211
Mn n
nS u P u
CM
=−
=∑
(X1.6)
where: M = number of displacement values such that (u0 < un < ui). Equal sizes of increments are used
to create M-times displacement values (un). M may vary depending on the length between u0 and ui;
S(un) = value of slope equation calculated at u = un; and P2(un) = value of post-peak load–LLD curve calculated at u = un.
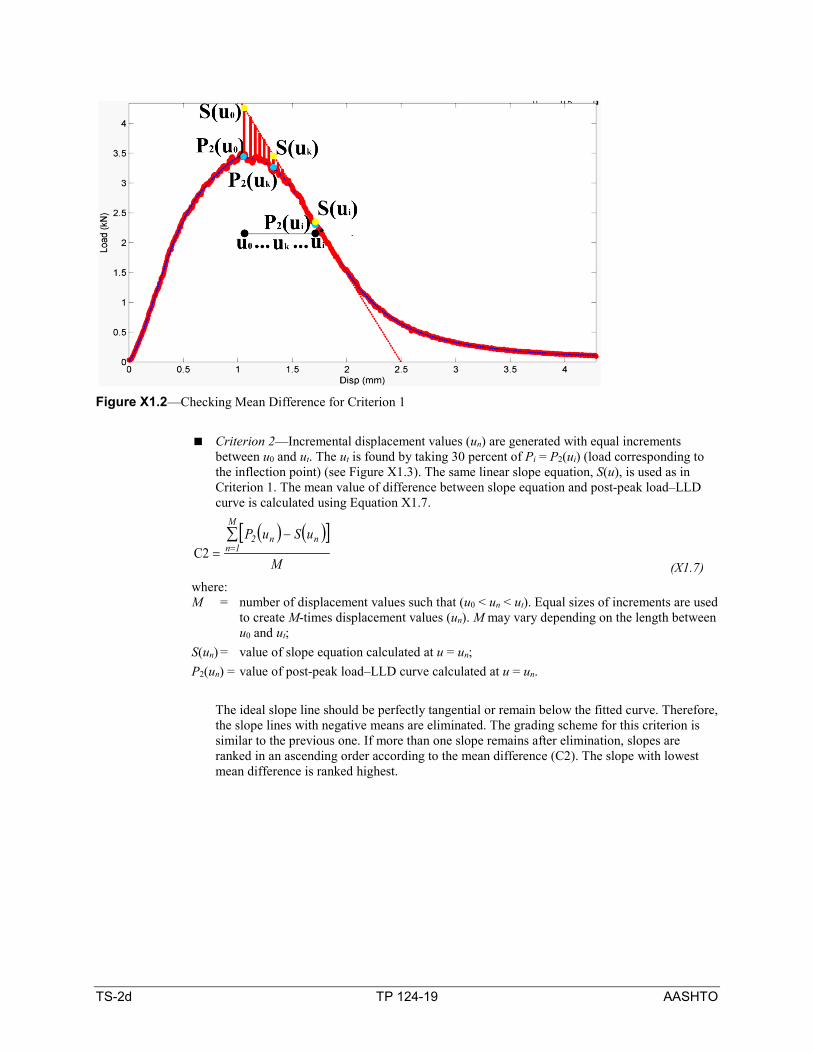
TS-2d TP 124-19 AASHTO
Figure X1.2—Checking Mean Difference for Criterion 1
Criterion 2—Incremental displacement values (un) are generated with equal increments between u0 and ut. The ut is found by taking 30 percent of Pi = P2(ui) (load corresponding to the inflection point) (see Figure X1.3). The same linear slope equation, S(u), is used as in Criterion 1. The mean value of difference between slope equation and post-peak load–LLD curve is calculated using Equation X1.7.
( ) ( )[ ]M
uSuPM
1nnn2∑
=−
=C2 (X1.7)
where: M = number of displacement values such that (u0 < un < ut). Equal sizes of increments are used
to create M-times displacement values (un). M may vary depending on the length between u0 and ut;
S(un) = value of slope equation calculated at u = un; P2(un) = value of post-peak load–LLD curve calculated at u = un.
The ideal slope line should be perfectly tangential or remain below the fitted curve. Therefore, the slope lines with negative means are eliminated. The grading scheme for this criterion is similar to the previous one. If more than one slope remains after elimination, slopes are ranked in an ascending order according to the mean difference (C2). The slope with lowest mean difference is ranked highest.

TS-2d TP 124-20 AASHTO
Figure X1.3—Checking Mean Difference for Criterion 2
Criterion 3—The value of this criterion is –x coordinate of inflections points (i.e., ui). If there are multiple candidates for slope line, they are ranked with an ascending order according to their ui. For example, slopes found at smaller inflection points ranked higher than the slope found at the tail part of the curve.
X1.4.1.3.5. If at least one realistic slope is found, and the R2 of the fit is higher than 0.997, the fit is accepted and the loop is stopped. In that case, the framework jumps to Section X1.4.4 to calculate fracture energy and report the representative slopes along with other required test outcomes. Otherwise, the loop continues—that is, the next value from fbound is selected to modify the lower bound for the parameter f. Sections X1.4.1.3.1 through X1.4.1.3.5 are repeated until a representative slope and satisfactory R2 is found.
X1.4.1.4. Using the satisfactory fit, P2(u), and representative inflection point and post-peak slope values (m), the test parameters required in the report section of the specification are calculated.
X1.4.1.4.1. Representative slope is reported as the one with the highest score from the grading process (Section X1.4.1.3.4).
X1.4.1.4.2. Similar to the pre-peak area calculation, a new displacement vector between up and ufinal by an increment of 0.005 is generated. Then corresponding load values are calculated by feeding this generated displacement vector to the fitted regression functions. The purpose of generating new sets of data with increased resolution is to increase the accuracy of the numerical integration in the next step.
X1.4.1.4.3. A trapezoidal numerical integration technique (Figure X1.2) is employed for the integral shown in Equation X1.8 to calculate the area under the post-peak segment of the curve.
final
02(post-peak) ( )
u
fu
W P u du= ∫ (X1.8)
X1.4.1.4.4. The total area under the load–LLD curve is found by adding the pre-peak and post-peak areas. Then the work of fracture is calculated using the Equation X1.9.

TS-2d TP 124-21 AASHTO
(post-peak) (pre-peak) f f fW W W= + (X1.9)
X1.4.1.4.5. Total energy and slope are inputted to Equations X1.10a and X1.10b to compute fracture energy and flexibility index.
6
lig
10Area
ff
WG = × (X1.10a)
fGFI As
m= × (X1.10b)
1 This provisional standard was first published in 2016. 2 Appendix X1 written by Hasan Ozer, Osman Erman Gungor, and Imad Al-Qadi, Illinois Center for Transportation, University of Illinois at Urbana-Champaign.
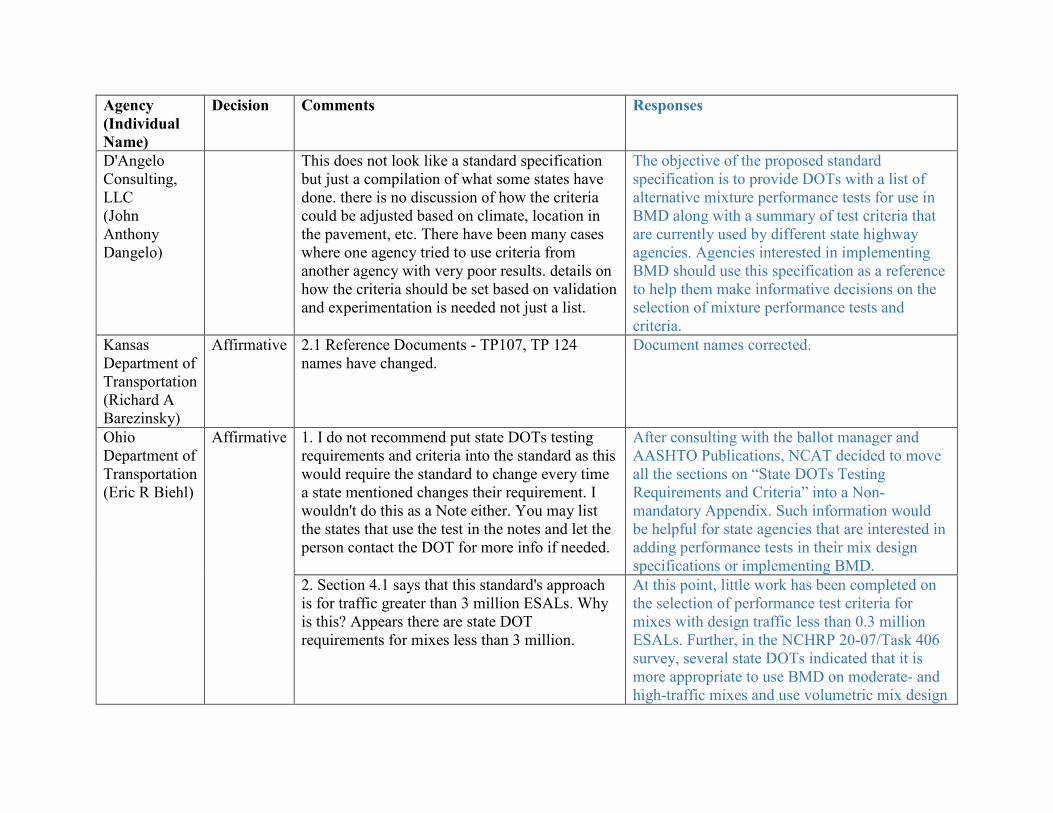
Agency (Individual Name)
Decision Comments Responses
D'Angelo Consulting, LLC (John Anthony Dangelo)
This does not look like a standard specification but just a compilation of what some states have done. there is no discussion of how the criteria could be adjusted based on climate, location in the pavement, etc. There have been many cases where one agency tried to use criteria from another agency with very poor results. details on how the criteria should be set based on validation and experimentation is needed not just a list.
The objective of the proposed standard specification is to provide DOTs with a list of alternative mixture performance tests for use in BMD along with a summary of test criteria that are currently used by different state highway agencies. Agencies interested in implementing BMD should use this specification as a reference to help them make informative decisions on the selection of mixture performance tests and criteria.
Kansas Department of Transportation (Richard A Barezinsky)
Affirmative 2.1 Reference Documents - TP107, TP 124 names have changed.
Document names corrected.
Ohio Department of Transportation (Eric R Biehl)
Affirmative 1. I do not recommend put state DOTs testing requirements and criteria into the standard as this would require the standard to change every time a state mentioned changes their requirement. I wouldn't do this as a Note either. You may list the states that use the test in the notes and let the person contact the DOT for more info if needed.
After consulting with the ballot manager and AASHTO Publications, NCAT decided to move all the sections on “State DOTs Testing Requirements and Criteria” into a Non-mandatory Appendix. Such information would be helpful for state agencies that are interested in adding performance tests in their mix design specifications or implementing BMD.
2. Section 4.1 says that this standard's approach is for traffic greater than 3 million ESALs. Why is this? Appears there are state DOT requirements for mixes less than 3 million.
At this point, little work has been completed on the selection of performance test criteria for mixes with design traffic less than 0.3 million ESALs. Further, in the NCHRP 20-07/Task 406 survey, several state DOTs indicated that it is more appropriate to use BMD on moderate- and high-traffic mixes and use volumetric mix design

on low-traffic mixes. Therefore, the proposed standard specification only includes performance test criteria for mixes with design traffic greater than 3 million ESALs. Section 4.1 states, “This approach is only applicable to pavements with design traffic greater than 3 million ESALs or high stress non-highway applications.”
3. Specimen Conditioning and Aging sections: Would it be better to say to refer to AASHTO R 30 for conditioning of loose mix in case R 30 ever changes?
Suggested changes accepted. When appropriate, the “Specimen Conditioning and Aging” section now states, “condition loose mix test samples in accordance to R 30, Section 7.2 Short Term Conditioning for Mechanical Property Testing.”
Illinois Department of Transportation (Brian Pfeifer)
Affirmative All rutting and cracking test sections do not specify AASHTO R 30 for mixture/specimen conditioning.
Suggested changes accepted. When appropriate, the “Specimen Conditioning and Aging” section now states, “condition loose mix test samples in accordance to R 30, Section 7.2 Short Term Conditioning for Mechanical Property Testing.”
It is suggested to add this reference to the document. Section 1.1 uses the term “performance-based test results”. Consider using “performancebased/ related test results” because many of the rutting and cracking performance tests use performance-related results.
Suggested change accepted.
Section 6.6 references the I-FIT procedure and Section 6.6.1 states that no specimen conditioning or aging procedure has been recommended. However, Illinois DOT uses 1 or
This information was added to Section 6.6.1 as Note 9.

2 hours of short-term oven conditioning at the mixing temperature for mixture design specimens depending on the absorption of the aggregate blend. One hour is used for low absorption aggregate blends (less than 2.5%) and 2 hours for high absorption aggregate blends. Also, Illinois DOT uses a long-term aging protocol of 3 days at 95°C in a force-draft oven on prepared and cut I-FIT specimens.
Ontario Ministry of Transportation (Becca Lane)
Affirmative Note 15- Can the information from this be input as a table, similar to other sections?
Table X.8 was added to summarize the TSR criteria used by different state DOTs (as of May 1, 2019).
Wisconsin Department of Transportation (Barry C Paye)
Negative Why publish all the different state standards in a specification. This will become a never ending challenge to maintain, as things constantly change. A national framework should be provided, but I don't know that putting all the current versions of state specifications in here helps anyone.
After consulting with the ballot manager and AASHTO Publications, NCAT decided to move all the sections on state DOTs testing requirements and criteria into a Non-mandatory Appendix. Such information would be helpful for state agencies that are interested in adding performance tests in their mix design specifications or implementing BMD.
Vermont Agency of Transportation (Aaron Schwartz)
Negative I do think BMD will make a significant difference overall on asphalt mixture performance. However, this was a borderline affirmative/negative vote due to the issues noted below. (1) The last sentence in Section 4.1 regarding BMD applying to pavements with design traffic greater than 3 million ESALs would have a significant impact on the more rural states that don't have roads designed for 10 million ESALs. Here in Vermont, for example, there is at least one (1) segment of the Interstate Highway
At this point, little work has been completed on the selection of performance test criteria for mixes with design traffic less than 0.3 million ESALs. Further, in the NCHRP 20-07/Task 406 survey, several state DOTs indicated that it is more appropriate to use BMD on moderate- and high-traffic mixes and use volumetric mix design on low-traffic mixes. Therefore, the proposed standard specification only includes performance test criteria for mixes with design traffic greater than 3 million ESALs.

System that doesn't see more than 2,500 vehicles per day, which when designing for a 20-year design life may be at or below 3 million ESALs. Moreover, some of the tables summarizing design criteria used by state DOTs (Table 2, North Carolina, for example) do have criteria for roads designed for less than 3 million ESALs.
Section 4.1 states, “This approach is only applicable to pavements with design traffic greater than 3 million ESALs or high stress non-highway applications.”
(2) The state DOT criteria in each table should be double-checked before moving forward, as it's likely changes were made after the literature review in Chapter 3 of the report was completed.
After consulting with the ballot manager and AASHTO Publications, NCAT decided to move all the sections on state DOTs testing requirements and criteria into a Non-mandatory Appendix. Such information would be helpful for state agencies that are interested in adding performance tests in their mix design specifications or implementing BMD. All test criteria included have been double-check and should be accurate as of May 1, 2019.
(3) It may be premature to include placeholder tables for traffic level (Table 1, for example) without further research being done.
For all mixture performance tests without nationally accepted criteria, the “Test Criteria” section is modified to read as follows: “compare the test results with the criteria in Table x, or criteria specified by the state highway agency.”
Tennessee Department of Transportation (Brian K. Egan)
Negative All the Tables that reference current State Criteria (i.e. Tables 2,4, 6, and 8) need to be removed since all are subject to change. They could be placed as an Appendix or revise the notes to reference the NCHRP 20-07/Task 406 for State Criteria and Specifications.
Suggested change accepted. After consulting with the ballot manager and AASHTO Publications, NCAT decided to move all the sections on state DOTs testing requirements and criteria into a Non-mandatory Appendix. Such information would be helpful for state agencies that are interested in adding performance tests in their mix design specifications or implementing BMD.

Pennsylvania Department of Transportation (Timothy L Ramirez)
Negative 1) There is too high a frequency of "TBD" used in the standard for many of the performance tests. This will not adequately support the different approaches in the R xx-xx, Balanced Design of Asphalt Mixtures standard.
The objective of the proposed standard practice and specification is to provide a framework for balanced design of asphalt mixtures based on mixture volumetric properties and/or performance-based/related test results. The two documents are envisioned to provide mix designers with an overview and guidance on how to establish a BMD job mix design using four alternate design approaches and how to select mixture performance tests and criteria. Because this is only a framework at this point, additional information with regards to performance criteria (based on findings and recommendations from many ongoing research studies on this topic) should be added as they become available in the near future.
2) For several of the TBD performance criteria, individual state criteria is provided within the body of the standard. These individual state criteria should be included in an Appendix (nonmandatory). Also, who and how will each individual state's performance testing criteria be maintained within this standard? This would seem impossible to keep these criteria updated to the current individual state specifications.
Suggested change accepted. After consulting with the ballot manager and AASHTO Publications, NCAT decided to move all the sections on state DOTs testing requirements and criteria into a Non-mandatory Appendix. Such information would be helpful for state agencies that are interested in adding performance tests in their mix design specifications or implementing BMD.
3) In Section 6.7.3, is there a standard practice to reference for determining master relaxation modulus curve and fracture parameters? If so, can it be included here?
Refences added. Section 6.7.3 now states, “However, the test data can be input into an Excel spreadsheet (LTSTRESS) to determine master relaxation modulus curve and fracture parameters and predict the critical thermal cracking temperature
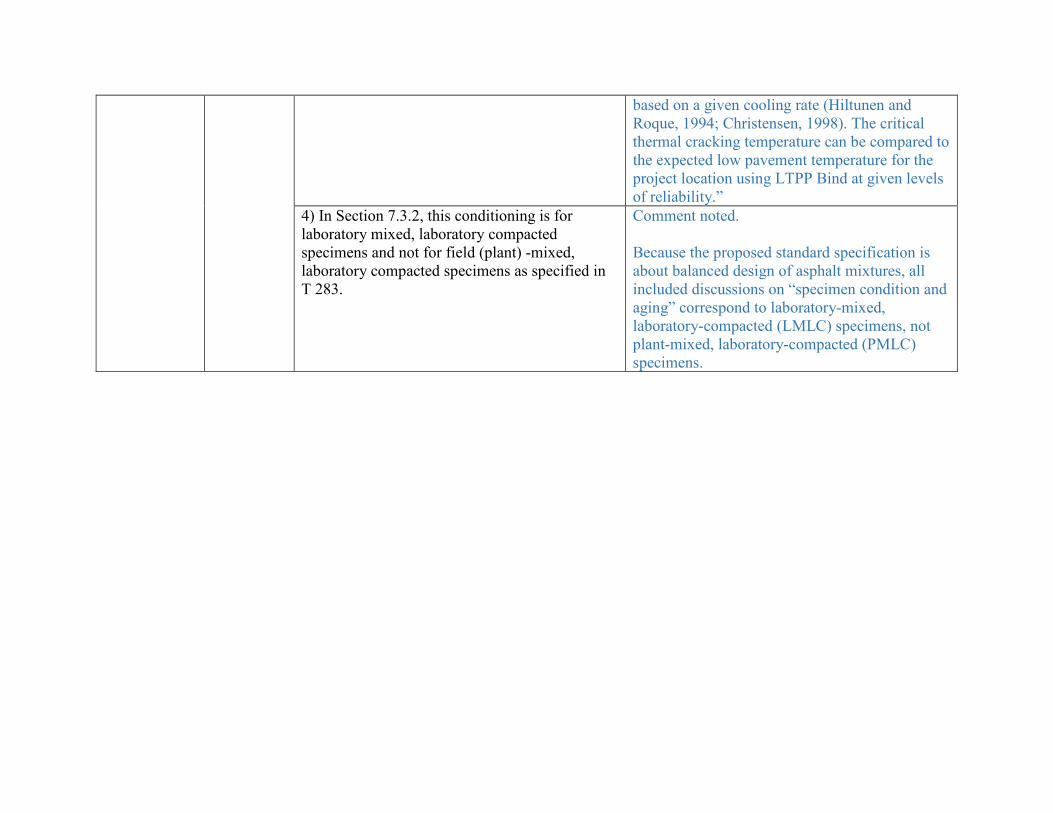
based on a given cooling rate (Hiltunen and Roque, 1994; Christensen, 1998). The critical thermal cracking temperature can be compared to the expected low pavement temperature for the project location using LTPP Bind at given levels of reliability.”
4) In Section 7.3.2, this conditioning is for laboratory mixed, laboratory compacted specimens and not for field (plant) -mixed, laboratory compacted specimens as specified in T 283.
Comment noted. Because the proposed standard specification is about balanced design of asphalt mixtures, all included discussions on “specimen condition and aging” correspond to laboratory-mixed, laboratory-compacted (LMLC) specimens, not plant-mixed, laboratory-compacted (PMLC) specimens.

1
Soneira, Casey
From: Kim, Deborah D <[email protected]>Sent: Monday, June 24, 2019 10:45 AMTo: Metcalfe, OakCc: Soneira, Casey; Milburn, GregSubject: RE: Fracture Toughness and AASHTO TP 105Attachments: image006.wmz
CAUTION: This email message may contain an unsafe attachment.
We scan email attachments for malicious software to protect your computer and the State's network. If we determine that an attachment is unsafe, then we block it and you will only see an attachment called 'Unsupported File Types Alert.txt'. If we cannot scan an attachment, then we provide this warning that the attachment may be unsafe and advise you to verify the sender before opening the attachment. If you don't see a file attached to this message, it doesn't mean that we blocked it, some email signatures contain image files that we cannot scan. Please contact your agency IT staff for more information.
Hi Oak, We have time to make this correction to TP 105 Equation 7. While we’re at it, is it OK if we change the outer set of nested parentheses at the end of the equation to flat brackets per standard math notation as follows?
0.8 4.782 1.219 0.063exp 7.045I
a aYr r
Thanks, Deb Deborah Doehr Kim, PMP Assistant Director of Publications | Publications Project Manager, Materials Standards and Design Titles American Association of State Highway and Transportation Officials (AASHTO) 444 North Capitol Street, Northwest, Suite 249 | Washington, DC 20001 Ph. 202‐624‐5883 | Fax 202‐508‐3835 | [email protected] www.transportation.org Store 1‐800‐231‐3475 | https://Store.transportation.org
From: Metcalfe, Oak [mailto:[email protected]] Sent: Wednesday, June 19, 2019 7:07 PM To: Kim, Deborah D <[email protected]> Cc: Soneira, Casey <[email protected]>; Milburn, Greg <[email protected]> Subject: FW: Fracture Toughness and AASHTO TP 105 Deb, I hope I’m not too late with this and that this issue can be addressed in the Group 3 update that will be published later this year. I apologize for taking so long to get back to you on this, but if you recall, at the end of our last COMP steering committee call I mentioned I had been informed of an error in TP 105. The attached paper

2
and email string are my conversation with the original developer of the method which cites the original equation (Lim, et al) in question and his agreement that there is an error. Specifically, equation (7) in TP 105. Currently it’s published with the first operation as a positive when it should be a negative.
𝑌 . 4.782 1.219𝑎𝑟
0.063𝑒𝑥𝑝 7.045𝑎𝑟
The correct equation should be:
𝑌 . 4.782 1.219𝑎𝑟
0.063𝑒𝑥𝑝 7.045𝑎𝑟
Please let me know if you need anymore information to make this correction or if there is any action I need to take other than notifying the members of the TS of the correction. Thanks,
Ross “Oak” Metcalfe, P.E. State Materials Engineer 406-444-9201 [email protected]
“Nullius in Verba”
From: Mihai Marasteanu <[email protected]> Sent: Monday, February 11, 2019 11:50 AM To: Metcalfe, Oak <[email protected]> Cc: Greg Milburn <[email protected]>; Casey Soneira <[email protected]> Subject: Re: Fracture Toughness and AASHTO TP 105
CAUTION: This email message may contain an unsafe attachment.
We scan email attachments for malicious software to protect your computer and the State's network. If we determine that an attachment is unsafe, then we block it and you will only see an attachment called 'Unsupported File Types Alert.txt'. If we cannot scan an attachment, then we provide this warning that the attachment may be unsafe and advise you to verify the sender before opening the attachment. If you don't see a file attached to this message, it doesn't mean that we blocked it, some email signatures contain image files that we cannot scan. Please contact your agency IT staff for more information.
Dear Ross, I reviewed our previous work and indeed the sign should be a minus. In all our calculations that we performed for various projects, we have the minus sign for 1.219 (a/r) in the Excel spreadsheet. For some reason, when we wrote the equation for the specification it came out as a plus sign and I did not catch it. We have published a paper in 2012 in which we provided the correct expression (see equation 5 on page 16 in the attachment). I am happy that someone noticed the error and that it can be corrected.

3
I am also happy to respond to your PS: WE ARE... Penn State! Great school and a very nice campus and place to live. My wife and daughter also went to Penn State for their graduate degrees. If you have any other questions, please do not hesitate to contact me. Thank you for bringing this up, Mihai On 2/8/2019 5:24 PM, Metcalfe, Oak wrote:
Dr. Marasteanu, Greetings! My name is Oak Metcalfe and I’m the Materials Testing Engineer for the Montana Department of Transportation. I am also the current chair of the AASHTO Committee on Materials and Pavements (COMP) Technical Subcommittee 2d – Proportioning of Asphalt-Aggregate Mixtures. My subcommittee houses the Provisional Standard Test Method TP 105 – Determining the Fracture Energy of Asphalt Mixtures Using the Semicircular Bend Geometry (SCB). Past chairs of this technical subcommittee (or technical section, as it was previously referred to) were Chris Abadie, formerly of Louisiana DOTD and Georgene Geary, formerly of Georgia DOT. I’m reaching out today to see if you might be able to assist me with a question relating to Fracture Toughness. I have only been the chair of TS2d for a few years now, so I’m unfamiliar with the original drafting and publication of TP 105, but your 2004 and 2006 papers with Xinjun Li on low temperature fracture resistance and low temperature cracking are cited in this standard with the discussion of Fracture Toughness and Stress Intensity Factor, so I thought you could help. Admittedly, I have yet to read your original work, however I’m waiting for our library to get me a copy. From the email, the issue is the sign of the second term for the normalized stress intensity factor, which could be a very easy fix, but have a significant impact on the test method moving forward. There is an excerpt of the standard in the email, but the equation as published in AASHTO currently is expressed:
YI0.8 4.782 1.219ar 0.063exp7.045ar Where:
a = notch
length (m), and r = specimen
radius (m) Could you confirm the equation above is correct as is, or that, indeed, the term 1.219ar should be negative instead of positive? I must admit I’m not very familiar with fracture mechanics, so if
any of this is unclear or I’m not expressing my concern adequately, please let me know and I’ll
try to clarify. Any assistance you could provide would be greatly appreciated. Thank you for your time and attention and please let me know if you have any questions or need additional information for clarity. Best Regards, Ross “Oak” Metcalfe, P.E. Testing Engineer/Physical Test Section Supervisor Materials Bureau

4
406-444-9201 [email protected]
“Nullius in Verba” P.S. WE ARE!!! (I noted you attended Penn State. I myself did not attend PSU but my father got his M.S. & Ph.D. in Chemical Engineering and my mother got her M.S. in Speech Pathology there in the late ‘70’s.)
-- Dr. Mihai Marasteanu Professor, Department of Civil, Environmental, and Geo- Engineering University of Minnesota 138 Civil Engineering Building 500 Pillsbury Drive SE Minneapolis, MN 55455 Office: 612-625-5558

COMP TS Planning Ahead—Full Standards
Designation No. Title ASTM Equiv. Planning Needed TS 2d
M 323‐17Superpave Volumetric Mix DesignM 323‐17 No
M 325‐08 (2017)Stone Matrix Asphalt (SMA)M 325‐08 (2017) No
R 30‐02 (2019)Mixture Conditioning of Hot Mix Asphalt (HMA)R 030‐02 (2019) No
R 35‐17Superpave Volumetric Design for Asphalt MixturesR 035‐17 No
R 46‐08 (2017)Designing Stone Matrix Asphalt (SMA)R 046‐08 (2017) No
R 62‐13 (2017)Developing Dynamic Modulus Master Curves for Asphalt MixturesR 062‐13 (2017) No
R 68‐15 (2019)Preparation of Asphalt Mixtures by Means of the Marshall ApparatusR 068‐15 (2019) No
R 83‐17Preparation of Cylindrical Performance Test Specimens Using the Superpave Gyratory Compactor (SGC)
R 083‐17 No
R 84‐17Developing Dynamic Modulus Master Curves for Asphalt Mixtures Using the Asphalt Mixture Performance Tester (AMPT)
R 084‐17 No
T 167‐10 (2019)Compressive Strength of Hot Mix AsphaltT 167‐10 (2019) No
T 245‐15 (2019)Resistance to Plastic Flow of Asphalt Mixtures Using Marshall ApparatusT 245‐15 (2019) No
T 246‐10 (2019)Resistance to Deformation and Cohesion of Hot Mix Asphalt (HMA) by Means of Hveem Apparatus
D1560‐09T 246‐10 (2019) No
T 247‐10 (2019)Preparation of Test Specimens of Hot Mix Asphalt (HMA) by Means of California Kneading Compactor
D1561‐92T 247‐10 (2019) No
T 283‐14 (2018)Resistance of Compacted Asphalt Mixtures to Moisture‐Induced DamageT 283‐14 (2018) No
T 312‐19Preparing and Determining the Density of Asphalt Mixture Specimens by Means of the Superpave Gyratory Compactor
T 312‐19 No
T 320‐07 (2016)Determining the Permanent Shear Strain and Stiffness of Asphalt Mixtures Using the Superpave Shear Tester (SST)
T 320‐07 (2016) Begin Review
T 321‐17Determining the Fatigue Life of Compacted Asphalt Mixtures Subjected to Repeated Flexural Bending
T 321‐17 No
T 322‐07 (2016)Determining the Creep Compliance and Strength of Hot Mix Asphalt (HMA) Using the Indirect Tensile Test Device
T 322‐07 (2016) Begin Review
T 340‐10 (2019)Determining Rutting Susceptibility of Hot Mix Asphalt (HMA) Using the Asphalt Pavement Analyzer (APA)
T 340‐10 (2019) No
T 342‐11 (2019)Determining Dynamic Modulus of Hot Mix Asphalt (HMA)T 342‐11 (2019) No
Wednesday, January 23, 2019 Prepared for COMP by AASHTO Publications Production

COMP TS Planning Ahead—Full Standards
Designation No. Title ASTM Equiv. Planning Needed TS 2d
T 344‐12 (2016)Evaluation of Superpave Gyratory Compactor (SGC) Internal Angle of Gyration Using Simulated Loading
D7115‐05T 344‐12 (2016) Begin Review
T 378‐17Determining the Dynamic Modulus and Flow Number for Asphalt Mixtures Using the Asphalt Mixture Performance Tester (AMPT)
T 378‐17 No
Wednesday, January 23, 2019 Prepared for COMP by AASHTO Publications Production

COMP TS Planning Ahead—Provisional Standards TS 2dDesignation No. Title Planning NeededPub Yr. 1
MP 23‐15 (2018)Reclaimed Asphalt Shingles for Use in Asphalt MixturesMP 023‐15 (2018) Start Revise or 1‐Yr. Extend Review2014
MP 38‐18Mix Design of Cold Recycled Mixture with Foamed AsphaltMP 038‐18 No2018
PP 76‐13 (2015)Troubleshooting Asphalt Specimen Volumetric Differences between Superpave Gyratory Compactors (SCGs) Used in the Design and the Field Management of Superpave Mixtures
PP 076‐13 (2015) Start Adopt or Drop Review2013
PP 77‐14 (2018)Materials Selection and Mixture Design of Permeable Friction CoursesPP 077‐14 (2018) Start Revise or 1‐Yr. Extend Review2014
PP 78‐17Design Considerations When Using Reclaimed Asphalt Shingles (RAS) in Asphalt Mixtures
PP 078‐17 Start Revise or 1‐Yr. Extend Review2014
PP 94‐18Determining Optimum Asphalt Content of Cold Recycled Mixture with Foamed AsphaltPP 094‐18 No2018
PP 95‐18Preparation of Indirect Tension Performance Test SpecimensPP 095‐18 No2018
PP 96‐18Developing Dynamic Modulus Master Curves for Hot Mix Asphalt (HMA) Using the Indirect Tension Testing Method
PP 096‐18 No2018
TP 105‐13 (2015)Determining the Fracture Energy of Asphalt Mixtures Using the Semicircular Bend Geometry (SCB)
TP 105‐13 (2015) Start Adopt or Drop Review2013
TP 107‐18Determining the Damage Characteristic Curve of Asphalt Mixtures from Direct Tension Cyclic Fatigue Tests
TP 107‐18 Start Revise or 1‐Yr. Extend Review2014
TP 108‐14 (2018)Abrasion Loss of Asphalt Mixture SpecimensTP 108‐14 (2018) Start Revise or 1‐Yr. Extend Review2014
TP 116‐15Rutting Resistance of Asphalt Mixtures Using Incremental Repeated Load Permanent Deformation (iRLPD)
TP 116‐15 Start Revise or 1‐Yr. Extend Review2015
TP 117‐15Determination of the Voids of Dry Compacted FillerTP 117‐15 Start Revise or 1‐Yr. Extend Review2015
TP 124‐18Determining the Fracture Potential of Ashalt Mixtures Using Semicircular Bend Geometry (SCB) at Intermediate Temperature
TP 124‐18 Start Revise or 2‐Yr. Reconfirm Review2016
TP 125‐16 (2018)Determining the Flexural Creep Stiffness of Asphalt Mixtures Using the Bending Beam Rheometer (BBR)
TP 125‐16 (2018) Start Revise or 2‐Yr. Reconfirm Review2016
TP 131‐18Determining Dynamic Modulus of Asphalt Concrete Using the Indirect Tension TestTP 131‐18 No2018
Wednesday, January 2, 2019 Prepared for COMP by AASHTO Publications Production

NCHRP Research Problem Statement
I. PROBLEM NUMBER To be assigned by NCHRP staff.
II. PROBLEM TITLE Mechanical Properties of Laboratory Produced Recycled Plastic Modified (RPM) Asphalt Binders and Mixtures
III. RESEARCH PROBLEM STATEMENT In late 2016, media reports and online networks began generating an interest in the possibility of using recycled plastic waste in asphalt mixtures. The idea was marketed as an opportunity to simultaneously improve the quality of asphalt pavements and help address the issue of waste plastic in cities, towns, and waterways across the U.S. While magazine articles and videos have trumpeted potential positive impacts of using recycled plastic modified (RPM) asphalt, such as increased service life and reduced need for polymers to modify asphalt binders, and while preliminary research suggests some of these benefits maybe realized, a full set of research to confidently back these claims is lacking.
The current waste plastic challenge is a critical concern; however, there is equal concern about the current state of the U.S.’s aging transportation infrastructure. Investment in maintenance, improvement, and expansion of transportation infrastructure in the U.S. must focus on delivering long-lasting, high-performing pavements as cost-effectively as possible. This research will be used to assess the feasibility of using RPM asphalt as a sustainable solution for improving both the performance of asphalt mixtures and reducing the amount of plastic waste in the US.
IV. LITERATURE SEARCH SUMMARY A number of international papers have recently appeared extolling the virtues of using waste plastics in asphalt. Such “recycled” plastics can be included as a substitute for aggregates, as an aggregate coating, as an asphalt binder modifier, or some combination of the three. For example, Dalhat et al. (2019) used “Recycled Plastic Waste (RPW)” consisting of a mixture of low-density polyethylene (LDPE), high-density polyethylene (HDPE), polyethylene terephthalate (PET), polypropylene (PP), polyvinyl chloride (PVC), and polystyrene (PS) as a partial aggregate substitute in asphalt mixtures. They also modified the asphalt binder with RPW. The experiment included so many variables and modifiers that it was highly confounded, but the authors did conclude that using recycled plastics in asphalt could enhance asphalt mixture rutting characteristics. Pre-coating aggregates with recycled plastics prior to their incorporation into asphalt mixtures has also been studied by researchers who have reported that recycled plastic materials tend to increase aggregate toughness, while decreasing water absorption. Asphalt mixtures containing plastic coated aggregates have also tended to show improved asphalt mixture moisture susceptibility properties (Manju et al., 2017; Shaikh et al., 2017; Adou et al., 2018; Asare et al., 2019). Using recycled plastics as asphalt binder modifiers appears to decrease binder penetration and ductility and increase softening point and viscosity (Swami et al., 2012; Appiah et al., 2017; Manju et al., 2017; Priya et al., 2017; Adou et al., 2018; Dalhat et al., 2019). Researchers have used such results to indicate the use of recycled plastics in asphalt binders would be good for areas that struggle with permanent deformation in asphalt pavements. These same authors are mostly silent

about what such binder modification could do for pavement cracking, as stiffening binders will tend to increase cracking. Finally, when incorporated in asphalt mixtures, researchers tend to agree that recycled plastics appear to enhance an asphalt mixture’s mechanical properties, although Dalhat et al. (2019) are one of the few groups that have used more modern mixture test methods, such as determining dynamic modulus and flow number and using a wheel tracking test. Other international researchers have used Marshall stability and flow to determine the merits of recycled plastics in asphalt, with experimental plans that are often lacking. While there does appear to be a mounting body of literature on the use of recycled plastics in asphalt, much of the work being reported has lacked a clear experimental plan and suffers from the use of dated test methods. Additionally, from a review of the literature, it does not appear to be a cohesive, well thought out plan to answer the many questions raised about recycled plastics in asphalt. References • Adou, Freshnel, Boateng Ampadu, Nana Kwesi Agyepng, and Olivia Naa-Afi Soli, “Assessing
Plastic Waste Usage Additives in Flexible Asphalt Mix for Road Construction,” Civil and Environmental Research, Vol. 10, No. 2, 2018.
• Appiah, Johnson Kwabena, Victor Nana Berko-Boateng, and Trinity Ama Tagbor, “Use of Waste Plastic Materials for Road Construction in Ghana,” Case Studies in Construction Materials, Vol. 6, 2017, pp. 1-7.
• Asare, Patricia Nana Ama, Francis Atta Kuranchie, and Eric Antwi Ofosu, “Evaluation of Incorporating Plastic Wastes into Asphalt Materials for Road Construction in Ghana,” Cogent Environmental Science, Vol. 5, 2019.
• Dalhat, M.A., H.I. Al-Abdul Whhab, and Khaleel Al-Adham, “Recycled Plastic Waste Asphalt Concrete vie Mineral Aggregate Substitution and Binder Modification,” Journal of Materials in Civil Engineering, Vol. 31, Issue 8, 2019.
• Manju, R., Sathya S., and Sheema K., “Use of Plastic Waste in Bituminous Pavement, International Journal of ChemTech Research, Vol. 10, No. 8, 2017, pp. 804-811.
• Priya, P., K. Archana, C. Gohila, and R. Saraswathi, “Utilization of Waste Plastic in Flexible Pavement with Marble Chips as Aggregate,” International Journal of Latest Technology in Engineering, Management & Applied Science (IJLTEMAS), Vol. 6, Issue 7, Jul 2017.
• Shaikh, Azmat, Mabeel Khan, Faisal Shah, Devendra Shukla, Gaurav Kale, “Use of Plastic Waste in Road Construction,” International Journal of Advance Research and Development, Vol. 2, Issue 5, 2017.
• Swami, Vidula, Abhijeet Jirge, Karan Patil, Suhas Patil, Sushil Patil, and Karan Salokhe, “Use of Waste Plastic in Construction of Bituminous Road,” International Journal of Engineering Science and Technology (IJEST), Vol. 4, No. 5, May 2012.
V. RESEARCH OBJECTIVE The objective of this research is to evaluate the impact recycled plastics, (including but not limited to: low density polyethylene (LDPE), high density polyethylene (HDPE), and Polypropylene), have on the mechanical properties of both asphalt binders and mixtures when added to asphalt binders using a wet process or asphalt mixtures using a plant-mixed or dry process.

This objective will be met by completing the following tasks:
1. Develop a work plan for completing Tasks 2 through 7. 2. Conduct a literature review of current and past research related to the use of recycled
plastics in asphalt mixtures. This review should include both laboratory and field studies which provide a clearer understanding of RPM asphalt mixture performance.
3. Write an interim report including the results of Tasks 1 and 2. 4. Determine the impacts of recycled plastics on the rheological stability properties of
asphalt binders. This work should evaluate the impacts of binder source, plastic dosage rate, and stabilizer, cohesive and adhesive properties, and aging on rheological and stability properties.
5. Determine the impacts of recycled plastics on the mechanical properties of asphalt mixtures using RPM asphalt binders and RPM asphalt mixtures where the plastic was introduced using a dry process. At a minimum, these mixtures should be evaluated for low temperature cracking, fatigue cracking, top-down cracking, rutting, and moisture susceptibility performance.
6. Develop a best practices manual for handling and using recycled plastics in a laboratory setting. If Tasks 2 through 5 warrant it, consideration should be also made on handling and quality control of the incoming RPM streams.
7. Produce a final report and hold a workshop with state agencies, the Federal Highway Administration, and industry to discuss the results.
VI. ESTIMATE OF PROBLEM FUNDING AND RESEARCH PERIOD Recommended Funding: It is requested that $1,250,000.00 be given to complete this research due to the extensive mechanical testing which will be required to complete the research. (Note: This estimate may be changed by the AASHTO Special Committee on Research and Innovation.)
Research Period: The research team will be given 48 months, including a three-month period for the preparation of a draft final report, to complete the outlined objectives.
(Note: This estimate may be changed by the AASHTO Special Committee on Research and Innovation.)
VII. URGENCY, PAYOFF POTENTIAL, AND IMPLEMENTATION Currently, the use of recycled plastics being used to improve the performance of asphalt mixtures is being marketed as a solution to help stem the plastic waste issue worldwide. While marketing is being conducted, there is little to no scientific research which backs up the current claims. In the near future, state agencies and the US Congress are going to be pressured to make decisions on the use of RPM asphalt binders and mixtures without adequate data to support their decisions. This research project will provide agencies with the data they can use to decide if RPM asphalt is a viable option for use on their highway infrastructure. Standard asphalt mixture design specifications may need to be altered to include the use of recycled plastics. A new standard which include acceptable plastic dosage rates may need to be developed. Currently, the National Asphalt Pavement Association and the Asphalt Institute have

a joint task force evaluating this work. This group should be consulted to ensure that industry understands the research implications on operations. This research will also need to be followed with field projects and evaluations on worker health & safety, long-term field performance, environmental impacts of milling RPM asphalt mixtures, plant emissions from RPM asphalt mixtures, and recyclability of RPM asphalt mixtures.
VIII. PERSON(S) DEVELOPING THE PROBLEM Richard Willis, PhD, Vice President for Engineering, Research, and Technology, National Asphalt Pavement Association, (301) 731-4748, [email protected], 5100 Forbes Blv, Lanham, MD 20706
Supported by AFK 10 - Critical Issues and Emerging Technologies in Asphalt,
Dr. Samuel Cooper III, (LADOTD), Erich Biehl (Ohio DOT), Dr. John E Haddock (Purdue University), Dr. Jean-Pascal Planche (University of Wyoming, WRI), and Harold “Skip” Paul, Retired LTRC Director
IX. PROBLEM MONITOR Samuel Cooper III, Materials Research Administrator, Louisiana Transportation Research Center, Louisiana Department of Transportation and Development, 225-767-9164, [email protected].
X. DATE AND SUBMITTED BY July 2019. Samuel Cooper III, Louisiana Department of Transportation and Development, Oak Metcalf, Montana Department of Transportation, Derek Nener-Plante, Maine Department of Transportation, and Eric Biehl, Ohio Department of Transportation