Embed Size (px)
Citation preview

Sept. 22, 2016
Washington Area Economy: Performance and Outlook
Kelley Coyner, Senior FellowCenter for Regional Analysis
School of Policy, Government & International AffairsGeorge Mason University
Presentation to:Committee for Dulles
1

2
What’s new?Economic Trends ?Regional Implications?
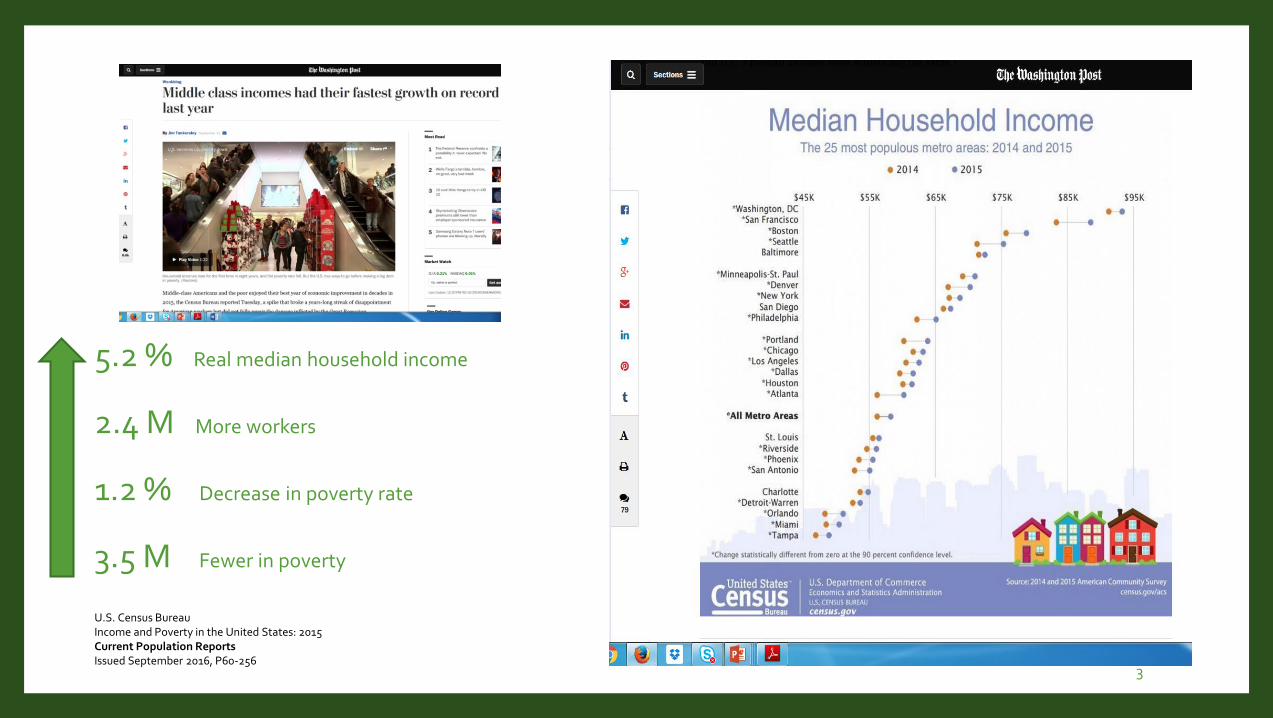
5.2 % Real median household income
2.4 M More workers
1.2 % Decrease in poverty rate
3.5 M Fewer in poverty
U.S. Census BureauIncome and Poverty in the United States: 2015 Current Population Reports Issued September 2016, P60-256
3
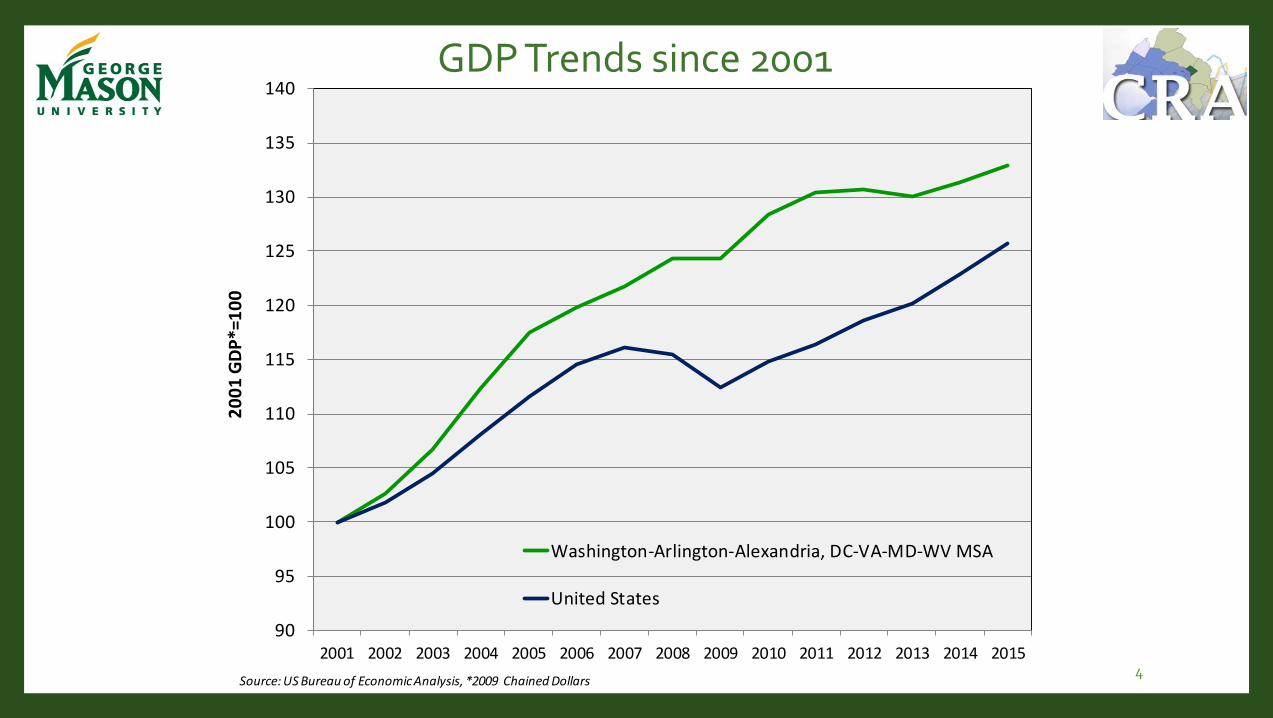
GDP Trends since 2001
4
90
95
100
105
110
115
120
125
130
135
140
2001 2002 2003 2004 2005 2006 2007 2008 2009 2010 2011 2012 2013 2014 2015
20
01
GD
P*=
10
0
Washington-Arlington-Alexandria, DC-VA-MD-WV MSA
United States
Source: US Bureau of Economic Analysis, *2009 Chained Dollars
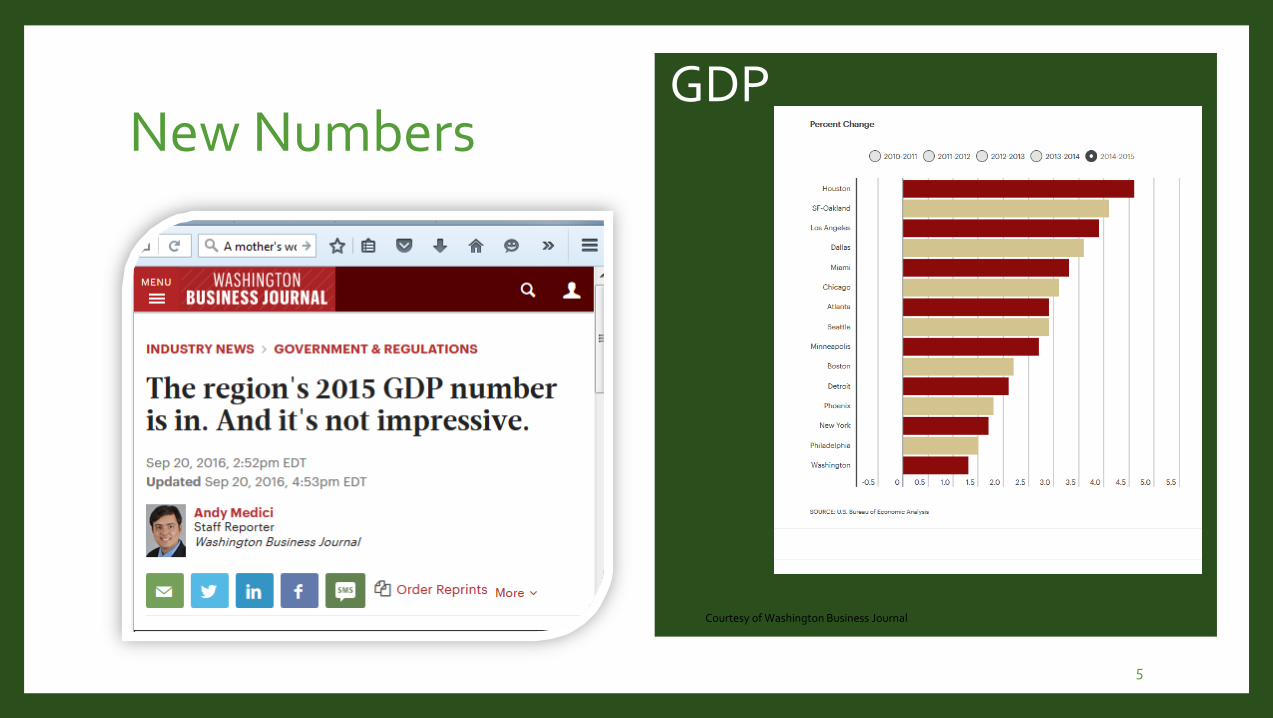
New NumbersGDP
5
Courtesy of Washington Business Journal
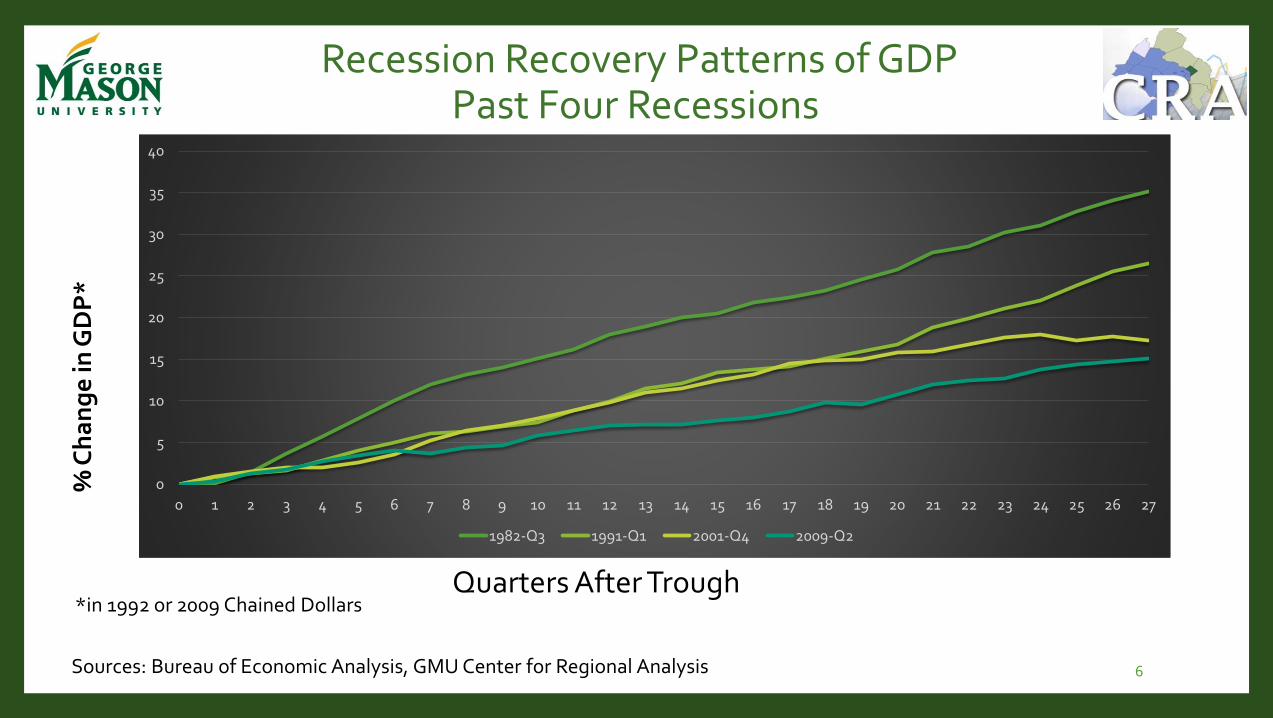
Recession Recovery Patterns of GDPPast Four Recessions
0
5
10
15
20
25
30
35
40
0 1 2 3 4 5 6 7 8 9 10 11 12 13 14 15 16 17 18 19 20 21 22 23 24 25 26 27
1982-Q3 1991-Q1 2001-Q4 2009-Q2
% C
ha
ng
e in
GD
P*
Quarters After Trough*in 1992 or 2009 Chained Dollars
Sources: Bureau of Economic Analysis, GMU Center for Regional Analysis 6
0
5
10
15
20
25
30
35
40
0 1 2 3 4 5 6 7 8 9 10 11 12 13 14 15 16 17 18 19 20 21 22 23 24 25 26 27
1982-Q3 1991-Q1 2001-Q4 2009-Q2
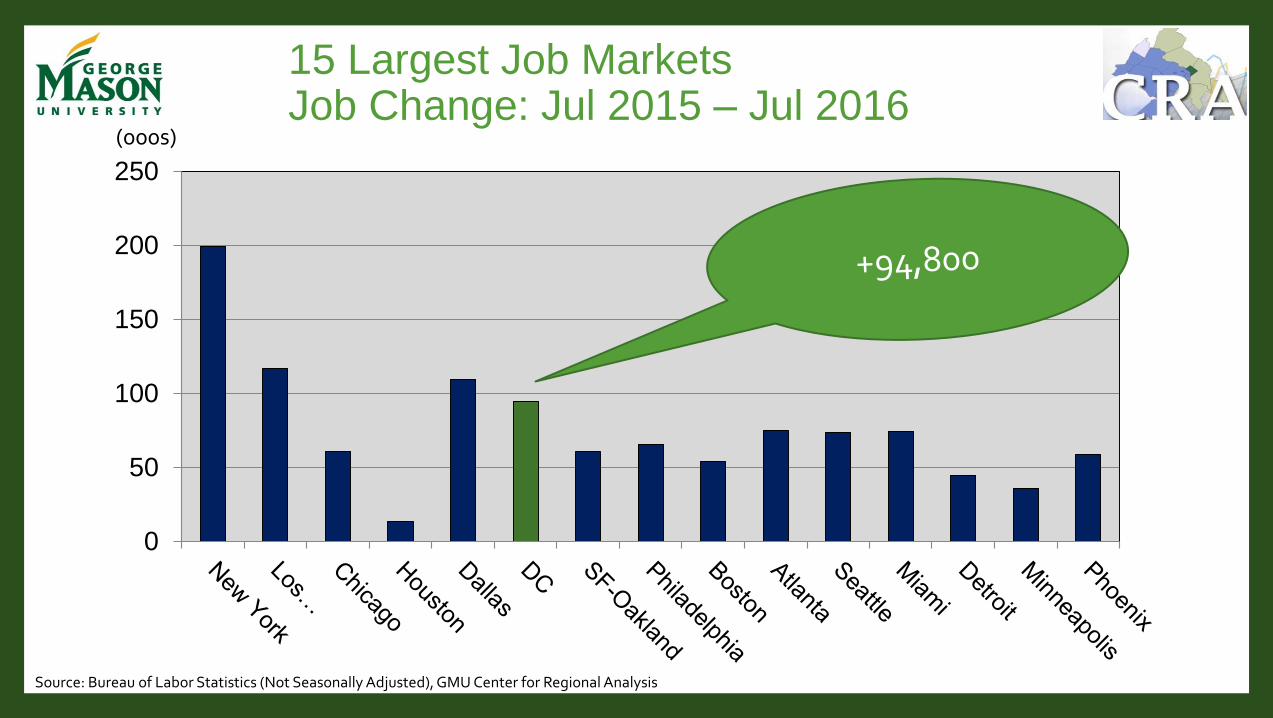
15 Largest Job MarketsJob Change: Jul 2015 – Jul 2016
0
50
100
150
200
250
(000s)
Source: Bureau of Labor Statistics (Not Seasonally Adjusted), GMU Center for Regional Analysis
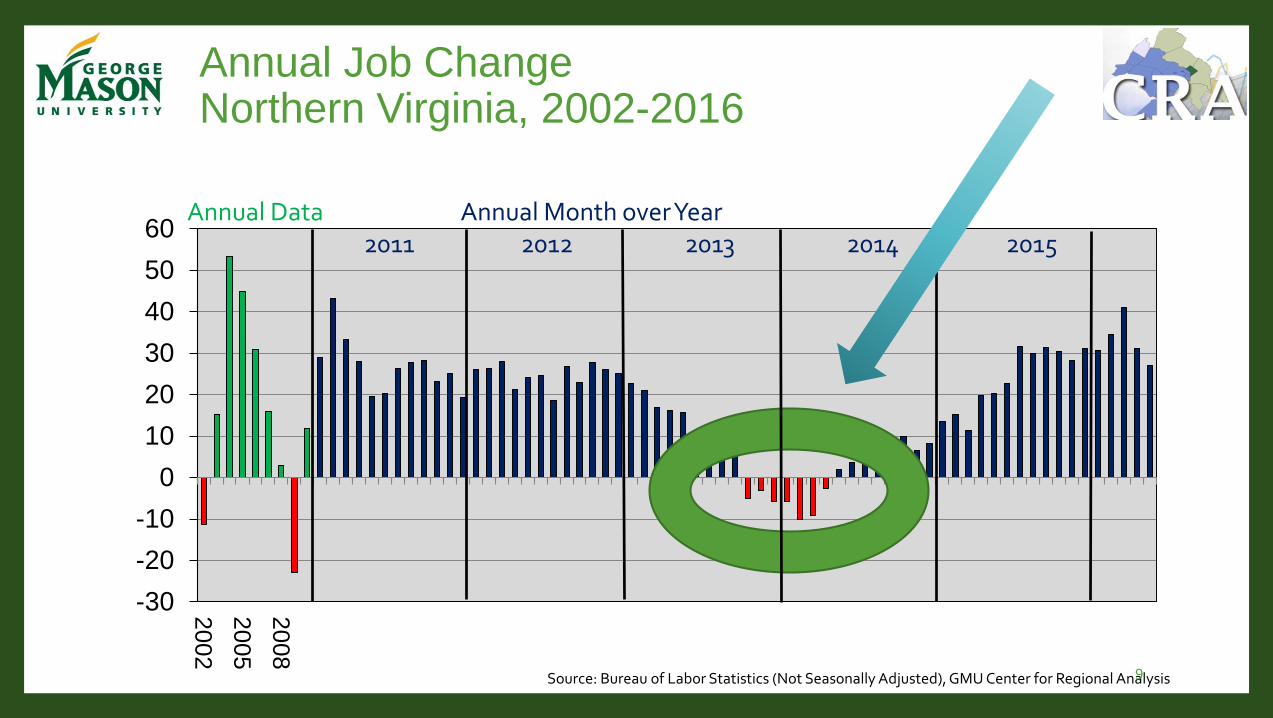
Annual Job ChangeNorthern Virginia, 2002-2016
-30
-20
-10
0
10
20
30
40
50
60
2002
2005
20
08
(000s)Annual Data Annual Month over Year
2011 2012 2013 2014 2015
Source: Bureau of Labor Statistics (Not Seasonally Adjusted), GMU Center for Regional Analysis9
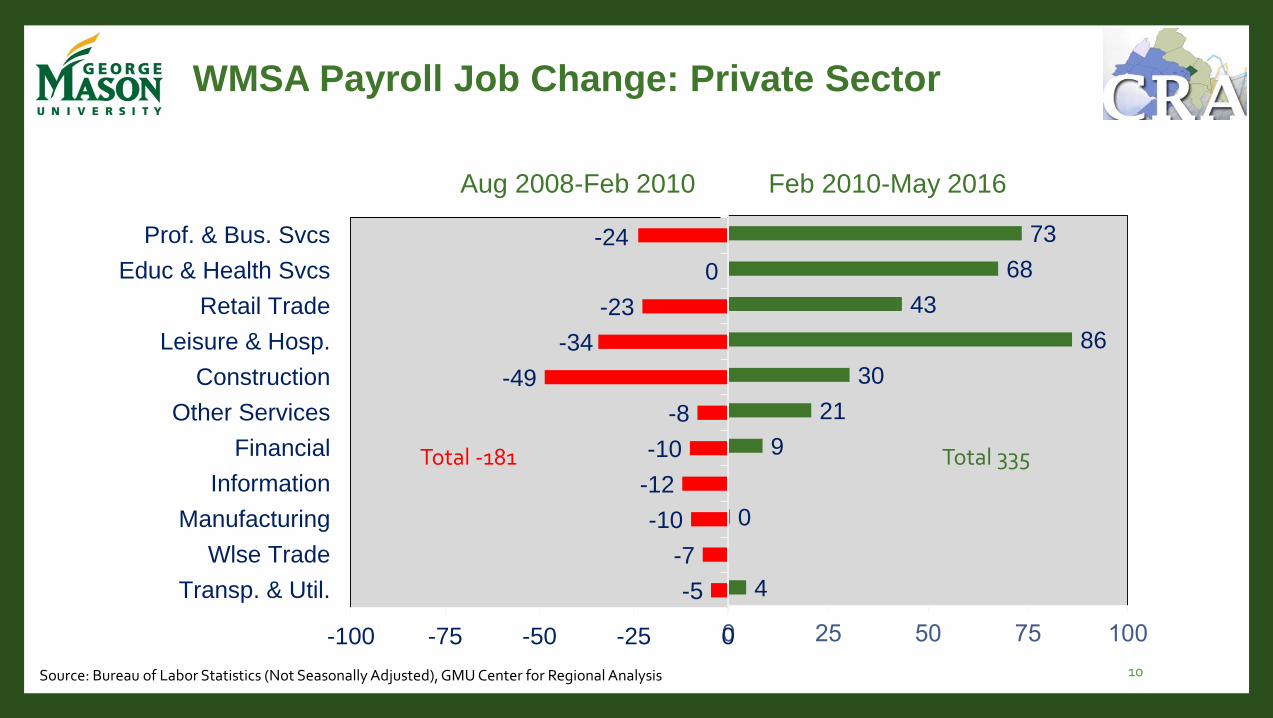
4
0
9
21
30
86
43
68
73
-5
-7
-10
-12
-10
-8
-49
-34
-23
0
-24
-100 -75 -50 -25 0
Transp. & Util.
Wlse Trade
Manufacturing
Information
Financial
Other Services
Construction
Leisure & Hosp.
Retail Trade
Educ & Health Svcs
Prof. & Bus. Svcs
WMSA Payroll Job Change: Private Sector
(000s)
Source: Bureau of Labor Statistics (Not Seasonally Adjusted), GMU Center for Regional Analysis
Total -181 Total 335
Aug 2008-Feb 2010 Feb 2010-May 2016
10
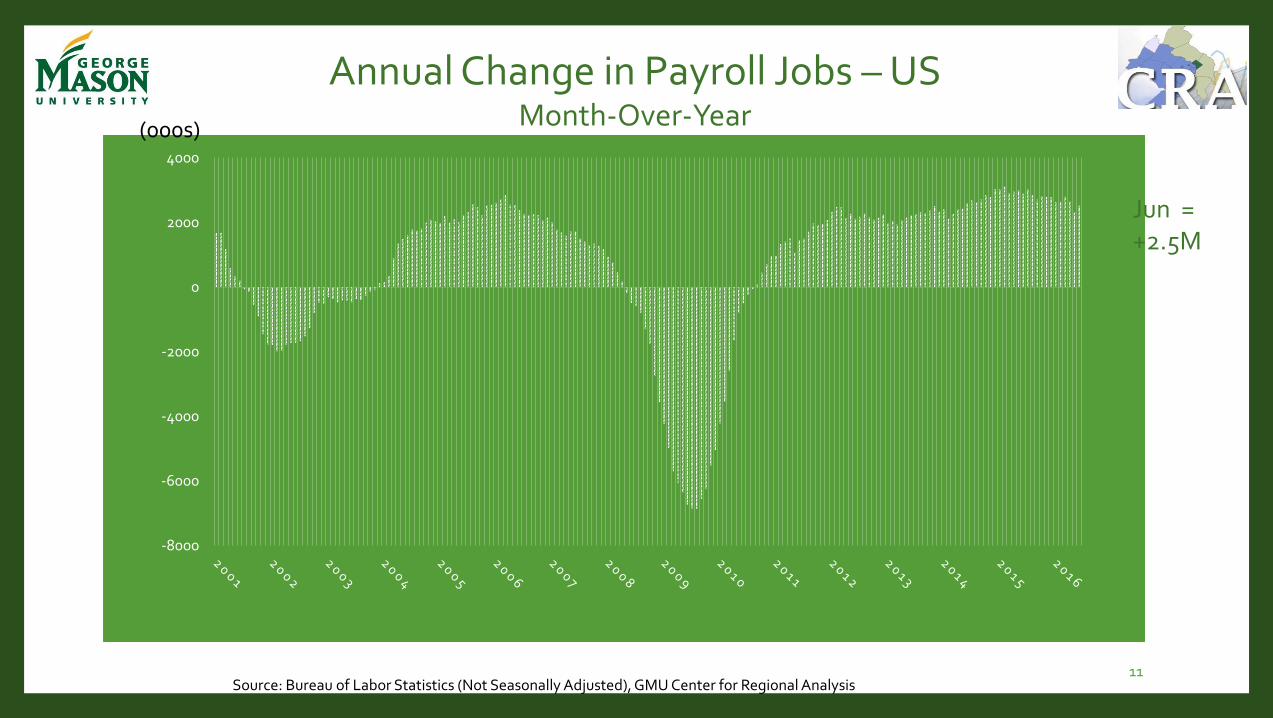
-8000
-6000
-4000
-2000
0
2000
4000
Annual Change in Payroll Jobs – USMonth-Over-Year(000s)
Jun =+2.5M
Source: Bureau of Labor Statistics (Not Seasonally Adjusted), GMU Center for Regional Analysis11
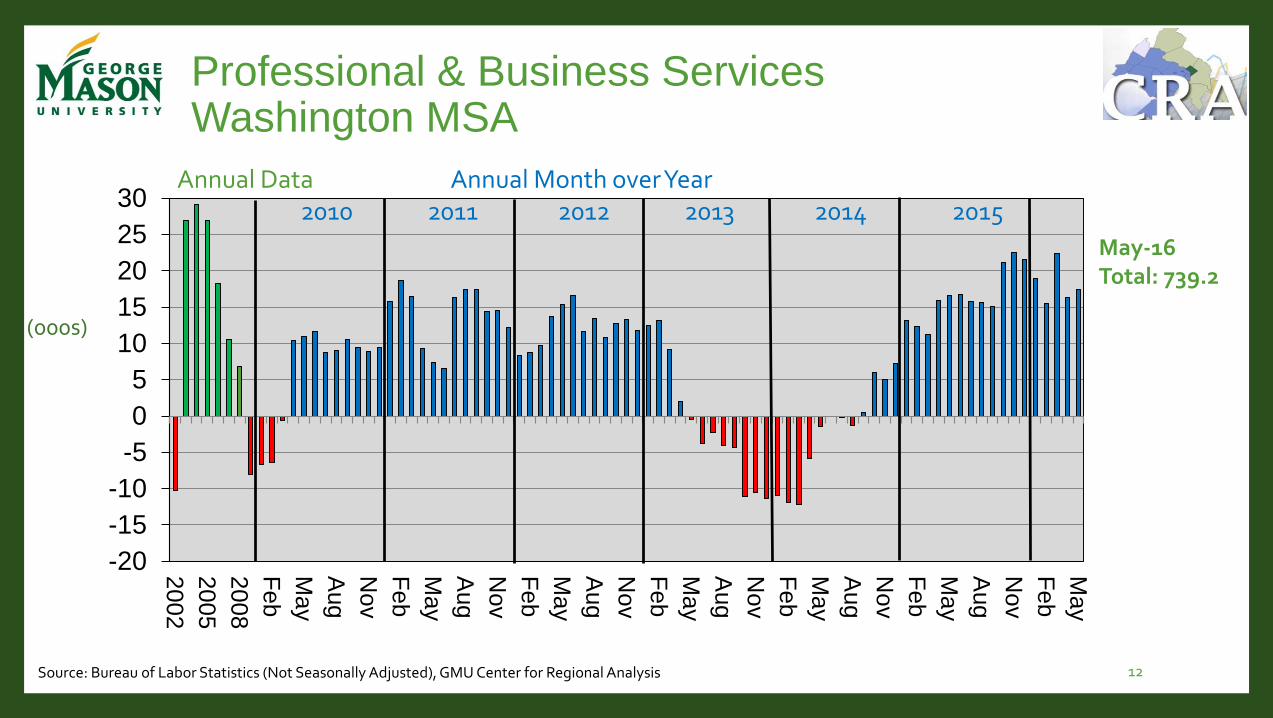
Professional & Business ServicesWashington MSA
-20
-15
-10
-5
0
5
10
15
20
25
30
2002
2005
2008
Feb
May
Aug
No
v
Feb
May
Aug
No
v
Feb
May
Aug
No
v
Feb
May
Aug
No
v
Feb
May
Aug
No
v
Feb
May
Aug
No
v
Feb
May
(000s)
Annual Data Annual Month over Year2010 2011 2012 2013 2014 2015
May-16Total: 739.2
Source: Bureau of Labor Statistics (Not Seasonally Adjusted), GMU Center for Regional Analysis 12
90
95
100
105
110
115
120
125
130
2000 2001 2002 2003 2004 2005 2006 2007 2008 2009 2010 2011 2012 2013 2014 2015
Year
20
00
=10
0
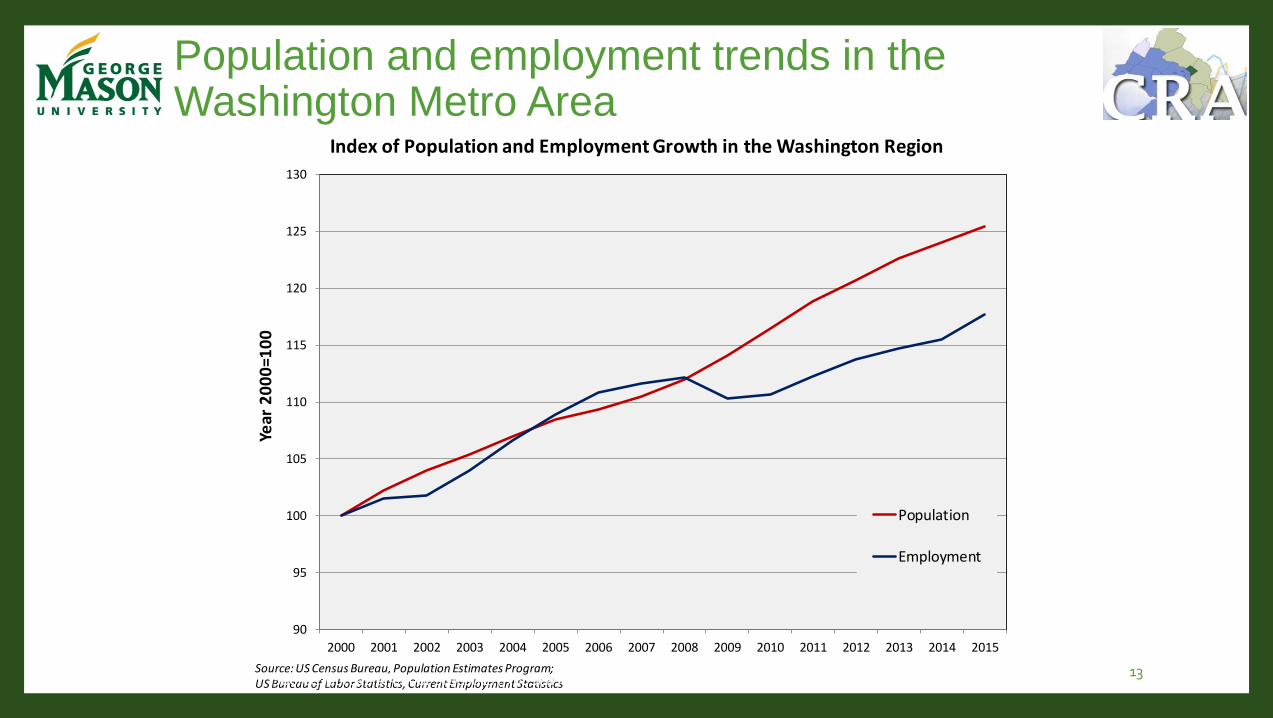
Index of Population and Employment Growth in the Washington Region
Population
Employment
Source: US Census Bureau, Population Estimates Program;US Bureau of Labor Statistics, Current Employment Statistics
Population and employment trends in the Washington Metro Area
Source: Bureau of Labor Statistics (Not Seasonally Adjusted), GMU Center for Regional Analysis13
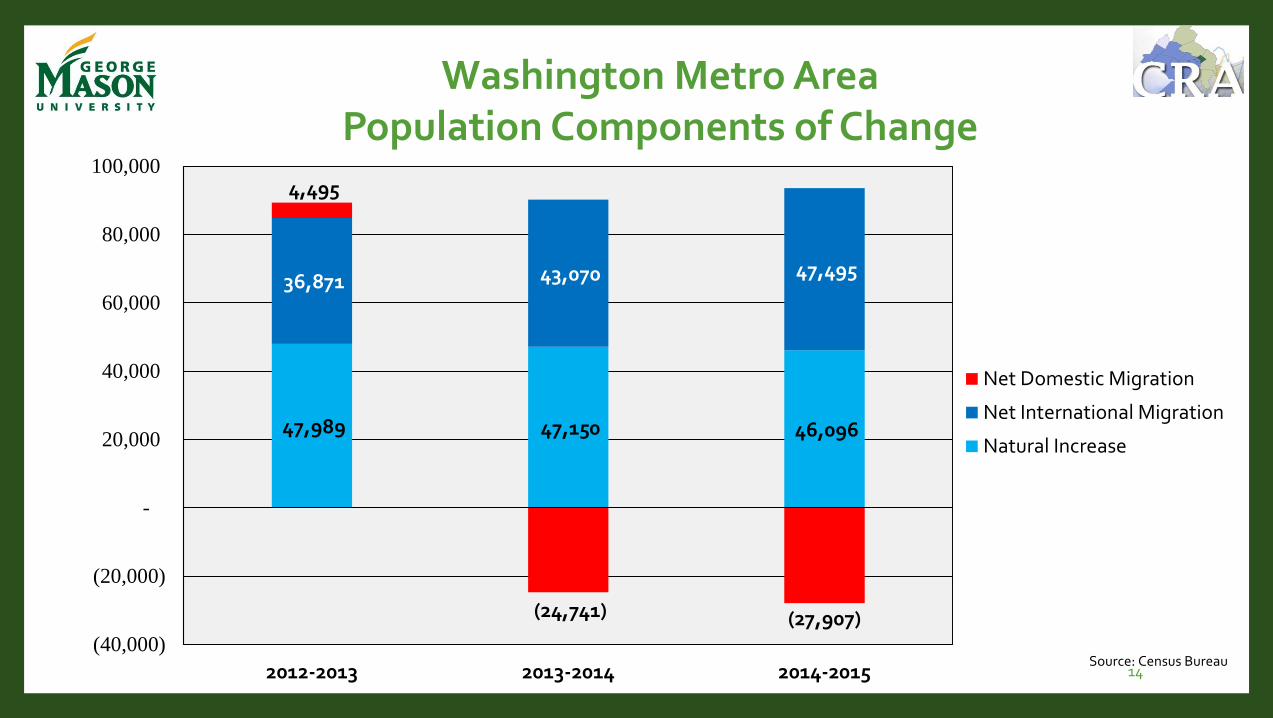
47,989 47,150 46,096
36,871 43,070 47,495
4,495
(24,741) (27,907) (40,000)
(20,000)
-
20,000
40,000
60,000
80,000
100,000
2012-2013 2013-2014 2014-2015
Net Domestic Migration
Net International Migration
Natural Increase
Source: Census Bureau
Washington Metro AreaPopulation Components of Change
14
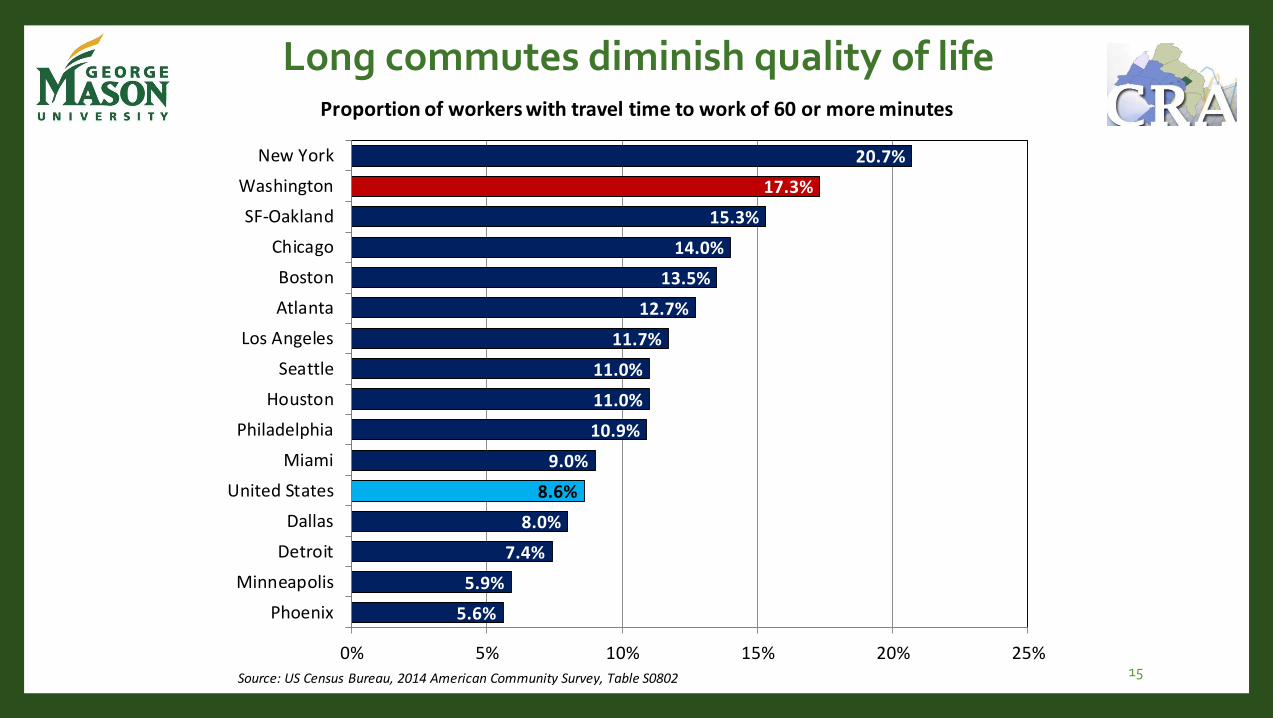
Long commutes diminish quality of life
5.6%
5.9%
7.4%
8.0%
8.6%
9.0%
10.9%
11.0%
11.0%
11.7%
12.7%
13.5%
14.0%
15.3%
17.3%
20.7%
0% 5% 10% 15% 20% 25%
Phoenix
Minneapolis
Detroit
Dallas
United States
Miami
Philadelphia
Houston
Seattle
Los Angeles
Atlanta
Boston
Chicago
SF-Oakland
Washington
New York
Proportion of workers with travel time to work of 60 or more minutes
Source: US Census Bureau, 2014 American Community Survey, Table S0802 15
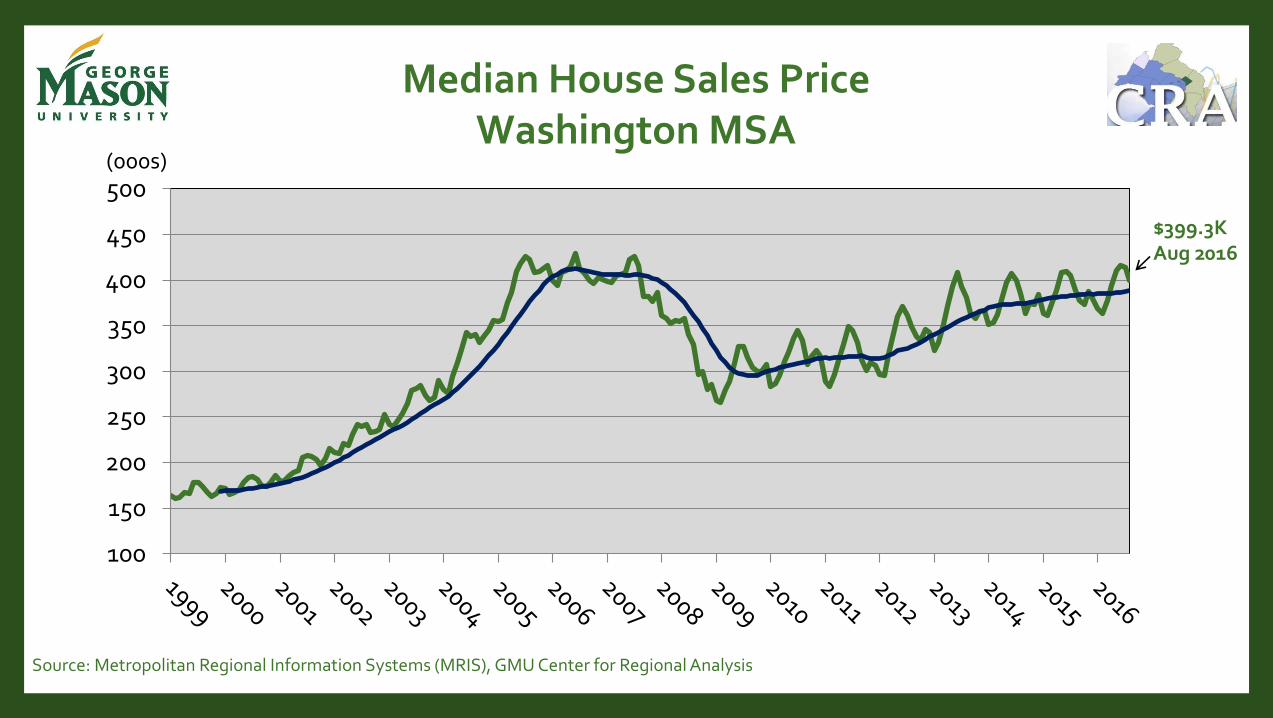
100
150
200
250
300
350
400
450
500
Median House Sales PriceWashington MSA
$399.3KAug 2016
Source: Metropolitan Regional Information Systems (MRIS), GMU Center for Regional Analysis
(000s)(000s)
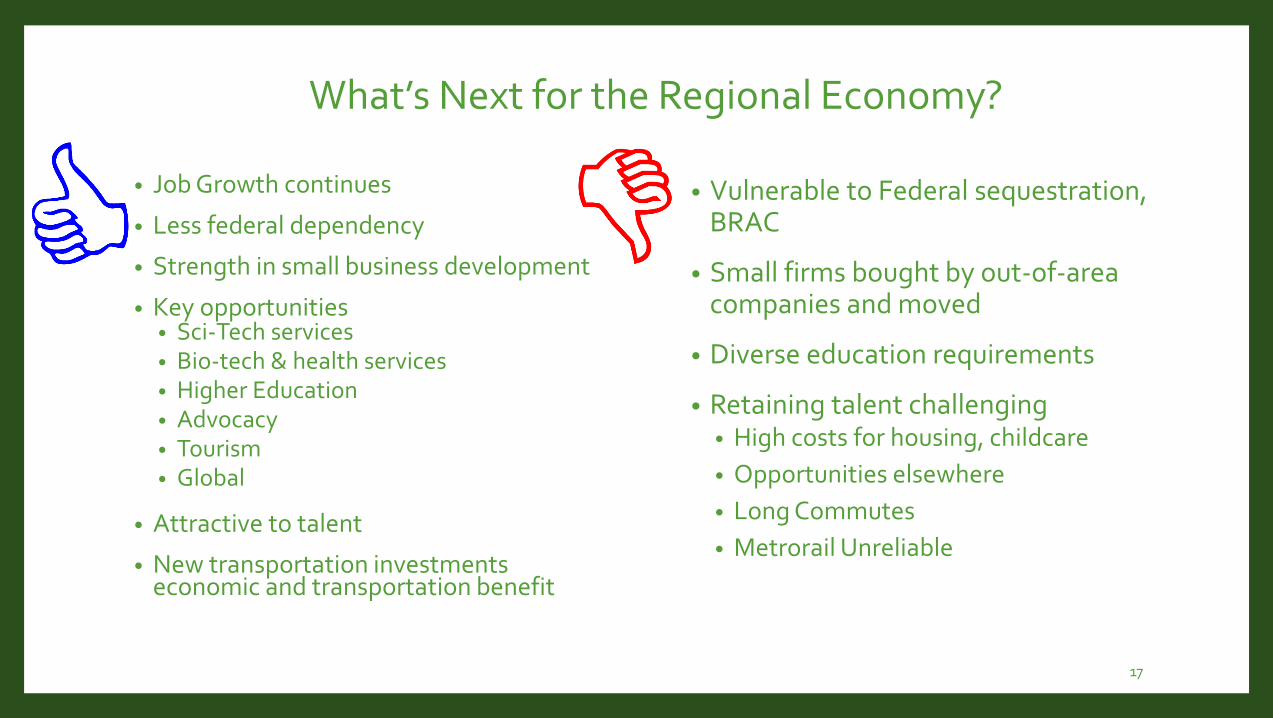
• Job Growth continues
• Less federal dependency
• Strength in small business development
• Key opportunities • Sci-Tech services• Bio-tech & health services • Higher Education• Advocacy• Tourism• Global
• Attractive to talent
• New transportation investments economic and transportation benefit
• Vulnerable to Federal sequestration, BRAC
• Small firms bought by out-of-area companies and moved
• Diverse education requirements
• Retaining talent challenging• High costs for housing, childcare
• Opportunities elsewhere
• Long Commutes
• Metrorail Unreliable
17
What’s Next for the Regional Economy?

Comments?
18