Embed Size (px)
Citation preview
Committed to innovation and growth
Alan Hippe, CFORoche Group
London, September 2012
This presentation contains certain forward-looking statements. These forward-looking statements may be identified by words such as ‘believes’, ‘expects’, ‘anticipates’, ‘projects’, ‘intends’, ‘should’, ‘seeks’, ‘estimates’, ‘future’ or similar expressions or by discussion of, among other things, strategy, goals, plans or intentions. Various factors may cause actual results to differ materially in the future from those reflected in forward-looking statements contained in this presentation, among others:1 pricing and product initiatives of competitors;2 legislative and regulatory developments and economic conditions; 3 delay or inability in obtaining regulatory approvals or bringing products to market; 4 fluctuations in currency exchange rates and general financial market conditions; 5 uncertainties in the discovery, development or marketing of new products or new uses of existing
products, including without limitation negative results of clinical trials or research projects, unexpected side-effects of pipeline or marketed products;
6 increased government pricing pressures; 7 interruptions in production; 8 loss of or inability to obtain adequate protection for intellectual property rights; 9 litigation;10 loss of key executives or other employees; and11 adverse publicity and news coverage.
Any statements regarding earnings per share growth is not a profit forecast and should not be interpreted to mean that Roche’s earnings or earnings per share for this year or any subsequent period will necessarily match or exceed the historical published earnings or earnings per share of Roche.
For marketed products discussed in this presentation, please see full prescribing information on our website – www.roche.com
All mentioned trademarks are legally protected
Our strategy
R&D productivity - general considerations
R&D allocation and governance at Roche
Continuous productivity improvements
Focus on cash and outlook
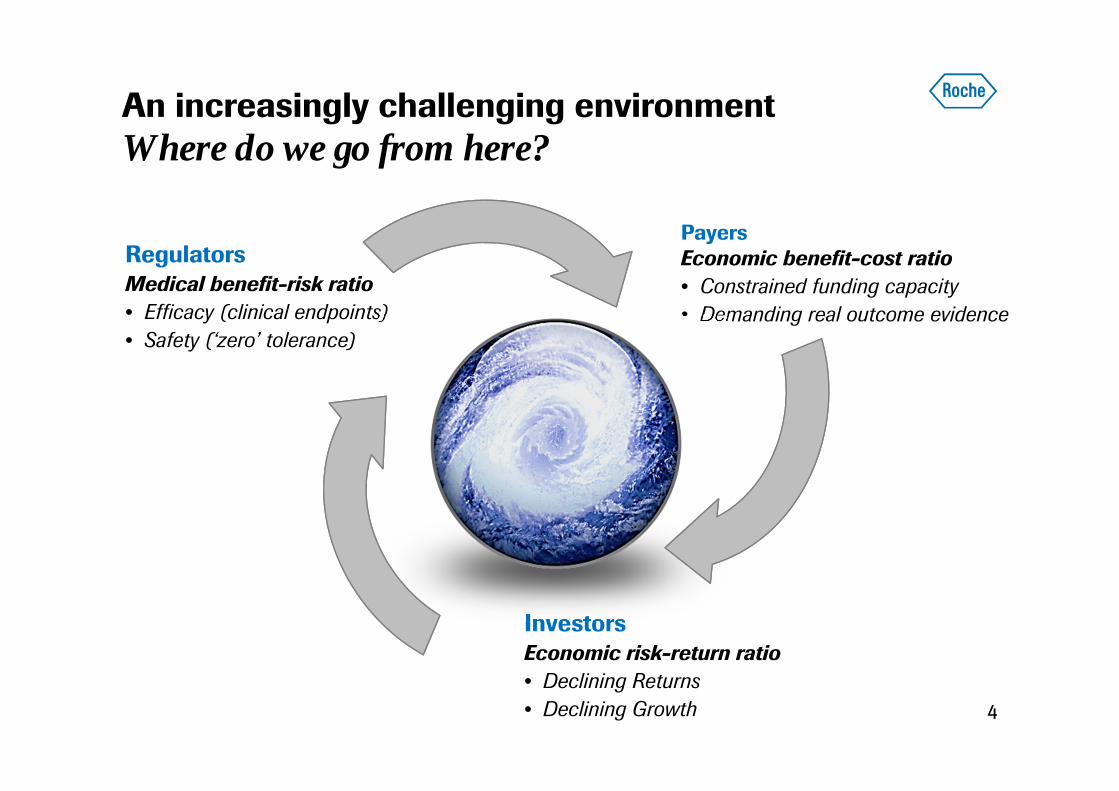
An increasingly challenging environmentWhere do we go from here?
4
RegulatorsMedical benefit-risk ratio• Efficacy (clinical endpoints)• Safety (‘zero’ tolerance)
PayersEconomic benefit-cost ratio• Constrained funding capacity• Demanding real outcome evidence
InvestorsEconomic risk-return ratio• Declining Returns • Declining Growth
5
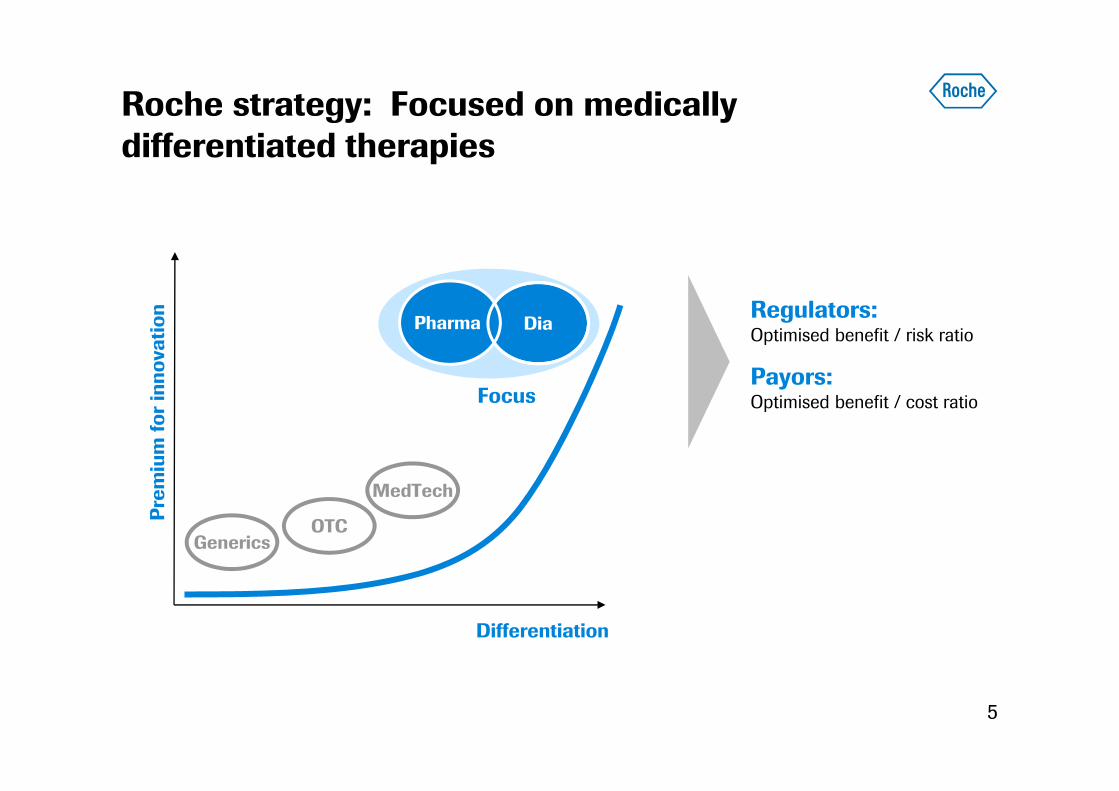
Roche strategy: Focused on medically differentiated therapies
Generics
Differentiation
MedTech
OTCPrem
ium
for
inno
vatio
n
DiaPharma
Focus
Regulators: Optimised benefit / risk ratio
Payors: Optimised benefit / cost ratio
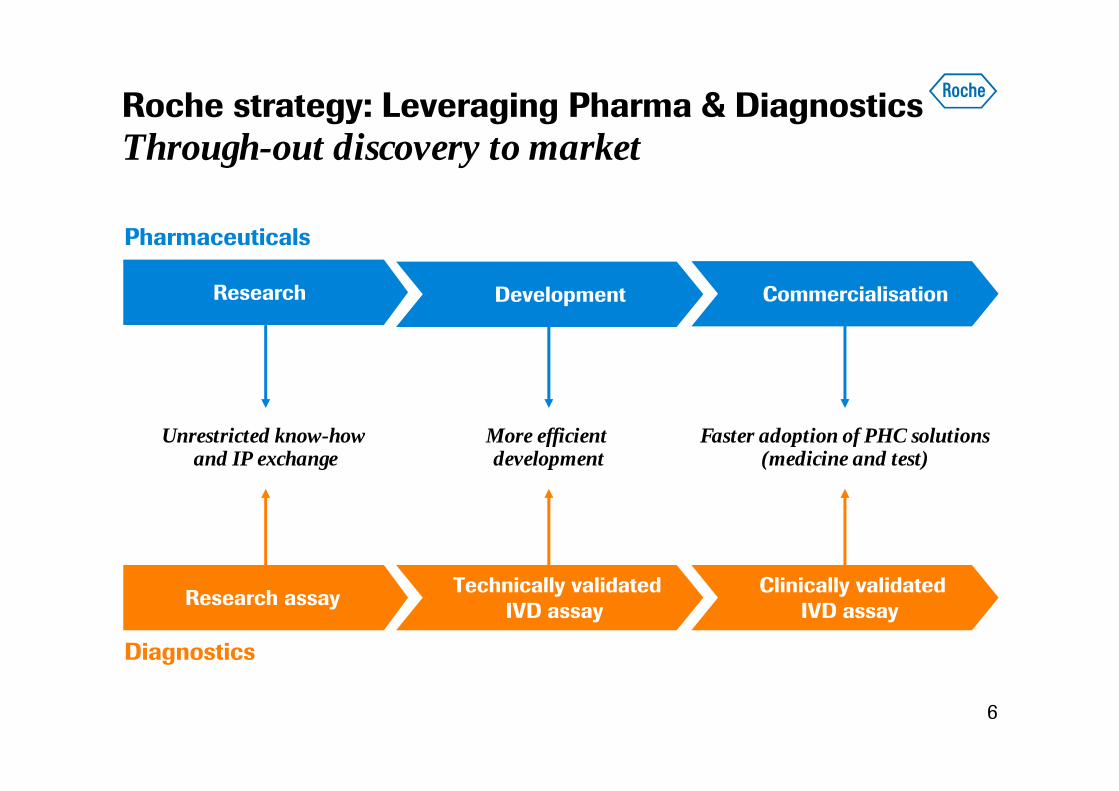
Roche strategy: Leveraging Pharma & Diagnostics Through-out discovery to market
Unrestricted know-how and IP exchange
Faster adoption of PHC solutions(medicine and test)
Pharmaceuticals
Diagnostics
Development CommercialisationResearch
Research assay Technically validated IVD assay
Clinically validated IVD assay
6
More efficient development
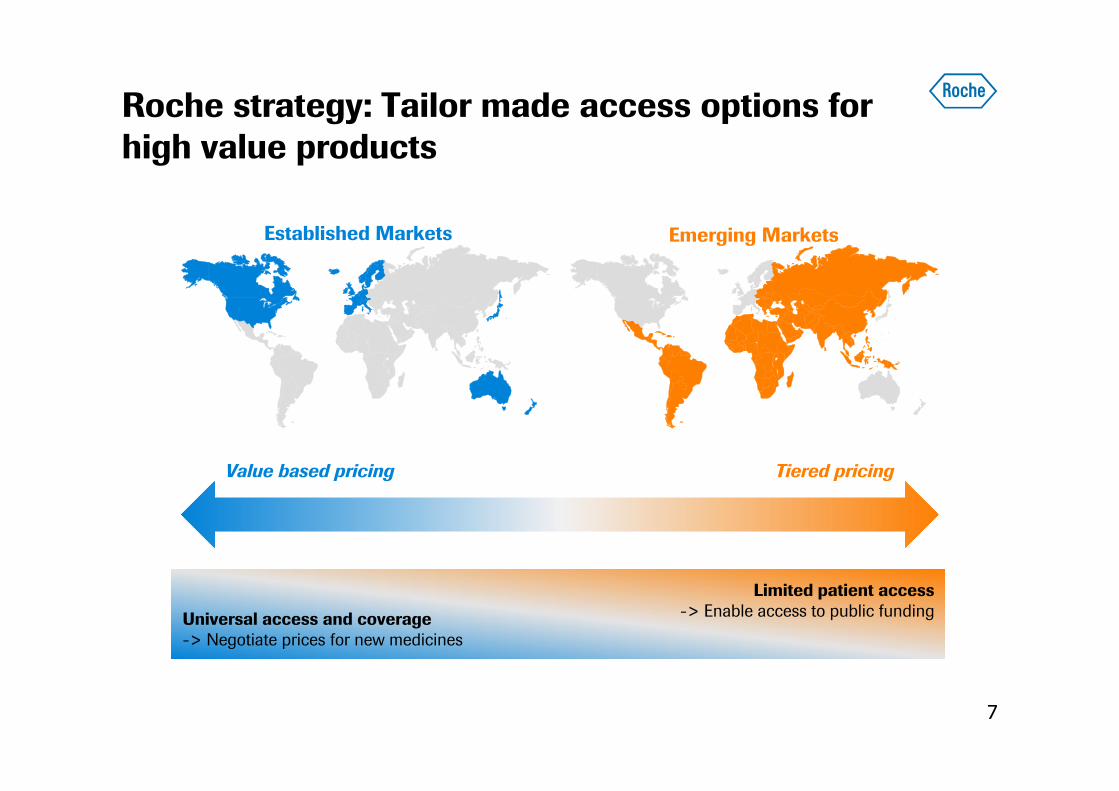
Roche strategy: Tailor made access options for high value products
7
Established Markets Emerging Markets
Universal access and coverage-> Negotiate prices for new medicines
Limited patient access-> Enable access to public funding
Value based pricing Tiered pricing
Our strategy
R&D productivity - general considerations
R&D allocation and governance at Roche
Continuous productivity improvements
Focus on cash and outlook
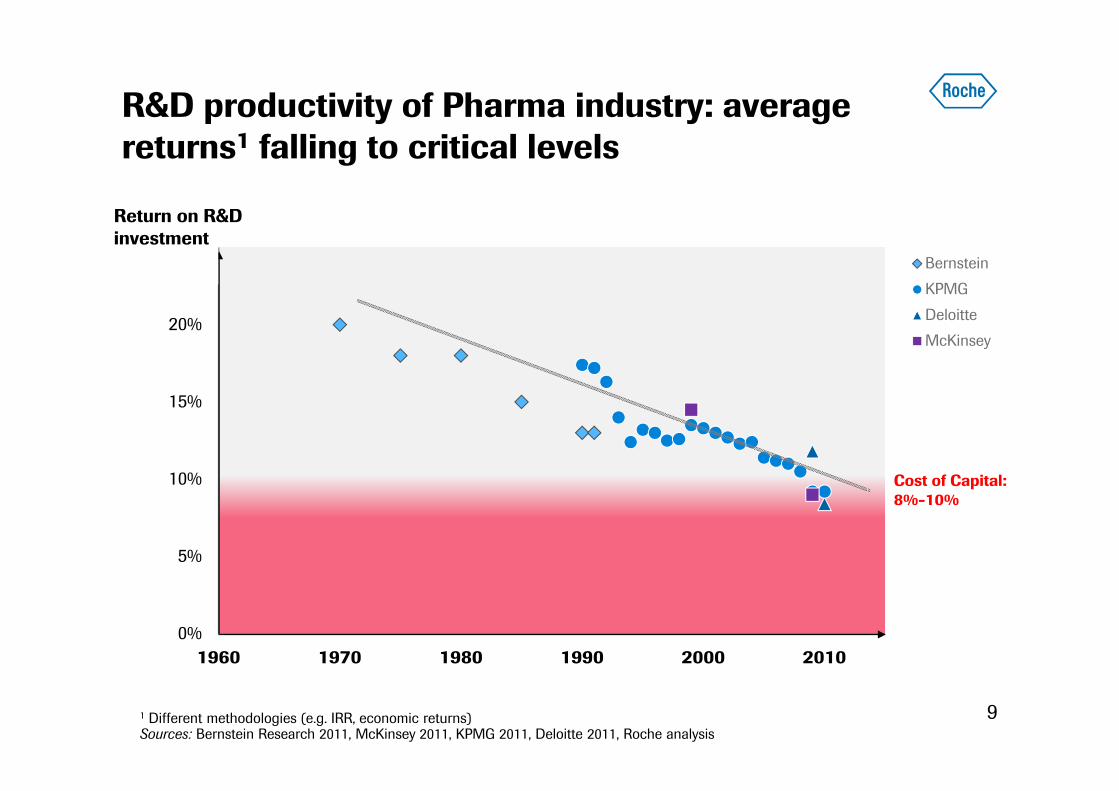
R&D productivity of Pharma industry: average returns1 falling to critical levels
91 Different methodologies (e.g. IRR, economic returns)Sources: Bernstein Research 2011, McKinsey 2011, KPMG 2011, Deloitte 2011, Roche analysis
0%
5%
10%
15%
20%
25%
1960 1970 1980 1990 2000 2010
Bernstein
KPMG
Deloitte
McKinsey
Cost of Capital: 8%-10%
Return on R&D investment
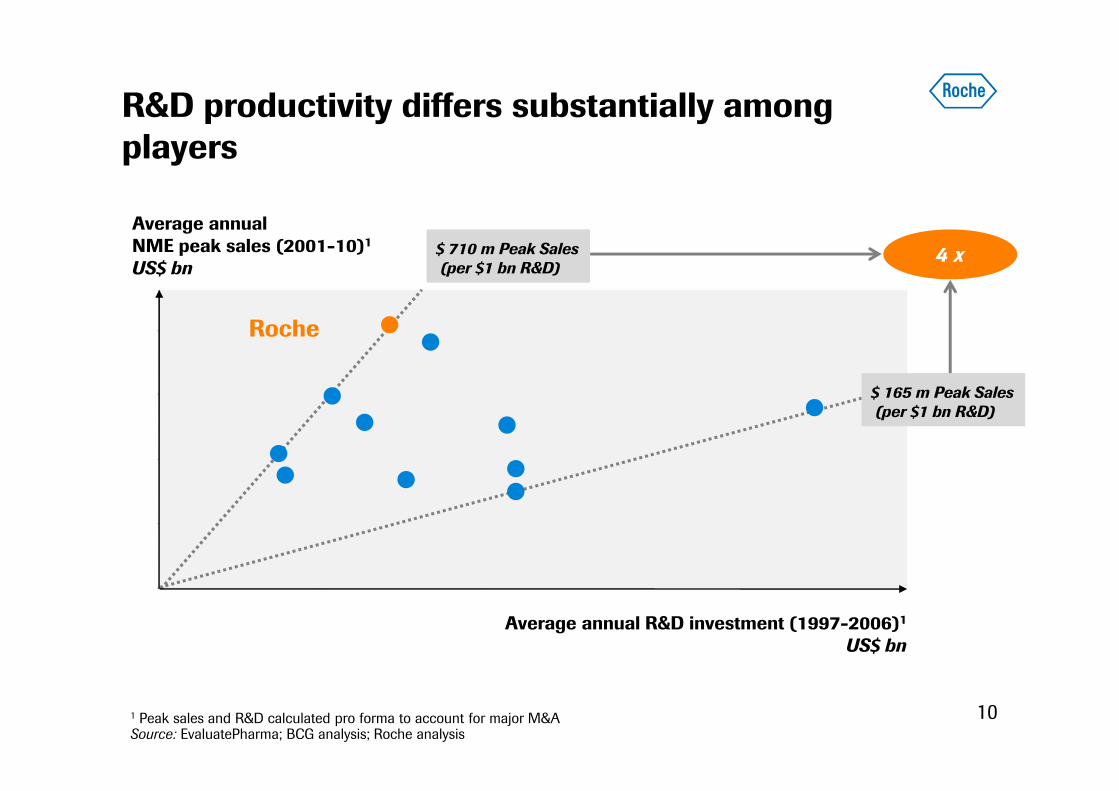
R&D productivity differs substantially among players
10
4 x$ 710 m Peak Sales(per $1 bn R&D)
Average annualNME peak sales (2001-10)1
US$ bn
Average annual R&D investment (1997-2006)1
US$ bn
Roche
1 Peak sales and R&D calculated pro forma to account for major M&ASource: EvaluatePharma; BCG analysis; Roche analysis
$ 165 m Peak Sales(per $1 bn R&D)
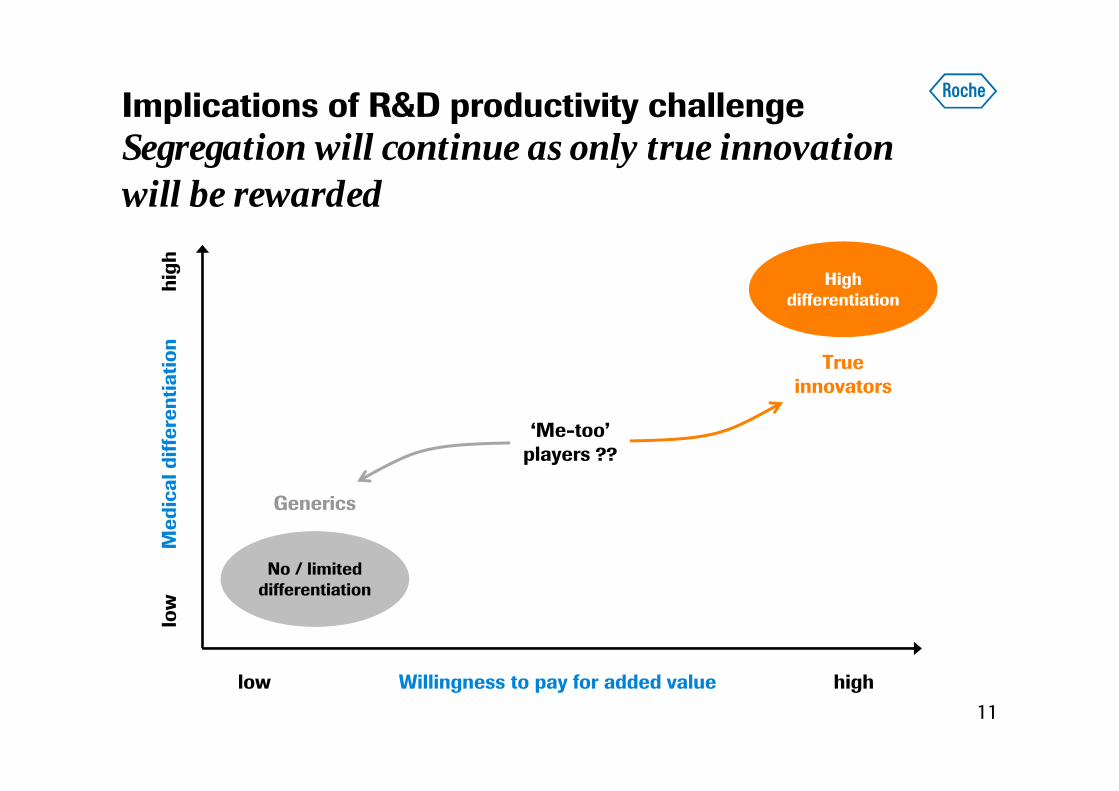
Implications of R&D productivity challengeSegregation will continue as only true innovation will be rewarded
11Willingness to pay for added value
Med
ical
diff
eren
tiatio
n
highlow
No / limited differentiation
High differentiation
True innovators
Generics
‘Me-too’ players ??
low
high
Our strategy
R&D productivity - general considerations
R&D allocation and governance at Roche
Continuous productivity improvements
Focus on cash and outlook
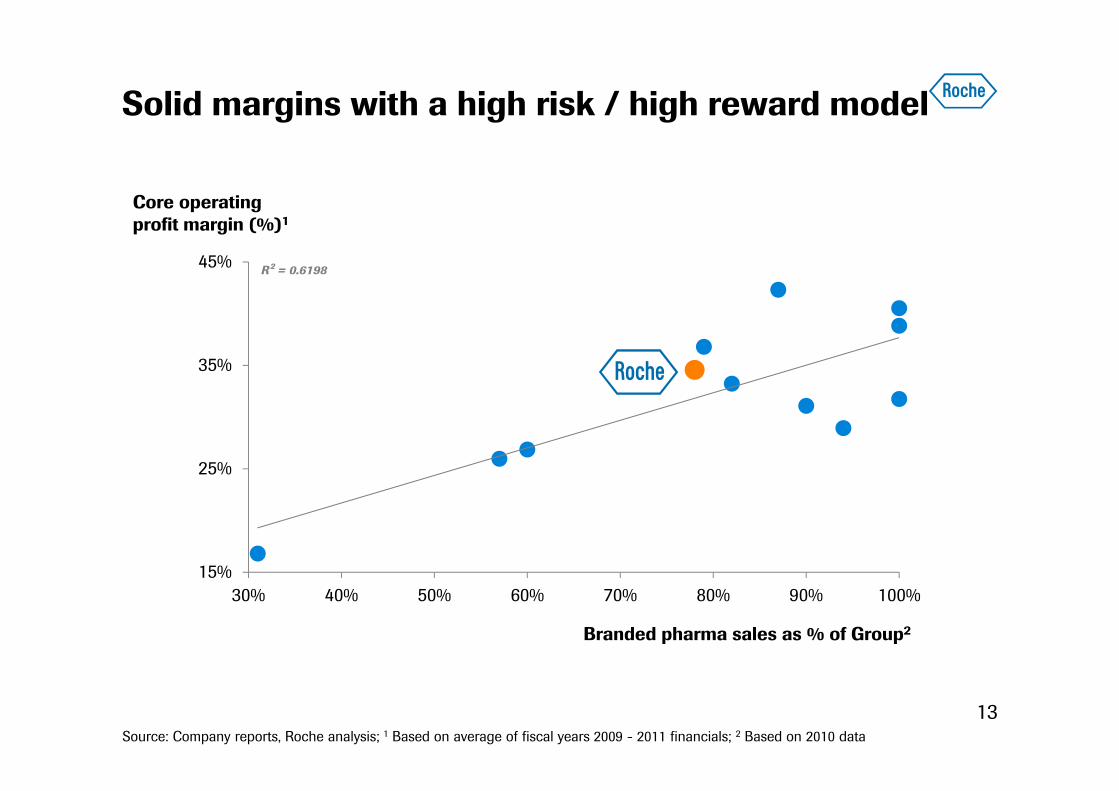
Solid margins with a high risk / high reward model
13Source: Company reports, Roche analysis; 1 Based on average of fiscal years 2009 - 2011 financials; 2 Based on 2010 data
Core operating profit margin (%)1
Branded pharma sales as % of Group2
Pfizer Astra
Sanofi
Merck
GSK
Novartis
Eli Lilly
Bayer
BMS
Amgen
Abbott
R² = 0.6198
15%
25%
35%
45%
30% 40% 50% 60% 70% 80% 90% 100%
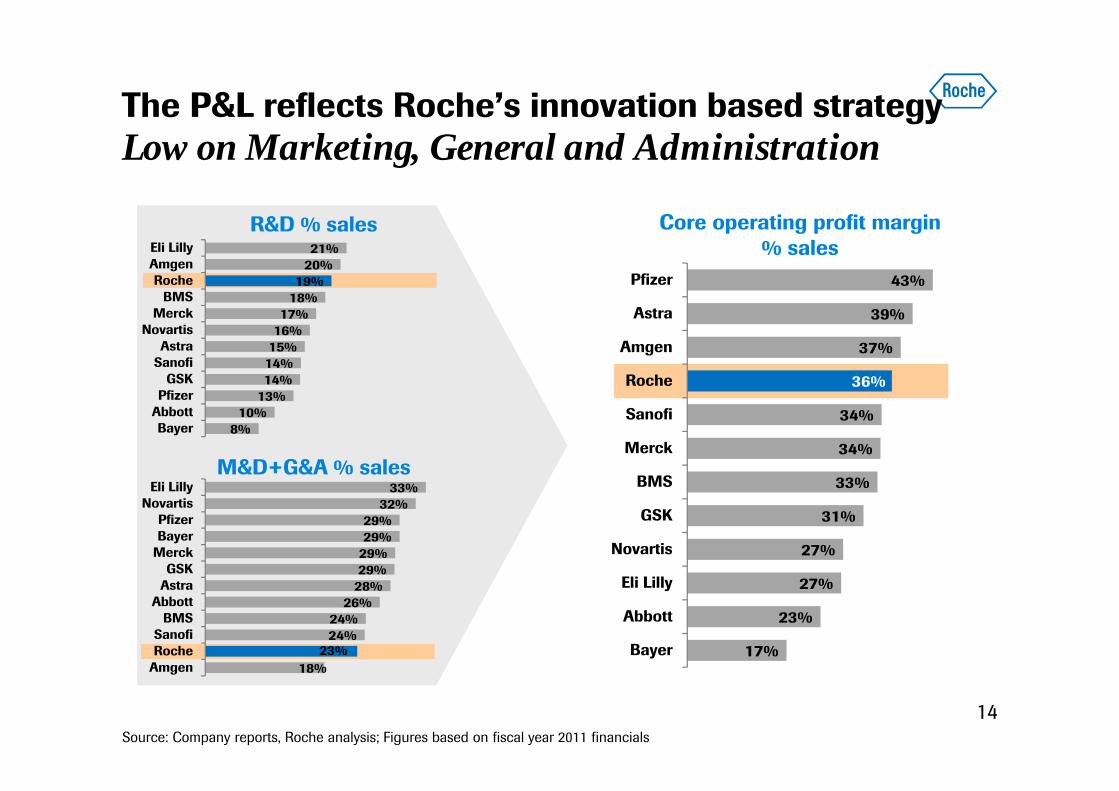
The P&L reflects Roche’s innovation based strategy Low on Marketing, General and Administration
14
33%32%
29%29%
29%29%
28%26%
24%24%
23%18%
Eli LillyNovartis
PfizerBayer
MerckGSK
AstraAbbott
BMSSanofiRoche
Amgen
R&D % sales Core operating profit margin% sales
M&D+G&A % sales
21%20%
19%18%
17%16%
15%14%14%
13%10%
8%
Eli LillyAmgenRoche
BMSMerck
NovartisAstra
SanofiGSK
PfizerAbbottBayer
43%
39%
37%
36%
34%
34%
33%
31%
27%
27%
23%
17%
Pfizer
Astra
Amgen
Roche
Sanofi
Merck
BMS
GSK
Novartis
Eli Lilly
Abbott
Bayer
Source: Company reports, Roche analysis; Figures based on fiscal year 2011 financials
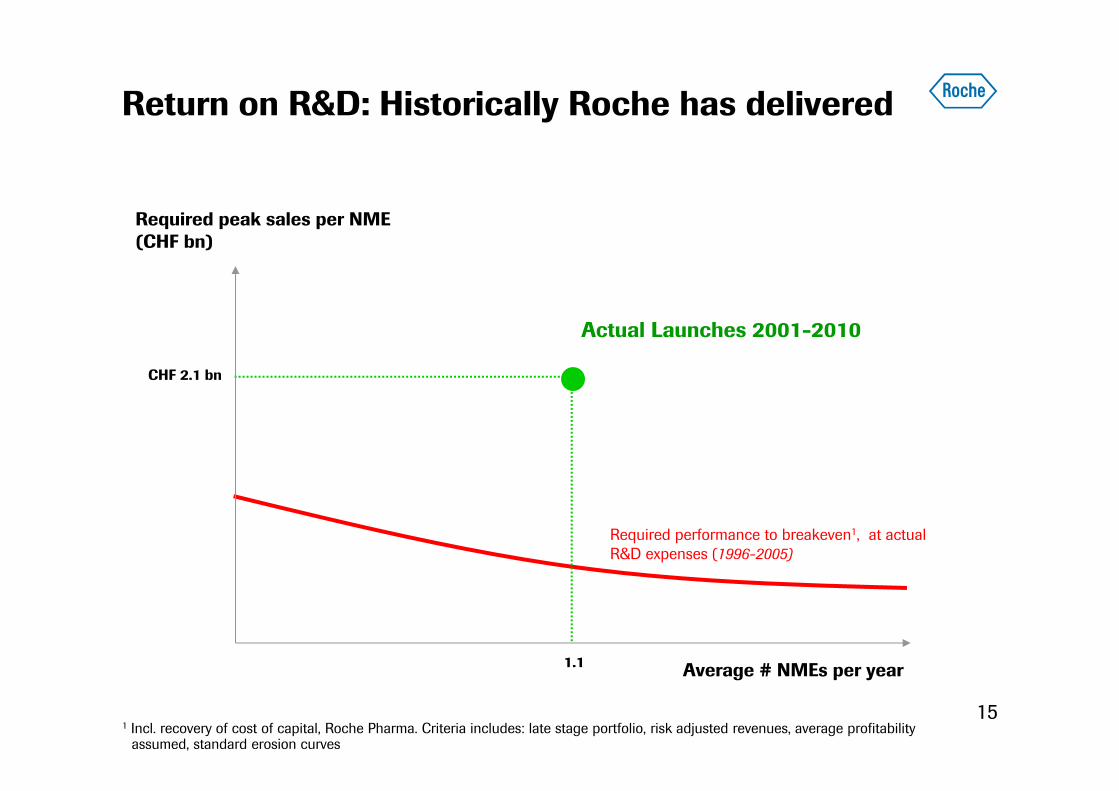
Return on R&D: Historically Roche has delivered
151 Incl. recovery of cost of capital, Roche Pharma. Criteria includes: late stage portfolio, risk adjusted revenues, average profitability
assumed, standard erosion curves
Average # NMEs per year
Required performance to breakeven1, at actual R&D expenses (1996-2005)
Actual Launches 2001-2010
CHF 2.1 bn
1.1
Required peak sales per NME(CHF bn)
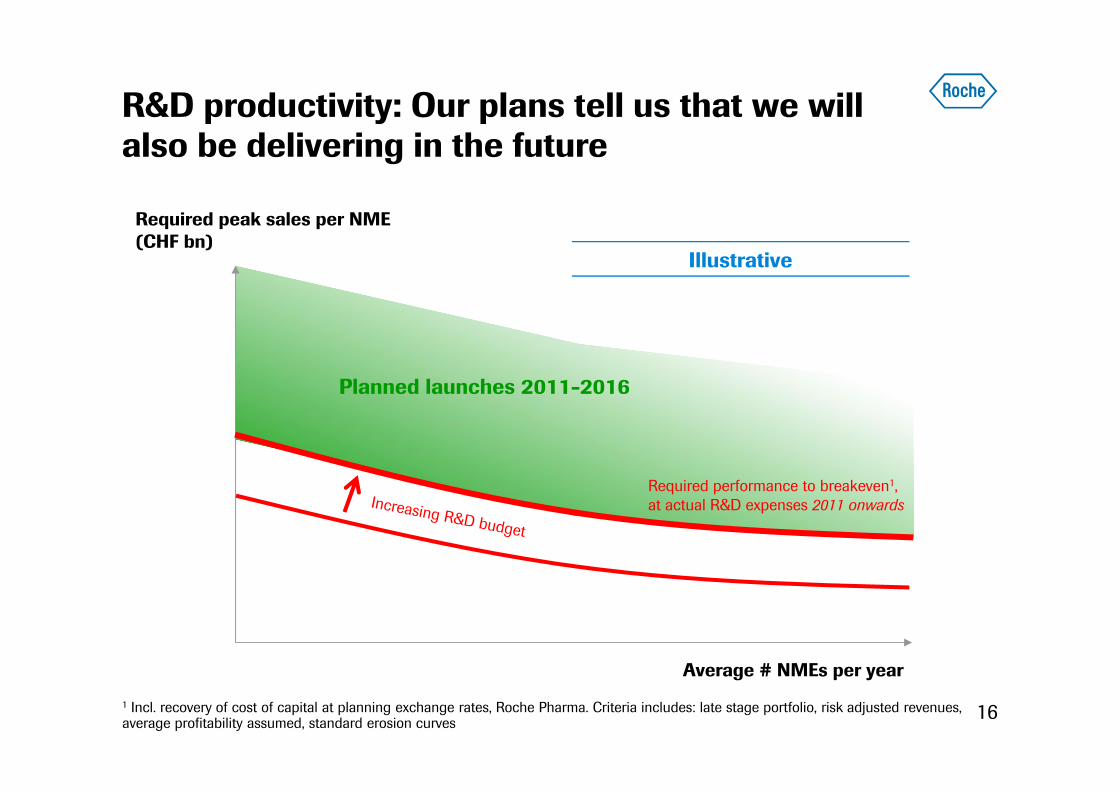
R&D productivity: Our plans tell us that we will also be delivering in the future
16
Required peak sales per NME(CHF bn)
Required performance to breakeven1, at actual R&D expenses 2011 onwards
Illustrative
Planned launches 2011-2016
1 Incl. recovery of cost of capital at planning exchange rates, Roche Pharma. Criteria includes: late stage portfolio, risk adjusted revenues, average profitability assumed, standard erosion curves
Average # NMEs per year
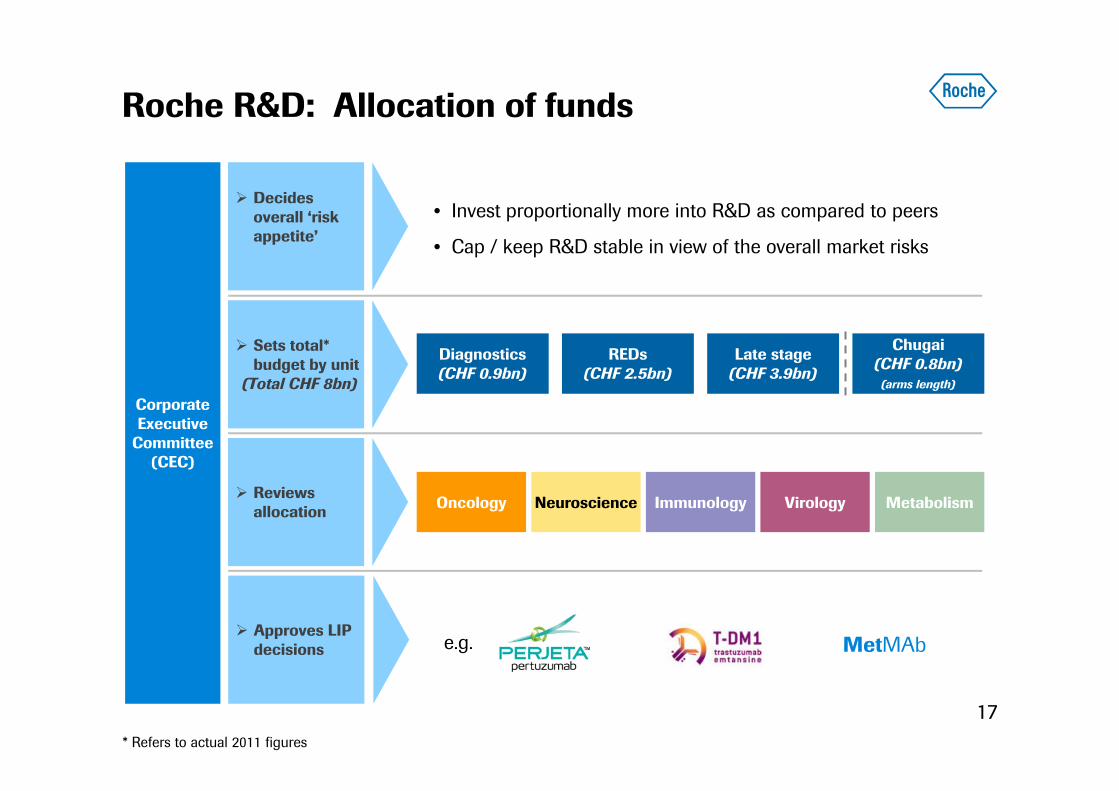
Roche R&D: Allocation of funds
17
Decides overall ‘risk appetite’
Corporate Executive
Committee(CEC)
Sets total* budget by unit
(Total CHF 8bn)
• Invest proportionally more into R&D as compared to peers
• Cap / keep R&D stable in view of the overall market risks
Diagnostics(CHF 0.9bn)
REDs(CHF 2.5bn)
Chugai(CHF 0.8bn)
(arms length)
Late stage(CHF 3.9bn)
Reviews allocation
Approves LIP decisions
Oncology Neuroscience Immunology Virology Metabolism
MetMAbe.g.
* Refers to actual 2011 figures
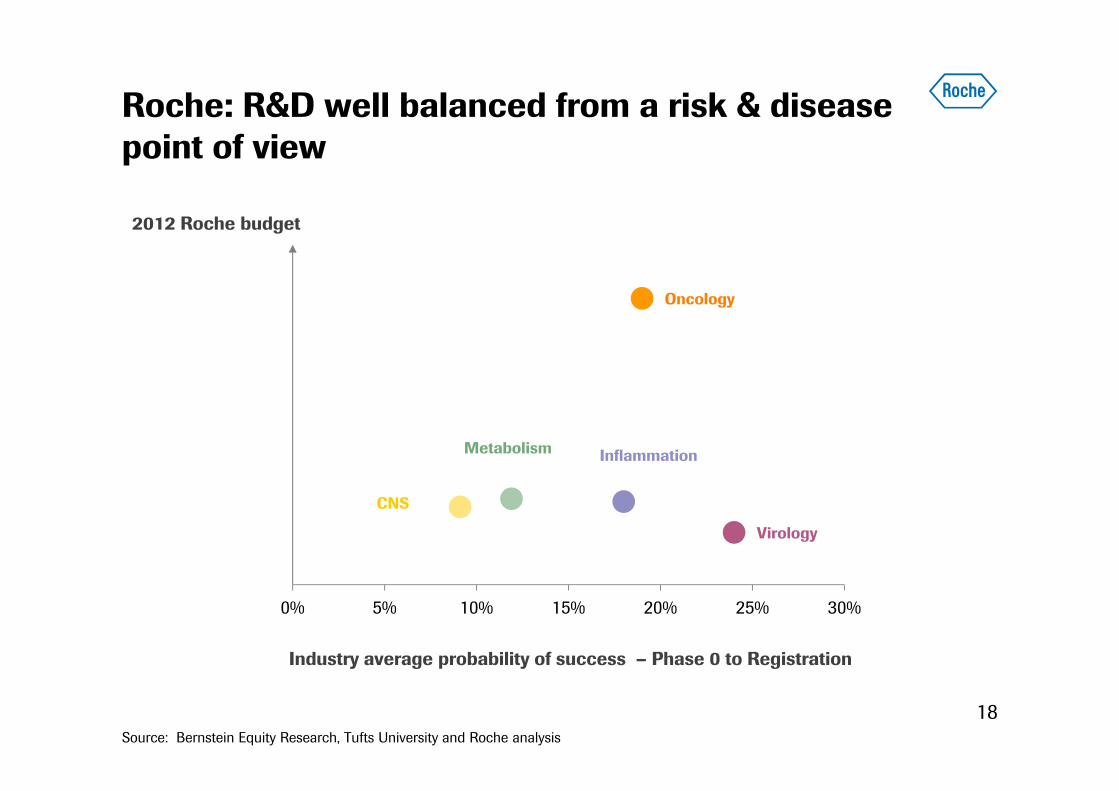
Roche: R&D well balanced from a risk & disease point of view
18Source: Bernstein Equity Research, Tufts University and Roche analysis
Industry average probability of success – Phase 0 to Registration
Oncology
Virology
CNS
0% 5% 10% 15% 20% 25% 30%
InflammationMetabolism
2012 Roche budget
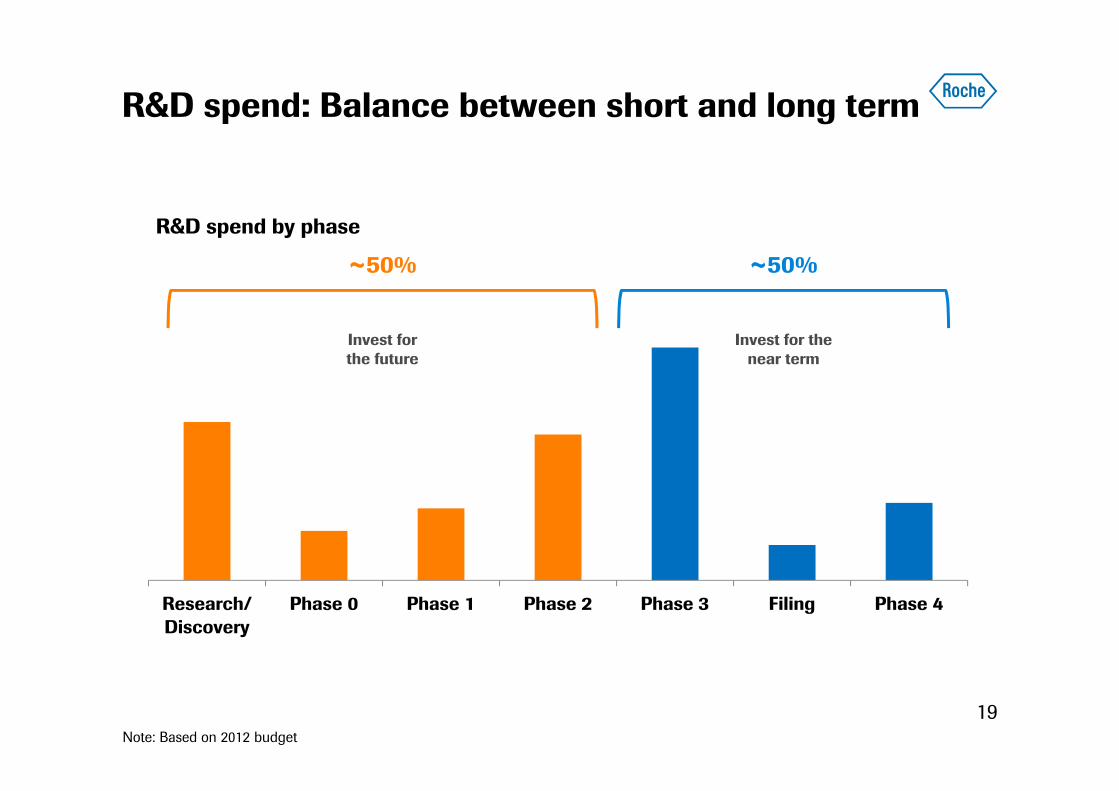
R&D spend: Balance between short and long term
19
Research/Discovery
Phase 0 Phase 1 Phase 2 Phase 3 Filing Phase 4
R&D spend by phase
~50% ~50%
Invest for the near term
Invest for the future
Note: Based on 2012 budget
Our strategy
R&D productivity - general considerations
R&D allocation and governance at Roche
Continuous productivity improvements
Focus on cash and outlook
Base Increasesuccess rate
Reduce timeto market
"Innovation" Reduce costbase
Innovation+ Efficiency
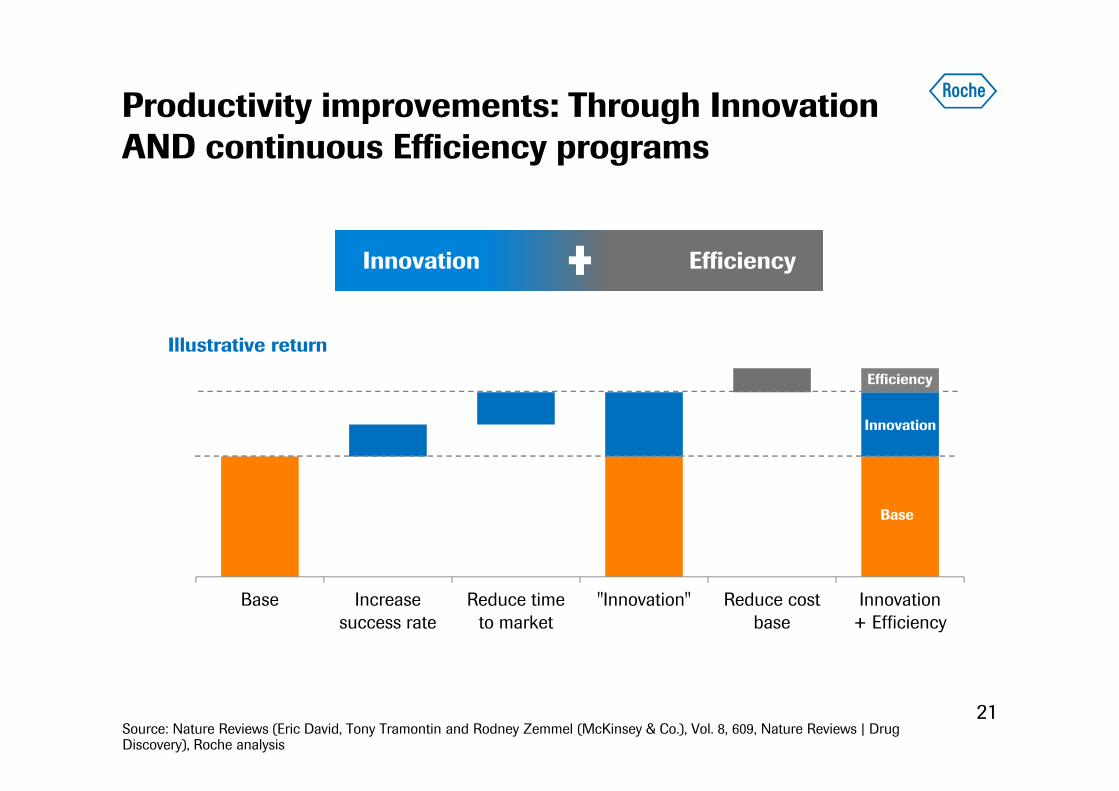
Productivity improvements: Through Innovation AND continuous Efficiency programs
21Source: Nature Reviews (Eric David, Tony Tramontin and Rodney Zemmel (McKinsey & Co.), Vol. 8, 609, Nature Reviews | Drug Discovery), Roche analysis
Innovation Efficiency
Innovation
Efficiency
Base
Illustrative return
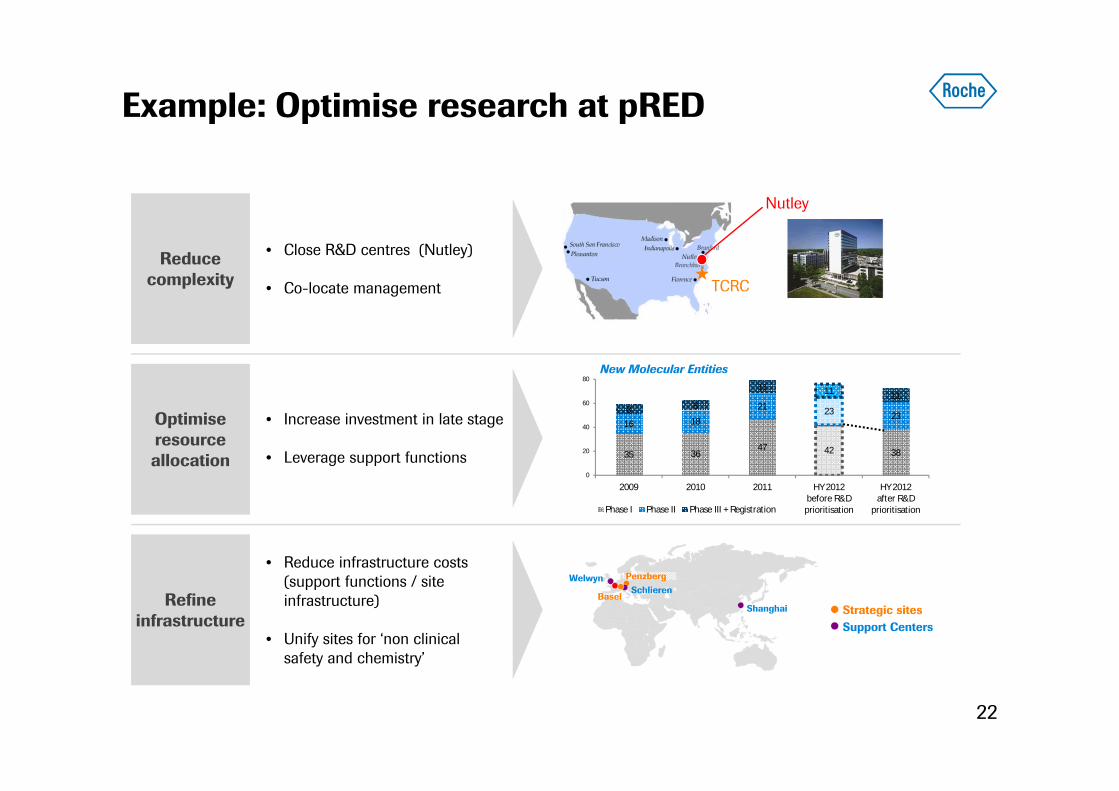
22
Reduce complexity
Optimise resource allocation
Refine infrastructure
Nutley
• Increase investment in late stage
• Leverage support functions
• Reduce infrastructure costs (support functions / site infrastructure)
• Unify sites for ‘non clinical safety and chemistry’
• Close R&D centres (Nutley)
• Co-locate managementTCRC
Example: Optimise research at pRED
ShanghaiBasel
Welwyn PenzbergSchlieren
Support CentersStrategic sites
35 3647 42 38
16 18
21 23 238 8
11 11 11
0
20
40
60
80
2009 2010 2011 HY 2012before R&D
prioritisation
HY 2012after R&D
prioritisationPhase I Phase II Phase III + Registration
New Molecular Entities
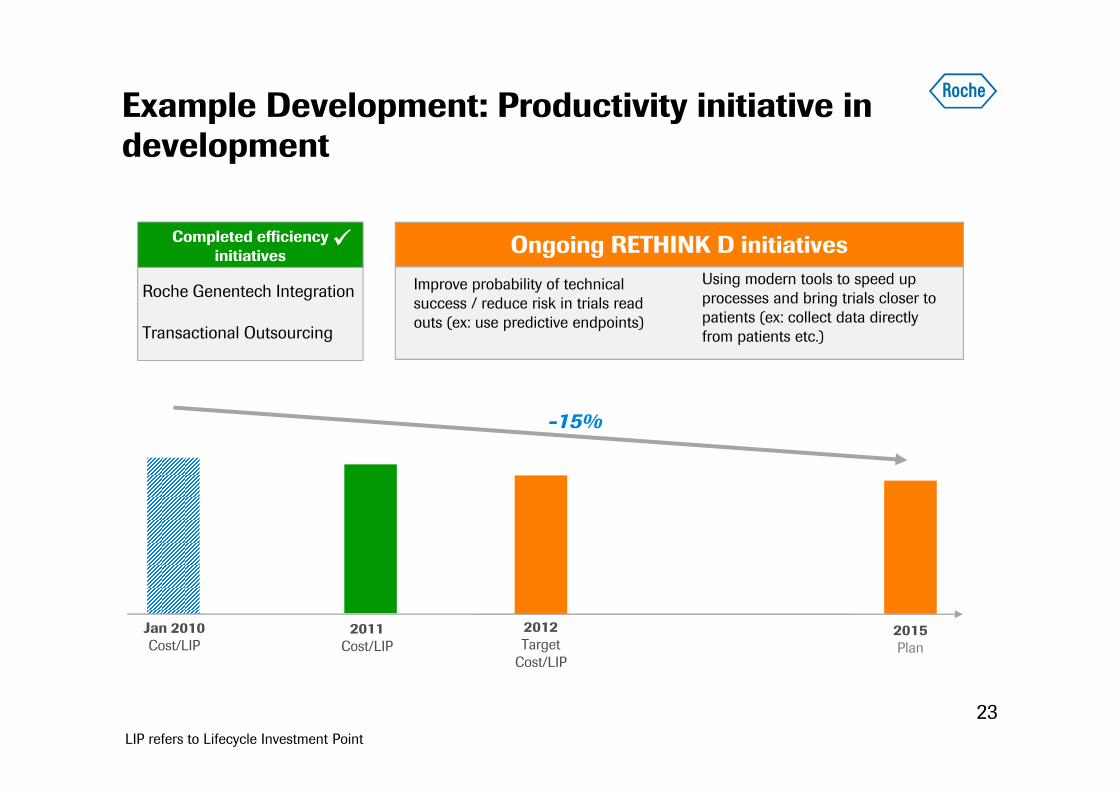
Example Development: Productivity initiative in development
23
Roche Genentech Integration
Transactional Outsourcing
Completed efficiency initiatives
-15%
Jan 2010Cost/LIP
2011Cost/LIP
2012Target
Cost/LIP
2015Plan
Ongoing RETHINK D initiativesImprove probability of technical success / reduce risk in trials read outs (ex: use predictive endpoints)
Using modern tools to speed up processes and bring trials closer to patients (ex: collect data directly from patients etc.)
LIP refers to Lifecycle Investment Point
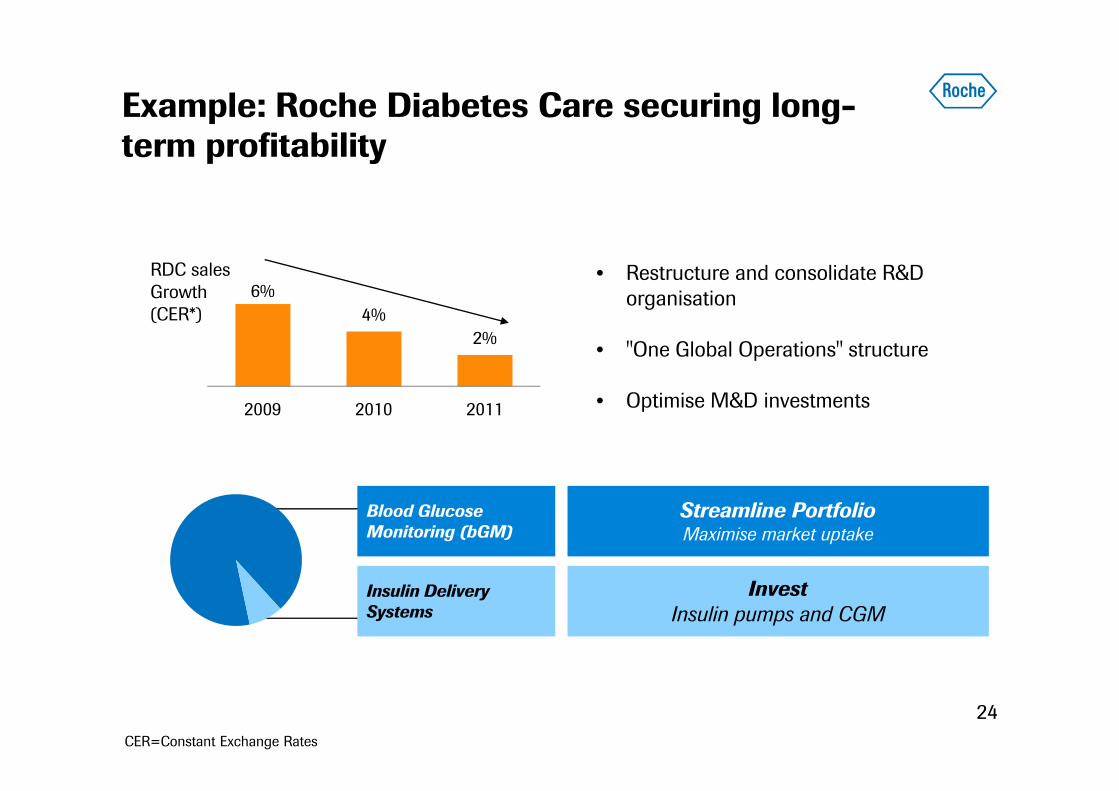
Example: Roche Diabetes Care securing long-term profitability
24
6%4%
2%
2009 2010 2011
Blood GlucoseMonitoring (bGM)
Insulin DeliverySystems
Streamline PortfolioMaximise market uptake
InvestInsulin pumps and CGM
RDC salesGrowth (CER*)
• Restructure and consolidate R&Dorganisation
• "One Global Operations" structure
• Optimise M&D investments
CER=Constant Exchange Rates
Our strategy
R&D productivity - general considerations
R&D allocation and governance at Roche
Continuous productivity improvements
Focus on cash and outlook
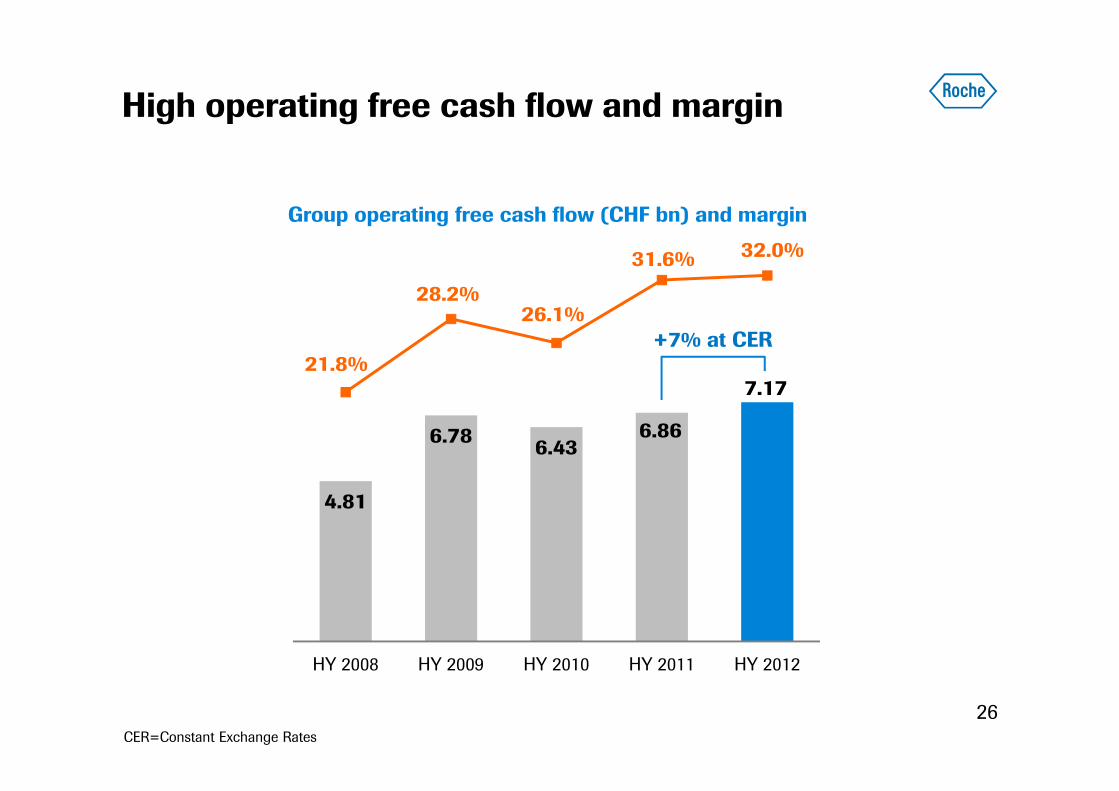
High operating free cash flow and margin
26
4.81
6.78 6.436.86
7.1721.8%
28.2%26.1%
31.6% 32.0%
HY 2008 HY 2009 HY 2010 HY 2011 HY 2012
Group operating free cash flow (CHF bn) and margin
CER=Constant Exchange Rates
+7% at CER
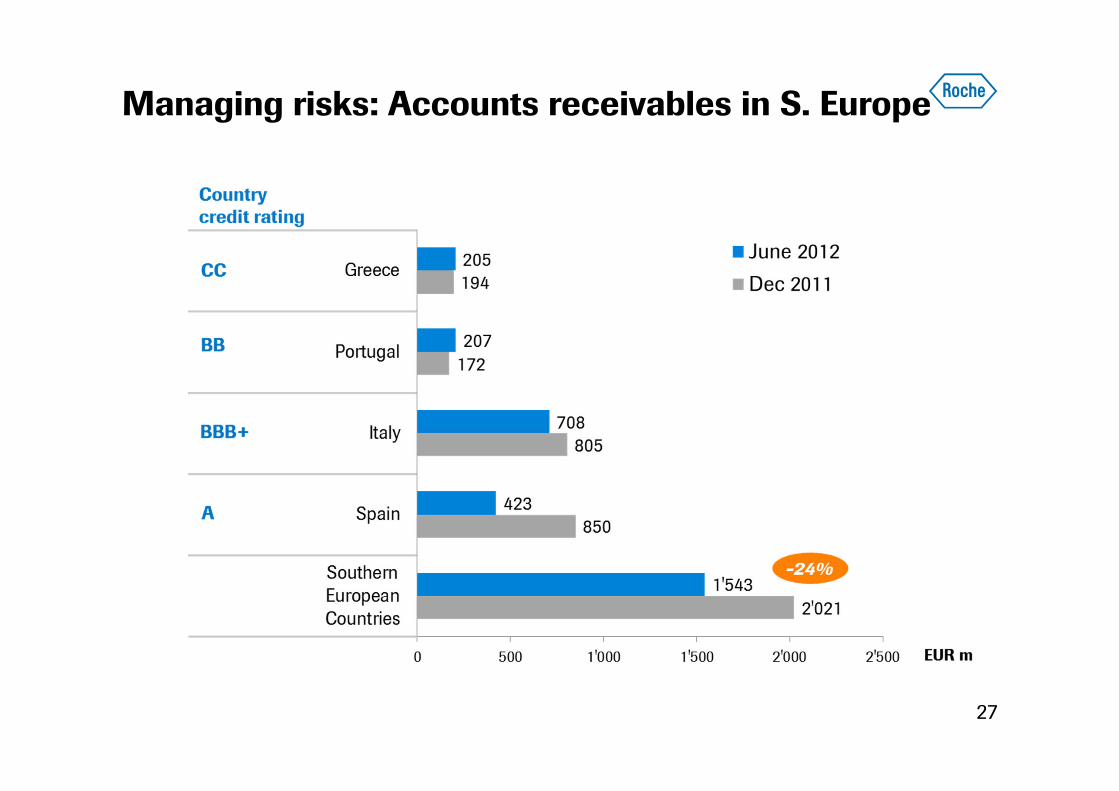
Managing risks: Accounts receivables in S. Europe
27
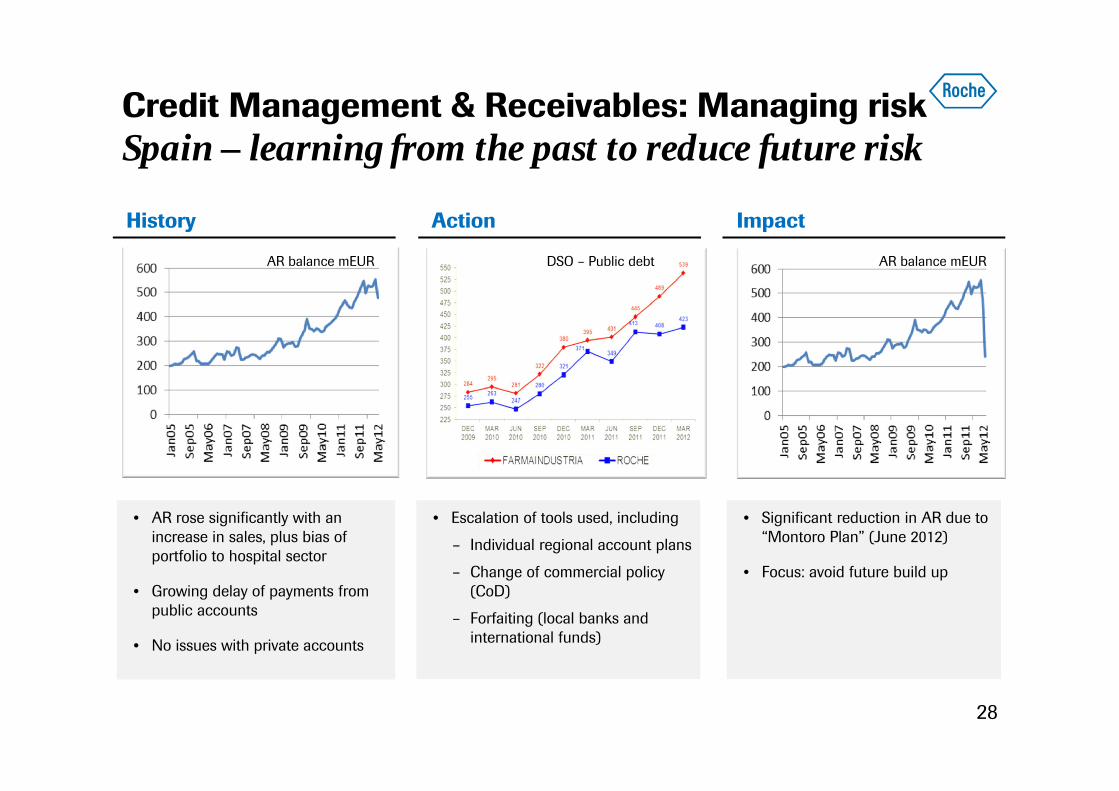
Credit Management & Receivables: Managing riskSpain – learning from the past to reduce future risk
28
• AR rose significantly with an increase in sales, plus bias of portfolio to hospital sector
• Growing delay of payments from public accounts
• No issues with private accounts
• Escalation of tools used, including
– Individual regional account plans
– Change of commercial policy (CoD)
– Forfaiting (local banks and international funds)
History
• Significant reduction in AR due to “Montoro Plan” (June 2012)
• Focus: avoid future build up
Action Impact
AR balance mEUR AR balance mEURDSO – Public debt
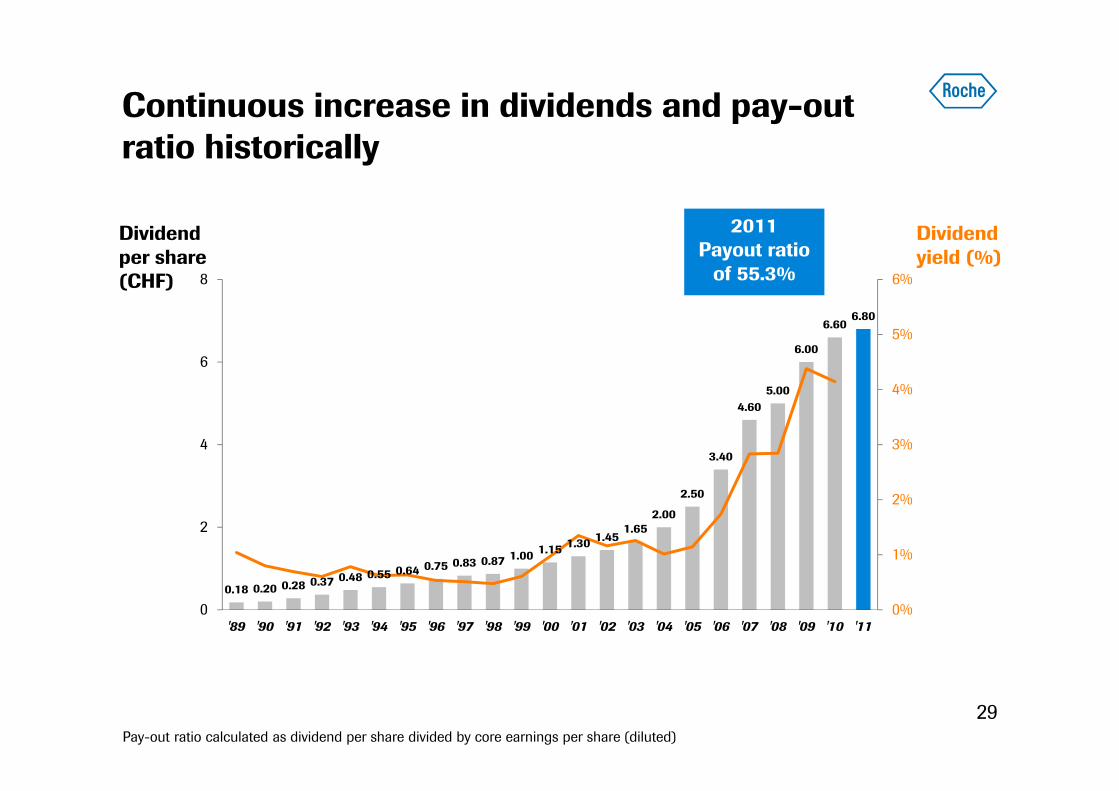
Continuous increase in dividends and pay-out ratio historically
29
0.18 0.20 0.28 0.37 0.48 0.55 0.64 0.75 0.83 0.87 1.00 1.15 1.30 1.451.65
2.00
2.50
3.40
4.605.00
6.00
6.606.80
0%
1%
2%
3%
4%
5%
6%
0
2
4
6
8
'89 '90 '91 '92 '93 '94 '95 '96 '97 '98 '99 '00 '01 '02 '03 '04 '05 '06 '07 '08 '09 '10 '11
Pay-out ratio calculated as dividend per share divided by core earnings per share (diluted)
Dividend per share (CHF)
2011Payout ratio
of 55.3%
Dividend yield (%)
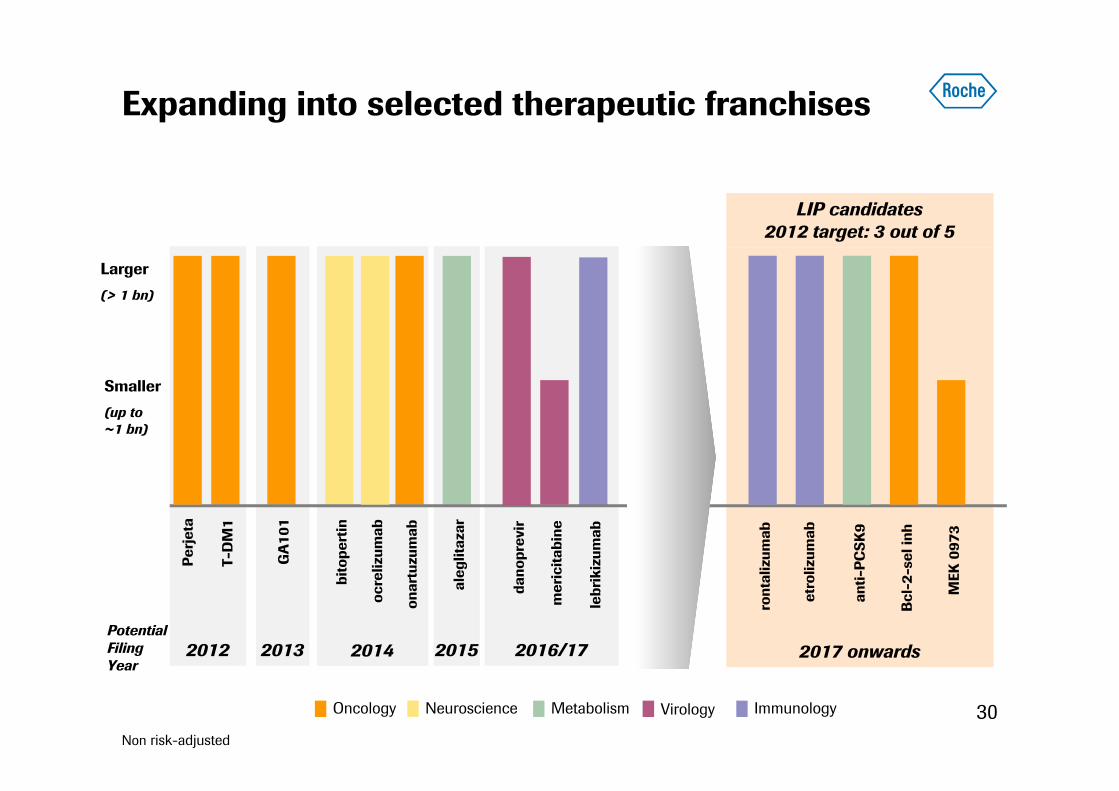
Expanding into selected therapeutic franchises
30Non risk-adjusted
2017 onwards20152012 2013 2014
aleg
litaz
ar
onar
tuzu
mab
ocre
lizum
ab
T-D
M1
PotentialFilingYear
GA
101
bito
pert
in
Larger
(> 1 bn)
Smaller
(up to ~1 bn)
MetabolismOncology ImmunologyNeuroscience Virology
2016/17
lebr
ikiz
umab
ront
aliz
umab
anti-
PCSK
9
LIP candidates2012 target: 3 out of 5
Bcl
-2-s
el in
h
etro
lizum
ab
MEK
097
3
mer
icita
bine
dano
prev
ir
Perj
eta
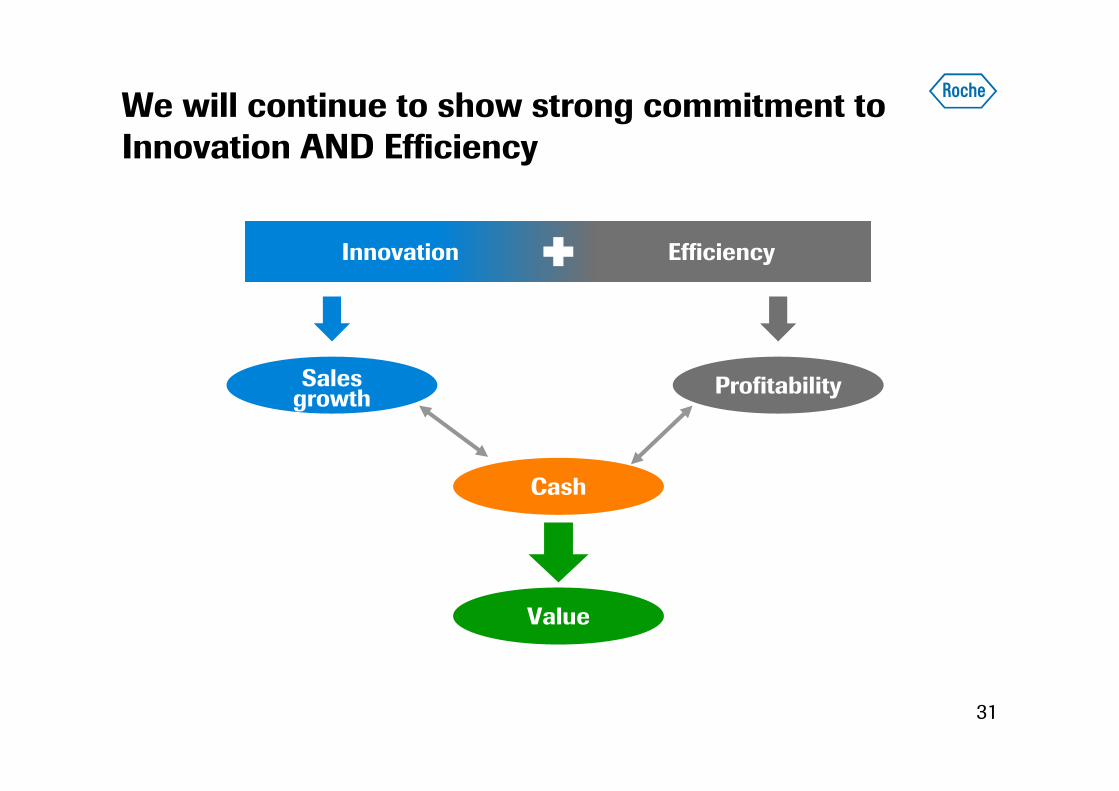
Cash
ProfitabilitySalesgrowth
We will continue to show strong commitment to Innovation AND Efficiency
31
Value
Innovation Efficiency
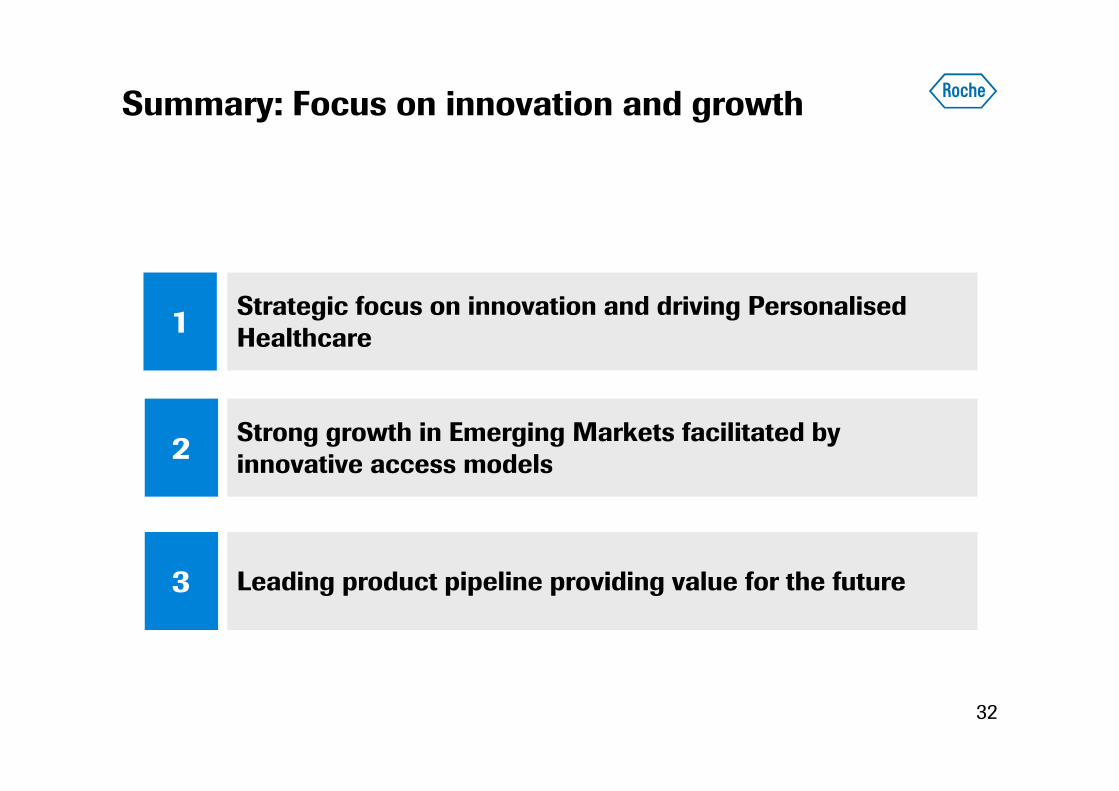
Summary: Focus on innovation and growth
1
2 Strong growth in Emerging Markets facilitated by innovative access models
3 Leading product pipeline providing value for the future
Strategic focus on innovation and driving Personalised Healthcare
32
We Innovate Healthcare