Embed Size (px)
Citation preview

Commissioning for Falls Prevention in Care Home Services
Matthew Areskog – Commissioning Manager
Key Areas
1. The Bristol Context
2. Commissioning for better outcomes
3. Service Specification 2012
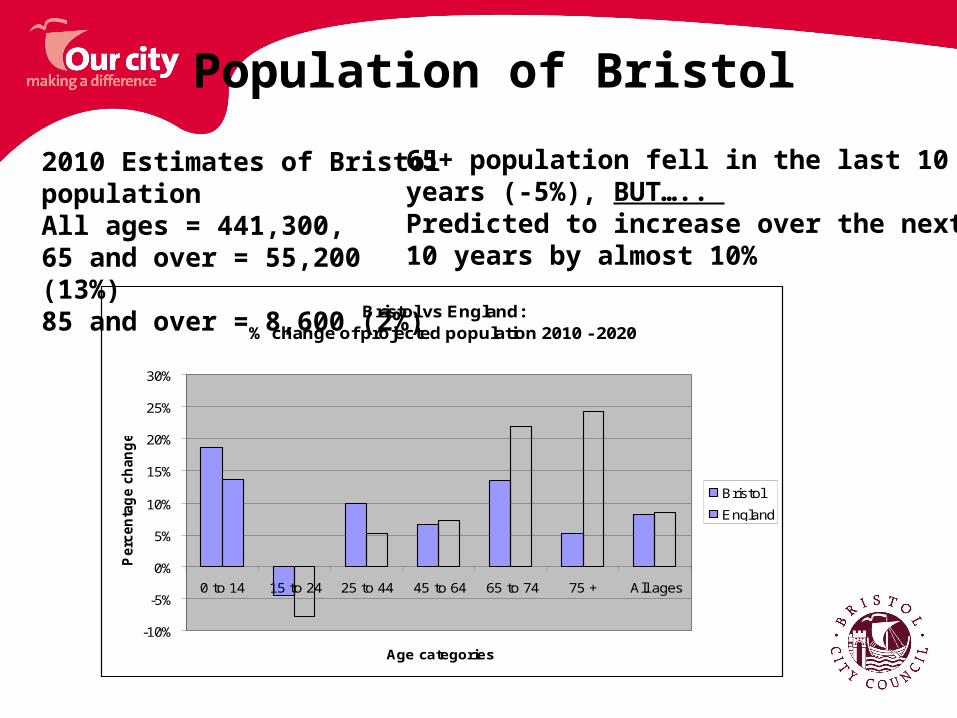
Bristol vs England: % change of projected population 2010 - 2020
-10%
-5%
0%
5%
10%
15%
20%
25%
30%
0 to 14 15 to 24 25 to 44 45 to 64 65 to 74 75 + All ages
Age categories
Perc
en
tag
e c
han
ge
Bristol
England
Population of Bristol
2010 Estimates of Bristol population All ages = 441,300, 65 and over = 55,200 (13%)85 and over = 8,600 (2%)
65+ population fell in the last 10 years (-5%), BUT….. Predicted to increase over the next 10 years by almost 10%

Health & Wellbeing
- More older people living alone (+5% to 2020)
- 22% older people in income-deprived households
- People living longer, with complex health and social care needs
- Inequalities across city
- Link between areas with high rates of obesity and diabetes
- Increasing pressure on informal carers
619 to 1096.9
1097 to 1575.8
1575.9 to 2086.4
2086.5 to 2597
Source: ONS Experimental Statistics © Crown Copyright
Estimated population over 65 Ashley
Avonmouth
Bedminster
Bishopston
Brislington East
Brislington West
Clifton
CliftonEast
CothamEaston
Eastville
Filwood
Frome Vale
Hartcliffe
Henbury
Hengrove
Henleaze
Hillfields
Horfield
Kingsweston
Knowle
Lawrence Hill
Lockleaze
Redland
St George East
St George West
Southmead
Southville
Stockwood
Stoke Bishop
Westbury-on-Trym
Whitchurch Park
Windmill Hill
Bishopsworth
Cabot
Older People (over 65)
2010

Dementia in Bristol
Differences in Dementia prevalence across city
Projected 7% increase(2012-2020) for PeopleLiving with Dementia2012 = 4,4252020 = 4,750
47 to 84
85 to 123
124 to 190
191 to 257
Source: Pop: ONS Census 2011; Prevalence rates: Dementia UK - Full report 2007
Estimated numbers with Dementia (60+)
Ashley
Avonmouth
Bedminster
Bishopston
Brislington East
Brislington West
Clifton
Clifton East
Cotham Easton
Eastville
Filwood
Frome Vale
Hartcliffe
Henbury
Hengrove
Henleaze
Hillfields
Horfield Kingsweston
Knowle
Lawrence Hill
Lockleaze
Redland
St George East
St George West
Southmead
Southville
Stockwood
Stoke Bishop
Westbury-on- Trym
Whitchurch Park
Windmill Hill
Bishopsworth
Cabot
Estimated Dementia Prevalence (60+) 2011
2011

Increasing Demand
The demand for residential and nursing care services will grow significantly
10 Year picture
- 13% Growth in Older Service Users
- 6% Growth in Younger Service Users
- Average 11% growth on people requiring Residential/Nursing care

Current Placements by BCC
Currently, Bristol City Council supports 1,100 older people in residential and nursing care home settings. Of those, 38% are for people with Dementia
Of the above 1,100 service users, BCC commissions care home placements in neighbouring Local Authorities areas, particularly homes close to the border of Bristol UA:
South Glos – 73 service usersBath & North East Somerset - 33North Somerset – 78Out of Area - 62
Of those, 40% are for people with Dementia – reliant on out of area more
Care Type Dementia Elderly Frail Total Nursing Care 183 381 564 Residential Care* 236 309 545 Total 419 690 1109
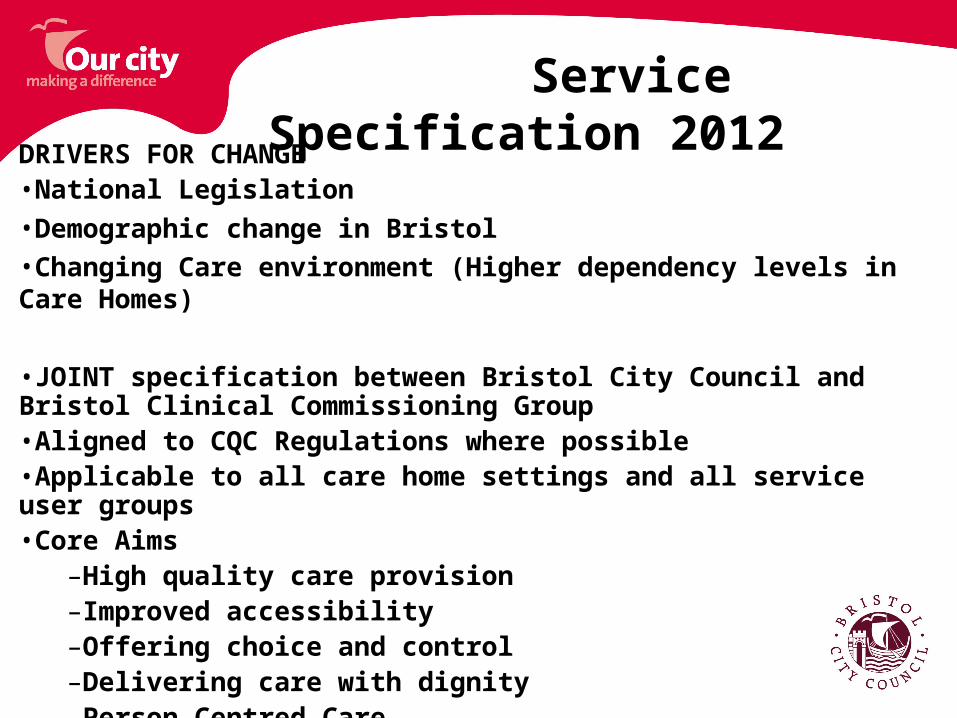
Service Specification 2012DRIVERS FOR CHANGE•National Legislation •Demographic change in Bristol•Changing Care environment (Higher dependency levels in Care Homes)
•JOINT specification between Bristol City Council and Bristol Clinical Commissioning Group•Aligned to CQC Regulations where possible•Applicable to all care home settings and all service user groups•Core Aims
–High quality care provision –Improved accessibility–Offering choice and control–Delivering care with dignity–Person Centred Care–Promoting Quality of Life for all
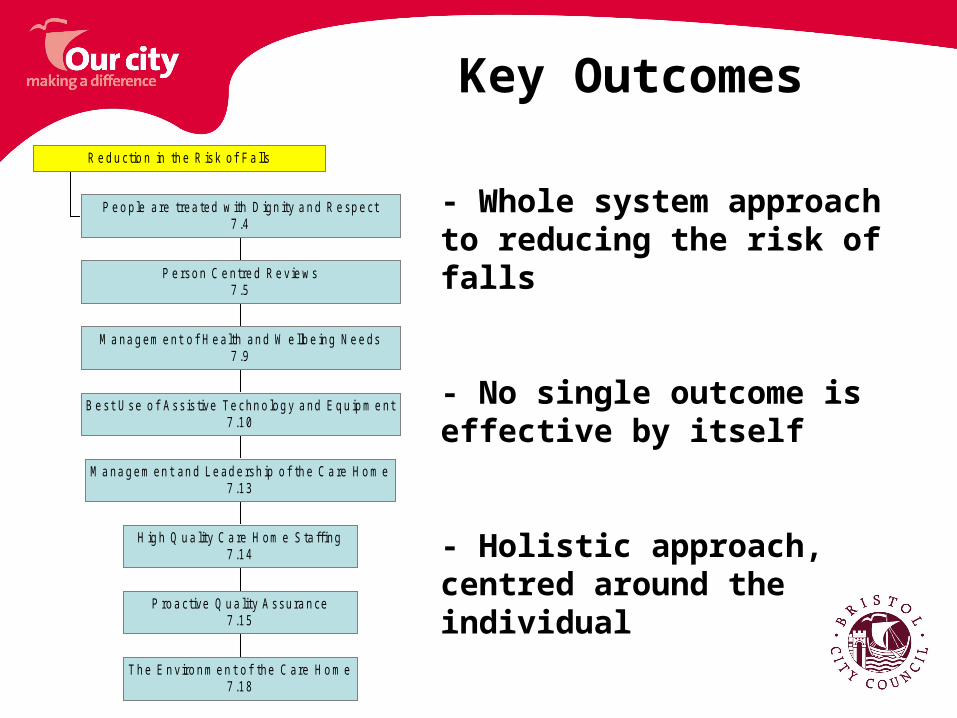
Key Outcomes
T h e E n v iro n m e n t o f the C are H o m e7 .18
P ro a ctive Q u a lity A ssura n ce7 .15
H ig h Q u a lity C a re H om e S ta ff ing7 .14
M a na g em en t an d L e ad e rsh ip o f th e C a re H o m e7 .13
B e s t U se o f A ss is tive Te chn o log y a nd E q u ip m e nt7 .10
M a na g em e nt o f H e a lth an d W e llb e ing N e e ds7 .9
P e rso n C e n tre d R e v ie w s7 .5
P e o p le a re trea ted w ith D ign ity a n d R e sp e ct7 .4
R e d u ctio n in th e R isk o f F a lls
- Whole system approach to reducing the risk of falls
- No single outcome is effective by itself
- Holistic approach, centred around the individual
Prevention is better than cure!
Some examples of key outcomes and standards for care home providers to meet that contribute to preventing the risk of falls:
- Safe, dignified moving and handling practice from qualified staff
- Service users are enabled to build and maintain independent living skills
- Care plan reviews following changes in service user health / care needs
-Use of equipment and assistive technology to support service users independence and manage risk
- Strong Management - Service users receive a consistent, safe and high quality service that maximises their independence. The service develops their management staff that take responsibility for delivery of a high quality service and retains high quality staff

Prevention is better than cure!
7.9 – Management of Health and Wellbeing Needs
-The care home is a physical and mental health promoting environment enabling service users to optimise their health, enabling activities, exercise and a healthy lifestyle
-Hydration and Nutrition, Foot Care, Proactive medication reviews with GP and other health professionals
- The provider ensures that service users are assessed for risk of falls within 24 hours of admission (where possible) and recorded in care and support plan
-Service users who are vulnerable to falls are actively supported by their key worker or equivalent members of the staff team to reduce / prevent the risk of a fall occurring
-Emergency admissions due to falls are minimised through proactive falls risk management
-The provider maintains a falls register recording information such as causes, location etc and uses this to reduce the risk of falls occurring within the care home

Prevention is better than cure!
7.14 – Care Home Staffing
-Staffing numbers, skills, qualifications, induction standards
-Staff receive regular training on core areas around health and safety, risk assessment, moving and handling etc
-Registered Nursing Staff regularly liaise with GPs and other allied health professionals to ensure health needs are met
7.15 – Quality Assurance
- Current and future risks are identified, accountability, risks routinely monitored and managed
-Sharing best practice between providers (CH Provider Forum etc)
Prevention is better than cure!
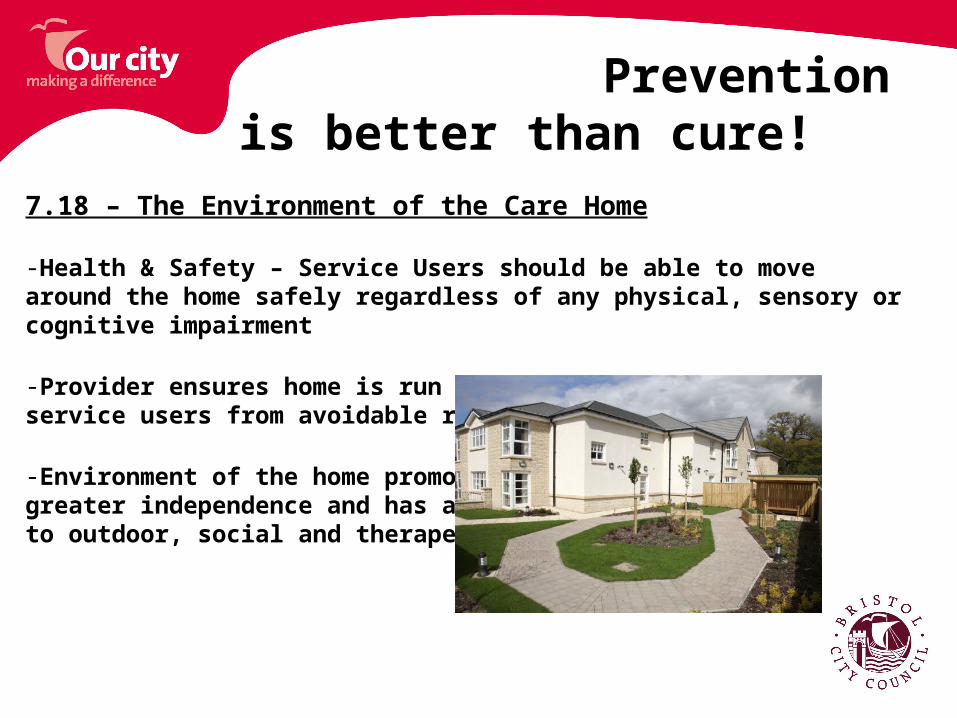
7.18 – The Environment of the Care Home
-Health & Safety – Service Users should be able to move around the home safely regardless of any physical, sensory or cognitive impairment
-Provider ensures home is run in a way that protects service users from avoidable risk or harm
-Environment of the home promotes greater independence and has access to outdoor, social and therapeutic space

Thank you for your time today
Matthew AreskogCommissioning Manager
Health & Social [email protected]