Embed Size (px)
Citation preview

1
COMMISSIONING A STEREOSCOPIC PARTICLE IMAGE VELOCIMETRY SYSTEM FOR APPLICATION IN A TOWING TANK David Molyneux1, Jie Xu2 and Neil Bose3
ABSTRACT
In January 2004, Memorial University purchased a stereoscopic Particle Image Velocimetry (PIV) system for making flow measurements. Although the system was potentially very versatile, its primary application was envisioned to be in a towing tank. The system was supplied as a complete package of hardware and software for calibration, data collection and analysis. The intention of the PIV system designers was to collect as many data frames as possible for a fixed measurement plane location, relative to the model. This required the PIV system to be fixed on the towing carriage, moving with the model being studied. It was found during some preliminary experiments that an active seeding delivery system was necessary to ensure sufficiently high seeding particle concentration, especially when measuring flow velocities around a model hull with a large yaw angle. This paper describes the development of a seeding technique for a PIV system that can be used in a towing tank. The paper also includes an estimate of the uncertainty of the measurement system, including the analysis of the flow behind the device used to deliver seed particles into the flow.
1. INTRODUCTION Particle Image Velocimetry (PIV) is an important technique for measuring velocities within a fluid. The flow through an illuminated plane (or volume) is seeded with small, reflective particles and a sequence of digital photographs is taken. By timing the intervals between photographs to ensure that the same particles are within the measurement space for each exposure, flow vectors can be calculated, once the measurement space has been calibrated. To calculate the velocity vectors, the total image is divided into smaller interrogation windows. The average particle movement within each interrogation window between two successive exposures is calculated. Velocity is determined by dividing the distance moved by the time interval between exposures. In its simplest form, the technique is applied in two dimensions using a single camera, but by using stereo photography, the method can be extended to three dimensions. The main advantage of PIV over other measurement methods is that it can determine fluid velocity at all locations within the measurement plane simultaneously instead of having to make separate measurements at a series of different point locations. This is an important feature for analyzing some forms of unsteady flow. The PIV system at Memorial University of Newfoundland was manufactured by LaVision GmbH of Goettingen, Germany and was purchased from LaVision Inc. of Ypsilanti, MI, USA. The system consisted of four main elements:
1 Senior Research Officer, Institute for Ocean Technology, National Research Council Canada 2 Laboratory Coordinator, Faculty of Engineering and Applied Science, Memorial University 3 Professor of Maritime Hydrodynamics, Manager, Australian Maritime Engineering Hydrodynamics
Research Centre, Australian Maritime College

2
• Two Charge Coupled Device (CCD) cameras • Twin-head Nd:YAG4 laser and controller • Computer for timing of laser and cameras and data acquisition
In addition to the hardware described above, the system comes with an extensive software package for system calibration, data collection and analysis (LaVision, 2005). Xu et al. (2005) gave a description of the PIV system together with the results of some preliminary experiments. The PIV system was designed for the special requirements of a towing tank, where the operating fluid was water with a free surface. A photograph of the complete system, assembled in air, is shown in Figure 1. The unique features of this PIV system were the two borescopes, which were used to obtain the underwater views. There were two main advantages of this arrangement. The first was that the sensitive cameras were kept accessible and well above the water surface. The second was that the underwater part of the measurement system was very small, compared to other systems, which used large, underwater housings. A similar arrangement was provided for the laser, but this was a plain tube, without the optics of a borescope. This paper describes the development of the techniques necessary to make the PIV system work in a towing tank, such as an active seeding system. It also describes the method used for estimating the uncertainty of the system, including the effect of the seeding rake on the measured flow speeds.
Figure 1, View of complete PIV system showing CCD cameras [1], laser head [2], computer [3], laser controller [4] and borescopes [5].
2. UNCERTAINTY ESTIMATES FOR MEMORIAL UNIVERSITY’S PIV SYSTEM The uncertainty of the PIV system used at Memorial University was estimated from the combination of the errors in the mapping function reported by the DaVis 7.1 software (La Vision, 2005), and some special experiments to measure undisturbed flow. The geometry of the optics for the Memorial PIV system was
4 Neodium doped: Yttrium Aluminium Garnet
[2]
[1]
[3]
[4]
[5]

3
highly variable, since the system was made of separate components, each of which could be moved relative to the others. As a result, each installation of the PIV system resulted in a different geometry, with different uncertainty. It was not practical to carry out a rigorous ‘in situ’ uncertainty analysis of the mapping functions (Lawson & Wu (1997a, b), Soloff et al. (1997), Calcagno et al. (2002)) because there was insufficient facility time available. Preliminary experiments to measure flow patterns around a ship model in a towing tank (Molyneux & Xu, 2005) showed that it was necessary to have a method of injecting the seed particles into the flow. Without a seeding system, there was insufficient particle concentration to obtain consistent measurements. One of the main concerns with this approach was the influence of the seeding system on the flow. Some experiments were designed to determine this effect, and these were combined with the uncertainty analysis. The PIV measurements to study the flow patterns created by the seeding rake were carried out in the Ice Tank of the National Research Council’s Institute for Ocean Technology. The ice tank is 80 m long, 12 m wide and 3 m deep. The tank is equipped with a large towing carriage, which is fitted with a test frame that can be adjusted vertically. It also has two longitudinal beams, either side of the carriage centreline that can be moved horizontally and independently. Each beam has a measurement scale relative to the centreline of the carriage, so the exact position of the beam is known. A temporary frame for the PIV system was built around one of the test beams, using extruded aluminium sections. The laser was oriented normal to the direction of motion, so that the measurement plane was across the direction of motion for the undisturbed flow. The borescopes for the CCD cameras were mounted symmetrically, approximately 650mm either side of the laser sheet. Camera 1 was at the forward end of the carriage, and Camera 2 was at the aft end. The centre of the measurement window was approximately 950 mm away from the underwater optical unit for the laser. The PIV system is shown fitted to the towing carriage in Figure 2. The PIV equipment was fitted to the beam on the south side of the carriage.
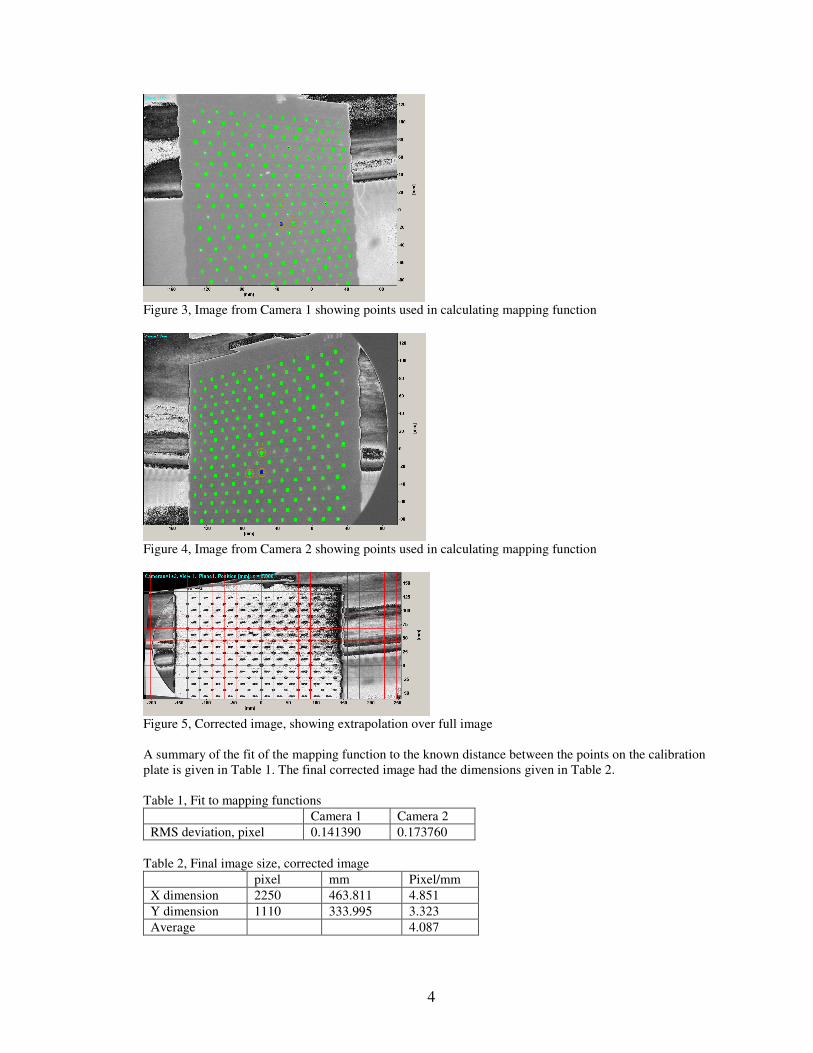
Figure 2, PIV system fitted to towing carriage In-situ calibration of the measurement space was carried out prior to testing. A Type 30 calibration plate, supplied by LaVision GmbH, was used. The plate was 300mm by 300 mm square. During calibration, the plate was suspended within the laser plane. The views from each camera were checked to ensure that the field of view was approximately the same. The calibration was carried out using visible light, following the procedures described in the DaVis 7.1 software (LaVision, 2005). The image taken from Cameras 1 and 2 during the calibration, together with the calculated mapping functions are shown in Figures 3 and 4. The combined image, after correction for the distortion is shown in Figure 5. This image is the calculated view normal to the plane of the calibration plate, whereas the raw images from the cameras include the perspective distortion.
4
Figure 3, Image from Camera 1 showing points used in calculating mapping function
Figure 4, Image from Camera 2 showing points used in calculating mapping function
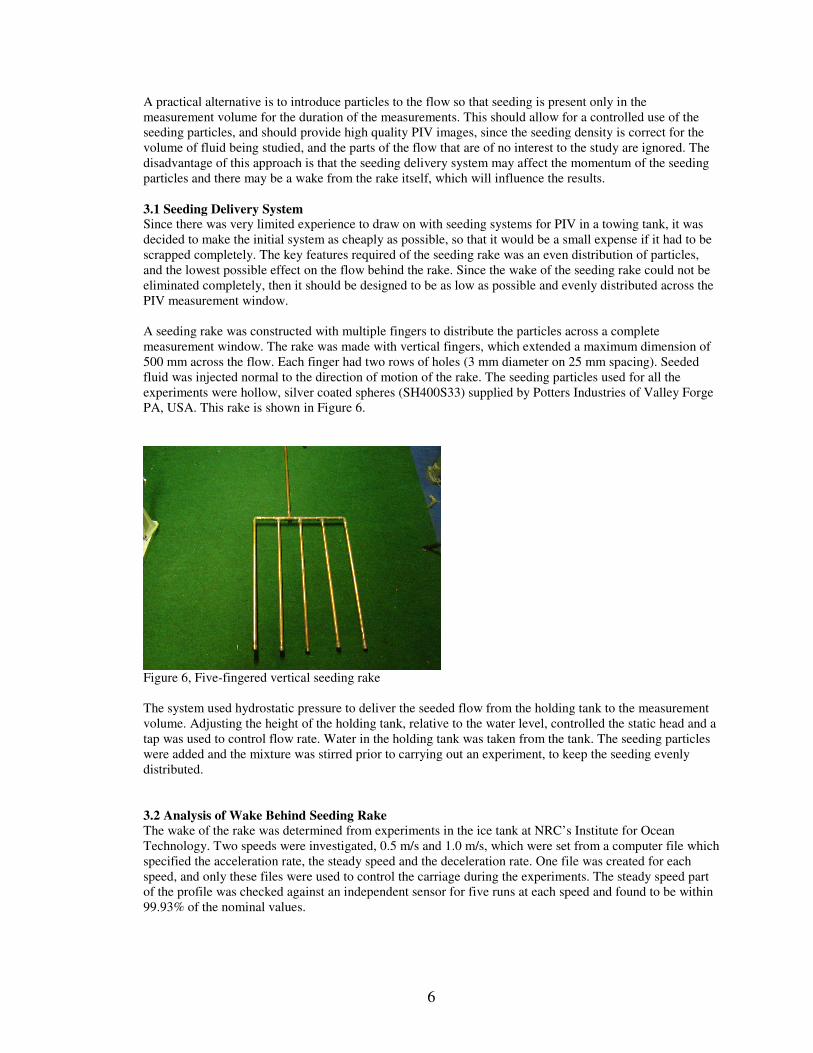
Figure 5, Corrected image, showing extrapolation over full image A summary of the fit of the mapping function to the known distance between the points on the calibration plate is given in Table 1. The final corrected image had the dimensions given in Table 2. Table 1, Fit to mapping functions
Camera 1 Camera 2 RMS deviation, pixel 0.141390 0.173760
Table 2, Final image size, corrected image
pixel mm Pixel/mm X dimension 2250 463.811 4.851 Y dimension 1110 333.995 3.323 Average 4.087

5
Assuming that the residuals in the polynomial fit to the mapping function follow a normal distribution, then the confidence intervals for the calculated speeds can be calculated for different laser timing intervals. The resulting calculations are given in Table 3, for the range of time intervals between first and second exposures, used in the free stream experiments. The calculated uncertainties are relatively high compared to the published uncertainty analyses from previous work (Lawson & Wu (1997a), b), Soloff et al. (1997), Calcagno et al. (2002). The calculated RMS deviation of the mapping function, in pixels, is very good when compared with the previously published results, which have RMS errors to within 1 to 1.1 pixels (Soloff et al, 1997). However, Soloff’s results translated into much smaller spatial errors of 0.05mm, since the measurement area was much smaller. Smaller measurement areas are more common in previously published PIV research on ship models. A study of ship wake using PIV in a large circulating water tunnel (Di Felice and De Gregorio, 2000) used a measurement window of 18,000 mm2. Gui et al. (2001) presented wake data for a ship model using a measurement window of 5,625 mm2. Calcagno et al. (2002) used the largest measurement area of 50,000 mm2 for measuring the downstream wake in the race of a working propeller behind a ship model. The measurement window for the Memorial PIV system used in this study was 155,000 mm2, which is over three times the size of the next largest. Test particle images showed that the average particle diameter was between 2 and 3 pixels, so data collected using the large window should not be subject to bias caused by peak locking (LaVision, 2005). Since the flow conditions were expected to be unsteady, the largest possible measurement window was thought to be desirable. Table 3 gives the effect of the time between the laser pulses on the uncertainty in the resulting speed measurement. When the PIV measurement plane is oriented across the flow, it is necessary to use short time intervals between the laser pulses, otherwise particles will have moved through the laser sheet, and no data is obtained. With this orientation, it is necessary to accept higher uncertainty than for an orientation along the flow, where there is more possibility for variation in the timing of the pulses. Table 3, 95% Confidence Intervals for calculated speeds, based on uncertainty in mapping function
δt, microsec δt, sec
95% CI, mm
95% CI, m/s
500 0.0005 0.083325 0.166649 700 0.0007 0.083325 0.119035 800 0.0008 0.083325 0.104156
1000 0.001 0.083325 0.083325
The analysis described here makes no allowance for the errors in separate velocity components. The more detailed analysis of stereo PIV carried out by other researchers suggests that the through plane measurements are generally less accurate than the in-plane measurements. 3. SEEDING DELIVERY SYSTEM Seeding the flow is an essential element of PIV measurements. If the PIV system is stationary and the fluid is stationary, then it is only necessary to seed the volume of fluid close to the laser sheet. This option is feasible for a stationary PIV system in a towing tank, where the ship model passes through the measurement volume. The movement of the model ship through the seeded fluid will cause a disturbance and the movement of the seed particles can be observed. The disadvantage of this system is that very little data is obtained at a specific location on the hull, since only one set of frames is obtained for each run down the tank. If the fluid is moving relative to the PIV system then one option is for the complete volume of the fluid to be seeded. This option is feasible for a circulating water tunnel, where particles can be kept in circulation by the moving fluid. This is not a practical option in a towing tank, which has a very large volume of stationary fluid. Eventually almost all of the seed particles will either sink to the bottom or float to the surface requiring the fluid to be re-seeded after a certain period of time.
6
A practical alternative is to introduce particles to the flow so that seeding is present only in the measurement volume for the duration of the measurements. This should allow for a controlled use of the seeding particles, and should provide high quality PIV images, since the seeding density is correct for the volume of fluid being studied, and the parts of the flow that are of no interest to the study are ignored. The disadvantage of this approach is that the seeding delivery system may affect the momentum of the seeding particles and there may be a wake from the rake itself, which will influence the results. 3.1 Seeding Delivery System Since there was very limited experience to draw on with seeding systems for PIV in a towing tank, it was decided to make the initial system as cheaply as possible, so that it would be a small expense if it had to be scrapped completely. The key features required of the seeding rake was an even distribution of particles, and the lowest possible effect on the flow behind the rake. Since the wake of the seeding rake could not be eliminated completely, then it should be designed to be as low as possible and evenly distributed across the PIV measurement window. A seeding rake was constructed with multiple fingers to distribute the particles across a complete measurement window. The rake was made with vertical fingers, which extended a maximum dimension of 500 mm across the flow. Each finger had two rows of holes (3 mm diameter on 25 mm spacing). Seeded fluid was injected normal to the direction of motion of the rake. The seeding particles used for all the experiments were hollow, silver coated spheres (SH400S33) supplied by Potters Industries of Valley Forge PA, USA. This rake is shown in Figure 6.
Figure 6, Five-fingered vertical seeding rake The system used hydrostatic pressure to deliver the seeded flow from the holding tank to the measurement volume. Adjusting the height of the holding tank, relative to the water level, controlled the static head and a tap was used to control flow rate. Water in the holding tank was taken from the tank. The seeding particles were added and the mixture was stirred prior to carrying out an experiment, to keep the seeding evenly distributed. 3.2 Analysis of Wake Behind Seeding Rake The wake of the rake was determined from experiments in the ice tank at NRC’s Institute for Ocean Technology. Two speeds were investigated, 0.5 m/s and 1.0 m/s, which were set from a computer file which specified the acceleration rate, the steady speed and the deceleration rate. One file was created for each speed, and only these files were used to control the carriage during the experiments. The steady speed part of the profile was checked against an independent sensor for five runs at each speed and found to be within 99.93% of the nominal values.

7
The seeding rake was fixed with its fingers across the direction of the undisturbed flow and parallel to the laser plane directed across the direction of motion for the carriage. The rake position was moved over the maximum distance that was practically obtainable. Three locations for the rake were examined, with distances of 720 mm, 1400 mm and 3600 mm ahead of the laser sheet. A sketch of the orientation of the seeding rake, the laser sheet and the direction of motion of the fluid is given in Figure 7. Vx was defined as horizontal flow within the laser sheet, Vy was the vertical flow component (positive towards the free surface) and Vz was the flow through the laser plane, based on a right-handed coordinate system. Vc was the speed of the carriage (assumed to be the same as the undisturbed flow). For the calibration experiments it was possible to pre-seed the fluid and remove the rake during data collection. These experiments were used to confirm the accuracy of the PIV system with no active seeding system. In this situation, seeding was carried out when the carriage was going in reverse and the rake was removed for the PIV measurements made with the carriage going forwards. Fluid motion Seeding rake Laser sheet Variable distance Figure 7, Orientation of seeding rake and laser sheet, and velocity components In all the experiments, determining the optimum time interval between laser exposures required a certain amount of trial and error to obtain flow vectors over the maximum area within the field of view. The time between individual runs was approximately five minutes, although in some cases it was as low as three and in others it was as high as ten. It was not necessary to let all the particles settle out of the fluid but it was important that the disturbances caused by the passage of the rake had died out, before a new data collection run was started. All data for this series of experiments was collected and analyzed using DaVis 7.1 (LaVision 2005). The average and RMS deviation were calculated from the 50 pairs of PIV frames, using the time averaging function within DaVis 7.1. This function has a threshold value for the minimum number of time steps for which a vector was observed at a given interrogation window before the average and RMS values were calculated. For all data sets used in the wake analysis the threshold value was set at 7. Varying this parameter from 5 to 50 produced variations in the mean value of the vector modulus of less than 1.5%. The value of 7 was found to be a reasonable compromise to remove values based on very small numbers of points, without removing significant amounts of information. The calculated vector components with and without the seeding rake are given in Tables 5 and 6 for speeds of 0.5 m/s and 1.0 m/s respectively. Included in these tables are the results of the experiments with no seeding system. In all cases it can be seen that the Vx and Vy components of the flow (within the measurement plane) are effectively zero, compared to Vz (through the measurement plane). The results show that at 0.5 m/s the location of the rake has little effect on the measured mean flow. The mean flow was between 10% and 12% lower than the nominal free stream case. The RMS deviation of the flow did not change with the location. At 1 m/s, the average wake fraction based on the three measurement
Vx Vz

8
locations was 15% of the free stream flow. There was more variation in the results than at 0.5 m/s, which may have been due to more turbulence in the flow. At 1 m/s, it was noticeable that the RMS deviation of the velocity decreased as the distance from the rake increased, whereas for 0.5 m/s it was approximately constant. In both cases where the seeding rake was removed, the free stream speed calculated by the PIV system was the same as the set speed (within a 95% Confidence Interval). An effective wake fraction for the seeding system was defined as (Vc-Vx)/Vc, (where Vc was the speed of the carriage) and the calculated values for each experiment are given in Tables 5 and 6. When the flow patterns were studied in detail, the wake from the individual fingers could be seen as vertical bands within the in-plane plane velocity vectors at the measurement location closest to the seeding rake, but this pattern dissipated as the distance from the rake increased. When the seeding rake was removed, the number of individual vectors used to calculate the mean flow pattern was considerably smaller than for the cases with active seeding. This highlights that even for very steady flow, the seeding rake provides uniform seeding concentration, but the average flow speed behind the rake is 12 to 15% lower than the nominal free stream case. When contours of Vz were inspected, it was seen that all the flow through the measurement window was effectively slowed by a uniform amount. Also, the rake had little effect on the unsteadiness of the in-plane velocities. In fact, rms velocity values were smaller over larger areas of the measurement window when the rake was present than when the rake was removed. It was not possible to tell if this was due to the low level of turbulence in the flow, or the reduced concentration of seeding particles, resulting in higher variation in the sample means. The seeding rake creates an even distribution of particles across the PIV measurement window. Figure 8 shows a particle image taken at 0.5 m/s with the laser 1400mm behind the seeding rake. This figure shows neither periodic waves of particles nor uneven clouds of particles, which were be observed in some prototype seeding rake designs.
Figure 8, Particle distribution behind the seeding rake, 0.5 m/s It might be possible to reduce the level of the wake seen behind the seeding rake. The cylindrical sections used had the advantages of being cheap and readily available, but had a relatively high drag coefficient. Further work could be done in the development of seeding rakes with lower wakes, such as using airfoil shapes for the tubing rather than cylinders. It is unlikely that the wake from this type of system can be removed completely, but a lower value than the current level of 12-15% is probably achievable. If the wake could be reduced to 5% of the free stream flow, it would be a significant improvement over the current system.

9
Table 5, Results from experiments at nominal speed of 0.5 m/s
Rake 720 mm away from laser δt, µs Cam_Date=060201_Time=095416 1000 min max mean rms Vx -0.10506 0.15533 0.00203 0.02156 Vy 0.08426 -0.09290 -0.00246 0.01382 Vz 0.34589 0.55785 0.43743 0.02119 /V/ 0.34935 0.57509 0.43818 0.02132 Vc 0.49963 Wake fraction 0.124498 Rake 1400mm away from laser δt, µs Cam_Date=060131_Time=161447 500 min max mean rms Vx -0.22546 0.29304 0.00536 0.03306 Vy 0.26403 -0.23092 -0.00643 0.02351 Vz 0.21475 0.63912 0.43851 0.02723 /V/ 0.23608 0.69629 0.44036 0.02890 Vc 0.49963 Wake fraction 0.122329 Rake 3600 mm away from laser δt, µs Cam_Date=060201_Time=103347 1000 min max mean rms Vx -0.14252 0.11699 -0.00139 0.01977 Vy 0.13939 -0.13122 -0.00145 0.01467 Vz 0.36573 0.55456 0.45032 0.01851 /V/ 0.36672 0.55622 0.45097 0.01912 Vc 0.49963 Wake fraction 0.098695 No seeding rake δt, µs Cam_Date=060201_Time=104950 500 min max mean rms Vx -0.17004 0.28746 0.01635 0.02688 Vy 0.20805 -0.15970 -0.00591 0.02486 Vz 0.24920 0.67043 0.50790 0.02547 /V/ 0.38104 0.68193 0.50951 0.02545 Vc 0.49963 Wake fraction -0.01655

10
Table 6, Results from experiments at nominal speed of 1.0 m/s Rake 720 mm away from laser δt, µs Cam_Date=060201_Time=100604 500 min max mean rms Vx -0.35342 0.36902 0.01803 0.05916 Vy 0.26067 0.24988 -0.01902 0.03675 Vz 0.61718 1.30182 0.87445 0.07062 /V/ 0.64439 1.30560 0.87747 0.07233 Vc 0.99932 Wake fraction 0.124955 Rake 1400mm away from laser δt, µs Cam_Date=060131_Time=163013 700 min max mean rms Vx -0.20548 0.21266 -0.00401 0.03873 Vy 0.12146 -0.16017 -0.00924 0.02317 Vz 0.69619 0.96175 0.81102 0.04233 /V/ 0.69984 0.98357 0.81232 0.04281 Vc 0.99932 Wake fraction 0.188427 Rake 3600 mm away from laser δt, µs Cam_Date=060201_Time=104155 700 min max mean rms Vx -0.20670 0.23962 0.01007 0.03318 Vy 0.13346 -0.11231 -0.00091 0.02102 Vz 0.72836 1.02592 0.85856 0.03355 /V/ 0.75712 1.03112 0.85950 0.03396 Vc 0.99932 Wake fraction 0.140855 No seeding rake δt, µs Cam_Date=060201_Time=105457 500 min max mean rms Vx -0.16372 0.25600 0.00659 0.03708 Vy 0.20408 -0.18448 -0.01302 0.02740 Vz 0.88357 1.20391 0.98504 0.04024 /V/ 0.84217 1.20609 0.98622 0.04045 Vc 0.99932 Wake fraction 0.014289

11
4. CONCLUSIONS A preliminary study (Molyneux and Xu, 2005) had shown that it was necessary to use a seeding rake when carrying out experiments using PIV to measure the flow vectors around a ship model in a towing tank. Without active seeding of the flow, it was not possible to make consistent measurements of flow velocity, especially on the downstream side of the hull, because the seed particle concentration was too low. The rake was needed to deliver seeding particles into the flow, and maintain the minimum concentration required for accurate measurements. Ideally the rake should have no effect on the flow, but this is impossible. The next best option is to have minimum disturbance to the flow, and to have that disturbance distributed uniformly across the measurement window of the PIV system. The rakes used for these experiments created a uniform disturbance across the measurement area, but reduced the mean flow speed by 12 to 15%, depending on the flow speed. The location of the rake relative to the measurement area has little effect on the measured mean speed, but the particle concentration decreases as the distance is increased. Since the area of the rake is large, in relation to the measurement area, it should affect all of the flow being studied. As a result, if the same rake and relative location are used, then flow patterns measured for different geometric arrangements of a ship model should be comparable, but with a similar bias to the results, caused by the presence of the seeding rake. The estimated uncertainty for the PIV velocity analysis is higher than the range discussed by other researchers. This is principally due to the need to orient the laser sheet across the strongest direction of the flow, and the high level of magnification obtained. For the system described in this paper the uncertainty in the measured flow speed is estimated be between 8% and 16%. The 8% values of uncertainty are estimated for a flow speed of 1.0 m/s with laser pulse times of 1000 µs. The 16% value of uncertainty was estimated for a flow speed of 0.5 m/s, with a laser pulse time of 500 µs. Using a smaller measurement area, with less magnification, would lower the uncertainty. Another way of lowering the uncertainty would be to increase the time between the laser pulses. The relatively high uncertainty was accepted for two reasons. The first was the desire for the largest measurement area from a single field of view. The second was because the measurement plane was across the strongest flow direction. This is the primary plane of interest for many flow measurements around a ship hull (e.g. a wake survey through the propeller plane). This required relatively short laser pulse times to ensure the same particles are within the measurement space for both image pairs, which resulted in relatively high values of uncertainty. The design of the rake should be improved so that it has a lower wake. It is unlikely that the wake will be removed completely, but a wake of 5% would be a significant improvement over to the currently achieved value of 12-15%. 5. ACKNOWLEDGEMENTS The work described in this paper would not have been possible without the help and support of many people, which is gratefully acknowledged:
Dr. Steve Anderson of La Vision, for providing advice and support based on his years of experience carrying out PIV experiments and designing PIV systems. The Canada Foundation for Innovation and the Newfoundland and Labrador Department of Innovation, Trade and Rural Development for financial support of the purchase of the PIV system. Mr. Jim Gosse, Laboratory Technician in the Fluids Laboratory at Memorial University for all his help during the set-up and carrying out the preliminary experiments in the OERC Towing Tank at MUN. The staff at IOT for preparing the model for testing and assisting with the many tasks required during experiments at IOT and the management of IOT is thanked for their financial support.

12
6. REFERENCES Calagno, G., Di Felice, F., Felli, M, and Pereira, F. 2002 ‘Application of Stereo PIV: Propeller Wake Analysis in a Large Circulating Water Channel’, 11th Symposium on Applications of Laser Techniques to Fluid Mechanics, Calouste Gulbenkian Foundation, Lisbon, Portugal, 8th to 11th July, Paper 26-4. Di Felice, F. & De Gregorio, F. 2000 ‘Ship Model Wake Analysis by Means of PIV in a Large Circulating Water Channel’, Proceedings of 10th International Offshore and Polar Engineering Conference, Seattle, USA, May 28-June 2, pp. 392-397 Gui, L., Longo, J. and Stern, F. 2001, ‘Towing Tank PIV Measurement System, Data and Uncertainty Assessment for DTMB Model 5512’, Experiments in Fluids, Volume 31, pp. 336-346. LaVision Inc. 2005 ‘DaVis Flowmaster Software Manual for DaVis 7.1’. Lawson, N. J. and Wu, J. 1997(a) ‘Three-dimensional Particle Image Velocimetry: Error Analysis of Stereoscopic Techniques’, Measurement Science and Technology, Volume 8, pp 894-900. Lawson, N. J. and Wu, J. 1997(b) ‘Three-dimensional Particle Image Velocimetry: Experimental Error Analysis of a Digital Angular Stereoscopic System’, Measurement Science and Technology, Volume 8, pp 1455-1464. Molyneux, W. D., and Xu, J. 2005 ‘Particle Image Velocimetry Experiments to Measure Flow Around and Escort Tug’, IOT/NRC, TR-2005-10. Soloff, S. M., Adrian, R. J. and Liu, Z-C. 1997 ‘Distortion Compensation for Generalized Stereoscopic Particle Image Velocimetry’, Measurement Science and Technology, Volume 8, pp 1441-1454. Xu, J., Molyneux, W. D. and Bose, N. 2005 ‘A Versatile Particle Image Velocimetry System for Flow Measurements in Water Tanks’, 7th Canadian Marine Hydromechanics and Structures Conference, Halifax, N. S. September.