Embed Size (px)
Citation preview

EN EN
EUROPEAN COMMISSION
Brussels, 13.9.2013 SWD(2013) 325 final
COMMISSION STAFF WORKING DOCUMENT
Developing an indicator of innovation output
Accompanying the document
COMMUNICATION FROM THE COMMISSION TO THE EUROPEAN PARLIAMENT, THE COUNCIL, THE EUROPEAN ECONOMIC AND SOCIAL
COMMITTEE AND THE COMMITTEE OF THE REGIONS
Measuring innovation output in Europe: towards a new indicator
{COM(2013) 624 final}

2
Table of Contents
EXECUTIVE SUMMARY................................................................................................. 3
1. INTRODUCTION........................................................................................................... 7
1.1. Measuring innovation output ....................................................................................... 8
1.2. The selection criteria .................................................................................................. 10
2. THE SIMPLE COMPOSITE INDICATOR ................................................................. 12
3. DATA USED ................................................................................................................ 14
3.1. Ability of the economy to transform knowledge into marketable innovations.......... 14
3.2. How the supply of skills feeds into the economic structure....................................... 15
3.3. Competitiveness of the knowledge-intensive sectors................................................. 16
3.4. Employment dynamism of fast-growing firms in innovative sectors ........................ 18
3.4.1. Usage of sector-level data ....................................................................................... 20
3.4.2. Imputation technique for missing values and wider international comparability ... 21
3.5. Overview of data used and reference periods ............................................................ 24
3.5.1. The data used........................................................................................................... 24
3.5.2. The reference periods .............................................................................................. 25
4. MEASURING COUNTRY PERFORMANCE WITH THE INDICATOR................. 26
4.1. Score produced by the chosen indicator..................................................................... 26
4.2. Country-by-country analysis of performance ............................................................ 29
5. ROBUSTNESS ANALYSIS......................................................................................... 37
5.1. Conceptual and statistical coherence in the framework ............................................. 37
5.2. Impact of modelling assumptions on the indicator results ......................................... 40
5.3. Distance to the efficient frontier by Data Envelopment Analysis (DEA).................. 45
6. CONCLUSION ............................................................................................................. 48
ANNEX 1. CALCULATION OF SECTORAL INNOVATION COEFFICIENTS......... 49
ANNEX 2. DATA COLLECTION FOR FAST-GROWING FIRMS ............................. 56
ANNEX 3. MAIN OPTIONS EXAMINED FOR THE COMPOSITE INDICATOR..... 57

3
EXECUTIVE SUMMARY This Commission Staff Working Document accompanies the Commission Communication "Measuring innovation output in Europe: towards a new indicator ", which presents an indicator to measure performance in innovation output. The rigorous measurement of innovation is critical to underpin evidence-based policy-making and for assessing the impact of policies and reforms. The European Council has given the European Commission the mandate to develop a single innovation indicator in the context of the Europe 2020 strategy, taking into account the commitment in the Innovation Union flagship initiative to "launch the necessary work for the development of a new indicator measuring the share of fast-growing innovative companies in the economy" (commitment 34.b). There is widespread agreement among experts, Member States and Commission services that such an innovation indicator should be output-oriented, measure the innovation performance of a country and its capacity to derive economic benefits from innovation, capture the dynamism of innovative entrepreneurial activities, and be useful for policy-makers at EU and national level. The proposed indicator will support policy-makers in establishing new or reinforced actions to remove bottlenecks that prevent innovators from translating ideas into products and services that can be successful on the market. Improved performance will contribute to smart growth, in line with Europe 2020 and its Innovation Union flagship initiative.1
The proposed indicator complements the Innovation Union Scoreboard (IUS),2 and its Summary Innovation Index (SII), which assess how the various strengths and weaknesses of Member States and the EU determine their overall performance, against a broad set of 24 innovation indicators, including inputs, throughputs and outputs. In addition, the Innovation Union Competitiveness Report, also analyses innovation performance every two years.
The indicator in this Communication zooms in exclusively on innovation output and monitors a reduced set of dimensions, including the contribution to job creation of fast-growing firms. Given its complementarity with the IUS, it is planned that the results of the proposed indicator are published simultaneously with those of the IUS.
Based on the conceptual framework defined by Eurostat for the definition of quality indicators and state-of-the-art statistical analyses, four principles were applied to examine feasible options. Those were: policy relevance, data quality, international availability and cross-country comparability, and robustness.3 After a comprehensive analysis of various options, a simple composite indicator is proposed in the Commission Communication " Measuring innovation output in Europe: towards a new indicator". It measures how Member States perform in innovation output, as shown by four indicators from the outputs and firm activities types in the Innovation Union Scoreboard,
1 "Europe 2020 Flagship Initiative Innovation Union", COM(2010) 546 final, of 6 October 2010. 2 http://ec.europa.eu/enterprise/policies/innovation/files/ius-2013_en-pdf. 3 A set of robustness tests and associated analyses is presented in this Commission Staff Working
Document and its annexes.

4
grouped in three components (technological innovation, skills, and competitiveness of knowledge-intensive goods and services), as well as a new component, capturing the employment dynamism of fast-growing innovative firms, and proposed to fill in the placeholder (3.1.3. "High-growth innovative firms") in the Innovation Union Scoreboard. Figure 0 below shows the proposed composite innovation indicator, presented in detail in section 4 of this Commission Staff Working Document.
Figure 0. The simple composite indicator zooming in on innovation output
Countries’ scores for 2011 (red bars) and 2010 (crosses) with respect to the EU average (100 in 2010).
In 2011, the components reflect the situation in 2009 (PCT), 2010 (DYN) or 2011 (KIA, COMP) In 2010, they are based on 2008 (PCT), 2009 (DYN) or 2010 (KIA, COMP) data
Source: Commission calculations. The four components, which underpin the proposed innovation indicator, are described in detail in sections 2 and 3 of the Commission Staff Working Document. The Commission services examined the advantages and disadvantages of those four components, compared to other options:
• The first component, measuring the ability of the economy to transform knowledge into marketable innovations, as shown by indicator 2.3.1 of the Innovation Union Scoreboard, counts the number of patent applications per billion units of GDP. The most recent years available for this indicator are 2008 and 2009.
• The second component, capturing how the supply of highly skilled people feeds into the economic structure of a country, is defined as indicator 3.2.1 of the Scoreboard, which is measuring the number of persons employed in knowledge-intensive activities (KIA). The most recent years available for this indicator are 2010 and 2011. The Commission services consider that the indicator provides a good measure of how a highly skilled labour force feeds into the economic structure of an innovation-driven economy.
5
• Concerning the third component, on the competitiveness of the knowledge-intensive
sectors, the Commission services analysed in detail various options for its sub-components (as reported in section 5.2) and selected indicators 3.2.2 and 3.2.3 of the Scoreboard. This choice has the drawback that both sub-components are based on different definitions, the goods trade sub-component (indicator 3.2.2) focusing on the contribution to the trade balance, and the services trade sub-component (indicator 3.2.3) on the export share. Nonetheless, it presents a series of advantages such as not penalising countries with large trade deficits and avoiding some counter-intuitive (e.g. low scores for the US and JP) as well as unstable rankings. A detailed analysis was also performed relating to which weights should be best used to build a mini-composite indicator, using both sub-components. The findings are reported in section 3.3. Three different alternatives were tested, and a sensitivity analysis was carried out. The choice was for integrating both sub-components using equal weights. The reference years were aligned and set to 2010 and 2011.
• Finally, the fourth and last component of the proposed indicator measures employment
in fast-growing innovative enterprises, and provides an indication of the innovation dynamism of fast-growing firms as compared to all fast-growing business activities. The data used for the test calculations for this component required considerable efforts from the Member States. The component draws on Eurostat voluntary data collections for the employment figures for 2009 and 2010 (see Annex 2), and 2006/8 and 2009/10 data for the innovation coefficient (see Annex 1). International comparability is more limited for this component and therefore the set of missing values was imputed using the optimal approach, which was found to be the Expected-Maximization (EM) algorithm described in section 3.4.2. The sector-specific innovation coefficients used to compute this component reflect the level of innovativeness of the sector and serve as a proxy for distinguishing innovative enterprises. It should be noted that EU averages were used rather than country-specific values and this implies that these sectoral innovation coefficients will not reflect differences in the knowledge intensity or Community Innovations Survey (CIS) scores across Member States. While this could be seen as a weakness, it has also the benefit of defining a common reference of the degree of innovation of each sector against which countries can be reliably compared over time (see Annex 1 for more details). The option of computing the innovation indicator without the fourth component was also examined in further detail. However, a wide-ranging set of policy arguments and a comprehensive set of technical analyses, which included inter alia a principal component analysis and counterfactual simulations, supported its inclusion in the proposed indicator (the results are presented in section 5.2).
In order to refine the indicator and bring it to its full potential, four areas were identified.
First, ensuring the improvement of data on fast-growing firms in innovative sectors, in coverage and regular production, with a mandatory request for collection as part of the amended Commission Regulation implementing the European Parliament and Council Regulation on Structural Business Statistics, which will cover the financial sector. Financial services are excluded at this stage but they are relevant, given their pervasive function and

6
impact on the economy. The production of these data will also improve the alignment of the reference years of the indicator.
Second, analysing how the data defining the innovation coefficients can be improved to ensure larger sets of observations across sectors and over time, and how variations in intensities across countries can be best captured. This includes sensitivity analysis on the coefficients using new data from the biennial CIS and the annual Labour Force Survey (LFS).
Third, examining whether and how: the data on the competitiveness of knowledge-intensive goods and services could be improved; the skills component could be refined to capture best the contribution of education, exploring its links with the indicator performance; other statistics of the market success of innovations could be considered.
Finally, enlarging its international dimension, through a wider collection of data on fast-growing firms and joint work with the OECD on the international coverage of the innovation coefficients, using comparable surveys in third countries. After setting the background (section 1), the Commission Staff Working Document presents the proposed indicator (section 2) and the dataset to build it up (section 3). It then displays the resulting ranking, alongside an analysis of the performance of the Member States and their main international competitors (section 4). Finally, it moves on to describe the comprehensive robustness analysis carried out (section 5).

7
1. INTRODUCTION
Investment in research and innovation is a relevant determinant of the capacity of an economy to generate smart growth, high-quality jobs and competitiveness. It must, however, be accompanied by reforms to increase the efficiency and effectiveness of the national innovation system to support business dynamics and the move towards a transformation of the economy into a more innovative, knowledge-intensive and productive one.
The rigorous measurement of innovation is critical to underpin evidence-based policy-making, to evaluate investment in research and innovation (R&I), and to assess the impact of policies and reforms. Furthermore, such measurements bolster the legitimacy of public action and the use of public funds. However, experts agree that measuring the innovation capacity of an economy is complex,4 and requires choices as there is a myriad of objective difficulties in capturing such a wide-ranging phenomenon with a single indicator.
The proposed indicator complements the Innovation Union Scoreboard (IUS),5 and its Summary Innovation Index (SII), which assess how the various strengths and weaknesses of Member States and the EU determine their overall performance, against a broad set of 24 innovation indicators, including inputs, throughputs and outputs. In addition, the Innovation Union Competitiveness Report, also analyses innovation performance every two years.
The indicator in this Communication zooms in exclusively on innovation output and monitors a reduced set of dimensions, including the contribution to job creation of fast-growing firms. Given its complementarity with the IUS, it is planned that the results of the proposed indicator are published simultaneously with those of the IUS.
The European Council gave the Commission the mandate to develop an indicator in the context of Europe 2020,6 to complement the R&D intensity target,7 taking into account the Innovation Union request that the Commission "launch the necessary work for the development of a new indicator measuring the share of fast-growing innovative companies in the economy". In March 2013, the Heads of State and Government requested a discussion on innovation in October 2013, calling on the Commission to deliver the indicator.8
To advise the Commission on its formulation, a High-Level Panel of leading innovators and economists was set up in 2010.9 It prompted the Commission to engage in data collections on fast-growing firms in innovative sectors, carried out by Eurostat. In parallel, cooperation was undertaken with the OECD to develop sectoral innovation coefficients. Discussions with
4 OECD(2010), "Measuring innovation: a new perspective". 5 http://ec.europa.eu/enterprise/policies/innovation/files/ius-2013_en-pdf. 6 http://ec.europa.eu/europe2020/index_en.htm. 7 Conclusions of 4/2/2011 (Council doc. EUCO 2/1/11 REV1) and 1-2/3/2012 (EUCO 4/2/12 REV2). 8 The European Council noted "a debate next year on the Europe 2020 Strategy" and called for
"preparatory work to be conducted giving priority to: (…) (b) innovation (October 2013)", looking forward to "the presentation by the Commission of (…) its communication on the 'State of the Innovation Union 2012', including the single innovation indicator, in time for its discussions.", Council doc. EUCO 23/13.
9 Report of the High Level Panel on the Measurement of Innovation, A. Mas-Colell (Chair), September 2010.

8
Member States on the scope and definition of the indicator took place in workshops, in October and December 2012, and in July 2013.
The proposed indicator proposed in this supporting document was built on a solid methodological basis, using state-of-the-art statistical analyses and quality data, within the limits of current data availability. After setting the background (section 1), the document presents the proposed indicator (section 2) and the dataset to build it up (section 3). It then displays the resulting ranking, alongside an analysis of the performance of Member States and their international competitors (section 4). It then moves on to describe the comprehensive robustness analysis (section 5).
1.1. Measuring innovation output
The crisis and increasing globalisation have changed the rules of the game. According to the literature, the economies, which have nurtured their knowledge-base and lead in innovation, are those better placed to wave the crisis and generate growth, jobs and competitiveness.10 Innovation makes economies more resilient to economic downturns. Innovation output is wide-ranging and differs from sector to sector. Measuring it entails quantifying the extent to which ideas for new products and services, stemming from innovative sectors, carry an economic added value and are capable of reaching the market. Therefore, it can be captured by more than one measure. After exploring a broad set of options, the Commission opted for four IUS indicators, from the outputs and firm activities types in the Innovation Union Scoreboard, grouped into three components (patents, employment in knowledge-intensive activities (KIA), and competitiveness of knowledge-intensive goods and services), and a new measure of employment in fast-growing firms of innovative sectors. The patents component takes into account inventions that exploit the knowledge generated by investing in R&D and innovation, and which can be transformed into successful technologies. Similarly, the indicators of the intensity of employment of skilled labour, in KIA and in fast-growing firms, provide an indication of the orientation of the economy towards the production of goods and services with innovation added value. Finally, the trade flows associated with those commodities measure their capacity to reach global markets.11 The first component of the indicator is technological innovation as measured by patents, which account for the ability of the economy to transform knowledge into technology. The
10 This relation has been tested inter alia by Mairesse and Mohnen "Using Innovation Surveys for
Econometric Analysis", in Hall and Rosenberg (2010) Handbook of the Economics of Innovation. 11 In selecting the final components for the proposed indicator, the possibility of using any of the four
additional indicators of the output type in the IUS (SMEs with products or process innovations, SMEs with marketing or organisation innovations, sales of new to market and new to firms innovations and license and patent revenues from abroad) was examined. A set of considerations were taken into account in this respect, among which the recommendations by the High-Level Panel of leading economists and innovators set up in 2010 to advise the Commission on the development of the indicator, the relevance of exploiting the ad hoc data collection on fast-growing firms by Eurostat, the fact that the first three indicators above draw on reported CIS data –also used to build the innovation coefficients of the component on employment in fast-growing firms of innovative sectors-, and that PCT patenting covers for the technological innovation dimension.
9
number of patent applications per billion GDP is used as a measure of the marketability of innovations.12. An intrinsic bias in favour of countries relying more on international patents than on national ones might occur. Alternative statistics such as triadic patents from the OECD Patent Database were thus tested. The second component of the indicator focuses on how a highly skilled labour force feeds into the economic structure of a country. Investing in people is one of the main challenges for Europe in the years ahead, as education and training provide workers with the skills for generating innovations. This component captures the structural orientation of the economy towards knowledge-intensive activities, as measured by the number of persons employed in those activities in business industries over total employment.
The third component of the proposed indicator is the competitiveness of knowledge-intensive goods and services. This is a fundamental dimension of a well-functioning economy, given the close link between growth, innovation and internationalisation. Competitiveness-enhancing measures and innovation strategies can be mutually reinforcing for the growth of employment, export shares and turnover at the firm level. This component is built integrating in equal weights the contribution of the trade balance of high-tech and medium-tech products to the total trade balance, and knowledge-intensive services as a share of the total services exports of a country. It reflects the ability of an economy, notably resulting from innovation, to export products with high levels of value added, and successfully take part in knowledge-intensive global value chains.
Finally, the last component measures the employment in fast-growing firms in innovative sectors. Sector-specific innovation coefficients, reflecting the level of innovativeness of each sector, serve here as a proxy for distinguishing innovative enterprises. The component reflects the degree of innovativeness of successful entrepreneurial activities. The specific target of fostering the development of fast-growing firms in innovative sectors is an integral part of modern R&D and innovation policy. Studies show that while there are fewer fast-growing innovative firms in the EU than in the US, overall employment growth depends critically upon them given that they generate directly or indirectly a disproportionally large share of jobs, and can contribute to increased innovation investments during economic downturns.13 Moreover, it has been estimated that variations in firm growth dynamics between the US and the EU may account for more than two thirds of the EU's underperformance vis-à-vis the US in productivity growth in the recent decades.14
The Scoreboard data were used for the proposed indicator in two different ways:
1. First, three indicators of the "outputs" type (employment in knowledge-intensive activities, contribution of medium- and high-tech products to the trade balance and knowledge-intensive services exports as percentage of total service exports) defined the skills and competitiveness dimensions of the proposed indicator.
12 Despite the fact that these data might fail to capture innovation which occurs in industries where
investors rely on alternative mechanisms to protect intellectual property such as secrecy or lead-time. Moser (2013) Journal of Economic Perspectives—Volume 27, Number 1—Winter 2013—Pages 23–44.
13 OECD (2010), "High-growth Enterprises: What Governments Can Do to Make a Difference". Archibugi, D et al. (2013) "Economic crisis and innovation: is destruction prevailing over accumulation?" Research Policy 42, 2.
14 See the Report on the State of the Innovation Union 2011.

10
2. Second, one indicator from the "firm activities" type of the Scoreboard, measuring
PCT (Patent Cooperation Treaty) patent applications, was used as a proxy of the ability of transforming knowledge into marketable technology.
Finally, the Commission services computed a new measure intended to fill in the placeholder in the Scoreboard under the "outputs" type (number 3.1.3. High-growth innovative firms),15 reserved for an indicator reflecting the contribution of fast-growing firms in innovative sectors to market dynamics, as foreseen by the Innovation Union flagship initiative. It could thus be the 25th Scoreboard indicator. The underlying data for all components is available in Table 1 and at the European Commission’s Innovation Union website.16
1.2. The selection criteria
There is widespread agreement among experts, Member States' representatives and Commission services on the need to develop an indicator which is output-oriented, measures the innovation performance of a country and its capacity to derive economic benefits from it, captures the dynamism of innovative entrepreneurial activities, and is useful for policy-makers at EU and national level.
The indicator should also be easy to understand, built on solid foundations, and cover different types of innovation.17 It should draw on representative, comparable and validated data and rely on a robust methodology for its construction.
Throughout this work, the international standards for quality indicators put forward by Eurostat, OECD and IMF,18 which are widely accepted in the economic literature, were taken as reference. A large set of options were comprehensively tested in the process of defining this indicator.19 The necessary data were put together and comprehensive calculations were run to identify the option that best complied with the set of criteria defined in this section. Based on the conceptual framework defined by Eurostat,20 the following four principles were applied by the Commission services in its analysis of the set of options for the innovation indicator. 15 The development of the DYN component of the indicator is the fruit of joint work by Directorates-
General RTD and JRC with Eurostat. 16 See http://ec.europa.eu/research/innovation-union/index_en.cfm. 17 While the first component of the proposed indicator focuses solely on technological innovation, the
other three components might capture, to a certain extent, various dimensions of non-technological innovations, as measured for instance by skills, marketability elements in competitive knowledge-based goods and services, and additional aspects such as the organisation of business processes in fast-growing firms.
18 See Eurostat and European Statistical System (2011) "European Statistics Code of Practice for the National and Community Statistical Authorities", OECD (2011) “Quality Framework and Guidelines for OECD Statistical Analysis”, and OECD-JRC (2008) "Handbook on constructing composite indicators: methodology and user guide", as well as the report of the High-Level Panel, referred to in footnote 4.
19 The options examined are not reported in this supporting document, for the sake of conciseness.

11
1. Policy relevance. Focus was set on a simple and intuitive interpretation, with sizeable and direct links to measured facts. The indicator permits monitoring dimensions such as IPR conditions, the upgrading of the skills demanded by the market in knowledge-intensive and innovative sectors, the creation of a breeding ground for trade in knowledge-intensive commodities, and framework conditions for fast-growing firms.
2. Data quality. The availability of timely, representative and validated time series, and the exploitation of all available sources, was deemed essential.
3. International availability and cross-country comparability. The aim was to set the basis for an indicator suitable for meaningful cross-country comparisons and benchmarking.
4. Robustness. Composite indicators are used worldwide by a large number of actors, including international organisations. Their construction requires such state-of-the-art validation and robustness analyses21 that the picture produced enables benchmarking and meets policy needs.
A detailed analysis was performed on the various options for the innovation indicator. A set of more stringent robustness tests and associated analyses has been carried out for the selected option, namely the simple composite indicator. Because of data limitations, criteria 2 and 3 could only be met partially at this stage, and remain areas for future analysis. The indicator relies on imputations for missing values and international comparability, carried out in the fourth indicator component for four Member States and international partners. Those imputations were tested for robustness (section 3.4.2).
20 See Eurostat and European Statistical System (2011) "European Statistics Code of Practice for the
National and Community Statistical Authorities". 21 See: http://composite-indicators.jrc.ec.europa.eu/
12
2. THE SIMPLE COMPOSITE INDICATOR
Work to develop the indicator departed from the premise that the selected indicator of innovation output shall reflect the objectives assigned to innovation policy in the context of the Europe 2020 strategy for smart, sustainable and inclusive growth.
After a comprehensive analysis of all options, the Commission services (Secretariat-General, and Directorates-General ECFIN, ENTR, Eurostat,22 JRC and RTD) reached consensus on a simple composite indicator zooming in on four components measuring innovation output. Eurostat's role was limited to providing advice on the statistics it collects. Three of those components are from the "outputs" and "firm activities" types in the Innovation Union Scoreboard (technological innovation, skills , and competitiveness of knowledge-intensive goods and services) and there is a new component, which captures the employment dynamism of fast-growing firms in innovative sectors. This latter is proposed to fill in the existing placeholder (number 3.1.3.) in the Innovation Union Scoreboard. The equation representing this indicator is:
Box 1: Equation for the simple composite indicator zooming in on innovation output.23
DYNwCOMPwKIAwPCTwI 4321 +++=
where: PCT = number of patent applications filed under the Patent Cooperation Treaty per billion GDP. KIA = employment in knowledge-intensive activities in business industries (including financial services) as % of total employment.
SERVGOODCOMP *5,0*5,0 += , where: 24 GOOD = contribution of medium and high-tech products exports to the trade balance; SERV = knowledge-intensive services exports as % of total service exports;
DYN = employment in fast-growing firms of innovative business industries, excluding financial services:
HGc
HGsc
ss
scorescore
EEKIACIS∑ )*( , where s
scorescore KIACIS )*( is the innovation coefficient of sector s,
resulting from the product of Community Innovation Survey and Labour Force Survey scores for each sector at EU level;25 and HG
scE is the employment in fast-growing firms in sector s and country c.
4321 ,,, wwww are the weights of the component indicators (23, 18, 43, 15), fixed over time.26 These are statistically computed in such a way that the component indicators are equally balanced.
It is to be noted that the weights for the indicator components are used as ‘scaling coefficients’ and not as ‘importance coefficients’, with the aim of arriving at composite scores that are balanced in their underlying components. This implies taking a first decision on the 22 Providing advice on the statistics it collects. 23 For better comparability all components have been standardized. This procedure implies subtracting
from each component its mean and then dividing the result by the component’s standard variation. 24 Section 3.3. explains in detail the selected weighting and why the chosen weights are not country-
specific. 25 Annex 1 presents in detail the computation of the innovation coefficient 26 The sum of the weights adds up to 99, as each weight has been rounded to the closest integer.

13
relative importance of the variables, e.g. two given variables should be equally important. The corresponding nominal weights are subsequently assigned to these two variables in such a way that they are of truly equal statistical importance. The nominal weights might thus diverge from 50%-50%. This procedure aims to avoid that the two variables are equally important in nominal terms but that statistically the index depends more on one variable than on the other.27
27 Paruolo P., Saisana M., Saltelli A., “Ratings and Rankings: Voodoo or Science?”, Journal Royal
Statistical Society, A176(3), 609-634, show that in weighted arithmetic averages, the ratio of two nominal weights gives the rate of substitutability between the two indicators, and hence can be used to reveal the relative importance of individual indicators. Subsequently, a correction of the ‘scaling coefficients’ can be made to achieve component indicators with the desired relative importance.

14
3. DATA USED The simple composite indicator proposed in this supporting document is based to the maximum possible extent on existing and internationally used definitions and variables and on the best data sources available for its underlying components,28 be it national accounts, national business registers, European Union Labour Force Survey (LFS), Community Innovation Survey, European Patent Office Database, Commodity trade statistics, Balance of Payments.
Composite indicators are used across the board by a large number of public and private actors, including international organisations.29 They have the advantage of permitting intuitive and straightforward comparisons of countries in issues which would otherwise prove of a wide-ranging and multifaceted nature, and avoiding the disadvantage of possibly offering a simplistic picture of what is being measured. According to the authors of the Stiglitz report, composite indicators may also hide non transparent normative stances behind their weighting process30.
Thus, their construction requires the application of advanced validation and robustness analysis so that the picture produced supports the derivation of sound analytical and policy conclusions, while allowing to solidly benchmark relative performances. The battery of tests carried out for the selected composite indicator is presented in section 5 below.
Below, the supporting document presents in detail the data used to construct the four components of the proposed composite indicator, with particular attention to the dynamism component, given the fact that this latter variable is a new construct, which fully exploits the results from the ad hoc data collections on fast-growing firms undertaken by Eurostat and from the workshops conducted with the Member States. This component is intended to fill in the placeholder reserved in the Innovation Union Scoreboard for an indicator on fast-growing firms.
3.1. Ability of the economy to transform knowledge into marketable innovations
The first component, labelled as PCT, is indicator 2.3.1. of the Innovation Union Scoreboard and counts the number of patent applications per billion GDP. The numerator is defined as the number of patent applications filed, in international phase, which name the European Patent Office (EPO) as designated office under the Patent Cooperation Treaty (PCT).31 Patent counts 28 For all components based on data from the Innovation Union Scoreboard, the EU average refers to
EU27, since the Scoreboard indicators were computed and published prior to Croatia's accession. For the DYN component, the EU average was computed making use of all countries with available data (see section 3.4).
29 Recent studies find almost 180 composite indicators being used worldwide on a regular basis for policy-making purposes. Those indicators usually assess performance of countries in multiple areas such as competitiveness, environment, governance, and globalization, amongst others. Some can be found in the field of research and innovation. For more details, see Bandura (2008), UNDP/ODS Working Paper, " A Survey of Composite Indices Measuring Country Performance: 2008 Update".
30 Stiglitz, J. E., A. Sen, and J. Fitoussi (2009). Report by the commission on the measurement of economic performance and social progress. Technical report, www.stiglitz-sen-fitoussi.fr.
31 PCT is an international patent law treaty concluded in 1970, unifying procedures for filing patent applications. An application filed under PCT is called an "international application". An international patent is subject to two phases. The first one is the "international phase" (protection pends under a single application filed with the patent office of a contracting state of the PCT). The second one is the "national and regional phase" in which rights are continued by filing documents with the patent offices of the various PCT states.
15
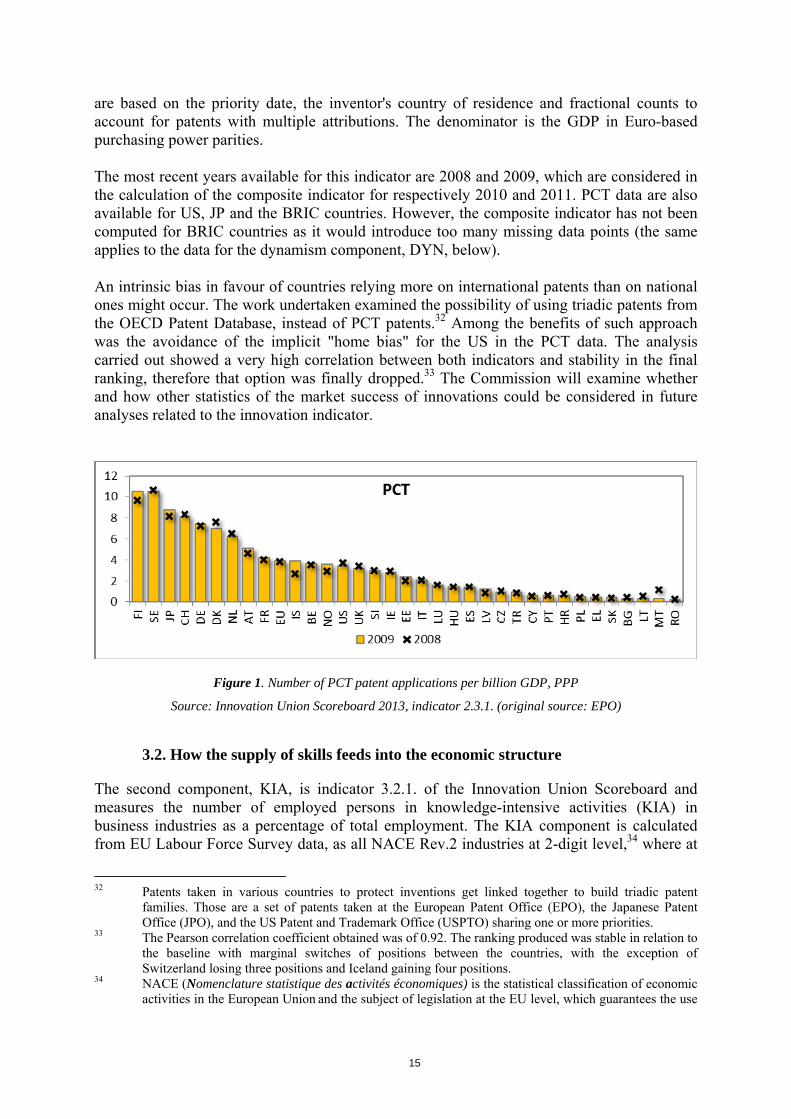
are based on the priority date, the inventor's country of residence and fractional counts to account for patents with multiple attributions. The denominator is the GDP in Euro-based purchasing power parities. The most recent years available for this indicator are 2008 and 2009, which are considered in the calculation of the composite indicator for respectively 2010 and 2011. PCT data are also available for US, JP and the BRIC countries. However, the composite indicator has not been computed for BRIC countries as it would introduce too many missing data points (the same applies to the data for the dynamism component, DYN, below). An intrinsic bias in favour of countries relying more on international patents than on national ones might occur. The work undertaken examined the possibility of using triadic patents from the OECD Patent Database, instead of PCT patents.32 Among the benefits of such approach was the avoidance of the implicit "home bias" for the US in the PCT data. The analysis carried out showed a very high correlation between both indicators and stability in the final ranking, therefore that option was finally dropped.33 The Commission will examine whether and how other statistics of the market success of innovations could be considered in future analyses related to the innovation indicator.
Figure 1. Number of PCT patent applications per billion GDP, PPP
Source: Innovation Union Scoreboard 2013, indicator 2.3.1. (original source: EPO)
3.2. How the supply of skills feeds into the economic structure
The second component, KIA, is indicator 3.2.1. of the Innovation Union Scoreboard and measures the number of employed persons in knowledge-intensive activities (KIA) in business industries as a percentage of total employment. The KIA component is calculated from EU Labour Force Survey data, as all NACE Rev.2 industries at 2-digit level,34 where at
32 Patents taken in various countries to protect inventions get linked together to build triadic patent
families. Those are a set of patents taken at the European Patent Office (EPO), the Japanese Patent Office (JPO), and the US Patent and Trademark Office (USPTO) sharing one or more priorities.
33 The Pearson correlation coefficient obtained was of 0.92. The ranking produced was stable in relation to the baseline with marginal switches of positions between the countries, with the exception of Switzerland losing three positions and Iceland gaining four positions.
34 NACE (Nomenclature statistique des activités économiques) is the statistical classification of economic activities in the European Union and the subject of legislation at the EU level, which guarantees the use

16
least 33% of employment has a tertiary degree (ISCED5 or ISCED6). The most recent years available for this indicator are 2010 and 2011, which are considered in the calculation of the composite indicator for respectively 2010 and 2011. KIA data are also available for the US and JP.
Figure 2. Employment in knowledge-intensive activities in business industries as % of total employment
Source: Innovation Union Scoreboard 2013, indicator 3.2.1. (original source: Eurostat) 3.3. Competitiveness of the knowledge-intensive sectors
The third component, named COMP, is made of indicators 3.2.2. and 3.2.3. of the Innovation Union Scoreboard, and integrates in equal weights the contribution of the trade balance of high-tech and medium-tech products to the total trade balance and of knowledge-intensive services exports as a share of the total services exports of a country. The first part of the component, GOOD, measures the contribution of the trade balance of high-tech and medium-tech products to the total trade balance. The contribution to the trade balance is calculated as follows: (XMHT-MMHT)-(X-M)*[(XMHT+MMHT)/(X+M)], where (XMHT-MMHT) is the observed trade balance for medium and high-tech products and (X-M)*[(XMHT +MMHT)/(X+M)] is the theoretical trade balance (where X denotes exports and M denotes imports of respectively MHT products and all products). MHT exports include exports of the following Standard International Trade Classification (STIC) Rev.3 products: 266, 267, 512, 513, 525, 533, 54, 553, 554, 562, 57, 58, 591, 593, 597, 598, 629, 653, 671, 672, 679, 71, 72, 731, 733, 737, 74, 751, 752, 759, 76, 77, 78, 79, 812, 87, 88 and 891. The denominator is the value of the total trade balance. The most recent years available for this indicator are 2010 and 2011, which are considered in the calculation of the composite indicator for the years 2010 and 2011. GOOD data are also available for US, JP and the BRIC countries.
of the classification uniformly within all the Member States. It is a basic element of the international integrated system of economic classifications, based on classifications of the UN Statistical Commission, Eurostat as well as national classifications; all of them strongly related each to the others, allowing the comparability of economic statistics produced worldwide by different institutions.

17
Figure 3a. Contribution of medium and high-tech products to trade balance
Source: Innovation Union Scoreboard 2013, indicator 3.2.2. (original source: UN) The second part of the component, SERV, measures exports of knowledge-intensive services as captured by the sum of credits in EBOPS (Extended Balance of Payments Services Classification) 207, 208, 211, 212, 218, 228, 229, 245, 253, 260, 263, 272, 274, 278, 279, 280 and 284. The denominator is the total services exports as measured by credits in EBOPS 200. The most recent years available for this indicator are 2010 and 2011, which are considered in the calculation of the composite indicator for the years 2010 and 2011. The SERV data for 2011 come directly from Eurostat, as the Scoreboard indicator only covers figures up to 2010. SERV data are not available for Norway in 2010, so the 2009 value is considered. SERV data are also available for US, JP and the BRIC countries. For CH, SERV data is not available for 2011, so the 2010 value has been imputed as the best proxy. Data from the Scoreboard for Greece showed a large discrepancy in value between year 2010 (5.4%) and 2011 (54.2%). This was due to the fact that the value for sector 208 (freight transport by sea) is not available for 2011, due to confidentiality constraints. In order to calculate the SERV indicator, the 2011 value for EL was thus imputed using the 2010 value for that Member State.
Figure 3b. Knowledge-intensive services exports as % of total service exports
Source: Innovation Union Scoreboard 2013, indicator 3.2.3. for 2010, and Eurostat for 2011 (original sources for both years: UN/Eurostat)
18
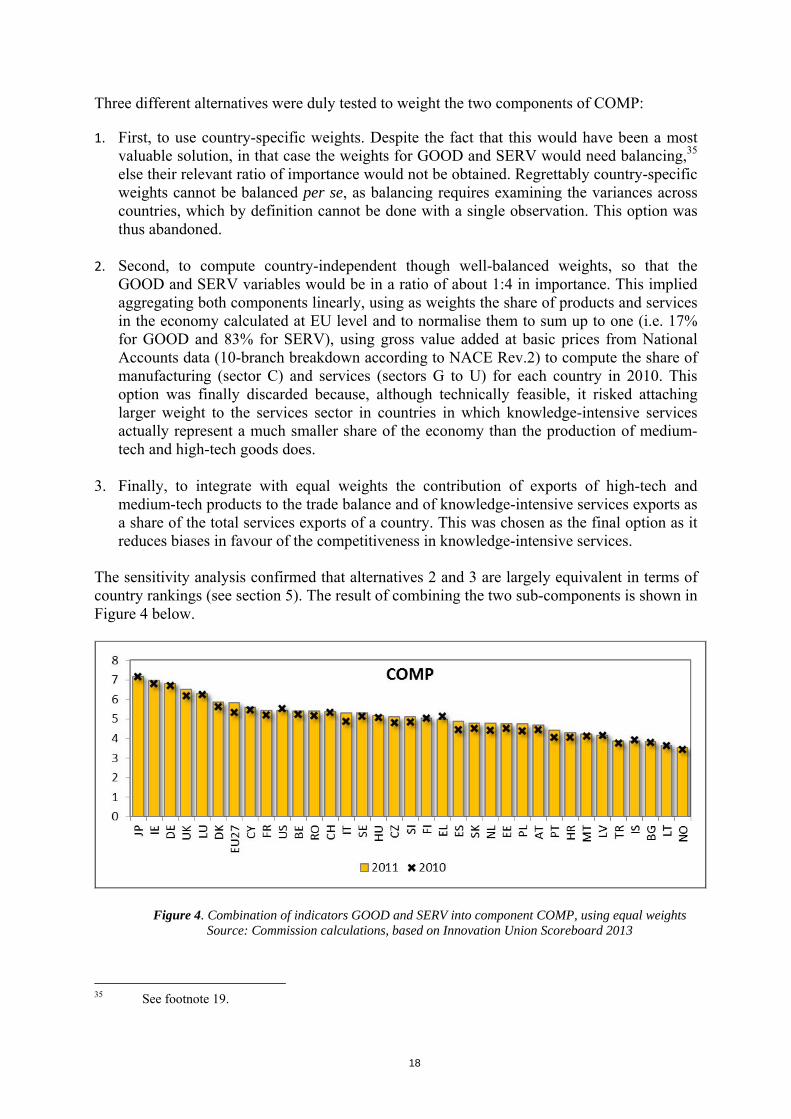
Three different alternatives were duly tested to weight the two components of COMP:
1. First, to use country-specific weights. Despite the fact that this would have been a most valuable solution, in that case the weights for GOOD and SERV would need balancing,35 else their relevant ratio of importance would not be obtained. Regrettably country-specific weights cannot be balanced per se, as balancing requires examining the variances across countries, which by definition cannot be done with a single observation. This option was thus abandoned.
2. Second, to compute country-independent though well-balanced weights, so that the GOOD and SERV variables would be in a ratio of about 1:4 in importance. This implied aggregating both components linearly, using as weights the share of products and services in the economy calculated at EU level and to normalise them to sum up to one (i.e. 17% for GOOD and 83% for SERV), using gross value added at basic prices from National Accounts data (10-branch breakdown according to NACE Rev.2) to compute the share of manufacturing (sector C) and services (sectors G to U) for each country in 2010. This option was finally discarded because, although technically feasible, it risked attaching larger weight to the services sector in countries in which knowledge-intensive services actually represent a much smaller share of the economy than the production of medium-tech and high-tech goods does.
3. Finally, to integrate with equal weights the contribution of exports of high-tech and medium-tech products to the trade balance and of knowledge-intensive services exports as a share of the total services exports of a country. This was chosen as the final option as it reduces biases in favour of the competitiveness in knowledge-intensive services.
The sensitivity analysis confirmed that alternatives 2 and 3 are largely equivalent in terms of country rankings (see section 5). The result of combining the two sub-components is shown in Figure 4 below.
Figure 4. Combination of indicators GOOD and SERV into component COMP, using equal weights
Source: Commission calculations, based on Innovation Union Scoreboard 2013
35 See footnote 19.

19
The most recent years available for COMP, as for its sub-components, are 2010 and 2011. Because of its composition, COMP reflects the strengths of countries with high scores in GOOD, such as Japan or Germany, and with a very good performance in SERV, such as Luxembourg and Ireland. Countries with good performance in both sub-components, rank naturally also well in COMP. This is the case of the UK, France or the United States. For a sub-set of countries, relative strengths and weaknesses in both sub-components lead to a number of countries being located around the EU average. Beyond the four top performers, the differences in score for the majority of the remaining countries are not particularly large.
3.4. Employment dynamism of fast-growing firms in innovative sectors
The fourth and last component of the composite indicator, DYN, is a measure of innovation dynamism newly developed by the work of the Commission services. Commitment 34.b of the Innovation Union flagship initiative requested to measure "the share of fast-growing innovative companies in the economy" and a placeholder was reserved for such measure in the Innovation Union Scoreboard. This new measure focuses on employment in fast-growing enterprises in innovative sectors. Sector-specific innovation coefficients, reflecting the level of innovativeness of each sector, serve here as a proxy for distinguishing innovative enterprises. These coefficients are weighted with sectoral shares of employment in fast-growing enterprises, providing an indication of the dynamism of fast-growing firms in innovative sectors. The employment data used for the calculation of this component comes from the ad hoc data collections undertaken in 2011 and 2012.36 In statistical terms, it is calculated on the basis of a ‘basket’ of all business economic sectors, with the exception of financial economic activities, characterised by their innovativeness and knowledge intensity, weighted with the sectoral shares of employment in fast-growing enterprises.37 The formula representing this fourth component is:
HGC
HGsC
ss
scorescorec E
EKIACISDYN ∑=1
)*(
Equation 2. Component DYN (dynamism) of the composite indicator
where sscorescore KIACIS )*( is the innovation coefficient and
HGsCE is the number of employees in fast-
growing enterprises in sector s and country c, being ∑=s
HGsC
HGC EE . Note that in this formula the term HG
C
HGsC
EE
plays the role of a weight as 11
=∑ HGC
HGsC
s EE
.
This indicator has been shown to be resistant to crisis-induced fluctuations in employment growth. 36 See details in Annex 2. 37 Annex 2 provides details on the underlying dataset.
20
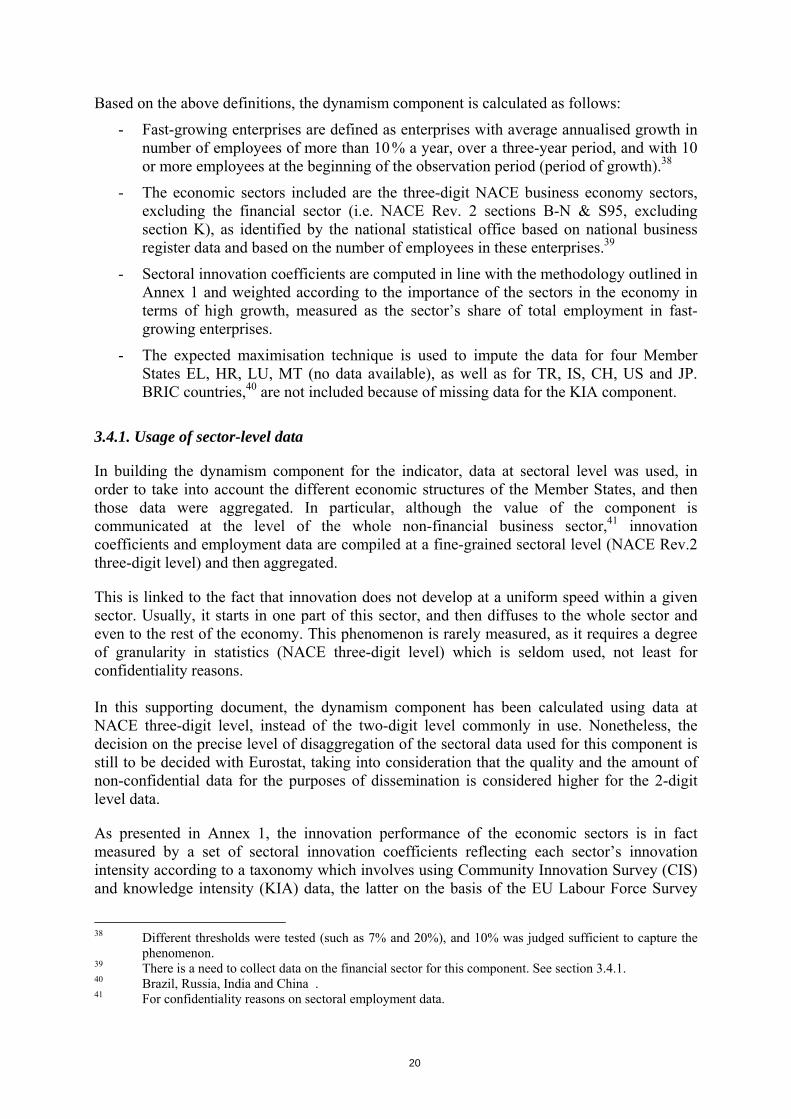
Based on the above definitions, the dynamism component is calculated as follows:
- Fast-growing enterprises are defined as enterprises with average annualised growth in number of employees of more than 10 % a year, over a three-year period, and with 10 or more employees at the beginning of the observation period (period of growth).38
- The economic sectors included are the three-digit NACE business economy sectors, excluding the financial sector (i.e. NACE Rev. 2 sections B-N & S95, excluding section K), as identified by the national statistical office based on national business register data and based on the number of employees in these enterprises.39
- Sectoral innovation coefficients are computed in line with the methodology outlined in Annex 1 and weighted according to the importance of the sectors in the economy in terms of high growth, measured as the sector’s share of total employment in fast-growing enterprises.
- The expected maximisation technique is used to impute the data for four Member States EL, HR, LU, MT (no data available), as well as for TR, IS, CH, US and JP. BRIC countries,40 are not included because of missing data for the KIA component.
3.4.1. Usage of sector-level data
In building the dynamism component for the indicator, data at sectoral level was used, in order to take into account the different economic structures of the Member States, and then those data were aggregated. In particular, although the value of the component is communicated at the level of the whole non-financial business sector,41 innovation coefficients and employment data are compiled at a fine-grained sectoral level (NACE Rev.2 three-digit level) and then aggregated.
This is linked to the fact that innovation does not develop at a uniform speed within a given sector. Usually, it starts in one part of this sector, and then diffuses to the whole sector and even to the rest of the economy. This phenomenon is rarely measured, as it requires a degree of granularity in statistics (NACE three-digit level) which is seldom used, not least for confidentiality reasons. In this supporting document, the dynamism component has been calculated using data at NACE three-digit level, instead of the two-digit level commonly in use. Nonetheless, the decision on the precise level of disaggregation of the sectoral data used for this component is still to be decided with Eurostat, taking into consideration that the quality and the amount of non-confidential data for the purposes of dissemination is considered higher for the 2-digit level data.
As presented in Annex 1, the innovation performance of the economic sectors is in fact measured by a set of sectoral innovation coefficients reflecting each sector’s innovation intensity according to a taxonomy which involves using Community Innovation Survey (CIS) and knowledge intensity (KIA) data, the latter on the basis of the EU Labour Force Survey
38 Different thresholds were tested (such as 7% and 20%), and 10% was judged sufficient to capture the
phenomenon. 39 There is a need to collect data on the financial sector for this component. See section 3.4.1. 40 Brazil, Russia, India and China . 41 For confidentiality reasons on sectoral employment data.

21
(LFS). The OECD elaborated the CIS and EU-LFS based scores used, in the framework of a contract financed by the Commission. The list of coefficients was updated following the meetings with Member States experts on 23 October and 13 December 2012, where agreement was reached on this principle. The use of EU averages rather than country-specific values implies that these sectoral innovation coefficients will not reflect differences in the knowledge intensity or CIS score across Member States. While this could be seen as a weakness, it has also the benefit of defining a common reference of the degree of innovation of each sector against which countries can be reliably compared over time (see Annex 1). In statistical terms, the dynamism component is calculated on the basis of a ‘basket’ of all business economy sectors, with the exception of financial economic activities, characterised by their innovativeness and knowledge intensity, weighted according to the sectoral shares of employment in fast-growing enterprises, providing an indication of the dynamism of innovative fast-growing firms. The changes in the index over time will show the trend. All economic sectors of the non-financial business economy are included in the component. However, the contribution of each sector depends on its innovation intensity as defined by multiplying its degree of innovativeness by its knowledge intensity.42 The top innovative sectors include among others R&D in natural sciences and engineering, software publishing, satellite telecommunications activities, manufacture of pharmaceutical preparations, computer programming, consultancy and related activities, wireless telecommunications activities, manufacture of basic pharmaceutical products, architectural and engineering activities and related technical consultancy. Well-functioning and performing financial services are crucial to the innovative capacity of an economy. Financial services have been excluded from the indicator at this stage but they are considered relevant for the measurement of innovation given their pervasive function and impact in the non-financial economy. The contribution of the financial sector is furthermore included in the other three components of the composite, i.e. in the technological innovation (to a lesser extent), skills component and competitiveness components. The Commission services therefore underline the need to ensure the improvement of data on fast-growing firms in innovative sectors, in coverage and regular production, with a mandatory request for collection as part of the amended Commission Regulation implementing the European Parliament and Council Regulation on Structural Business Statistics, which will cover the financial sector. 3.4.2. Imputation technique for missing values and wider international comparability
For the purpose of this supporting document, the dynamism component is based on two voluntary test data collections relating to four years (2008, 2009, 2010 and 2011), of which one (2010) is almost complete (with the exclusion of EL, HR, LU and MT). The other reference years are covered for a wide range of Member States.43 42 See Annex 1 for a comprehensive overview. 43 See Annex 2 for more details.

22
Unlike the Innovation Union Scoreboard based components, for which a good level of international comparability beyond the EU is ensured, as described above, for the dynamism component international comparability is more limited. The actual capacity to provide data to calculate the indicator on an international basis is constrained by two main factors. First of all, while statistical business registers are available in countries such as Brazil, Canada, New Zealand or the United States, a proper register does not exist in other major global economies such as China, India or Japan. In order to calculate the dynamism component for these countries, all that can be used are firm-level data from different types of data sources, with several representativeness and quality problems. For instance, the available Chinese data only cover manufacturing enterprises while India provides information at plant (not company) level, again mostly in manufacturing industry.
Second, estimates of employment in fast-growing innovative enterprises are based on European sector-specific innovation coefficients. Countries outside the EU use the International System of Industrial Classifications (ISIC) or national classifications convertible to ISIC, in order to organise economic data. Innovation coefficients thus need to be reported in both NACE and ISIC for the calculation of the indicator to be accurate outside the EU. The base classifications, i.e. ISIC4 and NACE Rev.2, are identical (NACE Rev.2 added a set of sub-aggregates at the three-digit level, which can be aggregated to ISIC4 three-digit level codes), but the data currently produced by non-EU countries are not necessarily at ISIC4 three-digit level and hence a methodology for converting such data to NACE Rev.2 still needs to be developed. However, it is standard practice to calculate composite indicators by the statistical imputation of missing values. DG JRC has applied a set of ten different imputation techniques from which the optimal one is chosen based on a cross-validation test. For the data considered here, the optimal imputation approach was found to be the Expectation-Maximization (EM) algorithm technique.44 This is an iterative procedure to find the maximum likelihood estimates of the parameter vector by repeating the following steps.
1. Expectation "E-step": given a set of parameter estimates, such as a mean vector and covariance matrix for a multivariate normal distribution, the E-step calculates the conditional expectation of the complete-data log likelihood given the observed data and the parameter estimates.
2. Maximization "M-step": given a complete-data log likelihood, the M-step finds the
parameter estimates which maximize the complete-data log likelihood from the E-step. These two steps are iterated until the iterations converge.
The imputation is thus carried out for component DYN for four EU Member States, EL, HR, LU, MT, , as well as for TR, IS, CH, US and JP. BRIC countries have not been included in
44 For further reference see: Dempster, A.P.; Laird, N.M.; Rubin, D.B., 1977. Maximum Likelihood from
Incomplete Data via the EM Algorithm, Journal of the Royal Statistical Society. B 39 (1): 1–38, and Little, R.J.A., Rubin, D.B., 2002. Statistical Analysis with missing data. IInd edition; John Wiley & Sons, Inc.
23
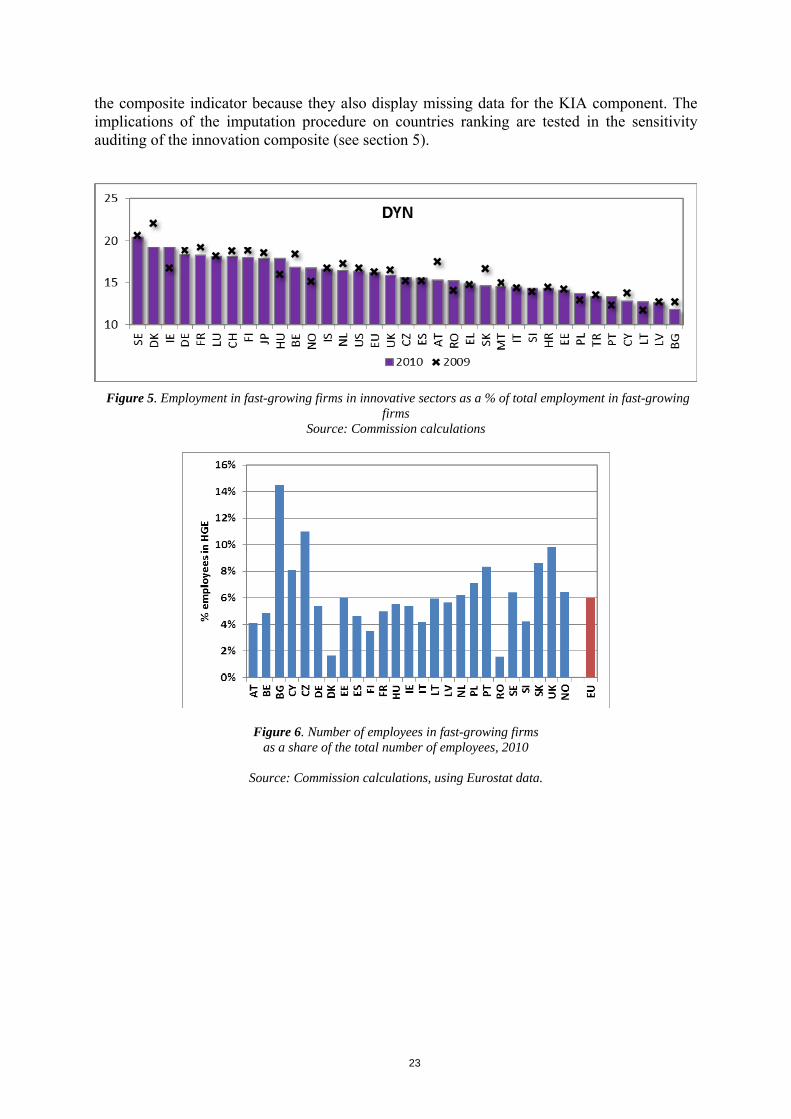
the composite indicator because they also display missing data for the KIA component. The implications of the imputation procedure on countries ranking are tested in the sensitivity auditing of the innovation composite (see section 5).
Figure 5. Employment in fast-growing firms in innovative sectors as a % of total employment in fast-growing
firms Source: Commission calculations
Figure 6. Number of employees in fast-growing firms as a share of the total number of employees, 2010
Source: Commission calculations, using Eurostat data.

24
3.5. Overview of data used and reference periods
3.5.1. The data used
Table 1 below presents the data used for all the components of the selected indicator.
PCT KIA GOOD SERV DYN Country Code 2008 2009 2010 2011 2010 2011 2010 2011 2009 2010 EU EU 3.8 3.9 13.5 13.6 1.0 1.3 45.1 54.8 16.2 16.2 Belgium BE 3.5 3.7 14.6 14.8 1.5 2.4 41.3 42.9 18.3 16.8 Bulgaria BG 0.4 0.3 8.6 8.4 -4.8 -4.8 26.8 27.6 12.7 11.8 Czech Republic CZ 1.0 0.9 11.8 12.3 3.4 3.8 27.3 33.0 15.2 15.6 Denmark DK 7.6 7.0 15.8 15.6 -3.8 -2.8 63.3 65.8 22.0 19.2 Germany DE 7.2 7.4 15.3 15.1 7.8 8.5 56.7 57.2 18.8 18.3 Estonia EE 2.0 2.4 9.8 10.7 -3.0 -2.7 37.4 41.8 14.2 14.1 Ireland IE 2.9 2.8 19.5 19.8 2.4 2.6 73.1 75.7 16.7 19.2 Greece EL 0.4 0.4 10.9 11.3 -4.2 -5.7 54.2 54.2 14.7 14.8 Spain ES 1.4 1.4 11.5 11.8 2.6 3.1 21.6 29.9 15.2 15.5 France FR 4.0 4.2 13.8 14.4 4.8 4.7 32.6 37.8 19.2 18.2 Croatia HR 0.7 0.6 9.9 10.3 2.1 3.0 15.0 17.6 14.4 14.3 Italy IT 2.1 2.1 13.7 13.4 4.0 5.0 27.2 34.0 14.3 14.4 Cyprus CY 0.5 0.6 14.4 15.0 0.7 1.7 48.5 48.5 13.7 12.8 Latvia LV 0.8 1.2 9.6 9.1 -5.0 -5.4 35.3 36.5 12.7 12.6 Lithuania LT 0.5 0.3 8.7 9.0 -1.1 -1.3 13.7 14.7 11.7 12.7 Luxembourg LU 1.6 1.6 25.7 24.8 -4.4 -3.3 78.3 76.2 18.1 18.1 Hungary HU 1.4 1.5 12.8 13.1 5.9 5.8 26.5 28.9 15.9 17.8 Malta MT 1.1 0.3 15.8 16.4 3.2 0.9 13.6 21.4 14.9 14.5 Netherlands NL 6.5 6.2 15.2 14.9 0.5 1.7 26.3 31.0 17.2 16.4 Austria AT 4.6 5.1 14.4 14.0 2.6 3.2 22.2 25.3 17.4 15.3 Poland PL 0.4 0.5 9.1 9.3 0.4 0.9 26.1 32.5 12.9 13.7 Portugal PT 0.6 0.6 8.6 9.1 -3.5 -1.2 29.0 31.2 12.3 13.3 Romania RO 0.2 0.2 6.0 6.5 0.3 0.4 43.0 47.5 14.0 15.2 Slovenia SI 3.0 3.0 13.4 13.7 6.1 6.1 20.9 26.6 13.9 14.3 Slovakia SK 0.3 0.4 10.1 10.5 4.0 4.4 19.6 24.5 16.6 14.6 Finland FI 9.6 10.5 15.2 15.3 2.0 1.7 35.9 36.8 18.8 17.9 Sweden SE 10.6 10.5 17.1 17.4 1.8 2.0 38.7 41.6 20.6 20.4 United Kingdom UK 3.4 3.2 17.0 17.6 3.0 3.1 57.6 64.8 16.4 15.8 Turkey TR 0.8 0.9 4.8 4.7 -2.8 -2.2 21.3 22.0 13.5 13.3 Iceland IS 2.7 3.9 18.1 18.5 -12.8 -13.6 50.3 51.4 16.6 16.6 Norway NO 2.9 3.6 14.2 15.1 -16.5 -17.4 49.4 54.0 15.1 16.7 Switzerland CH 8.3 8.1 19.8 20.0 8.0 8.4 26.5 26.5 18.7 18.0 United States US 3.7 3.4 16.6 16.8 2.4 1.9 45.3 44.8 16.7 16.4 Japan JP 8.1 8.8 17.5 17.5 20.4 21.4 33.9 31.6 18.5 17.8
Table 1. Country performance by indicator
Note: imputed values displayed in yellow background
25
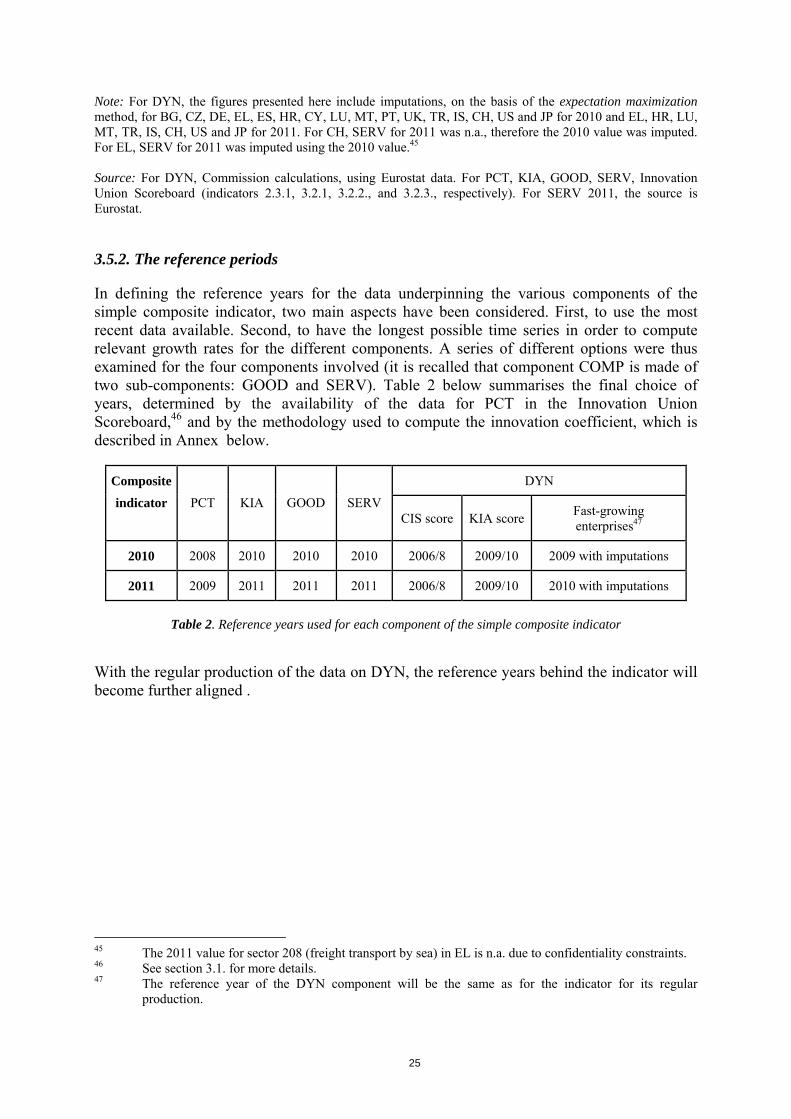
Note: For DYN, the figures presented here include imputations, on the basis of the expectation maximization method, for BG, CZ, DE, EL, ES, HR, CY, LU, MT, PT, UK, TR, IS, CH, US and JP for 2010 and EL, HR, LU, MT, TR, IS, CH, US and JP for 2011. For CH, SERV for 2011 was n.a., therefore the 2010 value was imputed. For EL, SERV for 2011 was imputed using the 2010 value.45 Source: For DYN, Commission calculations, using Eurostat data. For PCT, KIA, GOOD, SERV, Innovation Union Scoreboard (indicators 2.3.1, 3.2.1, 3.2.2., and 3.2.3., respectively). For SERV 2011, the source is Eurostat. 3.5.2. The reference periods
In defining the reference years for the data underpinning the various components of the simple composite indicator, two main aspects have been considered. First, to use the most recent data available. Second, to have the longest possible time series in order to compute relevant growth rates for the different components. A series of different options were thus examined for the four components involved (it is recalled that component COMP is made of two sub-components: GOOD and SERV). Table 2 below summarises the final choice of years, determined by the availability of the data for PCT in the Innovation Union Scoreboard,46 and by the methodology used to compute the innovation coefficient, which is described in Annex below.
DYN Composite
indicator PCT KIA GOOD SERV CIS score KIA score Fast-growing
enterprises47
2010 2008 2010 2010 2010 2006/8 2009/10 2009 with imputations
2011 2009 2011 2011 2011 2006/8 2009/10 2010 with imputations
Table 2. Reference years used for each component of the simple composite indicator
With the regular production of the data on DYN, the reference years behind the indicator will become further aligned .
45 The 2011 value for sector 208 (freight transport by sea) in EL is n.a. due to confidentiality constraints. 46 See section 3.1. for more details. 47 The reference year of the DYN component will be the same as for the indicator for its regular
production.

26
4. MEASURING COUNTRY PERFORMANCE WITH THE INDICATOR
The indicator provides an outcome-oriented measure of innovation in a country, balanced between technological and non-technological innovation, manufacturing and services, as captured by its four components: patents, skills, competitiveness and the employment dynamism of fast-growing enterprises in innovative sectors.
4.1. Score produced by the chosen indicator
Figure 7 and Table 3 show the scores of the innovation indicator for each EU Member State, Switzerland, Norway, Turkey, United States and Japan in comparison with the EU average. Countries’ scores for year 2011 (red bars) and 2010 (crosses) are displayed in Figure 7 with respect to the EU average, set at 100 in 2010.
Figure 7. The simple composite indicator measuring innovation output
Countries’ scores for 2011 (red bars) and 2010 (crosses) with respect to the EU average (100 in 2010).
In 2011, the components reflect the situation in 2009 (PCT), 2010 (DYN) or 2011 (KIA, COMP) In 2010, they are based on 2008 (PCT), 2009 (DYN) or 2010 (KIA, COMP) data
Source: Commission calculations.
Improved time series, based on longer observation periods and further aligned reference years, are essential and will become available in the medium term. This will enhance the possibilities for analysing performance in relation to progress and will offer new possibilities to derive policy recommendations.48
48 The potential of the indicator to inform policies will be further tested using research and econometric
analyses.

27
Country 2010 2011 Japan JP 133.9 134.2 Sweden SE 126.4 127.5 Germany DE 125.9 126.1 Ireland IE 118.7 124.8 Switzerland CH 122.6 121.5 Luxembourg LU 121.6 120.7 Denmark DK 124.7 119.7 Finland FI 117.5 117.9 United Kingdom UK 110.8 112.8 France FR 105.5 106.7 United States US 106.0 104.4 European Union EU 100.0 104.4 Belgium BE 103.8 103.1 Netherlands NL 102.4 102.8 Austria AT 98.0 96.4 Hungary HU 90.9 96.0 Iceland IS 92.6 95.2 Slovenia SI 89.5 92.8 Italy IT 89.0 92.3 Cyprus CY 90.1 90.3 Czech Republic CZ 85.2 89.0 Norway NO 81.1 87.7 Spain ES 82.8 87.4 Estonia EE 80.5 84.3 Greece EL 84.7 83.9 Malta MT 84.5 83.5 Romania RO 76.8 81.5 Slovakia SK 81.9 81.0 Poland PL 72.7 77.6 Croatia HR 74.7 76.6 Portugal PT 68.6 74.3 Latvia LV 72.0 72.1 Lithuania LT 63.9 65.9 Turkey TR 64.2 64.9 Bulgaria BG 66.7 64.9
Table 3. Countries’ scores for the years 2010 and 2011,
reported with respect to the EU average, which is set at 100 in 2010
Source: Commission calculations.

28
Overall, in 2011 six categories of performers are identified according to the country scores.49 Sweden, Germany, Ireland and Luxembourg are “top performers”, with scores of over 120 and high values in all four components. These are followed by Denmark, Finland, and the UK, which appear as “very good performers”, with scores of between 110 and 120. France, Belgium and the Netherlands are “good performers” with indicator values of between 100 and 110, followed closely by a group of “medium-level performers”, including Austria, Hungary, Slovenia, Italy, and Cyprus, in the score range of 90 to 100. “Medium-low performers”, with values of between 80 and 90, include the Czech Republic, Spain, Estonia, Greece, Malta, Romania, and Slovakia. Finally, the countries with scores of less than 80 are considered “low performers”. These include Poland, Croatia, Portugal, Latvia, as well as Lithuania and Bulgaria, the latter two with particularly low scores close to 65, around half of the top score.50
Box 2. Performance of four selected Member States on the indicator
Sweden, the top EU performer, has a knowledge-intensive economy with one of the world's highest R&D intensities, increased high-tech and medium-high-tech specialisation, and framework conditions prone to innovation and the creation of fast-growing firms. Therefore, it has a strong performance in three of the indicator components: patents, and employment in knowledge-intensive activities and in fast-growing firms of innovative sectors. Sweden’s success in deriving economic benefits from a well-performing research and innovation system is an example for other Nordic countries.
France is a good performer in the indicator. With its large and competitive science base, it has particular strengths in the contribution of medium- and high-tech products to the trade balance and in employment in fast-growing firms of innovative sectors. In contrast, its share of knowledge-intensive exports is much lower than the EU value. Although this can partially reflect the weight of tourism in France's economy, policies such as those aimed at linking up internationalisation and innovation strategies at the firm level and at valorising research results, will contribute to a higher performance on the indicator.
Italy, as a medium-level performer, is strong on the contribution of its medium- and high-tech goods to the trade balance, in relation to its lower performance on the other components. Improving the national framework conditions for innovation, such as further pursuing the on-going simplification of the IPR system, and policies aimed at fostering an increased correspondence between education curricula and labour market needs, as well as the reduction of administrative burdens for SMEs, all contribute to a better overall performance.
Bulgaria ranks as a low performer in the indicator, with small levels of knowledge-intensive economic activity. Improving this position requires fostering adequate framework conditions for an upgrade of the innovation capacity of its economy, including a more stable regulatory environment for companies, better access to financing and a reduction of existing administrative burdens for creating new enterprises. The failure to channel skilled people into domestic employment, linked to the relevance of making working conditions more attractive for highly productive researchers, is also a relevant bottleneck for increased performance. Policies to favour the development of knowledge, technology-intensive clusters and the upgrading of its manufacturing sector through R&D contribute to higher patenting and harness innovation to create new high value-added exports.
49 For 2011 the statistics for the score distribution are: average 96.1, standard deviation 19.4, median 92.8 50 The country-level results are correlated with those of the Summary Innovation Index of the Innovation
Union Scoreboard (coefficient: 0.90) and the R&D headline indicator on research expenditure (coefficient: 0.72). Nonetheless, the statistical properties of the proposed composite indicator are different from those of the SII. As an illustration of this fact, Principal Component Analysis reveals that the SII accounts for five different latent dimensions, capturing a wide range of innovation aspects, while the indicator proposed in the Communication reveals a single latent dimension, capturing innovation output.
29
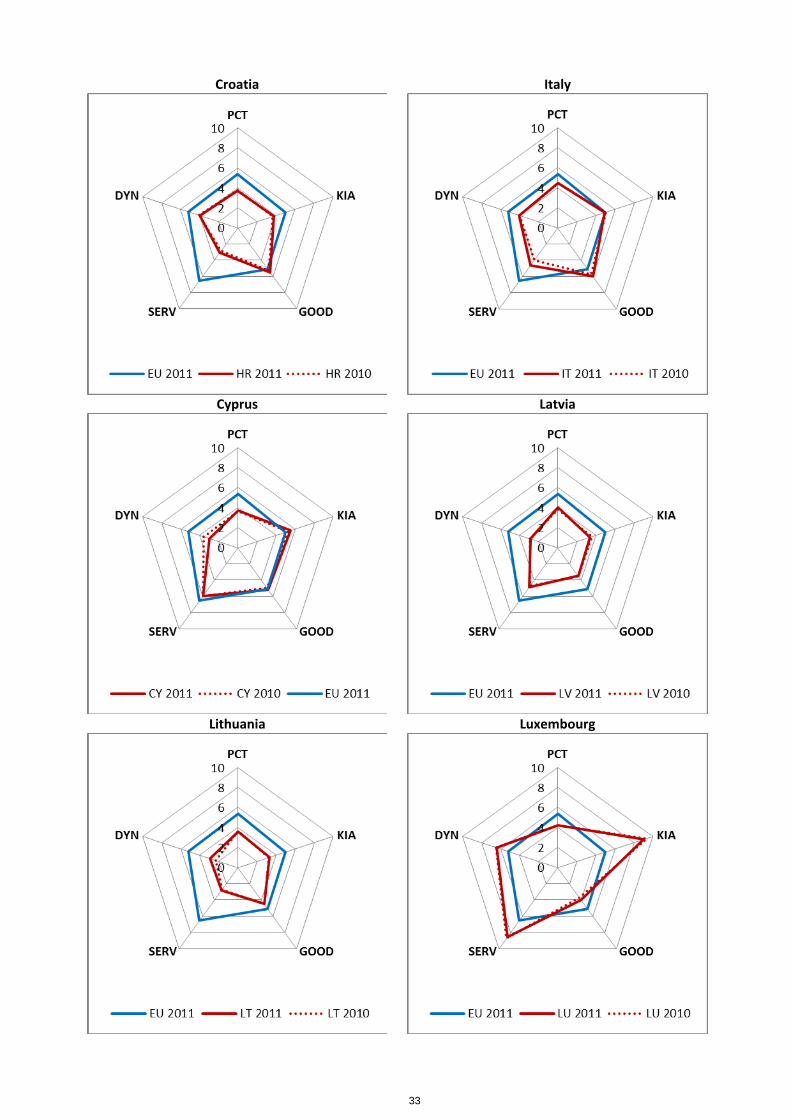
Given the data constraints for component DYN, the indicator is calculated for years 2009 and 2010. The policy relevance of the indicator will gradually grow as time series based on longer observation periods and further aligned reference years, become available in the medium term and it will make it possible to assess the progress achieved over time by individual countries and by the EU as a whole.
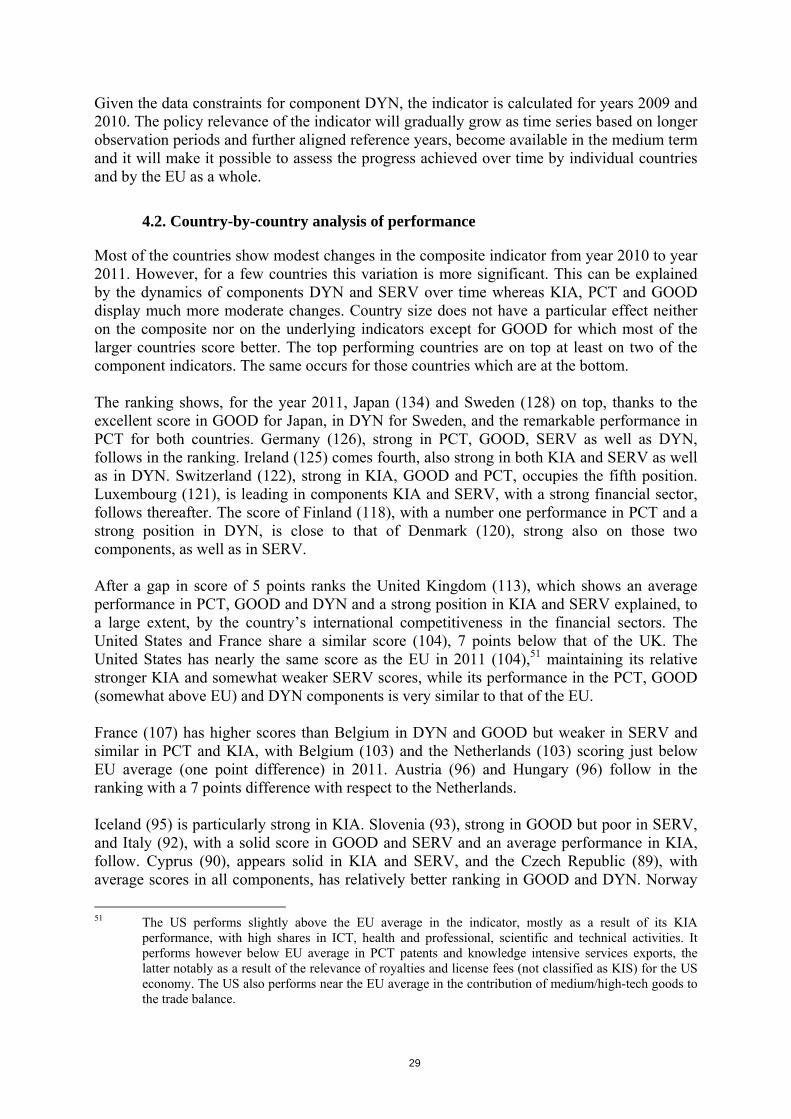
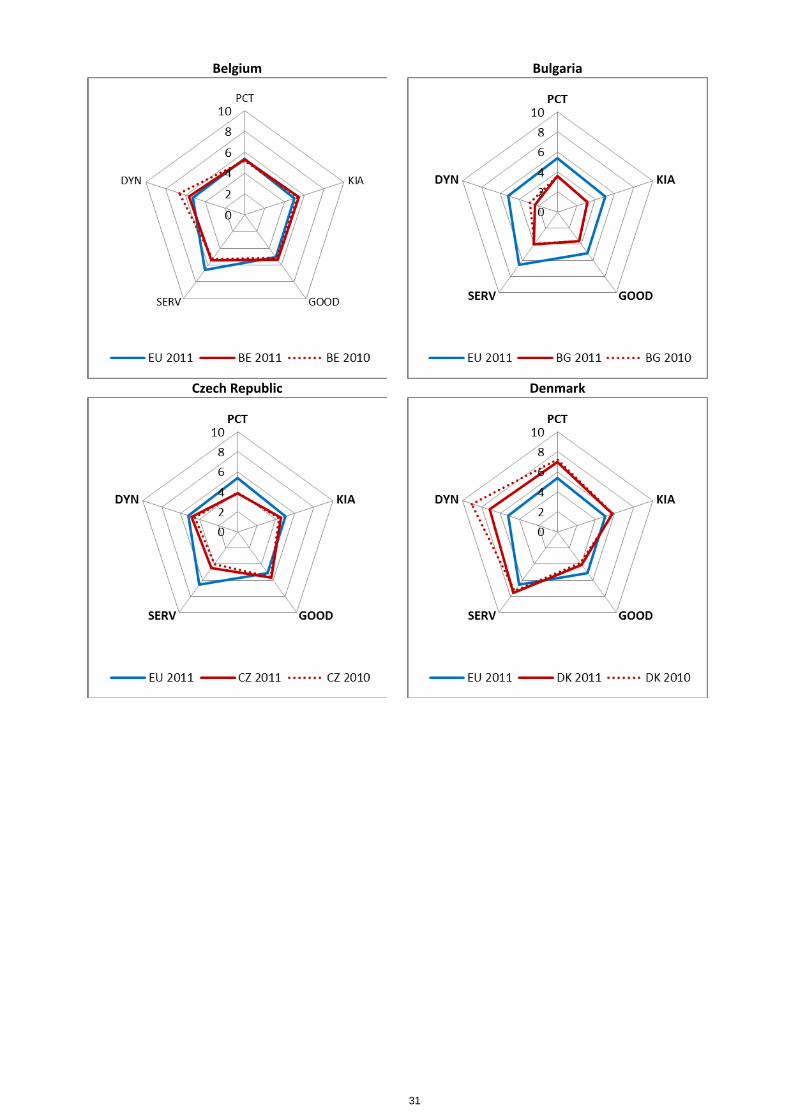
4.2. Country-by-country analysis of performance
Most of the countries show modest changes in the composite indicator from year 2010 to year 2011. However, for a few countries this variation is more significant. This can be explained by the dynamics of components DYN and SERV over time whereas KIA, PCT and GOOD display much more moderate changes. Country size does not have a particular effect neither on the composite nor on the underlying indicators except for GOOD for which most of the larger countries score better. The top performing countries are on top at least on two of the component indicators. The same occurs for those countries which are at the bottom. The ranking shows, for the year 2011, Japan (134) and Sweden (128) on top, thanks to the excellent score in GOOD for Japan, in DYN for Sweden, and the remarkable performance in PCT for both countries. Germany (126), strong in PCT, GOOD, SERV as well as DYN, follows in the ranking. Ireland (125) comes fourth, also strong in both KIA and SERV as well as in DYN. Switzerland (122), strong in KIA, GOOD and PCT, occupies the fifth position. Luxembourg (121), is leading in components KIA and SERV, with a strong financial sector, follows thereafter. The score of Finland (118), with a number one performance in PCT and a strong position in DYN, is close to that of Denmark (120), strong also on those two components, as well as in SERV. After a gap in score of 5 points ranks the United Kingdom (113), which shows an average performance in PCT, GOOD and DYN and a strong position in KIA and SERV explained, to a large extent, by the country’s international competitiveness in the financial sectors. The United States and France share a similar score (104), 7 points below that of the UK. The United States has nearly the same score as the EU in 2011 (104),51 maintaining its relative stronger KIA and somewhat weaker SERV scores, while its performance in the PCT, GOOD (somewhat above EU) and DYN components is very similar to that of the EU. France (107) has higher scores than Belgium in DYN and GOOD but weaker in SERV and similar in PCT and KIA, with Belgium (103) and the Netherlands (103) scoring just below EU average (one point difference) in 2011. Austria (96) and Hungary (96) follow in the ranking with a 7 points difference with respect to the Netherlands. Iceland (95) is particularly strong in KIA. Slovenia (93), strong in GOOD but poor in SERV, and Italy (92), with a solid score in GOOD and SERV and an average performance in KIA, follow. Cyprus (90), appears solid in KIA and SERV, and the Czech Republic (89), with average scores in all components, has relatively better ranking in GOOD and DYN. Norway
51 The US performs slightly above the EU average in the indicator, mostly as a result of its KIA
performance, with high shares in ICT, health and professional, scientific and technical activities. It performs however below EU average in PCT patents and knowledge intensive services exports, the latter notably as a result of the relevance of royalties and license fees (not classified as KIS) for the US economy. The US also performs near the EU average in the contribution of medium/high-tech goods to the trade balance.

30
(88) performs just below EU average in SERV, although it has the lowest score in GOOD as a result of oil and natural gas exports. Spain (87) has a low score in SERV and PCT but higher scores in GOOD, KIA and DYN. Estonia (84) follows with score below the EU average in all components, although closer to it in PCT. Greece (84) appears particularly strong on SERV,52 Malta (84) is below average in PCT and SERV but strong in KIA, and Romania (82) has low performance in both PCT and KIA but performs better in SERV and somewhat in DYN, together with Slovakia (81), which has strong performance in GOOD. Poland (78) and Croatia (77), follow in the ranking, the first one scoring better in GOOD and SERV while the latter with an average score for GOOD but weak in SERV, slightly ahead of Portugal (74), which scores low in all components but with higher performance in GOOD. Latvia (72), with performance under that of Portugal although with an average position in SERV and scoring better in PCT, is ahead of Lithuania (66) and Turkey (65), both having stronger scores in GOOD, and of Bulgaria, weak in all components except SERV, which shows the lowest score. The radar charts shown below for all countries can assist in the interpretation of the results of the composite indicator. We refer to Table 1 for the exact country’s scores.
The figures below display the reference years for the composite indicator (2010 and 2011), using normalised unweighted scores. Table 2 above shows the reference years selected for each of the components, which have been reflected into the 2010 and 2011 values of the proposed composite indicator.
52 The 2010 SERV data for Greece was imputed by the 2011 values, due to the disproportionate.
31
Belgium Bulgaria
Czech Republic Denmark

32
Germany Estonia
Ireland Greece
Spain France
33
Croatia Italy
Cyprus Latvia
Lithuania Luxembourg

34
Hungary Malta
The Netherlands Austria
Poland Portugal

35
Romania
Slovenia
Slovakia Finland
Sweden United Kingdom

36
Turkey
Iceland
Norway Switzerland
United States Japan
Figure 9. Country results. Note: The graphs include imputations for missing data, as shown in Table 1.
37
5. ROBUSTNESS ANALYSIS
Monitoring innovation at the national scale across the European Union Member States and with respect to benchmark countries raises practical challenges related to the quality of data and the combination of these into a single number. This section discusses the assessment of the indicator along two main axes: the conceptual and statistical coherence of the structure, and the impact of key modelling assumptions on the country ranks.53
These are necessary steps to ensure the transparency and reliability of the indicator, to enable policymakers to derive informed and meaningful conclusions, and to potentially guide choices on priority setting and policy formulation.
The conceptual and statistical coherence is carried out for two statistical approaches, one based on global sensitivity analysis and using the Pearson correlation ratio (the non-linear equivalent of the Pearson correlation coefficient), and another based on multivariate analysis and using principal component analysis.54
The key modelling assumptions tested include imputation (estimation of missing data), alternative aggregation formulas (arithmetic, geometric), alternative indicators for KIA, SERV and DYN and random weights for the indicators GOOD and SERV underlying the component COMP.
The analysis complements the country rankings with confidence intervals, in order to better appreciate the robustness of these ranks to the index computation methodology. In addition, the analysis includes a measure of distance to the efficient frontier of innovation by using data envelopment analysis.
5.1. Conceptual and statistical coherence in the framework
The options for the innovation indicator were assessed in an iterative process that aimed at setting the foundation for a balanced index. The process followed four steps (see Figure 10).
53 See for example Saisana, M., D'Hombres, B., Saltelli, A., 2011. Rickety numbers: Volatility of
university rankings and policy implications, Research Policy 40(1), 165-177. 54 Details on the applied methodologies are available at http///composite-indicators.jrc.ec.europa.eu
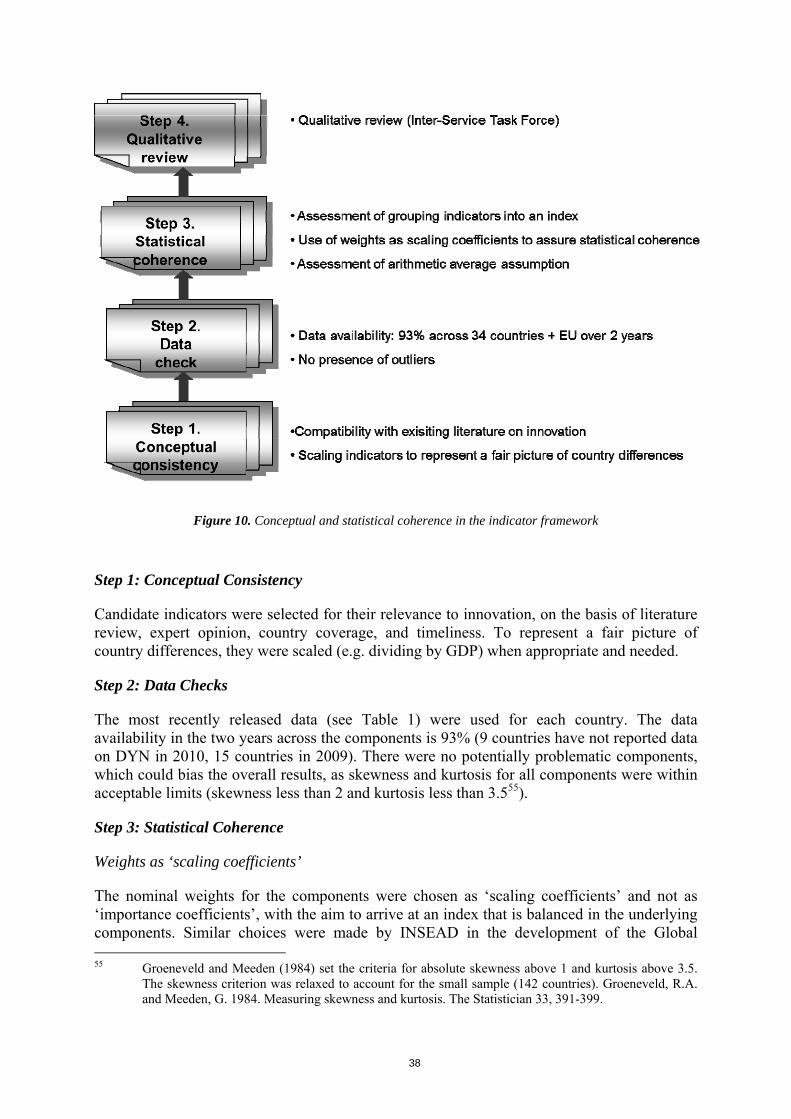
38
Figure 10. Conceptual and statistical coherence in the indicator framework
Step 1: Conceptual Consistency
Candidate indicators were selected for their relevance to innovation, on the basis of literature review, expert opinion, country coverage, and timeliness. To represent a fair picture of country differences, they were scaled (e.g. dividing by GDP) when appropriate and needed.
Step 2: Data Checks
The most recently released data (see Table 1) were used for each country. The data availability in the two years across the components is 93% (9 countries have not reported data on DYN in 2010, 15 countries in 2009). There were no potentially problematic components, which could bias the overall results, as skewness and kurtosis for all components were within acceptable limits (skewness less than 2 and kurtosis less than 3.555).
Step 3: Statistical Coherence
Weights as ‘scaling coefficients’
The nominal weights for the components were chosen as ‘scaling coefficients’ and not as ‘importance coefficients’, with the aim to arrive at an index that is balanced in the underlying components. Similar choices were made by INSEAD in the development of the Global 55 Groeneveld and Meeden (1984) set the criteria for absolute skewness above 1 and kurtosis above 3.5.
The skewness criterion was relaxed to account for the small sample (142 countries). Groeneveld, R.A. and Meeden, G. 1984. Measuring skewness and kurtosis. The Statistician 33, 391-399.
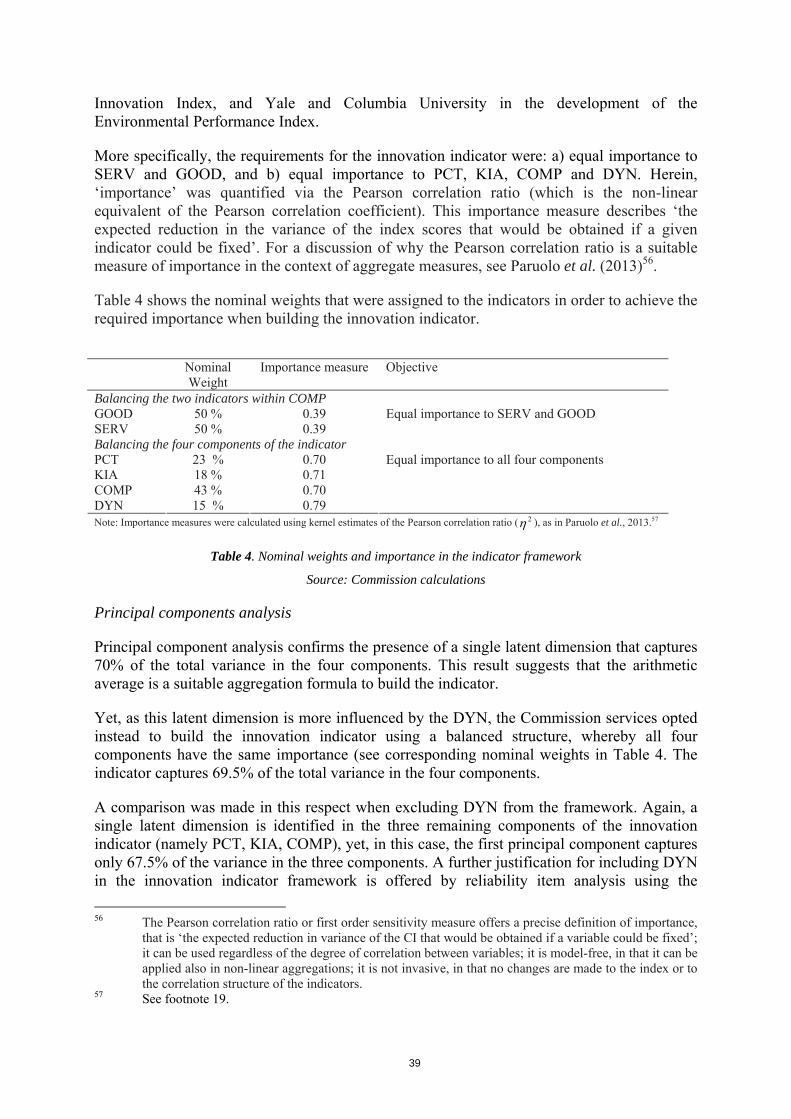
39
Innovation Index, and Yale and Columbia University in the development of the Environmental Performance Index.
More specifically, the requirements for the innovation indicator were: a) equal importance to SERV and GOOD, and b) equal importance to PCT, KIA, COMP and DYN. Herein, ‘importance’ was quantified via the Pearson correlation ratio (which is the non-linear equivalent of the Pearson correlation coefficient). This importance measure describes ‘the expected reduction in the variance of the index scores that would be obtained if a given indicator could be fixed’. For a discussion of why the Pearson correlation ratio is a suitable measure of importance in the context of aggregate measures, see Paruolo et al. (2013)56.
Table 4 shows the nominal weights that were assigned to the indicators in order to achieve the required importance when building the innovation indicator.
Nominal
Weight Importance measure Objective
Balancing the two indicators within COMP GOOD 50 % 0.39 SERV 50 % 0.39
Equal importance to SERV and GOOD
Balancing the four components of the indicator PCT 23 % 0.70 KIA 18 % 0.71 COMP 43 % 0.70 DYN 15 % 0.79
Equal importance to all four components
Note: Importance measures were calculated using kernel estimates of the Pearson correlation ratio ( 2η ), as in Paruolo et al., 2013.57
Table 4. Nominal weights and importance in the indicator framework
Source: Commission calculations
Principal components analysis
Principal component analysis confirms the presence of a single latent dimension that captures 70% of the total variance in the four components. This result suggests that the arithmetic average is a suitable aggregation formula to build the indicator.
Yet, as this latent dimension is more influenced by the DYN, the Commission services opted instead to build the innovation indicator using a balanced structure, whereby all four components have the same importance (see corresponding nominal weights in Table 4. The indicator captures 69.5% of the total variance in the four components.
A comparison was made in this respect when excluding DYN from the framework. Again, a single latent dimension is identified in the three remaining components of the innovation indicator (namely PCT, KIA, COMP), yet, in this case, the first principal component captures only 67.5% of the variance in the three components. A further justification for including DYN in the innovation indicator framework is offered by reliability item analysis using the 56 The Pearson correlation ratio or first order sensitivity measure offers a precise definition of importance,
that is ‘the expected reduction in variance of the CI that would be obtained if a variable could be fixed’; it can be used regardless of the degree of correlation between variables; it is model-free, in that it can be applied also in non-linear aggregations; it is not invasive, in that no changes are made to the index or to the correlation structure of the indicators.
57 See footnote 19.

40
coefficient Cronbach alpha (c-alpha)58. A high c-alpha, or equivalently a high “reliability”, indicates that the individual indicators measure the latent phenomenon well 59. The c-alpha value is 0.85 for the innovation indicator, which confirms the high reliability of the indicator. When either PCT or KIA is excluded from the framework, the reliability drops slightly at 0.81. When the COMP is eliminated, the reliability remains unaffected. Instead, when DYN is eliminated from the framework, the reliability drops notably at 0.74. This result gives a further justification for including DYN in the framework, as it increases the reliability (measured here by c-alpha) of the proposed innovation indicator.
These results reveal that the choices made in building the indicator have assured the statistical coherence of the index.
Step 4: Qualitative Review
Finally, the country scores and ranks for the innovation indicator were evaluated to verify that the overall results were, to a great extent, consistent with current evidence, existing research or prevailing theory.
Notwithstanding these statistical tests and the positive outcomes on the statistical coherence of the proposed indicator, it is important to mention that it should remain open for future improvements as new relevant research studies become available. A potential revision of the framework in five to ten years can thus be envisaged.
5.2. Impact of modelling assumptions on the indicator results
Every country score depends on modelling choices: components’ selection, imputation or not of missing data, normalization, weights, aggregation method, among other elements. These choices are based on expert opinion (e.g., selection of components), or common practice (e.g., standardisation), driven by statistical analysis (e.g., weights assigned to the components). The robustness analysis is aimed at assessing the simultaneous and joint impact of these modelling choices on the rankings. The data are error-free since eventual errors and typos were corrected during the computation phase.
The robustness assessment of the innovation indicator was based on a combination of a Monte Carlo experiment and a multi-modelling approach that dealt with seven issues: (1) missing data, (2) aggregation formula, (3) weights for GOOD and SERV, (4) alternative indicator for KIA, (5) alternative indicator for SERV, (6) alternative indicator for DYN, and (7) exclusion of SERV. This type of assessment aims to anticipate eventual criticism that the indicator scores were calculated under conditions of certainty (Saisana et al., 2005;60 Saisana et al., 2011).
The Monte Carlo simulation was played on the weights for the two components underlying COMP, namely GOOD and SERV, and comprised 1,000 runs, each corresponding to a
58 Cronbach L. J. 1951. Coefficient alpha and the internal structure of tests. Psychometrika 16: 297-334. 59 Nunnally (1978) suggests 0.7 as an acceptable reliability threshold (yet some authors use 0.75 or 0.8,
whist others are as lenient as to go to 0.6). Nunnaly J. 1978. Psychometric theory. New York: McGraw-Hill.
60 Saisana, M., Saltelli, A., Tarantola, S., 2005. Uncertainty and sensitivity analysis techniques as tools for the analysis and validation of composite indicators. Journal of the Royal Statistical Society A 168(2), 307-323.

41
different set of weights, randomly sampled from uniform continuous distributions that were determined as follows. The ratio of the share of services to products in the economies analysed ranges between 2.1 in Romania in 2010 to 16.26 in Luxembourg in 2009. These ratios are considered as notions of importance and subsequently lead to nominal weights for GOOD and SERV in the following range: 28-43% for GOOD and 57-72% for SERV. This choice of the range for the weights’ variation ensures a wide enough interval to have meaningful robustness checks.
When building aggregate measures and for reasons of transparency and replicability, international organisations often prefer not to estimate missing data. Yet, this “no imputation” choice is practically equivalent to replacing missing values with the weighted average of the available (normalized) data. Furthermore, the ‘no imputation’ choice might encourage countries not to report low data values. To overcome these limitations, the Commission services opted to estimate missing data using the Expectation Maximization (EM) algorithm.61
The next type of uncertainty considered relates to the use of the arithmetic average in the calculation of the indicator, a formula that received statistical support from principal component analysis. Yet, decision-theory practitioners have challenged the use of simple arithmetic averages because of their fully compensatory nature, in which a comparative high advantage on a few indicators can compensate a comparative disadvantage on many indicators (Munda, 2008).62 In order to account for this criticism, the geometric average was considered as an alternative. The geometric average63 is a partially compensatory approach that rewards countries with similar performance on the underlying indicators and motivates them to improve in the indicators in which they perform poorly, and not just in any indicator.
Finally, although the Commission services made a clear choice on the use of indicators KIA, SERV, and DYN, there have been discussions as to whether KIA2, or SERV2 or DYN2 could have been used instead.64 These alternatives were hence included in the uncertainty analysis, together with a consideration as to whether SERV should be excluded.
Fourty-eight models were tested based on the combination of EM imputation versus no imputation, arithmetic versus geometric average, KIA versus KIA2, SERV versus SERV2, DYN versus DYN2, and inclusion or not of SERV. Combined with 1,000 simulations per model for the random weights assigned to GOOD and SERV, a total of 48,000 simulations for
61 The Expectation-Maximization (EM) algorithm (Little, R.J.A., Rubin, D.B. 2002. Statistical Analysis
with missing data. 2nd edition; John Wiley & Sons, Inc.) is an iterative procedure that finds the maximum likelihood estimates of the parameter vector by repeating two steps: (1) The expectation E-step: Given a set of parameter estimates, such as a mean vector and covariance matrix for a multivariate normal distribution, the E-step calculates the conditional expectation of the complete-data log likelihood given the observed data and the parameter estimates. (2) The maximization M-step: Given a complete-data log likelihood, the M-step finds the parameter estimates to maximize the complete-data log likelihood from the E-step. The two steps are iterated until the iterations converge.
62 Munda, G. 2008. Social Multi-Criteria Evaluation for a Sustainable Economy. Berlin Heidelberg: Springer-Verlag.
63 In the geometric average, indicators are multiplied as opposed to summed in the arithmetic average. Indicator weights appear as exponents in the multiplication.
64 KIA2 defines KIA as a percentage of total employment in business industries. SERV2 captures the contribution of KIS exports to the trade balance. DYN2 is a variant of DYN focussing on the top-third tier of the innovative sectors and on employment in fast-growing firms over the total employment in the economy.

42
the indicator were carried out (see Table 5 for a summary of the uncertainties considered in the indicator).
1. Uncertainty in the treatment of missing values Reference Alternative Expectation Maximization (EM) no estimation of missing data 2. Uncertainty in the aggregation formula at pillar level Reference Alternative arithmetic average geometric average 3. Uncertainty in the weights COMP component Reference value Distribution for robustness GOOD 50% Uniform between 28-43% SERV 50% Uniform between 57-72% 4-7. Uncertainty in the indicators Reference Alternative KIA KIA2 SERV SERV2 DYN DYN2 SERV Excluding SERV
Table 5. Uncertainty analysis for the innovation indicator
Sensitivity analysis results
Sensitivity analysis has been used to identify which of the modelling assumptions have the highest impact on country ranks, and thereafter to help focus the discussion of on those uncertainties. Figure 11 presents the box plots of ranking shifts for the seven assumptions tested. The median shift in rank across all simulations is the red segment. The vertical boxes show the 75% of the distributions (percentiles P25 and P75 are the horizontal edges of the boxes) and vertical lines extend from minimum to maximum.
Three assumptions are highly influential: the choice of SERV versus SERV2, DYN versus DYN2, and the inclusion or not of the SERV indicator within the COMP. If SERV2 were used instead of SERV, four countries would move more than 3 positions (up to 6) in 2010 and only one country would move 4 positions in 2011. All other countries would shift less than 3 positions in either year. If DYN2 were used instead of DYN, seven countries would move more than 3 positions (up to 6). If SERV were excluded from the framework, two countries would lose over 12 positions in 2011 and 2010, whilst three countries would gain over 6 positions in 2011. Ten more countries would also move over 4 positions in the classification either in 2011 and/or in 2010. Of all the choices considered, this is also the only choice that has a notable impact to EU (decline of almost 5 positions if SERV were excluded).
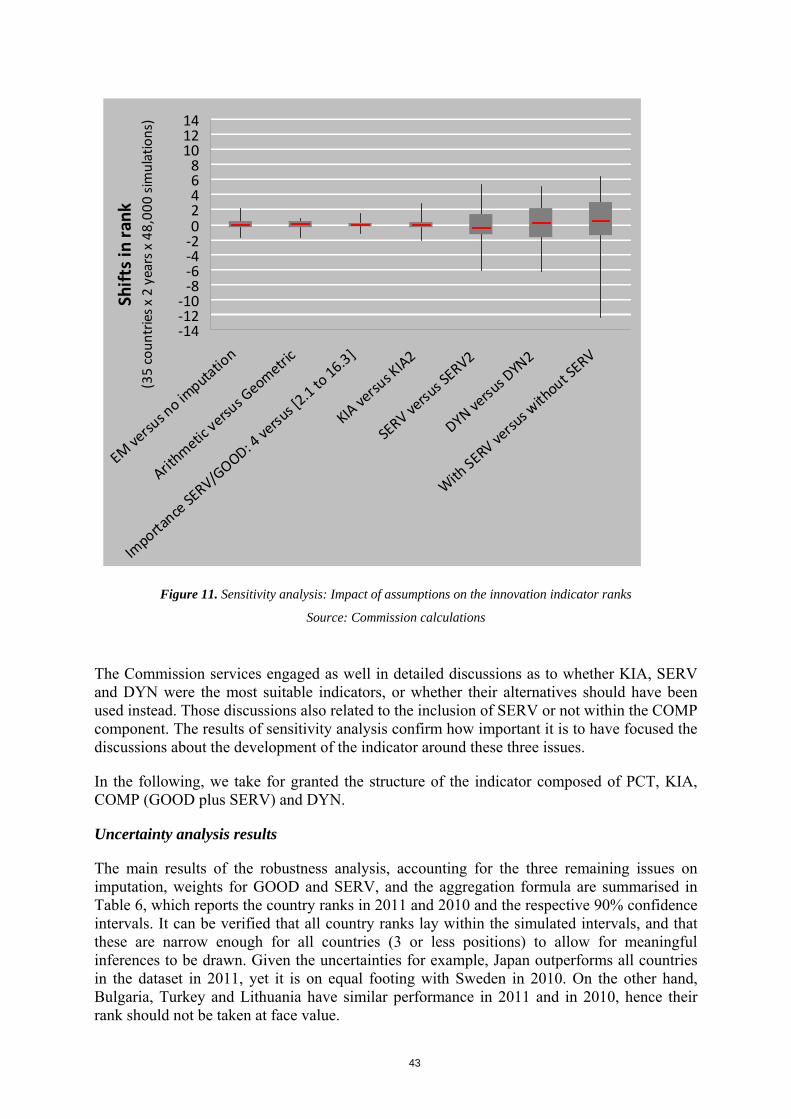
43
-14-12-10
-8-6-4-202468
101214
EM versu
s no im
putation
Arithmetic
versus G
eometric
Importa
nce SERV/G
OOD: 4 ve
rsus [2
.1 to 16.3]
KIA versu
s KIA2
SERV versu
s SERV2
DYN versu
s DYN
2
With SERV ve
rsus w
ithout S
ERV
Shift
s in
rank
(3
5 co
untr
ies x
2 y
ears
x 4
8,00
0 sim
ulat
ions
)
Figure 11. Sensitivity analysis: Impact of assumptions on the innovation indicator ranks
Source: Commission calculations
The Commission services engaged as well in detailed discussions as to whether KIA, SERV and DYN were the most suitable indicators, or whether their alternatives should have been used instead. Those discussions also related to the inclusion of SERV or not within the COMP component. The results of sensitivity analysis confirm how important it is to have focused the discussions about the development of the indicator around these three issues.
In the following, we take for granted the structure of the indicator composed of PCT, KIA, COMP (GOOD plus SERV) and DYN.
Uncertainty analysis results
The main results of the robustness analysis, accounting for the three remaining issues on imputation, weights for GOOD and SERV, and the aggregation formula are summarised in Table 6, which reports the country ranks in 2011 and 2010 and the respective 90% confidence intervals. It can be verified that all country ranks lay within the simulated intervals, and that these are narrow enough for all countries (3 or less positions) to allow for meaningful inferences to be drawn. Given the uncertainties for example, Japan outperforms all countries in the dataset in 2011, yet it is on equal footing with Sweden in 2010. On the other hand, Bulgaria, Turkey and Lithuania have similar performance in 2011 and in 2010, hence their rank should not be taken at face value.

44
Rank Interval Rank IntervalJapan 1 [1, 1] 1 [1, 2]Sweden 2 [2, 2] 2 [1, 2]Germany 3 [3, 3] 3 [3, 4]Ireland 4 [4, 5] 7 [7, 8]Switzerland 5 [5, 7] 5 [5, 7]Luxembourg 6 [5, 7] 6 [5, 7]Denmark 7 [6, 7] 4 [3, 5]Finland 8 [8, 8] 8 [7, 8]United Kingdom 9 [9, 9] 9 [9, 9]France 10 [10, 11] 11 [10, 11]United States 11 [10, 11] 10 [10, 11]EU 12 [12, 12] 14 [13, 14]Belgium 13 [13, 13] 12 [12, 13]Netherlands 14 [14, 14] 13 [13, 15]Austria 15 [15, 15] 15 [15, 15]Hungary 16 [16, 17] 17 [17, 18]Iceland 17 [16, 17] 16 [16, 17]Slovenia 18 [18, 18] 19 [19, 20]Italy 19 [19, 20] 20 [20, 21]Cyprus 20 [20, 22] 18 [17, 19]Czech Republic 21 [21, 22] 21 [21, 22]Norway 22 [22, 22] 26 [25, 26]Spain 23 [23, 24] 24 [23, 24]Estonia 24 [24, 25] 27 [26, 27]Greece 25 [25, 27] 22 [22, 24]Malta 26 [26, 26] 23 [23, 24]Romania 27 [27, 28] 28 [28, 29]Slovakia 28 [27, 28] 25 [24, 26]Poland 29 [28, 29] 30 [30, 31]Croatia 30 [29, 30] 29 [29, 30]Portugal 31 [31, 31] 32 [30, 32]Latvia 32 [32, 32] 31 [30, 31]Lithuania 33 [33, 35] 35 [33, 35]Turkey 34 [33, 35] 34 [33, 35]Bulgaria 35 [33, 35] 33 [33, 35]
2011 2010
Table 6. Country ranks and 90% intervals for the innovation indicator
Source: Commission calculations

45
5.3. Distance to the efficient frontier by Data Envelopment Analysis (DEA)
Several innovation-related policy issues at the national level entail an intricate balance between global priorities and country-specific strategies. Comparing the performance of countries on innovation by subjecting them to a fixed and common set of weights may prevent acceptance of the indicator on grounds that a given weighting scheme might not be fair to a particular country. An appealing feature of the more recent Data Envelopment Analysis (DEA) literature applied in real decision-making settings is to determine endogenous weights that maximize the overall score of each decision-making unit given a set of other observations (see Box 1 for a brief mathematical formulation of DEA).
In this section, the assumption of fixed component weights common to all countries is relaxed once more; this time country-specific weights that maximize a country’s score are determined endogenously by DEA. In theory, each country is free to decide on the relative contribution of each component to its score, so as to achieve the highest possible score in a computation that reflects its innovation strategy. In practice, the DEA method assigns a higher (or lower) contribution to those components in which a country is relatively strong (or weak).
Reasonable constraints on the weights are assumed to preclude the possibility of a country achieving a perfect score by assigning a zero weight to weak components: for each country, the share of each component score (i.e. the component score multiplied by the DEA weight over the total score) has upper and lower bounds of 10% and 30% respectively. The DEA score is then measured as the weighted average of all four component scores, where the weights are the country-specific DEA weights, compared to the best performance among all other countries with those same weights. The DEA score can be interpreted as a measure of ‘the ‘distance to the efficient frontier’.
Table 7 presents the pie shares and DEA scores for all countries in 2011. All pie shares are in accordance with the starting point of granting leeway to each country when assigning shares, while not violating the (relative) upper and lower bounds. The pie shares are quite diverse, reflecting the different national innovation strategies. For example Austria, Bulgaria, Cyprus assign 30% of their DEA score to PCT, whilst this component accounts for no more than 10% of Luxembourg’s DEA score. The EU assigns 30% of its score to KIA and GOOD, and so does the USA. Two countries– Sweden, and Japan – reach a perfect DEA score of 1. Figure 12 shows how close the DEA scores and the innovation indicator scores are for all 34 countries plus the EU in 2011 (correlation of 0.987).
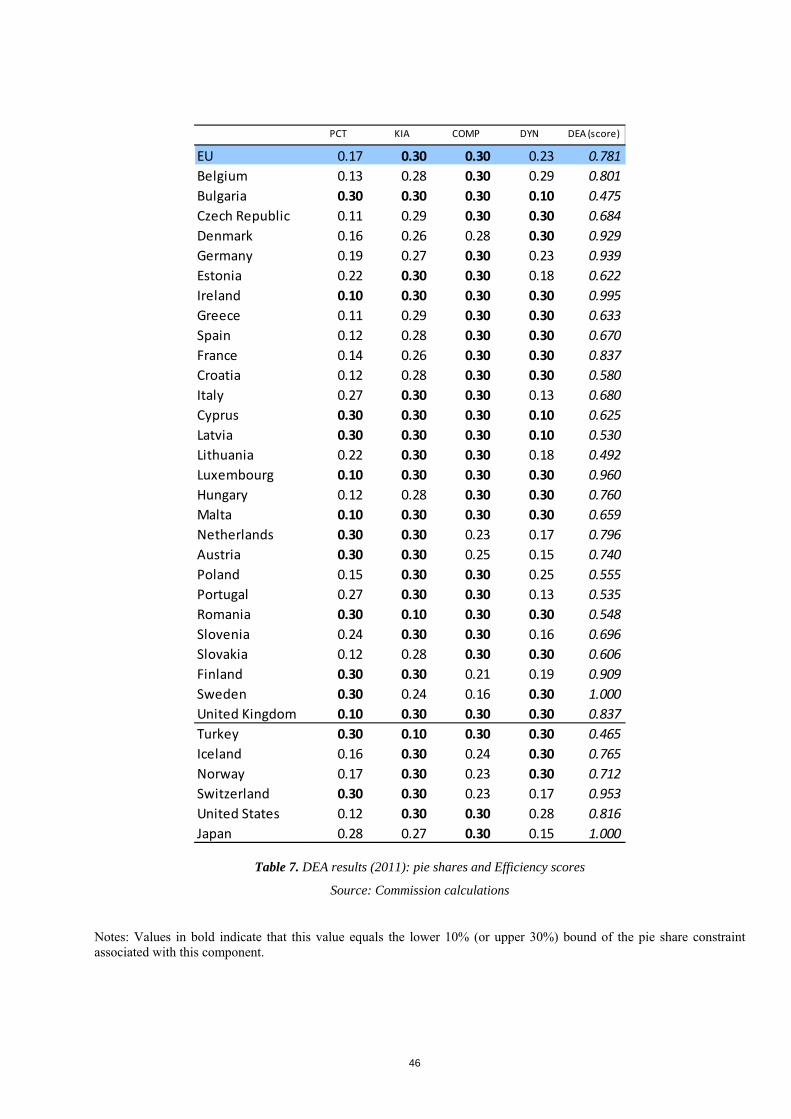
46
PCT KIA COMP DYN DEA (score)
EU 0.17 0.30 0.30 0.23 0.781Belgium 0.13 0.28 0.30 0.29 0.801Bulgaria 0.30 0.30 0.30 0.10 0.475Czech Republic 0.11 0.29 0.30 0.30 0.684Denmark 0.16 0.26 0.28 0.30 0.929Germany 0.19 0.27 0.30 0.23 0.939Estonia 0.22 0.30 0.30 0.18 0.622Ireland 0.10 0.30 0.30 0.30 0.995Greece 0.11 0.29 0.30 0.30 0.633Spain 0.12 0.28 0.30 0.30 0.670France 0.14 0.26 0.30 0.30 0.837Croatia 0.12 0.28 0.30 0.30 0.580Italy 0.27 0.30 0.30 0.13 0.680Cyprus 0.30 0.30 0.30 0.10 0.625Latvia 0.30 0.30 0.30 0.10 0.530Lithuania 0.22 0.30 0.30 0.18 0.492Luxembourg 0.10 0.30 0.30 0.30 0.960Hungary 0.12 0.28 0.30 0.30 0.760Malta 0.10 0.30 0.30 0.30 0.659Netherlands 0.30 0.30 0.23 0.17 0.796Austria 0.30 0.30 0.25 0.15 0.740Poland 0.15 0.30 0.30 0.25 0.555Portugal 0.27 0.30 0.30 0.13 0.535Romania 0.30 0.10 0.30 0.30 0.548Slovenia 0.24 0.30 0.30 0.16 0.696Slovakia 0.12 0.28 0.30 0.30 0.606Finland 0.30 0.30 0.21 0.19 0.909Sweden 0.30 0.24 0.16 0.30 1.000United Kingdom 0.10 0.30 0.30 0.30 0.837Turkey 0.30 0.10 0.30 0.30 0.465Iceland 0.16 0.30 0.24 0.30 0.765Norway 0.17 0.30 0.23 0.30 0.712Switzerland 0.30 0.30 0.23 0.17 0.953United States 0.12 0.30 0.30 0.28 0.816Japan 0.28 0.27 0.30 0.15 1.000
Table 7. DEA results (2011): pie shares and Efficiency scores
Source: Commission calculations
Notes: Values in bold indicate that this value equals the lower 10% (or upper 30%) bound of the pie share constraint associated with this component.

47
Figure 12. Innovation indicator scores and Data Envelopment Analysis ‘distance to the efficient frontier’ scores
Source: Commission calculations
Box 3. Data Envelopment Analysis
The original question in the DEA-literature was how to measure each unit’s relative efficiency in production compared to a sample of peers, given observations on input and output quantities and, often, no reliable information on prices (Charnes and Cooper, 1985).65 A notable difference between the original DEA question and the one applied here is that no differentiation between inputs and outputs is made (Melyn and Moesen, 1991; Cherchye et al., 2008).66 To estimate DEA-based distance to the efficient frontier scores, we consider the m = 4 components in the innovation indicator for n = 35 countries, with yij the value of component j in country i. The objective is to combine the component scores per country into a single number, calculated as the weighted average of the m components, where wi represents the weight of the i-th component. In absence of reliable information about the true weights, the weights that maximize the DEA-based scores are endogenously determined. This gives the following linear programming problem for each country j:
{ }∑
∑
=∈
== 7
1
7
1
maxmax
jijcjdatasety
jijij
wiji
wy
wyY
c
(bounding constraint)
Subject to
0≥ijw , where 4,...,1=j , 35,...,1=i (non-negativity constraint)
In this basic programming problem, the weights are non-negative and a country’s score is between 0 (worst) and 1 (best).
65 Charnes, A., Cooper, W.W. 1985. Preface to Topics in Data Envelopment Analysis, Annals of
Operations Research 2, 59-94. 66 Cherchye, L., Moesen, W., Rogge, N., Van Puyenbroeck, T., Saisana, M., Saltelli, A., Liska, R.,
Tarantola, S. 2008. Creating Composite Indicators with DEA and Robustness Analysis: the case of the Technology Achievement Index. Journal of Operational Research Society 59, 239-251. Melyn, W. and Moesen, W. 1991. Towards a Synthetic Indicator of Macroeconomic Performance: Unequal Weighting when Limited Information is Available, Public Economics Research Paper 17, Leuven: Centre for Economic Studies.
48
6. CONCLUSION
In response to the European Council, this Communication presents an indicator of innovation output, building on the Commission’s efforts to improve the quality of its evidence in support of policy-making and to assess the impact of innovation.
By zooming in on innovation output, the indicator complements the Innovation Union Scoreboard and its Summary Innovation Index.
In line with Europe 2020 and its Innovation Union flagship initiative, the indicator will support policy-makers in creating an innovation-friendly environment. It was developed using international quality standards and state-of-the-art statistical analyses. Nonetheless, the Commission identified four areas to bring it to its full potential, including widening its international comparability, improving its data on fast-growing firms, and analysing how the innovation coefficient datasets could be improved.
The indicator is a composite index, quantifying four dimensions of innovation output: patents, skills, trade in knowledge-intensive goods and services, and employment in fast-growing firms.

49
ANNEX 1. CALCULATION OF SECTORAL INNOVATION COEFFICIENTS
The component DYN makes use of a set of innovation coefficients which characterise the degree of innovation of each sector of the business economy. This annex presents the method used to compute these coefficients, highlighting in particular the advantages and disadvantages of using EU averages for each sector rather than country-specific values. It also proposes a way forward for further improving the quality and relevance of these coefficients.
For each sector, the innovation coefficient is calculated at EU level as the product of two elements: a CIS-based innovation intensity score ( scoreCIS ),67 and a Labour Force Survey (LFS)-based knowledge intensity score ( scoreKIA ).68
It is represented as sscorescore KIACIS )*( .
Advantages and disadvantages of sectoral EU-level coefficients
Using EU averages rather than country-specific values implies that these sectoral innovation coefficients will not reflect differences in the knowledge intensity or CIS score across Member States. While this could be seen as a weakness in the approach, it has the main benefit of defining a common reference of the degree of innovation of each sector against which countries can be reliably compared over time.
Advantages of using a uniform coefficient across countries for each sector
Using a uniform coefficient at EU level is also justified given the fact that the cross-country comparability of detailed CIS survey results can be limited, partly as a result of differences between enterprises in the perception of what constitutes an innovation. These differences may become noticeable in the responses to the CIS at country level. This problem becomes even more acute at the sectoral-level, where limitations of the sample size and the small number of observations per sector and country affect negatively the statistical reliability of results. Country-specific sectoral CIS-scores in their current form are hence considered not reliable enough for inter-country comparisons.
Moreover, the source micro-data for both the CIS and KIA scores are not available for each of the Member States, making it impossible to produce country-specific coefficients for all of them. Since CIS is only carried out in EU Member States, non-EU EEA countries and some candidate countries, country-specific CIS scores cannot be produced for non-European countries. Despite the fact that CIS is the best available source for innovation statistics in European countries, calculations of sectoral country-specific CIS scores could furthermore be based only on those sectors defined as 'core', according to the CIS methodology. Participating countries self-select the sectors beyond 'core' to be covered by their national CIS. For sectors included in the CIS on a voluntary basis, different countries took different priorities.
In response to the limitations outlined above, pooling together all available CIS micro-data for each sector increases noticeably the statistical reliability of CIS scores. Similarly, the sample sizes of the Labour Force Survey (LFS) are not sufficient for producing reliable results for 67 Community Innovation Survey. 68 Labour Force Survey.

50
most economic activities, unless data is pooled at the sectoral level. Moreover, LFS data is not available at 3-digit level from all countries (voluntary provision only).
Disadvantages of using a uniform coefficient across countries for each sector
There might indeed be differences between countries in their sectoral CIS and KIA scores, reflecting the fact that the same sector can be more innovative in one country than in another. Sector differences between countries will not be addressed by a uniform coefficient which will apply the same value to both modest innovators and innovation leaders. In other words, pooling all available data to calculate the uniform coefficient leads to an EU average which risks overestimating the innovation coefficient for modest innovators and underestimating it for innovation leaders.
Another option would be to calculate the uniform coefficient based on the data of the countries close to the innovation frontier. The results would be statistically less robust, because based on fewer data, and less representative for the EU as a whole.
Despite these shortcomings, there is regrettably currently no alternative to using uniform coefficients, since data gaps, sample size limitations and potential comparability issue at detail level do not allow to produce meaningful country specific coefficients for inter-country comparison.
Computation of the coefficients In order to compute the dynamism component, all sectors of the non-financial business economy are considered. Innovation coefficients are calculated for all economic sectors of the non-financial business economy, i.e. NACE Rev.2 sections B to N, plus S95, excluding K. Therefore, no economic sector covered by CIS, except the financial sector, is excluded from the list of innovative sectors when calculating the indicator.
Each sector (NACE Rev.2 three-digit level),69 is given a sector-specific coefficient reflecting its degree of innovativeness. This sector-specific coefficient is calculated on the basis of the sector’s scores on a set of Community Innovation Survey (CIS) variables in all countries providing CIS micro-data (21 countries), and also on the share of tertiary-educated persons employed in this sector (data source: Labour Force Survey, 19 countries), which is used as a measure of the knowledge intensity of the sector (designated as KIA score). CIS variables quantify the level of innovation in a sector. Knowledge intensity provides insight into the innovation potential of the sector, as innovation is in essence based on knowledge and requires highly qualified human resources.
In the case of a few three-digit sectors, the number of CIS observations was judged too small to allow for statistics to be displayed, even with pooled data. In those cases, the CIS-score was imputed from the two-digit level. In the case of the Labour Force Survey, KIA scores of a few three-digit sectors (representing 1.5% of total employment) were also judged statistically unreliable, due to the small size of their populations. In other words, the KIA scores related to 98.5% of total employment are statistically reliable, a very good performance from a statistical point of view.
69 Statistical Classification of Economic Activities in the European Community.

51
The innovation coefficient of a sector is defined as the product of this sector’s normalised CIS-based score and normalised LFS-based score. The KIA score is the normalised share of tertiary attainment (ISCED 5 and 6) in NACE sections based on the Labour Force Survey results 2009 and 2010 (average for the two years). The normalisation is performed by dividing the share of a section by the highest share and giving the highest share a value of 1.
The coefficient of each sector in the indicator is larger or smaller, depending on the innovativeness of this sector. Firms can innovate in any business sector. Including in the indicator only a subset of business sectors would have led to the innovation carried out in other sectors to be ignored. The option of assigning innovation coefficients to all sectors avoids this exclusion and allows innovation in all business sectors to be taken into account.
By construction, the innovation coefficient is sector-specific although uniform for all countries and constant over time, in order to provide an indication of the structural features of economic sectors. This is in line with the long-established OECD taxonomy of high-tech, medium-high-tech, medium-low-tech and low-tech sectors, which is also based on the R&D intensity of economic activities in a defined pool of countries and kept unchanged for years in order to build meaningful time series.
Calculation of CIS scores
CIS aims at capturing a broad range of innovation activities such as product and process development and marketing and organisational changes. A total of 33 CIS 2008 variables distributed among four groups (see Table 12) and reflecting the different aspects of innovation were used to rank economic sectors according to their innovation intensity. These variables were assigned equal weights so that, for instance, R&D performers and marketing innovators are given the same weight when constructing sectoral innovation intensities. This addresses the concern that the innovation performance of some sectors, especially services, is not linked to R&D performance only, as has traditionally been the case in manufacturing. The CIS-based sector-specific scores,70 are based on a methodology developed by OECD which can be summarised as: 71
1. Weighted country data were pooled together: firms’ responses from all available countries were weighted by their statistical representativeness (provided by each national statistical office) before being pooled together. This approach has the main advantage of being able to account for the relative importance of the countries included in the analysis. This on the other hand leads to statistics that are more heavily influenced by the behaviour of respondents located in the biggest countries surveyed; it also assumes that non-surveyed firms behave in exactly the same way as their surveyed counterparts do.
2. For each CIS 2008 dichotomous variable considered, sectors’ ‘performance’ was obtained as the ratio of the number of firms answering ‘yes’ to the total number of firms answering the 70 All sectors covered in the CIS 2008 survey were included in order to assess innovativeness across the
whole spectrum of economic activities. This means that, as sectoral coverage varies across countries, the statistics for some sectors may rely on a subset of countries only. Reference years of the CIS 2008: 2006-2008.
71 The OECD methodology is fully described in "Innovation Intensity in Sectors; An Experimental Taxonomy" (2011). Calculations at 3-digit level of NACE Rev. 2 are based on CIS 2008 micro-data from 21 European countries (BG, CY, CZ, EE, IE, ES, FI, FR, HR, HU, IT, LT, LU, LV, MT, NO, PT, RO, SE, SI, SK).
52
same question. Conversely, for those variables asking respondents to quantify investment or amounts (e.g. innovation-related expenses), sectors were ranked on the basis of average expenditure per respondent firm.
3. For each of the 33 CIS 2008 variables considered and included in the four different groups created (see Table 11), business sectors were ranked according to their relative ‘performance’ and given a score proportional to their position in the ranking: the first sector in the ranking is attributed the highest score, the second one is attributed the highest score minus one, and so on until the last sector in the ranking, which only receives 1 point.
4. Variable-specific scores were then normalised so that all variable-specific rankings are defined between ]0, 1]. To this end, the normalised score of sector x (called xnorm) was calculated for each variable i as:
xnorm i = xi / ximax
where ximax is the maximum score by any of the sectors included in the ranking of variable i.72
5. For each group j of variables, with j = [product and process innovators; innovation-related expenditures; organisation and market innovations; environmental innovations], group-specific sectoral scores were calculated as the average of the scores obtained from each of the variables included in group j. 6. Overall CIS-based sectors scores were finally calculated as the average of the sector-specific scores obtained from each of the four groups of variables considered. Overall CIS-based scores thus range between ]0, 1].73
Calculation of KIA scores Innovation is always the tangible or intangible translation of new ideas and knowledge. Knowledge-intensive economic activities are more likely to be subject to innovations and to offer innovations with a high potential for economic and societal transformations. In order to account for the role of knowledge in the innovation potential of an economic sector, the CIS-based score of each sector was multiplied by a second component,74 the knowledge intensity score of this sector, defined as the share of tertiary-educated persons employed in that sector, based on Labour Force Survey 2009-2010 data and normalised by the highest share among all sectors.75 The sector-specific knowledge intensity coefficient thus ranges between [0, 1].
72 The methodology leads to first ranked sectors that receive normalised scores equal to one, and to last
ranked sectors that receive small (i.e. close to zero) but positive values, with stepwise distances (i.e. between a sector n and the sectors ranked n+1 or n-1) that depend on the variable-specific number of sectors included.
73 For three-digit sectors where the number of observations was judged too small to allow for statistics to be displayed, the CIS score was imputed from the two-digit level. This concerns 27 three-digit sectors out of 218 included in the indicator (non-financial business economy).
74 The arithmetic average between CIS and KIA scores of a sector was also envisaged. Multiplication was preferred to avoid a substitution effect, whereby one component can compensate for the other.
75 Calculations at three-digit level of NACE Rev. 2 are based on the LFS data available for 19 Member States (AT, CZ, DE, EE, ES, FI, FR, GR, HU, LU, LT, MT, NL, PL, PT, RO, SE, SK, UK). Values for 25 three-digit sectors out of 272 in total economy (i.e. including public sector), accounting for 0.3% of total persons employed in 2010 in the same dataset, are considered unreliable and not published, because they are below the 6500 population threshold applied to LFS data; 28 additional three-digit sectors out of 272 in total economy, accounting for 1.2% of total persons employed in 2010 in the same
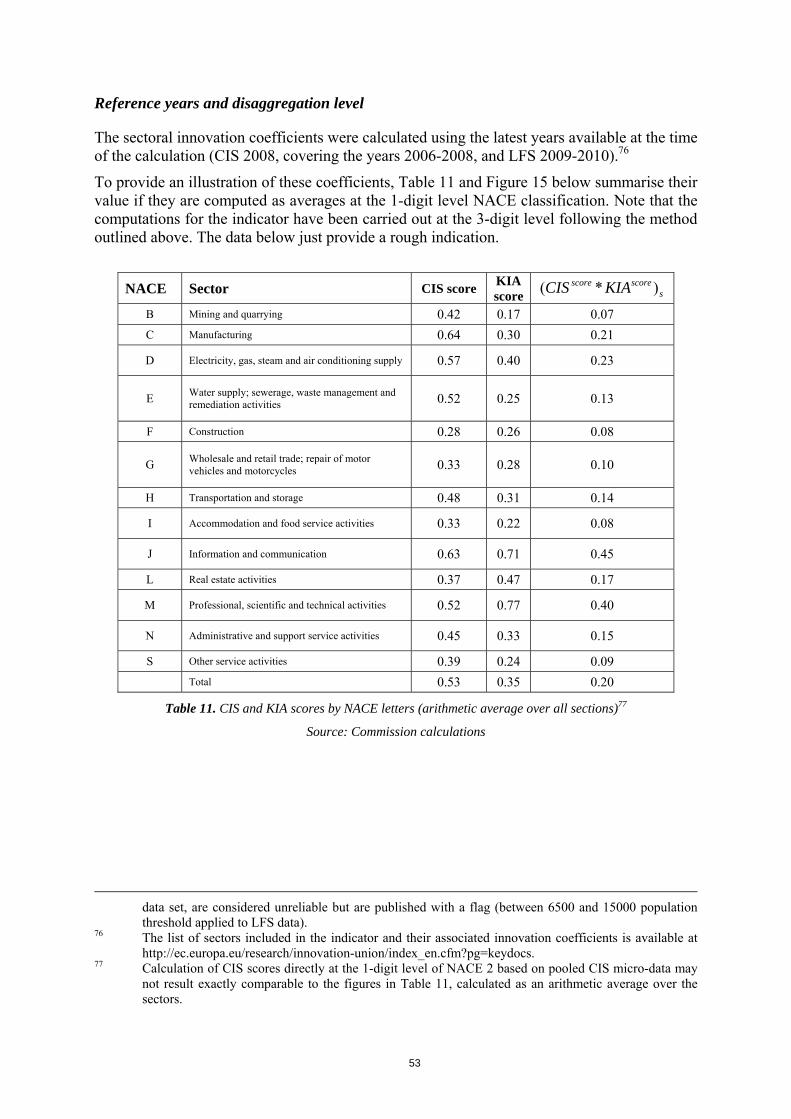
53
Reference years and disaggregation level
The sectoral innovation coefficients were calculated using the latest years available at the time of the calculation (CIS 2008, covering the years 2006-2008, and LFS 2009-2010).76
To provide an illustration of these coefficients, Table 11 and Figure 15 below summarise their value if they are computed as averages at the 1-digit level NACE classification. Note that the computations for the indicator have been carried out at the 3-digit level following the method outlined above. The data below just provide a rough indication.
NACE Sector CIS score KIA score s
scorescore KIACIS )*(
B Mining and quarrying 0.42 0.17 0.07 C Manufacturing 0.64 0.30 0.21
D Electricity, gas, steam and air conditioning supply 0.57 0.40 0.23
E Water supply; sewerage, waste management and remediation activities 0.52 0.25 0.13
F Construction 0.28 0.26 0.08
G Wholesale and retail trade; repair of motor vehicles and motorcycles 0.33 0.28 0.10
H Transportation and storage 0.48 0.31 0.14
I Accommodation and food service activities 0.33 0.22 0.08
J Information and communication 0.63 0.71 0.45
L Real estate activities 0.37 0.47 0.17
M Professional, scientific and technical activities 0.52 0.77 0.40
N Administrative and support service activities 0.45 0.33 0.15
S Other service activities 0.39 0.24 0.09 Total 0.53 0.35 0.20
Table 11. CIS and KIA scores by NACE letters (arithmetic average over all sections)77
Source: Commission calculations
data set, are considered unreliable but are published with a flag (between 6500 and 15000 population threshold applied to LFS data).
76 The list of sectors included in the indicator and their associated innovation coefficients is available at http://ec.europa.eu/research/innovation-union/index_en.cfm?pg=keydocs.
77 Calculation of CIS scores directly at the 1-digit level of NACE 2 based on pooled CIS micro-data may not result exactly comparable to the figures in Table 11, calculated as an arithmetic average over the sectors.

54
Figure 15. CIS and KIA scores by NACE letters (arithmetic average over all sections)
Source: Commission calculations In order to analyse innovation in greater detail, one can use the three-digit level of the economic activities classification NACE. Two-digit NACE economic sectors can prove heterogeneous in the innovation intensity of their sub-sectors and such differences can lead to three-digit CIS and KIA scores differing from the two-digit ones.78 These differences can be particularly noticeable in the services sectors. For the computation of the innovation coefficients, each NACE Rev.2 three-digit sector was therefore assigned an innovation coefficient between ]0, 1] obtained by multiplying its normalised CIS-based score by its normalised knowledge intensity score. The overall innovation coefficient of the sector is uniform for all countries (see the CIS and KIA scores at: http://ec.europa.eu/research/innovation-union/index_en.cfm?pg=keydocs) and represented by the country-specific score for each sector.
78 See Mariagrazia Squicciarini and Colin Webb (2011), “Innovation intensity in sectors. An experimental
taxonomy”, Mimeo, OECD, Paris.
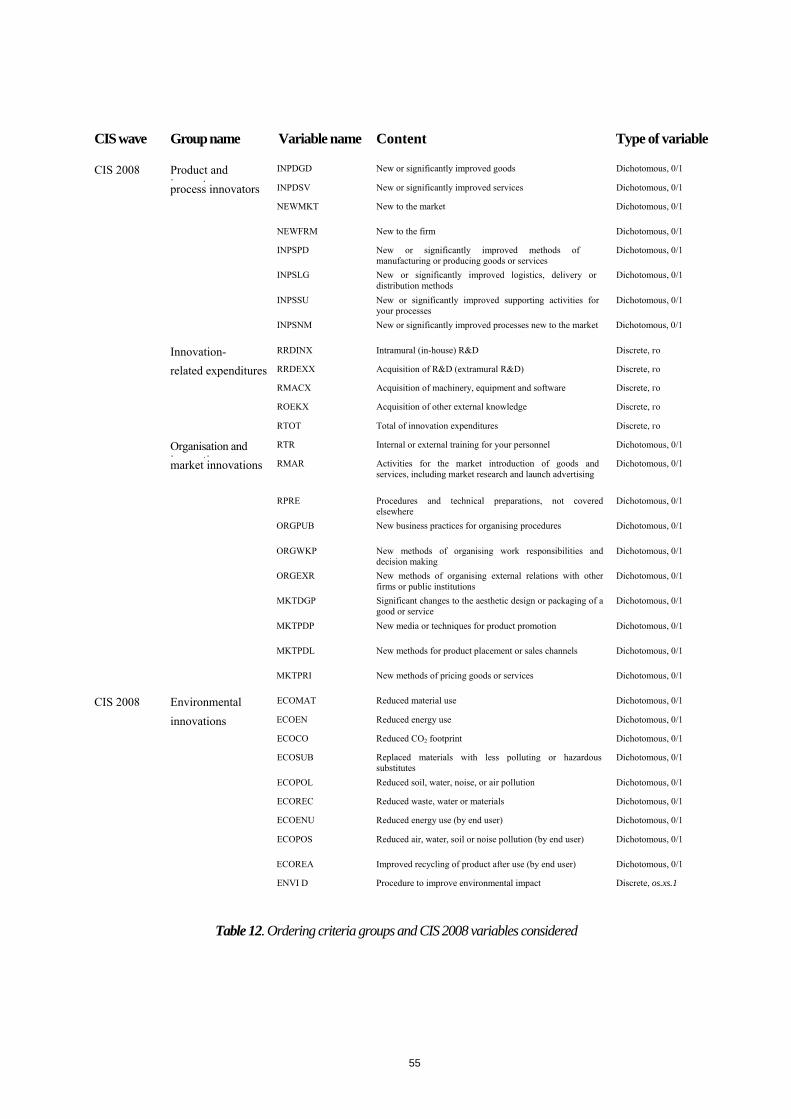
55
Table 12. Ordering criteria groups and CIS 2008 variables considered
CIS wave Group name Variable name Content Type of variable
CIS 2008 Product and inno ators process
INPDGD New or significantly improved goods Dichotomous, 0/1 process innovators INPDSV New or significantly improved services Dichotomous, 0/1
NEWMKT New to the market Dichotomous, 0/1
NEWFRM New to the firm Dichotomous, 0/1 INPSPD New or significantly improved methods of
manufacturing or producing goods or services Dichotomous, 0/1
INPSLG New or significantly improved logistics, delivery or distribution methods
Dichotomous, 0/1
INPSSU New or significantly improved supporting activities for your processes
Dichotomous, 0/1
INPSNM New or significantly improved processes new to the market Dichotomous, 0/1
Innovation- RRDINX Intramural (in-house) R&D Discrete, го related expenditures RRDEXX Acquisition of R&D (extramural R&D) Discrete, го RMACX Acquisition of machinery, equipment and software Discrete, го ROEKX Acquisition of other external knowledge Discrete, го RTOT Total of innovation expenditures Discrete, го Organisation and
i tiRTR Internal or external training for your personnel Dichotomous, 0/1
market innovations
RMAR Activities for the market introduction of goods and services, including market research and launch advertising
Dichotomous, 0/1
RPRE Procedures and technical preparations, not covered elsewhere
Dichotomous, 0/1
ORGPUB New business practices for organising procedures Dichotomous, 0/1
ORGWKP New methods of organising work responsibilities and decision making
Dichotomous, 0/1
ORGEXR New methods of organising external relations with other firms or public institutions
Dichotomous, 0/1
MKTDGP Significant changes to the aesthetic design or packaging of a good or service
Dichotomous, 0/1
MKTPDP New media or techniques for product promotion
Dichotomous, 0/1
MKTPDL
New methods for product placement or sales channels
Dichotomous, 0/1
MKTPRI New methods of pricing goods or services Dichotomous, 0/1
CIS 2008 Environmental ECOMAT Reduced material use Dichotomous, 0/1 innovations ECOEN Reduced energy use Dichotomous, 0/1 ECOCO Reduced CO2 footprint Dichotomous, 0/1 ECOSUB Replaced materials with less polluting or hazardous
substitutes Dichotomous, 0/1
ECOPOL Reduced soil, water, noise, or air pollution Dichotomous, 0/1 ECOREC Reduced waste, water or materials Dichotomous, 0/1 ECOENU Reduced energy use (by end user) Dichotomous, 0/1 ECOPOS Reduced air, water, soil or noise pollution (by end user) Dichotomous, 0/1
ECOREA Improved recycling of product after use (by end user) Dichotomous, 0/1 ENVI D Procedure to improve environmental impact Discrete, os.xs.1

56
ANNEX 2. DATA COLLECTION FOR FAST-GROWING FIRMS
Fast-growing or high-growth enterprises have been defined statistically as part of the joint OECD/Eurostat Entrepreneurship Indicators Programme (EIP).79 The definition used for the dynamism component is the employment-based definition established by the EIP, with the exception of the minimum growth rate, which is set to 10 % for DYN instead of 20 % for the EIP. While still being very selective, this lower threshold allows for a more significant coverage of fast-growing firms.80
Member States have been involved in the development of the component through their national statistical offices and through providing regular information to the European Research Area Committee (ERAC).
This internationally agreed definition is now in use in the production of business demography statistics.81 National statistics on fast-growing enterprises are based on national business registers, leaving therefore enterprises' response burden unchanged. To define the dynamism component, fast-growing enterprises are those with average annualised growth in number of employees of more than 10 % a year, over a three-year period, and with ten or more employees at the beginning of the observation period (period of growth). The relevant data for fast-growing enterprises was gathered by Eurostat on the basis of two voluntary test data collections on sectoral employment and fast-growing enterprises’ employment in Member States, which took place in 2011 and 2012 from April to September.82 The data collected have been extensively used for calculations of the DYN component. The voluntary test data collections relate to four years (2008, 2009, 2010 and 2011), of which one (2010) is almost complete in country coverage, the other reference years being covered by 15 Member States for 2008, 19 for 2009, and 17 for 2011. In fact, 25 countries participated in the 2011 and 2012 collection exercise (24 EU Member States plus Norway). Data for the 4 reference years are available for 12 countries, for 3 reference years for 6 countries, for 2 reference years for 6 countries, and for 1 reference year for 1 country. For the reference year 2010, data are available for 25 countries. Those data should be regularly produced.
79 The joint OECD/Eurostat EIP programme started in 2006. See
http://www.oecd.org/fr/industrie/statistiquessurlentreprenariatetlesentreprises/theentrepreneurshipindicatorsprogrammeeipbackgroundinformation.htm.
80 The rationale of the choice of this threshold was agreed with Member States' experts on 23 October 2012.
81 See the joint Eurostat/OECD manual on business demography at: http://epp.eurostat.ec.europa.eu/portal/page/portal/product_details/publication?p_product_code=KS-RA-07-010.
82 See DOC.8/en/Eurostat/g2/sbs/nov2012 of the Meeting of 15-16 November 2012 of the Structural Business Statistics Steering Group. In the 2011 collection in addition to data with 10+ employees, data were also collected for the enterprise threshold 5+ employees and for 7% and 20% annualized growth in employment.

57
ANNEX 3. MAIN OPTIONS EXAMINED FOR THE COMPOSITE INDICATOR
Variables Formula Pros Cons 1. PCT, KIA, COMP
CCCC COMPKIAPCTI ++= - Timely data currently available. - All indicators in Scoreboard. - Correlation structure fit for aggregation.
- Does not include aspect of fast-growth.
2. PCT, TER, COMP CCCC COMPTERPCTI ++= - Timely data currently available.
- Correlation structure fit for aggregation. - All indicators but TER in Scoreboard.
- Does not include aspect of fast-growth. - TER not about skills employed in economy.
3. PCT, KIA2, COMP CCCC COMPKIAPCTI ++= 2 - Timely data currently available.
- Correlation structure fit for aggregation. - All indicators but KIA2 in Scoreboard.
- Does not include aspect of fast-growth.
4. PCT, KIA, (GOOD, SERV2) ( )CCCC SERVGOODKIAPCTI 2+++= - Timely data currently available. - Correlation structure fit for aggregation. - All indicators but SERV2 in Scoreboard.
- Does not include aspect of fast-growth.
5. PCT, KIA2, (GOOD, SERV2) ( )CCCC SERVGOODKIAPCTI 22 +++= - Timely data currently available. - Correlation structure fit for aggregation.
- Does not include aspect of fast-growth. - KIA2 and SERV2 not in the Scoreboard.
6. PCT, TER, COMP, SALE CCCCC SALECOMPTERPCTI +++= - Fair coverage of output-oriented innovation.
- All indicators but TER in Scoreboard.
- Does not include aspect of fast-growth. - TER not about skills employed in economy. - Correlation not permitting fine aggregation.
7. PCT, KIA, COMP, SALE CCCCC SALECOMPKIAPCTI +++= - Fair coverage of output-oriented innovation.
- All indicators in Scoreboard. - Does not include aspect of fast-growth - Correlation not permitting fine aggregation.
8. PCT, KIA, COMP, DYN CCCCC DYNCOMPKIAPCTI +++= - Direct inclusion of dynamism component. - Fair coverage of output-oriented innovation. - Correlation structure fit for aggregation. - DYN robust to economic downturn.
- DYN to be improved: coverage & production.
9. PCT, KIA, COMP, DYN2 CCCCC DYNCOMPKIAPCTI 2+++= - Direct inclusion of dynamism component. - Fair coverage of output-oriented innovation.
- DYN2 to be improved: coverage & production. - Correlation not permitting fine aggregation. - DYN2 more sensitive to economic downturns.
10 PCT, KIA, COMP, DYN3 CCCCC DYNCOMPKIAPCTI 3+++= - Direct inclusion of dynamism component. - Fair coverage of output-oriented innovation.
- DYN3 to be improved: coverage & production. - Correlation not permitting fine aggregation. - DYN3 more sensitive to economic downturns.
11. PCT, KIA, (GOOD, SERV2), DYN ( ) CCCCC DYNSERVGOODKIAPCTI ++++= 2 - Direct inclusion of dynamism component. - Fair coverage of output-oriented innovation. - Correlation structure fit for aggregation. - DYN robust to economic downturn.
- DYN to be improved: coverage & production. - SERV2 not in the Scoreboard.

58
11b. PCT, KIA, (GOOD2, SERV), DYN ( ) CCCCC DYNSERVGOODKIAPCTI ++++= 2 - Direct inclusion of dynamism component. - Fair coverage of output-oriented innovation. - Correlation structure fit for aggregation. - DYN robust to economic downturn.
- DYN to be improved: coverage & production. - GOOD2 not any longer in the Scoreboard.
11c. PCT, KIA, (GOOD2, SERV2), DYN ( ) CCCCC DYNSERVGOODKIAPCTI ++++= 22 - Direct inclusion of dynamism component. - Fair coverage of output-oriented innovation. - Correlation structure fit for aggregation. - DYN robust to economic downturn.
- DYN to be improved: coverage & production. - GOOD2 not any longer in the Scoreboard. - SERV2 not in the Scoreboard.
12. PCT, KIA, (GOOD, SERV2), DYN2 ( ) CCCCC DYNSERVGOODKIAPCTI 22 ++++= - Direct inclusion of dynamism component. - Fair coverage of output-oriented innovation.
- DYN2 to be improved: coverage & production. - SERV2 not in the Scoreboard. - Correlation not permitting fine aggregation.. - DYN2 more sensitive to economic downturns.
13. PCT, KIA2, COMP, DYN2 CCCCC DYNCOMPKIAPCTI 22 +++= - Direct inclusion of dynamism component. - Fair coverage of output-oriented innovation.
- DYN2 to be improved: coverage & production. - KIA2 not in the Scoreboard. - Correlation not permitting fine aggregation. - DYN2 more sensitive to economic downturn.
14. PCT, KIA2, COMP, DYN CCCCC DYNCOMPKIAPCTI +++= 2 - Direct inclusion of dynamism component.
- Fair coverage of output-oriented innovation. - Correlation structure fit for aggregation. - DYN robust to economic downturn.
- DYN to be improved: coverage & production.
15. PCT, KIA2, (GOOD, SERV2), DYN2 ( ) cCCCC DYNSERVGOODKIAPCTI 222 +⋅+++= - Direct inclusion of dynamism component. - Fair coverage of output-oriented innovation.
- DYN2 to be improved: coverage & production. - KIA2 and SERV2 not in the Scoreboard. - Correlation not permitting fine aggregation. - DYN2 more sensitive to economic downturn.
16. PCT, KIA2, (GOOD, SERV2), DYN ( ) CCCCC DYNSERVGOODKIAPCTI 222 ++++= - Direct inclusion of dynamism component. - Fair coverage of output-oriented innovation.
- DYN2 to be improved: coverage & production. - KIA2 and SERV2 not in the Scoreboard. - Correlation not permitting fine aggregation.. - DYN2 more sensitive to economic downturn.
17. PCT, KIA, COMP, SALE, DYN2 CCCCCC DYNSALECOMPKIAPCTI 2++++=
- Direct inclusion of dynamism component. - Fair coverage of output-oriented innovation.
- DYN2 to be improved: coverage & production. - Correlation not permitting fine aggregation.. - DYN2 sensitive to economic downturns.
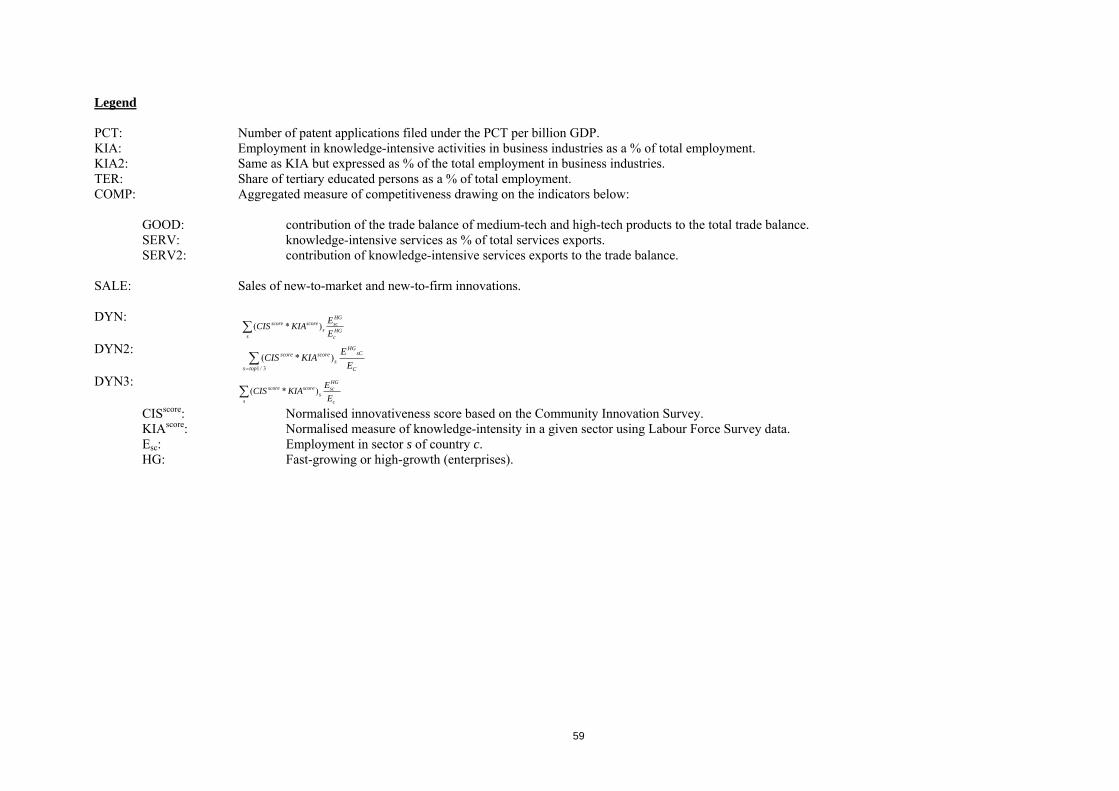
59
Legend PCT: Number of patent applications filed under the PCT per billion GDP. KIA: Employment in knowledge-intensive activities in business industries as a % of total employment. KIA2: Same as KIA but expressed as % of the total employment in business industries. TER: Share of tertiary educated persons as a % of total employment. COMP: Aggregated measure of competitiveness drawing on the indicators below:
GOOD: contribution of the trade balance of medium-tech and high-tech products to the total trade balance. SERV: knowledge-intensive services as % of total services exports. SERV2: contribution of knowledge-intensive services exports to the trade balance.
SALE: Sales of new-to-market and new-to-firm innovations. DYN:
HGc
HGsc
ss
scorescore
EEKIACIS∑ )*(
DYN2: C
sCHG
topss
scorescore
EEKIACIS∑
= 3/1
)*(
DYN3: c
HGsc
ss
scorescore
EEKIACIS∑ )*(
CISscore: Normalised innovativeness score based on the Community Innovation Survey. KIAscore: Normalised measure of knowledge-intensity in a given sector using Labour Force Survey data. Esc: Employment in sector s of country c. HG: Fast-growing or high-growth (enterprises).