Embed Size (px)
Citation preview
EN EN
EUROPEAN COMMISSION
Brussels, 2.6.2014 SWD(2014) 417 final
COMMISSION STAFF WORKING DOCUMENT
Assessment of the 2014 national reform programme and stability programme for LUXEMBOURG
Accompanying the document
Recommendation for a COUNCIL RECOMMENDATION
on Luxembourg’s 2014 national reform programme and delivering a Council opinion on Luxembourg’s 2014 stability programme
{COM(2014) 417 final}

2
CONTENTS
Executive summary .................................................................................................................... 3
1. Introduction....................................................................................................................... 5
2. Economic situation and outlook ....................................................................................... 5
3. Challenges and assessment of policy agenda ................................................................... 7
3.1. Fiscal policy and taxation............................................................................................. 7
3.2. Financial sector .......................................................................................................... 14
3.3. Labour market, education and social policies ............................................................ 16
3.4. Structural measures promoting sustainable growth and competitiveness.................. 21
3.5. Modernisation of public administration ..................................................................... 26
4. Conclusions..................................................................................................................... 28
Overview table ......................................................................................................................... 29
Annex ....................................................................................................................................... 33

3
EXECUTIVE SUMMARY
Luxembourg’s economic model is strongly based on financial services. The strength of its financial services sector has allowed the country to create and sustain a generous welfare state without jeopardising public finances and enabled it to keep public debt at a very low level. According to the Commission 2014 spring forecast, GDP growth is expected to reach 2.6 % in 2014 and to slightly rise in 2015. The main contribution will come from domestic demand, backed by improving confidence. Net exports will continue to add to growth. Unemployment is expected to remain close to a record high level in 2014 and tick back only slightly in 2015. Inflation is projected to further decline in 2014, in line with a negative output gap, driven down by the weak dynamic of oil prices. However, a sharp spike is projected in 2015, owing to the impact of the decision of the authorities to increase by 2 pp. all VAT rates, except the super reduced rate of 3 %, as of 1st January 2015.
Overall, Luxembourg has made only limited progress in addressing the 2013 country-specific recommendations. However, it has to be acknowledged that government action and the political agenda in the second semester of last year were heavily affected by the call for early general elections, which took place in October 2013. Moreover, the new government that came into office in December 2013 has set an ambitious agenda in terms of economic and social targets. In 2013, the government budget recorded a small surplus on the back of a sizeable consolidation package and windfall revenues. However, public finances are expected to deteriorate slightly in 2014 and further in 2015. While some progress has been made with the recently enacted pension reform, Luxembourg continues to face challenges in terms of the long-term sustainability of its public finances, as the reform that has been taken was not ambitious enough to guarantee the needed savings. No measures have been taken to address the debt bias in the taxation system and reduced rates for value-added tax continue to be used widely. In spite of several measures being adopted, youth unemployment remains high. In addition, Luxembourg is expected to miss its greenhouse gas emissions reduction target by a wide margin. The main challenges identified in July 2013 remain, therefore, broadly valid.
Luxembourg continues to face major challenges as regards the long-term sustainability of its public finances, the competitiveness and the diversification of its economy, the labour market, and its transition to a low-carbon and resource-efficient economy. The national reform programme broadly reflects these challenges. It outlines the policy initiatives to be taken in these areas, though in some of them, these initiatives lack the necessary ambition to address the challenges in a comprehensive and structural way.
• Public finances: While public finances improved in 2013, partly owing to a sizeable consolidation package, the improvement is not sustainable yet as, according to the stability programme, the public deficit is projected to worsen in 2015 and in the absence of any corrective measures would continue to post a negative balance. Measures underpinning the strategy outlined in the programme need to be fully specified. A draft bill aimed at strengthening fiscal governance through the adoption of a medium-term budgetary framework has been submitted to parliament. The parliamentary adoption process and subsequent implementation need to be carefully monitored. The pension system reform adopted in December 2012 is limited in scope. Luxembourg would benefit from the adoption of new measures to counter the expected increase in age-related expenditure well ahead of the review scheduled for 2017. Finally, revenues raised from consumption taxes are low, amounting to less than a third of fiscal revenues.
• Labour market: In spite of the adoption of several measures, unemployment among young migrants and those with low qualifications continued to remain high compared

4
to the overall unemployment rate. The youth unemployment rate stood at 17.4 % in 2013. A wider reform of the education and vocational system would help to alleviate the situation of migrants and young people with low skills, which remains difficult.
• Competitiveness: The economy is heavily dependent on developments in the financial sector. Therefore, efforts to diversify the economy beyond the financial sector are worth being pursued in the search for alternative sources of growth. Over the last few years, Luxembourg’s competitiveness has deteriorated, mostly because wages have increased faster than in neighbouring countries. Ensuring that wages evolve in line with productivity would help to preserve Luxembourg's competitiveness from further losses. The low level of cooperation between firms and public research institutions and the sharp drop in business R&D intensity (from 1.53 % in 2000 to 1.0 % in 2012) reveal the current weakness of Luxembourg’s research and innovation system. Non-financial corporations are highly indebted, which mainly reflects the presence of a large number of multinational firms that use their branches or subsidiaries in Luxemburg for intra-group financing operations.
• Greenhouse gas emissions: Luxembourg has committed itself to reducing the level of greenhouse gas emissions in sectors not covered by the EU’s Emissions Trading System by 20 % by 2020. According to the latest projections, however, it is not on track to achieve that target, largely because of the fuel-pump tourism induced by the country's low taxes on petrol and diesel.

5
1. INTRODUCTION
In May 2013, the Commission proposed a set of country-specific recommendations (CSRs) for economic and structural reform policies for Luxembourg. On the basis of these recommendations, the Council of the European Union adopted six CSRs in the form of a Council Recommendation in July 2013. These CSRs concerned public finances, the use of VAT reduced rates and the debt bias, the pension system, wage setting and the diversification of the structure of the economy, the labour market and a reduction in greenhouse gas emissions. This staff working document (SWD) assesses the state of implementation of these recommendations in Luxembourg.
The SWD assesses policy measures in light of the findings of the Commission’s 2014 Annual Growth Survey (AGS)1 and the third annual Alert Mechanism Report (AMR),2 which were published in November 2013. The AGS sets out the Commission’s proposals for building the necessary common understanding about priorities for action at national and EU level in 2013. It identifies five priorities to guide Member States to renewed growth: pursuing differentiated, growth-friendly fiscal consolidation; restoring lending to the economy; promoting growth and competitiveness for today and tomorrow; tackling unemployment and the social consequences of the crisis; and modernising public administration. The AMR serves as an initial screening device to ascertain whether macroeconomic imbalances exist or risk emerging in Member States. The AMR found positive signs that macroeconomic imbalances in Europe are being corrected. To ensure that a complete and sustainable rebalancing is achieved, Luxembourg and 15 other Member States were selected for a review of developments in the accumulation and unwinding of imbalances. These in-depth reviews were published on 5 March 2014 along with a Commission Communication.3
Against the background of the 2013 Council Recommendation, the AGS, the AMR and the in-depth review, Luxembourg presented a national reform programme (NRP) and a stability programme on 25 April 2014. These programmes provide detailed information on progress made since July 2013 and on the government’s plans. The information contained in these programmes provides the basis for the assessment made in this staff working document.
The programmes submitted underwent an inclusive consultation process involving the national parliament. Preparation of the NRP involved in-depth consultations with the social partners, local actors and civil society to increase ownership of the Europa 2020 Strategy and Luxembourg’s national strategy.
2. ECONOMIC SITUATION AND OUTLOOK
Economic situation
In 2013 and early 2014, economic activity returned to sustained growth, underpinned by a general improvement in financial market sentiment and strengthening of the ongoing recovery in neighbouring countries. Employment continued to post a positive growth rate, and job creation accelerated over the first months of 2014.
1 COM(2013) 800 final. 2 COM(2013) 790 final. 3 Apart from the 16 Member States identified in the AMR, Ireland was also covered by an in-depth review, following the conclusion by the Council that it should be fully integrated into the normal surveillance framework after the successful completion of its financial assistance programme.

6
In line with the above developments, economic growth picked up in 2013. The contribution from net external exports turned out positive after acting as a drag factor for five years in a row, mostly in line with export of (financial) services growing faster than imports. Contribution of domestic demand remained positive, even if it decelerated. On the back of substantial improvement in the global financial markets, the financial sector as a whole has withstood the crisis better than initially anticipated, probably because of its increasing specialisation and diversification. Furthermore, output in the industrial sector, and in the steel industry in particular, is estimated to have bottomed out and there are hints of an incipient recovery, albeit from a low level.
Job creation in 2013 stayed positive but decreased year-on-year to 1.7%, as compared with 2.5 % in 2012. The number of hours worked per employee continued to fall, even at a faster pace than in the previous year. This reflects a rise in the use of the government-subsidised work scheme and a fall in overtime working. In spite of consistently robust job creation, unemployment stood at 6.2 % of the active labour population in December 2013, as compared with 5.4 % a year earlier, owing to growth in the labour force.
Economic outlook
The Commission 2014 spring forecast revised GDP growth prospects for 2014 upwards, to 2.6%, but they remain modest as compared with pre-crisis rates (in 2000-07, economic output increased by an average of 4.7%). The recovery of economic activity is expected to gradually gain momentum in 2014 and 2015, supported by the projected recovery of exports and the quicker adaptation by the financial industry to the new regulatory environment. Private consumption will increase, as improved consumer confidence encourages households to reduce precautionary savings. In line with continued positive labour growth, the unemployment rate did likely peak in 2013 and is projected to slightly decline over the forecast horizon. Inflation is expected to fall in 2014, as the base effect from the increase in administered prices will fade, but headline inflation is projected to sharply rise in 2015, owing to the announced increase in VAT rates. In the absence of a correction to the automatic wage indexation mechanism, higher wage growth is expected as a consequence of the increase in VAT rates, and this will affect the country’s competitiveness. Corporate investment plans are projected to remain subdued in light of the low level of capacity utilisation. Financial services are expected to continue to add to growth, as diversification efforts in the financial sector meet with increasing success. In 2015, GDP is projected to grow by 2.7%. The main contribution will come from domestic demand backed by improving confidence as the contribution from exports is expected to lessen, though positive, by more dynamic import growth once domestic demand gains momentum.
The macro-economic scenario underlying the national budgetary projections in the 2014 update of the stability programme is slightly more optimistic than the Commission 2014 spring forecast. For the later years of the programme, the growth scenario is slightly optimistic, as the projected growth of 3.5%, 3.6% and 3.7% in 2016, 2017 and 2018 respectively is well above the estimated rate for potential growth, estimated below 2%. The main downside risk for this growth scenario concerns the export performance of the financial services sector. The stability programme and the national reform programme have been prepared in coherent manner and share the same macroeconomic outlook.

7
3. CHALLENGES AND ASSESSMENT OF POLICY AGENDA
3.1. Fiscal policy and taxation
Budgetary developments and debt dynamics
Luxembourg has preserved its sound fiscal position in line with the 2013 country-specific recommendation. Luxembourg exceeded its MTO in 2013, defined as a surplus of 0.5% of GDP of the general government balance in structural terms. The structural balance is estimated to stand at 1.4% of GDP, declining from 1.7% of GDP in 2012.
The objective of the medium-term budgetary strategy, as outlined in the programme, is to return to the country's MTO already in 2016, after significantly deviating from it in 2015. The programme confirms the previous medium-term budgetary objective (MTO) of a surplus of 0.5% of GDP, which is in line with the requirements of the Stability and Growth Pact.
The general government balance recorded a small surplus of 0.1% of GDP in 2013, marginally better than the budget balance recorded in 2012. It represents an improvement compared to the target as presented in last year's stability programme, in which a deficit of 0.7% of GDP was targeted. This better-than-expected outcome is mostly due to more buoyant revenues, in particular the VAT from e-commerce activities have expanded by 27.1% compared to the previous year, while on the expenditure side slippages have occurred as total expenditure is estimated to have increased by 5.1% compared to projected increase of 4.2% outlined in the last year programme.
In 2014, according to the programme, the government balance is expected to stabilise and to exhibit a surplus of 0.1% of GDP, as in 2013. Economic activity growth is projected to remain robust and GDP is expected to expand by 3.2%. In the light of the early general election hold in October 2013, with the new government taking office only in the first week of December, the 2014 budget was delayed, with parliament passing a law proposed by the outgoing government for a provisional budget covering the first four months of 2014. A project of draft law for the 2014 budget was presented by the government on 5 March and finally voted by the Parliament of 24 April. The Commission 2014 spring forecast expects the general government balance to post a small deficit of 0.2% of GDP, based on the impact on revenues of a less buoyant underlying macro-economic scenario and on a slightly more pessimistic view on the execution of the budget, where some slippages are expected to occur. The measures adopted with the budget, exclusively on the expenditure side, estimated by the national authorities at around 0.5% of GDP (see Box 1), are expected to help to partially counterbalance the increasing trend in public expenditure.
According to the programme, in 2015 the general government balance would deteriorate to post a deficit of 0.5% of GDP. The fiscal horizon in 2015 in Luxembourg is characterised by a sharp deterioration of its public finances related to the entry into force of new VAT legislation on e-commerce related activities.4 The impact of the change in the VAT legislation is estimated at a loss of revenues of around 1.5% of GDP. The deterioration will happen in spite of economic activity projected to remain robust. Despite the projected loss in VAT revenues, total revenues are expected to grow quicker than in the previous year (4.0%
4 As of 1 January 2015, new VAT rules regarding electronic services will enter into force. According to these rules, the VAT revenues generated from e-commerce activities will be transferred from the country where the supplier is located to that of the residence of the customer. In order to ensure a certain transition, the Member State of establishment will retain a proportion of the VAT collected until 31st December 2018. This proportion will amount to 30% from 1 January 2015 until 31 December 2016, 15% from 1 January 2017 until 31 December 2018 and 0% from 1 January 2019 onwards.

8
compared to 3.8% in 2014), as revenues from income and labour taxation are expected to increase substantially. The programme already factors in the increase by 2 pp.5, announced by the government in order to counterbalance the above-mentioned loss, in all VAT rates, except the super-reduced of 3%. This measure is expected to increase revenues by around 0.7% of GDP, therefore covering almost half of the drop. In addition, the budgetary trajectory outlined by the government in the programme includes the impact of consolidation measures that will be adopted on the basis of an on-going spending review. This exercise, which aims to identify savings up to the cumulated amount of EUR 700 million (around 1.5% of GDP) over the period 2015-2018, will contribute, according to the authorities, to contain, among others, the increase in public expenditure and ensure the return to the country's MTO already in 2016. The cumulated savings would be spread almost evenly over the period covered by the programme, hence for 2015 the authorities plan an additional retrenchment of up to EUR 200 million or 0.4% of GDP. In the Commission 2014 spring forecast economic activity in 2015 is projected to expand at a lower rate (2.7% compared to 3.2% in the programme). Furthermore, the Commission forecast does not account for the additional savings, as the related specific measures have not been outlined by the authorities yet. Finally, less buoyant revenues and more dynamic expenditure would lead to a deficit of 1.4% of GDP in 2015 according to the Commission spring forecast.
Box 1. Main budgetary measures
Revenue Expenditure 2014
• Reduction in operating costs of the administration (-0.1% of GDP)
• Reduction of expenditure on investments (-0.3% of GDP)
• Measures to limit growth of public administration wage (-0.0% of GDP)
• Reduction in student financial aids (-0.1% of GDP)
Note: The budgetary impact in the table is the impact reported in the programme, i.e. by the national authorities. A plus sign indicates that revenue/expenditure increases as a consequence of the measure. The degree of detail reflects the information made available in the stability programme and, where available, in a multiannual budget.
The figures for 2016 to 2018 in the programme can be considered as targets, given that they are not underpinned by sufficiently specified measures. The general government balance is projected to improve substantially from a deficit of 0.5% of GDP in 2015 to a surplus of 1.5% of GDP in 2018, underpinned, among others, by the evolution of the underlying macroeconomic environment that is expected to remain favourable.
The macro-economic scenario underpinning the national budgetary projections in 2014 and 2015 is plausible even if slightly more optimistic than that outlined in the Commission spring forecast. The GDP growth of 3.2% in 2014 is slightly above the 2.6% projected in the spring forecast. In 2015, the authorities' projection for growth of 3.2% is higher than the Commission's. For the outer years of the programme, the growth scenario is 5 The Luxembourg government confirmed its intention to increase the Value-added tax rates (VAT) by 2% from January 1, 2015. From the beginning of next year, the standard rate of VAT will rise from 15% to 17%. The 2% hike will also apply to the reduced rates of VAT, from 12% and 6%, to 14% and 8%, respectively. The super reduced rate, in place on basic commodities, is to remain unchanged at 3%.

9
also slightly optimistic, as the projected growth of 3.5%, 3.6% and 3.7% in 2016, 2017 and 2018 respectively is above the estimated rate for potential growth. The main downside risk for this growth scenario is related to the export performance of the financial services industry.
In structural terms, Luxembourg exceeded its MTO in 2013. The (recalculated) structural balance is estimated to stand at 1.4% of GDP. In 2014 Luxembourg might already have used part of its margin, and the structural balance is projected to decline to 1.1%, remaining however well above the MTO. In 2015 the structural balance is expected to deteriorate by 1.2% of GDP to post a deficit of 0.1% of GDP and therefore significantly deviate from the MTO. Based on the Commission 2014 spring forecast, the structural balance is projected to decline from a surplus of 1.4% of GDP in 2013 to a surplus of 0.6% in 2014, to turn to a deficit of 1.3% in 2015. The difference with the programme scenario mostly lies in different assumptions on discretionary measures in 2015, as explained above. According to both the programme and the Commission forecast the growth rate of net expenditure is projected to exceed the reference rate in 2015. In conclusion, following an overall assessment of the Luxembourg's budgetary plans, with the structural balance as a reference, including an analysis of expenditure net of discretionary revenue measures, a risk of deviation from the MTO is to be expected in 2015 based on both pillars.
In the outer years the programme projects the structural balance to improve throughout the period covered by the programme, nevertheless in 2016 the structural balance is still expected to stand just below the country's MTO, posting a surplus of 0.4% of GDP. The improvement in the structural balance in the outer years is expected to be less pronounced than shown by the nominal balance, as the improvement of the cyclical conditions partially counterbalance the progress in the headline balance.
The general government debt increased to 23.1% in 2013 from 21.7% of GDP in 2012. According to the programme, the debt is projected to peak in 2015 at 24% of GDP and should decrease in the coming years and to stand at 22.2% of GDP in 2018. The programme specifies that the recurrent central government deficits will be financed through additional debt, as the structural surplus of the social security subsector cannot be used to that purpose, as it is transferred to the pension reserve fund. In sum, the reduction in the debt ratio (1.8% of GDP between 2015 and 2018) would essentially result from the planned decline in the deficit that is expected to turn from a deficit of 0.5% in 2015 to a surplus of 1.5% of GDP in 2018. In addition, it is worth signalling that at the end of 2013, the government had cumulated assets up to 37% of GDP: to the pension reserve fund assets equivalent to 26.9% of GDP, it should be added the financial assets directly owned by the government and equal to around 10% of GDP. Since the debt-to GDP ratio is below the reference rate of 60% of GDP, the debt reduction benchmark is not applicable.
Fiscal framework
In 2013, Luxembourg received a CSR concerning the strengthening of fiscal governance by adopting a medium-term budgetary framework and putting in place independent monitoring of fiscal rules. The analysis in this SWD leads to the conclusion that Luxembourg has made some progress on measures taken to address this recommendation (for the full CSR assessment see the overview table in Section 4).
In July 2013, the government submitted to parliament a draft bill6 on the transposition of Council Directive 85/2011/EU on budgetary frameworks and the Fiscal Compact. While the draft law was expected to enter into force on 1 January 2014, its adoption was delayed by the resignation of the government in July. Under the draft bill, a new Multiannual Finance
6 Projet de loi n. 6597 relative à la coordination et à la gouvernance des finances publiques.

10
Programme Law (MFPL) would cover the same time horizon as the forthcoming update of the stability programme. The MFPL would be updated annually on a rolling basis, together with the annual budget. It would detail plans to achieve the medium-term budgetary objective at the level of general government. To that end, it would provide annual forecasts for the public debt and balance (in nominal and structural terms), broken down by major subsectors, i.e. central government, social security and local government. For each major budget line, expenditure and revenue projections would be annexed to the MFPL. The expected contribution of planned policies to the achievement of multiannual budgetary targets and a comparison with a no-change policy baseline would also be annexed. The draft bill introduces multiannual ceilings in the MFPL that would cover the central government sector only. It gives no indication of the consequences in the event of ceilings being exceeded. It does not introduce a national expenditure rule to guide the setting of multiannual expenditure targets. In particular, it does not contain an explicit reference to the expenditure benchmark within the meaning of Regulation (EC) No 1466/97. It does, however, require that the adjustment path to the medium-term objective (MTO) be respected.
In March 2014, a revised draft of the law was submitted to parliament. The main change involves entrusting a newly created institution, the Conseil National des Finances Publiques (CNFP), with the independent monitoring of fiscal rules. This addresses concerns expressed by the European Central Bank7 regarding the original choice to allocate this task to a body within the Luxembourg Central Bank. The draft bill is expected to be adopted by the parliament within the first semester of the current year.
Long-term sustainability
Government debt (23.1% of GDP in 2013 and expected to rise to 25.5% in 2015) is currently below the 60% of GDP Treaty threshold, but is projected to rise further by 2030 to above 60%. The full implementation of the stability programme would put debt on an increasing path by 2030, to above the 60% of GDP reference value.
Luxembourg appears to face medium fiscal sustainability risks in the medium-term. The medium-term sustainability gap8, showing the adjustment effort up to 2020 required to bring debt ratios to 60 % of GDP in 2030, is at 0.4 % of GDP, primarily related to the projected ageing costs contributing with 2 pp. of GDP until 2030 and the structural primary deficit in 2015 (-0.7% of GDP) and despite the low level of government debt (25.5% of GDP in 2015). In the long-term, Luxembourg appears to face high fiscal sustainability risks, primarily related to the projected ageing costs contributing with 8.7 pp. of GDP over the very long run, in particular in the field of pension (+6.5 pp. of GDP). The long-term sustainability gap9 shows
7 European Central Bank’s Opinion of 18 December 2013 on the public finances (CON/2013/90)). 8 See Table V. The medium-term sustainability gap (S1) indicator shows the upfront adjustment effort required, in terms of a steady improvement in the structural primary balance to be introduced until 2020, and then sustained for a decade, to bring debt ratios back to 60% of GDP in 2030, including financing for any additional expenditure until the target date, arising from an ageing population. The following thresholds were used to assess the scale of the sustainability challenge: (i) if the S1 value is less than zero, the country is assigned low risk; (ii) if a structural adjustment in the primary balance of up to 0.5 p.p. of GDP per year until 2020 after the last year covered by the autumn 2013 forecast (year 2015) is required(indicating an cumulated adjustment of 2.5 pp.), it is assigned medium risk; and, (iii) if it is greater than 2.5 (meaning a structural adjustment of more than 0.5 p.p. of GDP per year is necessary), it is assigned high risk. 9 See Table V. The long-term sustainability gap (S2) indicator shows the immediate and permanent adjustment required to satisfy an inter-temporal budgetary constraint, including the costs of ageing. The S2 indicator has two components: i) the initial budgetary position (IBP) which gives the gap to the debt stabilising primary balance; and ii) the additional adjustment required due to the costs of ageing. The main assumption used in the derivation of S2 is that in an infinite horizon, the growth in the debt ratio is bounded by the interest rate differential (i.e. the difference between the nominal interest and the real growth rates); thereby not necessarily implying that the debt ratio will fall below the EU Treaty 60% debt threshold. The following thresholds for the S2 indicator were used:

11
the adjustment effort needed to ensure that the debt-to-GDP ratio is not on an ever-increasing path, is at 10.2 % of GDP.
The structural primary balance is expected to deteriorate substantially (by 2.6 pp. of GDP between 2013 and 2015), entailing high sustainability gaps compared with the 2013 scenario. Risks would be lower in the event of the structural primary balance reverting to higher values observed in the past, such as the average for the period 2004-2013. It is therefore appropriate for Luxembourg to ensure sufficient primary surpluses and to further contain age-related expenditure10 growth to contribute to the sustainability of public finances in the long term.
Luxembourg’s gross public pension expenditure is expected to increase from 9.2 % of GDP to 18.6 % in 2060 (as compared with 12.9 % for the EU-27). This is mostly due to pensions and age-related spending. The 2012 pension reform was limited in scope and did not substantially address the threat posed to the long-term sustainability of public finances. Currently, the short-term financing of the pension system is guaranteed by a low old-age dependency ratio and relies on the contributions paid by relatively young cross-border workers. In the future, this trend is expected to reverse and pension costs, and long-term care costs, should increase substantially. The development of second- and third-pillar pensions would help alleviate the burden on the budget, alongside efforts to maintain the current high replacement rate. In this sense, financial incentives to extend working careers, as provided for in the pension reform, could contribute to the sustainability of the pension system. However, for this to happen, the employability of older workers, including their skills, also needs to be improved. In last year’s update of the National Reform Programme, the government confirmed its intention to proceed with an overhaul of the early retirement system, through a reform of the reclassification system for people with work disabilities. However, though tabled before parliament in March 2013, the draft bill has yet to be adopted and has recently been revised. In addition, the possibility to revise the law regulating supplementary pensions is envisaged.
In 2013, Luxembourg received a CSR concerning the cost-effectiveness of long-term care and the effective retirement age. The analysis in this SWD leads to the conclusion that overall Luxembourg has made limited progress in implementing these recommendations. Moreover, there are no current plans for legislative changes to link the statutory retirement age to life expectancy. However, the new government’s programme recognises the need to continue reform efforts in the area of pensions. A ‘Pensions Group’ will be set up to assess possible measures relating to pensions and older workers.
The 2012 Ageing Report projects a sizeable increase in long-term care expenditure between 2010 and 2060. To ensure the sustainability of long-term care, Luxembourg needs to curb future needs and related costs. Long-term care services can be made more cost-effective, for instance by strengthening coordination between health and social care. The new government programme announced a reform of dependency insurance that aims to ensure that dependent persons receive the services needed and organise the corresponding financing. The plan is to standardise the needs assessment procedure, review financial support for housing adaptations and redefine the role of informal carers.
(i) if the value of S2 is lower than 2, the country is assigned low risk; (ii) if it is between 2 and 6, it is assigned medium risk; and, (iii) if it is greater than 6, it is assigned high risk. 10 Ageing costs comprise long-term projections of public age-related expenditure on pension, health care, long-
term care, education and unemployment benefits. See the 2012 Ageing Report for details.

12
Tax system Luxembourg's economy is characterised by a relatively low tax-to-GDP ratio.11 Direct taxes, indirect taxes and social security contribution make each around one-third of total revenues.
In order to prevent the emergence of financial risks and to anticipate medium term fiscal consolidation challenges, last year Luxembourg was recommended to take measures to address the debt-bias in corporate taxation and to extend the application of the standard VAT rate. The analysis in this SWD leads to the conclusion that Luxembourg has made limited progress on measures taken to address these recommendations (for the full CSR assessment see the overview table in Section 4).
Luxembourg was also recommended to step up measures to meet the target for reducing non-ETS greenhouse gas emissions, in particular by increasing taxation on energy products for transport. Here as well, we report limited progress, leaving challenges unmet. Luxembourg is characterized by a high private debt-to-GDP ratio for the corporate sector as a whole (in particular, consolidated debt of non-financial corporations stood at 260.6 % of GDP in 2012),12 which mainly reflect the presence of a large number of multinational firms that use their branches or subsidiaries in Luxembourg for intra-group financing operations. Although the national authorities have assigned greater importance to the issue, no specific measures have been taken since the Council issued its recommendations last June and therefore no real progress has been made on this part of CSR 2. This can be partly explained by the political stalemate that Luxembourg faced in the second half of 2013. It is mentioned in the National Reform Programme that a major reform of the tax system is scheduled for 2016 to be applied in 2017. The Government intends to examine the debt bias issue in the framework of this reform.
Luxembourg is frequently used by multinational companies to channel tax-driven financial flows to other jurisdictions. An OECD study13 suggests that some international corporations may shift profits to low-tax jurisdictions via Luxembourg. The absence of withholding tax on outbound royalties and intercompany interest payments and the fact that the Luxembourg tax administration gives advance clearance (tax rulings) on the tax consequences of such activities have contributed to the emergence of companies known as ‘special purpose vehicles’ (SPVs)14 being registered in Luxembourg without having a substantial physical presence there. In 2011, SPVs generated gross financial flows through Luxembourg of USD 1.987 billion for inward stock investment and USD 1.945 billion for outward stock investment.
Less than one third of tax revenue is raised from consumption taxes, partially owing to moderate nominal VAT rates, a widespread use of reduced and super-reduced rates and the importance for the economy of the financial sector, whose activities are VAT-exempt. It should also be borne in mind that VAT revenues from e-commerce-related activities, which
11 At 39.3 %, the tax burden in Luxembourg expressed as the tax-to-GDP ratio was around (0.1 pp below) the EU 28 weighted average (39.4 %) in 2012 (latest year available); see Taxation Trends in the European Union, European Commission, 2014. 12 Macroeconomic imbalances - Luxembourg 2014 (COM(2014) provides more in-depth analysis on these issues; available at: http://ec.europa.eu/economy_finance/publications/occasional_paper/2014/op183_en.htm. 13 OECD (2013), Addressing Base Erosion and Profit Shifting. 14 In general terms, SPVs are entities with no or few employees, little or no physical presence in the host economy, whose assets and liabilities represent investments in or from other countries, and whose core business consists of group financing or holding activities (OECD (2013,), Addressing Base Erosion and Profit Shifting, p. 18).

13
amounted to around 2 % of GDP in 2012, will be hit by changes to the relevant legislation and are expected to fade out gradually from 2015 onwards. Luxembourg ranks first in the EU in terms of the number of categories of goods and services covered by reduced VAT rates and there is clear scope to bring reduced VAT rates closer to the standard rate and remove inefficient reduced rates. Reduced VAT rates are widely used to achieve redistribution objectives even though they are not an efficient and well-targeted policy tool to protect vulnerable groups. The standard VAT rate is set at 15 %. Luxembourg applies a super-reduced rate of 3 %,15 a reduced rate of 6 %16 and an intermediate rate of 12 %.17 The government decided that all VAT rates, except the super reduced rate of 3%, will rise by 2 pp. at the beginning of 2015. On top of that, the standard rate will apply to all real investments, with the exception of investments in a primary residence for which the super reduced rate (3%) still applies. These developments are designed in particular to partially compensate for future revenue losses due to the change in the legislation on VAT collection from e-commerce (mentioned above). However, broadening the tax base, as suggested in the 2013 CSR, would have proven to be more growth-friendly than increasing tax rates. Therefore, it can be concluded that there has been limited progress with regard to this part of CSR 2. In addition, given the widespread use of reduced and super reduced rates, there remains room to raise additional revenues by extending the application of the standard rate and thereby compensate more largely for the expected loss in VAT revenue from e-commerce related activities.
Environmental taxation accounted for 2.4% of GDP in 2012, as compared with 3.1% in 2004. This drop is driven in particular by lower energy-tax revenues influenced by the non-indexation of energy taxes. Although taxes on fuel used for transport are high, at 2.2 % of GDP, they mostly refer to the so-called "fuel-pump tourism".18 Excise duties on diesel and petrol were last increased in 2012 and remain considerably lower than in neighbouring countries. In addition, Luxembourg still applies preferential tax treatment for diesel19 compared to petrol. The government plans to launch a study on the impact on tax revenues of an increase in taxation on fuel.20 It also announced its objective in the long term of decoupling fiscal revenues from taxes on transport fuels from current budget expenses. However, no details or timeline have been provided as regards the implementation of such a move, which would release Luxembourg to some extent from the budgetary constraint that, it has claimed until now, inhibited the authorities from increasing tax rates, at the expense of its tax revenue. Overall, no progress has been observed in addressing the challenge of environmental taxes in Luxembourg.
15 The super-reduced rate applies to food and beverages, pharmaceutical products, newspapers, periodicals and books (on all physical means of support), passenger transport, and admission to cultural services and parks. 16 The reduced rate applies to gas, electricity, flowers and labour-intensive services such as hairdressing and window cleaning. 17 The intermediate rate applies to certain wine, solid mineral fuels and mineral oils, and wood intended for use as fuel, with the exception of wood for heating. 18 Fuel prices in Luxembourg are lower than in the neighbouring countries due to comparatively lower excise duties and value-added taxes charged on petrol and diesel. Commission's in-depth study into the market for vehicle fuels (to be published in mid-2014, http://ec.europa.eu/consumers/consumer_research/index_en.htm) confirmed that both diesel and petrol excises in Luxembourg were below the EU average. Excise duties on petrol fuels were 0,46 € per litre vs. 0,53 € on average at EU level while for diesel fuels 0,34 € vs. 0,41€ at EU level in December 2012. This also explains why the average petrol and diesel prices in Luxembourg, all tax included, are the lowest among the EU15 countries (1,39€ and 1,26€, respectively vs. 1,63€ and 1,50 €). The difference in fuel prices encourages people to cross the border, even making a detour, to purchase fuel for their vehicles. Sales to non-residents (including cross-border commuters) account for 75% of fuel sales in Luxembourg. 19 Tax Reforms in EU member states 2013 (European Commission 2013), p. 71. 20 Since fuel sales provide employment for 2, 500 people in Luxembourg and bring some €EUR 1.2 billion to the state budget (concession rights for petrol stations, excise tax, VAT), around 10 % of government income, more estimates are needed on the potential fiscal implications of restructuring the energy tax system.
14
Finally, there is scope for tapping more growth-friendly revenue sources, taking also into consideration the need to maintain budgetary outcomes in line with the medium-term objective (MTO). Revenues from recurrent property taxes (0.2 % of GDP in 2011) were much lower than in the euro area on average (+1.9 % of GDP). The base on which recurrent property taxes are levied is the unit value of a property, which is still calculated according to a scale that dates back to 1941 and is not aligned with real current rental value. The low taxation, combined with a bundle of government measures that reduce the financial burden for housing investors, mean that the current taxation system is conducive to owner occupation. Given limited supply, this drives up house prices considerably. House prices have risen much faster than incomes, alongside a build-up of household debt, which stood at 56.8% of GDP in 2012, in line with the EA17 average. Although these trends have moderated since the start of the crisis, some measures suggest a degree of over-valuation in current house prices.21 In recent years, housing supply has not kept up with the growing demand associated with population growth and this has contributed to urban sprawl and additional congestion problems. While some ongoing initiatives are designed to speed up procedures for granting construction permits or develop social housing, progress remains limited. Finally, the building pressure on households related to high and increasing real estate prices combined with risks related to the large share of loans at variable rate, represent developments that deserve to be carefully monitored.
3.2. Financial sector
Luxembourg’s financial sector weathered the financial crisis well and benefited from the gradual build-up of market confidence in 2013, but it still has to adjust in reaction to regulatory changes and increased competition from international financial centres. Progresses in consolidation of the balance-sheet continued, mainly thanks to a further reduction in interbank lending. Credit to the private sector tightened marginally and mainly for non-financial corporations, which had to comply with tougher credit standards. Credit to households, especially for house purchases, continued its upward trend. The net banking product improved over the year and total assets under management in the fund industry advanced on the back of positive financial market performance and inflows. While the results of the banking sector are improving and the fund industry continues to attract new activities, financial regulation changes and competition from international financial centres are challenges that Luxembourg has to deal with going forward.
In 2013, Luxemburg did not receive a CSR on financial sector policies. Nevertheless, Luxembourg implemented measures to reinforce its financial supervisory framework and to increase the resilience of its financial sector.
The limited inter-links of the financial sector with the domestic economy and the small scale of the domestic banking sector shielded Luxembourg from unfavourable developments. Judged by the size of the total bank assets as a percentage of GDP, Luxembourg’s financial sector is the largest in the euro area and appears as an outlier. In absolute terms, however, the aggregate size of the banks’ balance sheets is smaller than in Belgium, for example. Most of the banks operating in Luxembourg play a marginal role in the financing of the domestic economy. Furthermore, the effect of the crisis on credit to the private sector has been contained. While access to private-sector credit in the euro area was 21 To this effect, in the context of the recent announced increase in VAT rates, it is foreseen that VAT rates will rise from 3% to 17% on second houses and properties bought by investors solely for rental to third parties. In the intention of the government this will increase the cost for holding unused properties and help in limiting the rise in house prices.
15
hindered in the aftermath of the financial crisis, no credit rationing was felt in Luxembourg and credit standards have tightened only marginally. Although lending conditions for businesses have tightened slightly over the past year, only 6 % of SMEs consider access to finance a challenge. Apart from increased internal financing, new innovative approaches such as crowd-funding and ‘business angels’ initiatives are meeting with more and more success — often through bottom-up initiatives from the business environment. Credit to households continued its upward trend, mainly due to the expansion of credit for house acquisition.
The push for more transparency and the introduction of the automatic exchange of information are likely to weigh on private banking, but steps have been taken to support the development of this activity. Various initiatives indicate that the Grand Duchy is becoming increasingly aware of the need to adjust its economic interests and national choices in line with international acceptance. In 2009, Luxembourg signed up to the OECD standards on the exchange of financial information on request by competent foreign authorities. In April 2013, ten years after the adoption of Directive 2003/48/EC22 on the taxation of interest income from savings, Luxembourg decided to end the transition period that it benefited from and to introduce the automatic exchange of information in tax matters with competent government tax authorities. This will be in place as of 1 January 2015.
The financial services sector plays a vital role in the Luxembourgish economy and the asset management sector is one of the largest specialisations of the Luxembourgish financial sector. The country has succeeded in establishing itself as one of the main fund domiciliation worldwide, generating lots of positive externalities for the local financial sector. The country is seeking to expand further the fund domiciliation business by promoting internationally the European funds and by profiting from the internal market benefits inside the European Union. While such actions might preserve the leadership of Luxembourg in this area, they are not likely to contribute in increasing the diversification of the financial sector. To ensure that the Luxembourgish financial sector can smoothly withstand fund’s industry-specific risks, the financial place could concentrate more its efforts in attracting other types of financial services, in the fund sector itself through the management functions, or in other financial sector parts. In December 2012, Luxembourg was the first Member State to offer a regulatory framework for family offices targeted at developing this private banking activity.
The national authorities plan to reinforce the supervisory financial framework by adopting a bill providing for the creation of a systemic risk committee.23 The bill is intended to implement the recommendation from the European Systemic Risk Board (ESRB) on 22 December 2011 urging Member States to establish a national macro-prudential authority. The draft law also implements the ESRB recommendation (4 April 2013) on the intermediary objectives and instruments of macro-prudential policy. Cooperation will be improved between all authorities currently involved in the regulation and surveillance of the Luxembourg financial system. These include the Ministry of Finance, the Luxembourg Central Bank (BCL), the bank and fund administration supervisor (CSSF) and the insurance supervisor (Commissariat aux assurances). The committee will be tasked with contributing to maintaining the stability of Luxembourg’s financial system as a whole, in particular by strengthening its resilience. Although Luxembourg is increasing its efforts to upgrade macro-prudential supervision, the efficiency and independence of the CSSF continued to attract attention, notably from the investor community. To ensure that international investors continue to trust Luxembourg as a location for their assets, efforts are needed to secure the independence and quality of the supervisory work.
22 Directive 2014/48/EU adopted in March 2014 amends Directive 2003/48/EC. 23 Draft law No 6653 submitted to parliament on 28 February 2014.
16
3.3. Labour market24, education and social policies
Luxembourg’s labour market is characterised for a large and stable proportion of non-resident workers, currently accounting for around 40 % of total employment. Resident workers are therefore subject to competition from a large pool of well-trained cross-border workers with a lower reservation wage and often more suitable skills. The performance of the education system, as measured by the PISA score in 2012, is below average and partly explains the skills mismatch between labour supply and demand. The unemployment rate is quite high for the low-skilled and young people, in particular those with a migrant background. Older workers’ participation in the labour market is increasing but remains low, in part owing to the generosity of the pension system and the existence of early-retirement schemes. Poverty in the working-age population is increasing, albeit from low levels, but the level of inequality in Luxembourg remains low and stable.
In 2013, Luxembourg received one CSR concerning the high level of youth unemployment, active labour market policies, general and vocational education, skills mismatch and the employment rate among older workers. The analysis in this SWD leads to the conclusion that Luxembourg has made limited progress on measures taken to address these issues.
Box 2: Potential impact of structural reforms on growth – a benchmarking exercise
Structural reforms are crucial for boosting growth. It is therefore important to know the potential benefits of these reforms. Benefits of structural reforms can be assessed with the help of economic models. The Commission uses its QUEST model to determine how structural reforms in a given Member State would affect growth if the Member State narrowed its gap vis-à-vis the average of the three best EU performers on key indicators, such as labour market participation or reducing disincentives to work. Improvements on these indicators could raise Luxembourg's GDP by about 4% in a 10-year period. Some reforms could have an effect even within a relatively short time horizon. The model simulations corroborate the analysis of Section 3.3, according to which the largest gains would likely stem from increasing labour market participation by older workers (e.g. by eliminating pre-retirement schemes), followed by measures to increase women’s participation and measures to reduce disincentives to work (e.g. reducing the benefit replacement rate).
24 For further details, see the 2014 Joint Employment Report, COM(2013)801, which includes a scoreboard of key employment and social indicators.
17
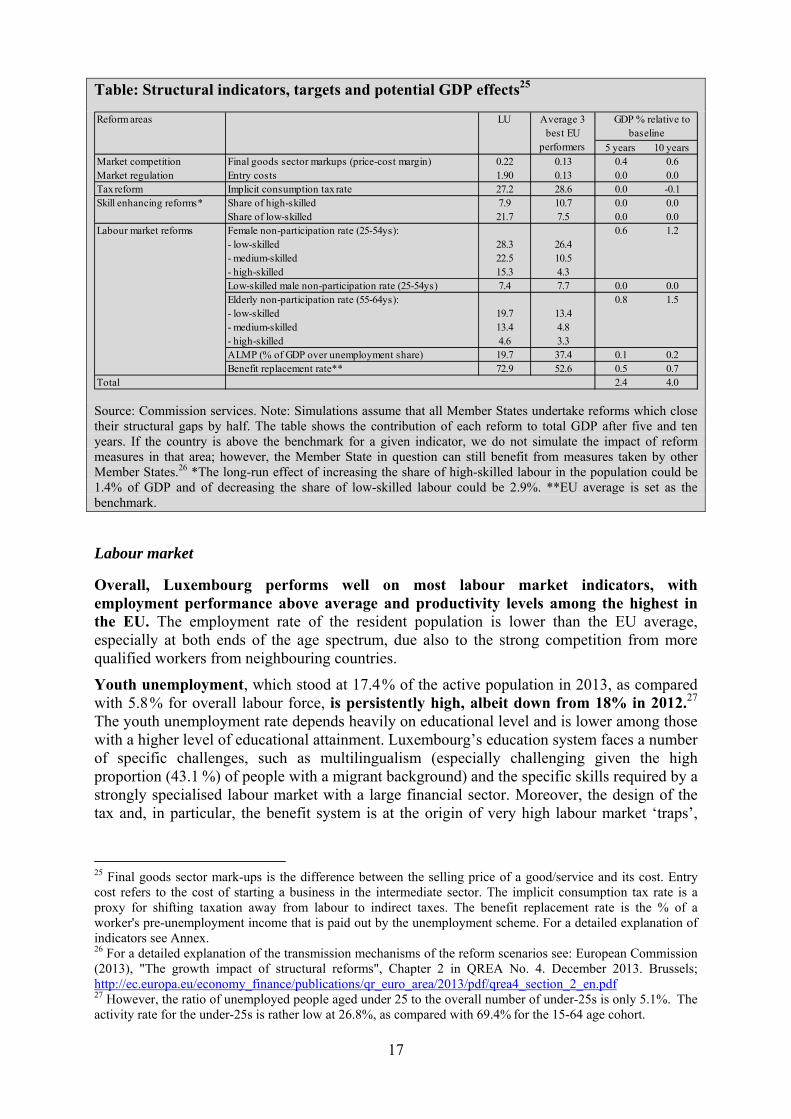
Table: Structural indicators, targets and potential GDP effects25
5 years 10 yearsMarket competition Final goods sector markups (price-cost margin) 0.22 0.13 0.4 0.6Market regulation Entry costs 1.90 0.13 0.0 0.0Tax reform Implicit consumption tax rate 27.2 28.6 0.0 -0.1Skill enhancing reforms* Share of high-skilled 7.9 10.7 0.0 0.0
Share of low-skilled 21.7 7.5 0.0 0.0Labour market reforms Female non-participation rate (25-54ys): 0.6 1.2
- low-skilled 28.3 26.4- medium-skilled 22.5 10.5- high-skilled 15.3 4.3Low-skilled male non-participation rate (25-54ys) 7.4 7.7 0.0 0.0Elderly non-participation rate (55-64ys): 0.8 1.5- low-skilled 19.7 13.4- medium-skilled 13.4 4.8- high-skilled 4.6 3.3ALMP (% of GDP over unemployment share) 19.7 37.4 0.1 0.2Benefit replacement rate** 72.9 52.6 0.5 0.7
Total 2.4 4.0
Reform areas LU Average 3 best EU
performers
GDP % relative to baseline
Source: Commission services. Note: Simulations assume that all Member States undertake reforms which close their structural gaps by half. The table shows the contribution of each reform to total GDP after five and ten years. If the country is above the benchmark for a given indicator, we do not simulate the impact of reform measures in that area; however, the Member State in question can still benefit from measures taken by other Member States.26 *The long-run effect of increasing the share of high-skilled labour in the population could be 1.4% of GDP and of decreasing the share of low-skilled labour could be 2.9%. **EU average is set as the benchmark.
Labour market
Overall, Luxembourg performs well on most labour market indicators, with employment performance above average and productivity levels among the highest in the EU. The employment rate of the resident population is lower than the EU average, especially at both ends of the age spectrum, due also to the strong competition from more qualified workers from neighbouring countries.
Youth unemployment, which stood at 17.4 % of the active population in 2013, as compared with 5.8 % for overall labour force, is persistently high, albeit down from 18% in 2012.27 The youth unemployment rate depends heavily on educational level and is lower among those with a higher level of educational attainment. Luxembourg’s education system faces a number of specific challenges, such as multilingualism (especially challenging given the high proportion (43.1 %) of people with a migrant background) and the specific skills required by a strongly specialised labour market with a large financial sector. Moreover, the design of the tax and, in particular, the benefit system is at the origin of very high labour market ‘traps’,
25 Final goods sector mark-ups is the difference between the selling price of a good/service and its cost. Entry cost refers to the cost of starting a business in the intermediate sector. The implicit consumption tax rate is a proxy for shifting taxation away from labour to indirect taxes. The benefit replacement rate is the % of a worker's pre-unemployment income that is paid out by the unemployment scheme. For a detailed explanation of indicators see Annex. 26 For a detailed explanation of the transmission mechanisms of the reform scenarios see: European Commission (2013), "The growth impact of structural reforms", Chapter 2 in QREA No. 4. December 2013. Brussels; http://ec.europa.eu/economy_finance/publications/qr_euro_area/2013/pdf/qrea4_section_2_en.pdf 27 However, the ratio of unemployed people aged under 25 to the overall number of under-25s is only 5.1%. The activity rate for the under-25s is rather low at 26.8%, as compared with 69.4% for the 15-64 age cohort.

18
among the highest in the EU, for all wage levels and family compositions.28 Most of the unemployment trap is due to the withdrawal/reduction of social benefits on return to work. As an example, for a one-earner couple with two children, the marginal effective tax rate when resuming work after unemployment at 67 % of the average wage stood at 102.4 % in 2012, against an EU average of 78%. Similarly, the unemployment trap for a single person resuming work after unemployment at 100 % of the average wage stood at 88 %, against 67 % on average in the EU. On top of this, despite recent reform efforts, activation policies remain weak; participation in active labour market policies (ALMPs) is not compulsory at any point of the spell of unemployment and there is no requirement to continue job-searching during participation in ALMPs.
Several measures have been taken to help young people entering the employment market (e.g. the setting-up of a Maison de l’Orientation, an Employment Observatory, and ‘fit4jobs’ incentives) and ‘maintaining in employment’ measures have increased, but do not necessarily offer young people a permanent job and the potential impact on their employability is so far considered to be limited. A centre for socio-professional counselling set up in August 2013 aims to offer better matched (non-formal) education and training for long-term and (very) low-skilled jobseekers. This measure is part of current employment policy and the reform of social employment initiatives co-financed by the Ministry of Labour and Employment. The new government action aims to strengthen cooperation between the ministries involved and the national employment agency (Agence pour le développement de l’emploi — ADEM) with a view to assessing and implementing adopted measures. The measures were ongoing in 2013, with no amendments to the existing legal framework, in particular as regards the ‘maintaining in employment’ contracts for young jobseekers (contrat initiation-emploi, contrat appui à l’emploi). The new government has indicated its intention to work with the relevant stakeholders on a ‘solidarity pact for youth employment’ aimed at implementing the Youth Guarantee and to develop "Green Jobs" trainings in the construction sector. So far, Luxembourg has made some progress in addressing this challenge.
The employment rate for older workers (aged 54-64) is increasing but remains far below the European average (40.5 % in 2013 against 50.1 % for the EU). The new government programme puts a specific focus on promoting a flexible transition from work to retirement, measures to increase the effective retirement age and promoting the passing-on of skills between generations, inter alia via business mentoring and voluntary work among older workers. They also envisage to offer 6 weeks trainings for 50 year old workers or over in order to facilitate the reinsertion on the job market. Progress on tackling this challenge has so far been limited.
The employment rate among women increased more than that among men in 2013 (from 61.9% in 2011 to 63.9%, as compared with 78.1 % to 78.0 %), but the gap remains substantial. A number of measures have been taken to address the relevant issues (i.e. childcare, transposition of Directive 2010/18/EU on parental leave, equal treatment, promoting women entrepreneurs) and these are being implemented. However, it is too early to assess the impact of these measures and the continued growth of part-time work among women29 suggests that measures allowing people to reconcile their professional and private
28 For more information, see the tax and benefit model database developed by the OECD in cooperation with the European Commission, available at: http://ec.europa.eu/economy_finance/db_indicators/tab/. 29 36.3% in 2012 (against 5.4% for men), 36.1% in 2011, 36% in 2010, 35% % in 2009, 25% in 2002.
19
life should be pursued.30 Also, ‘joint taxation’ for couples creates disincentives for second earners, mainly women,31 to return to work, as their earnings come into a higher tax bracket.
Education
Luxembourg’s education system faces specific challenges due to various factors: multilingualism, a high proportion of people with migrant backgrounds and a very specific labour market. The results of the OECD PISA 2012 Survey32 show that the proportion of low achievers is significantly higher than the EU average in reading and science and somewhat higher in maths. The results also confirmed a strong correlation between socio-economic background and skills attainment, and second-generation migrants perform only slightly better than first-generation. Luxembourg recognises that schools should respond with greater flexibility to the growing heterogeneity of the school population; however, according to the government, this approach should not put into question the traditional multilingualism of Luxembourg schools.33 In January 2013, the first assessment of implementation of the 2009 reform of primary education was presented by the Ministry of Education.34 Following this, the Ministry decided to continue the dialogue with all partners to identify priorities to improve and adjust the reform. Further improvement and targeting of education resources to schools with disadvantaged students and increase of resources available for language support and remedial classes are needed. The 2014 NRP stipulates that the new government also wishes to put a specific focus on the language teaching, specifically for children of migrant origin. The offer for Second Chance school should also be developed. In addition, the 2013 Government Programme seeks to improve the administration and organisation of schools.35 A draft law on secondary education reform submitted to the House of Representatives still has to be voted on. The reform proposal is based on the principle that secondary school should be more equal (providing all pupils with resources adapted to their individual needs) and more efficient (allowing all students to develop basic skills while guiding as many as possible on to higher qualifications). Luxembourg has made limited progress in addressing the part of the CSR 5 relating to the need to strengthen general education.
Vocational education does not sufficiently match young people’s skills with labour demand, in particular for people with a migrant background. National statistics suggest that the level of early school leaving is high among the migrant population.36 Luxembourg had already started a reform of vocational education and training in 2008, introducing a dual system (apprenticeships or long-term internships) in all paths of vocational training. The last classes to apply the reform switched to the new system in the 2012/13 school year.37
30 ENEGE country fiche LU 4Q2013. 31 In Luxembourg, 25.1% of women in married couples have no earnings and 46.9% have lower earnings than their husband; calculation by the European Network of Experts on Gender Equality (ENEGE) using 2011 EU-SILC data. 32 OECD (2012), Programme for International Student Assessment. 33 http://www.gouvernement.lu/3322796/Programme-gouvernemental.pdf: page 109. 34 Ministre de l’Éducation nationale et de la Formation professionnelle: http://www.men.public.lu/fr/grands-dossiers/enseignement-fondamental/premier-bilan-reforme-fondamentale/index.html. The report is positive on principles such as the attention to dialogue between parents and teachers, teamwork and continuing education. However, reservations were expressed about the practical implementation of the various measures. 35Available at: http://www.gouvernement.lu/3322796/Programme-gouvernemental.pdf. 36 Eurostat: 8.1% in 2012, as compared with the 12.7% EU average. 37 The reform offers remediation measures which help pupils with difficulties, improve learning methods and provide additional training. There are welcoming classes for newcomers and integration classes in lower technical secondary education for people lacking language proficiency.

20
However, the Government Programme states that the modular system,38 as introduced in vocational and educational training, proved difficult for schools to manage. Together with stakeholders and on the basis of a thorough assessment, the new government aims to adapt teaching skills to the requirements of the vocational and educational training system and linguistic situation of the population. Another weakness is that a single and comprehensive qualification system remains to be developed. The main goals of the Maison de l’Orientation, an efficient initiative for young people and adults which became fully operational in 2013, are to offer counselling and guidance services and the systematic follow-up of early school leavers. The reform of the vocational and educational training system provides more opportunities to bridge the gap between vocational training and higher education. A key challenge will be to increase the quality and attractiveness of vocational and educational training and to raise it to the level of ‘excellence’ needed to provide the labour market with a qualified workforce and provide learners with professional perspectives. Nevertheless, implementation and organisational issues have weakened stakeholders’ ownership of the vocational and educational training reform. Luxembourg has made limited progress as regards the recommendation on strengthening vocational education and training.
Tertiary attainment rate is 49.6 % in 2012 and 50.8% in 2013, progressing towards the very high national target of 66%. To achieve this ambitious target, the Government proposed in March 2014 an act providing for student loans and scholarships, the latter being available in different categories: basic grant, mobility grant and scholarship on social criteria.
Lifelong learning could help getting older workers back to work and tackle youth unemployment. The 2013 Government Programme states that the strategy outlined in the White Paper on Lifelong Learning (2012)39 will be progressively implemented in cooperation with the partners involved. One of the measures implemented in 2013 was the increased government financial participation rate for firms investing in lifelong learning for their employees. The overall rate of 20 % rises to 35 % to support older (over 45) and lower-qualified workers. Despite this positive development, there is still scope for increasing participation among vulnerable groups, especially the low-skilled, migrants and older workers. Adult participation in lifelong learning, which is an important factor in improving the employment rate of older workers, has increased over the last few years and reached 14.2 % in 2013, against an EU average of 9 %.40 Despite this good performance, greater adult participation is needed, since residents are facing competition from a large pool of potential workers from neighbouring countries. The measures taken on lifelong learning should be reinforced to help increase the labour market participation of older workers and the new government seems to be willing to implement measures going in that direction. Overall, Luxembourg has made some progress as regards the recommendation on the need to increase the participation rate of older workers.
Social policies
Poverty and social exclusion rates in Luxembourg are among the lowest in the EU but data tend to show the growing importance of social transfers for households, with more 38 For more details, see http://www.men.public.lu/catalogue-publications/systeme-educatif/dossiers-presse/2013-2014/130912-rentree.pdf page 19. 39 In November 2012, the previous government adopted a white paper on its LLL strategy. The national strategy focused on six cross-cutting principles and eight measures aim to link the various existing initiatives and improve the visibility of national policy. The eight steps are to: 1. Put in place the national qualifications framework (CLQ); 2. Adapt LLL to the life-cycle of the learner; 3. Adjust LLL to the diversity of Luxembourg society; 4. Concentrate all LLL information on a single platform; 5. Improve the quality of training for adults; 6. Professionalise LLL guidance; 7. Make individuals responsible for their own guidance; and 8. Create an LLL advisory commission. 40 Eurostat.

21
people relying on the guaranteed minimum income (RMG). While the inequality rate remains low, the poverty rate in the working-age population (as measured by the AROPE41 rate) has increased slightly, albeit from very low levels.
Young people are more at risk of poverty or social exclusion than older people and the rate decreases with age (24.6 % for the 0-17 age group against 6.1 % for the 65+ age group in 2012).42 Child poverty43 is often perceived as a problem for vulnerable households, but increasing labour market participation is not the only way to alleviate poverty. Educational performance may also be seen as a very important factor in the fight against unemployment and poverty, and this remains a serious challenge in Luxembourg.44 The ongoing reform of the minimum income scheme aims to respond better to the needs of specific population groups and to specific situations (e.g. as regards housing).
The proportion of people living in households with very low work intensity, though still among the lowest in the EU, increased slightly between 2010 and 2012 (from 5.5 % to 6.1 %). Particularly worrying is the in-work/at-risk-of-poverty rate for single parents, which is the second highest in the EU. According to the European Working Conditions Observatory, families are more likely to be at risk of poverty in households with people prevented by disability from engaging in economic activity. The government has announced its intention to reform the social benefits system, without providing precise information on content or timing.
The poverty situation of people with migrant backgrounds is considerably worse than that of nationals, although it has improved in recent years (the AROPE rate has declined steadily since 2009 to 20.9 % in 2012 for EU nationals and 41.6 % for non-EU nationals). The government has proposed six measures to achieve the poverty target, four of which could be considered as focusing on women and single-parent families.45
3.4. Structural measures promoting sustainable growth and competitiveness
Luxembourg’s large and persistent current-account surplus is driven by financial services and masks a persistent and gradually increasing deficit in the trade balance for goods. The latter stems from anaemic export growth, as reflected in the significant loss in export market share for goods in the aftermath of the financial crisis. This trend is likely to reflect not simply the increasing ‘tertiarisation’ of the economy, but also a more structural loss of cost-competitiveness. As a result of wage increases and a decline in productivity, the unit labour cost has increased one-and-a-half times faster in Luxembourg than on average in the EA17, eroding the country’s competitive position.
41 ‘At risk of poverty or social exclusion’ (AROPE) refers to the situation of people at risk of poverty, severely materially deprived or living in a household with very low work intensity. The AROPE rate, the proportion of the total population that is at risk of poverty or social exclusion, is the headline indicator to monitor the EU 2020 Strategy poverty target. 42 +2.9% and +1.4% as compared with 2011. 43 Child poverty has increased by 3% in a year. However, the risk of severe material deprivation for children is much lower in Luxembourg than in the EU on average (1.1% in 2012 against 11.1%) and only 3.1% of children live in low work intensity households. By way of reference, the risk of severe material deprivation for the total Luxembourg population is 1.3% (as compared with 9.9% in EU28the EU-28). 44 EU Network of Independent Experts on Social Inclusion, Investing in children — breaking the cycle of disadvantage — A Study of National Policies, Luxembourg, 2013. 45 Measures relate to: Continuing the policy of providing welcoming socio-educational structures to children; — Making parents who benefit from the guaranteed minimum income (RMG) mechanism aware of the use of welcome centre checks; — Increasing activation rates as part of the RMG mechanism; — Promoting measures favouring young peoplepeople’s transition from academic to professional life and motivating them to return to school; — Making full use of the instruments put in place under the social aid law; and a national strategy against homelessness and exclusion caused by housing.

22
In 2013, Luxembourg received a CSR concerning the reform of wage indexation, the diversification of the economy and the need to foster investment in research. The analysis in this SWD leads to the conclusion that Luxembourg has made limited progress on measures taken to address this CSR.
Box 3: Conclusions from the March 2014 in-depth review on Luxembourg
The first in-depth review (IDR) on Luxembourg under the Macroeconomic Imbalances Procedure was published on 5 March 2014.46 On the basis of the analysis in the IDR, the Commission concluded that the macroeconomic challenges identified in Luxembourg did not constitute an imbalance in the sense of the MIP. The main observations and findings from this analysis are:
• The analysis of the current-account surplus shows that it does not stem from anaemic domestic demand, but is the result of the country’s particular growth model, which is strongly based on financial services. Still, it masks a large and steadily increasing deficit in merchandise trade, which broadly comes from subdued exports.
• Losses of export market share are largely associated with nominal unit labour costs rising much faster than in trading partner countries, driven to a certain extent by the wage-setting mechanism.
• Risks to domestic financial stability stemming from the presence of a large financial sector exist but are relatively contained, as the sector is both diversified and specialised. Furthermore, domestic banks post sound capital and liquidity ratios.
• The high level of indebtedness of the private sector, in particular the non-financial corporations, mainly reflects the presence of a large number of multinational firms that use their branches or subsidiaries in Luxembourg for intra-group financing operations. The dynamism of house prices represents an increasing source of concern.
• Finally, the current favourable position of public finances is highly dependent on the sustainability of the growth model based on a buoyant financial sector and presents a high sustainability risk in the long term. In this vein, the recently implemented pension reform is insufficient to cope with the challenge.
The IDR also discusses policy elements stemming from these areas and possible avenues for the way forward:
• Cost-competitiveness and export performance could be improved by replacing the temporary modulation of automatic wage indexation with a structural solution.
• Efforts to diversify the economy beyond the financial sector should be pursued. In particular, the existing clusters on ICT, logistic and the aero-naval and space industries are the most promising in terms of future growth and employment.
• Changes to the recently modified pension system could lower risks related to the long-term sustainability of public finances and ensure a more equitable intergeneration distribution of the pension burden.
46 Available at: http://ec.europa.eu/economy_finance/economic_governance/macroeconomic_imbalance_procedure/index_en.htm
23
Competitiveness
The steady increase in unit labour cost over the last decade has undermined the competitiveness of Luxembourg’s industrial fabric. The modulation of the wage indexation mechanism adopted by the government in 2012 is only temporary (until end 2014), and finding a more structural solution constitutes a challenge. In its programme, the new government has announced its intention to analyse the feasibility and potential impact of a widespread de-indexation of the economy, taking into account both social and economic considerations, and committed to adapting the current legislation on the automatic indexation of wages, after consultation with the social partners. To this end, the government has asked to the social partners to strike an agreement on amendments to the system before the summer. The government has announced its intention to legislate the issue in the case an agreement is not reached or in the case of inflation hike. While the principle of automatic indexation of wages, salaries, pensions, annuities and other generally adapted allowances and amounts should remain intact, different avenues are open for adapting current legislation. The key issue lies with ensuring that wages are tied more closely to productivity developments, including at sectorial level where relevant, so as to ultimately ensure long-term price competitiveness. No progress has been made on this part of the CSR.
Research and innovation
The heavy dependence on the financial sector represents a structural risk for Luxembourg’s economy: in addition to the ‘sovereignty niches’ on which the financial sector expansion is based, the country crucially needs to develop and strengthen ‘competence niches’ as a springboard for innovation-driven growth. Although public-sector R&D intensity has quadrupled since 2000 (reflecting the authorities’ resolve to build up public research capacities from a situation where, 25 years ago, the public research system was non-existent), Luxembourg is not on track to reach its 2020 R&D intensity target of 2.3-2.6 %, due to the sharp decrease in business R&D intensity (from 1.53 % of GDP in 2000 to 1.00 % in 2012). Its performance against indicators on cooperation between public research institutions and firms is well below the EU average, reflecting the current disconnect between private sector R&D and the public research system. Objectives in terms of spin-off creation, as specified in public research organisations’ performance contracts, are not met.
The main reform launched in the past year in this direction is the strengthening of the country’s policy on innovative clusters, with new missions given to clusters and the setting-up of a new cluster in the automotive field. Moreover, the government announced its intention to put in place a process to enable public research organisations and firms to develop common research agendas focused on medium- and long-term targets. Two important draft laws are currently in the legislative process, with adoption expected in 2014: one is aimed at consolidating the public research organisations, in particular with the merger of the Tudor and Lippmann Public Research Centres, the other at reforming the National Research Fund (FNR), which allocates funds on a competitive basis. The merger of the Tudor and Lippmann Public Research Centres should enable a build-up of critical mass in areas with major prospects for cooperation with Luxembourg industry, e.g. materials and sustainable development, with some less promising research being discontinued. The reform of FNR will enable the better use of research results, notably through enabling actions to support ‘proof of concept’. The reform of FNR’s researchers training scheme (AFR) will foster inter-sectoral (public/private) mobility, but more could be done to encourage the economic exploitation of research activities. So far, Luxembourg has therefore made some progress on the implementation of this recommendation.

24
Towards green and sustainable growth
Luxembourg is expected to miss its GHG emissions reduction target by a wide margin, on the basis of inventories and the latest projections (based on existing measures only) it has submitted to the European Environmental Agency. GHG emissions are expected to have increased by 3 % in 2020 as compared with 2005, corresponding to a 23 percentage point gap with the 2020 target of a 20 % reduction. 2013 emissions are expected to be 1 % higher than the target set for 2013 by the Effort Sharing Decision. The gap to the target can be largely explained by emissions from the transport sector. In 2011, transport accounted for 57% of all GHG emissions in Luxembourg and transport-related emissions have increased by 40% since 2000. Around 70% of these emissions are connected to fuel exports, inter alia a result of very low excise duties on fuels.
Luxembourg’s second National Climate Action Plan (adopted in May 2013) contains 51 measures targeting a variety of areas, including energy efficiency, the use of renewable energies, transport, environmental taxation, climate change adaptation and governance structures. The fact that the new National Climate Action Plan recognises fuel exports as a key challenge is a step forward, but the corresponding proposed measures are vague and apply only to the midterm”. If successfully implemented, these measures would reduce the gap between Luxembourg's non-ETS emissions and the relevant target.
Overall, limited progress has been achieved in addressing this challenge. Acceleration of reforms and a focus on concrete and ambitious measures are still lacking.
Luxembourg is one of the five EU countries where the most time is spent in traffic, entailing a significant cost for the Luxembourg economy. Peak-hour congestion in Luxembourg constitutes a major problem, above all in the City of Luxembourg and on the main surrounding motorways and other roads. However, the potential of time-differentiated congestion charging to induce better use of the infrastructure remains completely unexploited. Revenues from congestion charges could be usefully devoted to the development of public transport alternatives. Furthermore, Luxembourg has the highest motorisation rate in the EU, and 92% of cross-border commuters using a car to get to work. It would benefit from a reduction in the favourable tax treatment of company cars which could encourage more people, including cross-border commuters, to use public transport alternatives.
The strategy of the government as outlined in the 2012 Sustainable Mobility Strategy (MoDu"), is tilted to increase the share of public transport in all motorised forms of domestic transport from 14.5 % in 2009 to 25 % in 2020. To this effect, plans have sketched out for a tramway network in the City of Luxembourg and a number of ‘park & ride’ facilities on the outskirts of the cities. In September 2013, the government adopted a draft financing bill for the first construction phase of the tramline. The government also announced the creation of a dedicated committee to promote soft mobility. If successfully implemented, the corresponding reduction in the modal share of individual motorised transport should help reduce congestion, air pollution and CO2 emissions from transport. Similar results are expected from enhanced cooperation with adjacent regions to increase the capacity of the public transport system and to reduce cross-border car traffic. While the existing vehicle fleet in Luxembourg is becoming greener and more fuel-efficient, the government is still far away from its objective of increasing the proportion of electric vehicles to 10 % by 2020 (i.e. some 40 000 vehicles). Loading stations are to be installed to help meet this objective. In view of this, the target of increasing the share of renewable energy used in transport from 2 % in 2011 to 10 % by 2020 remains a challenge.
Between 2005 and 2012, renewable energy consumption doubled to 3.1 % of total consumption, but this still falls far short of the 11 % target for 2020. Electricity from

25
renewable sources is mainly promoted through feed-in tariffs and subsidies. A new feed-in tariff system for electricity from renewable energy sources was introduced on 1 January 2014, with increased tariffs for hydro-power, wind energy, biogas and biomass. Current policies alone, however, will be insufficient to trigger the required deployment of renewable energy. Given the limited national capabilities, Luxembourg does not appear able to meet its renewable energy target through domestic measures. Therefore, the timely implementation of cooperation mechanisms with other Member States will most likely be necessary. The government has initiated contacts with various Member States expected to exceed their RES objectives to explore the possibility of statistical transfers, in particular. A new regulation on renewable energies, coupling the use of renewables to energy performance certificates for buildings, as established by the European Energy Performance in Buildings Directive, was implemented in early 2013. This move has to be commended and should serve as a starting point for further integration of renewable energy and energy efficiency solutions.
Luxembourg’s energy intensity remains moderate, even though the country has substantial ‘heavy industry’ and large proportions of transport fuels due to transit traffic. Government efforts to promote energy efficiency focus mainly on buildings, with various initiatives to reduce energy use in the residential sector. The government decided to go beyond European requirements and set 1 January 2019 as the deadline for achieving the ‘nearly zero-energy’ target for both public and other buildings. Measures target the construction of new efficient buildings and the renovation of old buildings. Energy efficiency in industry is largely addressed through long-standing voluntary agreements. The complete and timely transposition and effective implementation of the Energy Efficiency Directive (due to be transposed by June 2014) would provide additional means, including audits, to promote energy efficiency. To boost the job creation potential of energy efficiency investments, the skills gap identified in the construction sector for such measures would also need to be tackled.
Luxembourg is dependent on imports for all its energy needs. Further interconnections with neighbouring countries could therefore improve security of supply. With regard to electricity, the current interconnection capacity with Germany is sufficient but the situation has to be reassessed as a result of Germany’s nuclear phase-out. Moreover, higher shares of renewable sources through imports would justify further development of connecting infrastructures. Regarding gas, the country is suffering from limited availability of firm entry capacity. An enhanced congestion management mechanism could help alleviate this situation. Overall, limited progress has been achieved in meeting Luxembourg’s energy challenges.
Internal market and competition
According to the latest Single Market Scoreboard,47 Luxembourg decreased by four its backlog of single market directives due for transposition, reducing its current deficit to 0.7 %. The deficit therefore remains under the EU’s 1 % threshold and also meets the ‘zero tolerance’ target for ‘long outstanding’ directives (transposition two or more years overdue). The current transposition delay for overdue directives is 7.9 months on average, slightly above the EU average of 7.3 months. As regards the conformity of measures communicated to the Commission, Luxembourg’s compliance deficit of 0.3 % is close to the proposal in the Single Market Act for a 0.5 % target. With 19 pending infringement proceedings relating to the single market (37 % of them relating to taxation), Luxembourg has kept its case load well below the EU average of 30. Luxembourg is also one of the Member States where infringement cases are resolved most quickly — 18.7 months on average, as compared with
47 Single Market Scoreboard — February 2014; available at: http://ec.europa.eu/internal_market/score/index_en.htm.

26
the EU average of 27.9 months. Luxembourg takes 12 months on average to comply with court rulings following judgments, well below the EU average of 18.2 months.
Directives 2009/72/EC and 2009/73/EC concerning the common rules for the internal markets in electricity and natural gas were transposed by laws adopted on 7 August 2012. Most aspects of implementation are satisfactory, but some issues remain, mainly as regards the independence of the energy regulator.
Increased powers were granted to the new competition authority established in October 2011 through the merger of the two existing competition bodies. The authority has to be consulted on any draft law or regulation that may affect competition, but it suffers from a clear lack of staff that affects its capacity for more comprehensive competition enforcement.
3.5. Modernisation of public administration
Luxembourg generally ranks well in surveys of the administrative burdens of the tax system. However, it has one of the lowest rates of procurement contracts competitively advertised at EU level (in OJ/TED) and a low uptake of e-procurement.
The Luxembourgish Point of Single Contact is performing well in terms of provision of comprehensive information to businesses and allowing them to complete administrative formalities online. However, a requirement that imposes a use of LuxTrust certificate raises doubts whether its accessibility for service providers from other Member States is adequately ensured.
Luxembourg has not recorded any progress as regards the time required to start a business (19 days, as compared with 11 on average for OECD countries);48 still, this is balanced by a high enterprise survival rate after two years, which places Luxembourg in second position among the EU Member States.49 The new government wants to make business creation easier and faster. The legislation adopted in September 2011 simplified administrative procedures for the development and operating conditions of classified establishments, mainly by introducing tacit authorisation and obliging administrations to respect specific deadlines.
The value of works, goods and services that Luxembourg authorities and entities published under the EU procurement legislation in 2012 was 1.4 % of GDP, well below the EU-27 average of 3.4 % and, together with Germany, the lowest in the EU. This failure of competitive procurement produces considerable costs for the Luxembourg taxpayer and for European businesses in terms of foregone business opportunities. The scale of the problem is very difficult to estimate precisely. However, according to Commission estimates, Luxembourg advertised procurement contracts worth around EUR 560 million in 2011 and, if competitive procurement could bring savings of around 5 % (as several studies suggest), the Luxembourg public sector may be spending up to EUR 28 million more than it needs to.
While an e-procurement portal and a platform have been set up, the level of take-up of e-submission is still close to zero. The revised directives on public procurement, which entered into force in March 2014, provide for a gradual transition to mandatory e-procurement, to be progressively extended to all contracting authorities (September 2018). E-procurement can generate significant cost savings, improve the transparency of public procurement, shorten lead time and increase competition. Overall, its introduction is an opportunity to rethink the way public procurement is organised and a key element for
48 Figures from Doing Business 2014 — Luxembourg. 49 The most recent figures refer to 2010.

27
leveraging smart procurement. Therefore, fostering the level of take-up of e-procurement, in particular by gradually encouraging the use of e-submission, would help to maximise the benefits of using e-procurement.
The 7th Environment Action Programme states that the EU and its Member States should be moving towards a circular economy and that measures supporting such an objective should be in line with the principles of smart regulation and, where appropriate, subject to a comprehensive impact assessment.50 Such an assessment could provide the costs and benefits of different policy options, and also support precautionary action by estimating the costs of inaction. From case studies, it is clear that the costs of inaction have often been grossly underestimated in the past.51 Luxembourg could save costs (e.g. costs of inaction, lock-in effects, indirect and long-term effects) by introducing environmental integration criteria in its present system of impact assessment.
In March 2014, the government reached an agreement on the reform of the public sector which contained no major changes to the current staff regulation and therefore no substantial potential for budgetary savings. Starting salaries will remain at the current level and only a very limited appraisal system will be introduced.
50 Article 2.3 of the 7th EAP. http://eur-lex.europa.eu/LexUriServ/LexUriServ.do?uri=OJ:L:2013:354:0171:0200:EN:PDF . 51 European Environment Agency (2013).), Late lessons from early warnings: science, precaution, innovation, EEA Report No 1/2013.

28
4. CONCLUSIONS
The Luxembourg economy faces many challenges, most of which are linked to the Annual Growth Survey and Europe 2020 objectives. The situation of the public finances is sound only in the short term and its sustainability in the long term is challenged by the projected increase in age-related expenditure. Although to date windfall revenues have often more than counterbalanced expenditure overrun, the likelihood of these continuing in the future is becoming remote. The introduction of a medium-term budgetary framework will help to smooth the impact of the cycle on future fiscal developments. The economy’s strong reliance on financial services comes with an inherent risk of overexposure to a single sector and Luxembourg would benefit from a more diversified economy. The competitiveness of the industrial sector has been weakened, as the unit labour cost has increased more than in neighbouring countries. On the other hand, comparatively high wages have weakened demand for low-skilled workers and in general for people with low educational attainments, among whom the unemployment rate is especially high. The national education system currently performs below the OECD average, but is called to play an important role as resident workers face competition from a large pool of people from neighbouring countries with a lower reservation wage and more suitable skills. In light of high labour costs, the country is trying to develop and strengthen ‘competence niches’ as springboards for innovation-driven growth in high value-added industrial sectors. However, Luxembourg’s research and innovation system remains very weak, with decreasing business R&D investment and a low level of cooperation between public research institutions and firms. Although the government has put in place several measures to address these issues, these are often not ambitious enough or fail to tackle issues in a structural way.
The analysis in this staff working document leads to the conclusion that Luxembourg has made limited progress in addressing the 2013 country-specific recommendations. Some progress has been made as regards the situation of the public finances, the introduction of a medium-term budgetary framework and the increase of the employment rate among older workers. But limited progress has been made with regard to the long-term sustainability of the public finances, the improvement of cost-competitiveness and achieving greenhouse gas emissions targets. Limited progress has been made on reducing the debt bias on corporate taxation and the extension of the application of the standard VAT rate. Overall, the main challenges identified in July 2013 remain broadly valid, as there is still a need for further improvement in all areas.
The policy plans included in the 2014 national reform programme submitted by Luxembourg respond to last year’s recommendations. The national reform programme reflects the challenges identified in last year's Staff Working Document. It outlines the policy initiatives which have been taken to address the various aspects of the Country Specific Recommendations. In addition, when relevant, it provides an indication of the government's policy plans, even if in some areas they lack the ambition needed to address the challenges in a comprehensive and structural way. The stability programme confirms the medium term objective of a surplus of 0.5% of GDP in structural terms, but misses to fully specify the measures underpinning the strategy to reach this objective.

29
OVERVIEW TABLE
2013 commitments Summary assessment
Country-specific recommendations (CSRs)52
CSR 1: Preserve a sound fiscal position and remain at the medium-term objective so as to ensure the long-term sustainability of public finances, in particular by taking into account implicit liabilities related to ageing. Strengthen fiscal governance by adopting a medium-term budgetary framework covering the general government and including multi-annual expenditure ceilings, and by putting in place the independent monitoring of fiscal rules.
Luxembourg has made some progress in addressing CSR 1:
Luxembourg has made some progress concerning its fiscal position. In 2013, the government implemented a consolidation package equivalent to around 2.0 % of GDP. According to the Commission 2014 spring forecast, the government budget has recorded a small surplus of 0.1 % of GDP in 2013. The headline balance is then expected to turn to a deficit of 0.2% of GDP in 2014 and sharply deteriorate in 2015 to 1.4 % of GDP, as VAT revenues from e-commerce-related activities start to fade out. In structural terms, the government budget is expected to over-achieve the MTO in 2013, posting a surplus of 1.4 % of GDP. In 2014, the surplus is expected to shrink to 0.6 % of GDP, in line with the MTO, but the structural balance is then expected to post a sharp deterioration in 2015 and, departing from the MTO, fall by around 2 % of GDP.
Luxembourg has made some progress on the adoption of a medium-term budgetary framework. A new draft of the law to introduce such a framework (through a ‘multiannual finance law’) was presented to parliament in March 2014 and rapid adoption is expected.
CSR 2: Take measures to address the debt-bias in corporate taxation and extend the application of the standard VAT rate.
Luxembourg has made limited progress in addressing CSR 2:
Luxembourg has made limited progress concerning the corporations debt bias in corporate taxation.
Luxembourg has made limited progress on the application of the standard VAT rate. The Prime Minister indicated that the government plans to increase the standard VAT rate by 2 pp (to offset the loss of e-commerce VAT revenue). In parallel, the 2 pp increase will also apply to other reduced VAT rates, but not to the super-reduced rate of 3 %. While broadening the tax base would prove more efficient and more growth-friendly than increasing tax rates, it can be concluded that there has been limited progress with regard to CSR2 on VAT.
52 The following categories are used to assess progress in implementing the 2013 country-specific recommendations: No progress: The Member State has neither announced nor adopted any measures to address the CSR. This category also applies if a Member State has commissioned a study group to evaluate possible measures. Limited progress: The Member State has announced some measures to address the CSR, but these measures appear insufficient and/or their adoption/implementation is at risk. Some progress: The Member State has announced or adopted measures to address the CSR. These measures are promising, but not all of them have been implemented yet and implementation is not certain in all cases. Substantial progress: The Member State has adopted measures, most of which have been implemented. These measures go a long way in addressing the CSR. Fully addressed: The Member State has adopted and implemented measures that address the CSR appropriately.

30
CSR 3: Curb age-related expenditure by making long-term care more cost effective, in particular through a stronger focus on prevention, rehabilitation and independent living, strengthening the recently adopted pension reform, taking additional measures to curb early retirement and increasing the effective retirement age, including by linking the statutory retirement age to life expectancy.
Luxembourg has made limited progress in addressing CSR 3:
Luxembourg has made limited progress on long-term care expenditure. Long-term care reform has been announced, but has not yet been implemented.
Luxembourg has made limited progress on early retirement. A draft bill on the reclassification of people with work disabilities has been presented to parliament. The abolition of some early-retirement schemes has been announced. Finally, measures on lifelong learning should help increase labour market participation by older workers and should be continued (as people currently tend to retire at the age of 59.4 on average, thanks to the generous pension system in place).
CSR 4: Beyond the current freeze, take further structural measures, in consultation with the social partners and in accordance with national practices, to reform the wage-setting system, including wage indexation, to improve its responsiveness to productivity and sectoral developments and labour market conditions and foster competitiveness. Step-up efforts to diversify the structure of the economy, fostering private investment in research, notably by developing cooperation between public research and firms.
Luxembourg has made limited progress in addressing CSR 4:
Luxembourg has made no progress on the reform of the wage-setting scheme. The measures regarding the indexation system are valid until the end of 2014. Luxembourg should take further measures to reform the system itself to avoid future loss of competitiveness. Wages could be tied more closely to productivity through a permanent link and sectoral differentiation in the wage bargaining system.
Luxembourg has made some progress on the diversification of its economy. Positive signs include the reinforcement of the country’s policy on clusters and the reforms of the public research organisations and the National Research Fund. The government announced its intention to support common research agendas between public research organisations and industry, although it has not yet been announced how this will materialise.
CSR 5: Step up efforts to reduce youth unemployment by improving the design and monitoring of active labour market policies. Strengthen general and vocational education to better match young people’s skills with labour demand, in particular for people with migrant backgrounds. Take resolute action to increase the participation rate of older workers, including by improving their employability through lifelong learning.
Luxembourg has made limited progress in addressing CSR 5:
Luxembourg has made some progress in addressing CSR 5 as regards activation policies for young people. It has taken a number of relevant measures to tackle youth unemployment which seem to point in the right direction, but so far these have been only partially implemented. There is still a need for a coherent strategy. Stronger cooperation between administration levels (state, municipalities) and a more efficient use of employment services would produce better results.
Luxembourg has made limited progress in addressing CSR 5 as regards the reform of secondary education and of vocational education and training. In order to address the skills mismatch, there is a need to provide guidance to pupils at an earlier age (lower secondary). Overall, more will need to be done to improve significantly the integration of people from migrant backgrounds and low-skilled young jobseekers, and the Luxembourg authorities should be encouraged to take further action.

31
Luxembourg has made some progress in addressing CSR 5 as regards lifelong learning. Measures implemented in 2013 included increased government financial participation rate for firms investing in lifelong learning for their employees. There is still scope for increasing participation by older workers and other vulnerable groups to help put them back to work.
CSR 6: Step up measures to meet the target for reducing non-ETS greenhouse gas emissions, in particular by increasing taxation on energy products for transport.
Luxembourg has made limited progress in addressing CSR 6:
Luxembourg has made limited progress in adopting some measures to contribute to meeting the target for reducing non-ETS GHG emissions. The second national climate action plan, adopted in May 2013, contains 51 measures targeting a variety of areas, including energy efficiency, the use of renewable energies or transport. Implementing successfully these measures would still fall short of meeting the target.
Luxembourg has made no progress with respect to taxation on energy products for transport. The government announced a new study on the impact of energy tax reforms, but did not specify concrete actions or timeline for implementation.
Overall, GHG emissions are expected to increase by 3% in 2020 compared to 2005, corresponding to a 23 percentage point gap with the target. 2013 emissions are expected to be 1% higher than the Effort Sharing Decision target.
Europe 2020 (national targets and progress)
Policy field target Progress achieved
Employment rate target: 73 % The overall employment rate of the resident population decreased slightly from 71.4 in 2012 % to 71.1% in 2013.
R&D target: 2.3 %-2.6 % of GDP (of which 1.5 % to 1.9 % for the private sector and 0.7 % to 0.8 % for public spending)
Luxembourg is not at all on track to reach its R&D intensity target for 2020, as this is on a declining trend. This is explained by the sharp decrease in business R&D intensity (from 1.53 % of GDP in 2000 to 1.0 % in 2012). Public sector R&D intensity, on the other hand, increased steadily from 0.12 % in 2000 to 0.45 % in 2011. This fourfold increase reflects the willingness of the country to build up its public research capacities from a situation where, 25 years ago, the public research system was non-existent. These efforts have continued in recent years. In 2012, for the first time, the government R&D budget caught up with the EU average percentage of total government expenditures (1.4 %). Between 2011 and 2014, the nominal increase of the public R&D budget is expected to be 21 %.
Greenhouse gas (GHG) emissions target: -20 % compared to 2005 emission (from sources not covered by the Emission Trading System)°
Change in non-ETS greenhouse gas emissions between 2005 and 2012: -5 %.
According to the latest national projections submitted to the Commission and taking into account existing measures, it is expected that the target will be missed: +3 % in 2020 as compared with 2005 (i.e. a projected shortfall of 23 percentage points).

32
Renewable energy target: 11 %
Share of renewable energy in all modes of transport:
Luxembourg has achieved the interim target for the share of RES in final energy consumption for 2011/2012 (2.92%) and registered a slightly increase from 2011 to 2012 (2.87% to 3.13%). Renewable share in transport reached 2.22% in 2012. Nevertheless, there is a long way to go if compliance with the 2020 objective of 11% is to be realised..
Energy efficiency target —
Luxembourg has set an indicative national energy efficiency target which implies reaching a 2020 level of 4.48 Mtoe primary consumption and 4.24 Mtoe final energy consumption.
Luxembourg did not notify the policy measures it plans to adopt to implement Article 7 of the Energy Efficiency Directive.
Early school leaving target: <10 % The number of early leavers from education and training stood at 8.1 % in 2012 and 6.3 % (provisional data) in 2013 and remains an issue for Luxembourg. Luxembourg could review the target in 2015 if figures remain below 10 %. However, the migrant population in particular is still hit heavily by early school leaving.
Tertiary education target: >40 % (national target 66%)
The tertiary attainment rate according to Eurostat methodology was 49.6 % in 2012 and 50.8 % (provisional data) in 2013, i.e. above the EU target of 40 %. However, tertiary attainment in the resident population is lower, currently about 30 %, despite the strong demand for workers with tertiary qualifications. No new measures have been taken in recent months.
Risk of poverty or social exclusion target: reduction of the number of people threatened by poverty or social exclusion by 6 000 in 2020
People at risk of poverty or social exclusion numbered around 11 000 in 2010 and 12 000 in 2011. The overall employment and poverty situation in Luxembourg did not change significantly over the past year. But the position of cross-border workers and non-nationals, in particular Portuguese (over 21 % of Portuguese workers are ‘working poor’) and non-EU citizens, remains a big challenge for Luxembourg.

33
ANNEX
Standard tables
Table I. Macro-economic indicators

34
1996-2000
2001-2005
2006-2010
2011 2012 2013 2014 2015
Core indicatorsGDP growth rate 6.2 3.6 1.7 1.9 -0.2 2.1 2.6 2.7Output gap 1 0.5 1.1 0.0 -1.8 -3.6 -2.8 -1.6 -0.3HICP (annual % change) 1.7 2.8 2.5 3.7 2.9 1.7 1.4 2.4Domestic demand (annual % change) 2 5.9 3.2 2.0 4.2 2.5 -0.8 1.9 2.6Unemployment rate (% of labour force) 3 2.6 3.6 4.7 4.8 5.1 5.8 5.7 5.5Gross fixed capital formation (% of GDP) 21.6 21.8 19.6 18.5 19.3 17.6 17.1 17.3Gross national saving (% of GDP) 33.0 32.7 28.0 27.8 27.1 23.7 24.3 23.1General Government (% of GDP)Net lending (+) or net borrowing (-) 3.5 1.5 1.4 0.2 0.0 0.1 -0.2 -1.4Gross debt 6.9 6.3 12.6 18.7 21.7 23.1 23.4 25.5Net financial assets 45.6 54.3 54.1 46.7 49.9 n.a n.a n.aTotal revenue 43.4 42.6 41.9 42.7 44.0 43.6 42.9 42.6Total expenditure 39.9 41.1 40.5 42.6 43.9 43.5 43.1 44.0 of which: Interest 0.4 0.2 0.3 0.5 0.5 0.5 0.5 0.6Corporations (% of GDP)Net lending (+) or net borrowing (-) n.a n.a -2.5 -8.8 -10.2 n.a n.a n.aNet financial assets; non-financial corporations n.a n.a -162.6 -204.6 -194.5 n.a n.a n.aNet financial assets; financial corporations n.a n.a -182.6 53.8 23.8 n.a n.a n.aGross capital formation n.a n.a 11.3 12.1 12.7 n.a n.a n.aGross operating surplus 27.9 27.8 31.3 30.5 29.1 n.a n.a n.aHouseholds and NPISH (% of GDP)Net lending (+) or net borrowing (-) 3.2 n.a 1.6 2.8 3.4 n.a n.a n.aNet financial assets n.a n.a 81.8 75.1 73.9 n.a n.a n.aGross wages and salaries 31.7 29.5 26.3 26.5 26.8 n.a n.a n.aNet property income n.a n.a 1.4 1.2 1.2 n.a n.a n.aCurrent transfers received n.a n.a 14.2 15.4 15.9 n.a n.a n.aGross saving n.a n.a 5.9 7.6 7.8 n.a n.a n.aRest of the world (% of GDP)Net lending (+) or net borrowing (-) n.a 10.5 7.5 6.3 5.3 4.7 6.2 5.0Net financial assets n.a n.a 209.9 30.5 48.4 n.a n.a n.aNet exports of goods and services 18.9 22.2 31.0 30.4 29.1 32.7 33.7 32.8Net primary income from the rest of the world -8.3 -15.5 -25.9 -31.2 -31.9 -31.6 -31.3 -31.4Net capital transactions n.a 0.0 -0.6 -0.4 -0.5 -0.5 -0.2 0.0Tradable sector 34.9 32.3 28.4 29.1 28.0 26.9 n.a n.aNon tradable sector 54.9 57.3 61.7 60.9 61.6 62.5 n.a n.a of which: Building and construction sector 6.0 6.2 5.6 5.3 5.5 5.6 n.a n.aReal effective exchange rate (index, 2000=100) 94.8 97.6 107.4 116.7 117.6 121.0 122.4 123.5
Terms of trade goods and services (index, 2000=100) 98.2 98.6 102.8 105.5 105.7 107.1 107.8 107.1Market performance of exports (index, 2000=100) 86.3 97.6 107.2 105.9 103.6 105.7 105.5 104.9
Source :Commission 2014 spring forecast (COM); Stability programme (SP).
Notes:1 The output gap constitutes the gap between the actual and potential gross domestic product at 2005 market prices.2 The indicator on domestic demand includes stocks.3 Unemployed persons are all persons who were not employed, had actively sought work and were ready to begin working immediately or within two weeks. The labour force is the total number of people employed and unemployed. The unemployment rate covers the age group 15-74.
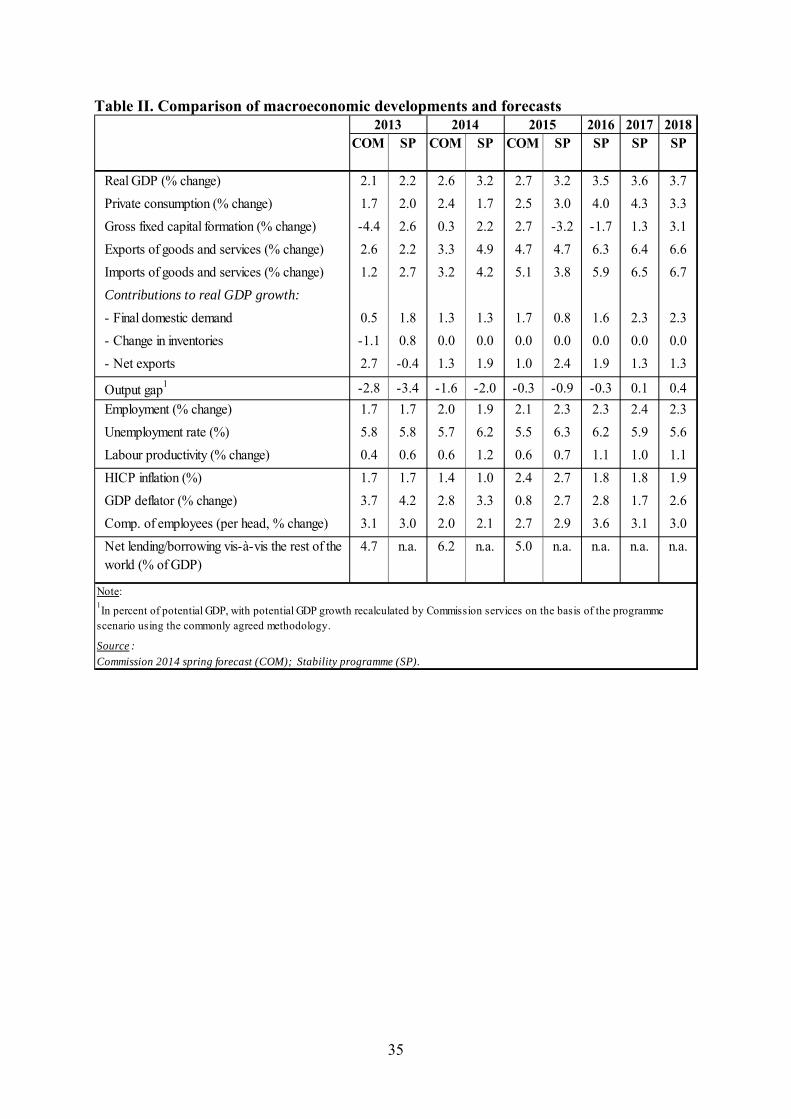
35
Table II. Comparison of macroeconomic developments and forecasts
2016 2017 2018COM SP COM SP COM SP SP SP SP
Real GDP (% change) 2.1 2.2 2.6 3.2 2.7 3.2 3.5 3.6 3.7Private consumption (% change) 1.7 2.0 2.4 1.7 2.5 3.0 4.0 4.3 3.3Gross fixed capital formation (% change) -4.4 2.6 0.3 2.2 2.7 -3.2 -1.7 1.3 3.1Exports of goods and services (% change) 2.6 2.2 3.3 4.9 4.7 4.7 6.3 6.4 6.6Imports of goods and services (% change) 1.2 2.7 3.2 4.2 5.1 3.8 5.9 6.5 6.7Contributions to real GDP growth:- Final domestic demand 0.5 1.8 1.3 1.3 1.7 0.8 1.6 2.3 2.3- Change in inventories -1.1 0.8 0.0 0.0 0.0 0.0 0.0 0.0 0.0- Net exports 2.7 -0.4 1.3 1.9 1.0 2.4 1.9 1.3 1.3
Output gap1 -2.8 -3.4 -1.6 -2.0 -0.3 -0.9 -0.3 0.1 0.4Employment (% change) 1.7 1.7 2.0 1.9 2.1 2.3 2.3 2.4 2.3Unemployment rate (%) 5.8 5.8 5.7 6.2 5.5 6.3 6.2 5.9 5.6Labour productivity (% change) 0.4 0.6 0.6 1.2 0.6 0.7 1.1 1.0 1.1HICP inflation (%) 1.7 1.7 1.4 1.0 2.4 2.7 1.8 1.8 1.9GDP deflator (% change) 3.7 4.2 2.8 3.3 0.8 2.7 2.8 1.7 2.6Comp. of employees (per head, % change) 3.1 3.0 2.0 2.1 2.7 2.9 3.6 3.1 3.0Net lending/borrowing vis-à-vis the rest of the world (% of GDP)
4.7 n.a. 6.2 n.a. 5.0 n.a. n.a. n.a. n.a.
Note:
2013 2014 2015
1In percent of potential GDP, with potential GDP growth recalculated by Commission services on the basis of the programme scenario using the commonly agreed methodology.
Source :Commission 2014 spring forecast (COM); Stability programme (SP).

36
Table III. Composition of the budgetary adjustment
2013 2016 2017 2018Change:
2013-2018
COM COM SP COM1 SP SP SP SP SPRevenue 43.6 42.9 42.2 42.6 41.4 41.2 41.1 41.0 -2.6of which:- Taxes on production and imports 13.2 13.1 12.9 12.4 11.9 11.6 11.4 11.3 -1.9- Current taxes on income, wealth, etc. 14.6 14.3 14.0 14.6 14.3 14.4 14.6 14.7 0.2- Social contributions 12.2 12.1 11.9 12.3 11.9 11.9 11.9 11.8 -0.4- Other (residual) 3.6 3.3 3.3 3.3 3.3 3.3 3.2 3.2 -0.4Expenditure 43.5 43.1 42.1 44.0 41.9 41.0 40.3 39.5 -4.1of which:- Primary expenditure 43.0 42.6 41.6 43.5 41.5 40.5 39.8 38.9 -4.1
of which:Compensation of employees 8.4 8.4 8.2 8.7 8.1 7.9 7.8 7.6 -0.8Intermediate consumption 3.8 3.7 3.6 3.8 3.6 3.6 3.5 3.4 -0.3Social payments 21.0 20.9 20.5 21.1 20.0 19.7 19.5 19.1 -1.9Subsidies 1.8 1.8 1.7 1.8 1.7 1.6 1.6 1.6 -0.2Gross fixed capital formation 3.1 3.1 3.1 3.2 3.5 3.2 3.1 3.1 0.0Other (residual) 4.9 4.7 4.5 4.9 4.6 4.4 4.3 4.2 -0.8
- Interest expenditure 0.5 0.5 0.5 0.6 0.4 0.5 0.5 0.5 0.0General government balance (GGB) 0.1 -0.2 0.1 -1.4 -0.5 0.2 0.8 1.5 1.5Primary balance 0.6 0.3 0.6 -0.9 -0.1 0.7 1.3 2.0 1.5One-off and other temporary measures 0.0 0.0 0.0 0.0 0.0 0.0 0.0 0.0 0.0GGB excl. one-offs 0.1 -0.2 0.1 -1.4 -0.5 0.2 0.8 1.5 1.5Output gap2 -2.8 -1.6 -2.0 -0.3 -0.9 -0.3 0.1 0.4 3.2Cyclically-adjusted balance2 1.4 0.6 1.1 -1.3 -0.1 0.4 0.8 1.3 0.0Structural balance (SB)3 1.4 0.6 1.1 -1.3 -0.1 0.4 0.8 1.3 -0.3Change in SB -0.3 -0.8 -0.6 -1.9 -1.2 0.5 0.4 0.6 -Two year average change in SB 0.2 -0.6 -0.4 -1.3 -0.9 -0.4 0.4 0.5 -Structural primary balance3 1.9 1.1 1.5 -0.7 0.3 0.8 1.3 1.9 -0.3Change in structural primary balance -0.8 -0.6 -1.8 -1.2 0.5 0.4 0.6 -Expenditure benchmark
Applicable reference rate4 n.a. n.a. n.a. 1.08 1.08 n.a. n.a. n.a. -Deviation5 (% GDP) n.a. n.a. n.a. -2.3 -0.3 n.a. n.a. n.a. -Two-year average deviation (% GDP) n.a. n.a. n.a. -1.2 0.0 n.a. n.a. n.a. -
Stability programme (SP); Commission 2014 spring forecast (COM); Commission calculations.
1On a no-policy-change basis.
(% of GDP)2014 2015
Notes:
2Output gap (in % of potential GDP) and cyclically-adjusted balance according to the programme as recalculated by Commission services on the basis of the programme scenario using the commonly agreed methodology.3Structural (primary) balance = cyclically-adjusted (primary) balance excluding one-off and other temporary measures.4 Reference medium-term rate of potential GDP growth. The (standard) reference rate applies from year t+1, if the country has reached its MTO in year t. A lower rate applies as long as the country is adjusting towards its MTO, including in year t.The reference rates applicable to 2014 onwards have been updated in 2013.
5 Deviation of the growth rate of public expenditure net of discretionary revenue measures and revenue increases mandated by law from the applicable reference rate. The expenditure aggregate used for the expenditure benchmark is obtained following the commonly agreed methodology. A negative sign implies that expenditure growth exceeds the applicable reference rate.
Source :

37
Table IV. Debt dynamics
Average 2016 2017 20182008-2012 COM SP COM SP SP SP SP
Gross debt ratio1 18.0 23.1 23.4 23.3 25.5 24.0 23.9 23.5 22.2Change in the ratio 3.0 1.4 0.3 0.1 2.2 0.7 -0.1 -0.4 -1.2Contributions 2 :
1. Primary balance -0.8 -0.6 -0.3 -0.6 0.9 0.1 -0.7 -1.3 -2.02. “Snow-ball” effect 0.0 -0.7 -0.7 -1.0 -0.2 -0.8 -1.0 -0.7 -0.8
Of which:Interest expenditure 0.4 0.5 0.5 0.5 0.6 0.4 0.5 0.5 0.5Growth effect 0.0 -0.4 -0.6 -0.7 -0.6 -0.7 -0.8 -0.8 -0.8Inflation effect -0.5 -0.8 -0.6 -0.7 -0.2 -0.6 -0.6 -0.4 -0.6
3. Stock-flow adjustment 3.9 2.7 1.3 1.7 1.5 1.5 1.6 1.6 1.7Of which:Cash/accruals diff.Acc. financial assets
PrivatisationVal. effect & residual
2016 2017 2018COM SP COM SP SP SP SP
n.a. n.a. n.a. n.a. n.a. n.a. n.a. n.a.n.a. n.a. n.a. n.a. n.a. n.a. n.a. n.a.
n.a. n.a. n.a. n.a. n.a. n.a. n.a. n.a.
2013 2014 2015
(% of GDP) 20132014 2015
Source :Stability programme (SP); Commission 2014 spring forecast (COM); Commission calculations.
Gap to the debt benchmark3,4
Structural adjustment5
To be compared to:
Required adjustment6
Notes:1End of period.2The snow-ball effect captures the impact of interest expenditure on accumulated debt, as well as the impact of real GDP growth and inflation on the debt ratio (through the denominator). The stock-flow adjustment includes differences in cash and accrual accounting, accumulation of financial assets and valuation and other residual effects. 3Not relevant for Member Sates that were subject to an EDP procedure in November 2011 and for a period of three years following the correction of the excessive deficit.4Shows the difference between the debt-to-GDP ratio and the debt benchmark. If positive, projected gross debt-to-GDP ratio does not comply with the debt reduction benchmark.5Applicable only during the transition period of three years from the correction of the excessive deficit for EDP that were ongoing in November 2011.6Defines the remaining annual structural adjustment over the transition period which ensures that - if followed – Member State will comply with the debt reduction benchmark at the end of the transition period, assuming that COM (SP/CP) budgetary projections for the previous years are achieved.

38
Table V. Sustainability indicators
2013 scenario
No-policy-change scenario
Stability programme
scenario
2013 scenario
No-policy-change scenario
Stability programme
scenario
S2* 7.5 10.2 7.8 2.4 2.4 0.7of which:
Initial budgetary position (IBP) -1.2 1.5 -0.7 0.5 0.4 -1.3Long-term cost of ageing (CoA) 8.7 8.7 8.5 1.9 2.0 2.0 of which:
pensions 6.5 6.5 6.3 0.7 0.8 0.9healthcare 0.7 0.7 0.6 0.9 0.9 0.8long-term care 1.5 1.5 1.4 0.6 0.6 0.6others -0.1 0.0 0.1 -0.4 -0.4 -0.3
S1** -2.5 0.4 -2.9 1.5 1.7 -0.2of which:
Initial budgetary position (IBP) -2.2 0.7 -1.8 -0.2 -0.4 -2.0Debt requirement (DR) -2.2 -2.3 -3.0 1.5 1.8 1.5Long-term cost of ageing (CoA) 1.9 2.0 2.0 0.2 0.3 0.3
S0 (risk for fiscal stress)*** 0.05
Debt as % of GDP (2013)Age-related expenditure as % of GDP (2013)
Source : Commission; 2014 stability programme.Note : The 2013 scenario depicts the sustainability gap under the assumption that the budgetary position evolves until 2013 in line with the Commission's 2014 spring forecast. The 'no-policy-change' scenario depicts the sustainability gap under the assumption that the budgetary position evolves until 2015 in line with the Commission's 2014 spring forecast. The 'stability programme' scenario depicts the sustainability gap under the assumption that the budgetary plans in the programme are fully implemented. Age-related expenditure as given in the 2012 Ageing Report.
* The long-term sustainability gap (S2) indicator shows the immediate and permanent adjustment required to satisfy an inter-temporal budgetary constraint, including the costs of ageing. The S2 indicator has two components: (i) the initial budgetary position (IBP), which gives the gap vis-à-vis the debt-stabilising primary balance and (ii) the additional adjustment required due to the costs of ageing. The main assumption used in the derivation of S2 is that, in an infinite horizon, the growth in the debt ratio is bound by the interest rate differential (i.e. the difference between the nominal interest and the real growth rates); thereby not necessarily implying that the debt ratio will fall below the EU Treaty 60 % debt threshold. The following thresholds were used for the S2 indicator: (i) if the value of S2 is lower than 2, the country is classed as low risk; (ii) if it is between 2 and 6, it is classed as medium risk; and (iii) if it is greater than 6, it is classed as high risk.** The medium-term sustainability gap (S1) indicator shows the upfront adjustment effort required, in terms of a steady improvement in the structural primary balance in the period to 2020 and then sustained for a decade, to bring debt ratios back to 60% of GDP in 2030, including financing for any additional expenditure by the target date, arising from population ageing. The following thresholds were used to assess the scale of the sustainability challenge: (i) if the S1 value is less than zero, the country is classed as low risk; (ii) if a structural adjustment in the primary balance of up to 0.5 pp of GDP per year until 2020 after the last year covered by the 2014 spring forecast (2015) is required (indicating a cumulated adjustment of 2.5 pp), it is classed as medium risk; and (iii) if the S1 value is greater than 2.5 (i.e. a structural adjustment of more than 0.5 pp of GDP per year is necessary), it is classed as high risk.
*** The S0 indicator reflects up-to-date evidence on the role played by fiscal and financial competitiveness variables in creating potential fiscal risks. The methodology for the S0 indicator differs fundamentally from that for the S1 and S2 indicators. Unlike S1 and S2, S0 is not a quantification of the required fiscal adjustment effort, but a composite indicator which estimates the extent to which there might be a risk of fiscal stress in the short term. The critical threshold for the S0 indicator is 0.43.
: :
23.1 88.918.0 25.8

39
Table VI. Taxation indicators
2002 2006 2008 2010 2011 2012
Total tax revenues (incl. actual compulsory social contributions, % of GDP) 39.3 35.9 37.5 38.1 38.2 39.3
Breakdown by economic function (% of GDP)1
Consumption 10.7 10.1 10.5 10.4 10.6 11.0
of which:
- VAT 5.8 5.8 6.3 6.4 6.7 7.1
- excise duties on tobacco and alcohol 2.0 1.5 1.4 1.3 1.3 1.3
- energy 2.6 2.5 2.5 2.3 2.3 2.3
- other (residual) 0.3 0.3 0.3 0.3 0.3 0.3
Labour employed 14.0 13.3 14.8 15.2 15.4 15.9
Labour non-employed 1.1 1.2 1.3 1.4 1.5 1.5
Capital and business income 10.2 7.8 8.0 8.4 7.9 8.0
Stocks of capital/wealth 3.3 3.4 2.9 2.8 2.8 2.9
p.m. Environmental taxes2 2.8 2.6 2.6 2.4 2.4 2.4
VAT efficiency3
Actual VAT revenues as % of theoretical revenues at standard rate 73.0 89.3 99.5 100.1 106.7 112.1
2. This category comprises taxes on energy, transport and pollution, and resources included in taxes on consumption and capital.
3. The VAT efficiency is measured via the VAT revenue ratio. It is defined as the ratio between the actual VAT revenue collected and the revenue that would be raised if VAT was applied at the standard rate to all final (domestic) consumption expenditures, which is an imperfect measure of the theoretical pure VAT base. A low ratio can indicate a reduction of the tax base due to large exemptions or the application of reduced rates to a wide range of goods and services ('policy gap') or a failure to collect all tax due to e.g. fraud ('collection gap'). It should be noted that the relative size of cross-border shopping compared to domestic consumption also influences the value of the ratio, notably for smaller economies. See European Commission (2012), Tax Reforms in EU Member States and OECD (2012), Consumption tax trends for a more detailed discussion.
Source: Commission
Note: 1. Tax revenues are broken down by economic function, i.e. according to whether taxes are raised on consumption, labour or capital. See European Commission (2014), Taxation trends in the European Union, for a more detailed explanation.

40
Table VII. Financial market indicators
2009 2010 2011 2012 2013
Total assets of the banking sector (% of GDP) 3 139.3 2 681.2 2 634.4 2 242.3 2 010.8
Share of assets of the five largest banks (% of total assets) 29.3 31.1 31.2 33.1 -
Foreign ownership of banking system (% of total assets) 64.7 68.6 68.1 71.5 -
Financial soundness indicators: - non-performing loans (% of total loans)1) 0.7 0.2 0.4 0.1 0.2
- capital adequacy ratio (%) 2) 19.2 17.4 16.4 19.1 19.0
- return on equity (%) 2),3) 11.5 13.0 5.1 10.4 12.0
Bank loans to the private sector (year-on-year % change) -5.3 1.5 1.5 -6.5 -4.8
Lending for house purchase (year-on-year % change) 7.1 8.8 8.9 7.2 6.7
Loan to deposit ratio 66.1 69.0 65.8 60.9 54.9
CB liquidity as % of liabilities 2.2 0.5 1.2 0.9 0.9
Banks' exposure to countries receiving official financial assistance (% of GDP) - - - - -
Private debt (% of GDP) 399.6 339.4 328.1 317.4 -
Gross external debt (% of GDP) - Public 2.9 6.4 6.1 8.2 10.2
- Private 2 963.5 2 423.0 2 644.0 4 127.5 4 488.9
Long term interest rates spread versus Bund (basis points)* 100.7 42.6 31.5 32.7 17.4
Credit default swap spreads for sovereign securities (5-year)* - - - - -
* Measured in basis points.
Notes: 1) Latest data 2013 Q3.2) Latest data 2013 Q2.3) Tier 1 capital.
Source :Bank for International Settlements and Eurostat (exposure to macro-financially vulnerable countries), IMF (financial soundness indicators), Commission (long-term interest rates), World Bank (gross external debt) and ECB (all other indicators).

41
Table VIII. Labour market and social indicators

42
Labour market indicators 2008 2009 2010 2011 2012 2013
Employment rate(% of population aged 20-64) 68.8 70.4 70.7 70.1 71.4 71.1
Employment growth (% change from previous year) 5.0 0.9 1.8 2.9 2.5 1.7
Employment rate of women(% of female population aged 20-64) 60.1 61.5 62.0 61.9 64.1 63.9
Employment rate of men (% of male population aged 20-64) 77.2 79.0 79.2 78.1 78.5 78.0
Employment rate of older workers (% of population aged 55-64) 34.1 38.2 39.6 39.3 41.0 40.5
Part-time employment (% of total employment, 15 years and more) 18.0 18.2 17.9 18.4 19.0 19.2
Part-time employment of women (% of women employment, 15 years and more) 38.3 35.1 36.0 36.1 36.3 36.0
Part-time employment of men (% of men employment, 15 years and more) 2.7 5.6 4.0 4.8 5.4 6.0
Fixed term employment (% of employees with a fixed term contract, 15 years and more) 6.2 7.2 7.1 7.1 7.7 7.1
Transitions from temporary to permanent employment 42.1 42.9 26.0 30.7 32.4 :
Unemployment rate1 (% of labour force, age group 15-74)
4.9 5.1 4.6 4.8 5.1 5.8
Long-term unemployment rate2 (% of labour force) 1.6 1.2 1.3 1.4 1.6 1.8
Youth unemployment rate (% of youth labour force aged 15-24) 17.3 16.5 15.8 16.4 18.0 17.4
Youth NEET rate (% of population aged 15-24) 6.2 5.8 5.1 4.7 5.9 5.0
Early leavers from education and training (% of pop. 18-24 with at most lower sec. educ. and not in further education or training)
13.4 7.7 7.1 6.2 8.1 6.1
Tertiary educational attainment (% of population 30-34 having successfully completed tertiary education)
39.8 46.6 46.1 48.2 49.6 52.5
Formal childcare (from 1 to 29 hours; % over the population less than 3 years) 13.0 22.0 17.0 16.0 21.0 :
Formal childcare (30 hours or over; % over the population less than 3 year) 13.0 12.0 19.0 28.0 27.0 :
Labour productivity per person employed (annual % change) -5.5 -6.4 1.3 -1.0 -2.6 0.4
Hours worked per person employed (annual % change) 0.9 -4.0 0.2 -0.1 -0.5 -1.1
Labour productivity per hour worked (annual % change; constant prices) -6.3 -2.4 1.1 -0.9 -2.1 1.5
Compensation per employee (annual % change; constant prices) 3.0 1.0 -4.2 -1.7 -1.0 -0.6
Nominal unit labour cost growth (annual % change) 9.4 8.7 1.4 3.4 4.7 2.7
Real unit labour cost growth (annual % change) 8.9 7.9 -5.4 -0.7 1.6 -1.0
Notes:
Sources: Commission (EU Labour Force Survey and European National Accounts)
1 Unemployed persons are all persons who were not employed, had actively sought work and were ready to begin working immediately or within two weeks. The labour force is the total number of people employed and unemployed.
2 Long-term unemployed are unemployed persons for at least 12 months.
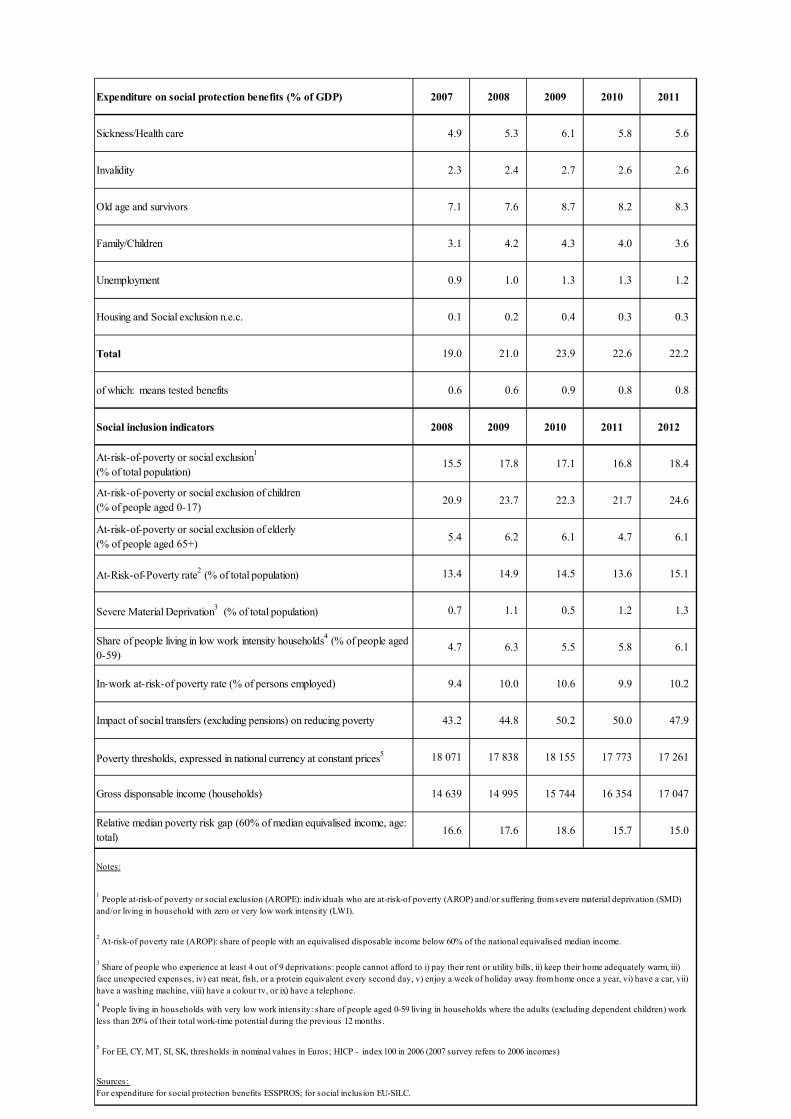
43
Expenditure on social protection benefits (% of GDP) 2007 2008 2009 2010 2011
Sickness/Health care 4.9 5.3 6.1 5.8 5.6
Invalidity 2.3 2.4 2.7 2.6 2.6
Old age and survivors 7.1 7.6 8.7 8.2 8.3
Family/Children 3.1 4.2 4.3 4.0 3.6
Unemployment 0.9 1.0 1.3 1.3 1.2
Housing and Social exclusion n.e.c. 0.1 0.2 0.4 0.3 0.3
Total 19.0 21.0 23.9 22.6 22.2
of which: means tested benefits 0.6 0.6 0.9 0.8 0.8
Social inclusion indicators 2008 2009 2010 2011 2012
At-risk-of-poverty or social exclusion1
(% of total population)15.5 17.8 17.1 16.8 18.4
At-risk-of-poverty or social exclusion of children (% of people aged 0-17) 20.9 23.7 22.3 21.7 24.6
At-risk-of-poverty or social exclusion of elderly (% of people aged 65+) 5.4 6.2 6.1 4.7 6.1
At-Risk-of-Poverty rate2 (% of total population) 13.4 14.9 14.5 13.6 15.1
Severe Material Deprivation3 (% of total population) 0.7 1.1 0.5 1.2 1.3
Share of people living in low work intensity households4 (% of people aged 0-59)
4.7 6.3 5.5 5.8 6.1
In-work at-risk-of poverty rate (% of persons employed) 9.4 10.0 10.6 9.9 10.2
Impact of social transfers (excluding pensions) on reducing poverty 43.2 44.8 50.2 50.0 47.9
Poverty thresholds, expressed in national currency at constant prices5 18 071 17 838 18 155 17 773 17 261
Gross disponsable income (households) 14 639 14 995 15 744 16 354 17 047
Relative median poverty risk gap (60% of median equivalised income, age: total) 16.6 17.6 18.6 15.7 15.0
4 People living in households with very low work intensity: share of people aged 0-59 living in households where the adults (excluding dependent children) work less than 20% of their total work-time potential during the previous 12 months.
5 For EE, CY, MT, SI, SK, thresholds in nominal values in Euros; HICP - index 100 in 2006 (2007 survey refers to 2006 incomes)
Sources: For expenditure for social protection benefits ESSPROS; for social inclusion EU-SILC.
2 At-risk-of poverty rate (AROP): share of people with an equivalised disposable income below 60% of the national equivalised median income.
3 Share of people who experience at least 4 out of 9 deprivations: people cannot afford to i) pay their rent or utility bills, ii) keep their home adequately warm, iii) face unexpected expenses, iv) eat meat, fish, or a protein equivalent every second day, v) enjoy a week of holiday away from home once a year, vi) have a car, vii) have a washing machine, viii) have a colour tv, or ix) have a telephone.
1 People at-risk-of poverty or social exclusion (AROPE): individuals who are at-risk-of poverty (AROP) and/or suffering from severe material deprivation (SMD) and/or living in household with zero or very low work intensity (LWI).
Notes:

44
Table IX. Product market performance and policy indicators
Performance indicators 2004-2008
2009 2010 2011 2012 2013
Labour productivity1 total economy (annual growth in %) 0.0 -6.9 1.5 -1.5 -3.1 0.2
Labour productivity1 in manufacturing (annual growth in %) -3.0 -21.0 10.5 -12.8 4.2 0.8
Labour productivity1 in electricity, gas, water (annual growth in %) -14.7 3.4 -14.2 9.2 -4.5 n.a.
Labour productivity1 in the construction sector (annual growth in %) -1.4 -3.3 1.4 -0.4 0.9 2.8
Patent intensity in manufacturing2 (patents of the EPO divided by gross value added of the sector)
479.5 312.1 256.3 231.9 n.a. n.a.
Policy indicators 2004-2008
2009 2010 2011 2012 2013
Enforcing contracts3 (days) 321.0 321 321 321 321 321
Time to start a business3 (days) 26.0 24 19 19 19 19
R&D expenditure (% of GDP) 1.6 1.7 1.5 n.a. n.a. n.a.
Tertiary educational attainment (% of 30-34 years old population)
35.9 46.6 46.1 48.2 49.6 52.5
Total public expenditure on education (% of GDP)
3.6 n.a. n.a. n.a. n.a. n.a.
2008 2009 2010 2011 2012 2013
Product market regulation4, Overall(Index; 0=not regulated; 6=most regulated)
n.a. n.a. n.a. n.a. n.a. n.a.
Product market regulation4, Retail(Index; 0=not regulated; 6=most regulated)
n.a. n.a. n.a. n.a. n.a. n.a.
Product market regulation4, Network Industries5
(Index; 0=not regulated; 6=most regulated)n.a. n.a. n.a. n.a. n.a. n.a.
Commission, World Bank - Doing Business (for enforcing contracts and time to start a business) and OECD (for the product market regulation indicators).
1Labour productivity is defined as gross value added (in constant prices) divided by the number of persons employed.
Notes:
Source :
2Patent data refer to applications to the European Patent Office (EPO). They are counted according to the year in which they were filed at the EPO. They are broken down according to the inventor's place of residence, using fractional counting if multiple inventors or IPC classes are provided to avoid double counting. 3 The methodologies, including the assumptions, for this indicator are presented in detail on the website http://www.doingbusiness.org/methodology.
4 The methodologies of the product market regulation indicators are presented in detail on the website http://www.oecd.org/document/1/0,3746,en_2649_34323_2367297_1_1_1_1,00.html.
5 Aggregate ETCR.

45
Table X. Green growth 2003-2007
2008 2009 2010 2011 2012 2011 2012
Green Growth performanceMacroeconomic
Energy intensity kgoe / € 0.18 0.16 0.16 0.16 0.16 0.15 0.16 0.15Carbon intensity kg / € 0.48 0.42 0.43 0.43 0.42 n.a. 0.42 n.a.Resource intensity (reciprocal of resource productivity) kg / € 0.44 0.35 0.36 0.36 0.35 n.a. 0.35 n.a.Waste intensity kg / € n.a. 0.33 n.a. 0.37 n.a. n.a. n.a. n.a.Energy balance of trade % GDP -3.6% -4.9% -2.7% -3.6% -4.6% -5% -4.6% -5%Energy weight in HICP % 11 12 11 11 12 12 12 12Difference between change energy price and inflation % 4.8 11.7 -11.9 3.5 6.8 3.9 6.8 3.9Environmental taxes over labour taxes ratio 18.7% 16.5% 15.1% 14.8% 14.4% n.a. 14.4% n.a.Environmental taxes over total taxes ratio 7.6% 7.0% 6.6% 6.4% 6.4% n.a. 6.4% n.a.
Sectoral Industry energy intensity kgoe / € 0.27 0.30 0.33 0.36 301.06 n.a. 301.06 n.a.Share of energy-intensive industries in the economy % GDP 6.5 5.9 4.9 n.a. n.a. n.a. n.a. n.a.Electricity prices for medium-sized industrial users** € / kWh n.a. 0.09 0.11 0.10 0.10 0.10 0.10 0.10Gas prices for medium-sized industrial users*** € / kWh n.a. 0.04 0.04 0.04 0.05 0.05 0.05 0.05Public R&D for energy % GDP n.a. 0.01% 0.01% 0.01% 0.01% 0.01% 0.01% 0.01%Public R&D for the environment % GDP n.a. 0.01% 0.01% 0.01% 0.01% 0.01% 0.01% 0.01%Recycling rate of municipal waste ratio 81.1% 82.4% 82.0% 82.3% 82.3% 82.9% 82.3% 82.9%Share of GHG emissions covered by ETS* % n.a. 17.2% 18.7% 18.4% 16.9% 16.8% 16.9% 16.8%Transport energy intensity kgoe / € 1.07 0.98 0.87 0.89 n.a. n.a. n.a. n.a.Transport carbon intensity kg / € 2.60 2.35 2.06 2.15 n.a. n.a. n.a. n.a.
Security of energy supplyEnergy import dependency % 97.6% 97.4% 97.5% 97.0% 97.2% 97.4% 97.2% 97.4%Diversification of oil import sources HHI n.a. 0.55 0.60 0.56 0.61 n.a. 0.61 n.a.Diversification of energy mix HHI 0.47 0.45 0.46 0.45 0.46 0.46 0.46 0.46Share renewable energy in energy mix % 1.6% 2.9% 2.9% 2.8% 2.7% 3.1% 2.7% 3.1%
Country-specific notes:
The year 2012 is not included in the table due to lack of data.
General explanation of the table items:
Source: Eurostat unless indicated otherwise; ECFIN elaborations indicated below
All macro intensity indicators are expressed as a ratio of a physical quantity to GDP (in 2000 prices)
Energy intensity: gross inland energy consumption (in kgoe) divided by GDP (in EUR)
Carbon intensity: Greenhouse gas emissions (in kg CO2 equivalents) divided by GDP (in EUR)
Resource intensity: Domestic Material Consumption (in kg) divided by GDP (in EUR)
Waste intensity: waste (in kg) divided by GDP (in EUR)
Energy balance of trade: the balance of energy exports and imports, expressed as % of GDP
Energy weight in HICP: the share of the "energy" items in the consumption basket used in the construction of the HICP
Difference between energy price change and inflation: energy component of HICP, and total HICP inflation (annual %-change)
Environmental taxes over labour or total taxes: from DG TAXUD's database "Taxation trends in the European Union"
Industry energy intensity: final energy consumption of industry (in kgoe) divided by gross value added of industry (in 2005 EUR)
Share of energy-intensive industries in the economy: share of gross value added of the energy-intensive industries in GDP
Electricity and gas prices medium industrial users: consumption band 500 - 2000MWh and 10000 - 100000 GJ; figures excl. VAT.
Recycling rate of municipal waste: ratio of municipal waste recycled over total municipal waste
Public R&D for energy or for the environment: government spending on R&D (GBAORD) for these categories as % of GDP
Share of GHG emissions covered by ETS: based on greenhouse gas emissions as reported by Member States to EEA (excl LULUCF)
Transport energy intensity: final energy consumption of transport activity (kgoe) divided by transp industry gross value added (2005 EUR)
Transport carbon intensity: greenhouse gas emissions in transport activity divided by gross value added of the transport sector
Energy import dependency: net energy imports divided by gross inland energy consumption incl. energy consumption international bunkers
Diversification of oil import sources: Herfindahl index (HHI), calculated as the sum of the squared market shares of countries of origin
Diversification of the energy mix: Herfindahl Index over natural gas, total petrol products, nuclear heat, renewable energies and solid fuels
Share renewable energy in energy mix: %-share in gross inland energy consumption, expressed in tonne oil equivalents
* Commission and EEA.
** For 2007 average of S1 & S2 for DE, HR, LU, NL, FI, SE & UK. Other countries only have S2.
*** For 2007 average of S1 & S2 for HR, IT, NL, FI, SE & UK. Other countries only have S2.
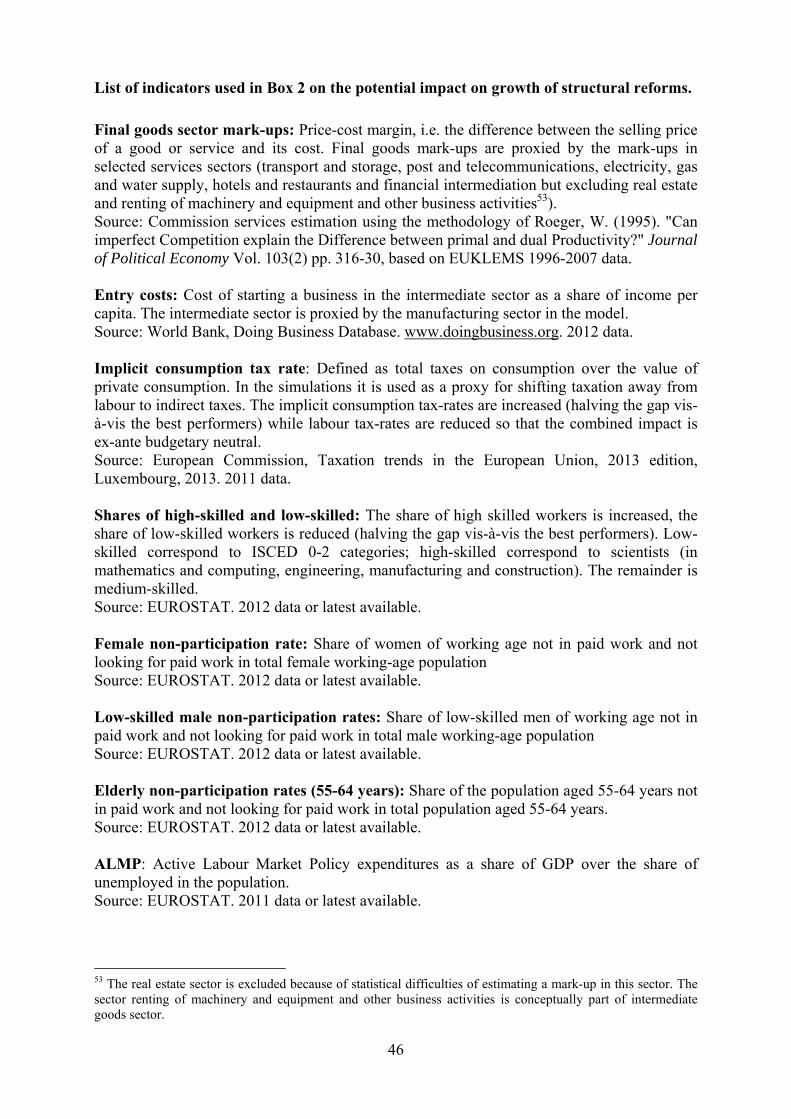
46
List of indicators used in Box 2 on the potential impact on growth of structural reforms. Final goods sector mark-ups: Price-cost margin, i.e. the difference between the selling price of a good or service and its cost. Final goods mark-ups are proxied by the mark-ups in selected services sectors (transport and storage, post and telecommunications, electricity, gas and water supply, hotels and restaurants and financial intermediation but excluding real estate and renting of machinery and equipment and other business activities53). Source: Commission services estimation using the methodology of Roeger, W. (1995). "Can imperfect Competition explain the Difference between primal and dual Productivity?" Journal of Political Economy Vol. 103(2) pp. 316-30, based on EUKLEMS 1996-2007 data. Entry costs: Cost of starting a business in the intermediate sector as a share of income per capita. The intermediate sector is proxied by the manufacturing sector in the model. Source: World Bank, Doing Business Database. www.doingbusiness.org. 2012 data. Implicit consumption tax rate: Defined as total taxes on consumption over the value of private consumption. In the simulations it is used as a proxy for shifting taxation away from labour to indirect taxes. The implicit consumption tax-rates are increased (halving the gap vis-à-vis the best performers) while labour tax-rates are reduced so that the combined impact is ex-ante budgetary neutral. Source: European Commission, Taxation trends in the European Union, 2013 edition, Luxembourg, 2013. 2011 data. Shares of high-skilled and low-skilled: The share of high skilled workers is increased, the share of low-skilled workers is reduced (halving the gap vis-à-vis the best performers). Low-skilled correspond to ISCED 0-2 categories; high-skilled correspond to scientists (in mathematics and computing, engineering, manufacturing and construction). The remainder is medium-skilled. Source: EUROSTAT. 2012 data or latest available. Female non-participation rate: Share of women of working age not in paid work and not looking for paid work in total female working-age population Source: EUROSTAT. 2012 data or latest available. Low-skilled male non-participation rates: Share of low-skilled men of working age not in paid work and not looking for paid work in total male working-age population Source: EUROSTAT. 2012 data or latest available. Elderly non-participation rates (55-64 years): Share of the population aged 55-64 years not in paid work and not looking for paid work in total population aged 55-64 years. Source: EUROSTAT. 2012 data or latest available. ALMP: Active Labour Market Policy expenditures as a share of GDP over the share of unemployed in the population. Source: EUROSTAT. 2011 data or latest available.
53 The real estate sector is excluded because of statistical difficulties of estimating a mark-up in this sector. The sector renting of machinery and equipment and other business activities is conceptually part of intermediate goods sector.

47
Benefit replacement rate: Share of a worker's pre-unemployment income that is paid out by the unemployment insurance scheme. Average of net replacement rates over 60 months of unemployment. Source: OECD, Benefits and Wages Statistics. www.oecd.org/els/benefitsandwagesstatistics.htm. 2012 data.