Embed Size (px)
Citation preview
COMMISSION OF THE EUROPEAN COMMUNITIES
Brussels, 10.3.2003SEC(2003) 288
&200,66,21�67$))�:25.,1*�3$3(5
��WK�5(3257�2)7+(�6&,(17,),&��7(&+1,&$/�$1'�(&2120,&
&200,77((�)25�),6+(5,(6
%UXVVHOV��������$SULO������
7$%/(�2)�&217(176
�� ,1752'8&7,21 ��������������������������������������������������������������������������������������������������������������������������
1.1 LIST OF PARTICIPANTS .................................................................................................................11.2 TERMS OF REFERENCE.................................................................................................................21.3 INSTITUTIONAL ASPECTS AND INFORMATION FROM THE COMMISSION .........................................3
����� 6WDWH�RI�SOD\�RI�UHIRUP�RI�&)3 ������������������������������������������������������������������������������������������������ 67(&)�FRPPHQW ����������������������������������������������������������������������������������������������������������������
�� 6*51�5(3257�21�7+(�(9$/8$7,21�2)�1$7,21$/�352*5$00(668%0,77('�:,7+,1�7+(�)5$0(:25.�2)�&281&,/�5(*8/$7,21����������������0$5&+������� ����������������������������������������������������������������������������������������������������������������������������������������
�� '(),1,7,21�2)�'$7$%$6(�81'(5�7+(�&20081,7<�352*5$00(�21�'$7$&2//(&7,21 ����������������������������������������������������������������������������������������������������������������������������������������
�� 6*%5(�:25.,1*�*5283�5(3257�2)�7+,5'�0((7,1*�21�)2//2:�83�2)0$*3,9���������129(0%(5������� ��������������������������������������������������������������������������������������������������
1.4 MAIN FINDINGS OF THE THIRD MEETING OF THE EXPERT GROUP ................................................8����� &DVH�VWXGLHV�RQ�WKH�UHODWLRQVKLS�EHWZHHQ�FDSDFLW\��HIIRUW�DQG�ILVKLQJ�PRUWDOLW\� ��������������
1.4.1.1 The Demersal trawl fleet of Palma de Mallorca..........................................................................81.4.1.2 Fleets in the Adriatic...................................................................................................................81.4.1.3 The western Mediterranean trawl fleets ......................................................................................81.4.1.4 Trends in fishing power on bio-economics in the North Sea flatfish fishery. .............................81.4.1.5 The relationships between fishing capacity, fishing effort and fishing mortality for fleets fromThe Netherlands, Denmark, France and the UK.........................................................................................9
����� 'HFRPPLVVLRQLQJ�DQG�HIILFLHQF\��������������������������������������������������������������������������������������������� 5HYLHZ�RI�GLIIHUHQW�LQVWUXPHQWV�WR�PDQDJH�FDSDFLW\�������������������������������������������������������������� 5HYLHZ�RI�ELR�HFRQRPLF�PRGHOV�IRU�WKH�PDQDJHPHQW�RI�ILVKLQJ�FDSDFLW\�������������������������
1.5 STECF COMMENTS...................................................................................................................12
�� 6*)(1�5(3257�6(&����������21�,1&,'(17$/�&$7&+(6�2)�&(7$&($16�������'(&(0%(5������ ���������������������������������������������������������������������������������������������������������������������������������
1.6 BACKGROUND ...........................................................................................................................121.7 STECF COMMENTS ON THE REPORT OF THE SUBGROUP ON FISHERY AND ENVIRONMENT ON
INCIDENTAL CATCHES OF SMALL CETACEANS ....................................................................................13����� 5HYLHZ�RI�H[LVWLQJ�GDWD�DQG�LQIRUPDWLRQ�RQ�VPDOO�FHWDFHDQ�E\FDWFK�UDWHV��SRSXODWLRQDEXQGDQFH�HVWLPDWHV�DQG�PHWKRGV�XVHG�WR�VHW�E\FDWFK�OLPLWV� ������������������������������������������������������������� %\FDWFK�OLPLWV�E\�UHOHYDQW�VSHFLHV�DQG�DUHD� ������������������������������������������������������������������������� 5DQNLQJ�ILVKHULHV�DFFRUGLQJ�WR�WKHLU�ULVN�RU�WKUHDW�WR�VPDOO�FHWDFHDQV���������������������������������� 0HWKRGV�WR�PLWLJDWH�E\�FDWFK�RI�VPDOO�FHWDFHDQV��������������������������������������������������������������
1.7.4.1 Methods of mitigating cetacean by-catch..................................................................................151.7.4.2 Mitigation measures currently in use .................................................................................... ....15
1.8 FURTHER RESEARCH NEEDS ......................................................................................................161.9 CONCLUSIONS AND RECOMMENDATIONS ..................................................................................161.10 DRAFT TERMS OF REFERENCE FOR A MEETING OF THE SUBGROUP ON FISHERIES AND THE
ENVIRONMENT (SGFEN) IN 2002 TO FURTHER CONSIDER THE TOPIC OF INCIDENTAL BYCATCH OF
SMALL CETACEANS. ............................................................................................................................17
�� 6*%5(�5(3257�21�)/((76�'<1$0,&��������)(%58$5<������ ���������������������������������
�� +$.(�$1'�&2'��5(&29(5<��3/$16 ����������������������������������������������������������������������������������
1.11 EVALUATION OF RECOVERY PLANS......................................................................................181.12 ECONOMIC CONSIDERATIONS................................................................................................191.13 CRITERIA FOR CHOOSING BETWEEN SCENARIOS ....................................................................191.14 COMMENT ON PARTICULAR STOCKS:....................................................................................21
������ 1RUWKHUQ�KDNH ������������������������������������������������������������������������������������������������������������������������� 1RUWK�6HD�&RG�������������������������������������������������������������������������������������������������������������������
1.14.2.1 General conclusions.............................................................................................................22������ &RG�LQ�.DWWHJDW �����������������������������������������������������������������������������������������������������������������
1.14.3.1 SSB based scenarios ............................................................................................................22
1.14.3.2 F based scenarios.................................................................................................................231.14.3.3 Other comments...................................................................................................................231.14.3.4 Conclusions .........................................................................................................................23
������ ,ULVK�6HD�&RG���������������������������������������������������������������������������������������������������������������������1.14.4.1 General comments ...............................................................................................................231.14.4.2 SSB controlled scenarios.....................................................................................................241.14.4.3 F controlled scenarios..........................................................................................................24
������ :HVW�RI�6FRWODQG�&RG ��������������������������������������������������������������������������������������������������������1.14.5.1 General comments ...............................................................................................................241.14.5.2 Biomass-controlled scenarios ..............................................................................................241.14.5.3 Fishing mortality controlled scenarios.................................................................................24
�� (&2120,&�,17(535(7$7,21�2)�7+(�7$&6�),;('�)25����� ����������������������������������
�� 0,;('�),6+(5,(6�,1�$7/$17,&��1257+�6($�$1'�%$/7,&�:$7(56���������������������
1.15 REQUIREMENTS FOR 2002 ....................................................................................................291.16 DEVELOPMENTS FOR THE MEDIUM TERM (2003 ONWARDS).................................................291.17 SOFTWARE............................................................................................................................291.18 DATA NEEDS ........................................................................................................................291.19 ANALYSIS RESOURCES ..........................................................................................................30
��� 7+(�(&2120,&�,17(535(7$7,21�2)�$&)0�$'9,&(��(,$$�02'(/��$1'35(3$5$7,21�2)�7+(�$(5� �����������������������������������������������������������������������������������������������������������
1.20 ANTICIPATED PROCEDURE AND TIME SCHEDULE...................................................................311.21 SPECIFICATION OF THE BIOLOGICAL DATA REQUIRED FOR THE EIAA MODEL........................31
��� 6&,(17,),&�$'9,&(�$1'�52/(�2)��7+(�6&,(17,),&��7(&+1,&$/�$1'(&2120,&�&200,77((�)25�),6+(5,(6��67(&)��,1�7+(�)8785(�&20021),6+(5,(6�32/,&<��&)3� �����������������������������������������������������������������������������������������������������������������
1.22 INTRODUCTION. ....................................................................................................................311.23 THE ROLE OF STECF BASED ON THE COMMISSION DECISION 93/619/EC .............................321.24 THE PRESENT WORK ORGANIZATION OF THE STECF ............................................................33
������ 6XE�*URXS�WR�UHYLHZ�VFLHQWLILF�DGYLFH�RQ�VWRFNV�RI�UHOHYDQFH�WR�WKH�&)3��6*567���������������� 6XE�*URXS�RQ�)LVKHULHV�DQG�WKH�(QYLURQPHQW��6*)(1��������������������������������������������������������� 6XE�*URXS�RQ�(FRQRPLF�$VVHVVPHQW��6*(&$����������������������������������������������������������������������� 6XE�*URXS�RQ�0DQDJHPHQW�2EMHFWLYHV�DQG�6WUDWHJLHV��6*026������������������������������������������� 6XE�*URXS�RQ�5HVHDUFK�1HHGV��6*51����������������������������������������������������������������������������������� 6XE�*URXS�RQ�%DODQFH�EHWZHHQ�5HVRXUFH�DQG�WKHLU�([SORLWDWLRQ��6*%5(� �������������������������� 6XE�*URXS�RQ�WKH�0HGLWHUUDQHDQ�6HD��6*0('� ������������������������������������������������������������������� $G�KRF�6XE�*URXS�RQ�0DFNHUHO��6*0$&������������������������������������������������������������������������
1.25 COMMENTS ON THE PRESENT ROLE OF STECF .....................................................................361.26 GENERAL COMMENTS ON THE FUTURE ROLE OF STECF .......................................................37
��� 6&,(17,),&�,1)250$7,21�2)�7+(�,03$&7�21�),6+�5(6285&(6�2)'(52*$725<�),6+(5,(6�:,7+�³*$1*8,´�,1�7+(�0(',7(55$1($1���������������������������
��� 5(9,(:�21�7+(�,&(6�&200(176��21�3/$,&(�,1�6.$*(55$.�$1'.$77(*$7���62/(�,1�',9,6,21�9,,,$%����������������������������������������������������������������������������������������
1.27 SOLE IN DIVISIONS VIIIAB (BAY OF BISCAY)........................................................................391.28 PLAICE IN DIVISION IIIA (SKAGERRAK AND KATTEGAT) ......................................................39
��� 27+(5�0$77(56����������������������������������������������������������������������������������������������������������������������
1.29 SOCIO ECONOMIC INDICATORS..............................................................................................40������ 7KH�GHILQLWLRQ�RI�WKH�JHRJUDSKLFDO�DUHDV �������������������������������������������������������������������������������� 7KH�GHILQLWLRQ�RI�IOHHW�VHJPHQWV����������������������������������������������������������������������������������������������� 7KH�GHILQLWLRQ�RI�EDVLF�LQGLFDWRUV�DQG�GDWD�QHHGV�������������������������������������������������������������
1.29.3.1 National level indicators......................................................................................................421.29.3.2 Indicators by fleet segments (National, regional or local level)...........................................42
1.30 RECOVERY PLANS ................................................................................................................43������ +DNH�5HFRYHU\�3ODQ��*DOLFLDQ�5HJLRQ�UHTXHVW� ���������������������������������������������������������������
1.31 ECONOMIC ASPECTS OF EU FISHERIES ..................................................................................44������ &RPPHQWV�E\�67(&)�DQG�IROORZLQJ�GLVFXVVLRQ����������������������������������������������������������������
1.32 STECF ACTIVITIES AND PLANNING OF MEETINGS FOR 2002 ..............................................46

��� $33(1',;������3$57,&,3$176�/,67��������������������������������������������������������������������������������������
��� $33(1',;����'$7$%$6(����������������������������������������������������������������������������������������������������������
��� $33(1',;���(;(&87,9(�6800$5<�2)�0((7,1*6�21�)2//2:�83�2)�0$*3,9���������������������������������������������������������������������������������������������������������������������������������������������������������
��� $33(1',;���7+(�327(17,$/�(&2120,&�,03$&7�2)�7$&6�352326('�%<$&)0�)25�����������������������������������������������������������������������������������������������������������������������������������������
��� $33(1',;�����$11(;�,�72�62&,2�(&2120,&�,1',&$7256 ��������������������������������������
��� $33(1',;����$11(;��,,�72�62&,2�(&2120,&�,1',&$7256�������������������������������������
1
��� ,1752'8&7,21
STECF met at the Conference Centre “Albert Borschette” in Brussels from 22 to 26April 2002.
The Chairman of STECF, Mr Alberto Gonzalez Garces, opened the plenary session at14.30.
The Secretariat of STECF welcomed the participants wishing them success in theirdeliberations.
The terms of reference for the meeting were surveyed and briefly discussed to arrangethe details of the meeting. The session was managed through alternation of plenaryand working groups meetings.
���� /,67�2)�3$57,&,3$176
The complete address of the participants is listed in Appendix I.
0HPEHUV�RI�WKH�67(&)�
Ardizzone,G. Domenico
Arrhenius, Fredrik
Camiñas, Juan Antonio
Casey, John
Cornus, Hans-Peter
Di Natale, Antonio
Eltink, Guus
Ernst, Peter
Franquesa, Ramon
Gonzalez, Garces Alberto (Chairman)
Gustavsson, Tore
Keatinge, Michael
Lokkegaard, Jorgen
Messina, Gaetano
Moguedet, Philippe
Munch-Petersen, Sten
Officer, Rick
Perraudeau, Yves
Pestana, Graça
Polet, Hans
Salminen, Matti
Simmonds, John
Smit, Jos
Virtanen, Jarno
,QYLWHG�H[SHUWV�
Verver, Sieto W. (items 1 and 2).
Dalskov, Jorgen (items 1 and 2)
De Cardenas, Enrique (items 1 and 2)
Demaré, Wim
Hatcher, Aaron
Lassen, Hans (items 1 and 2)
Sabatella, Evelina (items 1 and 2)
67(&)�6HFUHWDULDW�
Biagi, Franco
Pertierra, Juan Pablo

2
���� 7(506�2)�5()(5(1&(
STECF was asked to address the following issues:
�� 7R�UHYLHZ�DQG��DV�DSSURSULDWH�FRPPHQW�RQ�WKH�6*51�UHSRUW�RQ�WKH�HYDOXDWLRQ�RIQDWLRQDO� SURJUDPPHV� VXEPLWWHG� ZLWKLQ� WKH� IUDPHZRUN� RI� &RXQFLO� 5HJXODWLRQ����������������0DUFK�������
In the light of the evaluation of the national programmes and in order to improve the qualityof these programmes, STECF is requested to define a standard format for the presentation ofnational programmes.
�� 6XE�JURXS�PHHWLQJ�IRU�WKH�GHILQLWLRQ�RI�GDWDEDVH�DQG�UHODWHG�V\VWHPV�WR�KROG�WKHLQIRUPDWLRQ�UHTXLUHG�XQGHU�WKH�&RPPXQLW\�SURJUDPPH�RQ�GDWD�FROOHFWLRQ�DQG�WRVXSSRUW� DFFHVV� E\� WKH� &RPPLVVLRQ� DQG�� ZKHUH� DSSURSULDWH�� DXWKRULVHGUHSUHVHQWDWLYHV�IURP�RWKHU�0HPEHU�6WDWHV�
Following the adoption of Commission Regulation 1639/2001, it is necessary to define thestructure of the Community database to hold the data for each Member States from theirminimum and extended programmes and their transfer protocols (Articles 9, 10 and 11).
�� 7R�UHYLHZ�DQG�FRPPHQW�DV�DSSURSULDWH�RQ� WKH�6*%5(�ZRUNLQJ�JURXS�UHSRUW�RIWKLUG�PHHWLQJ�RQ�IROORZ�XS�RI�0$*3,9���������1RYHPEHU�������
The SGBRE working group was convened on November 2001. It was the last of threeplanned meetings to provide the Commission with updated scientific background to define astrategy for the follow up of MAGPIV.
�� 7R� UHYLHZ� DQG� FRPPHQW� DV� DSSURSULDWH� RQ� WKH� 6*)(1� UHSRUW� RQ� LQFLGHQWDOFDWFKHV�RI�&HWDFHDQV��������'HFHPEHU������
�� 7R�UHYLHZ�DQG�FRPPHQW�DV�DSSURSULDWH�RQ� WKH�6*%5(�UHSRUW�RQ� IOHHWV�G\QDPLF�������)HEUXDU\������
�� +DNH� DQG� FRG� � UHFRYHU\� � SODQV�� 67(&)� LV� UHTXHVWHG� WR� DGYLVH� RQ� DSSURSULDWHKDUYHVW�VWUDWHJLHV�IRU�FRG�DQG�KDNH�VWRFNV�VXEMHFW�WR�UHFRYHU\�SODQV��EDVHG�RQ�WKHUHSRUW� RI� WKH� 6*567� PHHWLQJ� RQ� (YDOXDWLRQ� RI� 5HFRYHU\� 3ODQV� ������� 0DUFK������� DQG� WKH� UHSRUW� RI� WKH� WZR�GD\�PHHWLQJ� RI� VFLHQWLVWV� IURP�1RUZD\�DQG� WKH&RPPXQLW\�RQ�WKH�HYDOXDWLRQ�RI�KDUYHVW�FRQWURO�UXOHV�IRU�1RUWK�6HD�FRG�
�� (FRQRPLF�LQWHUSUHWDWLRQ�RI�WKH�7$&V�IL[HG�IRU�����
STECF is requested to provide the evaluation of the economic impact of the fishingopportunities established for 2002
�� 0L[HG�ILVKHULHV�LQ�$WODQWLF��1RUWK�6HD�DQG�%DOWLF�ZDWHUV
At the December Fisheries Council the following Declaration was made :
"The Council and the Commission agree to further develop the scientific basis formanagement that takes appropriate account of the mixed nature of the fisheries, through theprovision of data on as fine a scale as possible, preferably at the level of the fishingoperation. These data should be examined at technical meetings to take place during 2002."
The Commission will make a brief presentation on this topic, and STECF will be invited toexplore ways to address this topic for the Baltic and North-East Atlantic areas.
3
�� 7KH�(FRQRPLF�,QWHUSUHWDWLRQ�RI�$&)0�$GYLFH��(,$$�PRGHO��DQG�SUHSDUDWLRQ�RIWKH�$(5�
STECF is requested to set up a suitable arrangement between biologists and economists toprepare both the report on the EIAA model for 2003 and the annual economic report.
��� 6FLHQWLILF�DGYLFH�DQG�UROH�RI�67(&)STECF is requested to reflect on its role and working procedures and to identify problemareas in the provision of fisheries advice. The Commission services will assist in thisprocess.
��� 7R� UHYLHZ� WKH� VFLHQWLILF� LQIRUPDWLRQ� RI� WKH� LPSDFW� RQ� ILVK� UHVRXUFHV� RI� FHUWDLQGHURJDWRU\�ILVKHULHV�LQ�WKH�0HGLWHUUDQHDQ�
Article 3(1) of Regulation 1626/94 prohibits, from 1st January 2003, the use of “gangui”.
France has been asked to submit, not later than the 10th of April, scientific information onthe effect on the resources and environment of the fishing activities carried out with the“gangui” . Depending on the information submitted, STECF may be requested to evaluate,inter alia, the consequences in conservation terms of fisheries of this type.
���67(&)�LV�UHTXHVWHG�WR�UHYLHZ�DQG��DV�DSSURSULDWH�FRPPHQW�RQ�WKH�UHVSRQVH�IURP�,&(6�RQ3ODLFH�LQ�6NDJHUUDN�DQG�.DWWHJDW���6ROH�LQ�'LYLVLRQ�9,,,DE�
The Council and the Commission at the Council meeting in December 2001 jointly made thefollowing declaration concerning reviews : �3ODLFH� LQ� 6NDJHUUDN� DQG� .DWWHJDW�� +HUULQJ� LQ9,,JKMN��6ROH�LQ�'LYLVLRQ�9,,,DE�DQG�1RUWKHUQ�+DNH
The Council and the Commission agree to seek further scientific advice from ICES and STECF onthe state of the stock and appropriate catches for 2002 for the stock of plaice in Skagerrak andKattegat, herring in VIIghjk, sole in ICES division VIIIab and northern hake".
Within the above context the Commission in January this year requested ICES to evaluate any newrelevant information concerning the state of the stocks of plaice in the Skagerrak and Kattegat and toreview the catch advice provided for the year 2002.
In response to the request ICES has sent the enclosed report.
���2WKHU�PDWWHUV��1) Socio economic indicators
2) Recovery plans: Galicia, Sicily, Andalusia
3) Economic aspects of EU fisheries
���� ,167,787,21$/�$63(&76�$1'�,1)250$7,21�)520�7+(�&200,66,21
������ 6WDWH�RI�SOD\�RI�UHIRUP�RI�&)3
Mr John Farnell, Director in charge of DG-FISH Conservation Policy Directorate(Directorate A), welcomed the participants and briefed STECF on the reform of CFP.
Mr Farnell drew the attention on the fact that the present fishery policy has not beencompletely successful in promoting sustainable fisheries as demonstrated both by the badconservation status of several stocks and poor economic performance of several fisheries. Inseveral fisheries, only the huge increase of fish prices, that is not necessarily an indicator ofgood wealth for an economic system, have allowed fishing industry to be profitable, so far.
The entire fishing system is in the crossroads and need to be adequately reformed to promoteresponsible fisheries for a sustainable development.
4
The Commission is on the way to issue a roadmap communication where actions andobjectives that must be achieved with the reform are underlined (i.e. sustainable fisheriesmore based on long term strategic management, stakeholders much closer to the decision-making process, a greater integration of environmental concern into sectoral policy and needof improvement of the current scientific advice framework) .
A first package of proposals including the new basic regulation, the fleet policy regulation,an action plan on integration of environmental concern into fishery policy and an actionplan on IUU fisheries, will be delivered soon.
Other policies and communications regarding, namely, the revision of CFP in theMediterranean, the aquaculture policy, the fishery agreements and community role in theRFOs, the improvement of the scientific advice and strengthening of control will be issuedin a second package coming soon in Summer.
An other important aspect at stake is the role played by the CFP in promoting co-operationand building capacity through its fishing agreements with non EU Countries.
Mr Farnell underlined the fact that, in front of more and more painful management decisionsthat need to be taken, the scientific advice behind the Commission’s proposals will gounder a more and more severe and critical scrutiny from the part of all the interested Parties.The more we move toward a multi-annual management approach, as the basic tool, the morethe scientific advice need to be robust.
Unfortunately, although fishery policy is very research dependent, small resources have beenmade available for fisheries research in the 6th framework programme.
Therefore, both community and national Administrations need to invest more on scientificinvestigation, both on data collection and, primarily, on the analysis and formulation ofscientific advice.
The Commission, in its communication on scientific advice, will put forward operationalproposals on how to improve the overall framework of producing scientific advice.
Within that context the role of the STECF will be adequately outlined.
������ 67(&)�FRPPHQW
STECF welcomed Mr Farnell’s presentation, but several comments were raised to underlinethat the foreseen increase of more robust scientific advice happens in a context in which,both at national and community level, there is a diminishing effort to support fisheryscience.
STECF commented that the current Community support, both in terms of financial andhuman resources, to the STECF activities is not compatible with a continuing increasingrequest of good scientific advice. All the STECF members are trying to do as much aspossible to assist the Commission but there are growing doubts on the way forward if thingsare not adequately modified.
STECF underlined also that, due to recent changes in the career evaluation and progression,assistance to advisory committees and working groups is not rewarding and even it is havingopposite effect.
STECF pointed out that the Commission should raise awareness of the above problemswithin member States Administrations, highlighting the mismatching between the need ofrobust scientific advice and available scientific human resources.
5
��� 6*51�5(3257�21�7+(�(9$/8$7,21�2)�1$7,21$/�352*5$00(6�68%0,77('�:,7+,1
7+(�)5$0(:25.�2)�&281&,/�5(*8/$7,21�����������������0$5&+�������
The SGRN report ( SEC(2002)438) was presented to STECF during the plenary meeting.This report does not cover the economic data. In this SGRN report general comments weredone on the following points :
• mis-interpretations, poor translation, and mistakes
• Precision level
• Sampling levels for length and age – Indications of under- and over-sampling
• Discards
• Review of survey priorities
• Small scale fisheries (<10m)
• Recreational and game fisheries
• International co-operation and co-ordination
• Issues for the 2003 Review of the Regulation
Previous analysis of the National Programmes was conducted by a Consultant. Theconsultant report pointed out in the National Programmes implicit and/or explicitderogations to the Regulation for Data Collection. So, the STECF was asked by theCommission to analyse these derogations. The STECF conducted the analysis Country byCountry following the four following item of the Regulation for Data Collection :
� Section E (Collection of data related to catches and landings)
� Section F (Collection of data concerning the catches per unit of effort and/oreffective effort of specific commercial fleets)
� Section G (Eligibility of the scientific evaluation surveys of stocks)
� Section H and I (Biological Sampling of the catches by age and length; otherbiological samplings)
Implicit and/or explicit derogations presented in the National Programmes were accepted bythe STECF, in some cases considering that, as 2002 was the first year of the start for theData Collection Regulation, the Members States could improve their National Programmesin 2003. Then, the SGRN Working Group concluded that all National Programmescomplied the Data Collection Regulation for 2002.
The report was firstly approved by correspondence and then presented during the STECFplenary meeting and endorsed by the Committee.
Furthermore, STECF points out difficulties related to the data collection on large pelagicspecies. This problem has been recently discussed in the GFCM/ICCAT Expert Meeting onLarge Pelagic Species in Malta (15-19 April 2002).
The general problem for most large pelagic species is due to the peculiarity of the fishery,which required specific designed samplings and surveys at sea, because there are no regularlandings, the biological data could be quite difficult to get in a large number (fishes are oftenlanded gutted or they are gutted only on the retail markets; the cost to buy samples is high)and fishing vessels are highly migratory, sometimes landing abroad. These problems shouldbe more focally addressed in the National Programmes of all the Member States concerned.
Also, in the most recent years, the practice to bring most of the tuna purse-seine catchesthroughout floating cages to fattening farms (some times placed in other country nationalwaters different from the flag State of the fishing vessels) heavily deteriorated the bluefintuna statistical data on catches and size frequencies in the Mediterranean Sea. The problemin now well documented and requires special and expensive techniques to be even partially

6
solved. Pilot studies on the tuna purse-seine fishery and transfers to the cages should benecessary among the most interested Countries, possibly within an international co-operation framework, to fulfil the ICCAT obligations and the EC regulations. Due to thelack of any reference about this problem in all the National Programmes of the MemberStates concerned, STECF recommends an intervention of both the Commission and theMember States to face the situation, due to the high economical interest of this fishery andto the delicate state of the stock. An improvement of the actual situation could be quiteuseful even for the fishery sector concerned.
The STECF was requested by the Commission to define a standard format for thepresentation of National Programmes. STECF considered that is was primarily anadministrative matter and therefore a task best completed by the Commission. However,STECF considered that the ability of the Committee to complete its scientific evaluation ofthe National Programmes would be better facilitated by presentation of the Programmes in astandard format. STECF further considered that the its ability to complete a scientificevaluation of National Programmes would be best facilitated by a standard presentation ofplans for National Programmes as well as annual reports of activity conducted under eachProgramme.
STECF recommended that the Commission proceed with preparation of draft standardformats for presentation of:
• Plans for National Programmes, and,
• Annual activity reports.
STECF suggested that the advice of the consultants engaged to evaluate the 2000 NationalProgrammes should be used in the preparation of these drafts. STECF considered thatstandard formats for presentation of National Programmes were unlikely to be availableprior to the May 2002 submission date of 2003 National Programmes. STECF thereforesuggested that draft standard formats should be reviewed at the November 2002 plenarymeeting of STECF and VXEVHTXHQWO\�DGRSWHG by Member States for the 2003 submissionsof their 2004 National Programmes, and Reports of Activity under the 2002 NationalProgrammes.
STECF recommended that a term of reference for the November 2002 plenary be anevaluation of draft standard formats for presentation of:
♦ Plans for National Programmes, and,
♦ Annual activity reports.
��� '(),1,7,21� 2)� '$7$%$6(� 81'(5� 7+(� &20081,7<� 352*5$00(� 21� '$7$
&2//(&7,21
A joint working group between STECF members and invited experts has addressed the issueof the definition of database and related systems to hold the information required under theCommunity programme on data collection and to support access by the Commission and,where appropriate, authorised representatives from other Member States.
The report of the working group “Communicating Aggregated data Collected under the DataCollection regulation” (Appendix 2), which includes at the end a proposal for call for tender,was endorsed by the Committee.
7
��� 6*%5(�:25.,1*�*5283�5(3257�2)�7+,5'�0((7,1*�21�)2//2:�83�2)�0$*3,9��������129(0%(5�������
The last in the series of three meetings of the STECF-SGBRE Expert Working Groupconvened to advise the Commission on the Scientific basis for a follow-up to MAGP IVtook place in Brussels from 19-23 November 2001. The series of meetings were set up toattempt to provide answers to the following questions.:
1. Has there been a direct clear link between fishing capacity (however it is measured) anddeployed fishing effort (however it is measured) in the past?
2. Are there clear examples where various levels of deployed fishing effort can be relatedto observed exploitation rates?
3. To what extent have other factors (technological improvements, environmental changesbiological interactions or economic factors) affected such relationships.
4. How does fleet capacity grow and decrease? What are the main factors that explain fleetdynamics?
5. Which managerial models can be used to administer fishing capacity in an efficient way?
At its first two meetings, (SEC(2001)177 and SEC(2001)1194), the Expert Group reviewedexisting literature and case studies on the relationships between fleet capacity, deployedfishing effort and observed exploitation rates and in addition, carried out originalinvestigations, using data for specific fishing fleets in the north-east Atlantic andMediterranean. Taking into account the findings in the first two meeting reports, the termsof reference for the third meeting were modified in an attempt to focus the Group’s attentionon specific issues.
The Terms of Reference for the third meeting were as follows:
1. Review the reports of the first two meetings and summarise the findings on therelationship between capacity, fishing effort and fishing mortality.
2. Wherever possible, provide further examples of the above relationships with regard tofisheries and areas not yet addressed by the group.
3. Describe the relationships above in relation to hake and cod stocks in the north-eastAtlantic.
4. Describe in more detail the pros and cons of the various alternative management models(VHQVX instruments) using both observations and theory.
5. Review existing different bio-economic models, discuss and identify which are mostsuitable and applicable for evaluating the management of fleet capacity.
6. Consider the options to evaluating the effectiveness of different capacity managementinstruments or combinations using one or more of the existing bio-economic models.
STECF reviewed the report SEC(2003)74 of the third meeting noting that in addition toaddressing additional case studies on the relationship between capacity, effort and fishingmortality, the Expert Group had spent considerable effort in providing reviews on the bio-economic models for the management of capacity and proposed an original approach whichpermits an evaluation of economic sustainability and economic overcapacity.
8
���� 0$,1�),1',1*6�2)�7+(�7+,5'�0((7,1*�2)�7+(�(;3(57�*5283
������ &DVH� VWXGLHV� RQ� WKH� UHODWLRQVKLS� EHWZHHQ� FDSDFLW\�� HIIRUW� DQG� ILVKLQJPRUWDOLW\�
�������� 7KH�'HPHUVDO�WUDZO�IOHHW�RI�3DOPD�GH�0DOORUFD
For the Palma de Mallorca trawl fleet a strong direct relationships between effort expressedas days fishing and capacity expressed as landed weight (an output measure) wasdemonstrated.
�������� )OHHWV�LQ�WKH�$GULDWLF
Three fleets in the central and northern Adriatic Sea were examined.
• The mid-water pair trawl fleet for small pelagic fishes (sardines and anchovies),
• The rapido trawl fleet for common sole (6ROHD�YXOJDULV)
• The small-scale fishery for common sole using gillnets.
For the mid-water pair trawl fleet exploiting sardine and anchovy, there is a weakrelationship between fishing effort and fishing mortality for both species.
For the rapido trawl fleet, a highly significant correlation was found between fishingcapacity (kW, GRT and number of vessels) and fishing activity expressed as total fishingdays at sea. In addition, the relationship between fishing capacity in terms of overall kW andGRT and the effective fishing effort standardised as days at sea x kW or GRT also washighly significant.
For the small scale gillnet fishery for common sole, the relationship between fishingcapacity expressed as overall length of gillnet deployed at sea and nominal fishing effort(fishing activity) expressed as days at sea x number of vessels was highly significant,indicating that on average each vessel deploys the same amount of net per day. In addition,the relationship between output capacity expressed as catch and effort expressed either asdays at sea x number of vessels or km of net deployed was highly significant.
�������� 7KH�ZHVWHUQ�0HGLWHUUDQHDQ�WUDZO�IOHHWV
Results of modelling the north-western Mediterranean trawl fisheries for hake showed thatvessel identity was the main factor affecting hake catch rates. Among the vesselcharacteristics, size was the best descriptor of fishing power in the selected trawl fleets.
�������� 7UHQGV�LQ�ILVKLQJ�SRZHU�RQ�ELR�HFRQRPLFV�LQ�WKH�1RUWK�6HD�IODWILVK�ILVKHU\�
An evaluation of the trends in fishing power on bio-economics in the North Sea flatfishfishery regulated by catch or effort quotas, indicated that the harvest control rule proposedunder the Precautionary Approach appears to be very restrictive with the current stocksituation. Furthermore, the results indicate that if this approach been strictly applied duringthe 1990s either through effort (TAE) or catch (TAC) controls, it would have induced
9
enhanced biological status of the stocks but have resulted in major economic losses in theshort term.
Overall results from this study suggested that, in a multi-species multi-fleet fishery, there arewide biological and economic differences expected when implementing the samemanagement rules with different management tools. TACs and TAEs have different benefitsand drawbacks. In particular, regarding catchability, TAEs are more sensitive to a biasinduced by mis-specifying the relationship between effort and mortality. Furthermore, notaccounting for trends in fishing power due to technological developments, increases the riskof underestimating F and overestimating SSB.
�������� 7KH� UHODWLRQVKLSV� EHWZHHQ� ILVKLQJ� FDSDFLW\�� ILVKLQJ� HIIRUW� DQG� ILVKLQJPRUWDOLW\�IRU�IOHHWV�IURP�7KH�1HWKHUODQGV��'HQPDUN��)UDQFH�DQG�WKH�8.
The group carried out further investigations on the relationship between fishing capacity,fishing effort and fishing mortality using up-dated information for selected Dutch andDanish fleets. In addition, data on UK and French fleets were also evaluated. The overallconclusions are that with respect to target species the fishing efficiency of some of the fleetsunder examination appears to have increased over the period of investigation. However, insome cases decreasing trends have been observed.
Fishing efficiency of most fleets under investigation has decreased between 1999 and 2000.The efficiency of the English fleets harvesting hake appears to have decreased over thewhole period of investigation. The reason for these observed trends are still unclear.Decreasing trends in fishing efficiency may be related to TACs being more restrictive orspecies being less available. On the other hand, increases in efficiency may be due to eitherchanges in the technical characteristics and/or ability of the crew, but may also be influencedby the allocation of ITQs among vessels (e.g. Dutch beam trawlers).
The measure of engine power (HP, kW) to standardise fishing effort appears only useful forfisheries that are energy-intensive, e.g. those requiring engine power for pulling the gearover the bottom. In such cases (e.g. beam and otter trawling) a positive relationship existsbetween engine power and the proxy for fishing capacity.
Tonnage (GRT) does not appear to be a relevant measure of fishing capacity for fleets usingtowed gears but it does seem to be a better proxy for gill-netters, probably because largerboats can carry more nets.
Using alternative measures of fishing effort for the English fleets did not significantly alterthe results, except for gill-netters, where using net size as a measure of fishing effortmodified the perception of fishing power. However, the fit between partial F and effort wasnever substantially improved.
Improvements of the fit between partial F and effort were brought about by standardisingfishing effort by horsepower for trawlers, and by gross tonnage for gill-netters.Standardising fishing effort by efficiency trends only enhanced the fit in one case: theDanish gill-netters harvesting plaice.
The results indicate that in most of the case studies, the relationship between fishing effortand fishing mortality is more dependent on which capacity measure is used than on whetherefficiency trends are accounted for.
������ 'HFRPPLVVLRQLQJ�DQG�HIILFLHQF\
An evaluation of the effects of decommissioning on efficiency highlights theinappropriateness of using physical capacity units for both the measurement of fishing
10
capacity and the basis of capacity reduction programmes. While the latter is to some extentessential from a pragmatic management perspective, managers need to take into accountdifferences in efficiency of the boats when implementing decommissioning programmes.That is, it needs to be recognised removing x% of the fleet will not equate to a x% reductionin output.
A key result of the study relates not to the effects of management SHU�VH, but to the effects ofboat replacement on the harvesting capability of the fleet. Introducing newer, larger vesselsincreases the harvesting potential of the fleet. The importance of vintage to the level oftechnical efficiency has a substantial implication for the management of EU fisheries, andthe North Sea fisheries in particular. New vessels are able to incorporate new designtechnologies that improve their performance. Under the MAGPs, countries that achieve theircapacity reductions can assist in the modernisation of their fleet. As noted above, replacingolder vessels with new vessels will increase the level of technical efficiency in the fleet, andagain distort the balance between catching capacity and catch. Moreover, as larger boatswere found to be more efficient than smaller boats, replacing even two old smaller boatswith one new larger boat with the same overall physical capacity may result in a substantialefficiency increase. When assistance is provided to replace ageing fleets, the resultantincrease in efficiency may more than offset any reduction in capacity and nominal effortarising from the MAGP.
A further implication of the results is that decreasing fleet size through policies such as theMAGP to bring it back into balance with the stocks may result in increased harvestingefficiency through decreased crowding. While economic benefits are likely to derive fromsuch a policy as a result of the reduction in overall resource used in fishing, the conservationbenefits may be less than anticipated.
������ 5HYLHZ�RI�GLIIHUHQW�LQVWUXPHQWV�WR�PDQDJH�FDSDFLW\
The Expert group reviewed several different management instruments and provides acommentary on each in turn. The review categorises the different instruments according towhether they are input or output measures The different instruments evaluated are asfollows:
,QSXW�FRQWUROV�
/LFHQFH�OLPLWDWLRQV��OLPLWHG�HQWU\�PDQDJHPHQW�8QLWLVDWLRQ�VFKHPHV'HFRPPLVVLRQLQJ�DQG�EX\EDFN�VFKHPHV/LPLWDWLRQV�RQ�DFWLYLW\7HFKQLFDO�FRQWUROV�RQ�YHVVHOV
2XWSXW�FRQWUROV
7RWDO�DOORZDEOH�FDWFKHV��7$&V�,QGLYLGXDO�TXRWDVIn addition the Report discusses the merits of user charges as an alternative approach toinput or output controls i.e. to change the costs or benefits of fishing through imposing acharge for use to the resource, either on inputs or outputs. The report also discusses differentallocation systems on the management of capacity and summarises a variety ofcomprehensive reviews on alternative management instruments that complement the abovediscussion.
Finally the Report documents the different systems in operation in Denmark, theNetherlands, the UK and the Mediterranean Region.
11
������ 5HYLHZ�RI�ELR�HFRQRPLF�PRGHOV�IRU�WKH�PDQDJHPHQW�RI�ILVKLQJ�FDSDFLW\�
The Expert group has reviewed existing bio-economic models and their applicability for themanagement of capacity and lists all known models, many of which were funded by the EU.The Group concludes that a logistical difficulty with the use of bio-economic models forassessing capacity management is that most models are not updated. Because funding formodelling activity is not ongoing, but is largely project specific, researchers are unable tokeep the models up to date after the end of the project in which they were developed.Further, as most models have been developed for particular purposes (e.g. to evaluate aparticular problem), they are not able to address all potential management options. Evenmodels that have been developed as generic modelling tools, such as the MEFISTO modelfor the Mediterranean, are limited in their scope to the fisheries and issues that they weredesigned to address. In most cases, these models need to be further developed, and allmodels need to be maintained on an ongoing basis.
The Group also proposes a method to assess economic sustainability and overcapacity usingeconomic data prepared under the concerted action FAIR CT-97-3541, the EconomicInterpretation of ACFM Advice (EIAA) and the Annual Economic Report of selectedEuropean Fishing Fleets (AER). This is referred to as the Break-Even method. The methodis described in detail and its utility is illustrated using a specific example.
The group concludes that the Break-Even method is considered operational on a wider EU-level and sufficiently robust, although not necessarily theoretically optimal. Further themethod is supported by its transparency, and acceptability in the industry due to the use ofwell-known business-economics principles. The method can handle many species subject todifferent yield curves by weighting them together using prices. The method takes intoaccount a number of the economic elements the fisherman would face and include in hisdecision about whether to leave the industry or remain. Furthermore, because the method isbased on remuneration of production factors, be it only vessel capital or both vessel capitaland fish stocks, the method could be used independently of TAC and quota settings. Finally,the calculation is based on well-justified costs and earnings statistics produced in theindustry.
It is possible to apply the method to all the fleet segments that are included in the AER. Atpresent about 50 segments are included, but in the EU supported concerted actioncommencing in 2002 the number will be increased.
Although the method is based on output it could be applied on the input side as well; in themost simple form, by changing the fishing capacity in terms of potential number of fishingdays (number of vessels times vessel fishing days) proportionally with the required changein output. By using models that take into account explicitly a number of capacity and effortvariables e.g. in particular the number of vessels and fishing days categorised inhomogenised fleet segments, an estimate of overcapacity could be obtained. Using anoptimisation procedure where profit is maximised either on a fleet segment level or thefishery as a whole, will indicate the optimum fleet composition and number of fishing daysrequired to catch a given TAC.
The Group provides a review of an analysis of technical interactions between fishing fleetsin the English Channel. The results show that decreasing the fishing effort of fleetsdifferentially affects the catching capacity of other fleets, depending of their level ofcompetition for the resource. Although the results should essentially be used on a qualitativemanner; they provide relevant information on both the direction and the magnitude of thecompetition interactions in such a polyvalent fishery.
Finally, the Expert Group provided an overview of MEFISTO, a bio-economic model for theMediterranean fisheries.
12
���� 67(&)�&200(176
STECF welcomed the report SEC(2003)74 of the third meeting of the Sub-group on thefollow up to MAGP IV, noting that the group had produced a valuable report.
STECF recognises that over the three meetings a considerable number of case studies on therelationship between capacity, effort and fishing mortality had been evaluated. For themajority, it was possible to demonstrate explicit relationships between, capacity and effort,and in some cases between effort and fishing mortality rates. However, since most resultswere case specific it is difficult to find any conclusions that can be generally applied todifferent kinds of fleets and fisheries.
STECF notes that comprehensive reviews of the existing models for the management offishing capacity are presented in the third report of the group together with a novel approachin using the results from the EIAA and AER to determining economic sustainability andovercapacity.
Noting the considerable amount of analyses and discussion contained in the reports of thethree meetings of the Expert Group to advise the Commission on the Scientific Basis for afollow up to MAGP IV, an executive summary is shown in�$SSHQGL[����
��� 6*)(1� 5(3257� 6(&���������� 21� ,1&,'(17$/� &$7&+(6� 2)� &(7$&($16� ������'(&(0%(5������
���� %$&.*5281'
At its 11th meeting in November 2000, STECF was asked to address the issue of incidentalcatches of marine mammals with particular attention to small cetaceans; it was also asked toorganise and develop terms of reference for a dedicated meeting of its Subgroup onFisheries and the Environment1 (SGFEN) to further consider the topic.
STECF emphasised that the issue of incidental catches of small cetaceans is one aspect ofthe broader problem surrounding the interaction between marine mammals and fisheries. Inaddition, given the sensitivity of this issue, STECF drew attention to the need to make use ofonly robust scientific data and information and the need to avoid references to suppositions.
STECF listed a number of fisheries identified with the problem of cetacean bycatch,including, LQWHU�DOLD, drift nets and fixed-nets, purse-seiners, pelagic trawlers and long linefisheries. In addition STECF acknowledged that the opportunistic predation on fishing gearby small cetaceans could be one of the reasons for the occurrence of unintentional bycatch.STECF also highlighted another aspect of the problem, quite often neglected or notconsidered, namely the damage caused by marine mammals to fishing gears.
Specifically SGFEN was asked to address the following Terms of Reference:
��� Review and update existing data and information on small cetacean bycatch rates byfleet, season and geographic area;
��� Review and update information on small cetacean population abundance estimates anddynamics per species and geographic area. Give whenever possible trends in historicpopulation sizes;
��� Assess the risks posed by fisheries to small cetacean populations;
1 SEC (2001) 177
13
��� Prepare a list of fisheries (metiers) ranked according to the risk or threat to smallcetaceans;
��� Review and update estimates of a maximum allowable level of anthropogenic mortalityby cetacean species and advise on maximum bycatch rates by species and area;
��� Advise on possible approaches to reduce the impact of fishing;
��� Review and summarise information on implementation of actions already taken atnational and international level to monitor and survey cetacean bycatches and to enforcethe use of mitigation devices;
��� Conceive and design an observer sampling scheme suitable to monitoring cetaceanbycatches. An account of the human resources needed, on a permanent or seasonal basis,by “metier” should be addressed.
��� Identify possible management frameworks, suitable to the European Communitydecision-making structure, to tackle the issue of cetacean bycatches;
����Indicate future research and monitoring needs for a greater knowledge of cetaceanpopulations and the development of bycatch mitigation devices and practices.
The STECF Subgroup on Fishery and Environment (SGFEN) met at the Demot Building inBrussels from the 10th to 14th of December 2001 under the chairmanship of Mr SimonNorthridge. The report (SEC(2002)376) of this meeting was available to the STECF at its14th meeting in April 2002.
���� 67(&)� &200(176� 21� 7+(� 5(3257� 2)� 7+(� 68%*5283� 21� ),6+(5<� $1'
(19,5210(17�21�,1&,'(17$/�&$7&+(6�2)�60$//�&(7$&($16
������ 5HYLHZ� RI� H[LVWLQJ� GDWD� DQG� LQIRUPDWLRQ� RQ� VPDOO� FHWDFHDQ� E\FDWFK� UDWHV�SRSXODWLRQ�DEXQGDQFH�HVWLPDWHV�DQG�PHWKRGV�XVHG�WR�VHW�E\FDWFK�OLPLWV�
Section 2 of the subgroup’s report contains, for both the NE Atlantic and the Mediterranean,overviews of the current available information for EU waters, where historically themajority of the by-catch of small cetaceans have historically been taken by gillnets anddriftnets.
Several methods have been used to estimate cetacean bycatch rates in the past. Theseinclude methods that rely on fishermen providing information on bycatch rates, strandingrecords, and independent observation schemes. It is generally accepted that the only reliablemethod involves the use of independent observations of fishing activity.
Current abundance estimates (as distinct from SRSXODWLRQ estimates) for all relevant species,as well as estimates of bycatch and estimates of fishing effort in relevant fisheries aredescribed for the Baltic, North and Norwegian Seas, Atlantic and Mediterranean areas.Where mitigation measures have been attempted in these areas they are described. Inparticular the report details:
1. Occurrence of small cetaceans,
2. Methodologies for estimation of abundance as well as by-catches of the various species,
3. Methods of mitigating by-catch of small cetaceans,
4. Available estimates for various species in various fisheries the NE Atlantic and in theMediterranean at present.
5. The risks posed by fisheries to small cetacean populations.
14
Reliable effort data by fishery are required for estimation of total by-catch. Such data areavailable from logbooks. In most European fisheries in the NE Atlantic and from 2000 inthe Mediterranean logbooks are mandatory, however only for vessels larger than 10 m. Thusthe effort estimates based on logbook data will only cover vessels larger than 10 m.
Following this overview, the methods used to set up by-catch limits are described andevaluated in Section 3 of the report. These include ‘rules of thumb’ proposed by the IWCand more stringent methods that have been derived in the USA under the Marine MammalProtection Act. The deliberations of ASCOBANS on this subject are also discussed.
1. Following the precautionary principle the IWC (International Whaling Commission) hasrecommended a figure of 1% of the current abundance estimate for a particular stock asa reasonable and precautionary by-catch level.
2. A second approach is that adopted by the US under the Marine Mammal Protection Act(MMPA). The aim of the MMPA is to prevent any marine mammal stock from beingreduced to below its optimum sustainable level and to restore those stocks that havebeen reduced to below that level. This method requires that the marine mammal stocksunder consideration are assessed annually as well as the fisheries where the by-catchesoccur. A crucial figure here is the PBR (Potential Biological Removal) for a given stock.This figure is calculated as the product of the Minimum population estimate (Nmin), halfthe maximum net productivity rate (0.5 Rmax) and a recovery factor (Fr).
3. A PBR type approach has also been used by the IWC-ASCOBANS working group forestimation of a maximum removal (by-catch) rate for the Harbour porpoise. This ratewas estimated at 1.7 % of the population size, i.e. higher than the general limit suggestedby the IWC.
Having considered these 3 options, the subgroup considered the ASCOBANS approach andconservation objectives useful and in the interim, adopted 1.7% as a maximum allowableremoval rate for the harbour porpoise.
������ %\FDWFK�OLPLWV�E\�UHOHYDQW�VSHFLHV�DQG�DUHD�
Section 4 of the subgroup report presents, for the Harbour porpoise, Common dolphin andStriped Dolphin, estimates of abundance and by-catch level in a number of fisheries.However the subgroup stressed that the abundance estimates presented are not estimates ofpopulation size (but refer instead to particular survey areas, and while the stock structure isusually not known in most cases the species range probably extends beyond the survey area)and as there are no bycatch estimates from all fisheries operating in a given area, so thebycatch estimates presented may be biased.
In consequence, STECF is of the opinion that the any comparison of these figures (estimatesof abundance and by-catch level) should be treated with caution, particularly in respect ofthe bycatch ‘limits’ discussed in the previous section of this report.
������ 5DQNLQJ�ILVKHULHV�DFFRUGLQJ�WR�WKHLU�ULVN�RU�WKUHDW�WR�VPDOO�FHWDFHDQV�
In its terms of reference the subgroup was asked to rank fisheries according to their risk tosmall cetaceans. However the subgroup decided that there is currently insufficient data toachieve this task and instead listed in tabular form (section 5 of the subgroup report):
1. Those fisheries for which bycatch estimates and local abundance estimates are availablewith an indication of the current management measures that are being proposed for thesefisheries. However, the subgroup stressed that the inclusion of fisheries within this firsttable was NOT intended to highlight these as being more problematic than others –
15
rather the table highlights those fisheries in which research has been done that mayenable some assessment of the level of impact to be made.
2. Fisheries where there is a measured bycatch but no estimate of animal abundance, andthose fisheries where some bycatch is known or may reasonably be expected, but forwhich no adequate sampling has been done. The subgroup was not in a position to rankthese fisheries in terms of their potential risk to cetaceans.
3. Fisheries, where by-catch rates are not available, but where the number of interferencebetween cetaceans and fishery could potentially create harassment or deliberate killingor where there is a potential risk.
STECF agrees with the opinion of the subgroup that it is currently not possible to attributelevels of risk to specific fisheries with any confidence. In addition STECF anticipates thatsome fisheries were not included in the subgroup analysis as data were not available to thegroup. STECF considers it possible to tabulate fisheries where by-catch is known orsuspected to occur, and to further tabulate those fisheries where rigorous estimates ofcetacean by-catch are available.
STECF noted the absence of ongoing sampling programmes to monitor the by-catch ofsmall cetaceans and the limited duration of such activities where they have been carried outin the past.
������ 0HWKRGV�WR�PLWLJDWH�E\�FDWFK�RI�VPDOO�FHWDFHDQV�
Section 6 of the subgroup report presents an overview of possible methods of mitigatingcetacean by-catch while Section 7 presents an overview� of some mitigation methodscurrently in use.
�������� 0HWKRGV�RI�PLWLJDWLQJ�FHWDFHDQ�E\�FDWFK
Reduction of by-catch of cetaceans could be achieved in different ways including, LQWHU�DOLD,
1. Protected areas,
2. Technical Measures,
3. Acoustic alarms
4. Passive acoustic devices
5. Active acoustic devices including ‘pingers’.
6. Interactive devices, i.e. devices, which are activated in response to sonar clicks fromapproaching porpoises.
7. Fishing effort reduction, however there is no practical experience from such a measure.
�������� 0LWLJDWLRQ�PHDVXUHV�FXUUHQWO\�LQ�XVH
1. The United Nations moratorium on large-scale high seas driftnets fishing (Resolution44/225 of 1999).
2. Council Regulation 345/92 limiting the length of nets used in the European fishery fortuna to 2.5km.
3. Italian ban on the use of driftnets in the Ligurian Sea (1992).
4. Spanish ban on the use of driftnets (1994).
5. Council Regulation 1239/98 phasing out the use of driftnets for certain species of largepelagic fish throughout the EU with a complete ban effective from 1.1.2002.
16
6. In Denmark pingers are now required for certain bottom gillnet fisheries in the NorthSea.
7. In the USA all cetacean stocks and their by-catches are monitored closely. Where by-catch rates exceed PBR ‘Take Reduction Teams’ (TRT) are established to devisemanagement schemes to reduce by-catch levels.
STECF, in its review of the report, noted that the reduction of catches of species having nocommercial interest - including small cetaceans - but requiring additional protection, can beobtained by the adoption of new technical measures, including acoustic devices, or therevision of already existing ones. Such an improvement in the selectivity of fisheriesmethods could be encouraged by incentives, including those of an economic nature.
STECF, is of the opinion that, as additional information becomes available the Commissionshould continue to bring forward measures to improve the selectivity of fishing gear and toimprove methods of control and implementation. These provisions will aim to minimiseincidental catches of, and/or damage to, particularly endangered species of fish, marinemammals, birds and reptiles.
���� )857+(5�5(6($5&+�1(('6
In the report it was concluded that the population structure of the small cetacean populationsin European waters is poorly understood and ongoing investigations of this issue are needed.Concerning the current abundance estimates of the various small cetaceans in Europeanwaters, it seems that, at present, the situation is most critical for the of Harbour porpoisepopulation in the Baltic Sea, where the ASCOBANS recovery plan was welcomed by thesubgroup.
The sub-group also agreed that there needs to be clarification of the methods used toextrapolate observed by-catch rates to an entire fleet. These investigations should includeexamination of the consequences of using different raising factors (e.g. total landed weight,days at sea, hours towed etc) in estimating total by-catch.
As for methods of mitigation (reduction) of cetacean by-catch the group stressed that beforebeing implemented as a measure for a particular fishery, any proposed mitigation methodmust be carefully monitored on an experimental basis for a significant time period in orderto identify unwanted side effects that would be difficult to address once a specific measurehas been adopted for the regulation measures.
The subgroup also stressed the need to re-evaluate mitigation methods, on an ongoing andtimely basis, to ensure that they remain effective.
As for specific areas/fisheries where future investigations are needed, it was stressed that, infact, all the fisheries considered required further investigations to elucidate the by-catchproblem. However, some fisheries were of particular concern:
1. Those gillnet fisheries in the Baltic, where the porpoise are caught as by-catch.
2. The pelagic and pair trawl fisheries in the Western Channel and in the Bay of Biscay.
3. The Norwegian gillnet fisheries in the northern North Sea need to be assessed for its by-catch of porpoises.
���� &21&/86,216�$1'�5(&200(1'$7,216
STECF recommended that updated assessment on the status of cetacean population shouldbe undertaken.

17
STECF, in its review of the report, noted that due to insufficient time the expert subgroupdid not consider observer sampling schemes suitable for monitoring cetacean by-catches,nor did the subgroup identify possible management frameworks, suitable to the EuropeanCommunity decision-making structure, to tackle the issue of cetacean by-catch. Theseimportant issues are to be dealt with at an additional dedicated meeting of its Subgroup onFisheries and the Environment (SGFEN) in 2002 to further consider the topic (see section4.5).
STECF noted that the "Habitats" Directive obliges Member States to take the measuresneeded to establish a strict protection system of certain marine animal species in theirnatural range. This includes in particular the establishment by the Member States of asystem to monitor the incidental capture and killing of these species (including cetaceans)and of further research or conservation measures, as required, to ensure that incidentalcapture and killing does not have a significant negative impact on the species concerned.Several by-catch monitoring schemes have already been co-financed by the Community, inparticular under the Research programmes on fisheries (AIR- FAIR projects). STECF,consider it important that the Commission closely monitor the implementation of thismeasure by Member States.
STECF strongly recommends, that national observer programmes be extended to includerecording of by-catches of small cetaceans.
STECF recommends that assessments of the possible economic and social consequences ofany proposed mitigation methods (including technical measures other than acoustic devices)be carried out prior to implementation of these measures.
����� '5$)7�7(506�2)�5()(5(1&(�)25�$�0((7,1*�2)�7+(�68%*5283�21�),6+(5,(6�$1'
7+(� (19,5210(17� �6*)(1�� ,1� ����� 72� )857+(5� &216,'(5� 7+(� 723,&� 2)
,1&,'(17$/�%<&$7&+�2)�60$//�&(7$&($16�
STECF suggests that, in addition to terms of reference 8 and 9 of the last meeting of theSubgroup on Fisheries and the Environment (and listed below as items 1 and 2) theadditional items (3, etc) be included in the Terms of Reference for the sub-groups’s comingmeeting:
1. Conceive and design an observer sampling scheme suitable to monitoring cetaceanbycatches. An account of the human resources needed, on a permanent or seasonal basis,by “metier” should be addressed.
2. Identify possible management frameworks, suitable to the European Communitydecision-making structure, to tackle the issue of cetacean by-catches;
3. To prepare a new table(s) including all fisheries where by-catch of small cetaceans isknown or suspected to occur, including fisheries for which such information has not yetbeen documented.
4. To review and tabulate the existing information on the application of the "Habitats"Directive by each member country in respect of small cetaceans.
��� 6*%5(�5(3257�21�)/((76�'<1$0,&��������)(%58$5<������
The consolidated final report of the subgroup was not made available to the STECF duringthe plenary session due to unexpected editorial problems encountered by the coordinatorduring its finalisation. However, the STECF, after a presentation of the structure and content
18
of the report by the co-ordinator of the working group, agreed to adopt the report bycorrespondence once it will be finalised.
��� +$.(�$1'�&2'��5(&29(5<��3/$16
����� (9$/8$7,21�2)�5(&29(5<�3/$16
STECF welcomes the report of the SGRST meeting on Evaluation of Recovery Plans, andthe report of the two-day meeting of scientists from Norway and the Community on theevaluation of harvest control rules for North Sea cod. Both reports represent a considerableamount of work achieved by the participants in a very short period of time.
STECF notes that unfortunately limitations in time and in the tools available appear to haveconstrained the approach taken to evaluate the recovery plans. A comprehensive approachthat considers the interactions between system components and provides an integrated wayto evaluate the relative importance of individual components to the overall success ofmanagement (the MATES model: a simulation framework written in C++ and interfaced toExcel for data input and output. This framework is considered to provide the fullestexploration of the effects of the harvest control rules under uncertainty) could not beimplemented and validated in the time available due to the complexity of the system.
Options for recovery evaluations were restricted to the use of the CS model (a medium termprediction program written in Fortran. The CS program can incorporate uncertainty in anumber of population parameters, including the relationship between stock and recruitment.Bias in the assessment can also be incorporated. In addition, CS model essentially restrictedharvest control strategies to being biomass controlled or fishing mortality controlled and didnot permit combinations incorporating simultaneous temporal variation in both controllingvalues. STECF considers that an evaluation of harvest control strategies should not belimited D�SULRUL by the choice of evaluation tool.
There appear to be some inconsistencies between the results for percentage annual changegiven in the summary tables and the values presented in the graphs for each scenario.However, the graphical presentation shows the percentiles of distributions that include bothpositive and negative deviations of landings relative to the previous year. The positives tendto cancel out the negatives, hence the median deviation looks small on the charts. In thetable, the average change is the average of the ABS(deviation), hence no cancelling out .Consequently, the graphical presentation is misleading as a representation for any one stocktrajectory. If a measure of the relative change in yield is required readers should use thetabulated values.
The simulations reported rely upon numerous assumptions including:
• A constraint on F (F ≤ Fpa) resulting in a sharp reduction in F in 2003,
• High initial reductions in catch,
• The predicted TACs being taken exactly ,
• Recruitment estimates showing no long term trends,
• Consistency in mean weight at age corresponding to current ICES practice of the meanover the last three years.
Because of the likelihood that all of these assumptions will not be met STECF stronglyendorses the cautionary qualification made by the SGRST (Recovery plans) that:
19
“The values referred to in the presentation and discussion of the likely outcomes of thedifferent harvest control rules should NOT be interpreted as absolute. They are presentedas values which are conditional on a number of assumptions made within the forecastmodels that have been used, and are better considered to be relative values to becompared one to another. It cannot be emphasised too greatly that the results presentedhere permit only the comparative performance of the harvest control rules to beevaluated.”
Furthermore, because departures from the assumptions of the simulations are likely to besystematic, STECF advises that there are likely to be consequent systematic increases ordecreases in the recovery periods indicated by the simulations. It is possible that not all ofthis bias is accommodated in the 10 % bias allowed in the simulations. Nevertheless,STECF considers that the scenarios reported do provide useful evaluations of the range ofmanagement measures presented.
STECF suggests that the evaluations presented represent an annual approach rather than amulti-annual approach towards stock recovery. In 2001 STECF concluded that there was aneed to specify, in each case, stock-based management objectives rather than species-basedones, with clearly defined recovery periods, and harvesting strategies consistent with thestatus of the stock, and the fishery with which it is concerned. STECF considers that theevaluations fail to meet all of these needs.
����� (&2120,&�&216,'(5$7,216
The scenarios present information only on single species and single stocks. STECF thereforecannot assess the economic impact of the harvest control strategies presented on thefisheries that fish each stock. Mitigation of any economic impacts within each fishery willdepend on the ability of fleets to selectively fish for particular species.
STECF notes that recovery periods are consistent within stocks but quite extensive. Becauseof the need to mitigate economic impacts STECF considers that, from an economicperspective, scenarios with major short-term impacts should be avoided unless they have anextremely high probability of success.
����� &5,7(5,$�)25�&+226,1*�%(7:((1�6&(1$5,26
The differences in recovery periods between stocks of the same species indicate thatrecovery periods are very sensitive to the size of the starting population. However, for eachstock the recovery time varies very little between the scenarios that achieve recovery withina 10-year period. The duration of the period needed to achieve recovery is relativelyconstant in these simulations (about 6-7 years)
Consistency in the time taken to achieve recovery by various scenarios makes the recoveryperiod largely unimportant in the choice of a harvest control rule since the biologicalobjective is achieved within a similar time period. Hence, the choice of a harvest controlstrategy is a management decision that should be based on other factors including:
• Mitigation of TAC reductions in the short term,
• Shape of the F trajectory over the recovery period, and,
• Progression towards a long-term optimal point on a yield / biomass curve.
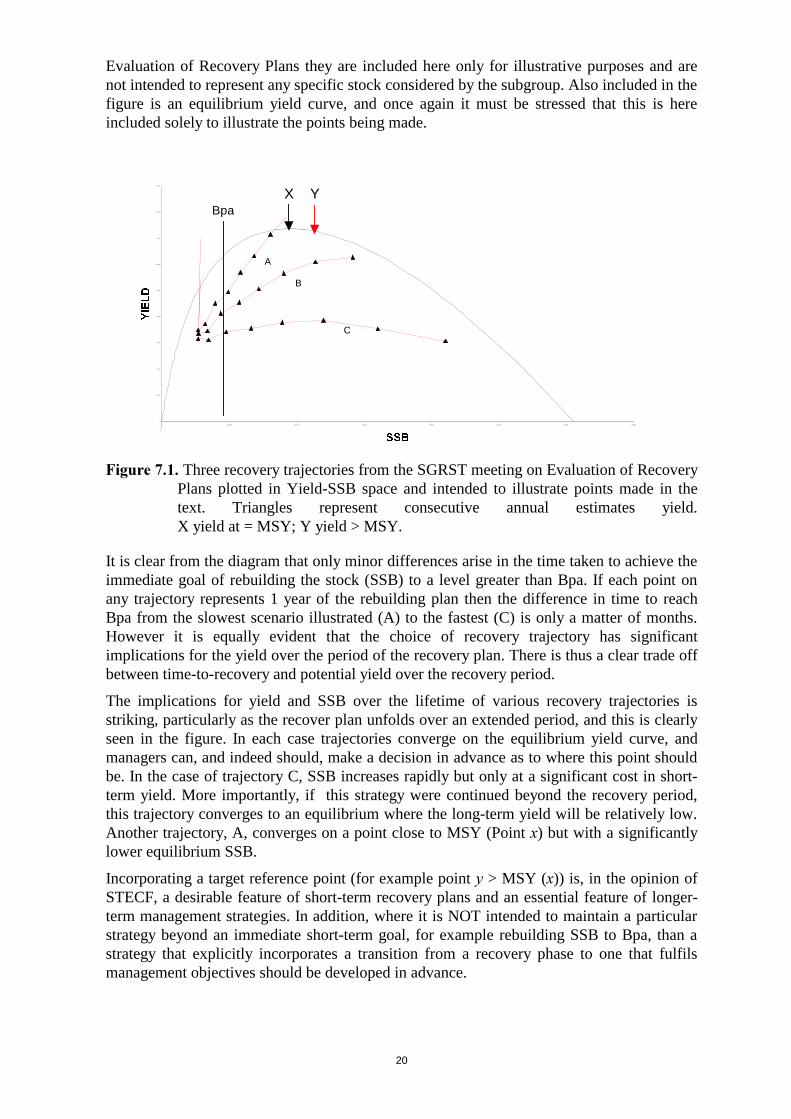
These points are illustrated in Figure 7.1, below, where a series of recovery trajectories areplotted in yield-SSB space. While the data presented are taken from the SGRST meeting on
20
Evaluation of Recovery Plans they are included here only for illustrative purposes and arenot intended to represent any specific stock considered by the subgroup. Also included in thefigure is an equilibrium yield curve, and once again it must be stressed that this is hereincluded solely to illustrate the points being made.
0
1,0 00
2,0 00
3,0 00
4,0 00
5,0 00
6,0 00
7,0 00
8,0 00
9,0 00
0 1 0,00 0 2 0,0 00 3 0,0 00 40,0 00 50 ,0 00 60 ,0 00 70 ,00 0
66%
<,(/'
Bpa
A
B
C
X Y
)LJXUH������Three recovery trajectories from the SGRST meeting on Evaluation of RecoveryPlans plotted in Yield-SSB space and intended to illustrate points made in thetext. Triangles represent consecutive annual estimates yield.X yield at = MSY; Y yield > MSY.
It is clear from the diagram that only minor differences arise in the time taken to achieve theimmediate goal of rebuilding the stock (SSB) to a level greater than Bpa. If each point onany trajectory represents 1 year of the rebuilding plan then the difference in time to reachBpa from the slowest scenario illustrated (A) to the fastest (C) is only a matter of months.However it is equally evident that the choice of recovery trajectory has significantimplications for the yield over the period of the recovery plan. There is thus a clear trade offbetween time-to-recovery and potential yield over the recovery period.
The implications for yield and SSB over the lifetime of various recovery trajectories isstriking, particularly as the recover plan unfolds over an extended period, and this is clearlyseen in the figure. In each case trajectories converge on the equilibrium yield curve, andmanagers can, and indeed should, make a decision in advance as to where this point shouldbe. In the case of trajectory C, SSB increases rapidly but only at a significant cost in short-term yield. More importantly, if this strategy were continued beyond the recovery period,this trajectory converges to an equilibrium where the long-term yield will be relatively low.Another trajectory, A, converges on a point close to MSY (Point [) but with a significantlylower equilibrium SSB.
Incorporating a target reference point (for example point \ > MSY ([)) is, in the opinion ofSTECF, a desirable feature of short-term recovery plans and an essential feature of longer-term management strategies. In addition, where it is NOT intended to maintain a particularstrategy beyond an immediate short-term goal, for example rebuilding SSB to Bpa, than astrategy that explicitly incorporates a transition from a recovery phase to one that fulfilsmanagement objectives should be developed in advance.
21
STECF reiterates the points made in its last report of November 2001, that when consideringthe requirements for recovering fish stocks and concluded that four components arenecessary:
1. A measure of the status of the stock with respect to biological reference points.
2. A target recovery period;
3. A target recovery trajectory for the interim stock status relative to the biologicalreference points;
4. Transition from a recovery strategy to one that fulfils management objectives.
����� &200(17�21�3$57,&8/$5�672&.6�
For each stock a table (see text table) is provided that details properties of the longer termperformance of these scenarios as possible harvest control strategies. In some cases thisinformation is also provided for scenarios that did not achieve a 90% probability of recoverybut came close to this threshold.
�������1RUWKHUQ�KDNH
In its 13th meeting report, of November 2001, it was noted that the precautionary and limitreference points for northern hake (Blim and Bpa) may not be appropriate. In 1998, ICESbased Blim for northern hake on the lowest observed SSB in the 1998 ICES assessment.Since then, the inputs to the assessment (catch in numbers at age back to 1995) have beenrevised, and as a result, the estimate of the lowest observed SSB has also been revised.STECF therefore suggested that ICES should be requested to re-examine these referencepoints and propose alternatives if necessary
The success of the recovery plan scenarios presented for northern hake are conditional onthe values assumed for Bpa and Fpa. Any revision of these values will affect the probabilityof achieving recovery within a specified time period.
Nevertheless, of the scenarios tested by the Working Group, most of them have a highprobability to achieve stock recovery to Bpa within 10 years.
For the scenarios based on achieving an annual percentage increase in SSB, all achieverecovery within 10 years, and this appears robust to annual changes in TAC up to 20%.
In order to achieve recovery to Bpa within 10 years, F needs to be reduced to at least 80% ofFpa. Nevertheless, the scenarios based in Fpa reach Bpa of 165 kT for 2 consecutive years inmore than 50% of the simulations (between 65% and 67%).
SGRST (Recovery Plans) recommended evaluation of lower values of SSB increases and/oryear to year TAC variation limitations to determine at what level these constraints the stockwould have a very low probability of recovery during the ten-year simulation period.
An exercise, with constant fishing mortality higher than Fsq and Flim was also made(simulation n° 19 with constant F=0.3). These exercise indicates that at this level of constantfishing mortality, the stock do not achieve recovery, but do not collapse, remaining yield,SSB and recruitment more or less constant.
22
�������1RUWK�6HD�&RG
��������� *HQHUDO�FRQFOXVLRQV
• Fishing at an F of 80% of Fpa, or higher from 2003 onwards, indicates that the stock willnot recover to Bpa in the foreseeable future (i.e. for at least 10 years).
• A biomass target of a 15% increase in SSB year-on year is too small to effect a recoveryof the stock.
Using a biomass strategy of 30% or 45% increase year on year also implies a reduction in Fto significantly below Fpa, which is a level never previously observed for this stock.
It is clear that to achieve a recovery of the for North Sea cod stock to Bpa within areasonable time, significant reductions in F to well below Fpa are required, regardless ofwhether the strategy is a year on year increase in biomass or a reduction in F.
Hence, on stock conservation grounds, a biomass strategy or an F strategy are both capableof achieving recovery of the SSB to Bpa, provided either strategy results in reduction of F tobelow Fpa in the short to medium term.
Eight of the scenarios presented achieve a recovery of SSB to Bpa with a probability of 90%or greater within a similar time scale (see text table).
All of the scenarios achieving recovery show an increasing trajectory for SSB beyond Bpa(assuming maintenance of the harvest control strategies after recovery has been achieved).
All except two scenarios of the successful scenarios indicate a continuing decline in Fimplying a continual reduction in fishing effort up to and beyond the period of recovery.Those scenarios not indicating a decline in F are SC5 and SC 17, both of which are constantF harvest strategies.
Under all scenarios average yield either increases or remains relatively constant, comparedto that predicted for 2003. The range of predicted annual average yield values is from about73-96 thousand tonnes depending on the harvest strategy considered.
�������&RG�LQ�.DWWHJDW
Basis: Fpa 0.6, Bpa 10,500 t, Fcur 1.2
The constraint on F (F ≤ Fpa) results in a strong reduction of F (50%) in the first year,corresponding with a 75% decrease in yield from 2002 to 2003, and an increase in SSB (ofmore than 45%) from 2003 to 2004.
��������� 66%�EDVHG�VFHQDULRV
There is recovery within 5-7 years for all SSB based scenarios.
Scenarios 2,8,14 (45%): High annual increases of SSB is accompanied with very low F’s,lower average annual yields (compared to other SSB base scenarios) and a reduction of therecovery time (see also table 3.2.1). A 45% annual increase of SSB will be hard toimplement.
A 15% annual SSB increase gives a higher average yield during the recovery time andhigher F’s, while the recovery period will be longer (up to 10%).
23
The lower the annual SSB increase, the lower the average annual % change in yield.
Restricting the annual variation of the TAC to 20% results in a more rapid recovery as theSSB increases at a faster rate than the catch. It also limits the average annual % change inyield. No obvious differences are noted between scenarios with 50% TAC changerestrictions and those scenarios with no TAC constraints.
��������� )�EDVHG�VFHQDULRV
For fishing at Fpa (scenarios 6,12,18), there is lower probability of recovery within 9 years,although SSB increases from year to year.
Fishing at lower F’s (scenarios 4,5,10,11,16,17) give high probabilities of recovery withinthe time frame (with average recovery times ranging from 5.15 – 6.01 years). The higher thereduction the lower the average annual yield during the recovery time.
A restriction of 20% in annual variation of the TAC leads to a more rapid recovery, butlower yields. Restriction of 50% has less impact.
��������� 2WKHU�FRPPHQWV
The Ricker-type stock recruitment relationship is almost linear for the observed SSBs forthis stock and hence the recruitment is rather sensitive to small changes in SSB.
An additional run was carried out considering the observed decreasing mean weights at agein recent years. This run suggests that the average recovery time increases with more than ayear if the lower weights at age persist.
��������� &RQFOXVLRQV
• Unattractive scenarios: 45% annual increase of SSB (difficult to realise), fishing at Fpa(recovery not achieved within the time frame)
• Attractive scenarios: 15% and 30% annual increase of SSB, fishing lower at Fpa (allachieve recovery within the time frame)
�������,ULVK�6HD�&RG
��������� *HQHUDO�FRPPHQWV
• STECF notes that 7 of 18 scenarios evaluated indicate more than a 90% probability ofrecovery within 9 years. For such scenarios, the time to recovery is about 6-7 years.
• Recovery in a period of 9 years can be achieved by both SSB and F controlled scenarios.
• SSB controlled scenarios seem to require less restrictive management action in the shortterm.
• None of the scenarios presented indicate that a recovery is achieved within 9 years wherethe average annual catch over the period is in excess of 4,700 t.
24
��������� 66%�FRQWUROOHG�VFHQDULRV
Recovery is achieved only when high annual increases in SSB (+45%) are implemented.These scenarios also indicate declining annual yields over the recovery period unless thevariability in TAC is tightly constrained.
��������� )�FRQWUROOHG�VFHQDULRV
Whilst the F controlled scenarios allow for increased yields, they require a marked reductionin F in the short term and continued low exploitation rates. Recovery is achieved by Fcontrolled scenarios that reduce F to 0.6 of Fpa, or 0.8 of Fpa combined with a 20% catchlimit.
�������:HVW�RI�6FRWODQG�&RG
��������� *HQHUDO�FRPPHQWV
• STECF notes that all of the 18 scenarios indicate stock recovery in about 2007.
• Recovery in a period of 10 years can be achieved by both biomass and fishing mortalitycontrolled management.
• In no cases, was the average annual catches over the recovery period in excess of 5600 tfor scenarios that indicated a 90% probability of recovery over the coming 10 years.
��������� %LRPDVV�FRQWUROOHG�VFHQDULRV
These reveal more stable annual yields over the recovery periods
15 % biomass increases do not achieve recovery unless combined with a 20 % limit on TACchange.
��������� )LVKLQJ�PRUWDOLW\�FRQWUROOHG�VFHQDULRV
These seem to allow for increased catches after a short period of 2-3 years. They do howeverrequire a drastic management action in a short term and continued low exploitation rateswhile biomass controlled management seems less restrictive in short term. F strategiesachieve recovery only when F is reduced to 0.6 x Fpa or 0.8 x Fpa combined with a 20 %limit on TAC change. � �
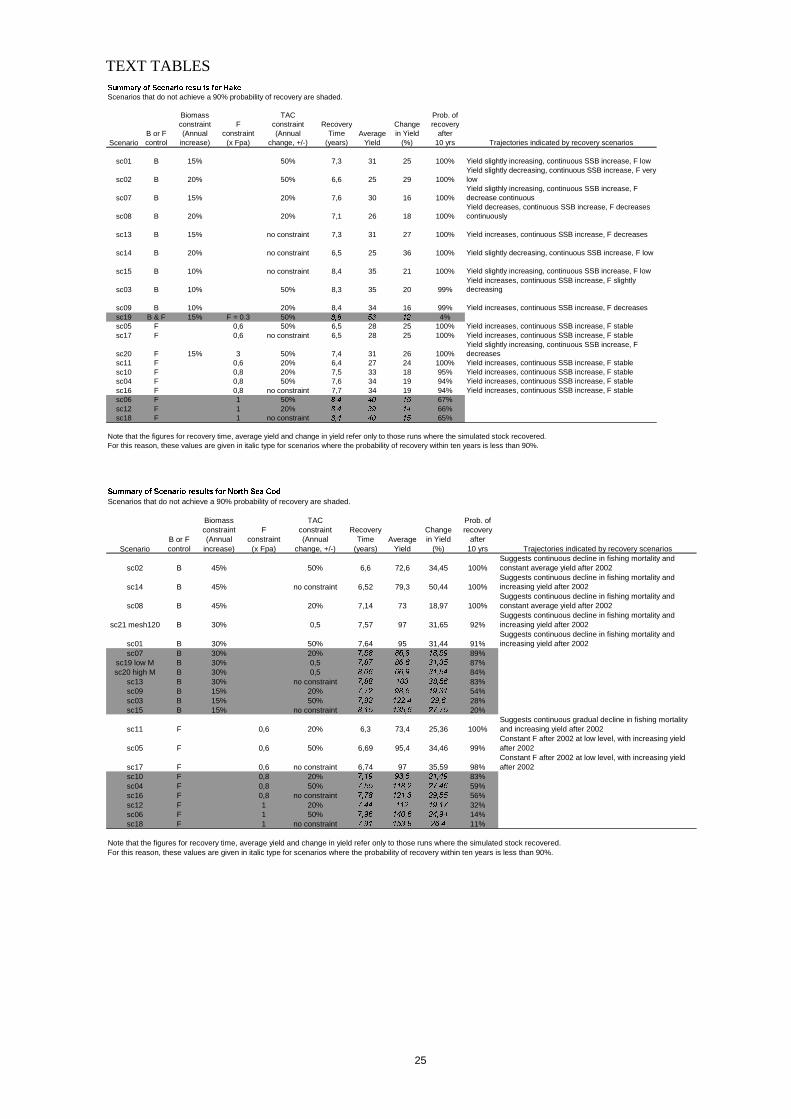
25
TEXT TABLES
6XPPDU\�RI�6FHQDULR�UHVXOWV�IRU�1RUWK�6HD�&RGScenarios that do not achieve a 90% probability of recovery are shaded.
ScenarioB or Fcontrol
Biomassconstraint(Annual
increase)
Fconstraint
(x Fpa)
TACconstraint(Annual
change, +/-)
RecoveryTime
(years)Average
Yield
Changein Yield
(%)
Prob. ofrecovery
after10 yrs Trajectories indicated by recovery scenarios
sc02 B 45% 50% 6,6 72,6 34,45 100%Suggests continuous decline in fishing mortality and constant average yield after 2002
sc14 B 45% no constraint 6,52 79,3 50,44 100%Suggests continuous decline in fishing mortality and increasing yield after 2002
sc08 B 45% 20% 7,14 73 18,97 100%Suggests continuous decline in fishing mortality and constant average yield after 2002
sc21 mesh120 B 30% 0,5 7,57 97 31,65 92%Suggests continuous decline in fishing mortality and increasing yield after 2002
sc01 B 30% 50% 7,64 95 31,44 91%Suggests continuous decline in fishing mortality and increasing yield after 2002
sc07 B 30% 20% ���� ���� ����� 89%sc19 low M B 30% 0,5 ���� ���� ����� 87%sc20 high M B 30% 0,5 ���� ���� ����� 84%
sc13 B 30% no constraint ���� ��� ����� 83%sc09 B 15% 20% ���� ���� ����� 54%sc03 B 15% 50% ���� ����� ���� 28%sc15 B 15% no constraint ���� ����� ����� 20%
sc11 F 0,6 20% 6,3 73,4 25,36 100%Suggests continuous gradual decline in fishing mortality and increasing yield after 2002
sc05 F 0,6 50% 6,69 95,4 34,46 99%Constant F after 2002 at low level, with increasing yield after 2002
sc17 F 0,6 no constraint 6,74 97 35,59 98%Constant F after 2002 at low level, with increasing yield after 2002
sc10 F 0,8 20% ���� ���� ����� 83%sc04 F 0,8 50% ���� ����� ����� 59%sc16 F 0,8 no constraint ���� ����� ����� 56%sc12 F 1 20% ���� ��� ����� 32%sc06 F 1 50% ���� ����� ����� 14%sc18 F 1 no constraint ���� ����� ���� 11%
Note that the figures for recovery time, average yield and change in yield refer only to those runs where the simulated stock recovered.For this reason, these values are given in italic type for scenarios where the probability of recovery within ten years is less than 90%.
6XPPDU\�RI�6FHQDULR�UHVXOWV�IRU�+DNHScenarios that do not achieve a 90% probability of recovery are shaded.
ScenarioB or Fcontrol
Biomassconstraint(Annual
increase)
Fconstraint
(x Fpa)
TACconstraint(Annual
change, +/-)
RecoveryTime
(years)Average
Yield
Changein Yield
(%)
Prob. ofrecovery
after10 yrs Trajectories indicated by recovery scenarios
sc01 B 15% 50% 7,3 31 25 100% Yield slightly increasing, continuous SSB increase, F low
sc02 B 20% 50% 6,6 25 29 100%Yield slightly decreasing, continuous SSB increase, F very low
sc07 B 15% 20% 7,6 30 16 100%Yield sligthly increasing, continuous SSB increase, F decrease continuous
sc08 B 20% 20% 7,1 26 18 100%Yield decreases, continuous SSB increase, F decreases continuously
sc13 B 15% no constraint 7,3 31 27 100% Yield increases, continuous SSB increase, F decreases
sc14 B 20% no constraint 6,5 25 36 100% Yield slightly decreasing, continuous SSB increase, F low
sc15 B 10% no constraint 8,4 35 21 100% Yield slightly increasing, continuous SSB increase, F low
sc03 B 10% 50% 8,3 35 20 99%Yield increases, continuous SSB increase, F slightly decreasing
sc09 B 10% 20% 8,4 34 16 99% Yield increases, continuous SSB increase, F decreasessc19 B & F 15% F = 0.3 50% ��� �� �� 4%sc05 F 0,6 50% 6,5 28 25 100% Yield increases, continuous SSB increase, F stablesc17 F 0,6 no constraint 6,5 28 25 100% Yield increases, continuous SSB increase, F stable
sc20 F 15% 3 50% 7,4 31 26 100%Yield slightly increasing, continuous SSB increase, F decreases
sc11 F 0,6 20% 6,4 27 24 100% Yield increases, continuous SSB increase, F stablesc10 F 0,8 20% 7,5 33 18 95% Yield increases, continuous SSB increase, F stablesc04 F 0,8 50% 7,6 34 19 94% Yield increases, continuous SSB increase, F stablesc16 F 0,8 no constraint 7,7 34 19 94% Yield increases, continuous SSB increase, F stablesc06 F 1 50% ��� �� �� 67%sc12 F 1 20% ��� �� �� 66%sc18 F 1 no constraint ��� �� �� 65%
Note that the figures for recovery time, average yield and change in yield refer only to those runs where the simulated stock recovered.For this reason, these values are given in italic type for scenarios where the probability of recovery within ten years is less than 90%.
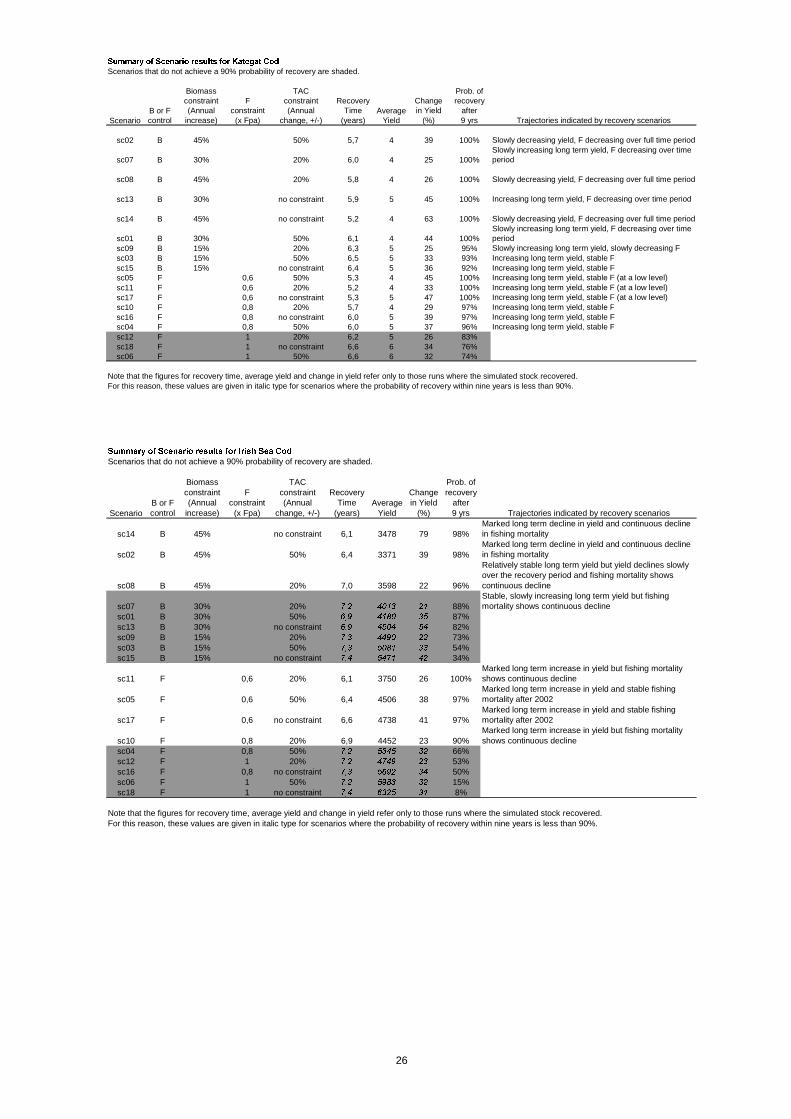
26
6XPPDU\�RI�6FHQDULR�UHVXOWV�IRU�.DWHJDW�&RGScenarios that do not achieve a 90% probability of recovery are shaded.
ScenarioB or Fcontrol
Biomassconstraint(Annual
increase)
Fconstraint
(x Fpa)
TACconstraint(Annual
change, +/-)
RecoveryTime
(years)Average
Yield
Changein Yield
(%)
Prob. ofrecovery
after9 yrs Trajectories indicated by recovery scenarios
sc02 B 45% 50% 5,7 4 39 100% Slowly decreasing yield, F decreasing over full time period
sc07 B 30% 20% 6,0 4 25 100%Slowly increasing long term yield, F decreasing over time period
sc08 B 45% 20% 5,8 4 26 100% Slowly decreasing yield, F decreasing over full time period
sc13 B 30% no constraint 5,9 5 45 100% Increasing long term yield, F decreasing over time period
sc14 B 45% no constraint 5,2 4 63 100% Slowly decreasing yield, F decreasing over full time period
sc01 B 30% 50% 6,1 4 44 100%Slowly increasing long term yield, F decreasing over time period
sc09 B 15% 20% 6,3 5 25 95% Slowly increasing long term yield, slowly decreasing Fsc03 B 15% 50% 6,5 5 33 93% Increasing long term yield, stable Fsc15 B 15% no constraint 6,4 5 36 92% Increasing long term yield, stable Fsc05 F 0,6 50% 5,3 4 45 100% Increasing long term yield, stable F (at a low level)sc11 F 0,6 20% 5,2 4 33 100% Increasing long term yield, stable F (at a low level)sc17 F 0,6 no constraint 5,3 5 47 100% Increasing long term yield, stable F (at a low level)sc10 F 0,8 20% 5,7 4 29 97% Increasing long term yield, stable Fsc16 F 0,8 no constraint 6,0 5 39 97% Increasing long term yield, stable Fsc04 F 0,8 50% 6,0 5 37 96% Increasing long term yield, stable Fsc12 F 1 20% 6,2 5 26 83%sc18 F 1 no constraint 6,6 6 34 76%sc06 F 1 50% 6,6 6 32 74%
Note that the figures for recovery time, average yield and change in yield refer only to those runs where the simulated stock recovered.For this reason, these values are given in italic type for scenarios where the probability of recovery within nine years is less than 90%.
6XPPDU\�RI�6FHQDULR�UHVXOWV�IRU�,ULVK�6HD�&RGScenarios that do not achieve a 90% probability of recovery are shaded.
ScenarioB or Fcontrol
Biomassconstraint(Annual
increase)
Fconstraint
(x Fpa)
TACconstraint(Annual
change, +/-)
RecoveryTime
(years)Average
Yield
Changein Yield
(%)
Prob. ofrecovery
after9 yrs Trajectories indicated by recovery scenarios
sc14 B 45% no constraint 6,1 3478 79 98%Marked long term decline in yield and continuous decline in fishing mortality
sc02 B 45% 50% 6,4 3371 39 98%Marked long term decline in yield and continuous decline in fishing mortality
sc08 B 45% 20% 7,0 3598 22 96%
Relatively stable long term yield but yield declines slowly over the recovery period and fishing mortality shows continuous decline
sc07 B 30% 20% ��� ���� �� 88%Stable, slowly increasing long term yield but fishing mortality shows continuous decline
sc01 B 30% 50% ��� ���� �� 87%sc13 B 30% no constraint ��� ���� �� 82%sc09 B 15% 20% ��� ���� �� 73%sc03 B 15% 50% ��� ���� �� 54%sc15 B 15% no constraint ��� ���� �� 34%
sc11 F 0,6 20% 6,1 3750 26 100%Marked long term increase in yield but fishing mortality shows continuous decline
sc05 F 0,6 50% 6,4 4506 38 97%Marked long term increase in yield and stable fishing mortality after 2002
sc17 F 0,6 no constraint 6,6 4738 41 97%Marked long term increase in yield and stable fishing mortality after 2002
sc10 F 0,8 20% 6,9 4452 23 90%Marked long term increase in yield but fishing mortality shows continuous decline
sc04 F 0,8 50% ��� ���� �� 66%sc12 F 1 20% ��� ���� �� 53%sc16 F 0,8 no constraint ��� ���� �� 50%sc06 F 1 50% ��� ���� �� 15%sc18 F 1 no constraint ��� ���� �� 8%
Note that the figures for recovery time, average yield and change in yield refer only to those runs where the simulated stock recovered.For this reason, these values are given in italic type for scenarios where the probability of recovery within nine years is less than 90%.
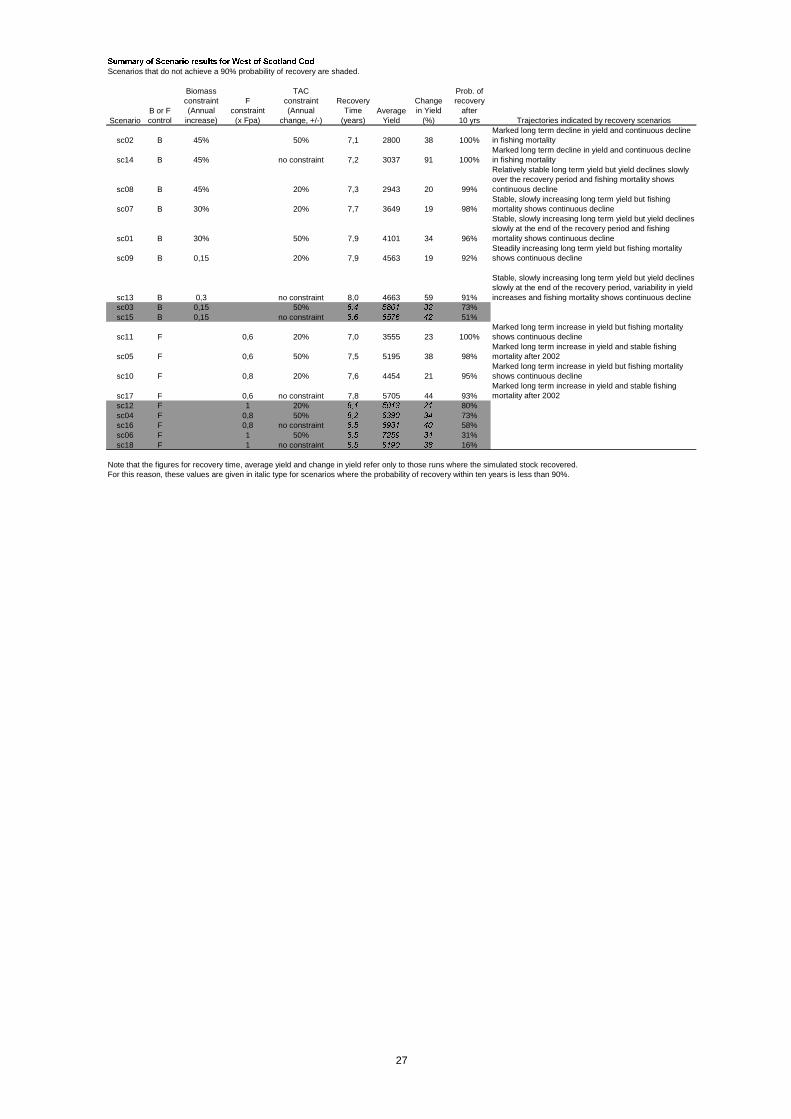
27
6XPPDU\�RI�6FHQDULR�UHVXOWV�IRU�:HVW�RI�6FRWODQG�&RGScenarios that do not achieve a 90% probability of recovery are shaded.
ScenarioB or Fcontrol
Biomassconstraint(Annual
increase)
Fconstraint
(x Fpa)
TACconstraint(Annual
change, +/-)
RecoveryTime
(years)Average
Yield
Changein Yield
(%)
Prob. ofrecovery
after10 yrs Trajectories indicated by recovery scenarios
sc02 B 45% 50% 7,1 2800 38 100%Marked long term decline in yield and continuous decline in fishing mortality
sc14 B 45% no constraint 7,2 3037 91 100%Marked long term decline in yield and continuous decline in fishing mortality
sc08 B 45% 20% 7,3 2943 20 99%
Relatively stable long term yield but yield declines slowly over the recovery period and fishing mortality shows continuous decline
sc07 B 30% 20% 7,7 3649 19 98%Stable, slowly increasing long term yield but fishing mortality shows continuous decline
sc01 B 30% 50% 7,9 4101 34 96%
Stable, slowly increasing long term yield but yield declines slowly at the end of the recovery period and fishing mortality shows continuous decline
sc09 B 0,15 20% 7,9 4563 19 92%Steadily increasing long term yield but fishing mortality shows continuous decline
sc13 B 0,3 no constraint 8,0 4663 59 91%
Stable, slowly increasing long term yield but yield declines slowly at the end of the recovery period, variability in yield increases and fishing mortality shows continuous decline
sc03 B 0,15 50% ��� ���� �� 73%sc15 B 0,15 no constraint ��� ���� �� 51%
sc11 F 0,6 20% 7,0 3555 23 100%Marked long term increase in yield but fishing mortality shows continuous decline
sc05 F 0,6 50% 7,5 5195 38 98%Marked long term increase in yield and stable fishing mortality after 2002
sc10 F 0,8 20% 7,6 4454 21 95%Marked long term increase in yield but fishing mortality shows continuous decline
sc17 F 0,6 no constraint 7,8 5705 44 93%Marked long term increase in yield and stable fishing mortality after 2002
sc12 F 1 20% ��� ���� �� 80%sc04 F 0,8 50% ��� ���� �� 73%sc16 F 0,8 no constraint ��� ���� �� 58%sc06 F 1 50% ��� ���� �� 31%sc18 F 1 no constraint ��� ���� �� 16%
Note that the figures for recovery time, average yield and change in yield refer only to those runs where the simulated stock recovered.For this reason, these values are given in italic type for scenarios where the probability of recovery within ten years is less than 90%.
28
��� (&2120,&�,17(535(7$7,21�2)�7+(�7$&6�),;('�)25�����
STECF received a report of the economic interpretation of 2001 ACFM advise submitted bythe European Association of Fisheries Economists (EAFE) (DSSHQGL[� �). The reportemployed the EIAA-model that was developed by Concerted Action and already presentedto the Committee in previous meetings.
The report presents the economic interpretation of ACFM advice for 2002. Due to a lack ofdata the results have been presented only for a part of the EU fishing fleets. The poor state offish stocks was reflected by worsening economic outlook for all fleet segments studied. Thereport presented also other bio-economic issues but failed to make long term “recoveredstock” assessment due to the lack of data.
STECF emphasizes that the report should have been prepared in October 2001 and used indecision process of 2002 TACs. In order to take account of economic perspective and link itwith the biological information, STECF underlines the need to organise the procedureneeded to carry out this exercise for 2002 (see point 9).
STECF considers that the EIAA model offers various possibilities to specify and quantifythe relations between economic processes and stock management. The model has beenapplied and proved its value in the Working Groups on the continuation of MAGP-IV andon fleet dynamics. In general, economic analysis will contribute to an improvedunderstanding of the causes of the situations and processes in fisheries. Analysis ofeconomic and environmental policies shows that understanding of these causes offers usefulstarting points for the formulation of policies and definition of policy instruments. Managingfisheries is only possible by managing fishers. Economic analysis plays a complementaryrole to the biological evaluation. Combination of the two should lead to an improvedappreciation of the causes and consequences in the relations between fishing as an economicactivity and fish stocks.
��� 0,;('�),6+(5,(6�,1�$7/$17,&��1257+�6($�$1'�%$/7,&�:$7(56
The Commission wishes to modify its form of advice to take into account the mixed natureof fisheries in the North East Atlantic (e.g. interactions between cod and haddock, cod andnephrops, plaice and sole, nephrops and hake etc.).
Following a meeting in Brussels in March 2002 it seems unlikely that ICES will be able torespond with advice based on the need for management options for mixed fisheries in theshort term. However, in the long term is might be possible to obtain mixed fishery advicethrough the ICES system. In the longer term the data regulation will also assist with thisprocess as it should ensure data on discards are collected and that data on catch by fleet isavailable. The Commission has indicated that they regard the use of data on total landingsby fleet as sufficient to carry out this investigation for the first year. STECF discussed thisissue and indicated that there will be some situations where this is not adequate. Both in afishery where catch of a none target species is dominated by discards of that species andwhere there are important differences in the catch at age by different fisheries of a singlespecies. In order to expedite this requirement it is suggested that a simple analysis becarried out in 2002 and that a medium term solution is set up for 2003 onwards.
29
����� 5(48,5(0(176�)25�����
STECF accepts that for 2002 it is preferable to carry out an analysis using total landings byspecies by fleet than no analysis at all. Initially it may be difficult to obtain catch data and itis suggested for 2002 that the work is carried out using only landings for consistency. Forthis purpose it is suggested that the Commission should request from member States therecorded landings by species by fleet by ICES division or where available for ICES sub-division for the years 1999 to 2001 inclusive to be delivered by end of September 2002. Thisdata should be provided to the STECF stock review subgroup (SGRST) at their Novembermeeting (chairman J. Casey). The SGRST will combine this with the ACFM advice toprovide multispecies catch option tables.
����� '(9(/230(176�)25�7+(�0(',80�7(50��������21:$5'6�
STECF discussed the scientific requirements for providing mixed fishery managementadvice in the medium term. Mixed fishery management may be amenable to spatio-temporalmanagement. However, considering the current single species management is generally notcarried out at this resolution, it would be more sensible to aim to carry out mixed speciesadvise at an annual level. It is important however, that multifleet management is based on ananalysis of catch at age and not just on landings data. Using such an annual approachwould imply an assumption that selection patterns by species remain constant over the twoyear period between the final year in the assessment and TAC year. This assumption is onlyslightly more demanding than the assumptions already required by the current short termprojection methods used to provide TAC advice. To implement an analysis, three areas ofdevelopment were identified as requiring attention:
• software to provide suitable output,
• Multispecies fleet definitions and single species data from assessments and multi-speciescatch at age by fleet
• resources to carry out the analyses.
����� 62)7:$5(
STECF is not aware of any currently available software that is entirely suitable for themultispecies multi-fleet fishery short term predictions required to provide advice. There hasbeen some work carried out on this problem in the Baltic but we are currently unsurewhether this software is suitable or available. This should be checked. Multifleet singlespecies software is currently available and there is some length based multi-speciesmultifleet projection software which might be applicable. However, it would not be toodifficult to carry out modification of the single species multifleet options software to allowmultiple F multipliers for multifleet short term projections.
����� '$7$�1(('6
Any study�would require ICES data from the final assessments and the short term predictionoptions by stock. These data are currently archived in a simple structure at ICES and couldbe obtained very easily if this was agreed.
There is a need to define appropriate fleets. Fleet definitions need to be adopted fromtechnical measures regulations which may correspond to different fleet definitions currentlyused to define ICES WG fleets. Currently some of the ICES WGs use both landings andcatch data as CPUE indices within assessments and some fisheries data is supplied as annual

30
or quarterly data by fleet. However given that the fleet definitions are not necessarily thesame as those required by the Commission it is unlikely that a set of fleet definitions can beconstructed for mixed fisheries by October 2002. It would also be particularly important toobtain data on catch rather than just landings. Landings reflect only the current TACsignoring discards and would make the results of multifleet projections importantly incorrectfor fleets that specifically target a small number of species and discard others heavily.
����� $1$/<6,6�5(6285&(6
Ideally ICES should carry out this task; and if the Commission wishes ICES to do so WKH&RPPLVVLRQ�VKRXOG�DVN�,&(6�WR�IRU�D�:RUNLQJ�*URXS�DVVLJQHG�WR�WKLV�WDVN. However,if ICES is unable to pass a resolution at the ICES annual meeting in 2002 to establish agroup for 2003 and onwards then STECF should take on the task. The ICES group orSTECF subgroup should consist primarily of the stock co-ordinators from the ICES WGs(WGBFAS, WGNSSK, WGNSDS, WGSSDS, WGHMM) should set up with the followingterms of reference:-
The WG should:
a) define a set of fleets that operate in mixed species fisheries and conform to theCommissions fleet definition requirements for the ICES areas III to XII. If individualfleets are not distinguishable or are too small for separate consideration the WG shouldprovide one or more combined minor fleets per area that include all these fleets.
b) Assemble annual catch at age by fleet by stock and total catch by stock, initially for 2002and then subsequently each year.
c) Obtain suitable short term prediction software suitable for multifleet multispecies shortterm predictions.
d) Collate the final assessment datasets including total F and total catch at age for speciescaught by mixed species fisheries.
e) In co-ordination with SGRST calculate annual catch at age option table by fleet that areconstant with the range of options from the ICES advice.
This WG should meet annually immediately after the ACFM October meeting to assemblemultifleet catch options based on accepted assessments and ACFM catch option tables.Preferably the members of this group should be the stock co-ordinators of the ICESassessment WGs.
7KH�&RPPLVVLRQ�PD\�ZLVK�WR�FRQWDFW�1DWLRQDO�5HVHDUFK�,QVWLWXWH�GLUHFWRUV� WR�REWDLQVXSSRUW�IRU�WKH�UHTXHVW�IRU�WKH�QHFHVVDU\�,&(6�JURXS�
����7+(� (&2120,&� ,17(535(7$7,21� 2)� $&)0� $'9,&(� �(,$$� 02'(/�� $1'
35(3$5$7,21�2)�7+(�$(5�
STECF realizes that implementation of the EIAA-model is only feasible in close dialoguebetween biologists involved in stock assessment and economist working on AER and EIAA:
- Design and inputs of the model should be tested and discussed between economists andbiologist.
- Biological inputs should be available for the economists in time.
The dialogue between biologists and economists could be organised by means of a WorkingGroup parallel to the WG on the review of stocks (SGRST) in its October meeting.Economist from STECF and invited experts should be invited to this WG.
31
Time schedule and data needs of the EIAA-model have been indicated in the reportpresented by EAFE to this meeting (annex …) and are repeated below.
����� $17,&,3$7('�352&('85(�$1'�7,0(�6&+('8/(
In order to submit the EIAA report for review by STECF in the first half of November afollowing time schedule must be foreseen (using dates of 2002):
Week 42: Concerted Action meeting, preparation of Annual Economic.
Week 43: ACFM meeting.
Week 44: STECF Economic Sub-group meeting, preparation of EIAA-report
(joint WG with SGRST).
Week 45: STECF plenary.
����� 63(&,),&$7,21�2)�7+(�%,2/2*,&$/�'$7$�5(48,5('�)25�7+(�(,$$�02'(/
All data specified below must be defined with precise correspondence to the definition ofTACs in terms of species and areas for all North East Atlantic stocks, i.e. including Norway,Iceland, Russia, Faeroe Islands, etc.
The following data are required:
- Estimation of long term TAC under precautionary conditions (yield per recruit at Fpa *number of recruits)
- Time series of SSB (1983 - present), annually up-dated to reflect latest VPA or anotherindicator reflecting fish density SSB under long term sustainable conditions
- Sets of proposed Fs, incl. Fpa, with the corresponding TACs, e.g.:
- TACs at Fpa,
- TACs at 0.8 F and
- TACs at 1.2 F.
- Indication of the multi-species effect, e.g. probability distribution that all stocks willrecover at the same time, if management is properly implemented.
����6&,(17,),&� $'9,&(� $1'� 52/(� 2)� � 7+(� 6&,(17,),&�� 7(&+1,&$/� $1'� (&2120,&
&200,77((� )25�),6+(5,(6� �67(&)�� ,1� 7+(� )8785(�&20021�),6+(5,(6� 32/,&<
�&)3�
����� �,1752'8&7,21�
It is traditionally considered, specially as a consequence of the Agreement on the applicationof the United Nations Convention on the Law of the Sea regulations regarding theconservation management of straddling and highly migratory fish stocks, as well as of theFAO Code of Conduct for Responsible Fisheries, that decisions on conservation andmanagement regarding fisheries must be based on the best scientific evidence available(taking also into account environmental, economic, social and other factors).

32
In the same way, Council Regulation (EC) No 3760/92, prior to the aforementionedAgreement and Code, by which a community regime for fish and aquaculture is established,says that when in order to guarantee the responsible and rational exploitation of resources ona sustainable basis, community regulations are established to set the conditions to access thewaters and resources, and for the exercise of exploitation activities, these will be madebased on the best available biological, socio-economic and technical analyses, andspecifically, based on the reports of the Scientific, Technical and Economic Committee forFisheries (STECF).
According to declarations made by the Directorate-General Fisheries of the EuropeanCommission to STECF, the role of STECF is to achieve a better integration of scientificrecommendations, but it is necessary to properly organize the work of this Committee.
This agenda item discusses the current role and activities of STECF, as well as the need forfuture restructuring and adaptation to new CFP.
����� 7+(�52/(�2)�67(&)�%$6('�21�7+(�&200,66,21�'(&,6,21��������(&
The Commission decision 93/619/EC of 19 November 1993, defines the constitution andmandate of the�Technical and Economic Committee for Fisheries (STECF) on the basis ofthe activities of the previous Scientific and Technical Committee for Fisheries (STECF),created in 1979.
As it literally reads: ‘:KHUHDV�WKH�LPSOHPHQWDWLRQ�RI�WKH�&RPPXQLW\�V\VWHP�IRU�ILVKHULHV�DQGDTXDFXOWXUH�UHTXLUHV�WKH�DVVLVWDQFH�RI�KLJKO\�TXDOLILHG�VFLHQWLILF�SHUVRQQHO��SDUWLFXODUO\�LQWKH� DSSOLFDWLRQ� RI�PDULQH� DQG� ILVKHULHV� ELRORJ\�� ILVKLQJ� WHFKQRORJ\�� ILVKHU\� HFRQRPLFV� RUVLPLODU� GLVFLSOLQHV�� RU� LQ� FRQQHFWLRQ� ZLWK� WKH� UHTXLUHPHQWV� RI� UHVHDUFK� LQ� WKH� ILHOGV� RIILVKLQJ� DQG� DTXDFXOWXUH¶« The Commission decision 93/619/EC of 19 November 1993,defines the constitution and mandate of the Scientific, the European Commission establishedthe Scientific, Technical and Economic Committee for Fisheries.
Article 2 of the Decision outlines the role of STECF as follows:
Paragraph 1: The Committee may be consulted by the Commission on all problemsconnected with the provisions governing access to zones and resources of Communityfisheries, and regulating the pursuit of exploitation activities.
�3DUDJUDSK����7KH�&RPPLWWHH�VKDOO�GUDZ�XS�DQ�DQQXDO�UHSRUW�RQ�WKH�VLWXDWLRQ�DV�UHJDUGVILVKHU\� UHVRXUFHV�� DQG� RQ� GHYHORSPHQWV� LQ� ILVKLQJ� DFWLYLWLHV�� ZLWK� UHIHUHQFH� WR� ELRORJLFDO�WHFKQLFDO� DQG� HFRQRPLF� IDFWRUV�� ,W� VKDOO� DOVR� UHSRUW� RQ� WKH� HFRQRPLF� LPSOLFDWLRQV� RI� WKHILVKHU\�UHVRXUFHV�VLWXDWLRQ�
3DUDJUDSK����7KH�&RPPLWWHH�VKDOO�UHSRUW�DQQXDOO\�RQ�ZRUN�DQG�UHTXLUHPHQWV�LQ�WKH�ILHOG�RIFR�RUGLQDWLRQ� RI� VFLHQWLILF�� WHFKQLFDO� DQG� HFRQRPLF� UHVHDUFK� IRU� WKH� ILVKHULHV� DQGDTXDFXOWXUH�VHFWRU�
�3DUDJUDSK����7KH�&RPPLWWHH�PD\�GUDZ� WKH�DWWHQWLRQ�RI� WKH�&RPPLVVLRQ� WR�DQ\�SUREOHPUHIHUUHG�WR�LQ�SDUDJUDSKV������DQG���
The STECF is made up by 28 members. ‘0HPEHUV�RI�WKH�&RPPLWWHH�VKDOO�EH�QRPLQDWHG�E\WKH� &RPPLVVLRQ� IURP� KLJKO\� TXDOLILHG� VFLHQWLILF� SHUVRQV� KDYLQJ� FRPSHWHQFH� LQ� WKH� ILHOGUHIHUUHG�WR�LQ�$UWLFOH��¶� (Commission decision 93/619/EC of 19 November 1993).
The Committee has a Chairman and two Vice-chairmen.
33
����� �7+(�35(6(17�:25.�25*$1,=$7,21�2)�7+(�67(&)
STECF conducts the majority of its work through Plenary sessions, permanent Sub-groupsand DG� KRF Working groups which produce studies and reports that are submitted to thePlenary sessions for discussion and eventual adoption. Plenary meetings, with a duration ofone week each, are held twice a year in April and November.
Several sub-group meetings are held between the STECF plenary meetings. In principle, theSub-group arrangement works reasonably well and the STECF sees no alternativearrangement. However, this system creates a significant additional workload for somemembers of the STECF and invited experts. Besides, it is necessary to take into account thatall of them depend on their institutes giving them leave of absence to participate in theSTECF, STECF Sub-groups activities and working groups, as well as to make the previouswork necessary to efficiently participate in them.
Present Sub- and Working groups are:
�������6XE�*URXS� WR� UHYLHZ� VFLHQWLILF� DGYLFH� RQ� VWRFNV� RI� UHOHYDQFH� WR� WKH� &)3�6*567�
Coordinator: John Casey.
This sub-group was established to undertake a review of the assessment and advice onstocks that are of relevance to the Common Fisheries Policy (CFP). This review should bepresented at a STECF plenary session so that the annual report on the state of the fisheriesresources requested by the Commission can be elaborated.
The Sub-group has to prepare an annual report on the status of the stocks that are ofrelevance to the CFP and will highlight where there are perceived or real problems with thestocks and/or with their assessments (see 8th, 10th and 12th STECF reports). The reviewshould take into account the reports of scientific bodies having research, assessment andadvisory functions on stocks of interest to the European Union, LQWHU� DOLD, InternationalCouncil for the Exploration of the Sea (ICES) and its Advisory Committee on FisheryManagement (ACFM); Standing Committee for Research and Statistics (SCRS) de laInternational Convention for the conservation of Atlantic tunas (ICCAT); ScientificCommittee for the Conservation of Antarctic Marine Living Resources (SC-CCALMR),North-west Atlantic Fisheries Organization Scientific Council (NAFO); Scientific AdvisoryCommittee (SAC) of the General Fisheries Commission for the Mediterranean (GFCM);Scientific Committee of the Indian Ocean Tuna Commission (IOTC); Central East andWestern Central Fisheries Commissions (CECAF and WECAF).
The 2001 review (12th STECF report, April 2001 – SEC(2001 1581)), presents a summaryinformation on the state of stocks and management advice for stocks of community interestthroughout the world including those in Third Country and international waters. Inundertaking the review, STECF has consulted the most recent reports on stock assessmentsand advice from appropriate scientific advisory bodies or other readily available literature,and has attempted to summarize it in a common format. The review is presently incomplete,since in some cases, appropriate information was insufficient. Nevertheless, the reportprovides summary assessment and management advice on 240 stocks out of 250 indicatedby the Commission as being of interest to the Community. In addition, information onelasmobranchs has been included in the review for the first time. The next review report willbe made in November 2002.
Furthermore this Sub-group uses to study and analyze some points on the state of resourcesin advance to their study at the STECF plenary sessions.
34
�������6XE�*URXS�RQ�)LVKHULHV�DQG�WKH�(QYLURQPHQW��6*)(1�
Coordinator: Sten Munch-Petersen.
This sub-group has to keep STECF informed on environmental problems created by fishingactivities, as well as on likely solutions to the envisaged problems and on research needs. Itmust also report on the environmental aspects that may be important on the state of certainresources or stocks. So far the Subgroup prepared two working documents bycorrespondence (Appendix II of SEC(1998)2048) and 7th STECF report) and organized aworkshop in Fuengirola (Spain) on ‘Research priorities on environmental impact of fishing’[SEC(2000)512 addendum to SEC(2000)15, 9th STECF report).
This sub-group has also organized a meeting in 2001 to analyze European fisheries in deep-waters (SEC (2002)133) and another meeting in December 2001 on incidental catches ofsmall cetaceans (SEC (2002)176).
�������6XE�*URXS�RQ�(FRQRPLF�$VVHVVPHQW��6*(&$�
Coordinator: Jos Smit.
This sub-group was established to advice the STECF on the economic implications of themanagement options. Based on the economical data available, it shall also produce abackground document to allow the STECF to prepare its annual economic report (AER) onthe economic performance of different fisheries. So far this labor has been based on thework of a ‘concerted action’ but in the future Member States must provide the necessarydata for this analysis. It is not clear yet how this transition will be carried out so that the lineof historical series developed are not lost when the ‘concerted action’ ends.
The AER shall be prepared for each November STECF Plenary Session, together with areport on the Economic Interpretation of the ACFM Advice. Four AER have been prepared(see 7th, 9th, 11th and 13th STECF reports).
�������6XE�*URXS�RQ�0DQDJHPHQW�2EMHFWLYHV�DQG�6WUDWHJLHV��6*026��
Coordinators: Ramón Franquesa and Michel Keatinge.
This sub-group was established to cover a wide and developing area that deals with fishingmanagement objectives and strategies. It shall keep the STECF informed and updated onrelevant management matters: such as precautionary approach, ecosystem approach,transferable quotas, TAC’s, real-time closures, investment in fisheries, social and politicaldimension, technical dimensions and influence of state intervention. The sub-group alsoneeds to examine the efficiency of new research methods applicable to resourcesmanagement. The goal is to help managers to implement management strategies appropriateto new problems.
The sub-group has prepared a discussion document for the November 1998 Plenary session(7th STECF report, SEC(1998)2048).
�������6XE�*URXS�RQ�5HVHDUFK�1HHGV��6*51�
Coordinator: Philippe Moguedet.
This sub-group has elaborated a report on the general needs and basic data needed for theassessment and scientific monitoring of stocks of interest for the European Union.
In addition, this sub-group has assisted the Commission in drawing up a Community schemeof fisheries data collection in support of the CFP [Council Regulation (CE) 1543/2000].

35
This sub-group will also focus on the permanent requirement of reporting to theCommission on the work done and required in the field of scientific and technical researchon fisheries. It is also expected to assist the Commission in the yearly quality control ofNational sampling Programs carried out within the framework of the above said Regulation.
In 2002 it will help the Commission in the design of a better development of scientificadvice.
The Sub-group has presented two documents for the April 2002 Meeting Plenary sessionare on the evaluation of the National Programs, the others as the “ CommunicatingAggregated Data collected under the Data Collection Regulation”
�������6XE�*URXS�RQ�%DODQFH�EHWZHHQ�5HVRXUFH�DQG�WKHLU�([SORLWDWLRQ��6*%5(�
Coordinator: Gaetano Messina.
The MAGP IV ends in December 2001. The Commission wished to be well prepared forthe next phase and therefore it requested the STECF to organize this sub-group in order toexamine the balance between the resource and its exploitation. The subject area for such asub-group is complex and deals with a wide range of technological and economic issuessuch as defining the defining the measurable and controllable parameters of fishing vessels,examining the increasing efficiency of vessels, the relationship between effort and fishingmortality, the fleet dynamics, the effect of subsidies, etc.
The sub-group prepared a discussion document for the November 1998 STECF meeting,and a review of the parameters suitable to measure the fishing effort for the April 2000STECF meeting.
Within the framework of this sub-group discussions are being developed in a� WorkingGroup on the scientific basis for a follow up to MAGP IV to address the followingquestions:
Has there been a direct link between fishing capacity (however it is measured) and deployedfishing effort (however it is measured) in the past?
Are there clear examples where various levels of deployed fishing effort can be related toobserved exploitation rates?
To what extent have other factors (technological improvements, environmental changes,biological interactions or economic factors) affected such relationships?
How does fleet capacity grow and decrease? What are the main factors that explain fleetdynamics?
Which managerial models can be used to administer fishing capacity in an efficient way?
The coordinator of this WG is Mr John Casey. The working group organized three meetings,one in 2000 and two in 2001, and it intends to prepare his final report during the first quarterof 2002. On meeting on fleet dynamics was held in February 2002.
�������6XE�*URXS�RQ�WKH�0HGLWHUUDQHDQ�6HD��6*0('�
Coordinator: Ramón Franquesa.
This sub-group is expected to support the Commission on the revision of the MediterraneanRegulation after 2002 (Council Regulation No1626/94).
36
Three very important meetings are scheduled for 2002: the first on the stocks and fisheriesfrom the Mediterranean Sea; the second on management and technical measures; and thethird on the economic performance of the Mediterranean fisheries.
By agreement made at the last plenary session of STECF, the need that the Commissionentrusted the elaboration of a series of reports on the state of the matter to an externalconsultant was suggested.
�������$G�KRF�6XE�*URXS�RQ�0DFNHUHO��6*0$&�
Coordinator: Guus Eltink.
The STECF sub-group on mackerel has been established following discussions between theEU and Norway and will look at the ways to improve the exploitation of mackerel.
����� �&200(176�21�7+(�35(6(17�52/(�2)�67(&)
The great difference existing between STECF and other international scientific committeeslies on its triple component, ‘scientific, technical and economic’, specially the economiccomponent. Scientific fisheries committees usually concentrate on the study and analysis ofpopulation dynamics and biological components, although the ‘ecosystem’ concept is beingrecently included and also the socio-economic component (GFCM). The economiccomponent, that should obviously improved and developed, even adding socioeconomiccomponent, makes STECF an exception in the study of fisheries. Another importantexception is that this Committee reviews the assessment and advice formulated by severalscientific committees belonging to different international agreements or regional fisheriesorganizations.
The second big difference is the geographic area of study. Scientific committees such asICES or those depending from international commissions for the management of fisheries(ICCAT, NAFO, CCMLAR,…), focus their studies in the regional geographic area of theircompetence. Nevertheless, STECF must cover all the geographic areas of interest for thecommunity fleets, as it is indicated by the CFP, including international waters and thirdcountry waters. This is the reason why its area of study is so wide, in addition to thecomplexity caused by its three components (scientific, technical and economic).
Because the whole fisheries sector has undergone significant changes after the regulation of1993 defining the formal role of the committee, also the actual role and the workingprocedures of the STECF have evolved over the years. One of the most important changeshas been the establishment of a number of sub-groups using external invited experts, whichhas been essential to cope with the increased workload.
Examples concerning the changes of the role of STECF after the regulation of 1993 are
- In addition, the Commission decision 1999/478/EC of 14 July 1999, created a newstructure and function for the Advisory Committee for Fisheries and Aquaculture (ACFA).The ACFA is organized into four Working Groups, each dealing with different aspects offisheries and aquaculture. STECF is a permanent member in each of the ACFA ( biologistand economist).
- STECF elaborate answers to the Commission in relation with article 16.1 (c) of the FIFGRegulation
- According to Article 8 of Commission Regulation 1639/2001 on the collection of data inthe fisheries sector, the Commission may authorise modifications as regards surveys andmay also decide on exemptions from the obligations as regards biological sampling of
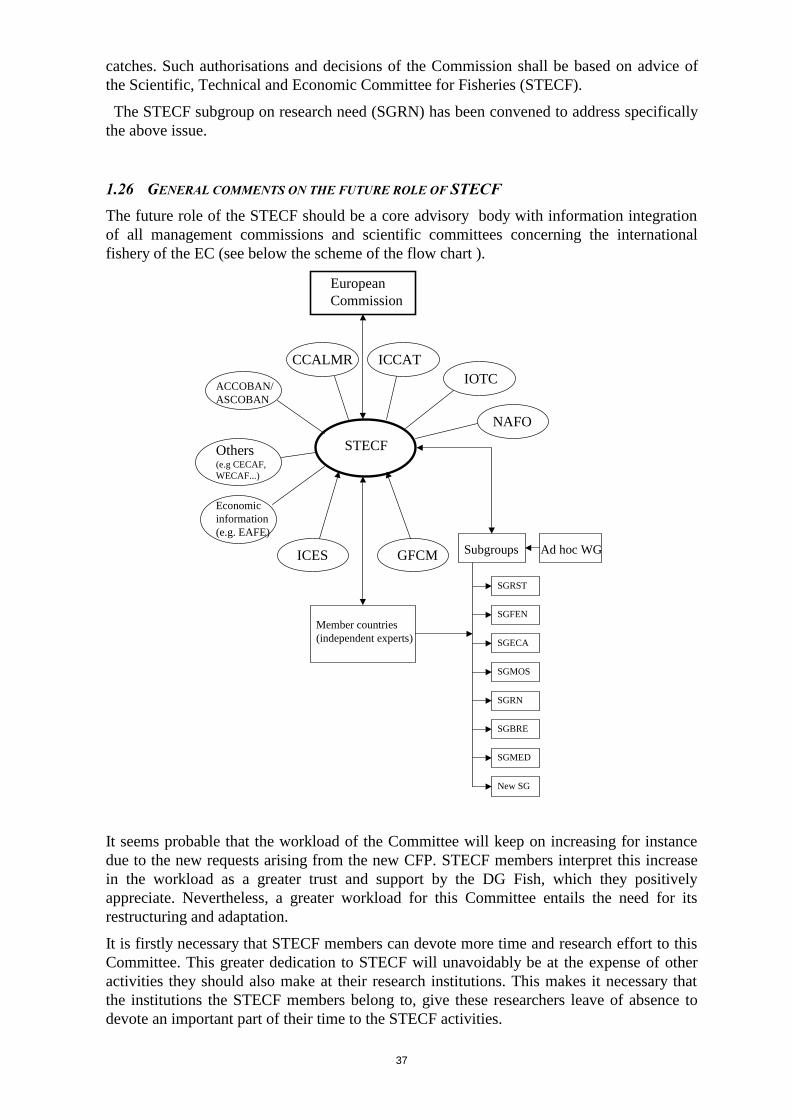
37
catches. Such authorisations and decisions of the Commission shall be based on advice ofthe Scientific, Technical and Economic Committee for Fisheries (STECF).
The STECF subgroup on research need (SGRN) has been convened to address specificallythe above issue.
����� �*(1(5$/�&200(176�21�7+(�)8785(�52/(�2)�67(&)
The future role of the STECF should be a core advisory body with information integrationof all management commissions and scientific committees concerning the internationalfishery of the EC (see below the scheme of the flow chart ).
STECF
Member countries(independent experts)
Subgroups
SGRST
SGFEN
SGECA
SGMOS
SGRN
SGBRE
SGMED
ICES GFCM
ICCAT
NAFO
CCALMR
ACCOBAN/ASCOBAN
Others(e.g CECAF, WECAF...)
IOTC
EuropeanCommission
New SG
Economicinformation(e.g. EAFE)
Ad hoc WG
It seems probable that the workload of the Committee will keep on increasing for instancedue to the new requests arising from the new CFP.�STECF members interpret this increasein the workload as a greater trust and support by the DG Fish, which they positivelyappreciate. Nevertheless, a greater workload for this Committee entails the need for itsrestructuring and adaptation.
It is firstly necessary that STECF members can devote more time and research effort to thisCommittee. This greater dedication to STECF will unavoidably be at the expense of otheractivities they should also make at their research institutions. This makes it necessary thatthe institutions the STECF members belong to, give these researchers leave of absence todevote an important part of their time to the STECF activities.

38
The per-diem rate remained at the same level for long times and nowadays it is well far tocover the costs.
Due to the fact that the necessary preparatory work takes a lot of time to the STECFmembers and invited experts before each meeting and the number of documents isconsiderably increasing, a proper compensation for the high level professional work is alsonecessary to cover either the additional workload and the time spent in the meetings.
Nowadays, STECF members are appointed by the Commission in an essentially honorificway, as due to legal reasons they do not receive any economic compensation for the workand time devoted to this Committee (the Commission Decision 93/619/EC clearly states thatthe duties of members of the STECF shall not be subject to remuneration). This causes thatSTECF members do a voluntary work and in some cases creates a problem of activeparticipation in the meetings or works that the Commission entrusts the Committee. Inaddition, their origin institutions do not receive any compensation for the time STECFmembers are absent from their workplace. Therefore it is essential to look for anappropriate solution that allows a greater allocation of time to the STECF.
When the ‘Green Paper’ on ‘The future of the Common Fisheries Policy’ refers to ‘TheFuture CFP: options and preferences’ it only mentions STECF with respect to theMediterranean Sea, when it mentions the need to ‘improve the governance inside the CFP’ itdoes indicate that we should tend to a “better integration of scientific advise in the decision-making process’.
In addition, in case the workload increases further it is necessary to adapt the STECFstructure in order to achieve:
A stable independent advisory system
A permanent structure with an appropriate expertise of the specialists.
A structure ensuring that the STECF advice will be produced during the Plenary Meetings
That experts can continue to work being independent from Member States.
That experts can devote enough time to STECF work.
An appropriate support from the European Commission regarding both financial support andsecretariat (which is currently overloaded with work).
On the other hand, STECF members must have access to databases and other necessaryinformation relative to biology, technology and economy so that they can carry out theirwork in a proper way.
It is necessary to create a monitoring scheme of the data collection system which is currentlybeing used.
A closer relation with the existing fisheries scientific committees is needed, and specially acloser relation with the existing economic study structures or committees. This would alsoentail to start an information system to provide the STECF members with the scientificcommittees reports in real time or in reception times equivalent to those of their respectivescientific committee.
Regarding this point it is necessary to highlight the specific problems of data andinformation on fisheries economy. If there are problems to obtain biological data, thisproblem becomes worse with economic data. Even in the case a community collectionsystem is established, a new delay will occur with economic data.
It is necessary to create stable structures that guarantee economic analyses similar to theexisting biological analyses. There is still a clear need to integrate better the biological andeconomic elements of the Committee.
39
The STECF is an expert advisory tool for the EC to better manage in a sustainable way aswell as the fishery resources and the EC fishery sector and to strengthen EU competence androle an a global market scale for the aquatic products.
67(&)�VWURQJO\�UHFRPPHQGV�WKDW�D�GLUHFW�PHHWLQJ�EHWZHHQ�WKH�&RPPLVVLRQ�DQG�WKH67(&)�%RDUG�VKRXOG�EH�DUUDQJHG�WR�GLVFXVV�WKH�SUREOHPV�UHSRUWHG�LQ�WKLV�LWHP�WU\LQJWR� ILQG� SURSHU� VROXWLRQV�� WDNLQJ� DGYDQWDJH� RI� WKH� FXUUHQW� H[SHULHQFH� WR� LPSURYH� WKHZRUNLQJ�FRQGLWLRQV�XQGHU�ZKLFK�WKH�6FLHQWLILF�&RPPLWWHH�LV�DVNHG�WR�RSHUDWH�
����6&,(17,),&� ,1)250$7,21� 2)� 7+(� ,03$&7� 21� ),6+� 5(6285&(6� 2)� '(52*$725<
),6+(5,(6�:,7+�³*$1*8,´�,1�7+(�0(',7(55$1($1�
STECF cannot provide further advice to what already stated in its 13th report SEC(2002)410 since no new updated scientific information have been made available.
����5(9,(:�21�7+(�,&(6�&200(176��21�3/$,&(�,1�6.$*(55$.�$1'�.$77(*$7���62/(
,1�',9,6,21�9,,,$%
����� �62/(�,1�',9,6,216�9,,,$%��%$<�2)�%,6&$<�
The new information on the state of the sole stock in the Bay of Biscay does not change theperception of the stock. The ICES advice is that there is no basis to revise the previousadvice on the stock. STECF endorses the ICES advice for 2002.
����� 3/$,&(�,1�',9,6,21�,,,$��6.$*(55$.��$1'�.$77(*$7�
The study presented by ICES is a non standard analysis for this stock. Substantial changes inassessment methodology have been undertaken since the previous assessment, although thejustification for this is unclear. It is unclear from the report provided by ICES whichelements of the change in perception of the stock are due to which changes. It would havebeen more helpful to have had the assessment presented in the same manner with only theaddition of survey and catch data. There is however, strong evidence to suggest there theview of the stock used for ICES advice in 2001 is incorrect.
STECF is concerned that the new perception of the stock is based on an assessment at age 2-6 which for management purposes is being compared to precautionary reference pointsbased on an assessment over ages 2-11. ICES indicates that the new assessment is moreuncertain than the previous assessment, this is not unusual with the addition of a new timeseries, and is not of great concern.
However, there is no reason to believe that the results presented by ICES are erroneous andSTECF accepts that the new data changes the perception of the stock.
ICES indicates that the 2001 advice was based on both the state of the plaice stock andconcern about the cod by-catch in the fishery. There is also indications that fishing effort bythis fleet has increased.
STECF notes that the information provided by ICES indicates that the perception of thestock has changed and that a rise in TAC for plaice could be considered up to a maximum of32%. However, STECF also notes that the ICES 2001 advice included elements to protectcod. STECF has not been provided with information to evaluate the influence of thisputative change in plaice TAC on the protection of Cod. STECF therefore can only endorse
40
any increase in the 2002 TAC for plaice provided any deleterious effects on cod areacceptably small.
����27+(5�0$77(56
����� 62&,2�(&2120,&�,1',&$7256
Recently, requests have been made to provide a list of socio-economic indicators fordifferent purposes. Requests are related to the revision process of CFP and to the debate inOCDE on sustainability. Socio-economic indicators are also needed by regionalorganisations such as GFCM in relation to management of effort.
In January 2002, STECF was requested by the Commission to provide a list of indicators inrelation to co-ordination of work between the Commission, Eurostat, OECD and FAO. Aftercorrespondence by e-mail, STECF has submitted a set of key indicators (Appendix 5) thatwas mainly designed for the harvesting sector and on based on economic data specified inCouncil Regulation 1543). STECF recognises that this list could be extended with manyother indicators depending on information required for specific analysis’s. Also, theindicators could take various dimensions in terms of space, fleet segmentation and time.Background considerations for a comprehensive set of indicators are elaborated below and acorresponding list of indicators is presented in Appendix 6.
Sustainability implies that the economic incentives in fishing act in the right direction inorder to achieve and to maintain the number of fishing enterprises and the level of capitalthat can be employed profitably without hampering the opportunities of the next generation.
To achieve this, the capital employed (and recovered in case of departure from the industry)must provide an equal or higher return than could be earned elsewhere (opportunity cost).This supposes a minimum degree of efficiency supported by appropriate resources ofcapital, skilled labour and surplus fish stocks.
Technical progress implies that in an industry dependent on a limited renewable naturalresources, the number of participating enterprises and the labour employed will, in the longrun, decrease. Though, there may be periods of adjustment when this trend is reversed orhalted due to economic, technical and environmental changes..
The underlying notion is that to be economically and socially sustainable, a fishery must becapable of being exploited profitably at some biologically sustainable level. The purpose ofindicators should therefore be to point out whether a fishery is currently sustainable,economically, socially, and biologically. They should also indicate if that fishery is capableof being exploited sustainable at all and if so at what levels of capital and labour employedand at which stock sizes.
Some advances are in progress as regards socio-economic indicators to help themanagement process and the analysis of fishing activities. However, in many fisheries, longterm forecasts are uncertain. One of the utilities of economic indicators is in analysis of theevolution of their value over time .Collection of homogenous information across the time istherefore a fundamental.
Relevant work developed recently2, contributes to establishing homogenous sets ofindicators and methods to obtain such indicators for the most relevant problems that appearin this moment. The three items where the STEFC can provide advise are:
2 The documents in consideration are:
41
- The definition of the geographical areas
- The definition of the segments
- The definition of the basic indicators (and the data needs)
�������7KH�GHILQLWLRQ�RI�WKH�JHRJUDSKLFDO�DUHDV
The minimum level of analysis proposed is the PHPEHU�6WDWH�(13 areas), but in general thislevel is to general and it does not produce the precision requested, in particular in caseswhere fishing is conducted on different fishing grounds
A second level is the UHJLRQV�RI�LQGLYLGXDO��PHPEHU�6WDWHV�(around 90 regions). This levelis more related to the real management of effort (Scotland, Galicia, Bretagne, etc). In somecases it demonstrates large heterogeneity from some areas to others inside the same region.
The most precise segmentation level from economic point of view is the ODQGLQJV�DUHD (theregion of influence of the most important fishing harbours) that provides information on theeconomic performance of each local fleet. Many studies show a large degree of variabilitybetween harbours (often larger than the differences between countries). The problem of thisoption is that this may concern between 200 to 400 areas, and the costs to collect andprocess the data are expected to be high
The definitive level of precision, of the indicators is a political decision that is related torequested level of precision demanded by the managers, the cost of data collection and theinstitutional facilities to collected the necessary data.
�������7KH�GHILQLWLRQ�RI�IOHHW�VHJPHQWV
The fleet segments are the management subject in economic analyses. They encompassvessels with similar characteristics. However, such categorisation follows no fixed criteriaand there is room for many amendments. We may classify vessels according to size (bigvessels and small vessels), gear, fishing grounds where they usually operate, etc.
Fishing fleets are the cornerstones of any socio-economic analysis, just like the concept of“species” is to a biological analysis. The basic unit of analysis for an economist is a fleet ofvessels having a common a structure of costs, employment, products and markets. Ifsegmentation is the instrument to define the object of the economic analysis, then theeconomic perspective should be a central criterion to for defining vessels groups.Obviously, it is also necessary to establish segmentations for other research perspectivessuch as stock assessment.
Regulations (on fishing schedules, licenses, taxes, etc.) are normally binding for specificfleet groups. This means that a correct fleet segmentation is essential for the construction ofthe indicators that would otherwise prove to be useless for management analyses.
- Hans Frost, Jørgen Løkkegaard and Philip Rodgers, Comments to “Outline for a study on Economicand Social Fisheries Sustainability Indicators OECD, AGR/FI (2000)5/REV1
- Franquesa, R. “Spain – Methodolgy and use of socio-economic indicators for managing fisheries”OECD, AGR/FI (2001)12/Part1
- Franquesa, R.; Malouli, I.M.; Alarcón, J.A. Feasibility assessment for a database on socio-economicindicators for Mediterranean fisheries. Studies and Reviews. General Fisheries Commission for theMediterranean. No. 71. Rome, FAO. 2001.
- Working Party on Fisheries Economics and Statistics of the GFCM, Denis Bailly & Ramon FranquesaWP/98/3 Les indicateurs socio-économiques dans l’aménagement des pêches en Méditerranée:éléments de réflexion, March 1998. CGPM, FAO, Rome.
42
Finally, segmentation needs to be coherent with the data source used.
Taking into account all these considerations and the work developed before by the STEFC,we suggest to use the segmentation defined in EU Council Regulation 1543 (2000): by gearand length.
�������7KH�GHILQLWLRQ�RI�EDVLF�LQGLFDWRUV�DQG�GDWD�QHHGV
There are many potential socio-economic indicators for fisheries. Some studies areproduced on this mater, recently. One of the most important restrictions appeas to be theability of the data. This limits the number of indicators available for the managers. Thecriteria to establish the minimum number of indicators are:
- The needs of management
- The availability of the data
- The capacity to obtain this data annually on regular basis.
- The capacity to collect this data with common methodology in all member states.
Some of the indicators are more useful at the MS level for analyses of the national fishery,others are more relevant for analysis of fleet segments at the national level or at a furtherdesegregated level (region or local). The lowest aggregation level is the most interestingone for management purposes, because it can identify clearly the characteristics ofsegments subject to management tools.
��������� 1DWLRQDO�OHYHO�LQGLFDWRUV�
The national level indicators have been divided in four categories. Most of the 11 data baseinputs required to elaborate these indicators are available at Eurostat and there do not seemto be methodological problems to build homogeneous data sets for all member states.Table 1 of Appendix 6 presents a list of indicators relevant on national level.
��������� ,QGLFDWRUV�E\�IOHHW�VHJPHQWV��1DWLRQDO��UHJLRQDO�RU�ORFDO�OHYHO��
Indicators on national fleet level provide general information on the relative situation offisheries between member states, regions or areas of the EU . It is a first step to understandthe situation and the evolution of the fisheries subjected to the CFP. However, managementmeasures are generally not implemented at national level, because the level of aggregationis to high. Regional or local segmentation is in particular relevant for proper collection ofdata but it provides also relevant information on the sustainability of particular fisheries andmanagement of specific fleets (especially when time series are available). The indicatorsconsidered to be most relevant for analysis by region or by segment have been summarizedin table 2 of Appendix 6 The data required for these indicators allow elaboration of manyother indicators.
The indicators described above are all related to the economic dimension. Social andenvironmental aspects are only covered as far as they touch upon the economic dimension.
Economic analysis of sustainability of fisheries present a particular difficulty. In principle,an important indicator is associated with: UHQW� DFKLHYHG� RU� IRUHJRQH. The underlyingintention is to demonstrate how much is being wasted through inefficient fisheriesmanagement (including poor stock conservation). However, this complex indicator isdifficult to calculate because it requires knowledge of the economic potential a fisheries hasin a situation of recovered stocks. Alternatively, some PHDVXUH�RI�HIILFLHQF\ would serve todemonstrate excessive capacity in the fishing industry or to measure whether capital was
43
being employed in-efficiently. A demonstrated degree of inefficiency or under utilization ofcapital would offer a struggling industry the opportunity to rationalise and survive. Anefficient industry finding itself in economic difficulties might be in an untenable position.
�����5(&29(5<�3/$16
STECF has been requested to evaluate the following four proposals of recovery plansaccording to Article 16(c) of Council Regulation 2792/1999: bottom trawl fishery forshrimps and longline swordfish fishery in Sicily, longline fishery for blackspot seabream(Pagellus bogaraveo) in Andalusia and southern hake fishery in Galician waters.
STECF has evaluated during the plenary session only the hake fishery in Galician waters,due both to the complexity and late arrival of the other three proposals.
STECF, due to the amount of the documentation attached to each proposal together somecontroversial aspects detected after a first scrutiny of the proposals themselves, decided toconvene a two days meeting, in Brussels, to examine more deeply the proposed recoveryplans.
STECF highlighted that the numbers and complexity of proposals aiming to use article16.1(c) of FIFG Regulation has been increasing in the last year. STECF underlined theimportance of an accurate scientific scrutiny of recovery plans, submitted either by memberStates or their autonomous regional Administrations, to avoid hidden subsidies to fishingfleets.
STECF noted that the complexity and huge amount of documents, often in original language,may make inappropriate, in several occasions, the previously agreed fast track procedure toevaluate the proposals by correspondence.
Therefore, it is important that STECF is put in a position to properly evaluate such proposalsduring its plenary sessions (April and November). STECF, to allow the Commission to replyto the national or regional Administrations within the delay of 60 days, should provide itsadvice to the Commission in 2-3 weeks time from the request. Therefore, it would beadvisable to limit the period, in which member States can present their recovery planproposals, to one month before each STECF plenary session.
Therefore, STECF recommended the Commission to ask member States to submit theirrecovery plans proposals within one month before each STECF session . The Commissionmay wish to ask the proponents to submit their proposals both in paper copy and inelectronic format, together a detailed executive summary, either in English or French, tospeed up the evaluation process.
�������+DNH�5HFRYHU\�3ODQ��*DOLFLDQ�5HJLRQ�UHTXHVW�
The STECF was requested by the Commission to advise on a proposal from the Galicianauthorities concerning a recovery plan for hake during the period 2002-2004. It wasproposed to tie up the Galician trawler fleet for a total period of 4 months during a three yearperiod (2002-2004). This 4 months period would be chosen within the periods of closure ofthe two hake boxes, which were established to protect the juvenile hake.
STECF tried to estimate the maximum expected reduction of the fishing mortality due tothis measure. For this stock a fishing mortality of 0.28 in 2001 was estimated. Based on atotal period of 4 months being tied up period during these 3 years the maximum annualreduction of fishing mortality would be about 11%. Taking into account that it applies onlyto the Galician trawlers which are approximately 65% of total Spanish trawler fleet fishing
44
southern hake, suggesting the maximum reduction of fishing mortality is therefore expectedto be around 3%. In addition because the proposal did not include any reduction in TAC it isexpected that the Spanish trawler fleet may take their TAC for hake anyway.
For this reason STECF expects that this proposal would have negligible conservation benefitfor the southern hake stock.
����� (&2120,&�$63(&76�2)�(8�),6+(5,(6
Results of the Concerted Action (FRQRPLFV� DQG� WKH� &RPPRQ� )LVKHULHV� 3ROLF\� werepresented to STECF by its coordinator Aaron Hatcher.
Results of the Concerted action summarised by the coordinator
For the future of fisheries management under the CFP, the key points to emerge from theconclusions of this group were as follows:
− Firstly, the apparent failure of the CFP to prevent continued depletion of a number ofimportant stocks suggests a failure of at least some Member States effectively tomanage their fleets within the exploitation limits set by the TACs. The CFP mustensure that the activities of individual vessels are monitored and that catch limits areenforced.
− Secondly, that there should be a general presumption against subsidies in fisheries. Theargument for this is not so much against subsidies in general but because subsidiesincrease incentives to expand fishing effort. Where fishing effort is poorly controlledtherefore, subsidies will seriously exacerbate the management problem. In thesecircumstances, it is especially difficult to justify capital subsidies for vesselconstructions and modernisation’s.
− Linked to this, the MAGPs can be interpreted as a sign of management failure. Moreseriously, they are likely to be relatively ineffective for a number of reasons: thewithdrawal of marginal capacity, subsidies for new investments, reinvestment ofcompensation payments, technological progress as well as substitution for controlledinputs (nominal capacity measures).
− Finally, there has been a tendency at the Community and national levels to valuefishery resources for the employment they create. Arguably this has led to policieswhich create perverse incentives to expand effort, including subsidies and poormanagement decisions. Fisheries policy should not be used to tackle regionalemployment problems. Rather attention should be focused on sustainable exploitationand the generation of economic benefits from the resource.
�������&RPPHQWV�E\�67(&)�DQG�IROORZLQJ�GLVFXVVLRQ
STECF appreciates the transparent and sound opinion presented. However it wascommented that the conclusions are based mainly on cases in Baltic and Atlantic fisheriesand that not all conclusions might be directly applicable to fisheries with a differentstructure, state of development or management system like fisheries in the Mediterranean. Inthis light, the following questions and comments were made:
- social aspects (in particular employment aspect) have not extensively beenconsidered in a positive sense. The CFP cannot provide solutions in the harvestingsector. However, employment is part of CFP and it should be part of a CommonPolicy in terms that fishermen should be assisted in finding employment in othersectors in addition to general employment programmes.
45
- the evidence of some of the ideas has not but not been demonstrated. For example:why should an ITQ’s system reduce instead of increase discarding?
- Any considerations about introduction of fishing rights like ITQs should beconsidered in the light of existing overcapacity, relative stability etc.
- The general conclusion of the Concerted Action is that subsidies are detrimental forsustainable fisheries. However, the impact different types of subsidies may have isnot clear. There are some subsidies which are likely to encourage restructuring of theEuropean fleets. During the period of restructure, the public action may be desirableas they reduce the time where a situation of overcapacity remains.
- The conclusion that international agreements are subsidies to the industry is asimplification. Many agreements contain other elements than fishing rights. Moredeep analysis is needed to identify other elements like: direct financial aid, additionalrules (local crew, local inputs, landing in local ports, etc) and free transfer ofknowledge by companies involved.
Mr Hatcher responded briefly to these points as follows:
(1) There was no suggestion that employment in general and employment in fisheries in
particular was not a good thing in itself, rather that fishery management decisions
influenced by a desire to safeguard current employment levels have the potential to
impose very adverse effects on resource sustainability. To give a simple example,
suppose we have a heavily exploited fishery and the development of new technologies
that increase the effectiveness of effort. In order to maintain current employment
levels we then would have to allow effort to increase, but this would have a negative
impact on the fish stock.
(2) Empirical evidence on the actual effects of ITQs on discards is scarce and often not
conclusive. Incentives to discard are created by factors other than quotas, but are
indeed created by individual quotas. My main point was not that ITQs do not create
discard incentives but that in multispecies fisheries quota related-discards should be
reduced if quotas are tradable rather than fixed (as in monthly limits) and therefore
individual vessels can better tailor their quotas to their catches. High grading is a
well-known (though possibly over-stated) problem with ITQs, but it will occur with
fixed quotas and physical constraints (hold sizes etc) as well.
(3) I acknowledged that there was a case for subsidies to reduce capacity, but emphasised
that this should be tackled as an acute, not a chronic, problem. That is, the
management effectiveness should be got right so that over-capacity does not re-occur.
Our report pointed out a number of problems with continual capacity adjustment
programmes.
(4) Indeed most third country fishing agreements are complex in their detailed terms and
are often linked to other instruments of international cooperation, such as aid
programmes, cooperation agreements, technology or agricultural trade agreements, etc.
Nevertheless, if the substantive terms of an agreement consist of the exchange of EU
funds for access to fish stocks, I think we are entitled to look at the net economic
benefit to the Community (or the net cost...) and how the benefits and costs are

46
distributed between the public and the fishing industry. This does not mean, of course,
that this cannot then be weighed against other benefits of international cooperation.
����� 67(&)�$&7,9,7,(6��$1'��3/$11,1*��2)�0((7,1*6��)25�����
In closure of the meeting it was recalled that the next plenary session will take place inBrussels from 04 to 08 November 2002.
The following table shows the provisional activities of STECF and its sub-groups in 2002.
67(&)�6XEJURXS�DG�KRF�:* ITEM Date3OHQDU\�6HVVLRQ
67(&)� %RDUG�� Alberto GonzalezGarces; Philippe Moguedet; ToreGustavvsson
22 - 26 April
4 – 8 November
WG on Stock status reviewChairperson: John Casey
28 October – 1November(joint WG withSGECA + mixedfisheries)
WG on elasmobranch fisheriesChairperson: Henk Heessen
Tentative date 23-26 September
WG on mixed fisheries October
6*567�� subgroup on review ofstocks
&RRUGLQDWRU��John Casey
WG on evaluation of recovery plans 20-22 March
6*)(1�� sub-group on Fishery andEnvironment
&RRUGLQDWRU�Sten Munch Petersen
WG on Incidental catches ofcetaceansChairperson: Simon Northridge
Tentative date 11-14 June
6*(&$�� sub group on economicassessment
&RRUGLQDWRU�Jos Smit
Fleet status report and EconomicImpact of ACFM AdviceChairperson: TBD
28 October – 1November (jointWG with SGRST)
WG on Stock status andfisheries descriptions
Chairperson: Ardizzone
4-6 September
WG on technical measures andmanagement options simulations
Chairperson: Messina
Fourth quarter
6*0('�� sub group onMediterranean
&RRUGLQDWRU�Ramon Franquesa
WG on economic performance ofMediterranean fisheries
Chairperson: Franquesa
Fourth quarter
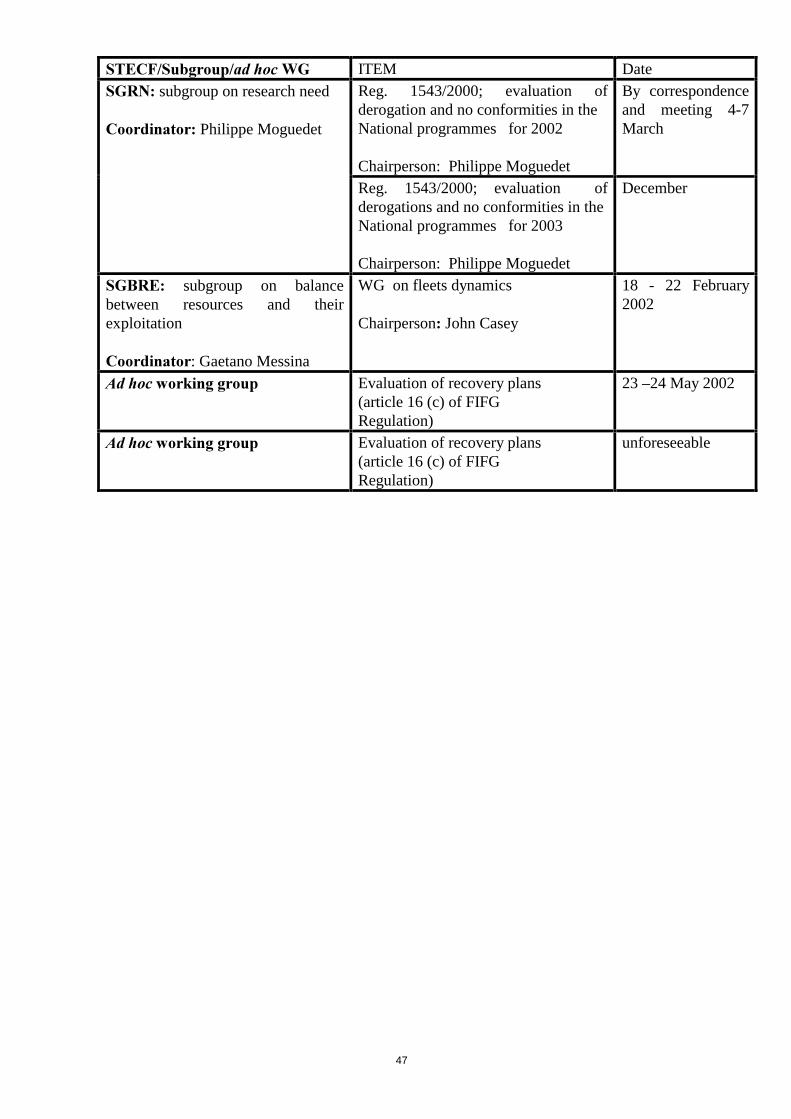
47
67(&)�6XEJURXS�DG�KRF�:* ITEM DateReg. 1543/2000; evaluation ofderogation and no conformities in theNational programmes for 2002
Chairperson: Philippe Moguedet
By correspondenceand meeting 4-7March
6*51��subgroup on research need
&RRUGLQDWRU� Philippe Moguedet
Reg. 1543/2000; evaluation ofderogations and no conformities in theNational programmes for 2003
Chairperson: Philippe Moguedet
December
6*%5(�� subgroup on balancebetween resources and theirexploitation
&RRUGLQDWRU: Gaetano Messina
WG on fleets dynamics
Chairperson��John Casey
18 - 22 February2002
$G�KRF�ZRUNLQJ�JURXS Evaluation of recovery plans(article 16 (c) of FIFGRegulation)
23 –24 May 2002
$G�KRF�ZRUNLQJ�JURXS Evaluation of recovery plans(article 16 (c) of FIFGRegulation)
unforeseeable

48
�����$33(1',;������3$57,&,3$176�/,67
Arrhenius FredrichInstitute of Marine Research NationalBoard of FisheriesSE-453 21 LysekilSwedenTel: +46523 18746Fax: +46 523 13977E-mail: [email protected]
Ardizzone GiandomenicoDip. Biologia Animale e dell’UomoUniversità di Roma "La sapienza"Viale dell 'Università 32I-00185 RomaItalyTel: +39-06-49914773Fax: +39-06-49914773E-mail: [email protected]
Camiñas Juan AntonioCentro Oceanográfíco de MálagaPuerto Pesquero s/n. Ap. 285E-29640 Fuengirola (Málaga)SpainTel: +34-952-478148Fax: +34-952-463808E-mail: [email protected]
Demaré WimMinisterie van Landbouw, DepartementZeevisserijAnkerstraat 1B-8400 OostendeBelgiumTel: +32 59 34 22 58Fax: +32 59 33 06 29E-mail: [email protected]
Di Natale AntonioAquastudioVia Trapani 6I-98121 MessinaItalyTel: +39 090 34 64 08Fax: +39 090 36 45 60E-mail: [email protected]
Eltink GuusRIVO-DLORijksinstituut voor VisserijonderzoekHaringkade 1P.O.Box 68NL-1970 AB IjmuidenThe NetherlandsTel: +31-255-564691Fax: +31-255-564644E-mail: [email protected]
Ernst PeterBundesforschungsanstalt für FischereiAn der Jägerbäk, 2D-18069 RostockGermanyTel: +49-381-810352Fax: +49-381-810445E-mail: ernst,[email protected]
Franquesa RamonGEM-Universidad de BarcelonaAv. Diagonal, 690E-08034 BarcelonaSpainTel: +34-932178734Fax: +34-932178734E-mail: [email protected]
Gonzalez Garces AlbertoCentro Oceanográfíco de VigoApartado 1552E-36200 VigoSpainTel: +34-986-492111Fax: +34-986-492351E-mail: [email protected] ToreFiskeriverket, National Board of FisheriesBox 423S-401 26 GöteborgSwedenTel: +46-31-7430300Fax: +46-31-7430444E-mail: [email protected]

49
Hatcher AaronUniversity of PortsmouthDept of EconomicsPortsmouthP04 85FUnited KingdomTel: +44 2392 844230Fax: +44 2392 844 037E-mail: [email protected]
Keatinge MichaelBord Iascaigh MharaDun LaoghaireDublinIrelandTel: +353 1 2144 230Fax: +353 1 2300 564E-mail: [email protected]
Lokkegaard JorgenDIAFEDanish Institute of Agricultural andFisheries EconomicsToftegards PladsGammel KoegeLandevej 1-3DK-2500 Valby (Copenhagen)DenmarkTel: +45-36442080Fax: +45-36441110E-mail: [email protected]
Messina GaetanoConsiglio Nazionale delle RicercheIstituto di Ricerche sulla Pesca MarittimaLargo Fiera della PescaI-60125 AnconaItalyTel: +39-71-2078831Fax: + 39-71-55313E-mail: [email protected]
Moguedet PhilippeIfremerrue François Toullec 8F-56000 LORIENTFranceTel: +33-297873803 +33-297873800Fax: +33-297873836E-mail: [email protected] StenDIFRES -Danish Institute for FisheriesResearchCharlottenlund CastleDK-2920 CharlottenlundDenmarkTel: +45-33 96 33 90Fax: +45-33 96 33 33E-mail: [email protected]
Officer RickMarine InstituteAbbdtstown lab complex snugbordAbbotstownDublin 15IrelandTel: +35 31 822 82 00Fax: +35 31 820 50 78E-mail: [email protected]
Pestana GraçaIPIMARAv. BrasíliaP-1400 LisboaPortugalTel: +351-21-3027000Fax: +351-1-3015948E-mail: [email protected]
Polet HansMinisterie van Landbouw, DepartementZeevisserijAnkerstraat, 1B-8400 OostendeBelgiumTel: +32-59-320805Fax: +32-59-330629E-mail: [email protected]
50
Salminen MattiFinnish Game and Fisheries ResearchInstitute (FGFRI)Pukinmäenaukio 4 P.O.Box 6F-00721 HelsinkiFinlandTel: +358-205-751-302Fax: +358-205-751-201E-mail: [email protected]
Smit JosLEI-DLO,Landbouw Economisch InstituutAfdeling VisserijP.O.Box 29703NL-2502 LS Den HaagThe NetherlandsTel: +31-70-3308238Fax: +31-70-3615624E-mail: j.g.p. [email protected]
Virtanen JarnoFGRIP.o Box 6FIN-00721 HelsinkiFinlandTel: +358 205 751 302Fax: +358 205 751 200E-mail: [email protected]
51
����$33(1',;����'$7$%$6(
Working group on database development22-24 April 2002, Brussels
&20081,&$7,1*�$**5(*$7('�'$7$�&2//(&7('�81'(5�7+(�'$7$&2//(&7,21�5(*8/$7,21
��� ,1752'8&7,21
The European Commission (EC) has initiated a process of development of standards for dataexchange of data collected under the Commission Regulation (No. 1639/2001). Under thisregulation, data of very different nature are collected including biological and economicdata. One of the general aims of the data collection process is to enhance the ability to assesschanges in fish stocks and in the fisheries. Therefore, the data that will be collected underthe regulation are also of high relevance to LQWHU�DOLD GCFM, ICCAT, ICES and NAFO intheir work of assessing the state of the stocks and to advice on future management. It is clearthat these regional fisheries organisations and EC have common interests in this field.
The necessity to exchange data as laid down by the Commission Regulation (No 1639/2001)should be used as the basis for the data-exchange within these European communities. Therequired formalised data communication procedure allows data from a database to beaccessed from other centres including EC and member states.
The aim is to establish this data communication process as the common process used in allanalysis of fisheries and stock structure.
The subsequent discussion is split into four parts
• Fisheries data for catch and effort,
• Economic data for fisheries
• Survey results
• Biological data.
The data on recreational fisheries in general follow the same specifications as thecommercial fisheries. Comments related to data for commercial fisheries also apply to thesefisheries.
The working group proposes a process whereby the system’s specifications are finalised by aconsultant, the consultant proposal is discussed within the management Committee and theimplementation is done through a further consultancy. A detail call for tender is given insection 5.
��� &200,66,21�),1$1&('�352-(&76�21�(67$%/,6+,1*�'$7$%$6(6�,17+,6�),(/'
EC has financed a number of projects that provide input to the definition of the processfurther elaborated below. These projects address specific data groups. Examples are
• EMAS (EU study project 98/075), SAMFISH (EU study project)
• DATRAS (Database for abundance trawl survey data)
• MEDITS
• Concerted action for economic data
52
• BALTCOM
��� '$7$�(;&+$1*(�675$7(*,(6
Under ideal conditions, the best approach to sampling biological data might be to set up acoordinated system of sampling whereby the methods and stratification would be the sameover all member states. We are at present not close to that situation nor is the commonsystem necessarily the most efficient approach. Different member states apply differentmethodologies, which often depend on the type of fishery and on the national organizationof the fishery and management. Differences in stratification schemes make it very difficultto set up a single useful database with all the raw sampling data from the member states.The main functionality of a central database is methods for combining and aggregating data,e.g. the possibility of using age information from one country on the catch data of anothercountry.
Even within a country there is no single national database that holds all these data, insteadthese data are spread among several databases e.g. countries may be holding separatedatabases on
• Landings and values;
• Logbook data (gear);
• Biological sampling data. All EC countries have or will establish databases(computerized but not necessary in a database structure) holding biological samplingdata and observer data (discards);
• Vessel register (physical characteristics) of the vessels (typically length, kW, GT). Thisregister is used in defining fleets;
• Economic data.
Typically, the databases differ in design and platform between types of data within acountry. Among countries several different approaches have been taken for each type ofdata.
The Commission and member states have the right to access aggregated data. While theData Regulation establish this right and that EC can only hold such communicated data for alimited time, the appropriate aggregation will vary among tasks. It is therefore consideredthat a system with quick access to the updated national databases would allow the level ofaggregation to be agreed and made consistent with the Data Regulation at the time when thespecific task is defined.
This access can be done using a variety of methods ranging from physical exchange of filesusing predefined exchange formats and to have databases communicating directly. Thetechnical aspects of these solutions should be investigated and this analysis should be part ofa call for tender, see section 5.
The entire process from the local national databases to another centre must be electronic, asspecified by the Data Collection Regulation. There must be no manual manipulation of thedata in the communication process. The extraction process should be reproducible.
It would be preferable that the data for exchange procedures are compatible among the ECand the regional fisheries organisations.
The biological data may be required at the stock or at the fleet level depending on the task tobe addressed. The economic data include value of the landings. Typically economic datawill be aggregated on fleet segment level. Both groups of data are expected to reside on well
53
structured national databases and as the two types of data shall be amalgamated at someaggregation level the basic identifiers and fundamental database structure will be similar.
�����&200(5&,$/�),6+(5,(6�'$7$
These data include
• Catch and effort (landings, cpue, capacity)
• Discard data from the commercial fisheries trips
• Sampling of biological data (length and age) from the catches/landings
• Other biological data (these are discussed under section 3.4)
(* annex 1 shows an example of the output of which is expected to provide)
������� ,QSXW
STECF agreed to exchange data without any previous national manipulation process.
In the tender the task is to define one or more methods of extracting data that is compatiblewith all member states’ data structures, codes, and storage methods. Data need to beconverted to a standard set of codes and the call for tender should examine where thisconversion should take place (at member state level or centrally as part of the system), andtake into account existing regulations for data codes and the costs for the operation.
������� ,QSXW�DJJUHJDWLRQ�OHYHO
Technically the system must be able to handle data from different member states whichprovide data at different levels of aggregation. The extended data collection programme isthe most detailed aggregation level required.
Member states should provide data for several years and including the most recent data.
The database structure should support queries at higher levels of aggregation using thecorrect aggregation rules for each data type.
• Ability to aggregate data from different national aggregation levels
• Ability to fill in holes in the data (interpolation procedures). This will be done in anexpert system the rules should be documented. The process should be reproducible
������� 2XWSXW�UHTXLUHPHQW�IRU�ODQGLQJV�FDWFK�DW�DJH�DQG�&38(�LQGLFHV
The catch at age and CPUE section of the database should be capable of providing output inthe file form as commonly used for ICES assessments and should have the capability ofusing length, age/length, age and catch data in the manner currently required by ICES WGspecies coordinators.
�����(FRQRPLF�'DWD
Each Member State collect economic data differently. While there are some countries wherethis task has been developed since many years, for the majority of the Member States DataCollection Regulation starts from basics.
In most cases, economic data have to be sampled. The sampling strategy differs betweencountries, e.g. in some cases this sample is a statistical random sample (for example in Italyand France) while in other cases it is based on a fixed panel (The Netherlands, Denmark,Sweden). Therefore, when treating this kind of information, the reliability of data must beconsidered. Such information most be stored together with actual observations or responses.The database users may expect more then just a presentation of statistical data in a table likean ordinary data base system does. The presented statistical data must be consistent and it is
54
essential that this consistency can be shown to the user. Information about the source, themethods of estimating, assumptions, justifications, any correction factors applied shouldalso be stored in the database itself. Reliability of the presented data can only be evaluatedbased on such documentation in terms of data consistency, actuality, correctness andcompleteness.
At present several national economic databases exist, e.g. in Italy, the Netherlands, Denmarkand Sweden), however, no attempt has been made to aggregate economic data from differentEU countries in a single international database.
The European Concerted Action on the economic performance of selected European fleetsegments publishes each year an Annual Economic Report. This economic report is basedon data collected by each partner. These data are collected for selected fleet segments.
The 3rd Concerted Action started in April 2002 and one of its tasks is to develop a databasefor the management of the aggregated data elaborated within these concerted actions.
The database is currently being designed by a project team consisting of experts in fisherieseconomics and information technology. A major task for the project team is to specify thestatistical tables to be routinely produced by the database. This specification is in terms ofaggregation level and data content
Data to be exchanged are aggregated on fleet segments and on years. Other aggregationlevels to be considered include age classes and target species. Data elements may concernfleet characteristics, landings, economic indicators and prices.
The Concerted Action database (CADB) is aimed at managing economic aggregated datacollected by partners on the basis of the work programme, in which the number of fleetsegments to be reported by each partner and the related budget are defined. Thereforereported data do not cover the entire fisheries. The Concerted Action database is differentfrom the Data Collection framework in the following aspects:
• Project partners are not always the same institutes that carry out the data collectionprogramme of economic data at national level. This raise a number issues concerningaccess to data and control over publication of data.
• CADB covers only part of the European fishing fleet, namely segments for whichpartners have access to data (coverage ranges from 3% in Greece to 100% in Italy)
• Desegregation levels may be different (appendix III for data collection per eachMAGP segment, selected fleet segments that could coincide with MAGP segmentsfor the CA project).
With regards to processing industry data, the Commission Regulation specifies that MemberState should carry out pilot surveys to assess the annual value per sector of the parametersspecified in appendix XIX of the Data Collection Regulation. The collection of data for thefish processing industry will be very variable with different levels of desegregation.Therefore it may be difficult to cross tabulate this data.
In general, it is expected that economic data to be submitted to EC will come from thenational databases. The data communication between the national databases and EC wouldfollow similar lines as described for the fisheries catch and effort data. However, through theConcerted Actions valuable knowledge on collecting such data and their storage indatabases has been and will be obtained by Member states and the Commission.
55
�����6XUYH\�GDWD
At the 2002 ICES IBTSWG progress on the DATRAS project was reviewed. Many of theissues discussed are pertinent to the collation of survey data required under Regulation1639/2001. The main issues of relevance here are:
• Exchange format
• Data quality checks
• Use of established survey databases
������� ([FKDQJH�IRUPDW
The DATRAS database exchanges data through physically moving files with a well definedexchange format from National databases through a central international database.
A standard exchange format must be agreed between member states. The DATRAS projecthas concluded that data will be exchanged in CSV files. CSV files are more flexible withregard to the size of the fields and to accommodate all surveys in the exchange format it issuggested that the files in the future should be delivered in the CSV format.
The call for tender should determine whether adopting the CSV file format is possible forsurveys in other areas and conducted using different methodologies.
������� 'DWD�TXDOLW\�FKHFNV
All member states submitting survey data should make the methods they use (or aredeveloping) for data quality checks available to the Commission.
The call for tender should examine these methods to ensure the reliability of the data and thepossibility of using this information to create a comprehensive data quality checkingprogram that will subsequently screen data received by the Commission.
������� 8VH�RI�HVWDEOLVKHG�VXUYH\�GDWDEDVHV
Databases have been established for most surveys that are run in a regular programme.These databases exist both on the national level, e.g. the Scottish and English Groundfishing survey while other databases are established internationally, e.g. the BITS and IBTS(DATRAS) databases. The general policy should be that the data communication programrequired under Regulation 1639/2001 should use these databases and not establish newnational/international databases.
The call for tender should therefore identify any potential access problems to existing surveydatabases and suggest ways to overcome any problems. It should be recalled that some ofthe international databases include data from non-EU countries, e.g. Norway.
�����%LRORJLFDO�GDWD
In addition, collecting of age based data on length, weight and numbers at age per species,sampling of other biological data, i.e. sex, weight, age, length, maturity and fecundity andanalyses for stock separations should be carried out following the Data CollectionRegulation.
At present numerous different maturity staging protocols are used in the nationallaboratories. In order to be able to aggregate this type of data one of the consequences areestablishing uniform protocols for maturity stating and for fecundity estimate analyses.

56
Data on maturity and fecundity can often only be obtained from research vessels surveys asmost species are landed gutted except when sampling is carried out at sea on commercialfishing trips.
When sampling biological data at R/V surveys, the data is recorded and stored in nationalsurvey databases and will be exchanged in R/V survey data formats for instance ICESDATRAS exchange formats.
Therefore, there are obvious two sources of obtained other biological data, observerprogrammes and R/V surveys. An agreed exchange protocol is required.
��� 6XSSRUW�JURXS
The communication system covers a wide range of data types and geographical area. So, inorder to insure that experience from these different fields and areas are taken into accountthe Consultant should be helped by a support group nominated by the STECF. This supportgroup should advice on system requirements including communication protocol, thedatabase and the aggregation software.
There are many considerations and the interests of the regional fisheries organisations andmanagers of national databases should be taken in to account. However, to allow an efficientsupport group membership should be restricted to 5 to 7 people.
So, the support should be established giving inputs from EC, Regional FisheriesOrganisations, national laboratories and data managers.
The group should be established after the Consultant has been nominated. This is proposedto supplement the expertise of the Consultant.
��� 3URSRVDO�IRU�D�&DOO�IRU�7HQGHU
7LWOH: European Fisheries Data Collection System
2EMHFWLYH�
The European Commission (EC) has initiated a process of development of standards for dataexchange of data collected under the Commission Regulation (No. 1639/2001). Under thisregulation, data of very different nature are collected including biological and economicdata. One of the general aims of the data collection process is to enhance the ability to assesschanges in fish stocks and in the fisheries. The necessity to exchange data as laid down bythe Commission and should be used as the basis for the data-exchange within theseEuropean Communities. The European Commission will own all the specificationdocumentation and source code developed under this project.
5HTXLUHPHQWV�
The required common data system should conform to the needs of defined in theCommission Regulation (No. 1639/2001). Further explanation is provided in the STECFBackground paper (Communicating aggregated data collected under the data collectionregulation title, Appendix 2 of 14th STECF Report).
Four major areas of data are considered:
• Fisheries data for catch and effort,
• Economic data for fisheries
• Survey results
• Biological data.

57
6WDJH����6SHFLILFDWLRQ�RI�V\VWHP�UHTXLUHPHQWV�DQG�SURSRVDO�IRU�WHFKQLFDO�VROXWLRQ�
The responsible Consultant shall be helped by a support group nominated by the STECF.The support group shall advice on system requirements including communication protocol,the database and the aggregation software.
The Consultant shall early in project convene a meeting with the support group to finalisethe specifications of the system.
The support group will be nominated by the STECF and cost associated with meeting of thisgroup will be covered through the National Programmes funding. Costs for the Consultantparticipation will be paid through this tender.
The Consultant should define the mechanism for data access from national databases into acommon data structure taking into account the diverse national databases and systemscurrently in use through the Community. Providing sufficient methods for datacommunication to deal with all the different codes and access methods used by memberstates.
The Consultant should define the structure to be used for the common database, the datatables and common data codes.
The Consultant should define the computational needs for data output from the database atdifferent aggregation levels. Data will be provided at different desegregation levels bymember states, the databases should be organised to give valid output at higher levels ofaggregation based on all the data available.
The Consultant should define the data output requirements from the database based onadvice of the support group.
The Consultant should advice on organisation on maintaining the system and on relatedcosts.
The Consultant should prepare a full specification for the production of the requiredsoftware including complete documentation in English.
The successful tender should have demonstrated experience with fisheries computeriseddatabases.
Time Frame end of 2002
6WDJH����,PSOHPHQWLQJ�WKH�SURSRVHG�V\VWHP�
The Consultant should implement the software defined in the specification above. Thesystem should be developed using a platform independent method and should conform toEuropean Commission computing standards. The software should be suitable for use bothby the Commission and also by the member states.
The Consultant should fully test the data input with all member states, the data storage andcomputation component and the data output as specified above.
The system should be fully documented in English.
Time Frame end of 2003
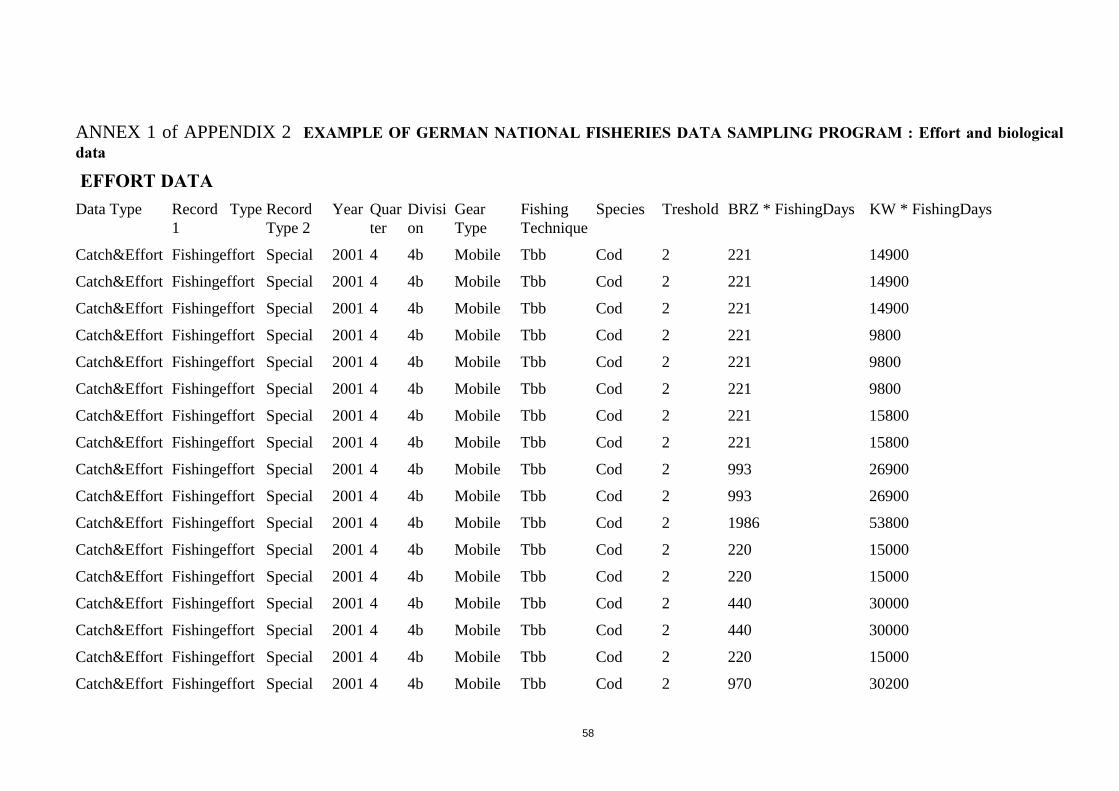
58
ANNEX 1 of APPENDIX 2 (;$03/(�2)�*(50$1�1$7,21$/�),6+(5,(6�'$7$�6$03/,1*�352*5$0���(IIRUW�DQG�ELRORJLFDOGDWD
�())257�'$7$
Data Type Record Type1
RecordType 2
Year Quarter
Division
GearType
FishingTechnique
Species Treshold BRZ * FishingDays KW * FishingDays
Catch&Effort Fishingeffort Special 2001 4 4b Mobile Tbb Cod 2 221 14900
Catch&Effort Fishingeffort Special 2001 4 4b Mobile Tbb Cod 2 221 14900
Catch&Effort Fishingeffort Special 2001 4 4b Mobile Tbb Cod 2 221 14900
Catch&Effort Fishingeffort Special 2001 4 4b Mobile Tbb Cod 2 221 9800
Catch&Effort Fishingeffort Special 2001 4 4b Mobile Tbb Cod 2 221 9800
Catch&Effort Fishingeffort Special 2001 4 4b Mobile Tbb Cod 2 221 9800
Catch&Effort Fishingeffort Special 2001 4 4b Mobile Tbb Cod 2 221 15800
Catch&Effort Fishingeffort Special 2001 4 4b Mobile Tbb Cod 2 221 15800
Catch&Effort Fishingeffort Special 2001 4 4b Mobile Tbb Cod 2 993 26900
Catch&Effort Fishingeffort Special 2001 4 4b Mobile Tbb Cod 2 993 26900
Catch&Effort Fishingeffort Special 2001 4 4b Mobile Tbb Cod 2 1986 53800
Catch&Effort Fishingeffort Special 2001 4 4b Mobile Tbb Cod 2 220 15000
Catch&Effort Fishingeffort Special 2001 4 4b Mobile Tbb Cod 2 220 15000
Catch&Effort Fishingeffort Special 2001 4 4b Mobile Tbb Cod 2 440 30000
Catch&Effort Fishingeffort Special 2001 4 4b Mobile Tbb Cod 2 440 30000
Catch&Effort Fishingeffort Special 2001 4 4b Mobile Tbb Cod 2 220 15000
Catch&Effort Fishingeffort Special 2001 4 4b Mobile Tbb Cod 2 970 30200
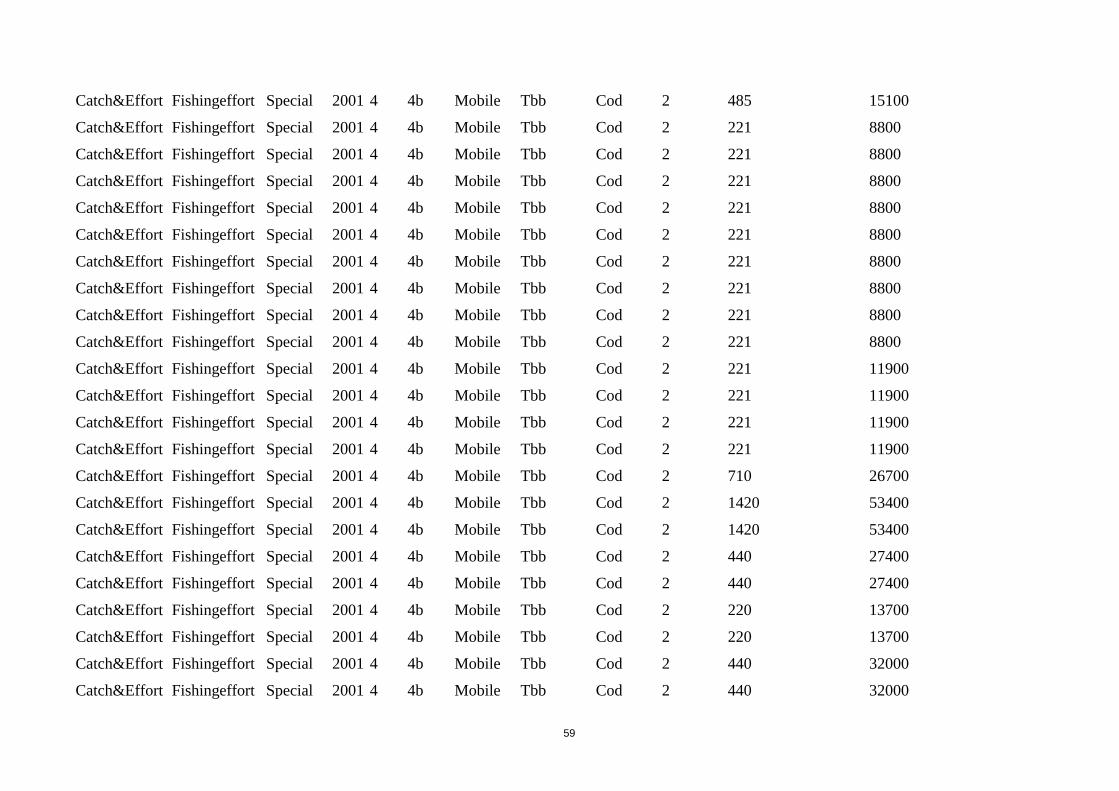
59
Catch&Effort Fishingeffort Special 2001 4 4b Mobile Tbb Cod 2 485 15100
Catch&Effort Fishingeffort Special 2001 4 4b Mobile Tbb Cod 2 221 8800
Catch&Effort Fishingeffort Special 2001 4 4b Mobile Tbb Cod 2 221 8800
Catch&Effort Fishingeffort Special 2001 4 4b Mobile Tbb Cod 2 221 8800
Catch&Effort Fishingeffort Special 2001 4 4b Mobile Tbb Cod 2 221 8800
Catch&Effort Fishingeffort Special 2001 4 4b Mobile Tbb Cod 2 221 8800
Catch&Effort Fishingeffort Special 2001 4 4b Mobile Tbb Cod 2 221 8800
Catch&Effort Fishingeffort Special 2001 4 4b Mobile Tbb Cod 2 221 8800
Catch&Effort Fishingeffort Special 2001 4 4b Mobile Tbb Cod 2 221 8800
Catch&Effort Fishingeffort Special 2001 4 4b Mobile Tbb Cod 2 221 8800
Catch&Effort Fishingeffort Special 2001 4 4b Mobile Tbb Cod 2 221 11900
Catch&Effort Fishingeffort Special 2001 4 4b Mobile Tbb Cod 2 221 11900
Catch&Effort Fishingeffort Special 2001 4 4b Mobile Tbb Cod 2 221 11900
Catch&Effort Fishingeffort Special 2001 4 4b Mobile Tbb Cod 2 221 11900
Catch&Effort Fishingeffort Special 2001 4 4b Mobile Tbb Cod 2 710 26700
Catch&Effort Fishingeffort Special 2001 4 4b Mobile Tbb Cod 2 1420 53400
Catch&Effort Fishingeffort Special 2001 4 4b Mobile Tbb Cod 2 1420 53400
Catch&Effort Fishingeffort Special 2001 4 4b Mobile Tbb Cod 2 440 27400
Catch&Effort Fishingeffort Special 2001 4 4b Mobile Tbb Cod 2 440 27400
Catch&Effort Fishingeffort Special 2001 4 4b Mobile Tbb Cod 2 220 13700
Catch&Effort Fishingeffort Special 2001 4 4b Mobile Tbb Cod 2 220 13700
Catch&Effort Fishingeffort Special 2001 4 4b Mobile Tbb Cod 2 440 32000
Catch&Effort Fishingeffort Special 2001 4 4b Mobile Tbb Cod 2 440 32000
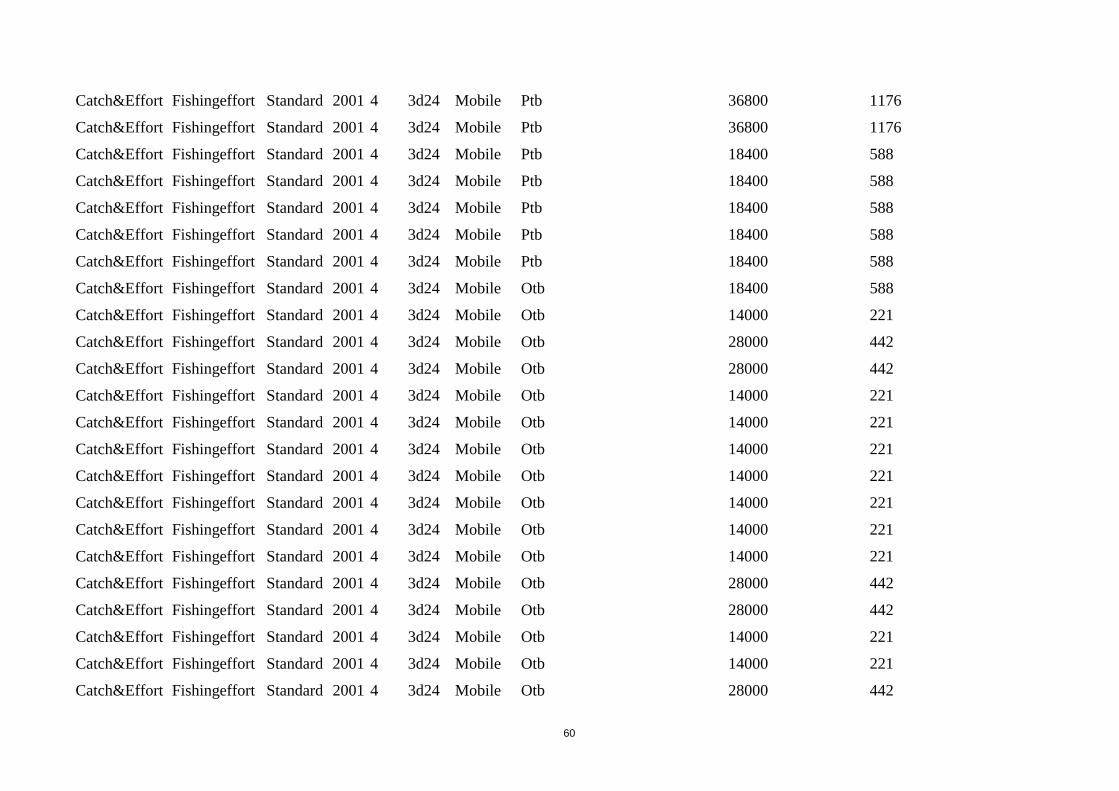
60
Catch&Effort Fishingeffort Standard 2001 4 3d24 Mobile Ptb 36800 1176
Catch&Effort Fishingeffort Standard 2001 4 3d24 Mobile Ptb 36800 1176
Catch&Effort Fishingeffort Standard 2001 4 3d24 Mobile Ptb 18400 588
Catch&Effort Fishingeffort Standard 2001 4 3d24 Mobile Ptb 18400 588
Catch&Effort Fishingeffort Standard 2001 4 3d24 Mobile Ptb 18400 588
Catch&Effort Fishingeffort Standard 2001 4 3d24 Mobile Ptb 18400 588
Catch&Effort Fishingeffort Standard 2001 4 3d24 Mobile Ptb 18400 588
Catch&Effort Fishingeffort Standard 2001 4 3d24 Mobile Otb 18400 588
Catch&Effort Fishingeffort Standard 2001 4 3d24 Mobile Otb 14000 221
Catch&Effort Fishingeffort Standard 2001 4 3d24 Mobile Otb 28000 442
Catch&Effort Fishingeffort Standard 2001 4 3d24 Mobile Otb 28000 442
Catch&Effort Fishingeffort Standard 2001 4 3d24 Mobile Otb 14000 221
Catch&Effort Fishingeffort Standard 2001 4 3d24 Mobile Otb 14000 221
Catch&Effort Fishingeffort Standard 2001 4 3d24 Mobile Otb 14000 221
Catch&Effort Fishingeffort Standard 2001 4 3d24 Mobile Otb 14000 221
Catch&Effort Fishingeffort Standard 2001 4 3d24 Mobile Otb 14000 221
Catch&Effort Fishingeffort Standard 2001 4 3d24 Mobile Otb 14000 221
Catch&Effort Fishingeffort Standard 2001 4 3d24 Mobile Otb 14000 221
Catch&Effort Fishingeffort Standard 2001 4 3d24 Mobile Otb 28000 442
Catch&Effort Fishingeffort Standard 2001 4 3d24 Mobile Otb 28000 442
Catch&Effort Fishingeffort Standard 2001 4 3d24 Mobile Otb 14000 221
Catch&Effort Fishingeffort Standard 2001 4 3d24 Mobile Otb 14000 221
Catch&Effort Fishingeffort Standard 2001 4 3d24 Mobile Otb 28000 442
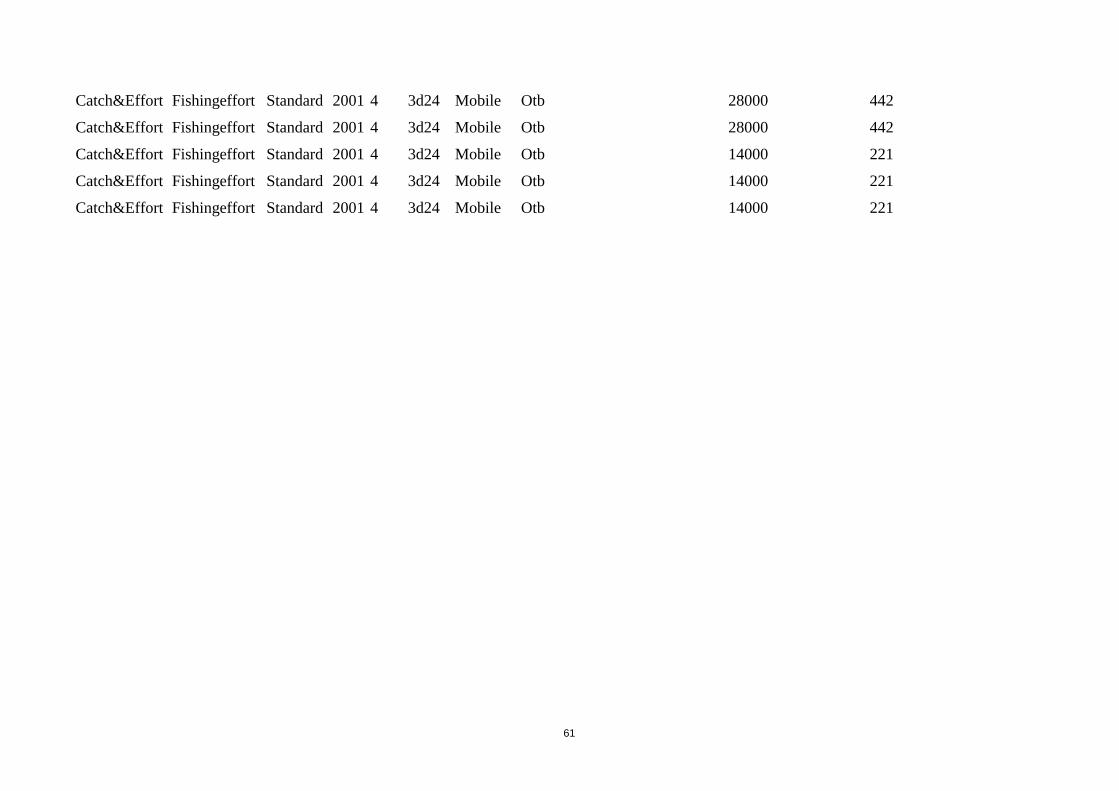
61
Catch&Effort Fishingeffort Standard 2001 4 3d24 Mobile Otb 28000 442
Catch&Effort Fishingeffort Standard 2001 4 3d24 Mobile Otb 28000 442
Catch&Effort Fishingeffort Standard 2001 4 3d24 Mobile Otb 14000 221
Catch&Effort Fishingeffort Standard 2001 4 3d24 Mobile Otb 14000 221
Catch&Effort Fishingeffort Standard 2001 4 3d24 Mobile Otb 14000 221
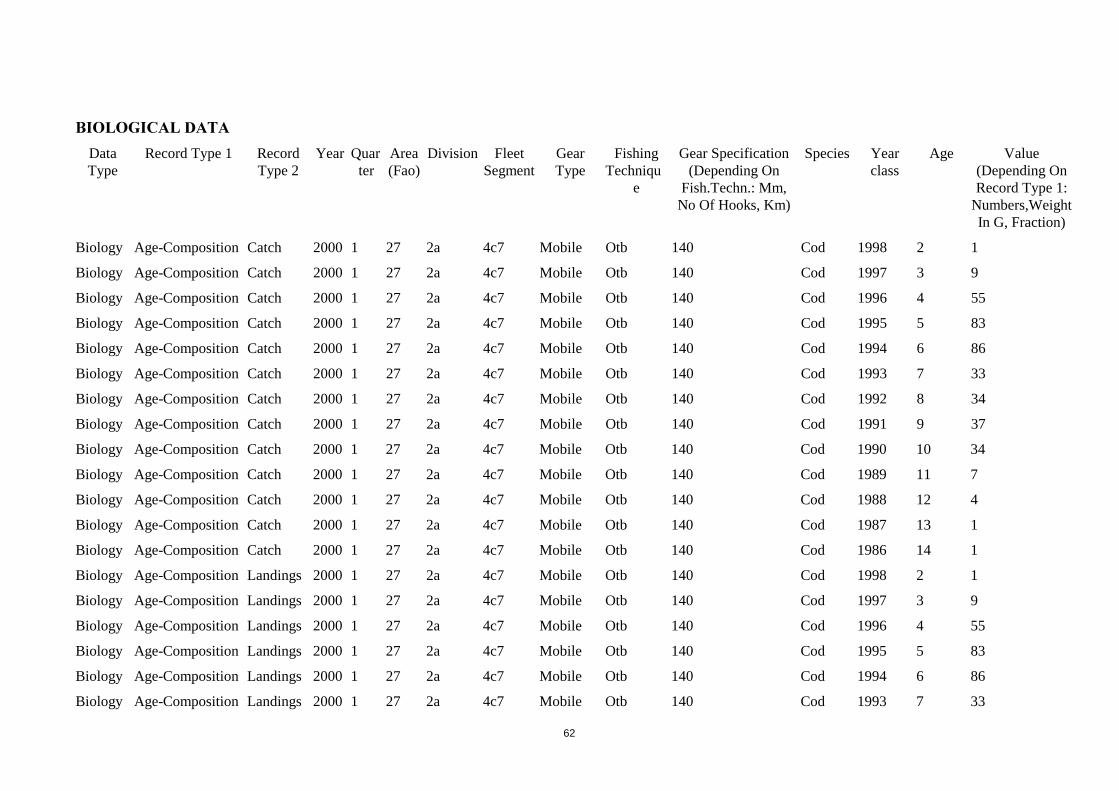
62
%,2/2*,&$/�'$7$
DataType
Record Type 1 RecordType 2
Year Quarter
Area(Fao)
Division FleetSegment
GearType
FishingTechniqu
e
Gear Specification(Depending On
Fish.Techn.: Mm,No Of Hooks, Km)
Species Yearclass
Age Value(Depending OnRecord Type 1:
Numbers,WeightIn G, Fraction)
Biology Age-Composition Catch 2000 1 27 2a 4c7 Mobile Otb 140 Cod 1998 2 1
Biology Age-Composition Catch 2000 1 27 2a 4c7 Mobile Otb 140 Cod 1997 3 9
Biology Age-Composition Catch 2000 1 27 2a 4c7 Mobile Otb 140 Cod 1996 4 55
Biology Age-Composition Catch 2000 1 27 2a 4c7 Mobile Otb 140 Cod 1995 5 83
Biology Age-Composition Catch 2000 1 27 2a 4c7 Mobile Otb 140 Cod 1994 6 86
Biology Age-Composition Catch 2000 1 27 2a 4c7 Mobile Otb 140 Cod 1993 7 33
Biology Age-Composition Catch 2000 1 27 2a 4c7 Mobile Otb 140 Cod 1992 8 34
Biology Age-Composition Catch 2000 1 27 2a 4c7 Mobile Otb 140 Cod 1991 9 37
Biology Age-Composition Catch 2000 1 27 2a 4c7 Mobile Otb 140 Cod 1990 10 34
Biology Age-Composition Catch 2000 1 27 2a 4c7 Mobile Otb 140 Cod 1989 11 7
Biology Age-Composition Catch 2000 1 27 2a 4c7 Mobile Otb 140 Cod 1988 12 4
Biology Age-Composition Catch 2000 1 27 2a 4c7 Mobile Otb 140 Cod 1987 13 1
Biology Age-Composition Catch 2000 1 27 2a 4c7 Mobile Otb 140 Cod 1986 14 1
Biology Age-Composition Landings 2000 1 27 2a 4c7 Mobile Otb 140 Cod 1998 2 1
Biology Age-Composition Landings 2000 1 27 2a 4c7 Mobile Otb 140 Cod 1997 3 9
Biology Age-Composition Landings 2000 1 27 2a 4c7 Mobile Otb 140 Cod 1996 4 55
Biology Age-Composition Landings 2000 1 27 2a 4c7 Mobile Otb 140 Cod 1995 5 83
Biology Age-Composition Landings 2000 1 27 2a 4c7 Mobile Otb 140 Cod 1994 6 86
Biology Age-Composition Landings 2000 1 27 2a 4c7 Mobile Otb 140 Cod 1993 7 33
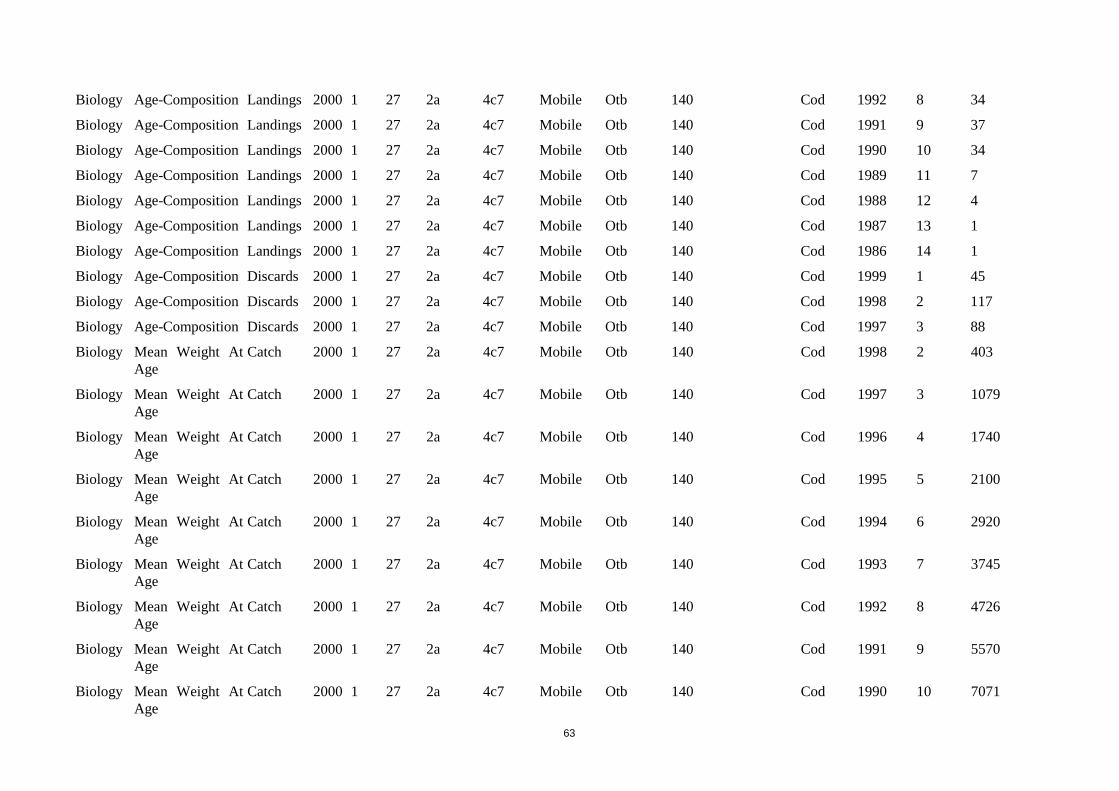
63
Biology Age-Composition Landings 2000 1 27 2a 4c7 Mobile Otb 140 Cod 1992 8 34
Biology Age-Composition Landings 2000 1 27 2a 4c7 Mobile Otb 140 Cod 1991 9 37
Biology Age-Composition Landings 2000 1 27 2a 4c7 Mobile Otb 140 Cod 1990 10 34
Biology Age-Composition Landings 2000 1 27 2a 4c7 Mobile Otb 140 Cod 1989 11 7
Biology Age-Composition Landings 2000 1 27 2a 4c7 Mobile Otb 140 Cod 1988 12 4
Biology Age-Composition Landings 2000 1 27 2a 4c7 Mobile Otb 140 Cod 1987 13 1
Biology Age-Composition Landings 2000 1 27 2a 4c7 Mobile Otb 140 Cod 1986 14 1
Biology Age-Composition Discards 2000 1 27 2a 4c7 Mobile Otb 140 Cod 1999 1 45
Biology Age-Composition Discards 2000 1 27 2a 4c7 Mobile Otb 140 Cod 1998 2 117
Biology Age-Composition Discards 2000 1 27 2a 4c7 Mobile Otb 140 Cod 1997 3 88
Biology Mean Weight AtAge
Catch 2000 1 27 2a 4c7 Mobile Otb 140 Cod 1998 2 403
Biology Mean Weight AtAge
Catch 2000 1 27 2a 4c7 Mobile Otb 140 Cod 1997 3 1079
Biology Mean Weight AtAge
Catch 2000 1 27 2a 4c7 Mobile Otb 140 Cod 1996 4 1740
Biology Mean Weight AtAge
Catch 2000 1 27 2a 4c7 Mobile Otb 140 Cod 1995 5 2100
Biology Mean Weight AtAge
Catch 2000 1 27 2a 4c7 Mobile Otb 140 Cod 1994 6 2920
Biology Mean Weight AtAge
Catch 2000 1 27 2a 4c7 Mobile Otb 140 Cod 1993 7 3745
Biology Mean Weight AtAge
Catch 2000 1 27 2a 4c7 Mobile Otb 140 Cod 1992 8 4726
Biology Mean Weight AtAge
Catch 2000 1 27 2a 4c7 Mobile Otb 140 Cod 1991 9 5570
Biology Mean Weight AtAge
Catch 2000 1 27 2a 4c7 Mobile Otb 140 Cod 1990 10 7071
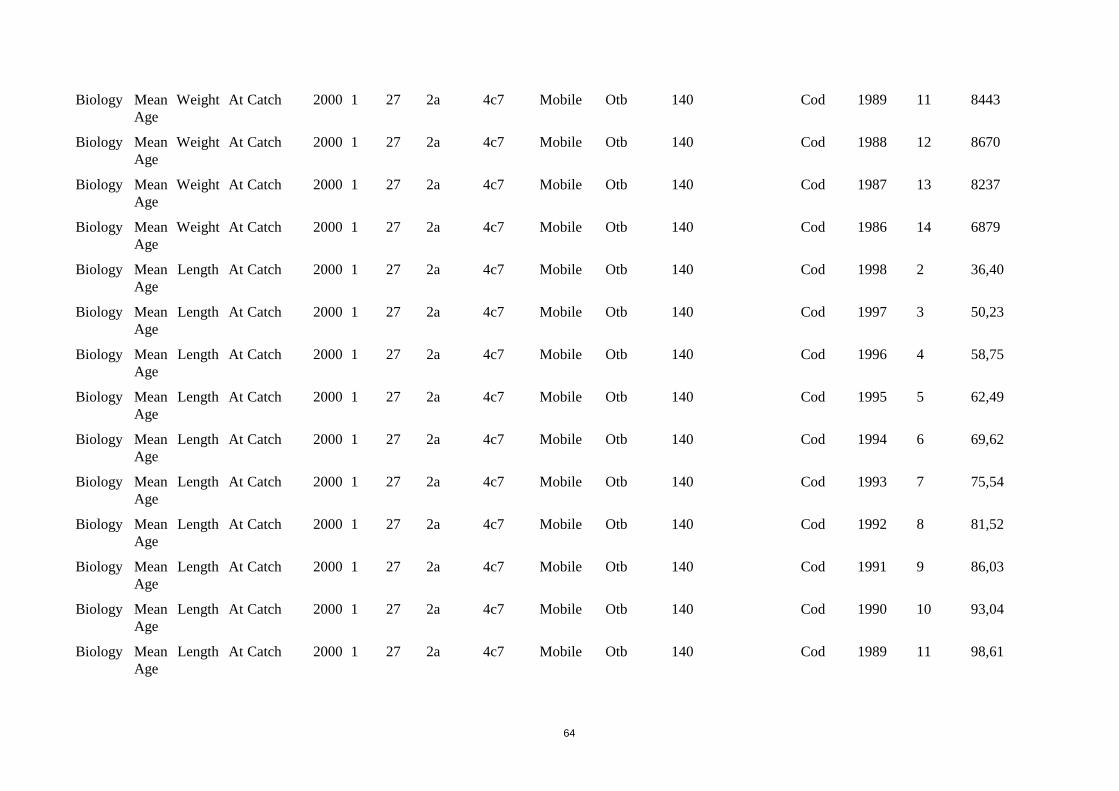
64
Biology Mean Weight AtAge
Catch 2000 1 27 2a 4c7 Mobile Otb 140 Cod 1989 11 8443
Biology Mean Weight AtAge
Catch 2000 1 27 2a 4c7 Mobile Otb 140 Cod 1988 12 8670
Biology Mean Weight AtAge
Catch 2000 1 27 2a 4c7 Mobile Otb 140 Cod 1987 13 8237
Biology Mean Weight AtAge
Catch 2000 1 27 2a 4c7 Mobile Otb 140 Cod 1986 14 6879
Biology Mean Length AtAge
Catch 2000 1 27 2a 4c7 Mobile Otb 140 Cod 1998 2 36,40
Biology Mean Length AtAge
Catch 2000 1 27 2a 4c7 Mobile Otb 140 Cod 1997 3 50,23
Biology Mean Length AtAge
Catch 2000 1 27 2a 4c7 Mobile Otb 140 Cod 1996 4 58,75
Biology Mean Length AtAge
Catch 2000 1 27 2a 4c7 Mobile Otb 140 Cod 1995 5 62,49
Biology Mean Length AtAge
Catch 2000 1 27 2a 4c7 Mobile Otb 140 Cod 1994 6 69,62
Biology Mean Length AtAge
Catch 2000 1 27 2a 4c7 Mobile Otb 140 Cod 1993 7 75,54
Biology Mean Length AtAge
Catch 2000 1 27 2a 4c7 Mobile Otb 140 Cod 1992 8 81,52
Biology Mean Length AtAge
Catch 2000 1 27 2a 4c7 Mobile Otb 140 Cod 1991 9 86,03
Biology Mean Length AtAge
Catch 2000 1 27 2a 4c7 Mobile Otb 140 Cod 1990 10 93,04
Biology Mean Length AtAge
Catch 2000 1 27 2a 4c7 Mobile Otb 140 Cod 1989 11 98,61
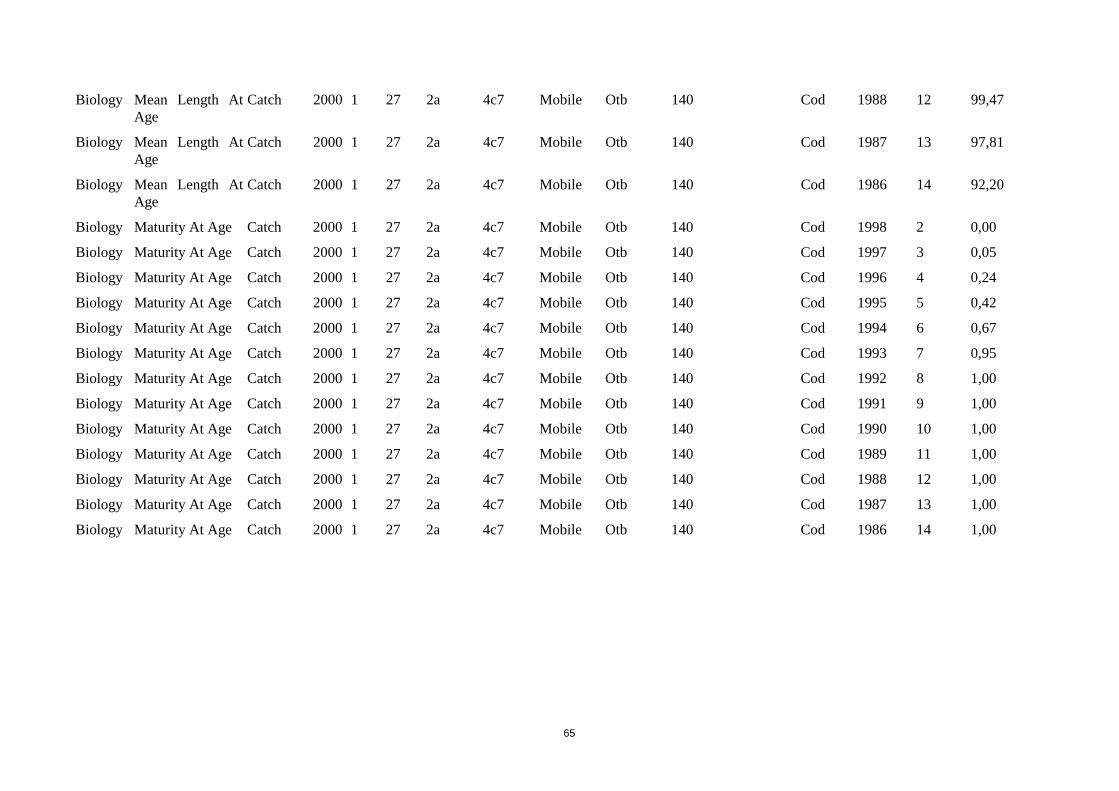
65
Biology Mean Length AtAge
Catch 2000 1 27 2a 4c7 Mobile Otb 140 Cod 1988 12 99,47
Biology Mean Length AtAge
Catch 2000 1 27 2a 4c7 Mobile Otb 140 Cod 1987 13 97,81
Biology Mean Length AtAge
Catch 2000 1 27 2a 4c7 Mobile Otb 140 Cod 1986 14 92,20
Biology Maturity At Age Catch 2000 1 27 2a 4c7 Mobile Otb 140 Cod 1998 2 0,00
Biology Maturity At Age Catch 2000 1 27 2a 4c7 Mobile Otb 140 Cod 1997 3 0,05
Biology Maturity At Age Catch 2000 1 27 2a 4c7 Mobile Otb 140 Cod 1996 4 0,24
Biology Maturity At Age Catch 2000 1 27 2a 4c7 Mobile Otb 140 Cod 1995 5 0,42
Biology Maturity At Age Catch 2000 1 27 2a 4c7 Mobile Otb 140 Cod 1994 6 0,67
Biology Maturity At Age Catch 2000 1 27 2a 4c7 Mobile Otb 140 Cod 1993 7 0,95
Biology Maturity At Age Catch 2000 1 27 2a 4c7 Mobile Otb 140 Cod 1992 8 1,00
Biology Maturity At Age Catch 2000 1 27 2a 4c7 Mobile Otb 140 Cod 1991 9 1,00
Biology Maturity At Age Catch 2000 1 27 2a 4c7 Mobile Otb 140 Cod 1990 10 1,00
Biology Maturity At Age Catch 2000 1 27 2a 4c7 Mobile Otb 140 Cod 1989 11 1,00
Biology Maturity At Age Catch 2000 1 27 2a 4c7 Mobile Otb 140 Cod 1988 12 1,00
Biology Maturity At Age Catch 2000 1 27 2a 4c7 Mobile Otb 140 Cod 1987 13 1,00
Biology Maturity At Age Catch 2000 1 27 2a 4c7 Mobile Otb 140 Cod 1986 14 1,00
66
�����$33(1',;���(;(&87,9(�6800$5<�2)�0((7,1*6�21�)2//2:�83�2)�0$*3,9
67(&)�±�6*%5(
5HSRUW�RQ�D�VHULHV�RI�WKUHH�PHHWLQJV�WR�DGYLVH�WKH�&RPPLVVLRQ�RQ�WKH�6FLHQWLILF�%DVLVIRU�D�IROORZ�XS�WR�WKH�)RXUWK�*HQHUDWLRQ�RI�0XOWL�DQQXDO�*XLGDQFH�3URJUDPPHV
�0$*3�,9��
&KDLUHG�E\�-��&DVH\
67
&KDLUPDQ¶V�6XPPDU\
��%$&.*5281'
In April 1999, STECF was asked to address the scientific background for a follow up toMAGP IV and in its 8th Report (SEC(1999) 932), proposed a number of areas that requireinvestigation in order to appropriately advise the Commission. At its 9th meeting inNovember 1999 (SEC (2000) 15), STECF was asked to organise and develop terms ofreference for a meeting on the scientific basis for a follow up to MAGP IV. As an initialstep, the Committee discussed the organisation of a one-year working schedule for anSTECF Sub-group (SGBRE) to examine the relationship linking fleet capacity withexploitation rates of fish stocks, taking into account biological, technical and economicconsiderations wherever possible.
A first meeting of the STECF Sub-group on Balance between Resources and theirexploitation (SGBRE), chaired by Mr Gaetano Messina, was convened in February 2000.The report of that meeting, that has been annexed to the STECF report SEC (2000) 1130 (Chapter 8 and Annex 5), provided an overall review of the parameters suitable to measurefishing effort.
At its meeting in April 2000 (SEC (2000) 1130, chapter 6, STECF noted that severalfundamental questions still needed to be addressed for an examination of the pastperformance of MAGPs and to assist the Commission in proposing a successor to MAGPIV. STECF therefore in its 10th report STECF proposed to convene a series of threemeetings under the Chairmanship of Dr J Casey, to address the following questions:
1. Has there been a direct clear link between fishing capacity (however it is measured) anddeployed fishing effort (however it is measured) in the past?
2. Are there clear examples where various levels of deployed fishing effort can be relatedto observed exploitation rates?
3. To what extent have other factors (technological improvements, environmental changesbiological interactions or economic factors) affected such relationships.
4. How does fleet capacity grow and decrease? What are the main factors that explain fleetdynamics?
5. Which managerial models can be used to administer fishing capacity in an efficient way?
STECF also pointed out that the meetings should focus on examples from specific fisheriesand resources and proposed that appropriate examples should be drawn from the followingbroad categories of fishery.
Demersal Otter trawl fisheries
Inshore (small-scale) pelagic fisheries
Offshore (large-scale) pelagic fisheries
Artisanal (small-scale) fisheriesOffshore static gear fisheries

68
The first of the series of meetings was held in Brussels from 23-27 October 2000. The reportof that meeting (Appendix III of SEC(2001)177) was reviewed by STECF at its November2000 plenary meeting.
The second meeting of the Sub-group took place in Brussels from 22-26 January 2001 andits report (SEC (2001)1194) was reviewed by STECF during its April 2001 Plenary meeting.
The third meeting was held in Brussels from 19-23 November 2001, and its report(SEC(2003)74) was reviewed by STECF at its April 2002 Plenary session.
At its first two meetings, the Expert Group reviewed existing literature and case studies onthe relationships between fleet capacity, deployed fishing effort and observed exploitationrates and in addition, carried out original investigations, using data for specific fishing fleetsin the north-east Atlantic and Mediterranean. Taking into account the findings in the firsttwo meeting reports, the terms of reference for the third meeting were modified in anattempt to focus the Group’s attention on specific issues.
The Terms of Reference for the third meeting were as follows:
1. Review the reports of the first two meetings and summarise the findings on therelationship between capacity, fishing effort and fishing mortality.
2. Wherever possible, provide further examples of the above relationships with regard tofisheries and areas not yet addressed by the group.
3. Describe the relationships above in relation to hake and cod stocks in the north-eastAtlantic.
4. Describe in more detail the pros and cons of the various alternative management models(VHQVX instruments) using both observations and theory.
5. Review existing different bio-economic models, discuss and identify which are mostsuitable and applicable for evaluating the management of fleet capacity.
6. Consider the options to evaluating the effectiveness of different capacity managementinstruments or combinations using one or more of the existing bio-economic models.
��5$7,21$/(�)25�7+(�0((7,1*6
����2%-(&7,9(6�2)�0$*3�,9
The objectives of MAGP IV3 were fixed in accordance with Council Decision 97/413/EC of26 June 1997 concerning the objectives and detailed rules for restructuring the Communityfisheries sector, for the period from 1 January 1997 to 31 December 2001, with a view toachieving a balance on a sustainable basis between resources and their exploitation.
The report from the Commission to the Council on the preparation for a mid term review ofthe Multi-annual guidance programmes4, pointed out that the Commission had proposedcuts in fishing effort of 30% and 20% for fleet segments exploiting stocks classified asdepletion risk or over-fished. Most Member States considered these cuts to be too high,reducing them to 20% and 15% respectively in the decision that was finally adopted by theCouncil. In addition, Member States also proposed that these reductions should be weighted
3 Commission Decisions 98/119/EC to 98/131/EC (OJ L 39 of 12.2.98, pp 1-84)4 Report from the Commission to the Council COM(2000) 272 final
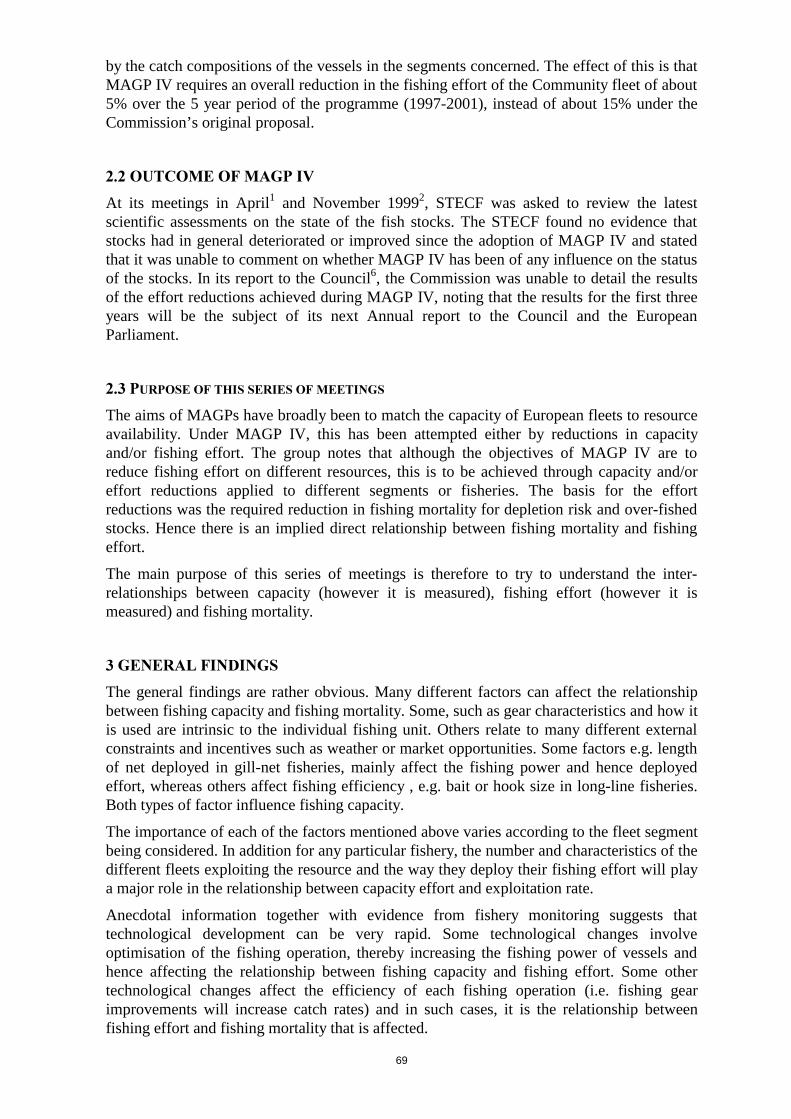
69
by the catch compositions of the vessels in the segments concerned. The effect of this is thatMAGP IV requires an overall reduction in the fishing effort of the Community fleet of about5% over the 5 year period of the programme (1997-2001), instead of about 15% under theCommission’s original proposal.
����287&20(�2)�0$*3�,9
At its meetings in April1 and November 19992, STECF was asked to review the latestscientific assessments on the state of the fish stocks. The STECF found no evidence thatstocks had in general deteriorated or improved since the adoption of MAGP IV and statedthat it was unable to comment on whether MAGP IV has been of any influence on the statusof the stocks. In its report to the Council6, the Commission was unable to detail the resultsof the effort reductions achieved during MAGP IV, noting that the results for the first threeyears will be the subject of its next Annual report to the Council and the EuropeanParliament.
����385326(�2)�7+,6�6(5,(6�2)�0((7,1*6
The aims of MAGPs have broadly been to match the capacity of European fleets to resourceavailability. Under MAGP IV, this has been attempted either by reductions in capacityand/or fishing effort. The group notes that although the objectives of MAGP IV are toreduce fishing effort on different resources, this is to be achieved through capacity and/oreffort reductions applied to different segments or fisheries. The basis for the effortreductions was the required reduction in fishing mortality for depletion risk and over-fishedstocks. Hence there is an implied direct relationship between fishing mortality and fishingeffort.
The main purpose of this series of meetings is therefore to try to understand the inter-relationships between capacity (however it is measured), fishing effort (however it ismeasured) and fishing mortality.
��*(1(5$/�),1',1*6
The general findings are rather obvious. Many different factors can affect the relationshipbetween fishing capacity and fishing mortality. Some, such as gear characteristics and how itis used are intrinsic to the individual fishing unit. Others relate to many different externalconstraints and incentives such as weather or market opportunities. Some factors e.g. lengthof net deployed in gill-net fisheries, mainly affect the fishing power and hence deployedeffort, whereas others affect fishing efficiency , e.g. bait or hook size in long-line fisheries.Both types of factor influence fishing capacity.
The importance of each of the factors mentioned above varies according to the fleet segmentbeing considered. In addition for any particular fishery, the number and characteristics of thedifferent fleets exploiting the resource and the way they deploy their fishing effort will playa major role in the relationship between capacity effort and exploitation rate.
Anecdotal information together with evidence from fishery monitoring suggests thattechnological development can be very rapid. Some technological changes involveoptimisation of the fishing operation, thereby increasing the fishing power of vessels andhence affecting the relationship between fishing capacity and fishing effort. Some othertechnological changes affect the efficiency of each fishing operation (i.e. fishing gearimprovements will increase catch rates) and in such cases, it is the relationship betweenfishing effort and fishing mortality that is affected.
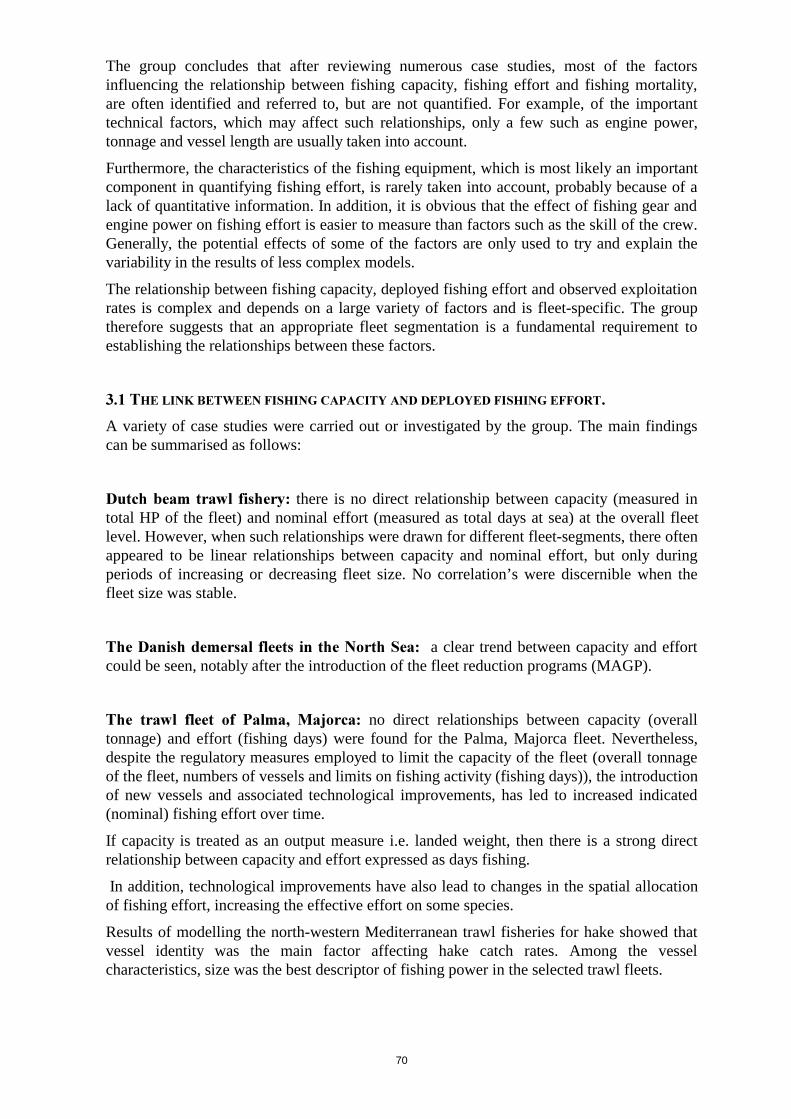
70
The group concludes that after reviewing numerous case studies, most of the factorsinfluencing the relationship between fishing capacity, fishing effort and fishing mortality,are often identified and referred to, but are not quantified. For example, of the importanttechnical factors, which may affect such relationships, only a few such as engine power,tonnage and vessel length are usually taken into account.
Furthermore, the characteristics of the fishing equipment, which is most likely an importantcomponent in quantifying fishing effort, is rarely taken into account, probably because of alack of quantitative information. In addition, it is obvious that the effect of fishing gear andengine power on fishing effort is easier to measure than factors such as the skill of the crew.Generally, the potential effects of some of the factors are only used to try and explain thevariability in the results of less complex models.
The relationship between fishing capacity, deployed fishing effort and observed exploitationrates is complex and depends on a large variety of factors and is fleet-specific. The grouptherefore suggests that an appropriate fleet segmentation is a fundamental requirement toestablishing the relationships between these factors.
����7+(�/,1.�%(7:((1�),6+,1*�&$3$&,7<�$1'�'(3/2<('�),6+,1*�())257�
A variety of case studies were carried out or investigated by the group. The main findingscan be summarised as follows:
'XWFK�EHDP�WUDZO� ILVKHU\� there is no direct relationship between capacity (measured intotal HP of the fleet) and nominal effort (measured as total days at sea) at the overall fleetlevel. However, when such relationships were drawn for different fleet-segments, there oftenappeared to be linear relationships between capacity and nominal effort, but only duringperiods of increasing or decreasing fleet size. No correlation’s were discernible when thefleet size was stable.
7KH�'DQLVK�GHPHUVDO�IOHHWV� LQ�WKH�1RUWK�6HD� a clear trend between capacity and effortcould be seen, notably after the introduction of the fleet reduction programs (MAGP).
7KH� WUDZO� IOHHW� RI� 3DOPD�� 0DMRUFD� no direct relationships between capacity (overalltonnage) and effort (fishing days) were found for the Palma, Majorca fleet. Nevertheless,despite the regulatory measures employed to limit the capacity of the fleet (overall tonnageof the fleet, numbers of vessels and limits on fishing activity (fishing days)), the introductionof new vessels and associated technological improvements, has led to increased indicated(nominal) fishing effort over time.
If capacity is treated as an output measure i.e. landed weight, then there is a strong directrelationship between capacity and effort expressed as days fishing.
In addition, technological improvements have also lead to changes in the spatial allocationof fishing effort, increasing the effective effort on some species.
Results of modelling the north-western Mediterranean trawl fisheries for hake showed thatvessel identity was the main factor affecting hake catch rates. Among the vesselcharacteristics, size was the best descriptor of fishing power in the selected trawl fleets.
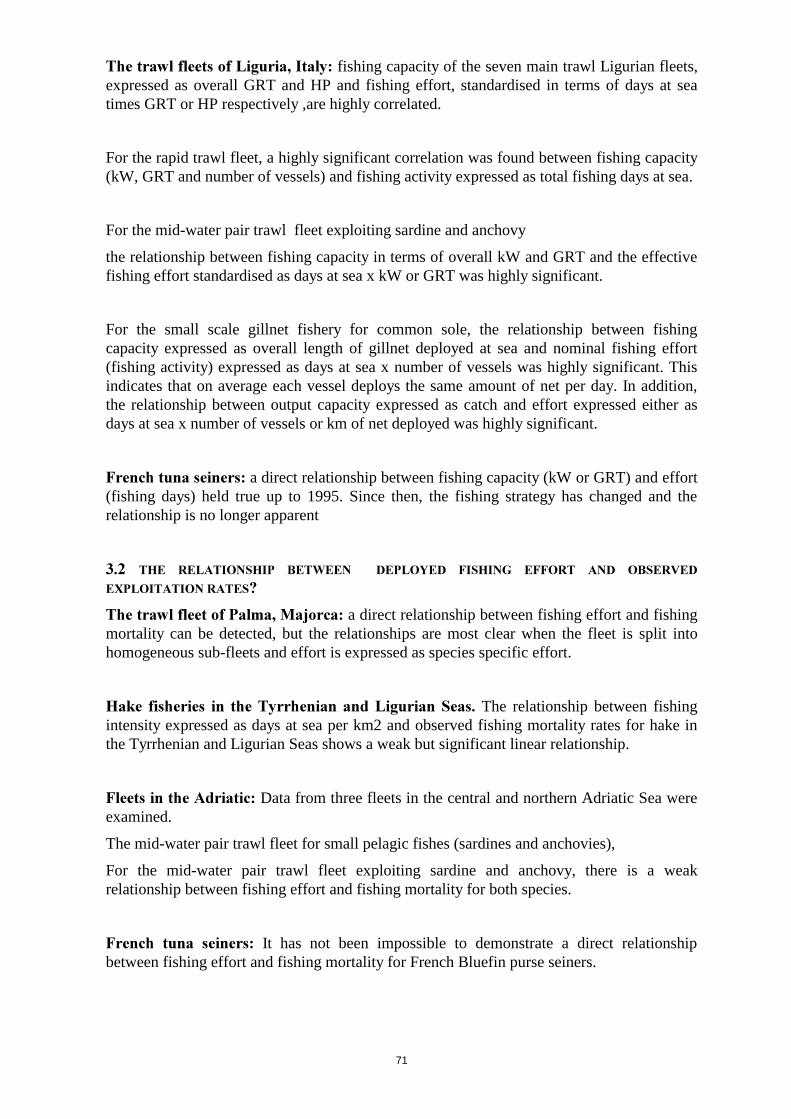
71
7KH�WUDZO�IOHHWV�RI�/LJXULD��,WDO\� fishing capacity of the seven main trawl Ligurian fleets,expressed as overall GRT and HP and fishing effort, standardised in terms of days at seatimes GRT or HP respectively ,are highly correlated.
For the rapid trawl fleet, a highly significant correlation was found between fishing capacity(kW, GRT and number of vessels) and fishing activity expressed as total fishing days at sea.
For the mid-water pair trawl fleet exploiting sardine and anchovy
the relationship between fishing capacity in terms of overall kW and GRT and the effectivefishing effort standardised as days at sea x kW or GRT was highly significant.
For the small scale gillnet fishery for common sole, the relationship between fishingcapacity expressed as overall length of gillnet deployed at sea and nominal fishing effort(fishing activity) expressed as days at sea x number of vessels was highly significant. Thisindicates that on average each vessel deploys the same amount of net per day. In addition,the relationship between output capacity expressed as catch and effort expressed either asdays at sea x number of vessels or km of net deployed was highly significant.
)UHQFK�WXQD�VHLQHUV� a direct relationship between fishing capacity (kW or GRT) and effort(fishing days) held true up to 1995. Since then, the fishing strategy has changed and therelationship is no longer apparent
���� 7+(� 5(/$7,216+,3� %(7:((1� � '(3/2<('� ),6+,1*� ())257� $1'� 2%6(59('
(;3/2,7$7,21�5$7(6"
7KH�WUDZO�IOHHW�RI�3DOPD��0DMRUFD��a direct relationship between fishing effort and fishingmortality can be detected, but the relationships are most clear when the fleet is split intohomogeneous sub-fleets and effort is expressed as species specific effort.
+DNH� ILVKHULHV� LQ� WKH�7\UUKHQLDQ�DQG�/LJXULDQ�6HDV� The relationship between fishingintensity expressed as days at sea per km2 and observed fishing mortality rates for hake inthe Tyrrhenian and Ligurian Seas shows a weak but significant linear relationship.
)OHHWV�LQ�WKH�$GULDWLF��Data from three fleets in the central and northern Adriatic Sea wereexamined.
The mid-water pair trawl fleet for small pelagic fishes (sardines and anchovies),
For the mid-water pair trawl fleet exploiting sardine and anchovy, there is a weakrelationship between fishing effort and fishing mortality for both species.
)UHQFK� WXQD� VHLQHUV� It has not been impossible to demonstrate a direct relationshipbetween fishing effort and fishing mortality for French Bluefin purse seiners.
72
���� 7+(� (;7(17� 72� :+,&+� 27+(5� )$&7256� �7(&+12/2*,&$/� ,03529(0(176�(19,5210(17$/� &+$1*(6� %,2/2*,&$/� ,17(5$&7,216� 25� (&2120,&� )$&7256�$))(&7('�7+(�5(/$7,216+,36�%(7:((1�&$3$&,7<��())257�$1'�),6+,1*�0257$/,7<�
������7KH� HIIHFWV� RI� WHFKQLFDO� LPSURYHPHQWV� �WHFKQLFDO� HIILFLHQF\�� RQ� WKH� UHODWLRQVKLSEHWZHHQ�FDSDFLW\��HIIRUW�DQG�ILVKLQJ�PRUWDOLW\�
Since increases in technical efficiency have a direct influence on the relationship betweenfishing effort and fishing mortality, the group reviewed the findings of the EU fundedproject 98/027, “On the applicability of biological and economic indicators to evaluate thefishing efficiency dynamics of some demersal fisheries of the North Sea”. The conclusionswere as follows:
Fishing efficiency of the Dutch and Danish fleets are subject to trends and stepwise changesover time and the relationship between fishing mortality and fishing activity can beenhanced by standardising the no. of days fishing by horsepower (for fleets using towedgears) and by the time dynamics in fishing efficiency.
The trends in fishing efficiency were different depending on the species under consideration.Such contrasting dynamics might reveal shifts in fishing strategies, which could result fromone of the harvested stock being depleted (Danish trawlers fishing for cod and plaice), TACand/or individual quota being restrictive (Dutch beam-trawlers harvesting sole and plaice).The mixed-species aspect of the fisheries is hence obscuring the nature of the relationshipbetween fishing mortality and fishing activity.
Despite species-dependent effects, overall increase of efficiency for Dutch beam-trawlersover 1989-1998 has been detected. This increase might somehow be related to somemanagement measures, including TACs, ITQs and the implementation of the plaice box.The latter might have resulted in a reduction of the competition for fishing grounds, whichcould have benefited to the small trawlers fishing in the restricted area, while the largertrawlers might have taken advantage of the exploration of new fishing grounds outside thePlaice Box.
Improving the understanding of management measures on fishing efficiency wouldcontribute to better predict some of the dynamics of fishing mortality.
Further investigations on the relationship between fishing capacity, fishing effort and fishingmortality using up-dated information for selected Dutch and Danish fleets. In addition, dataon UK and French fleets were also evaluated.
The overall conclusions are that with respect to target species the fishing efficiency of someof the fleets under examination appears to have increased over the period of investigation.However, in some cases decreasing trends have been observed.
Fishing efficiency of most fleets under investigation has decreased between 1999 and 2000.The efficiency of the English fleets harvesting hake appears to have decreased over thewhole period of investigation. The reason for these observed trends are still unclear.Decreasing trends in fishing efficiency may be related to TACs being more restrictive orspecies being less available. On the other hand, increases in efficiency may be due to eitherchanges in the technical characteristics and/or ability of the crew, but may also be influencedby the allocation of ITQs among vessels (e.g. Dutch beam trawlers).
The measure of engine power (HP, kW) to standardise fishing effort appears only useful forfisheries that are energy-intensive, e.g. those requiring engine power for pulling the gearover the bottom. In such cases (e.g. beam and otter trawling) a positive relationship existsbetween engine power and the proxy for fishing capacity.
73
Gross tonnage (GRT) does not appear to be a relevant measure of fishing capacity for fleetsusing towed gears but it does seem to be a better proxy for gill-netters, possibly becauselarger boats can carry more nets.
Using alternative measures of fishing effort for the English fleets did not significantly alterthe results, except for gill-netters, where using net size as a measure of fishing effortmodified the perception of fishing power. However, the fit between partial F and effort wasnever substantially improved.
Improvements of the fit between partial F and effort were brought about by standardisingfishing effort by horsepower for trawlers, and by gross tonnage for gill-netters.Standardising fishing effort by efficiency trends only enhanced the fit in one case: theDanish gill-netters harvesting plaice.
The results indicate that in most of the case studies, the relationship between fishing effortand fishing mortality is more dependent on which capacity measure is used than on whetherefficiency trends are accounted for.
������ 7HFKQLFDO� LQWHUDFWLRQV� DQG� WKHLU� HIIHFW� RQ� FDSDFLW\� DV� DQ� RXWSXW� PHDVXUH�FDWFKLQJ�FDSDFLW\�
A review of an analysis of technical interactions between fishing fleets in the EnglishChannel showed that decreasing the fishing effort of fleets differentially affects the catchingcapacity of other fleets, depending of their level of competition for the resource. Althoughthe results should essentially be used on a qualitative manner; they provide relevantinformation on both the direction and the magnitude of the competition interactions in sucha polyvalent fishery.
������'HFRPPLVVLRQLQJ�DQG�HIILFLHQF\
An evaluation of the effects of decommissioning on efficiency highlights theinappropriateness of using physical capacity units for both the measurement of fishingcapacity and the basis of capacity reduction programmes. While the latter is to some extentessential from a pragmatic management perspective, managers need to take into accountdifferences in efficiency of the boats when implementing decommissioning programmes.That is, it needs to be recognised removing x% of the fleet will not equate to a x% reductionin output.
A key result of the study relates not to the effects of management SHU�VH, but to the effects ofboat replacement on the harvesting capability of the fleet. Introducing newer, larger vesselsincreases the harvesting potential of the fleet. The importance of vintage to the level oftechnical efficiency has a substantial implication for the management of EU fisheries, andthe North Sea fisheries in particular. New vessels are able to incorporate new designtechnologies that improve their performance. Under the MAGPs, countries that achieve theircapacity reductions can assist in the modernisation of their fleet. As noted above, replacingolder vessels with new vessels will increase the level of technical efficiency in the fleet, andagain distort the balance between catching capacity and catch. Moreover, as larger boatswere found to be more efficient than smaller boats, replacing even two old smaller boatswith one new larger boat with the same overall physical capacity may result in a substantialefficiency increase. When assistance is provided to replace ageing fleets, the resultantincrease in efficiency may more than offset any reduction in capacity and nominal effortarising from the MAGP.
74
A further implication of the results is that decreasing fleet size through policies such as theMAGP to bring it back into balance with the stocks may result in increased harvestingefficiency through decreased crowding. While economic benefits are likely to derive fromsuch a policy as a result of the reduction in overall resource used in fishing, the conservationbenefits may be less than anticipated.
����7+(�0$,1�)$&7256�7+$7�(;3/$,1�)/((7�'<1$0,&6�
The group identified numerous candidate factors that can influence fleet dynamics andhence the fishing capacity of the fleet. The group has found no comprehensive studies thatcan quantify which factors have the greatest influence on fishing capacity or how the factorsinteract. Nevertheless, the group suggests that fishing capacity, is fundamentally driven byinvestment decisions, which in turn are influenced by other variables. Therefore, the groupsuggests that economic and technological components should be included in themeasurement of fishing capacity.
The group suggests that in order to understand how fishing capacity changes, it is necessaryto understand the processes that influence investment decisions. This is unlikely to be atrivial task and will involve assessments of biological, economic and social factors, all ofwhich can influence the decision to invest in fishing. Any such studies will be datademanding, and in most cases, appropriate data will be unavailable.
The group suggests however, that in terms of managing fishing capacity to match capacity toresource availability, besides an understanding of the processes that contribute to changes incapacity, the understanding of the factors that affect the deployment of fishing capacity togenerate fishing effort is also important. Furthermore, if the economic aspect is taken intoaccount in fishing capacity the relationship between fishing effort (fishing capacity perfishing activity) and fishing capacity should be better understood.
����0$1$*(5,$/�02'(/6��72�$'0,1,67(5�),6+,1*�&$3$&,7<
������7UHQGV�LQ�ILVKLQJ�SRZHU�RQ�ELR�HFRQRPLFV�LQ�WKH�1RUWK�6HD�IODWILVK�ILVKHU\�
An evaluation of the trends in fishing power on bio-economics in the North Sea flatfishfishery regulated by catch or effort quotas, indicated that the harvest control rule proposedunder the Precautionary Approach appears to be very restrictive with the current stocksituation. Furthermore, the results indicate that if this approach been strictly applied duringthe 1990s either through effort (TAE) or catch (TAC) controls, it would have inducedenhanced biological status of the stocks but have resulted in major economic losses in theshort term.
Overall results from this study suggested that, in a multi-species multi-fleet fishery, there arewide biological and economic differences expected when implementing the samemanagement rules with different management tools. TACs and TAEs have different benefitsand drawbacks. In particular, regarding catchability, TAEs are more sensitive to a biasinduced by mis-specifying the relationship between effort and mortality. Furthermore, notaccounting for trends in fishing power due to technological developments, increases the riskof underestimating F and overestimating SSB.
75
������5HYLHZ�RI�GLIIHUHQW�LQVWUXPHQWV�WR�PDQDJH�FDSDFLW\
The Expert group reviewed several different management instruments and provides acommentary on each in turn. The review categorises the different instruments according towhether they are input or output measures The different instruments evaluated are asfollows:
,QSXW�FRQWUROV�
/LFHQFH�OLPLWDWLRQV��OLPLWHG�HQWU\�PDQDJHPHQW�
8QLWLVDWLRQ�VFKHPHV
'HFRPPLVVLRQLQJ�DQG�EX\EDFN�VFKHPHV
/LPLWDWLRQV�RQ�DFWLYLW\
7HFKQLFDO�FRQWUROV�RQ�YHVVHOV
2XWSXW�FRQWUROV
7RWDO�DOORZDEOH�FDWFKHV��7$&V�
,QGLYLGXDO�TXRWDV
In addition the Report discusses the merits of user charges as an alternative approach toinput or output controls i.e. to change the costs or benefits of fishing through imposing acharge for use to the resource, either on inputs or outputs. The report also discusses differentallocation systems on the management of capacity and summarises a variety ofcomprehensive reviews on alternative management instruments that complement the abovediscussion.
Finally the third Report documents the different systems in operation in Denmark, theNetherlands, the UK and the Mediterranean Region.
������5HYLHZ�RI�ELR�HFRQRPLF�PRGHOV�IRU�WKH�PDQDJHPHQW�RI�ILVKLQJ�FDSDFLW\�
The Expert group has reviewed existing bio-economic models and their applicability for themanagement of capacity and lists all known models, many of which were funded by the EU.The Group concludes that a logistical difficulty with the use of bio-economic models forassessing capacity management is that most models are not updated. Because funding formodelling activity is not ongoing, but is largely project specific, researchers are unable tokeep the models up to date after the end of the project in which they were developed.Further, as most models have been developed for particular purposes (e.g. to evaluate aparticular problem), they are not able to address all potential management options. Evenmodels that have been developed as generic modelling tools, such as the MEFISTO modelfor the Mediterranean, are limited in their scope to the fisheries and issues that they weredesigned to address. In most cases, these models need to be further developed, and allmodels need to be maintained on an ongoing basis.
76
The Group also proposes a method to assess economic sustainability and overcapacity usingeconomic data prepared under the concerted action FAIR CT-97-3541, the EconomicInterpretation of ACFM Advice (EIAA) and the Annual Economic Report of selectedEuropean Fishing Fleets (AER). This is referred to as the Break-Even method. The methodis described in detail and its utility is illustrated using a specific example.
The group concludes that the Break-Even method is considered operational on a wider EU-level and sufficiently robust, although not necessarily theoretically optimal. Further themethod is supported by its transparency, and acceptability in the industry due to the use ofwell-known business-economics principles. The method can handle many species subject todifferent yield curves by weighting them together using prices. The method takes intoaccount a number of the economic elements the fisherman would face and include in hisdecision about whether to leave the industry or remain. Furthermore, because the method isbased on remuneration of production factors, be it only vessel capital or both vessel capitaland fish stocks, the method could be used independently of TAC and quota settings. Finally,the calculation is based on well-justified costs and earnings statistics produced in theindustry.
It is possible to apply the method to all the fleet segments that are included in the AER. Atpresent about 50 segments are included, but in the EU supported concerted actioncommencing in 2002 the number will be increased.
Although the method is based on output it could be applied on the input side as well; in themost simple form, by changing the fishing capacity in terms of potential number of fishingdays (number of vessels times vessel fishing days) proportionally with the required changein output. By using models that take into account explicitly a number of capacity and effortvariables e.g. in particular the number of vessels and fishing days categorised inhomogenised fleet segments, an estimate of overcapacity could be obtained. Using anoptimisation procedure where profit is maximised either on a fleet segment level or thefishery as a whole, will indicate the optimum fleet composition and number of fishing daysrequired to catch a given TAC.
Finally, the Group provides an overview of MEFISTO, a bio-economic model for theMediterranean fisheries. The model is designed specifically to address issues particular tothe Mediterranean and is not generally applicable to other fisheries.
77
����� �$33(1',;���7+(�327(17,$/�(&2120,&�,03$&7�2)�7$&6�352326('�%<�$&)0)25�����
(XURSHDQ�$VVRFLDWLRQ�RI�)LVKHULHV�(FRQRPLVWV�$GYLVRU\�&RPPLWWHH
($)(�$&�5(3257
7KH�3RWHQWLDO�(FRQRPLF�,PSDFW
RQ�6HOHFWHG�)LVKLQJ�)OHHW�6HJPHQWV
RI�7$&V�3URSRVHG�E\�$&)0�IRU�����
�(,$$�PRGHO�FDOFXODWLRQV�
$�5HSRUW�RI�WKH
(XURSHDQ�$VVRFLDWLRQ�RI�)LVKHULHV�(FRQRPLVWV�$GYLVRU\�&RPPLWWHH
May 2002
78
(XURSHDQ�$VVRFLDWLRQ�RI�)LVKHULHV�(FRQRPLVWV�$GYLVRU\�&RPPLWWHH
&KDLUPDQ�� Philip Rodgers
0HPEHUV� Jean Boncoeur
Denis Bailly
Henning Jørgensen
Massino Spagnolo
Vincenzo Placenti
Erik Buisman
Hans Frost
([�2IILFLR Members: Jorgen Lokkegaard, EAFE President
Aaron Hatcher, EAFE Secretary
&RQWDFW�
Jorgen Lokkegaard
President of EAFE
Fødevareøkonomisk Institut
Rolighedsvej 25
1958 Frederiksberg C.
Phone: +45 35 28 68 90
Fax: +45 35 28 68 01
E-mail: [email protected]
Website: www.sjfi.dk
EAFE Website: www.eafe-fish.org
$FNQRZOHGJHPHQW��The model used in this Report was developed from that set outfor the Economic Interpretation of ACFM Advice5 originated under FAIR PL97-3541 5 Concerted Action: Promotion of Common Methods for Economic Assessment of EU
Fisheries (2001) (FRQRPLF�,QWHUSUHWDWLRQ�RI�$&)0�$GYLFH��6SHFLPHQ�5HSRUW�1R����LEI, Den Haag, 2001.
79
and funded for 2001 by the Danish Institute for Agricultural and Fisheries Economics(SJFI), now the Danish Research Institute of Food Economics (FødevareøkonomiskInstitut, FØI). Most of the data presented was collected under the EU funded project‘Data on the economic performance of the fisheries sector’ (EU contract no. 00/32 DGFisheries).
'LVFODLPHU� EAFE accepts no responsibility for any action taken as a consequence ofthis report which by its nature must remain general. It is imperative that any partyshould take full and complete professional advice on any action they may propose totake.
No part of this document may be reproduced without the written permission of EAFE
© European Association of Fisheries Economists 2002
80
7+(� 327(17,$/� (&2120,&� ,03$&7� 21� 6(/(&7('� ),6+,1*� )/((76(*0(176� 2)� 7$&6� 352326('� %<� $&)0� )25� ������ �(,$$�02'(/&$/&8/$7,216�
&RQWHQWV
Introduction to the Report 81
6HFWLRQ�� ��
Assessments of the Economic Impact of Proposed 2002 TACs by Fleet Segment 84
Belgium 84
Denmark 85
Finland 89
Netherlands 91
Sweden 93
Summary 95
6HFWLRQ�� ��
The EIAA Model - Methodology, Definitions and Features 96
Methodology 97
Definitions 101
Presentation and interpretation of results 102
Specification of the biological data required for the EIAA model 103
6HOHFWHG�PRGHO�IHDWXUHV ���
Special Features of the EIAA Calculations 106
81
,1752'8&7,21�72�7+(�(,$$�5(3257�)25�����
This report is composed of 2 sections. The first gives an assessment of the expectedeconomic impact of the TACs proposed by the ACFM for 2002. The seconddescribes the EIAA Model. It is intended to throw light on some bio-economicfeatures of the model that will help non-economists and that dovetail with theconventional bio-economic advice.
To carry out an assessment of the financial impact of ACFM advice, the fleetsegments examined need to be subject to quotas, and knowledge of the catchcomposition for the national fleet and each fleet segment is also required. The costsand earnings information is from the Annual Economic Report (AER).
Section 1 includes the segments for which all the information is available. Theeconomic information is quite reliable. Definitions and explanation of diagrams arefound in section 2.2 and 2.3. In this report it has been possible to include segmentsfrom each EU member state as follows:
Belgium 1 segment
Denmark 4 segments
Finland 2 segments
Netherlands 2 segments
Sweden 2 segments
The assumptions for the calculations for these 5 countries are:
v Future prices are base period prices adjusted with a flexibility rate of 0.2 basedon the whole TAC for the EU for the relevant. Species.
v For Belgium, Denmark, the Netherlands and Sweden the stock-catch flexibilityrate is 0.6 for demersal species and 0.1 for pelagic. That means that an inincrease in stock abundance lowers the amount of effort. For Finland the stockeffects is zero for pelagic species because of the schooling behaviour and 0.6for demersal species.
v The change in effort is proportional to the change in the quotas for the relevantsegment.
v Costs are calculated at fixed prices (base period) but adjusted proportionallywith the change in effort for future years.

82
Segments subject to quotas but with no information or no sufficiently reliablecomparable information about the catch composition for the relevant segments arethose of Ireland, Portugal, Spain and United Kingdom.
Segments for which no applicable information is available also include those ofFrance, where there has been a change of base for data collection and hence as yet notime series, and Germany where no information was collected for 2001. Segmentsthat are not subject to quotas, or very few quotas, are those of Italy and Greece.
83
6HFWLRQ��
7+(�327(17,$/�(&2120,&�,03$&7�21�6(/(&7('�),6+,1*�)/((76(*0(176�2)�7$&6�352326('�%<�$&)0�)25������
�(,$$�02'(/�&$/&8/$7,216��
6 Concerted Action: Promotion of Common Methods for Economic Assessment of EU
Fisheries (2001) (FRQRPLF�3HUIRUPDQFH� RI� 6HOHFWHG�(XURSHDQ�)LVKLQJ�)OHHWV�� $QQXDO5HSRUW������ November, SJFI, Copenhagen.
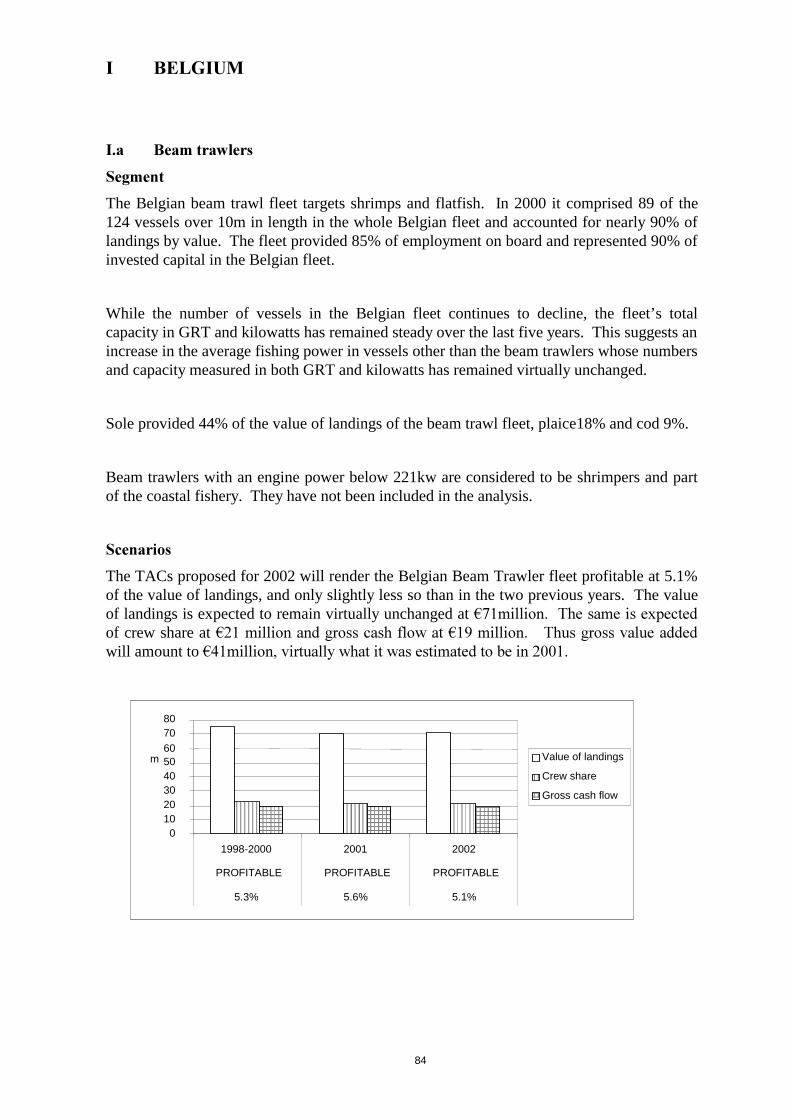
84
, %(/*,80
,�D %HDP�WUDZOHUV
6HJPHQW
The Belgian beam trawl fleet targets shrimps and flatfish. In 2000 it comprised 89 of the124 vessels over 10m in length in the whole Belgian fleet and accounted for nearly 90% oflandings by value. The fleet provided 85% of employment on board and represented 90% ofinvested capital in the Belgian fleet.
While the number of vessels in the Belgian fleet continues to decline, the fleet’s totalcapacity in GRT and kilowatts has remained steady over the last five years. This suggests anincrease in the average fishing power in vessels other than the beam trawlers whose numbersand capacity measured in both GRT and kilowatts has remained virtually unchanged.
Sole provided 44% of the value of landings of the beam trawl fleet, plaice18% and cod 9%.
Beam trawlers with an engine power below 221kw are considered to be shrimpers and partof the coastal fishery. They have not been included in the analysis.
6FHQDULRV
The TACs proposed for 2002 will render the Belgian Beam Trawler fleet profitable at 5.1%of the value of landings, and only slightly less so than in the two previous years. The valueof landings is expected to remain virtually unchanged at ¼��PLOOLRQ���7KH�VDPH�LV�H[SHFWHGof crew share at ¼���PLOOLRQ�DQG�JURVV�FDVK�IORZ�DW�¼���PLOOLRQ��� �7KXV�JURVV�YDOXH�DGGHGwill amount to ¼��PLOOLRQ��YLUWXDOO\�ZKDW�LW�ZDV�HVWLPDWHG�WR�EH�LQ������
01020304050607080
1998-2000 2001 2002
PROFITABLE PROFITABLE PROFITABLE
5.3% 5.6% 5.1%
m Value of landings
Crew share
Gross cash flow
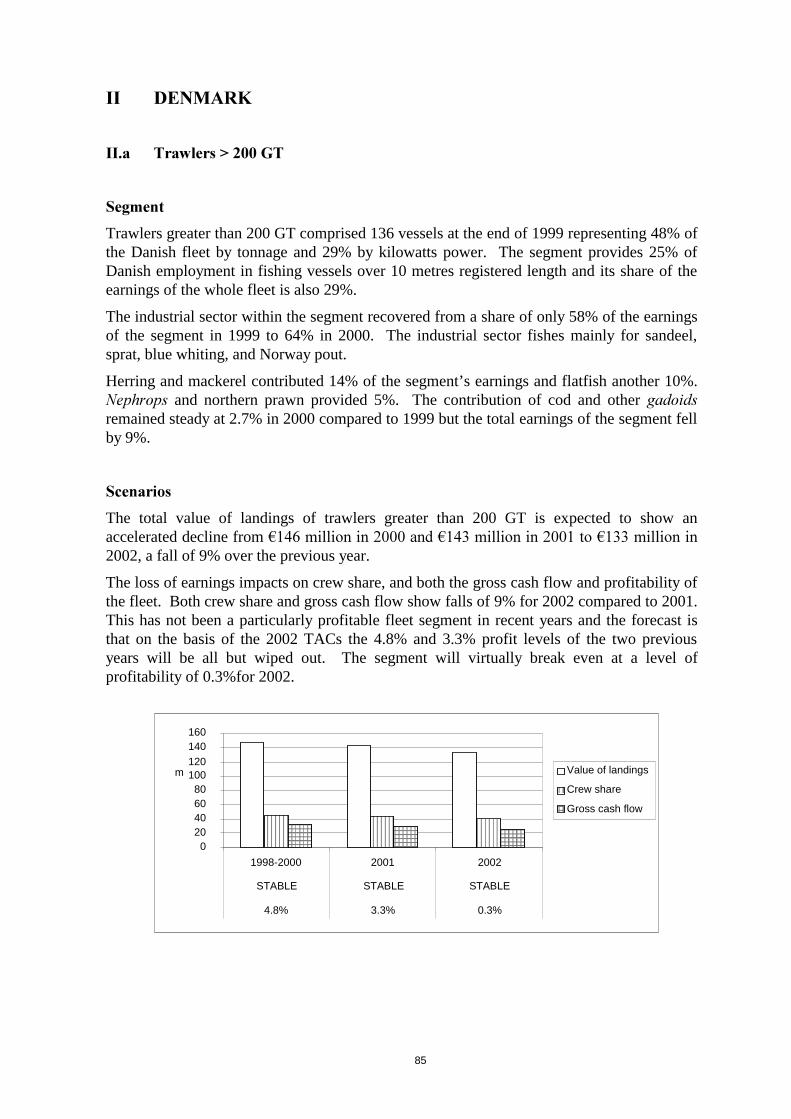
85
,, '(10$5.
,,�D 7UDZOHUV�!�����*7
6HJPHQW
Trawlers greater than 200 GT comprised 136 vessels at the end of 1999 representing 48% ofthe Danish fleet by tonnage and 29% by kilowatts power. The segment provides 25% ofDanish employment in fishing vessels over 10 metres registered length and its share of theearnings of the whole fleet is also 29%.
The industrial sector within the segment recovered from a share of only 58% of the earningsof the segment in 1999 to 64% in 2000. The industrial sector fishes mainly for sandeel,sprat, blue whiting, and Norway pout.
Herring and mackerel contributed 14% of the segment’s earnings and flatfish another 10%.1HSKURSV and northern prawn provided 5%. The contribution of cod and other JDGRLGVremained steady at 2.7% in 2000 compared to 1999 but the total earnings of the segment fellby 9%.
6FHQDULRV
The total value of landings of trawlers greater than 200 GT is expected to show anaccelerated decline from ¼����PLOOLRQ�LQ������DQG�¼����PLOOLRQ�LQ������WR�¼����PLOOLRQ�LQ2002, a fall of 9% over the previous year.
The loss of earnings impacts on crew share, and both the gross cash flow and profitability ofthe fleet. Both crew share and gross cash flow show falls of 9% for 2002 compared to 2001.This has not been a particularly profitable fleet segment in recent years and the forecast isthat on the basis of the 2002 TACs the 4.8% and 3.3% profit levels of the two previousyears will be all but wiped out. The segment will virtually break even at a level ofprofitability of 0.3%for 2002.
020406080
100120140160
1998-2000 2001 2002
STABLE STABLE STABLE
4.8% 3.3% 0.3%
m Value of landings
Crew share
Gross cash flow
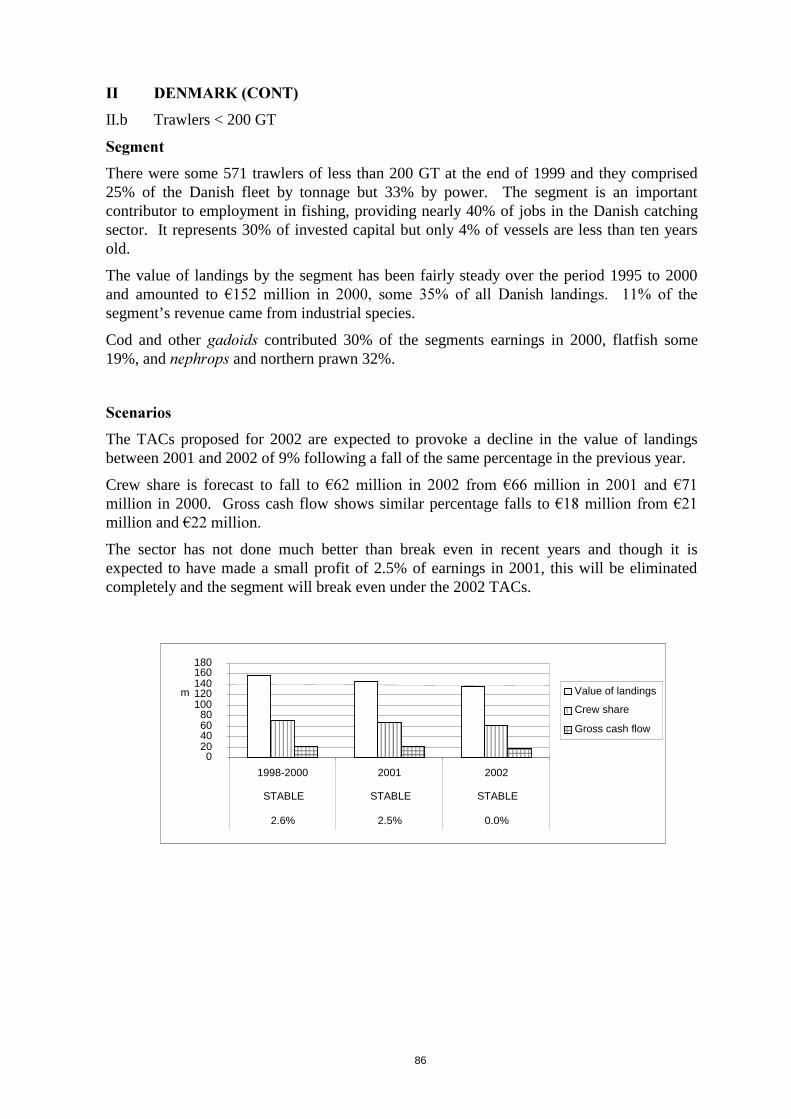
86
,, '(10$5.��&217�
II.b Trawlers < 200 GT
6HJPHQW
There were some 571 trawlers of less than 200 GT at the end of 1999 and they comprised25% of the Danish fleet by tonnage but 33% by power. The segment is an importantcontributor to employment in fishing, providing nearly 40% of jobs in the Danish catchingsector. It represents 30% of invested capital but only 4% of vessels are less than ten yearsold.
The value of landings by the segment has been fairly steady over the period 1995 to 2000and amounted to ¼���� PLOOLRQ� LQ� ������ VRPH� ���� RI� DOO� 'DQLVK� ODQGLQJV�� � ���� RI� WKHsegment’s revenue came from industrial species.
Cod and other JDGRLGV contributed 30% of the segments earnings in 2000, flatfish some19%, and QHSKURSV and northern prawn 32%.
6FHQDULRV
The TACs proposed for 2002 are expected to provoke a decline in the value of landingsbetween 2001 and 2002 of 9% following a fall of the same percentage in the previous year.
Crew share is forecast to fall to ¼���PLOOLRQ� LQ� ����� IURP� ¼���PLOOLRQ� LQ� ����� DQG� ¼��million in 2000. Gross cash flow shows similar percentage falls to ¼���PLOOLRQ� IURP�¼��million and ¼���PLOOLRQ�
The sector has not done much better than break even in recent years and though it isexpected to have made a small profit of 2.5% of earnings in 2001, this will be eliminatedcompletely and the segment will break even under the 2002 TACs.
020406080
100120140160180
1998-2000 2001 2002
STABLE STABLE STABLE
2.6% 2.5% 0.0%
m Value of landings
Crew share
Gross cash flow
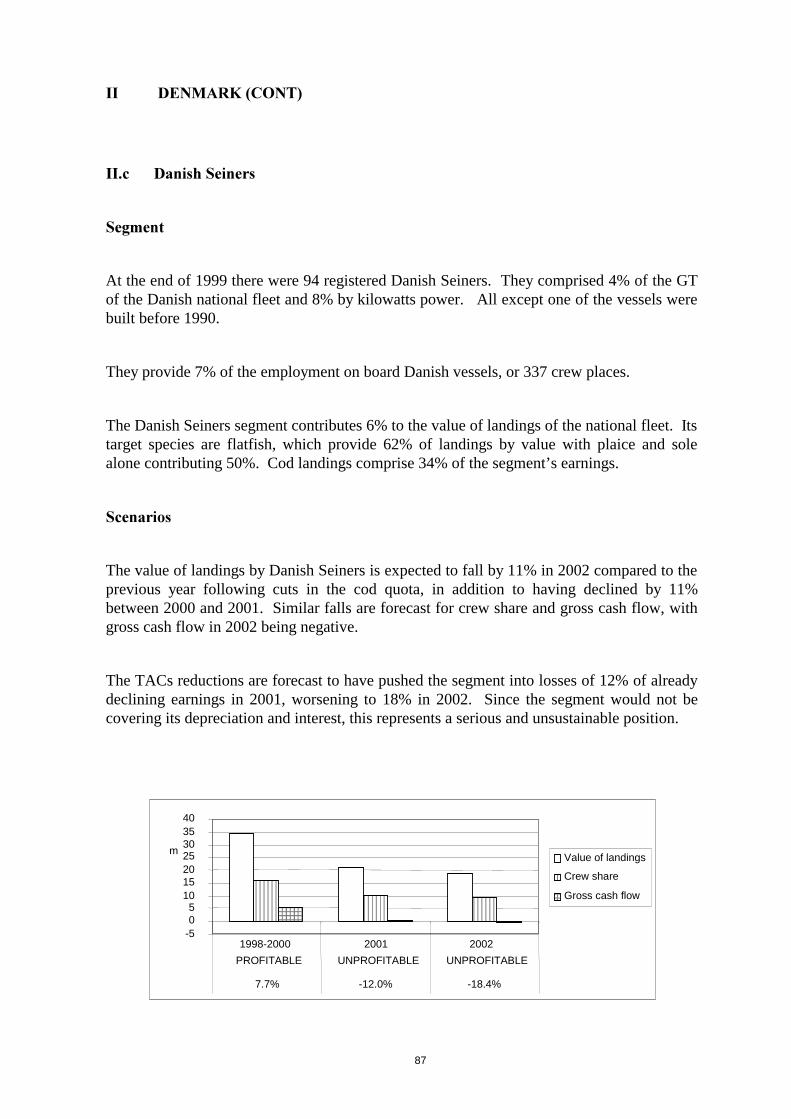
87
,, �'(10$5.��&217�
,,�F 'DQLVK�6HLQHUV
6HJPHQW
At the end of 1999 there were 94 registered Danish Seiners. They comprised 4% of the GTof the Danish national fleet and 8% by kilowatts power. All except one of the vessels werebuilt before 1990.
They provide 7% of the employment on board Danish vessels, or 337 crew places.
The Danish Seiners segment contributes 6% to the value of landings of the national fleet. Itstarget species are flatfish, which provide 62% of landings by value with plaice and solealone contributing 50%. Cod landings comprise 34% of the segment’s earnings.
6FHQDULRV
The value of landings by Danish Seiners is expected to fall by 11% in 2002 compared to theprevious year following cuts in the cod quota, in addition to having declined by 11%between 2000 and 2001. Similar falls are forecast for crew share and gross cash flow, withgross cash flow in 2002 being negative.
The TACs reductions are forecast to have pushed the segment into losses of 12% of alreadydeclining earnings in 2001, worsening to 18% in 2002. Since the segment would not becovering its depreciation and interest, this represents a serious and unsustainable position.
-505
10152025303540
1998-2000 2001 2002
PROFITABLE UNPROFITABLE UNPROFITABLE
7.7% -12.0% -18.4%
mValue of landings
Crew share
Gross cash flow
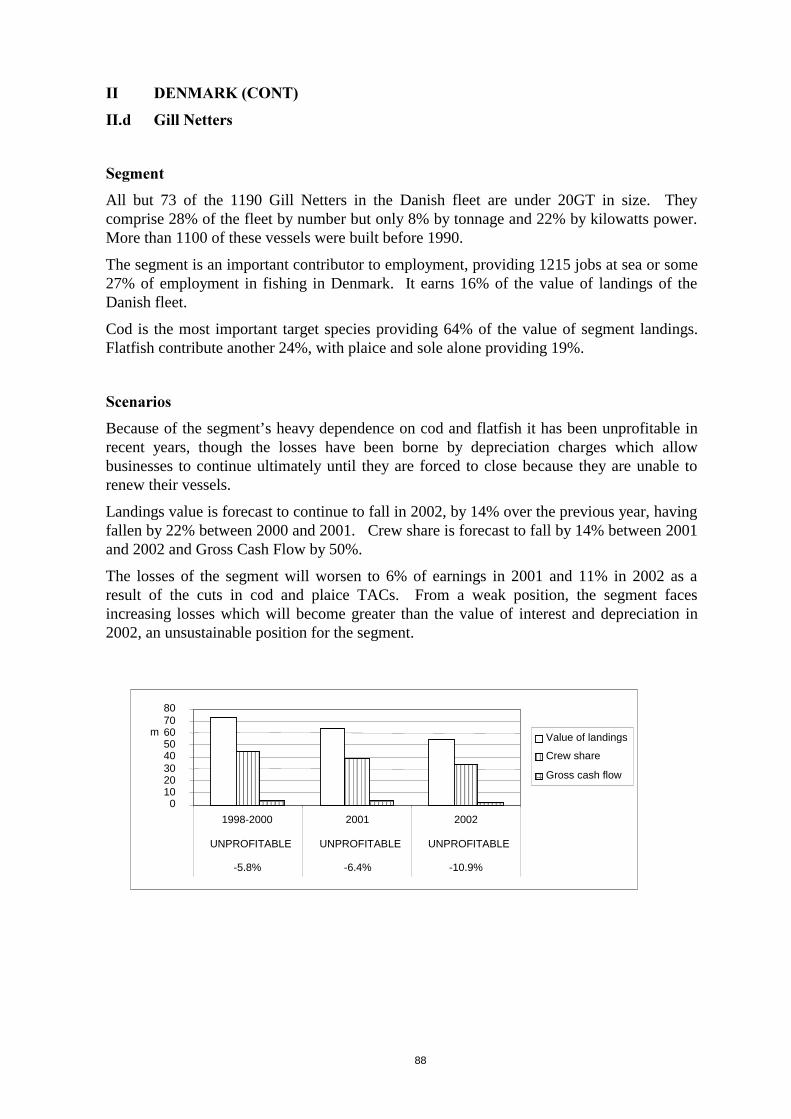
88
,, '(10$5.��&217�
,,�G *LOO�1HWWHUV
6HJPHQW
All but 73 of the 1190 Gill Netters in the Danish fleet are under 20GT in size. Theycomprise 28% of the fleet by number but only 8% by tonnage and 22% by kilowatts power.More than 1100 of these vessels were built before 1990.
The segment is an important contributor to employment, providing 1215 jobs at sea or some27% of employment in fishing in Denmark. It earns 16% of the value of landings of theDanish fleet.
Cod is the most important target species providing 64% of the value of segment landings.Flatfish contribute another 24%, with plaice and sole alone providing 19%.
6FHQDULRV
Because of the segment’s heavy dependence on cod and flatfish it has been unprofitable inrecent years, though the losses have been borne by depreciation charges which allowbusinesses to continue ultimately until they are forced to close because they are unable torenew their vessels.
Landings value is forecast to continue to fall in 2002, by 14% over the previous year, havingfallen by 22% between 2000 and 2001. Crew share is forecast to fall by 14% between 2001and 2002 and Gross Cash Flow by 50%.
The losses of the segment will worsen to 6% of earnings in 2001 and 11% in 2002 as aresult of the cuts in cod and plaice TACs. From a weak position, the segment facesincreasing losses which will become greater than the value of interest and depreciation in2002, an unsustainable position for the segment.
01020304050607080
1998-2000 2001 2002
UNPROFITABLE UNPROFITABLE UNPROFITABLE
-5.8% -6.4% -10.9%
m Value of landings
Crew share
Gross cash flow
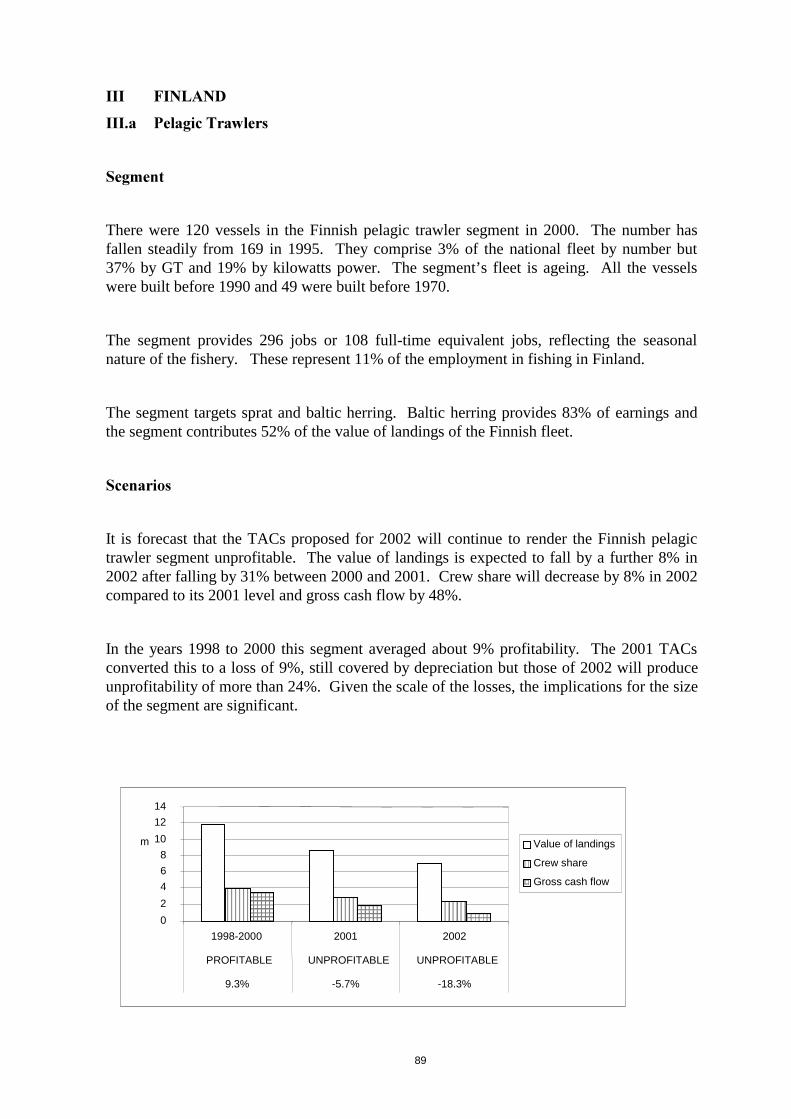
89
,,, ),1/$1'
,,,�D 3HODJLF�7UDZOHUV
6HJPHQW
There were 120 vessels in the Finnish pelagic trawler segment in 2000. The number hasfallen steadily from 169 in 1995. They comprise 3% of the national fleet by number but37% by GT and 19% by kilowatts power. The segment’s fleet is ageing. All the vesselswere built before 1990 and 49 were built before 1970.
The segment provides 296 jobs or 108 full-time equivalent jobs, reflecting the seasonalnature of the fishery. These represent 11% of the employment in fishing in Finland.
The segment targets sprat and baltic herring. Baltic herring provides 83% of earnings andthe segment contributes 52% of the value of landings of the Finnish fleet.
6FHQDULRV
It is forecast that the TACs proposed for 2002 will continue to render the Finnish pelagictrawler segment unprofitable. The value of landings is expected to fall by a further 8% in2002 after falling by 31% between 2000 and 2001. Crew share will decrease by 8% in 2002compared to its 2001 level and gross cash flow by 48%.
In the years 1998 to 2000 this segment averaged about 9% profitability. The 2001 TACsconverted this to a loss of 9%, still covered by depreciation but those of 2002 will produceunprofitability of more than 24%. Given the scale of the losses, the implications for the sizeof the segment are significant.
0
2
4
6
8
10
12
14
1998-2000 2001 2002
PROFITABLE UNPROFITABLE UNPROFITABLE
9.3% -5.7% -18.3%
m Value of landings
Crew share
Gross cash flow
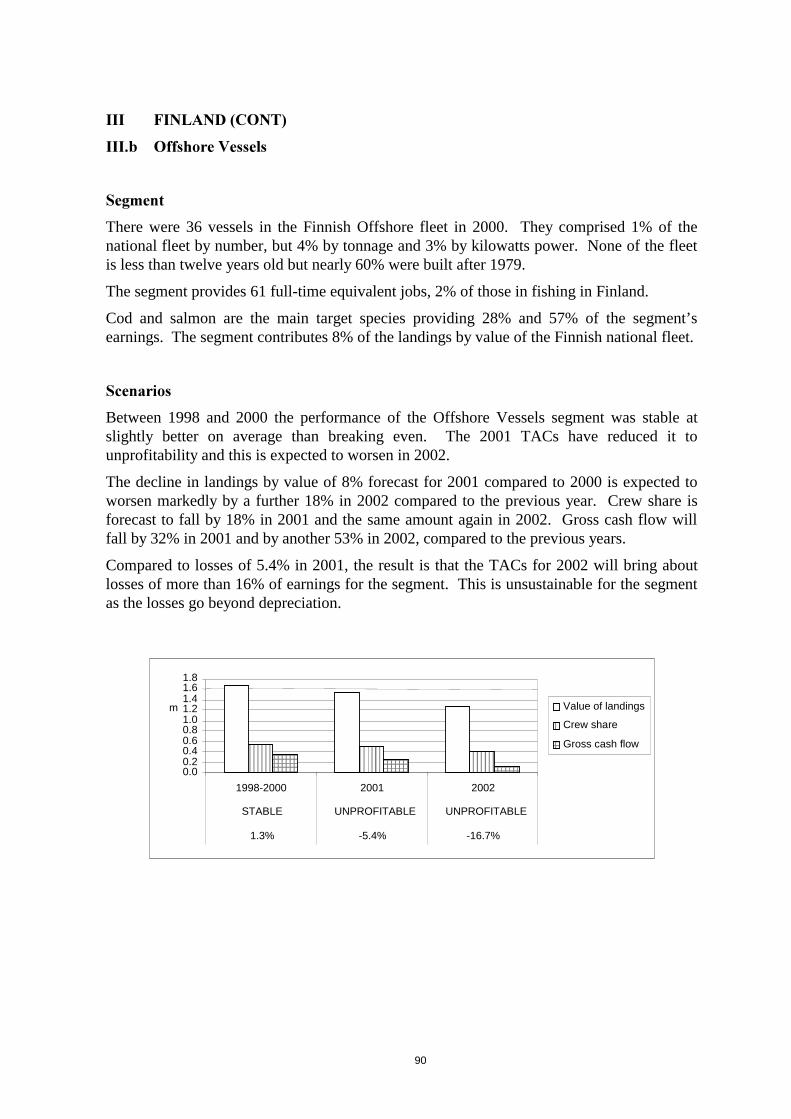
90
,,, ),1/$1'��&217�
,,,�E 2IIVKRUH�9HVVHOV
6HJPHQW
There were 36 vessels in the Finnish Offshore fleet in 2000. They comprised 1% of thenational fleet by number, but 4% by tonnage and 3% by kilowatts power. None of the fleetis less than twelve years old but nearly 60% were built after 1979.
The segment provides 61 full-time equivalent jobs, 2% of those in fishing in Finland.
Cod and salmon are the main target species providing 28% and 57% of the segment’searnings. The segment contributes 8% of the landings by value of the Finnish national fleet.
6FHQDULRV
Between 1998 and 2000 the performance of the Offshore Vessels segment was stable atslightly better on average than breaking even. The 2001 TACs have reduced it tounprofitability and this is expected to worsen in 2002.
The decline in landings by value of 8% forecast for 2001 compared to 2000 is expected toworsen markedly by a further 18% in 2002 compared to the previous year. Crew share isforecast to fall by 18% in 2001 and the same amount again in 2002. Gross cash flow willfall by 32% in 2001 and by another 53% in 2002, compared to the previous years.
Compared to losses of 5.4% in 2001, the result is that the TACs for 2002 will bring aboutlosses of more than 16% of earnings for the segment. This is unsustainable for the segmentas the losses go beyond depreciation.
0.00.20.40.60.81.01.21.41.61.8
1998-2000 2001 2002
STABLE UNPROFITABLE UNPROFITABLE
1.3% -5.4% -16.7%
m Value of landings
Crew share
Gross cash flow
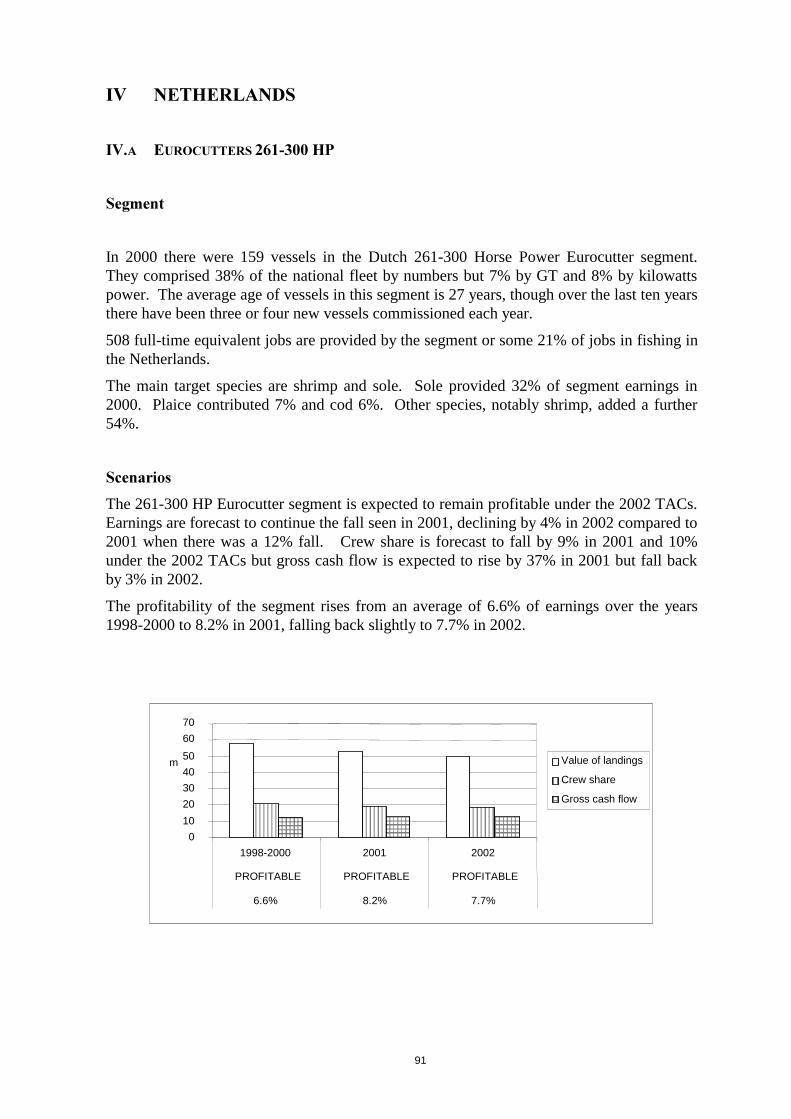
91
,9 1(7+(5/$1'6
,9�$ (852&877(56���������+3
6HJPHQW
In 2000 there were 159 vessels in the Dutch 261-300 Horse Power Eurocutter segment.They comprised 38% of the national fleet by numbers but 7% by GT and 8% by kilowattspower. The average age of vessels in this segment is 27 years, though over the last ten yearsthere have been three or four new vessels commissioned each year.
508 full-time equivalent jobs are provided by the segment or some 21% of jobs in fishing inthe Netherlands.
The main target species are shrimp and sole. Sole provided 32% of segment earnings in2000. Plaice contributed 7% and cod 6%. Other species, notably shrimp, added a further54%.
6FHQDULRV
The 261-300 HP Eurocutter segment is expected to remain profitable under the 2002 TACs.Earnings are forecast to continue the fall seen in 2001, declining by 4% in 2002 compared to2001 when there was a 12% fall. Crew share is forecast to fall by 9% in 2001 and 10%under the 2002 TACs but gross cash flow is expected to rise by 37% in 2001 but fall backby 3% in 2002.
The profitability of the segment rises from an average of 6.6% of earnings over the years1998-2000 to 8.2% in 2001, falling back slightly to 7.7% in 2002.
0
10
20
30
40
50
60
70
1998-2000 2001 2002
PROFITABLE PROFITABLE PROFITABLE
6.6% 8.2% 7.7%
m Value of landings
Crew share
Gross cash flow
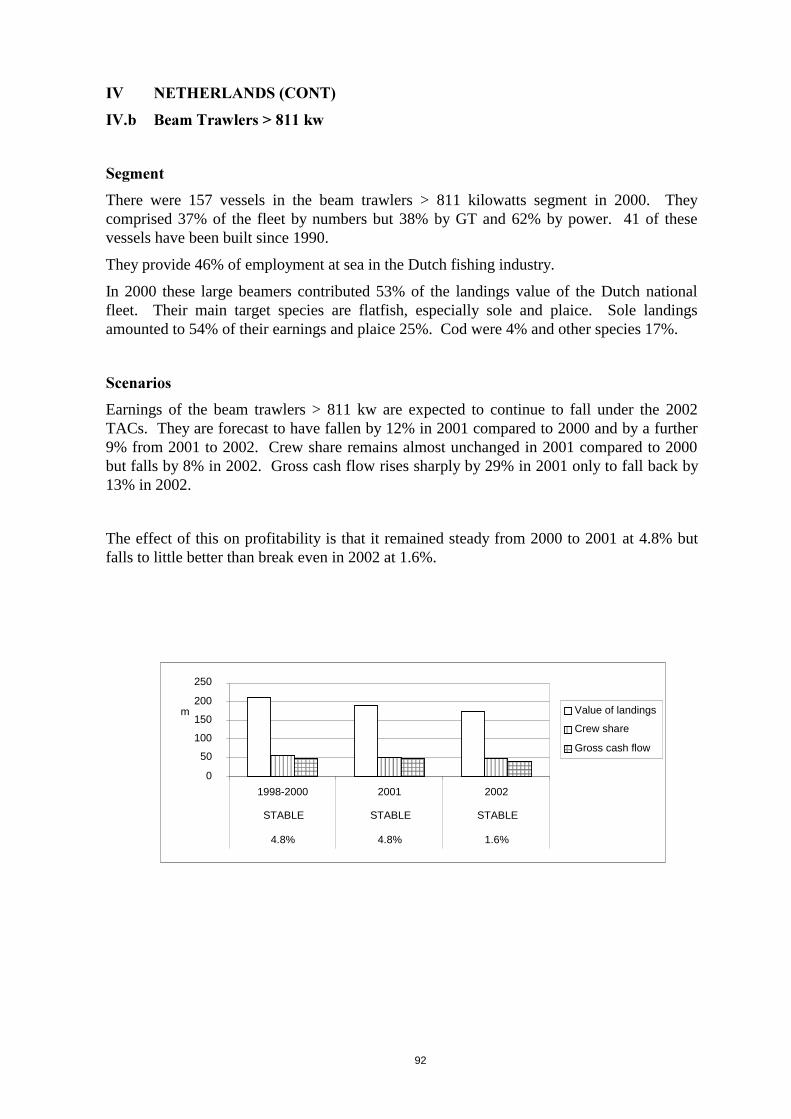
92
,9 1(7+(5/$1'6��&217�
,9�E %HDP�7UDZOHUV�!�����NZ
6HJPHQW
There were 157 vessels in the beam trawlers > 811 kilowatts segment in 2000. Theycomprised 37% of the fleet by numbers but 38% by GT and 62% by power. 41 of thesevessels have been built since 1990.
They provide 46% of employment at sea in the Dutch fishing industry.
In 2000 these large beamers contributed 53% of the landings value of the Dutch nationalfleet. Their main target species are flatfish, especially sole and plaice. Sole landingsamounted to 54% of their earnings and plaice 25%. Cod were 4% and other species 17%.
6FHQDULRV
Earnings of the beam trawlers > 811 kw are expected to continue to fall under the 2002TACs. They are forecast to have fallen by 12% in 2001 compared to 2000 and by a further9% from 2001 to 2002. Crew share remains almost unchanged in 2001 compared to 2000but falls by 8% in 2002. Gross cash flow rises sharply by 29% in 2001 only to fall back by13% in 2002.
The effect of this on profitability is that it remained steady from 2000 to 2001 at 4.8% butfalls to little better than break even in 2002 at 1.6%.
0
50
100
150
200
250
1998-2000 2001 2002
STABLE STABLE STABLE
4.8% 4.8% 1.6%
m Value of landings
Crew share
Gross cash flow
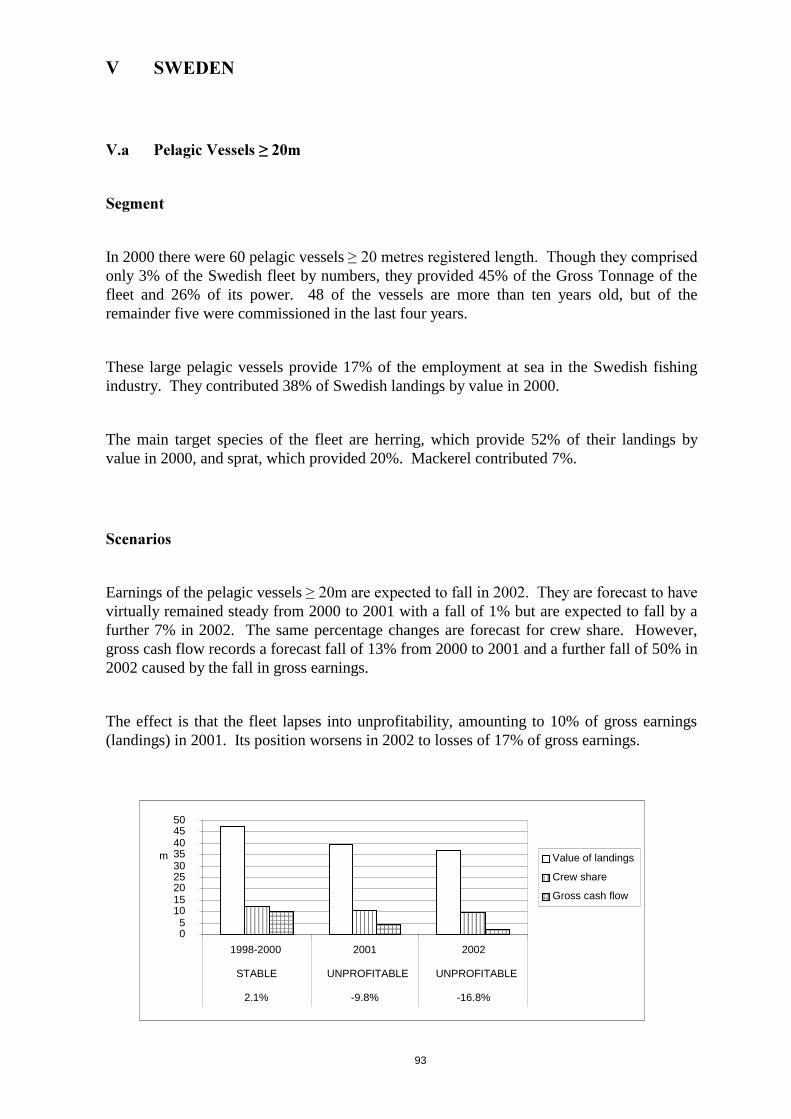
93
9 6:('(1
9�D 3HODJLF�9HVVHOV�����P
6HJPHQW
In 2000 there were 60 pelagic vessels �����PHWUHV�UHJLVWHUHG�OHQJWK���7KRXJK�WKH\�FRPSULVHGonly 3% of the Swedish fleet by numbers, they provided 45% of the Gross Tonnage of thefleet and 26% of its power. 48 of the vessels are more than ten years old, but of theremainder five were commissioned in the last four years.
These large pelagic vessels provide 17% of the employment at sea in the Swedish fishingindustry. They contributed 38% of Swedish landings by value in 2000.
The main target species of the fleet are herring, which provide 52% of their landings byvalue in 2000, and sprat, which provided 20%. Mackerel contributed 7%.
6FHQDULRV
Earnings of the pelagic vessels ����P�DUH�H[SHFWHG�WR�IDOO�LQ��������7KH\�DUH�IRUHFDVW�WR�KDYHvirtually remained steady from 2000 to 2001 with a fall of 1% but are expected to fall by afurther 7% in 2002. The same percentage changes are forecast for crew share. However,gross cash flow records a forecast fall of 13% from 2000 to 2001 and a further fall of 50% in2002 caused by the fall in gross earnings.
The effect is that the fleet lapses into unprofitability, amounting to 10% of gross earnings(landings) in 2001. Its position worsens in 2002 to losses of 17% of gross earnings.
05
101520253035404550
1998-2000 2001 2002
STABLE UNPROFITABLE UNPROFITABLE
2.1% -9.8% -16.8%
m Value of landings
Crew share
Gross cash flow
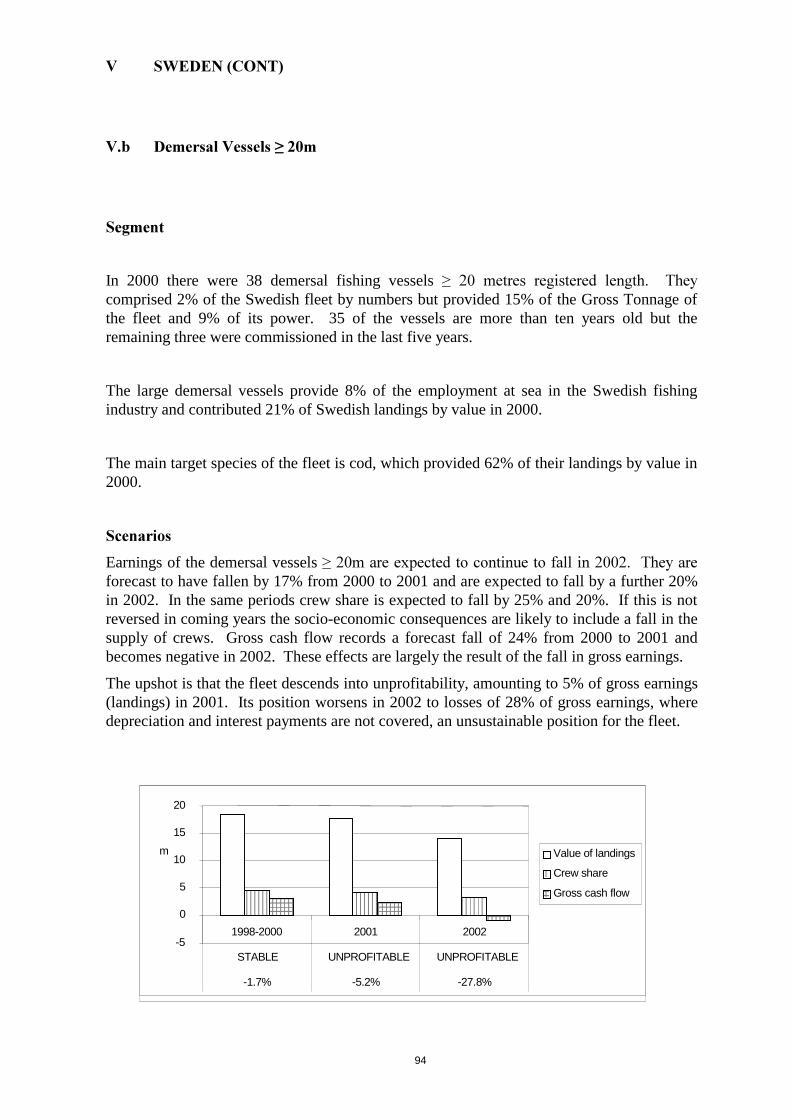
94
9 6:('(1��&217�
9�E 'HPHUVDO�9HVVHOV�����P
6HJPHQW
In 2000 there were 38 demersal fishing vessels �� ��� PHWUHV� UHJLVWHUHG� OHQJWK�� � 7KH\comprised 2% of the Swedish fleet by numbers but provided 15% of the Gross Tonnage ofthe fleet and 9% of its power. 35 of the vessels are more than ten years old but theremaining three were commissioned in the last five years.
The large demersal vessels provide 8% of the employment at sea in the Swedish fishingindustry and contributed 21% of Swedish landings by value in 2000.
The main target species of the fleet is cod, which provided 62% of their landings by value in2000.
6FHQDULRV
Earnings of the demersal vessels ����P�DUH�H[SHFWHG�WR�FRQWLQXH�WR�IDOO�LQ��������7KH\�DUHforecast to have fallen by 17% from 2000 to 2001 and are expected to fall by a further 20%in 2002. In the same periods crew share is expected to fall by 25% and 20%. If this is notreversed in coming years the socio-economic consequences are likely to include a fall in thesupply of crews. Gross cash flow records a forecast fall of 24% from 2000 to 2001 andbecomes negative in 2002. These effects are largely the result of the fall in gross earnings.
The upshot is that the fleet descends into unprofitability, amounting to 5% of gross earnings(landings) in 2001. Its position worsens in 2002 to losses of 28% of gross earnings, wheredepreciation and interest payments are not covered, an unsustainable position for the fleet.
-5
0
5
10
15
20
1998-2000 2001 2002
STABLE UNPROFITABLE UNPROFITABLE
-1.7% -5.2% -27.8%
m Value of landings
Crew share
Gross cash flow
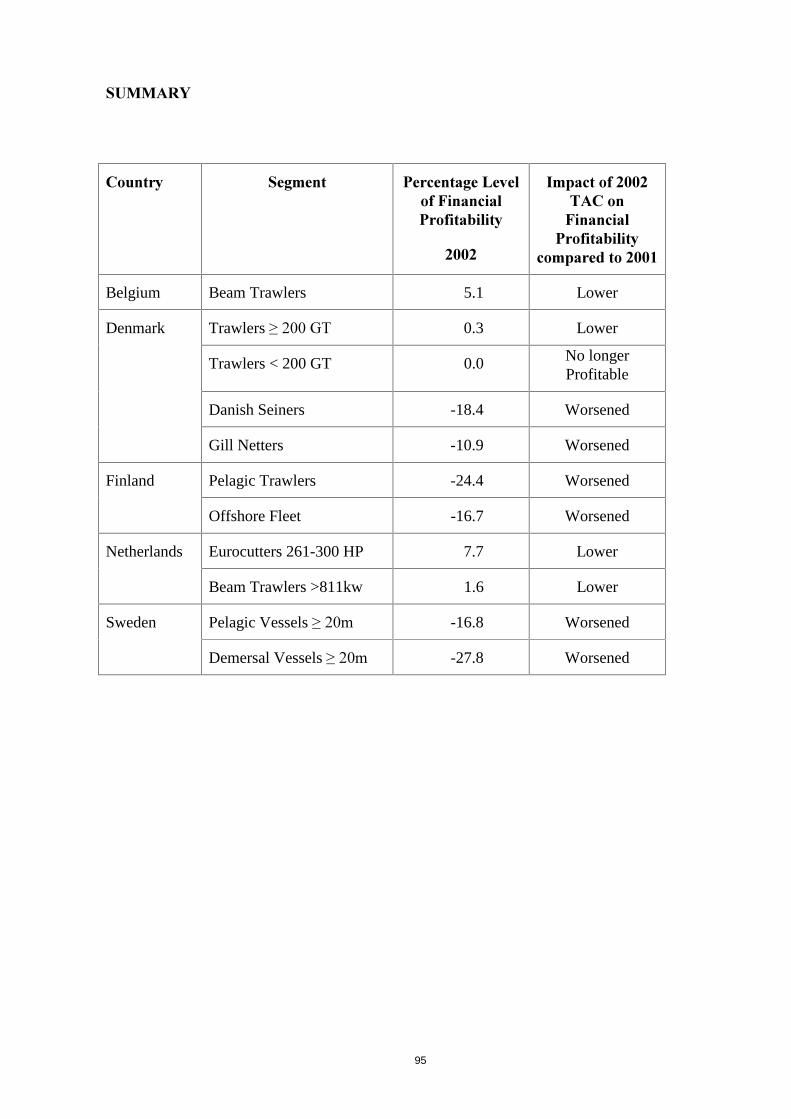
95
6800$5<
&RXQWU\ 6HJPHQW 3HUFHQWDJH�/HYHORI�)LQDQFLDO3URILWDELOLW\
����
,PSDFW�RI�����7$&�RQ)LQDQFLDO
3URILWDELOLW\FRPSDUHG�WR�����
Belgium Beam Trawlers 5.1 Lower
Trawlers ������*7 0.3 Lower
Trawlers < 200 GT 0.0 No longerProfitable
Danish Seiners -18.4 Worsened
Denmark
Gill Netters -10.9 Worsened
Pelagic Trawlers -24.4 WorsenedFinland
Offshore Fleet -16.7 Worsened
Eurocutters 261-300 HP 7.7 LowerNetherlands
Beam Trawlers >811kw 1.6 Lower
Pelagic Vessels ����P -16.8 WorsenedSweden
Demersal Vessels ����P -27.8 Worsened

96
6HFWLRQ��
7KH�(,$$�0RGHO
0HWKRGRORJ\��'HILQLWLRQV�DQG�)HDWXUHV
97
��� 0HWKRGRORJ\
%DFNJURXQG
The background to this report is the need for economic assessment to supplement the ACFMadvice demanded by STECF and other interested agents.
2EMHFWLYH
To produce short-term economic forecasts that take into consideration the quota advicegiven by ACFM for the fleet segments specified in the economic report.
'DWD�UHTXLUHPHQWV
- Technical details of fleet segments
- Landings by species
- Prices by species
- Cost information for fleet segments
- ACFM advice for landings by management stocks
Costs and earnings data should be drawn from the Annual Economic Report on EconomicPerformance of Selected European Fleets, while ACFM advisory data should be extractedfrom pertinent ACFM reports.
6FHQDULR�FDOFXODWLRQV
The EIAA report presents scenarios. They are intended as information to aid in makingpolitical choices. Therefore the scenarios should not be interpreted individually but rather incomparison with one another for each country. Such comparison indicates what change canbe expected if one or another choice is made.
On many major species the ACFM provides options according to the level of fishingmortality. Different options for various stocks can be combined in the catch composition ofthe fleet segments leading to a potentially very large number of scenarios, many of them notleading to converging results.
It cannot be foreseen which TAC will be decided upon by the Council of Ministers and towhich extent quotas will be swapped between Member States. For some stocks ACFM doesnot provide any advice. In other cases the advice is not identical to the TAC managementareas.

98
Only for a relatively few stocks are precautionary Spawning Stock Biomasses and TACsestimated.
'DWD�SUREOHPV
When combining biological assessment and advice with economic assessment and advice, anumber of data problems arise. Based on the problems detected in the work with theeconomic assessment the problems�could be divided into 6 areas:
1. Where quota species are constituting a large part of the landings composition of thefleet segments but the final data are not available
2. Where item one applies, but where data exists and where the management decisionshave been made already
3. Where the quota species constitute only a small share of the total landings of thefleet segment
4. Where no biological assessment is made but where precautionary quotas are fixed
5. Where the biological stock assessment areas are inconsistent with the quotamanagement areas
6. Where no assessment and no quota management is in function
The model can be applied with necessary adjustments to all areas.
$668037,216
In many cases assumptions have had to be made regarding information lacking which isessential for use in the model, e.g. the composition of costs and catches of specific fleetsegments, price flexibility rates of certain species, etc.
&RQVWDQW�ILVKLQJ�SDWWHUQV
The calculations require an assumption regarding the relative shares of the various nationalfleet segments in the national landings of a specific species.
It is assumed that this fishing pattern will not change from the reference year to the year forwhich the evaluation is made. In other words there is no substitution effect between theinputs to fishing.
99
The time that becomes available due to reduced effort on one stock remains unused. It is notutilised in another fishery or another species. For short term forecasting, when the quotachanges remain within reasonable limits, this assumption can be justified. However, over alonger time period and with more substantial changes in the overall composition of fishingopportunities (quota and non-quota species) the fleets may adjust their fishing pattern to thenew conditions.
(IIRUW�DQG�FDWFK�RI�QRQ�WDUJHW�VSHFLHV
When a TAC is changed the effort on the specific species will have to be adjustedaccordingly. At the same time catches of other species may be affected because of thechange in effort and their catch per unit effort (CPUE). These adjustments have beenintroduced as follows:
- Effort: The fishing effort exerted on a particular species in the reference year is assumedto be proportionate to the share of that species in the total value of the landings of thefleet segment. Consequently, when F<1 is selected in a scenario, the total fishingeffort of that fleet segment will be reduced by weighing the new Fs of all specieswith the respective shares in value of landings (see the example on page 27).Consequently, the composition of effort of one fleet segment by target species shiftsaway from the species which is to be protected. At the same time the role of all fleetsegments fishing this species remains proportionately the same.
- Non-target species: Landings of non-target species are not affected by the reduction ofeffort on the target species. The implicit assumption may be that either the CPUEincreases or that the vessels search for other fishing grounds with differentproportions of various species in their total catch.
The effort influences the variable costs in the short and the long run while fixed costs areunchanged. Variable costs are assumed to be non-linear with effort because it is assumedthat the stock abundance influences the CPUE in a non-linear way. This implies that i.e. asmaller quota requires less fishing effort to be caught and therefore lower variable costs.
At the same time a lower stock abundance leads to a lower CPUE, which offsets some of thelower effort needed to catch the lower quota. To include this assumption the model operateswith a catch-stock abundance flexibility rate. The procedure is summarised in the followingitems:
- Fishing mortality is changed only for a few species (quota species)
- Initial effort is normalised relative to the catch composition for the relevant fleetsegment
- Species effort is changed according to change in recommended landings (TACs and Fvalues)
100
- Landings per unit effort are dependent on stock abundance
- Landing flexibility rate is assumed 0.1 for pelagic species and 0.6 for demersal species;if no stock information is available the flexibility rate is 0
- Total effort is changed as a weighted average of the landing composition
- Effort is assumed to change as a weighted average of the stock abundance’s.
/LYH�ZHLJKW�HTXLYDOHQWV
As the ACFM advice is provided in live weight, all catches and landings are assumed to belive weight equivalents. In practice some fish is landed headed or gutted so that also therespective price information regards dead weight price per kg. At this stage the prices areunadjusted. This leads to overestimation of forecasted values. It is considered to correct forthat in future model versions.
4XRWD�XSWDNH
Nominal quota, as set at the beginning of the year, is considered. However, in practicequotas are swapped between countries, some quota remain unutilised and/or some areexceeded. The total effect of these changes is summarised in an uptake correction factor.This factor allows the projected landings of the coming year to be different from theproposed quota.
3ULFHV
Price level is adjusted to changes in the volume of landings. Future price is calculated basedon a price flexibility rate at -0.2. Consequently, value of lower quota is somewhat (20%)offset by higher prices. General price trends could not yet be included and neither could thetotal European or global catches be taken into account. A greater refinement of priceelasticity by species will be pursued in a later stage.
In the model price changes are calculated for each species (e.g. one herring and cod speciesetc.). Landings from third countries are not included.
101
��� 'HILQLWLRQV
*URVV�(DUQLQJV�RI�WKH�YHVVHO�DQG�FDWFKHV��9DOXH�RI�ODQGLQJV�
Gross earnings of a vessel are evidently determined by annual volume of catches per speciesand the prices, which those species fetch. The time, which can be spent at sea, and theproductivity achieved per unit of time (catch per unit of effort) determine the annualvolume.
9DULDEOH�FRVWV
Variable costs vary directly with effort i.e. fuel, provisions, repairs. When effort, exerted ona certain stock, is reduced due to lower F (or TAC), the total variable costs of that fleetsegment are reduced relative to weight of the reduced species in the fleet segment’scomposition of landings (cf. above concerning effort).
)L[HG�FRVWV
Fixed costs (including interest payments and depreciation) are kept constant and areassumed not to vary with effort. This is justified because in the short-run no changes in theinvested capital can be expected.
*URVV�YDOXH�DGGHG
Gross value added = depreciation costs + interest + crew share + net profit, or,
Gross value added = Gross revenues - all expenses (excl. labour remuneration, instalmentsand interest payments on loans).
&UHZ�VKDUH
Crew share is a percentage of the difference between gross revenue and variable costs.
*URVV�FDVK�IORZ
Gross cash flow = gross value added – crew share � �LQFRPH�WR�WKH�YHVVHO�
1HW�UHVXOW
Net result = gross revenues – variable costs – fixed costs – crew share
102
��� 3UHVHQWDWLRQ�DQG�LQWHUSUHWDWLRQ�RI�UHVXOWV
EIAA contains a short, a medium and a long-term assessment of expected changes ineconomic performance. Four main indicators are used for this purpose:
- *URVV�UHYHQXH� Is total landing value and is easy to relate to because it compares to totallanding volume and are often used as an indicator of gross income.
- &UHZ� UHPXQHUDWLRQ� Earnings of the crew members, including a skipper-owner. Animportant indicator for the economic attractiveness of the profession. If the figure isdivided by an opportunity salary, employment measured in full-time fishermen is easilycalculated.
- *URVV�FDVK�IORZ� Can be considered the main indicator for the feasibility of the survivalof fishing companies in the short run (2-3 years). Negative cash flow cannot be born forlong, as the cash expenses exceed cash income. Low cash flow will lead to problems ofrepayment of loans. The policy of the banks becomes of crucial importance in suchsituation.
- 1HW�SURILW� �UHVXOW���Represents the "above normal" economic remuneration of investedcapital. As this is the ‘bottom line’ of the calculations, it is very sensitive to changes inearnings or costs. It must be stressed that the net result calculated in EIAA is aneconomic and not a fiscal indicator. This means that it shows the long-term feasibility ofsurvival of the sector. A low economic net result may be still quite satisfactory in fiscalterms in the medium term (4-5 years). Net result is presented in the diagrams relative tothe gross revenue, and in this way the result represents a substitute for net profit relativeto investments.
This information is presented in diagrams, with the scenarios placed along the horizontalaxis. The value of landings, crew share and gross cash flow are shown as histograms.Below each scenario there is a verbal indication of the economic performance of the fleetsegment and the precise value of the ratio of net profit to gross value of landings. Theclassification is derived from this ratio as follows:
- 3URILWDEOH�Net profit/gross value of landings > 5%.
- 6WDEOH��-5% < net profit/gross value of landings < 5%
- 8QSURILWDEOH��Net profit/gross value of landings < -5%. In this situation fishing cannotcontinue in the long run.
103
��� 6SHFLILFDWLRQ�RI�WKH�ELRORJLFDO�GDWD�UHTXLUHG�IRU�WKH�(,$$�PRGHO
All data specified below must be defined with precise correspondence to the definition ofTACs in terms of species and areas for all North East Atlantic stocks, i.e. including Norway,Iceland, Russia, Faeroe Islands, etc.
The following data is required:
- Estimation of long term TAC under precautionary conditions (yield per recruit at Fpa *number of recruits).
- Time series of SSB, annually up-dated to reflect latest VPA or another indicatorreflecting fish density SSB under long term sustainable conditions.
- Sets of proposed Fs, incl. Fpa, with the corresponding TACs, e.g.:
- TACs at Fpa,
- TACs at 0.8 F, and
- TACs at 1.2 F.
- Indication of the multi-species effect, e.g. probability distribution that all stocks willrecover at the same time, if management is properly implemented.
If information about fishing mortalities and SSB does not exist, which is the case for anumber of management areas, only the TAC fixed for the management area is used in thecalculation.
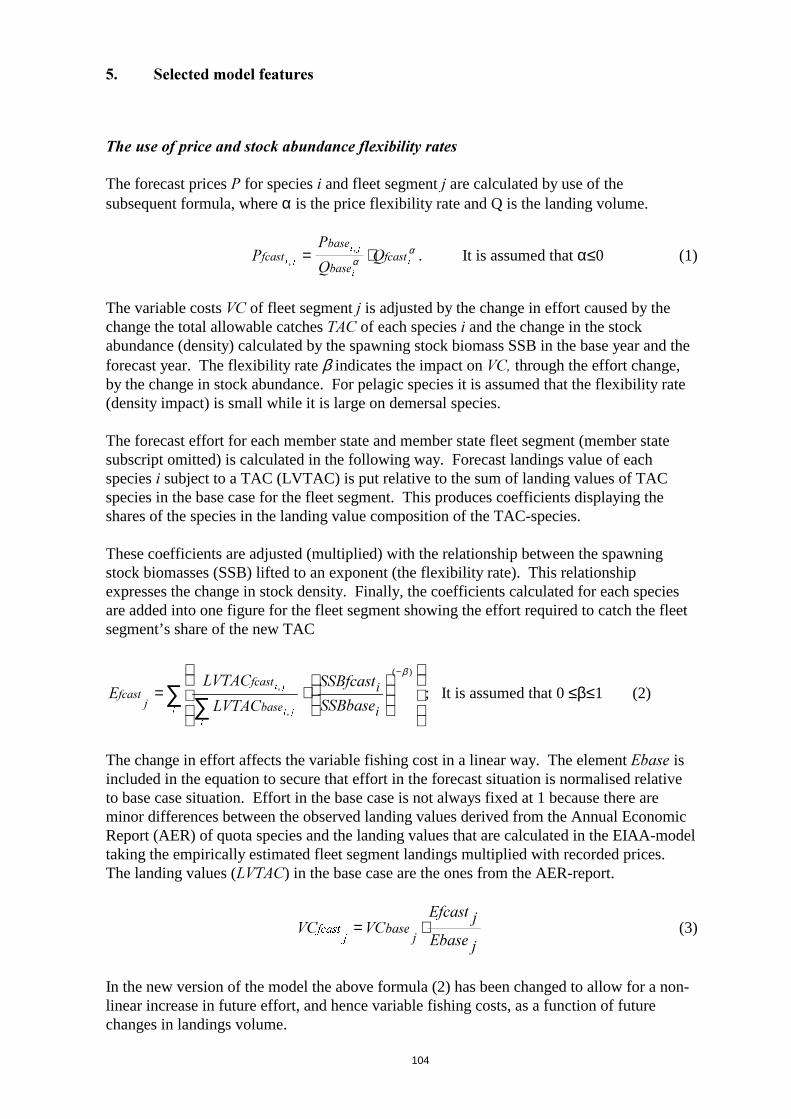
104
��� 6HOHFWHG�PRGHO�IHDWXUHV
7KH�XVH�RI�SULFH�DQG�VWRFN�DEXQGDQFH�IOH[LELOLW\�UDWHV
The forecast prices 3 for species L�and fleet segment M are calculated by use of thesubsequent formula, where α is the price flexibility rate and Q is the landing volume.
33
44
L M
L M
L
LIFDVW
EDVH
EDVHIFDVW,
,= ⋅αα . It is assumed that α≤0 (1)
The variable costs 9& of fleet segment M is adjusted by the change in effort caused by thechange the total allowable catches 7$& of each species L and the change in the stockabundance (density) calculated by the spawning stock biomass SSB in the base year and theforecast year. The flexibility rate β�indicates the impact on 9&� through the effort change,by the change in stock abundance. For pelagic species it is assumed that the flexibility rate(density impact) is small while it is large on demersal species.
The forecast effort for each member state and member state fleet segment (member statesubscript omitted) is calculated in the following way. Forecast landings value of eachspecies L�subject to a TAC (LVTAC) is put relative to the sum of landing values of TACspecies in the base case for the fleet segment. This produces coefficients displaying theshares of the species in the landing value composition of the TAC-species.
These coefficients are adjusted (multiplied) with the relationship between the spawningstock biomasses (SSB) lifted to an exponent (the flexibility rate). This relationshipexpresses the change in stock density. Finally, the coefficients calculated for each speciesare added into one figure for the fleet segment showing the effort required to catch the fleetsegment’s share of the new TAC
∑ ∑
⋅=
−
L
L
ML
ML
L
L
66%EDVH
66%IFDVW
/97$&
/97$&(
EDVH
IFDVW
MIFDVW
)(
,
,
β
; It is assumed that 0 ≤β≤1 (2)
The change in effort affects the variable fishing cost in a linear way. The element (EDVH�isincluded in the equation to secure that effort in the forecast situation is normalised relativeto base case situation. Effort in the base case is not always fixed at 1 because there areminor differences between the observed landing values derived from the Annual EconomicReport (AER) of quota species and the landing values that are calculated in the EIAA-modeltaking the empirically estimated fleet segment landings multiplied with recorded prices.The landing values (/97$&) in the base case are the ones from the AER-report.
M(EDVHMIFDVW(
9&9&M
EDVHM
IFDVW ⋅= (3)
In the new version of the model the above formula (2) has been changed to allow for a non-linear increase in future effort, and hence variable fishing costs, as a function of futurechanges in landings volume.
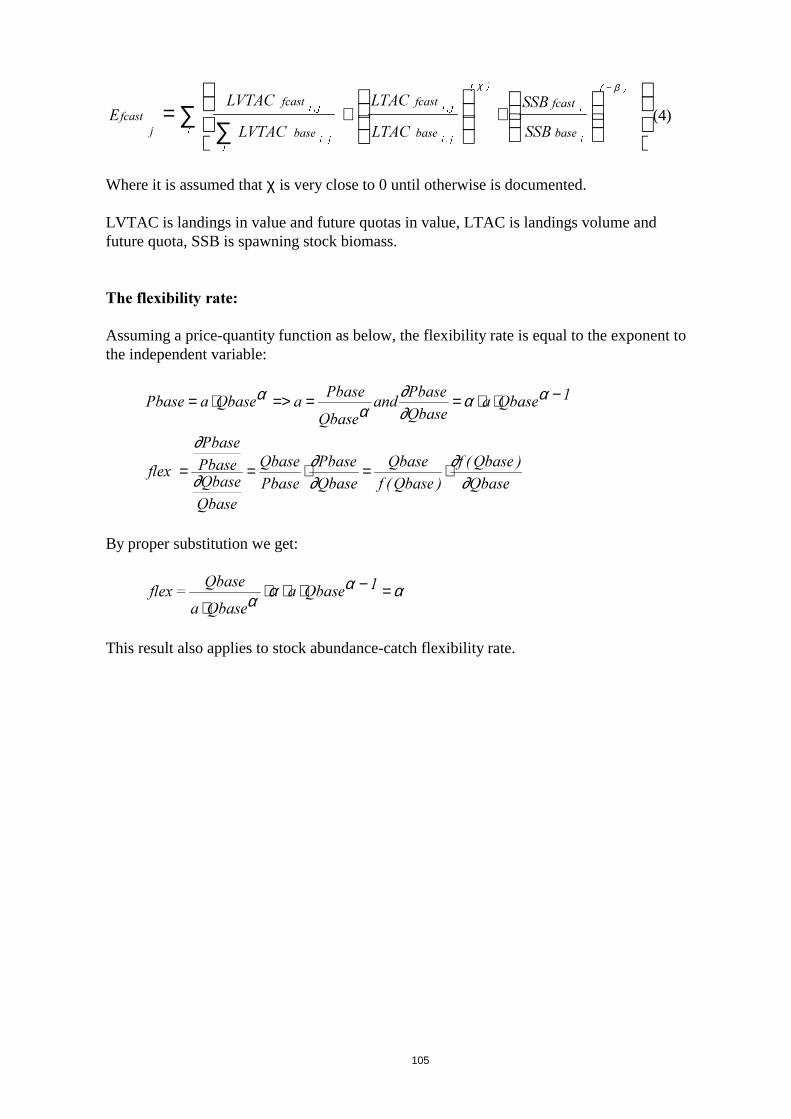
105
∑∑
=
−
⋅⋅L
��
L
L
��
M�L
M�L
LM�L
M�L
EDVH
IFDVW
EDVH
IFDVW
EDVH
IFDVW
MIFDVW
66%
66%
/7$&
/7$&
/97$&
/97$&(
βχ
(4)
Where it is assumed that χ is very close to 0 until otherwise is documented.
LVTAC is landings in value and future quotas in value, LTAC is landings volume andfuture quota, SSB is spawning stock biomass.
7KH�IOH[LELOLW\�UDWH�
Assuming a price-quantity function as below, the flexibility rate is equal to the exponent tothe independent variable:
EDVH4�EDVH4�I
�EDVH4�IEDVH4
EDVH4EDVH3
EDVH3EDVH4
EDVH4EDVH4EDVH3EDVH3
IOH[
�EDVH4DEDVH4EDVH3
DQGEDVH4
EDVH3DEDVH4DEDVH3
∂∂
∂∂
∂
∂
αα∂∂
αα
⋅=⋅==
−⋅⋅===>⋅=
By proper substitution we get:
αααα =−⋅⋅⋅⋅
�EDVH4DEDVH4D
EDVH4 IOH[
This result also applies to stock abundance-catch flexibility rate.
106
��� 6SHFLDO�)HDWXUHV�RI�WKH�(,$$�&DOFXODWLRQV
The purpose of this section is to throw light on two features of the EIAA model and itsapplication. First, the possible application and related process is discussed. Secondly, theway the model works, and in particular how it handles effort and effects of stockabundance’s is described. The EIAA model is set out in detail in Salz and Frost (2000)7.
The work with the EIAA model aims at producing advice that could form the basis for thefinal determination of the TACs. The following procedure has been proposed but it hasbeen difficult to implement in practice:
v The Annual Economic Report, containing data on fleets, costs and earnings of fleets,etc. should be finalised in draft form before November 1st. This is the case now for alarge number of fleet segments.
v ACFM advice on TACs should be available in late October and could then beapplied in the EIAA model together with the information from the AER.
v An EIAA Report could be presented to the STECF together with the developedmodel at the STECF meeting in November.
v Any changes to the ACFM advice made by the STECF could be substituted into themodel for economic assessment for selected fleet segments and afterwards beconveyed to the Commission.
A number of factors have made this procedure difficult to pursue. One is that there is stillsome work to do in the development of the interface between the species list in the EIAAmodel and the TAC list for the EU management areas. Another and more important reasonis that the ACFM information arrives very late and is incomplete with respect to the EUmanagement areas and the data needed.
The EIAA model requires the following data:
v TACs allocated to the EU, and the biomass levels, for all management areas for theshort run calculations.
v Estimation of TACs and biomasses under long-term sustainable conditions for thelong run calculations.
7 Salz, P. and H. Frost (2000): Model for economic interpretation of ACFM advice (EIAA) page 165-181,
in E. Lindebo and N. Vestergaard edt. Proceeding of the XIIth Annual Conference of the EuropeanAssociation of Fisheries Economics (EAFE)
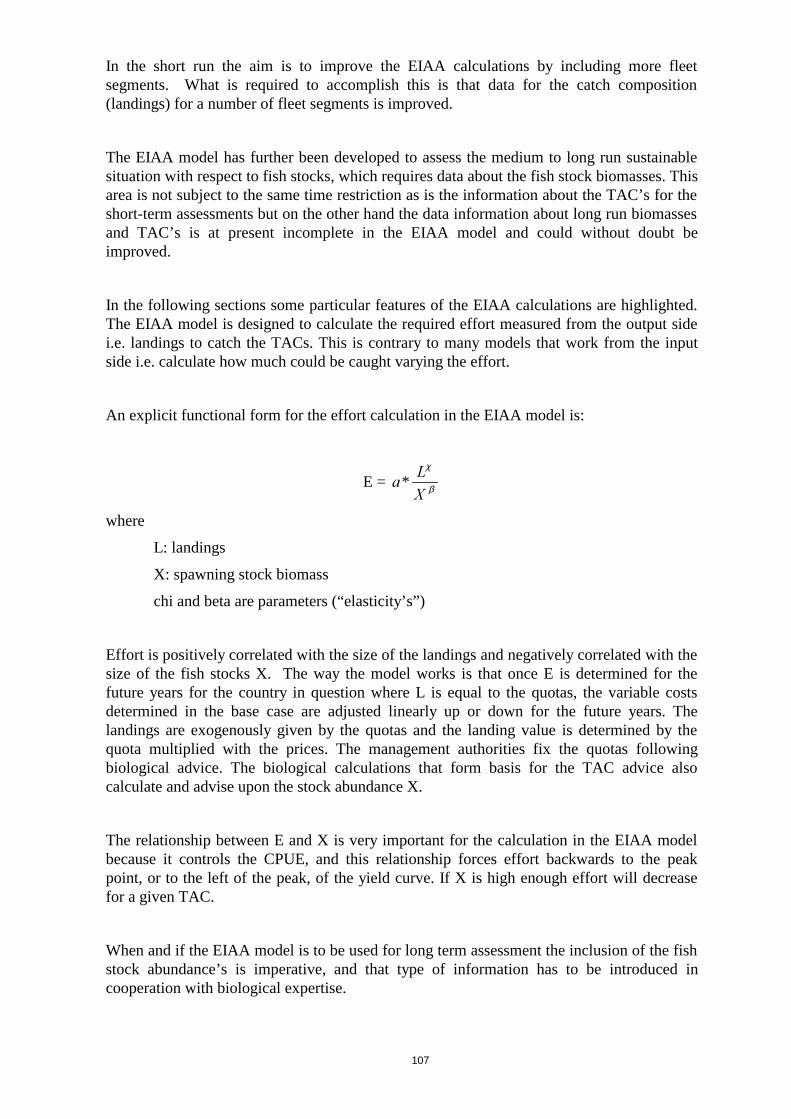
107
In the short run the aim is to improve the EIAA calculations by including more fleetsegments. What is required to accomplish this is that data for the catch composition(landings) for a number of fleet segments is improved.
The EIAA model has further been developed to assess the medium to long run sustainablesituation with respect to fish stocks, which requires data about the fish stock biomasses. Thisarea is not subject to the same time restriction as is the information about the TAC’s for theshort-term assessments but on the other hand the data information about long run biomassesand TAC’s is at present incomplete in the EIAA model and could without doubt beimproved.
In the following sections some particular features of the EIAA calculations are highlighted.The EIAA model is designed to calculate the required effort measured from the output sidei.e. landings to catch the TACs. This is contrary to many models that work from the inputside i.e. calculate how much could be caught varying the effort.
An explicit functional form for the effort calculation in the EIAA model is:
E = β
χ
;/
D*
where
L: landings
X: spawning stock biomass
chi and beta are parameters (“elasticity’s”)
Effort is positively correlated with the size of the landings and negatively correlated with thesize of the fish stocks X. The way the model works is that once E is determined for thefuture years for the country in question where L is equal to the quotas, the variable costsdetermined in the base case are adjusted linearly up or down for the future years. Thelandings are exogenously given by the quotas and the landing value is determined by thequota multiplied with the prices. The management authorities fix the quotas followingbiological advice. The biological calculations that form basis for the TAC advice alsocalculate and advise upon the stock abundance X.
The relationship between E and X is very important for the calculation in the EIAA modelbecause it controls the CPUE, and this relationship forces effort backwards to the peakpoint, or to the left of the peak, of the yield curve. If X is high enough effort will decreasefor a given TAC.
When and if the EIAA model is to be used for long term assessment the inclusion of the fishstock abundance’s is imperative, and that type of information has to be introduced incooperation with biological expertise.
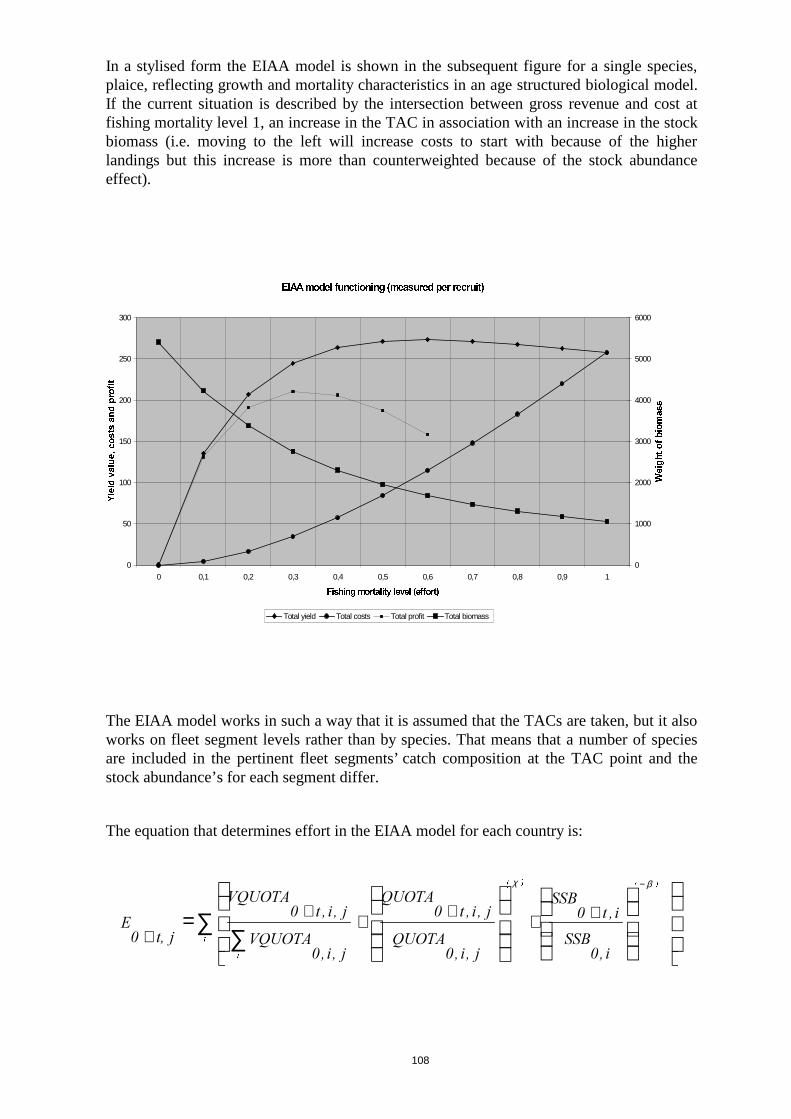
108
In a stylised form the EIAA model is shown in the subsequent figure for a single species,plaice, reflecting growth and mortality characteristics in an age structured biological model.If the current situation is described by the intersection between gross revenue and cost atfishing mortality level 1, an increase in the TAC in association with an increase in the stockbiomass (i.e. moving to the left will increase costs to start with because of the higherlandings but this increase is more than counterweighted because of the stock abundanceeffect).
The EIAA model works in such a way that it is assumed that the TACs are taken, but it alsoworks on fleet segment levels rather than by species. That means that a number of speciesare included in the pertinent fleet segments’ catch composition at the TAC point and thestock abundance’s for each segment differ.
The equation that determines effort in the EIAA model for each country is:
∑∑
=
−
++++
⋅⋅L
����
L L��66%
L�W�66%
M�L��4827$
M�L�W�4827$
M�L��94827$
M�L�W�94827$
MW��(
βχ
(,$$�PRGHO�IXQFWLRQLQJ��PHDVXUHG�SHU�UHFUXLW�
0
50
100
150
200
250
300
0 0,1 0,2 0,3 0,4 0,5 0,6 0,7 0,8 0,9 1
)LVKLQJ�PRUWDOLW\�OHYHO��HIIRUW�
<LHOG�YDOXH��FRVWV�DQG�SURILW
0
1000
2000
3000
4000
5000
6000
:HLJKW�RI�ELRPDVV
Total yield Total costs Total profit Total biomass
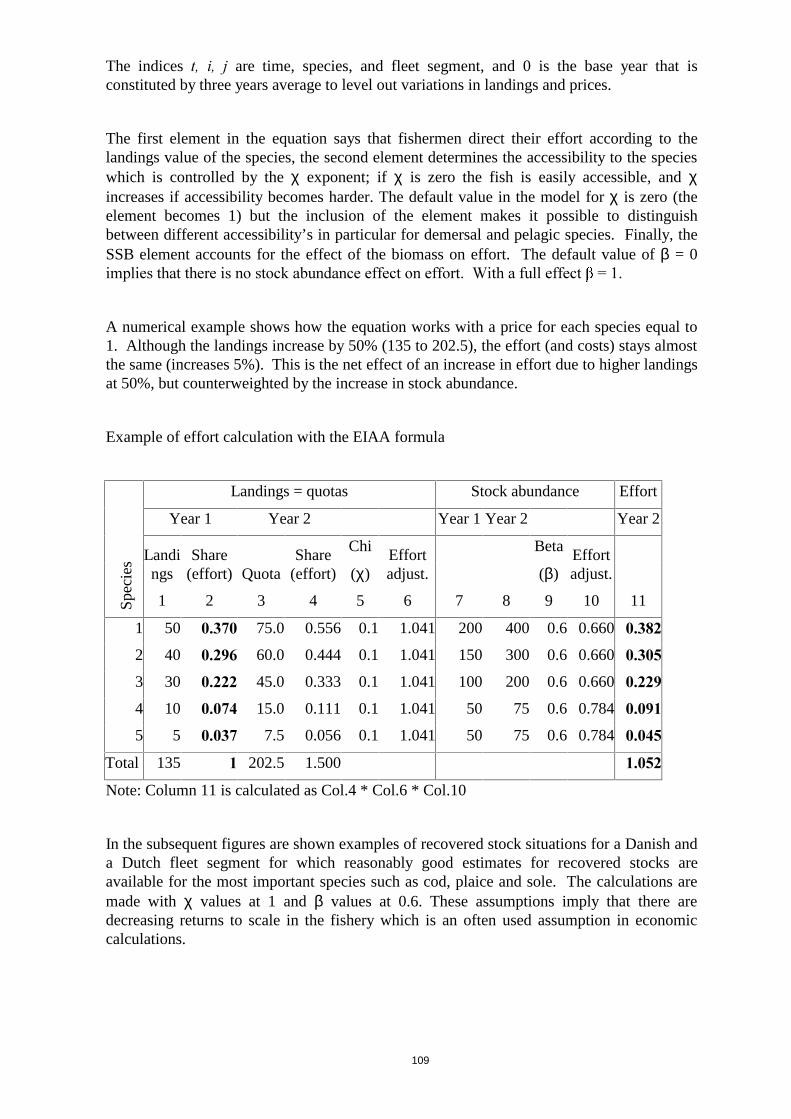
109
The indices W�� L�� M� are time, species, and fleet segment, and 0 is the base year that isconstituted by three years average to level out variations in landings and prices.
The first element in the equation says that fishermen direct their effort according to thelandings value of the species, the second element determines the accessibility to the specieswhich is controlled by the χ exponent; if χ is zero the fish is easily accessible, and χincreases if accessibility becomes harder. The default value in the model for χ is zero (theelement becomes 1) but the inclusion of the element makes it possible to distinguishbetween different accessibility’s in particular for demersal and pelagic species. Finally, theSSB element accounts for the effect of the biomass on effort. The default value of β = 0LPSOLHV�WKDW�WKHUH�LV�QR�VWRFN�DEXQGDQFH�HIIHFW�RQ�HIIRUW���:LWK�D�IXOO�HIIHFW� � ���
A numerical example shows how the equation works with a price for each species equal to1. Although the landings increase by 50% (135 to 202.5), the effort (and costs) stays almostthe same (increases 5%). This is the net effect of an increase in effort due to higher landingsat 50%, but counterweighted by the increase in stock abundance.
Example of effort calculation with the EIAA formula
Landings = quotas Stock abundance Effort
Year 1 Year 2 Year 1 Year 2 Year 2
Spe
cies
Landings
1
Share(effort)
2
Quota
3
Share(effort)
4
Chi
(χ)
5
Effortadjust.
6 7 8
Beta
(β)
9
Effortadjust.
10 11
1 50 ����� 75.0 0.556 0.1 1.041 200 400 0.6 0.660�����
2 40 ����� 60.0 0.444 0.1 1.041 150 300 0.6 0.660�����
3 30 ����� 45.0 0.333 0.1 1.041 100 200 0.6 0.660�����
4 10 ����� 15.0 0.111 0.1 1.041 50 75 0.6 0.784�����
5 5 ����� 7.5 0.056 0.1 1.041 50 75 0.6 0.784�����
Total 135 � 202.5 1.500 �����
Note: Column 11 is calculated as Col.4 * Col.6 * Col.10
In the subsequent figures are shown examples of recovered stock situations for a Danish anda Dutch fleet segment for which reasonably good estimates for recovered stocks areavailable for the most important species such as cod, plaice and sole. The calculations aremade with χ values at 1 and β values at 0.6. These assumptions imply that there aredecreasing returns to scale in the fishery which is an often used assumption in economiccalculations.
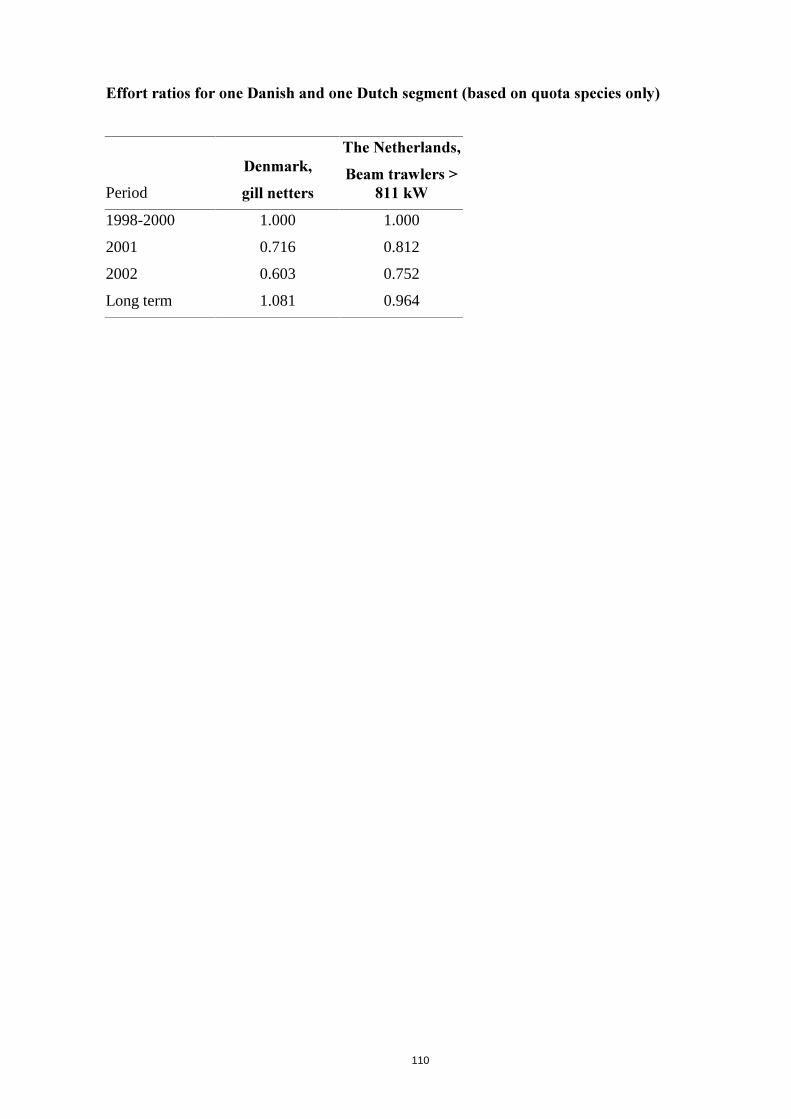
110
(IIRUW�UDWLRV�IRU�RQH�'DQLVK�DQG�RQH�'XWFK�VHJPHQW��EDVHG�RQ�TXRWD�VSHFLHV�RQO\�
Period
'HQPDUN�
JLOO�QHWWHUV
7KH�1HWKHUODQGV�
%HDP�WUDZOHUV�!����N:
1998-2000 1.000 1.000
2001 0.716 0.812
2002 0.603 0.752
Long term 1.081 0.964
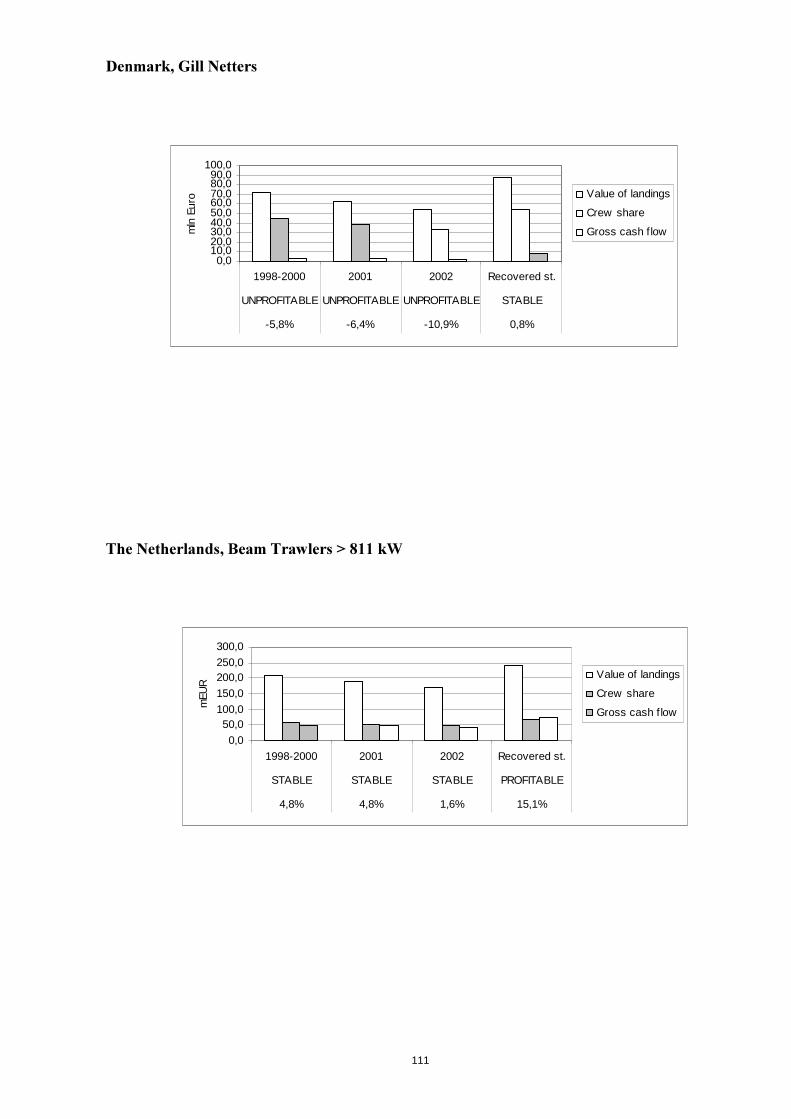
111
'HQPDUN��*LOO�1HWWHUV
7KH�1HWKHUODQGV��%HDP�7UDZOHUV�!�����N:
0,010,020,030,040,050,060,070,080,090,0
100,0
1998-2000 2001 2002 Recovered st.
UNPROFITABLE UNPROFITABLE UNPROFITABLE STABLE
-5,8% -6,4% -10,9% 0,8%
mln
Eur
o Value of landings
Crew share
Gross cash f low
0,0
50,0100,0
150,0
200,0250,0
300,0
1998-2000 2001 2002 Recovered st.
STABLE STABLE STABLE PROFITABLE
4,8% 4,8% 1,6% 15,1%
mEU
R
Value of landings
Crew share
Gross cash f low
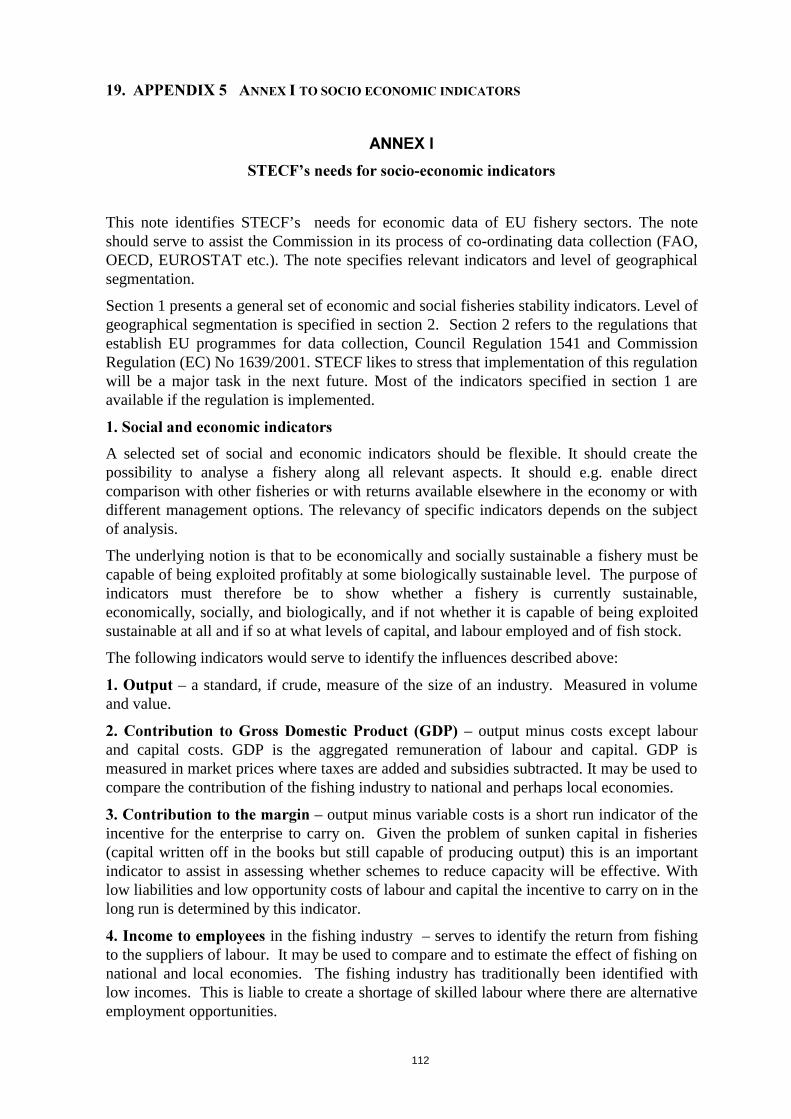
112
�����$33(1',;�����$11(;�,�72�62&,2�(&2120,&�,1',&$7256
$11(;�,
67(&)¶V�QHHGV�IRU�VRFLR�HFRQRPLF�LQGLFDWRUV
This note identifies STECF’s needs for economic data of EU fishery sectors. The noteshould serve to assist the Commission in its process of co-ordinating data collection (FAO,OECD, EUROSTAT etc.). The note specifies relevant indicators and level of geographicalsegmentation.
Section 1 presents a general set of economic and social fisheries stability indicators. Level ofgeographical segmentation is specified in section 2. Section 2 refers to the regulations thatestablish EU programmes for data collection, Council Regulation 1541 and CommissionRegulation (EC) No 1639/2001. STECF likes to stress that implementation of this regulationwill be a major task in the next future. Most of the indicators specified in section 1 areavailable if the regulation is implemented.
���6RFLDO�DQG�HFRQRPLF�LQGLFDWRUV
A selected set of social and economic indicators should be flexible. It should create thepossibility to analyse a fishery along all relevant aspects. It should e.g. enable directcomparison with other fisheries or with returns available elsewhere in the economy or withdifferent management options. The relevancy of specific indicators depends on the subjectof analysis.
The underlying notion is that to be economically and socially sustainable a fishery must becapable of being exploited profitably at some biologically sustainable level. The purpose ofindicators must therefore be to show whether a fishery is currently sustainable,economically, socially, and biologically, and if not whether it is capable of being exploitedsustainable at all and if so at what levels of capital, and labour employed and of fish stock.
The following indicators would serve to identify the influences described above:
���2XWSXW�– a standard, if crude, measure of the size of an industry. Measured in volumeand value.
���&RQWULEXWLRQ� WR�*URVV�'RPHVWLF�3URGXFW� �*'3� – output minus costs except labourand capital costs. GDP is the aggregated remuneration of labour and capital. GDP ismeasured in market prices where taxes are added and subsidies subtracted. It may be used tocompare the contribution of the fishing industry to national and perhaps local economies.
���&RQWULEXWLRQ�WR�WKH�PDUJLQ�– output minus variable costs is a short run indicator of theincentive for the enterprise to carry on. Given the problem of sunken capital in fisheries(capital written off in the books but still capable of producing output) this is an importantindicator to assist in assessing whether schemes to reduce capacity will be effective. Withlow liabilities and low opportunity costs of labour and capital the incentive to carry on in thelong run is determined by this indicator.
���,QFRPH�WR�HPSOR\HHV in the fishing industry – serves to identify the return from fishingto the suppliers of labour. It may be used to compare and to estimate the effect of fishing onnational and local economies. The fishing industry has traditionally been identified withlow incomes. This is liable to create a shortage of skilled labour where there are alternativeemployment opportunities.
113
���(PSOR\PHQW – a measure of the influence on the national and local economies and ameans of comparing whether the fishing industry is giving an adequate return to labour.
���&DSLWDO�(PSOR\HG�(a�measure of�the�value of Vessel, Licence, Quota) – would provideinformation of the relative position of the industry. Values above a discounted sum of thereturns they could provide would be an indication of an unsustainable industry.
���&DSLWDO�,QYHVWPHQWV�– is the change in capital employed over time - normally a year. Itindicates the future expectations of the enterprises. Often difficult to measure empirically inother ways than using the capital employed at two different points in time and subtractingthem from one another.
��� 1HW� SURILW (profitability) – would provide a direct comparison with returns availableelsewhere in the economy.
���5HWXUQ� RQ�&DSLWDO (net profit plus interest payments relative to capital employed) –provides a simple and direct comparison of the opportunity cost of capital.
����)LVK� VWRFN� VL]H measured in value – gives an indication of the use of the productionfactor that is not subject to price determination on a market. Will indicate as to whether theoutput of fish is a result of surplus harvesting or a result of production factor reduction.
���� 6XEVLGLHV� DQG� WD[HV – provide information about the dependency of the industry onpublic support and about the GDP in factor prices.
In principle, an important indicator is associated with: 5HQW�DFKLHYHG�RU�IRUHJRQH��This is avery difficult indicator to calculate given that the long-run supply curve in open accessfisheries or fisheries with overexploited stocks are backward bending. However, it wouldserve to show what the fishing industry could contribute to the economy and show what isbeing wasted through inefficient fisheries management (including poor stock conservation).Alternatively, some 0HDVXUH�RI�(IILFLHQF\ would serve to show whether there was excesscapacity in the fishing industry and therefore measure whether capital was being employedefficiently. A degree of inefficiency would offer a struggling industry the opportunity torationalise and survive. An efficient industry finding itself in economic difficulties might bein an untenable position. Therefore�capacity utilisation could be such a measure.
����&DSDFLW\�XWLOLVDWLRQ� � � calculation would require distinction between long run and shortrun, and knowledge about the state of the fish stocks as to whether they are overexploited ornot. In the short run the measure disregards fish stock effects. Required information is WKHQXPEHU�RI�YHVVHOV categorised in homogeneous groups according to e.g. length, GT, kW, orfishing gear. Further, information is required about WKH� QXPEHU� RI� VHD� GD\V for eachcategory in total or for each vessel. Relating the actual number of sea days, totally or foreach vessel on average, to the technically fixed maximum number of sea days indicates thecapacity utilisation subject to a given fish stock size.
����&DWFK�SHU�VHD�GD\�±�as time series based on homogeneous fleets the indicator providesinformation about the status of the stocks relative to the capacity.
The indicators described above are all related to the economic dimension. The social and theenvironmental dimensions are only covered in so far as they touch upon the economicdimension. The economic dimension, however, could be separated into three levels: Thesocio-economic level, the sector-specific level, and the fleet-specific level.
In the table below all indicators are listed and it is shown to which level the indicator mainlyrefers. Most of the indicators contain information that is relevant for more than only onelevel.
114
5HOHYDQFH�RI�LQGLFDWRUV�IRU�HFRQRPLF�OHYHOV
,QGLFDWRU 6RFLR�HFRQRPLF 6HFWRU�VSHFLILF )OHHW�VSHFLILF
���2XWSXW - X (X)
���*URVV�'RPHVWLF�3URGXFW X (X) -
���&RQWULEXWLRQ�WR�WKH�PDUJLQ - (X) X
���,QFRPH�WR�HPSOR\HHV X (X) -
���(PSOR\PHQW X (X) -
���&DSLWDO�(PSOR\HG - X (X)
���&DSLWDO�,QYHVWPHQWV X (X) -
���1HW�SURILW - (X) X
���5HWXUQ�RQ�&DSLWDO (X) X (X)
����)LVK�VWRFN�VL]H X (X) -
����6XEVLGLHV�DQG�WD[HV X (X) -
����&DSDFLW\�XWLOL]DWLRQ - X (X)
����&DWFK�SHU�VHD�GD\ - (X) X
1RWH��;�YHU\�UHOHYDQW���;��UHOHYDQW����OHVV�UHOHYDQW�
���'DWD�FROOHFWLRQ
STECF ‘s needs for economic data is covered by Council Regulation 1543/2000 and CommissionRegulation (EC) No 1639/2001 of 25 July 2001 establishing the minimum and extendedCommunity programmes for the collection of data in the fisheries sector and laying downdetailed rules for the application of Council Regulation (EC) No 1543/2000 (OJ L 222,17.08.2001)
The regulation includes a.o. a minimum (MP) and an extended programme (EP) for datacollecting (economic data see pp 13).
STECF suggests that:
− The Commission should consider the indicators mentioned in the minimumprogramme as presented in Appendix XVII (pp 61) of the Regulation.
− the indicators should be collected for national fleet segments as presented in AppendixIII (pp 18) of the Regulation. Further regional segmentation is optional and might beconsidered on national level.
− the indicators should be collected annually (minimum programme).
The data set that will be made available by the regulation enables extension with variousderived indicators. Such derived indicators take generally the form of ratios of economicresult per unit of input. E.g Gross earnings per vessel or per unit of effort, crew share perman, interest rate over capital employed, etc.
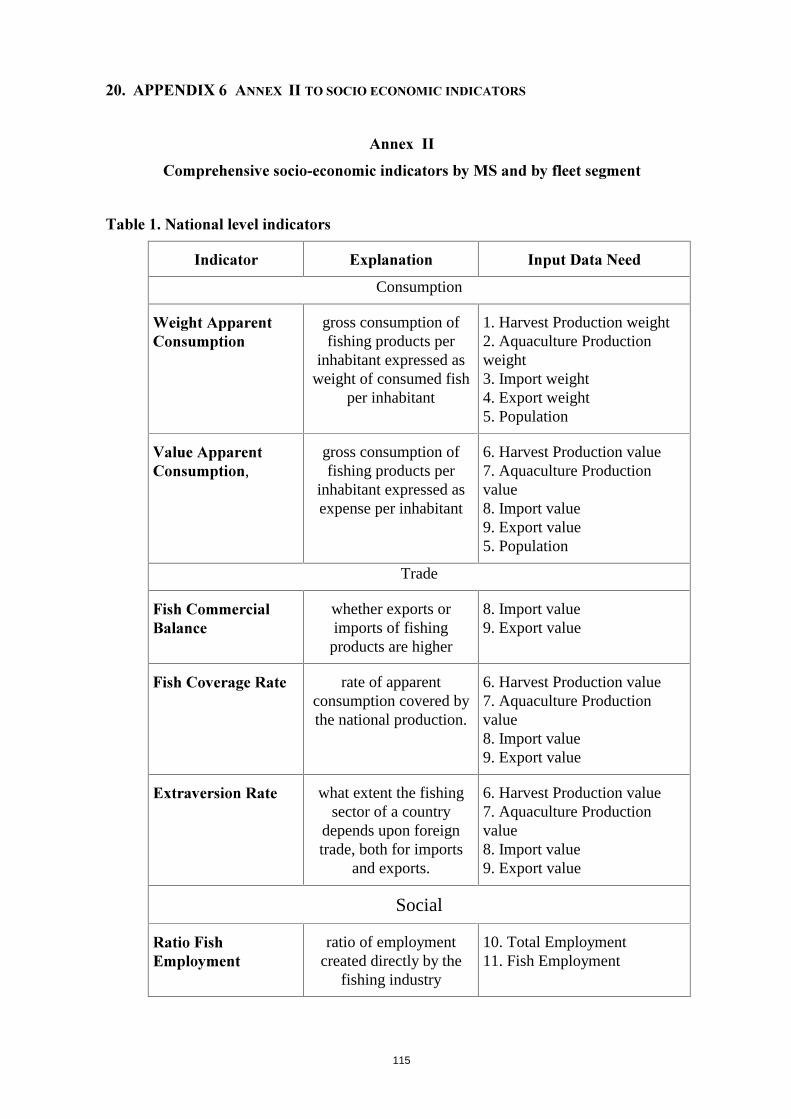
115
�����$33(1',;����$11(;��,,�72�62&,2�(&2120,&�,1',&$7256
$QQH[��,,
&RPSUHKHQVLYH�VRFLR�HFRQRPLF�LQGLFDWRUV�E\�06�DQG�E\�IOHHW�VHJPHQW
7DEOH����1DWLRQDO�OHYHO�LQGLFDWRUV
,QGLFDWRU ([SODQDWLRQ ,QSXW�'DWD�1HHG
Consumption
:HLJKW�$SSDUHQW&RQVXPSWLRQ
gross consumption offishing products per
inhabitant expressed asweight of consumed fish
per inhabitant
1. Harvest Production weight2. Aquaculture Productionweight3. Import weight4. Export weight5. Population
9DOXH�$SSDUHQW&RQVXPSWLRQ,
gross consumption offishing products per
inhabitant expressed asexpense per inhabitant
6. Harvest Production value7. Aquaculture Productionvalue8. Import value9. Export value5. Population
Trade
)LVK�&RPPHUFLDO%DODQFH
whether exports orimports of fishing
products are higher
8. Import value9. Export value
)LVK�&RYHUDJH�5DWH rate of apparentconsumption covered bythe national production.
6. Harvest Production value7. Aquaculture Productionvalue8. Import value9. Export value
([WUDYHUVLRQ�5DWH what extent the fishingsector of a country
depends upon foreigntrade, both for imports
and exports.
6. Harvest Production value7. Aquaculture Productionvalue8. Import value9. Export value
Social
5DWLR�)LVK(PSOR\PHQW
ratio of employmentcreated directly by the
fishing industry
10. Total Employment11. Fish Employment
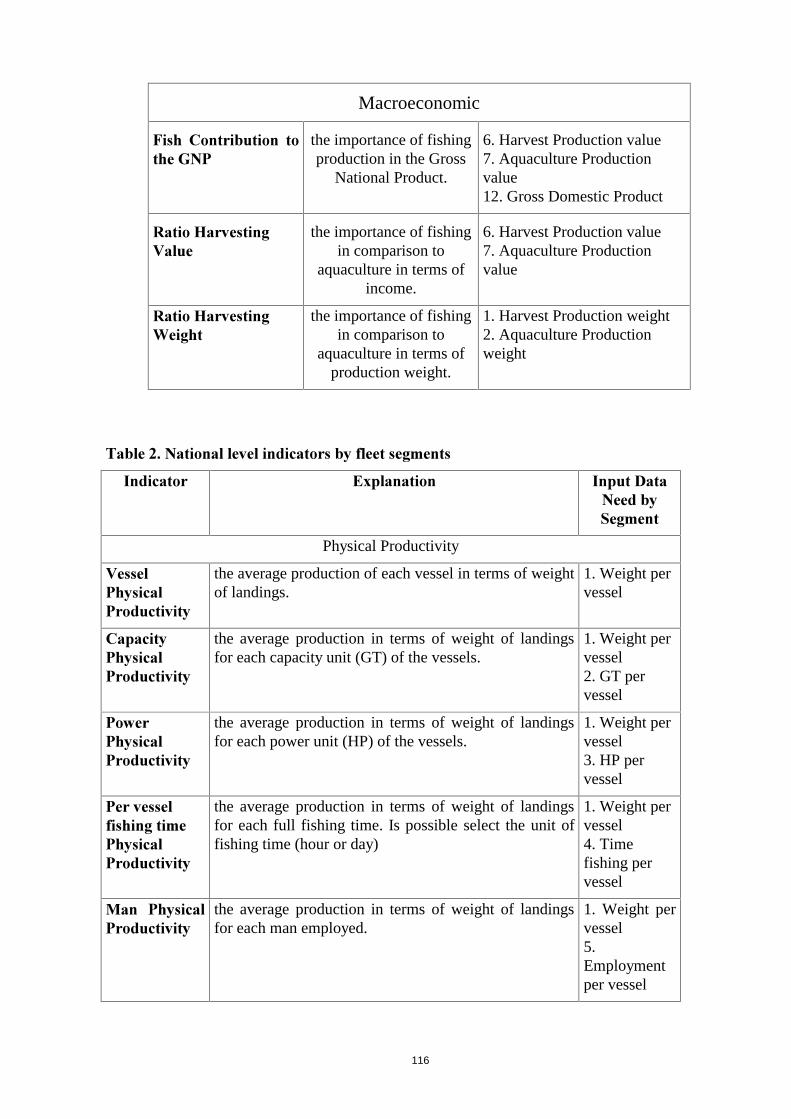
116
Macroeconomic
)LVK� &RQWULEXWLRQ� WRWKH�*13
the importance of fishingproduction in the Gross
National Product.
6. Harvest Production value7. Aquaculture Productionvalue12. Gross Domestic Product
5DWLR�+DUYHVWLQJ9DOXH
the importance of fishingin comparison to
aquaculture in terms ofincome.
6. Harvest Production value7. Aquaculture Productionvalue
5DWLR�+DUYHVWLQJ:HLJKW
the importance of fishingin comparison to
aquaculture in terms ofproduction weight.
1. Harvest Production weight2. Aquaculture Productionweight
7DEOH����1DWLRQDO�OHYHO�LQGLFDWRUV�E\�IOHHW�VHJPHQWV
,QGLFDWRU ([SODQDWLRQ ,QSXW�'DWD1HHG�E\6HJPHQW
Physical Productivity
9HVVHO3K\VLFDO3URGXFWLYLW\
the average production of each vessel in terms of weightof landings.
1. Weight pervessel
&DSDFLW\3K\VLFDO3URGXFWLYLW\
the average production in terms of weight of landingsfor each capacity unit (GT) of the vessels.
1. Weight pervessel2. GT pervessel
3RZHU3K\VLFDO3URGXFWLYLW\
the average production in terms of weight of landingsfor each power unit (HP) of the vessels.
1. Weight pervessel3. HP pervessel
3HU�YHVVHOILVKLQJ�WLPH3K\VLFDO3URGXFWLYLW\
the average production in terms of weight of landingsfor each full fishing time. Is possible select the unit offishing time (hour or day)
1. Weight pervessel4. Timefishing pervessel
0DQ� 3K\VLFDO3URGXFWLYLW\
the average production in terms of weight of landingsfor each man employed.
1. Weight pervessel5.Employmentper vessel
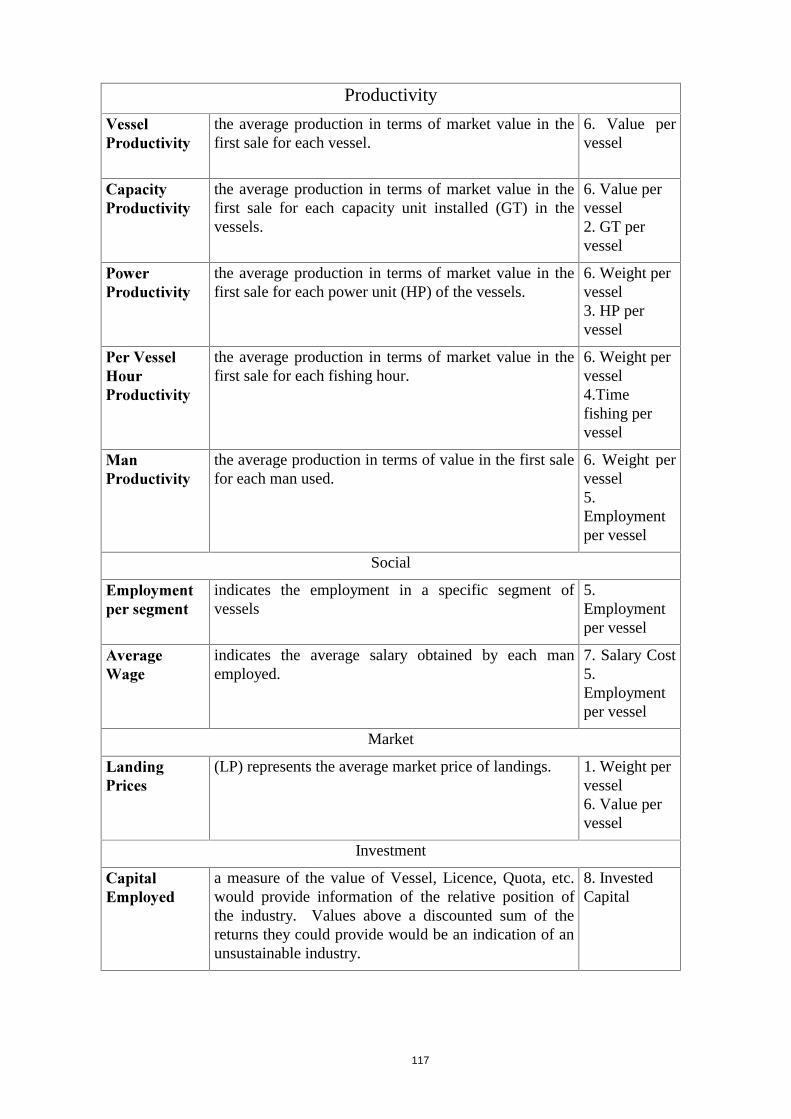
117
Productivity
9HVVHO3URGXFWLYLW\
the average production in terms of market value in thefirst sale for each vessel.
6. Value pervessel
&DSDFLW\3URGXFWLYLW\
the average production in terms of market value in thefirst sale for each capacity unit installed (GT) in thevessels.
6. Value pervessel2. GT pervessel
3RZHU3URGXFWLYLW\
the average production in terms of market value in thefirst sale for each power unit (HP) of the vessels.
6. Weight pervessel3. HP pervessel
3HU�9HVVHO+RXU3URGXFWLYLW\
the average production in terms of market value in thefirst sale for each fishing hour.
6. Weight pervessel4.Timefishing pervessel
0DQ3URGXFWLYLW\
the average production in terms of value in the first salefor each man used.
6. Weight pervessel5.Employmentper vessel
Social
(PSOR\PHQWSHU�VHJPHQW
indicates the employment in a specific segment ofvessels
5.Employmentper vessel
$YHUDJH:DJH
indicates the average salary obtained by each manemployed.
7. Salary Cost5.Employmentper vessel
Market
/DQGLQJ3ULFHV
(LP) represents the average market price of landings. 1. Weight pervessel6. Value pervessel
Investment
&DSLWDO(PSOR\HG
a�measure of� the�value of Vessel, Licence, Quota, etc.would provide information of the relative position ofthe industry. Values above a discounted sum of thereturns they could provide would be an indication of anunsustainable industry.
8. InvestedCapital
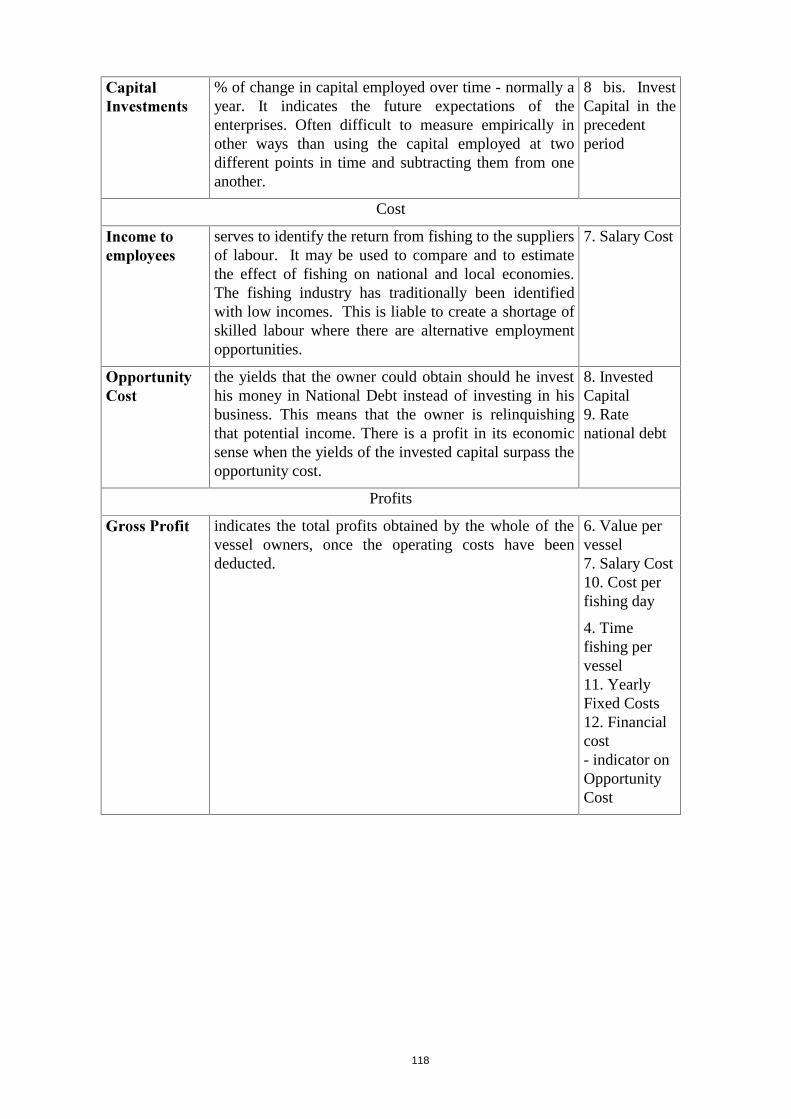
118
&DSLWDO,QYHVWPHQWV
% of change in capital employed over time - normally ayear. It indicates the future expectations of theenterprises. Often difficult to measure empirically inother ways than using the capital employed at twodifferent points in time and subtracting them from oneanother.
8 bis. InvestCapital in theprecedentperiod
Cost
,QFRPH�WRHPSOR\HHV
serves to identify the return from fishing to the suppliersof labour. It may be used to compare and to estimatethe effect of fishing on national and local economies.The fishing industry has traditionally been identifiedwith low incomes. This is liable to create a shortage ofskilled labour where there are alternative employmentopportunities.
7. Salary Cost
2SSRUWXQLW\&RVW
the yields that the owner could obtain should he investhis money in National Debt instead of investing in hisbusiness. This means that the owner is relinquishingthat potential income. There is a profit in its economicsense when the yields of the invested capital surpass theopportunity cost.
8. InvestedCapital9. Ratenational debt
Profits
*URVV�3URILW indicates the total profits obtained by the whole of thevessel owners, once the operating costs have beendeducted.
6. Value pervessel7. Salary Cost10. Cost perfishing day
4. Timefishing pervessel11. YearlyFixed Costs12. Financialcost- indicator onOpportunityCost
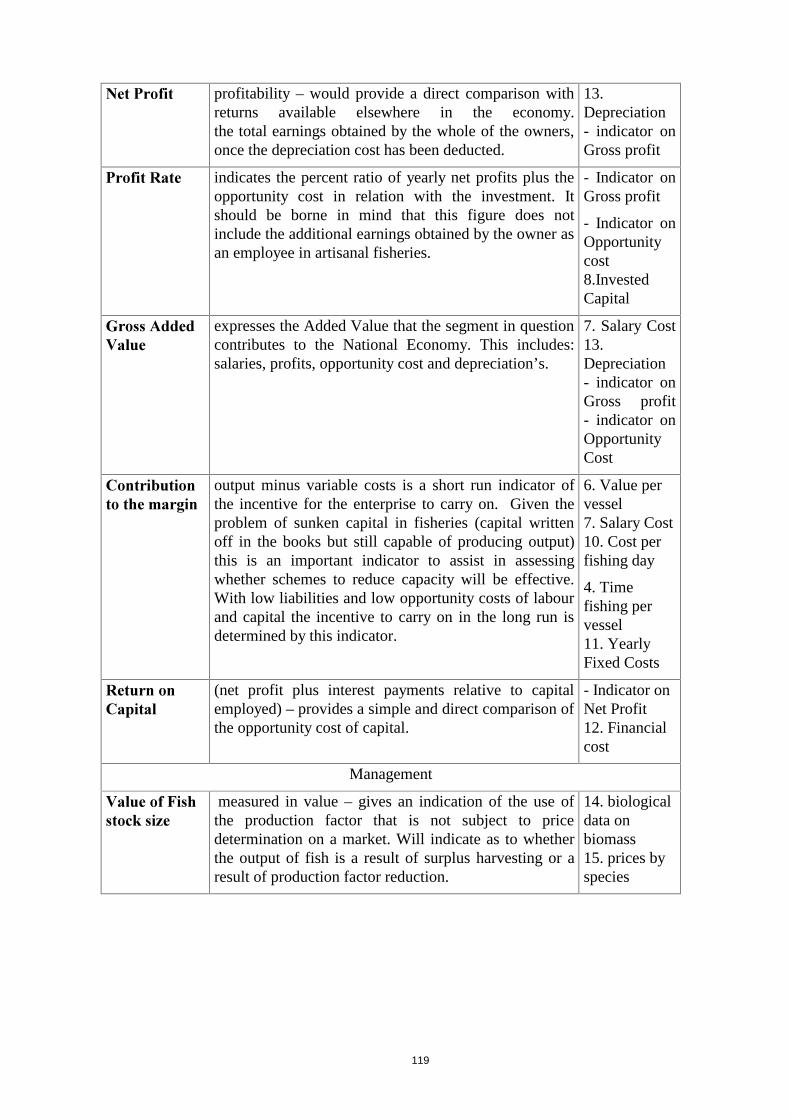
119
1HW�3URILW profitability – would provide a direct comparison withreturns available elsewhere in the economy.the total earnings obtained by the whole of the owners,once the depreciation cost has been deducted.
13.Depreciation- indicator onGross profit
3URILW�5DWH indicates the percent ratio of yearly net profits plus theopportunity cost in relation with the investment. Itshould be borne in mind that this figure does notinclude the additional earnings obtained by the owner asan employee in artisanal fisheries.
- Indicator onGross profit
- Indicator onOpportunitycost8.InvestedCapital
*URVV�$GGHG9DOXH
expresses the Added Value that the segment in questioncontributes to the National Economy. This includes:salaries, profits, opportunity cost and depreciation’s.
7. Salary Cost13.Depreciation- indicator onGross profit- indicator onOpportunityCost
&RQWULEXWLRQWR�WKH�PDUJLQ
output minus variable costs is a short run indicator ofthe incentive for the enterprise to carry on. Given theproblem of sunken capital in fisheries (capital writtenoff in the books but still capable of producing output)this is an important indicator to assist in assessingwhether schemes to reduce capacity will be effective.With low liabilities and low opportunity costs of labourand capital the incentive to carry on in the long run isdetermined by this indicator.
6. Value pervessel7. Salary Cost10. Cost perfishing day
4. Timefishing pervessel11. YearlyFixed Costs
5HWXUQ�RQ&DSLWDO
(net profit plus interest payments relative to capitalemployed) – provides a simple and direct comparison ofthe opportunity cost of capital.
- Indicator onNet Profit12. Financialcost
Management
9DOXH�RI�)LVKVWRFN�VL]H
measured in value – gives an indication of the use ofthe production factor that is not subject to pricedetermination on a market. Will indicate as to whetherthe output of fish is a result of surplus harvesting or aresult of production factor reduction.
14. biologicaldata onbiomass15. prices byspecies
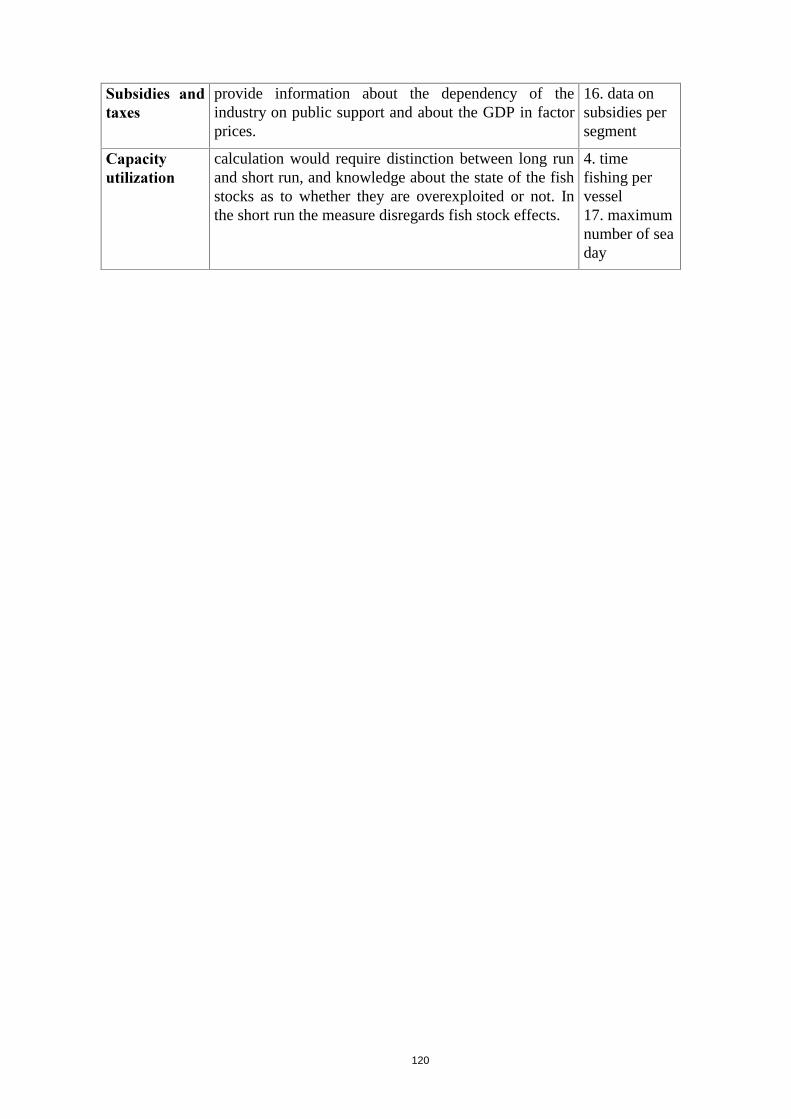
120
6XEVLGLHV� DQGWD[HV
provide information about the dependency of theindustry on public support and about the GDP in factorprices.
16. data onsubsidies persegment
&DSDFLW\XWLOL]DWLRQ
calculation would require distinction between long runand short run, and knowledge about the state of the fishstocks as to whether they are overexploited or not. Inthe short run the measure disregards fish stock effects.
4. timefishing pervessel17. maximumnumber of seaday