Embed Size (px)
Citation preview

1
The Funding of TVET and CET
Colleges and changes in recent years
Commission of Inquiry into Higher
Education and Training
24 October 2016

2
Targets, Expenditure and Government
Contributions – PSET Sector
White Paper on Post School Education and Training (PSET)
3
DNA Economics (2016). Volume 5: Financing options for the implementation of the White Paper on Post School Education and Training. National Treasury
Sector Actual Target (2030)
% change
TVET 702 000* 2 500 000 256%
Community colleges
265 000^ 1 000 000 277%
University 937 000* 1 600 000 71%
Source: (DHET, White Paper for Post-School Education and Training, 2013) Baseline
years differ: ^2011 and *2014
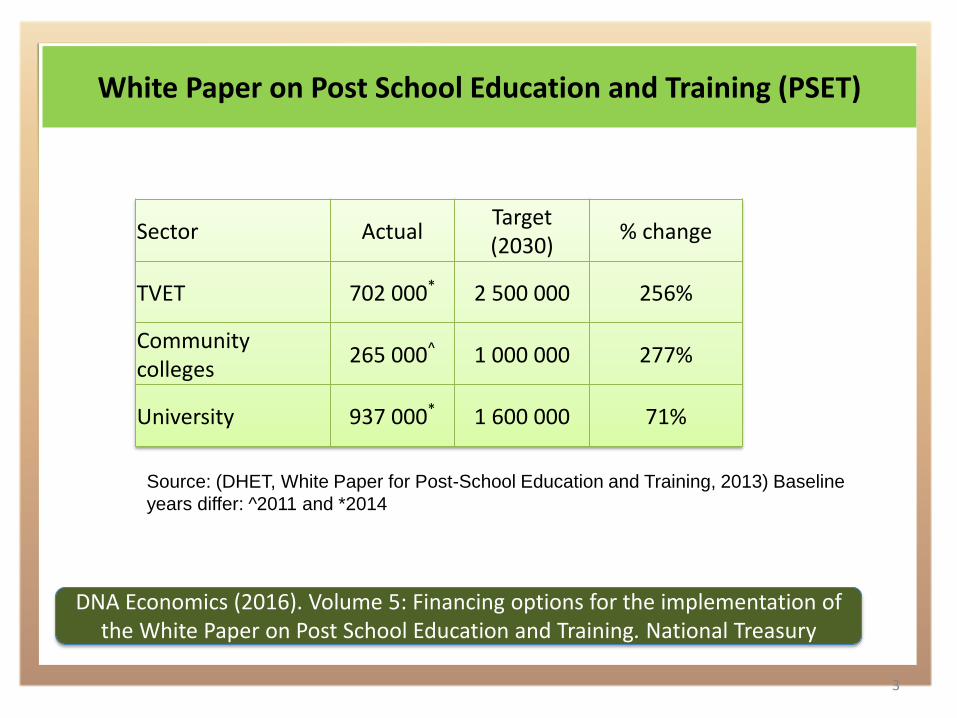
Expenditure on the PSET Sector (2014/15)
4
DNA Economics (2016). Volume 5: Financing options for the implementation of the White Paper on Post School Education and Training. National Treasury
Source: DNA Economics calculationsbased on data provided by the DHET It should be noted
that some SETA funds are eventually spent within the other sectors (TVET, Universities and
Community Colleges), the exact amount of which is not available. As a result the above table
does include some degree of double counting; but the impact of this is likely to be very minor.
Sector Amount (R'000) Percentage
TVET Colleges R8 501 243 11%
SETAs R10 456 134 14%
Universities R52 860 091 71%
Community Colleges R1 731 890 2%
Other institutions (incl. DHET)
R426 536 1%
Total R73 975 894 100%
Total as % of GDP 1.70%
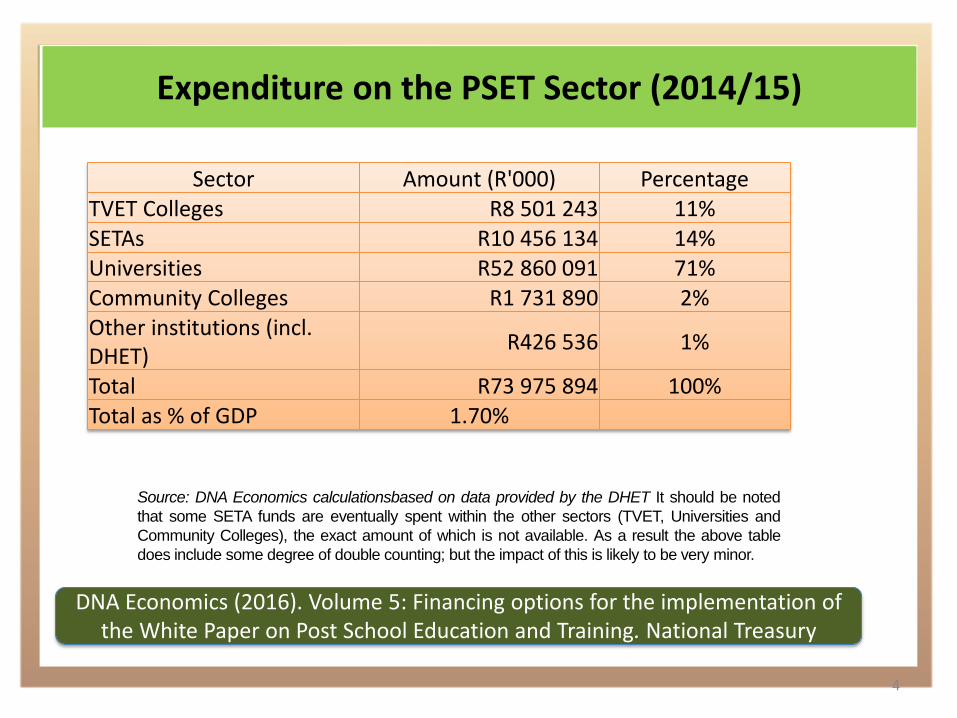
Government contribution to PSET by source (2014/15)
5
DNA Economics (2016). Volume 5: Financing options for the implementation of the White Paper on Post School Education and Training. National Treasury
Government Source Amount (R’000) Percentage
NSFAS 8 961 429 22%
DHET Transfers to TVET colleges 5 827 173 14%
DHET Transfers to Universities[1] 24 155 093 59%
Community Colleges 1 731 890 4%
PSET Institutions (incl. DHET) 426 536 1%
Total 41 102 121
Government PSET expenditure % of total PSET expenditures
55.56%
% of total of tax revenue 4.17%
Source: DNA Economics based on various sources of information
1 Department of Higher Education. 2015. University State Budgets Public Report.
Directorate: University Financial Planning
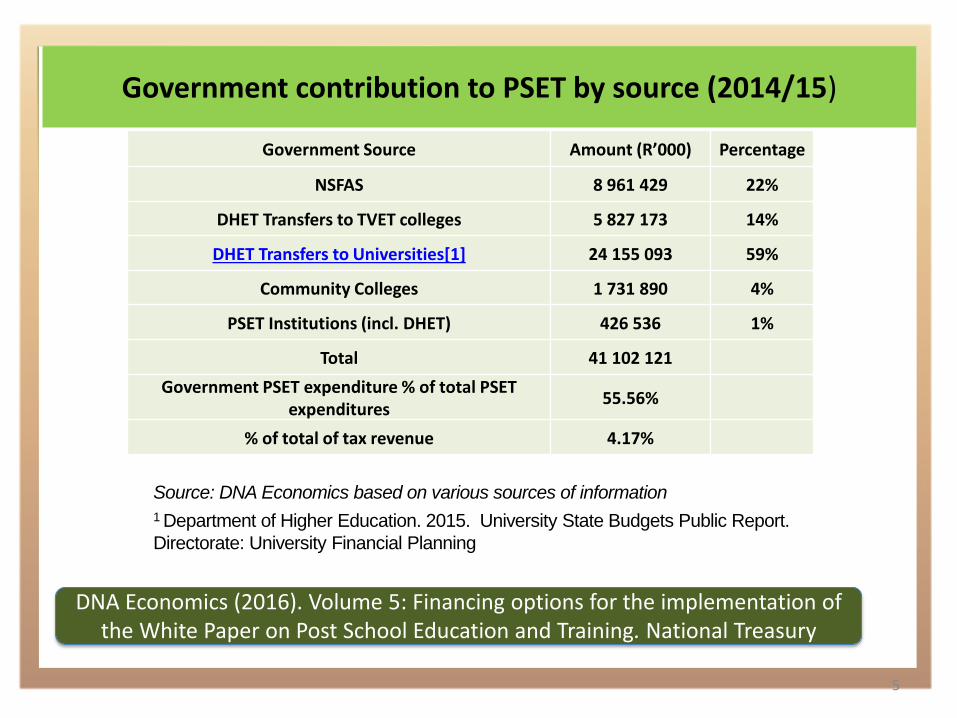
The TVET Colleges (continued)
6
60% 20%
5%
15%
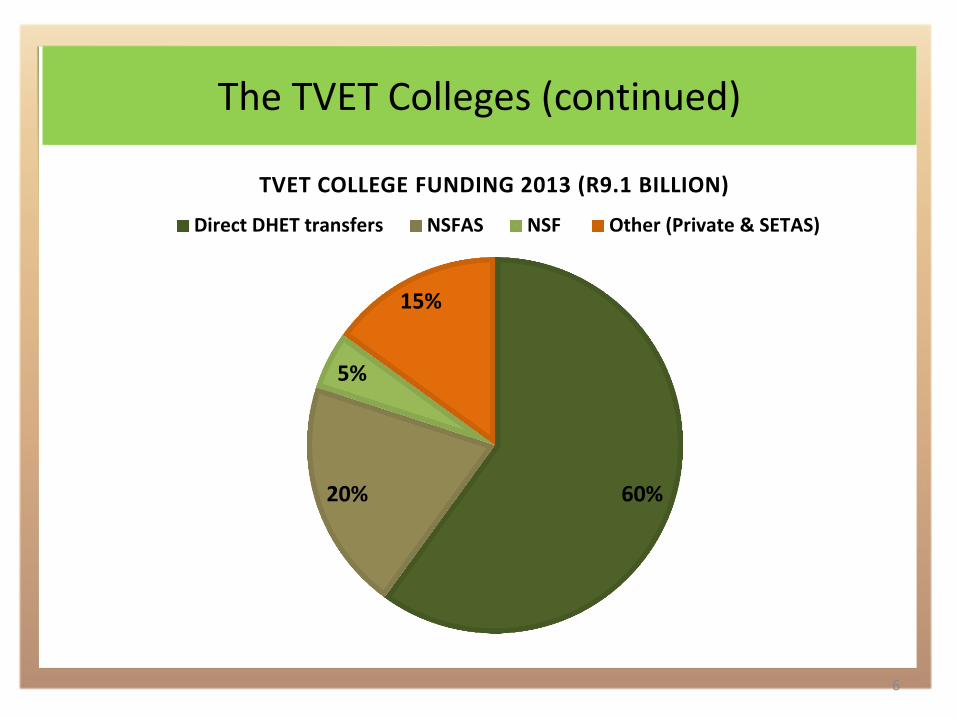
TVET COLLEGE FUNDING 2013 (R9.1 BILLION)
Direct DHET transfers NSFAS NSF Other (Private & SETAS)
The TVET Colleges (continued)
7
81% 68%
60% 56% 53%
19% 32%
40% 44% 47%
0%
10%
20%
30%
40%
50%
60%
70%
80%
90%
100%
2013/14 2014/15 2015/16 2016/17 2017/18
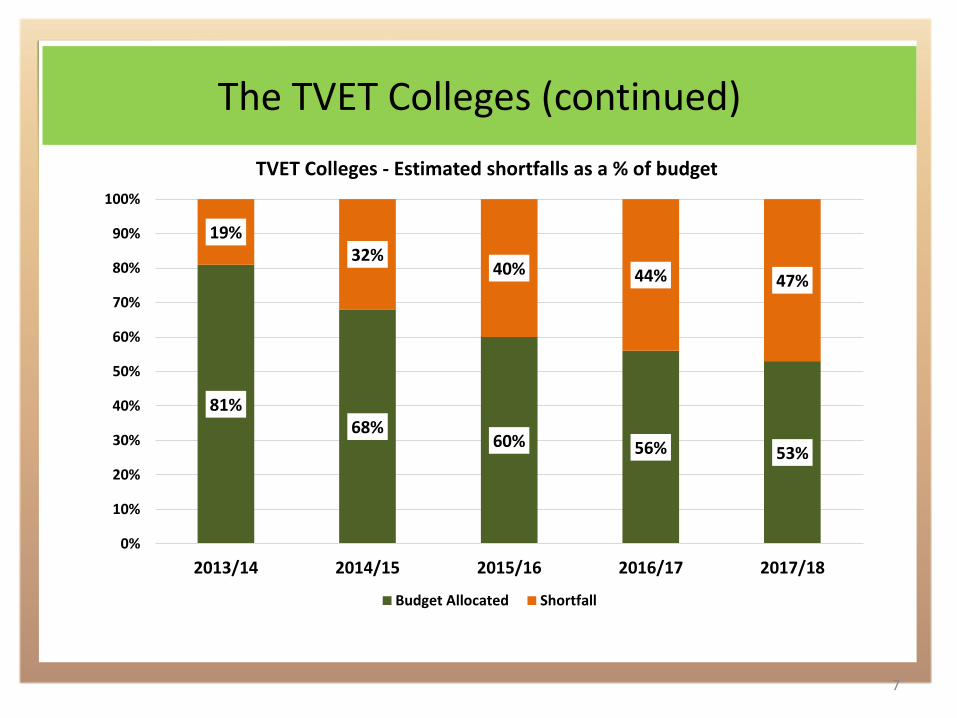
TVET Colleges - Estimated shortfalls as a % of budget
Budget Allocated Shortfall

Community Colleges’ expenditure
8
DNA Economics (2016). Volume 5: Financing options for the implementation of the White Paper on Post School Education and Training. National Treasury
• Expenditure increased from R 1.22 billion in 2010/11 to R 1.73
billion in 2014/15. Despite the 45.5% increase in overall funding -
simultaneous increase in enrolments means that revenue (from
direct government transfers) per learner decreased from R 6 714 in
2014/15 to R6 071 in 2015/16.
• Year-on-year budget increases for AET have been on a relative
decline and reflects the fact that provinces have consistently not
prioritised AET. This decline in allocations affect the state of AET
provision and the perceived decline in quality of provision over the
years.
• Analysis of expenditure shows that 93% is spent on compensation
of employees, leaving very little for the management or equipping
of the colleges or learner materials.

9
Specific questions that were asked
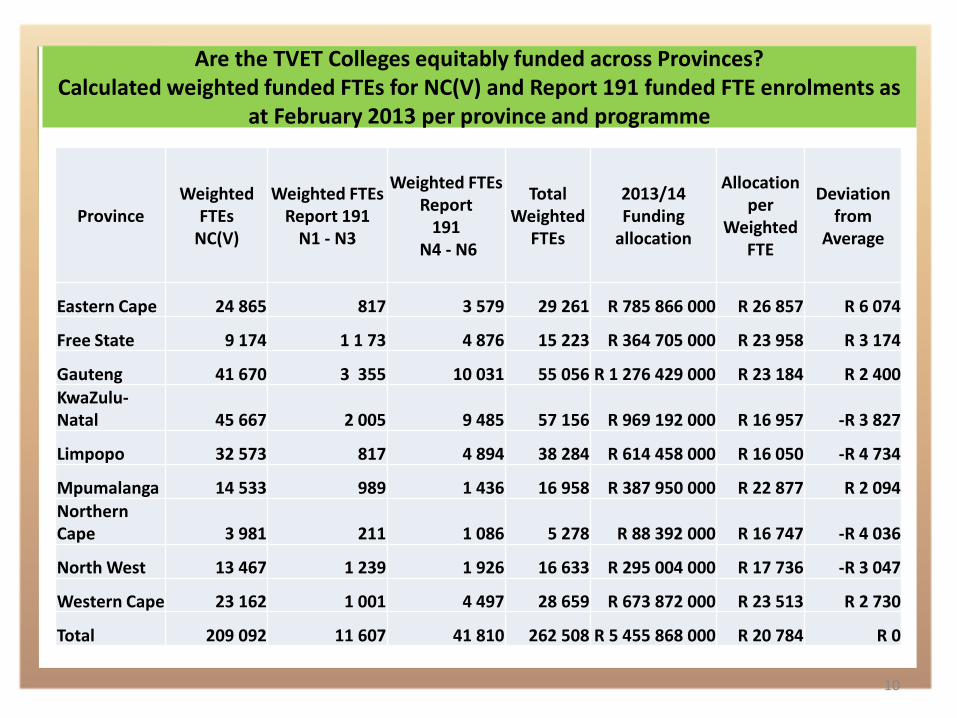
Are the TVET Colleges equitably funded across Provinces? Calculated weighted funded FTEs for NC(V) and Report 191 funded FTE enrolments as
at February 2013 per province and programme
10
Province Weighted
FTEs NC(V)
Weighted FTEs Report 191
N1 - N3
Weighted FTEs Report
191 N4 - N6
Total Weighted
FTEs
2013/14 Funding
allocation
Allocation per
Weighted FTE
Deviation from
Average
Eastern Cape 24 865 817 3 579 29 261 R 785 866 000 R 26 857 R 6 074
Free State 9 174 1 1 73 4 876 15 223 R 364 705 000 R 23 958 R 3 174
Gauteng 41 670 3 355 10 031 55 056 R 1 276 429 000 R 23 184 R 2 400
KwaZulu-Natal 45 667 2 005 9 485 57 156 R 969 192 000 R 16 957 -R 3 827
Limpopo 32 573 817 4 894 38 284 R 614 458 000 R 16 050 -R 4 734
Mpumalanga 14 533 989 1 436 16 958 R 387 950 000 R 22 877 R 2 094
Northern Cape 3 981 211 1 086 5 278 R 88 392 000 R 16 747 -R 4 036
North West 13 467 1 239 1 926 16 633 R 295 004 000 R 17 736 -R 3 047
Western Cape 23 162 1 001 4 497 28 659 R 673 872 000 R 23 513 R 2 730
Total 209 092 11 607 41 810 262 508 R 5 455 868 000 R 20 784 R 0
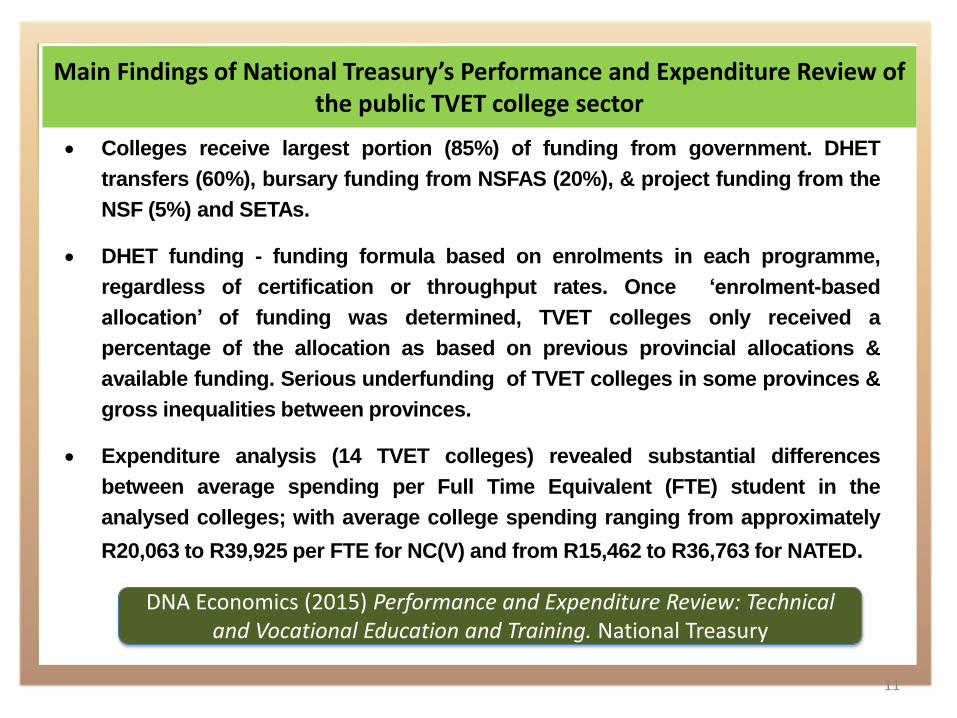
Main Findings of National Treasury’s Performance and Expenditure Review of the public TVET college sector
11
DNA Economics (2015) Performance and Expenditure Review: Technical and Vocational Education and Training. National Treasury
Colleges receive largest portion (85%) of funding from government. DHET
transfers (60%), bursary funding from NSFAS (20%), & project funding from the
NSF (5%) and SETAs.
DHET funding - funding formula based on enrolments in each programme,
regardless of certification or throughput rates. Once ‘enrolment-based
allocation’ of funding was determined, TVET colleges only received a
percentage of the allocation as based on previous provincial allocations &
available funding. Serious underfunding of TVET colleges in some provinces &
gross inequalities between provinces.
Expenditure analysis (14 TVET colleges) revealed substantial differences
between average spending per Full Time Equivalent (FTE) student in the
analysed colleges; with average college spending ranging from approximately
R20,063 to R39,925 per FTE for NC(V) and from R15,462 to R36,763 for NATED.

Main Findings of National Treasury’s Performance and Expenditure Review of the public TVET college sector
12
DNA Economics (2015) Performance and Expenditure Review: Technical and Vocational Education and Training. National Treasury
Actual spending per FTE doesn’t differ substantially between different
types of courses within the same college. Colleges do not in practice
spend substantially more on higher funded courses (more practical) than
lower funded ones. In practise this means that practical courses are not
being taught in the appropriate way.
Approximately 6% of average college spending on NC(V) programmes is on
direct programme costs; i.e. textbooks, programme consumables, toolkits,
etc. Substantially less than what was assumed in the funding norms.
Given the low throughput rates, the costs per graduate are exceedingly
large in many colleges as expenditure is apportioned to very few
graduates.
A positive relationship was observed between certification rates and
each of (a) funding (b) expenditure per FTE student and (c) staff
development spending.
Main Findings of National Treasury’s Performance and Expenditure Review of the public TVET college sector
13
DNA Economics (2015) Performance and Expenditure Review: Technical and Vocational Education and Training. National Treasury
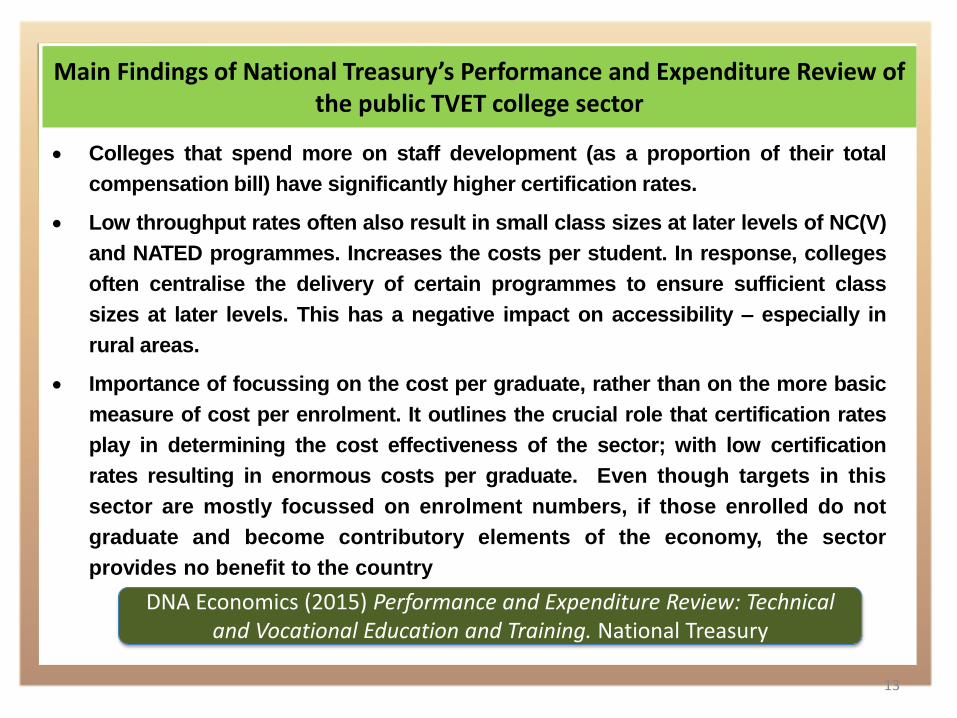
Colleges that spend more on staff development (as a proportion of their total
compensation bill) have significantly higher certification rates.
Low throughput rates often also result in small class sizes at later levels of NC(V)
and NATED programmes. Increases the costs per student. In response, colleges
often centralise the delivery of certain programmes to ensure sufficient class
sizes at later levels. This has a negative impact on accessibility – especially in
rural areas.
Importance of focussing on the cost per graduate, rather than on the more basic
measure of cost per enrolment. It outlines the crucial role that certification rates
play in determining the cost effectiveness of the sector; with low certification
rates resulting in enormous costs per graduate. Even though targets in this
sector are mostly focussed on enrolment numbers, if those enrolled do not
graduate and become contributory elements of the economy, the sector
provides no benefit to the country
Main Findings of National Treasury’s Performance and Expenditure Review of the public TVET college sector
14
DNA Economics (2015) Performance and Expenditure Review: Technical and Vocational Education and Training. National Treasury
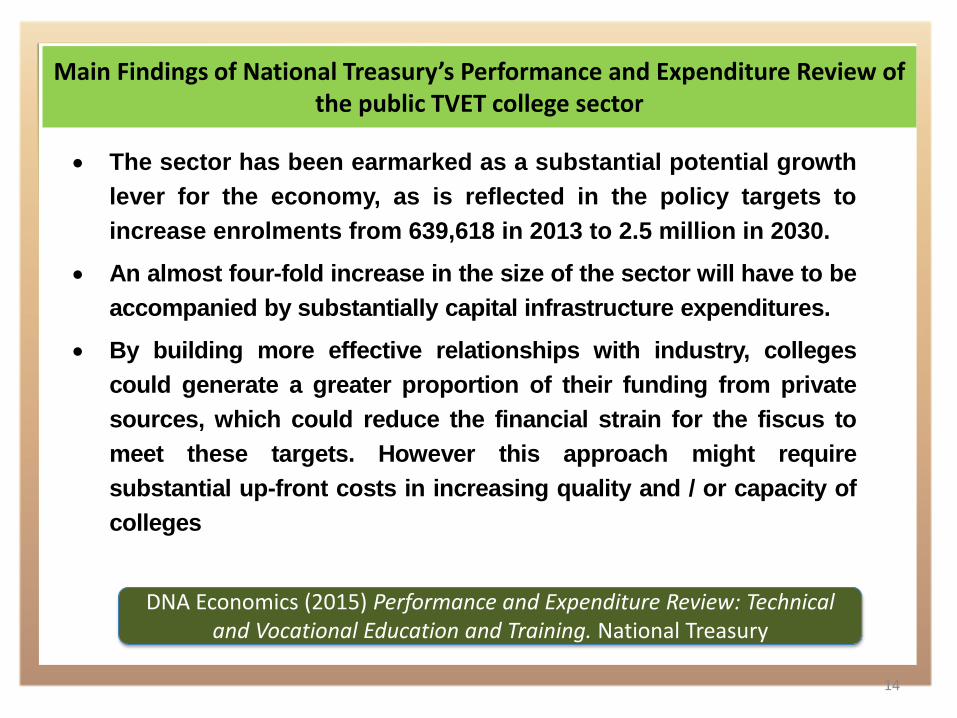
The sector has been earmarked as a substantial potential growth
lever for the economy, as is reflected in the policy targets to
increase enrolments from 639,618 in 2013 to 2.5 million in 2030.
An almost four-fold increase in the size of the sector will have to be
accompanied by substantially capital infrastructure expenditures.
By building more effective relationships with industry, colleges
could generate a greater proportion of their funding from private
sources, which could reduce the financial strain for the fiscus to
meet these targets. However this approach might require
substantial up-front costs in increasing quality and / or capacity of
colleges
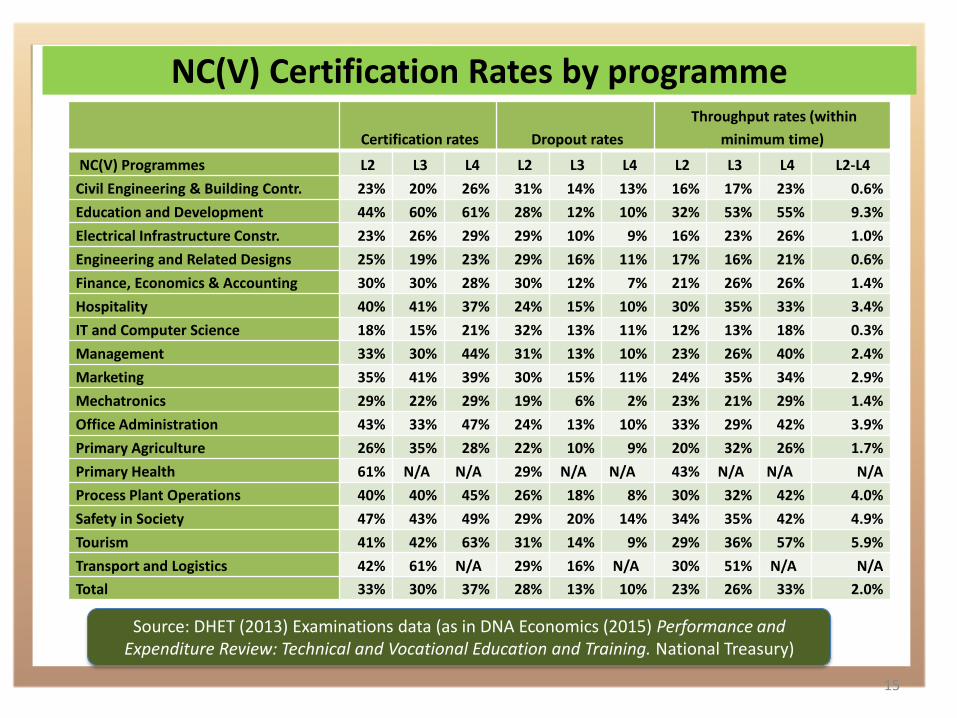
NC(V) Certification Rates by programme
15
Certification rates Dropout rates
Throughput rates (within
minimum time)
NC(V) Programmes L2 L3 L4 L2 L3 L4 L2 L3 L4 L2-L4
Civil Engineering & Building Contr. 23% 20% 26% 31% 14% 13% 16% 17% 23% 0.6%
Education and Development 44% 60% 61% 28% 12% 10% 32% 53% 55% 9.3%
Electrical Infrastructure Constr. 23% 26% 29% 29% 10% 9% 16% 23% 26% 1.0%
Engineering and Related Designs 25% 19% 23% 29% 16% 11% 17% 16% 21% 0.6%
Finance, Economics & Accounting 30% 30% 28% 30% 12% 7% 21% 26% 26% 1.4%
Hospitality 40% 41% 37% 24% 15% 10% 30% 35% 33% 3.4%
IT and Computer Science 18% 15% 21% 32% 13% 11% 12% 13% 18% 0.3%
Management 33% 30% 44% 31% 13% 10% 23% 26% 40% 2.4%
Marketing 35% 41% 39% 30% 15% 11% 24% 35% 34% 2.9%
Mechatronics 29% 22% 29% 19% 6% 2% 23% 21% 29% 1.4%
Office Administration 43% 33% 47% 24% 13% 10% 33% 29% 42% 3.9%
Primary Agriculture 26% 35% 28% 22% 10% 9% 20% 32% 26% 1.7%
Primary Health 61% N/A N/A 29% N/A N/A 43% N/A N/A N/A
Process Plant Operations 40% 40% 45% 26% 18% 8% 30% 32% 42% 4.0%
Safety in Society 47% 43% 49% 29% 20% 14% 34% 35% 42% 4.9%
Tourism 41% 42% 63% 31% 14% 9% 29% 36% 57% 5.9%
Transport and Logistics 42% 61% N/A 29% 16% N/A 30% 51% N/A N/A
Total 33% 30% 37% 28% 13% 10% 23% 26% 33% 2.0%
Source: DHET (2013) Examinations data (as in DNA Economics (2015) Performance and Expenditure Review: Technical and Vocational Education and Training. National Treasury)
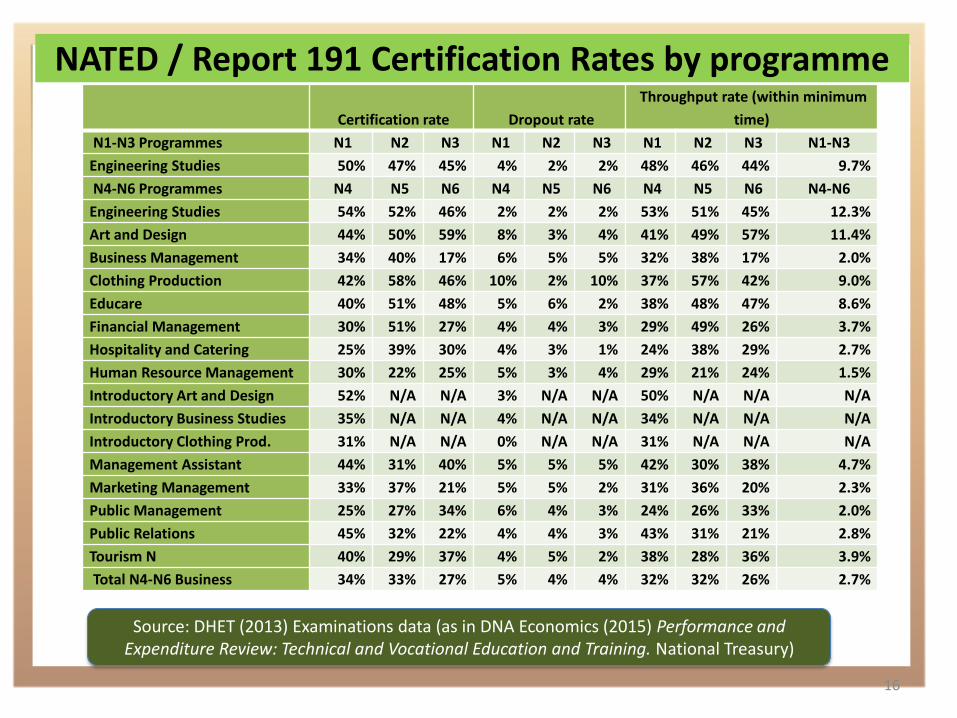
NATED / Report 191 Certification Rates by programme
16
Source: DHET (2013) Examinations data (as in DNA Economics (2015) Performance and Expenditure Review: Technical and Vocational Education and Training. National Treasury)
Certification rate Dropout rate
Throughput rate (within minimum
time)
N1-N3 Programmes N1 N2 N3 N1 N2 N3 N1 N2 N3 N1-N3
Engineering Studies 50% 47% 45% 4% 2% 2% 48% 46% 44% 9.7%
N4-N6 Programmes N4 N5 N6 N4 N5 N6 N4 N5 N6 N4-N6
Engineering Studies 54% 52% 46% 2% 2% 2% 53% 51% 45% 12.3%
Art and Design 44% 50% 59% 8% 3% 4% 41% 49% 57% 11.4%
Business Management 34% 40% 17% 6% 5% 5% 32% 38% 17% 2.0%
Clothing Production 42% 58% 46% 10% 2% 10% 37% 57% 42% 9.0%
Educare 40% 51% 48% 5% 6% 2% 38% 48% 47% 8.6%
Financial Management 30% 51% 27% 4% 4% 3% 29% 49% 26% 3.7%
Hospitality and Catering 25% 39% 30% 4% 3% 1% 24% 38% 29% 2.7%
Human Resource Management 30% 22% 25% 5% 3% 4% 29% 21% 24% 1.5%
Introductory Art and Design 52% N/A N/A 3% N/A N/A 50% N/A N/A N/A
Introductory Business Studies 35% N/A N/A 4% N/A N/A 34% N/A N/A N/A
Introductory Clothing Prod. 31% N/A N/A 0% N/A N/A 31% N/A N/A N/A
Management Assistant 44% 31% 40% 5% 5% 5% 42% 30% 38% 4.7%
Marketing Management 33% 37% 21% 5% 5% 2% 31% 36% 20% 2.3%
Public Management 25% 27% 34% 6% 4% 3% 24% 26% 33% 2.0%
Public Relations 45% 32% 22% 4% 4% 3% 43% 31% 21% 2.8%
Tourism N 40% 29% 37% 4% 5% 2% 38% 28% 36% 3.9%
Total N4-N6 Business 34% 33% 27% 5% 4% 4% 32% 32% 26% 2.7%
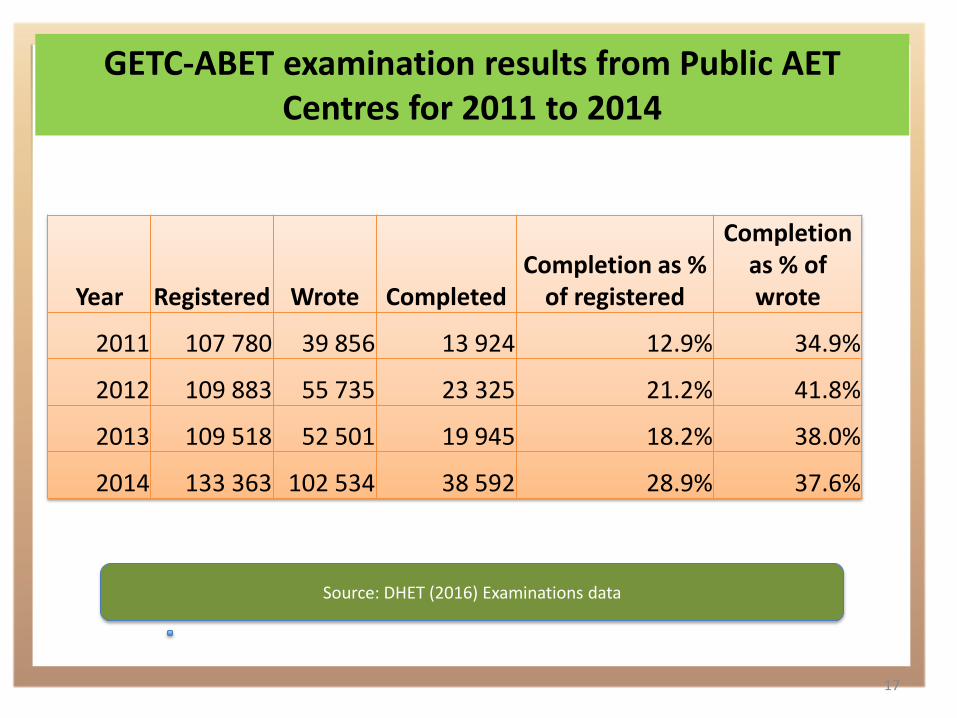
GETC-ABET examination results from Public AET Centres for 2011 to 2014
17
Source: DHET (2016) Examinations data
Year Registered Wrote Completed Completion as %
of registered
Completion as % of wrote
2011 107 780 39 856 13 924 12.9% 34.9%
2012 109 883 55 735 23 325 21.2% 41.8%
2013 109 518 52 501 19 945 18.2% 38.0%
2014 133 363 102 534 38 592 28.9% 37.6%
How do the FET and CET Colleges make funding decisions?
18
TVET Colleges:
• DHET allocates funds from the 80% state programme funding (which we know is currently at about 56%).
• 20% of the state programme funding must come from fees (largely funded by NSFAS)
• TVET colleges annually have their planning process (Strategic Plans, Operational Plans and Annual Performance Plans)
• In the planning process Colleges include the determination of their budget and how they intend to allocate the funding to activities.
• The budget of the college would therefore include funding from other sources of income e.g. donations, NSF, SETAs etc.
How do the FET and CET Colleges make funding decisions?
19
CET Colleges:
• DHET allocates full 100% funds (current 2016/2017 year estimated at R1.7 billion)
• Historically a few Public Adult Learning Centres (PALCs) charged small fees for photocopied notes, help in paying electricity accounts, etc. Minimal income from this.
• When PALCs where a provincial responsibility their planning may have been part of Provincial Education Departments’ overall planning processes. Whatever it was it was notoriously ineffective. Unclear what planning processes take place in the new nine Community College Administrative Centres
• CET Colleges have no income from other sources of income e.g. donations, NSF, SETAs etc.
What autonomy do they have in sourcing funds and deciding budgets?
20
TVET Colleges:
• Colleges are allowed to raise funds from other sources
and also to enter into partnership with e.g. the industry.
• FET Colleges determine their budgets, DHET allocate state
funding which is part of their total revenue.
CET Colleges
• Nominally the legislation for CET Colleges is similar to
TVET College legislation and allows for raising of funds
from other sources. But as actual community colleges do
not yet exist this is purely nominal. Community Colleges
not per se yet operational.
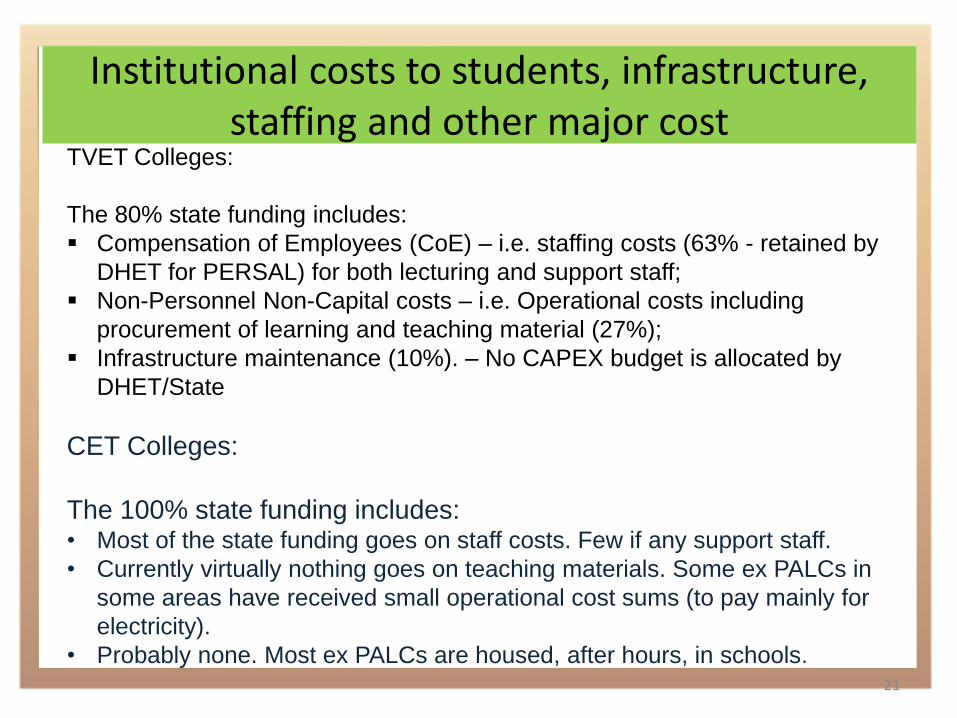
Institutional costs to students, infrastructure, staffing and other major cost
21
TVET Colleges:
The 80% state funding includes:
Compensation of Employees (CoE) – i.e. staffing costs (63% - retained by
DHET for PERSAL) for both lecturing and support staff;
Non-Personnel Non-Capital costs – i.e. Operational costs including
procurement of learning and teaching material (27%);
Infrastructure maintenance (10%). – No CAPEX budget is allocated by
DHET/State
CET Colleges:
The 100% state funding includes: • Most of the state funding goes on staff costs. Few if any support staff.
• Currently virtually nothing goes on teaching materials. Some ex PALCs in
some areas have received small operational cost sums (to pay mainly for
electricity).
• Probably none. Most ex PALCs are housed, after hours, in schools.
22
Ministerial Committee on the review of
the funding frameworks of TVET
Colleges and CET colleges
Committee still has to table final report to the
DHET. This presentation can only note
tentative findings
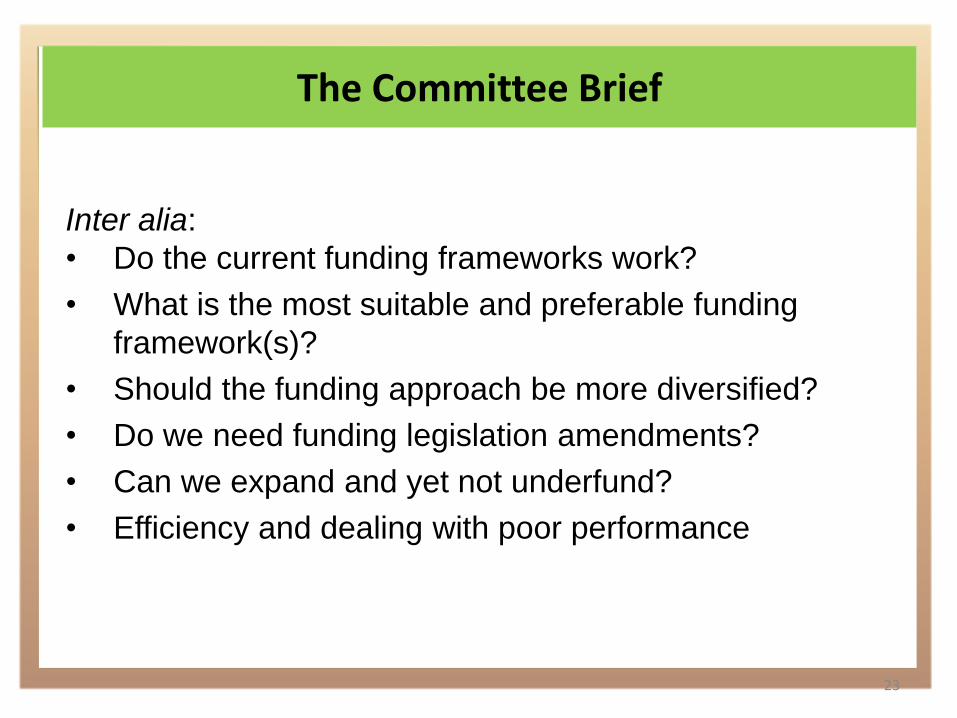
The Committee Brief
23
Inter alia:
• Do the current funding frameworks work?
• What is the most suitable and preferable funding
framework(s)?
• Should the funding approach be more diversified?
• Do we need funding legislation amendments?
• Can we expand and yet not underfund?
• Efficiency and dealing with poor performance

The brief continued – Community Colleges
24
Relevance of current adult learning centre funding?
Determine the typical characteristics of the
proposed Community Colleges: performance,
accountability, growth potential, viable size, etc.
Types of vocational qualifications and costs
Where should new Community Colleges be
established or merged?

25
The National Context Affecting TVET
and Community Colleges
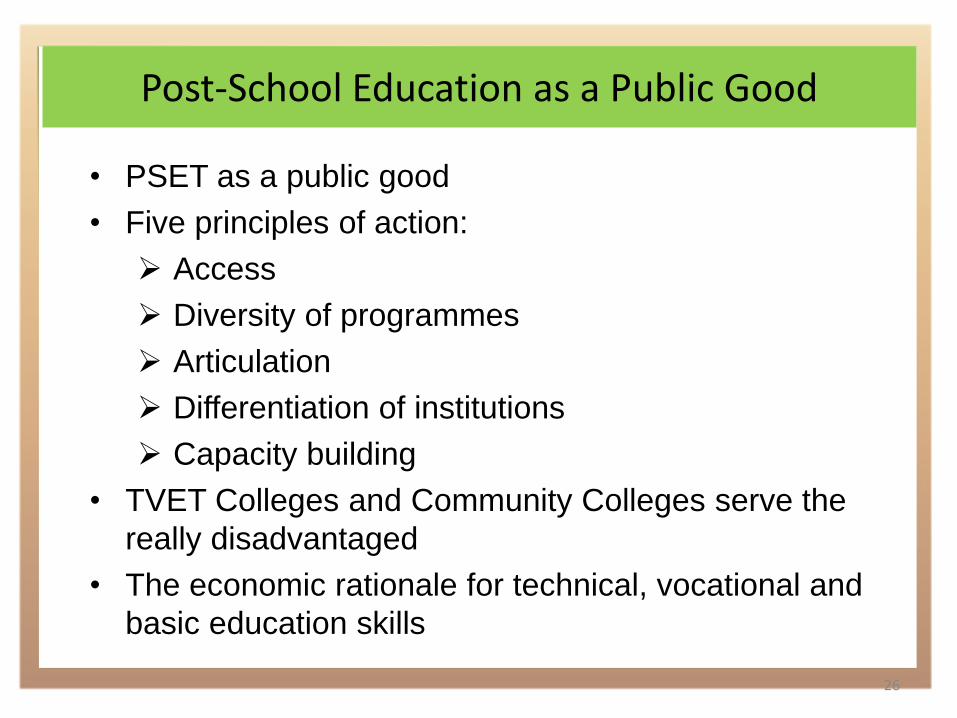
Post-School Education as a Public Good
26
• PSET as a public good
• Five principles of action:
Access
Diversity of programmes
Articulation
Differentiation of institutions
Capacity building
• TVET Colleges and Community Colleges serve the
really disadvantaged
• The economic rationale for technical, vocational and
basic education skills
The brief continued – Community Colleges
27
Relevance of current adult learning centre funding?
Determine the typical characteristics of the
proposed Community Colleges: performance,
accountability, growth potential, viable size, etc.
Types of vocational qualifications and costs
Where should new Community Colleges be
established or merged?
28
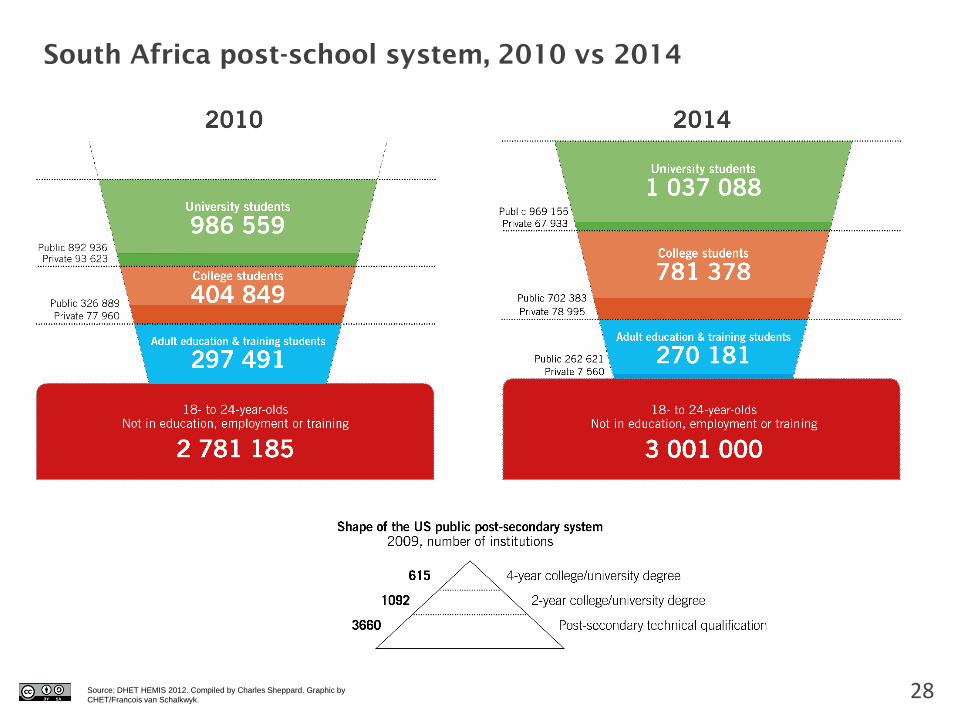
South Africa post-school system, 2010 vs 2014
Source: DHET HEMIS 2012. Compiled by Charles Sheppard. Graphic by
CHET/Francois van Schalkwyk.
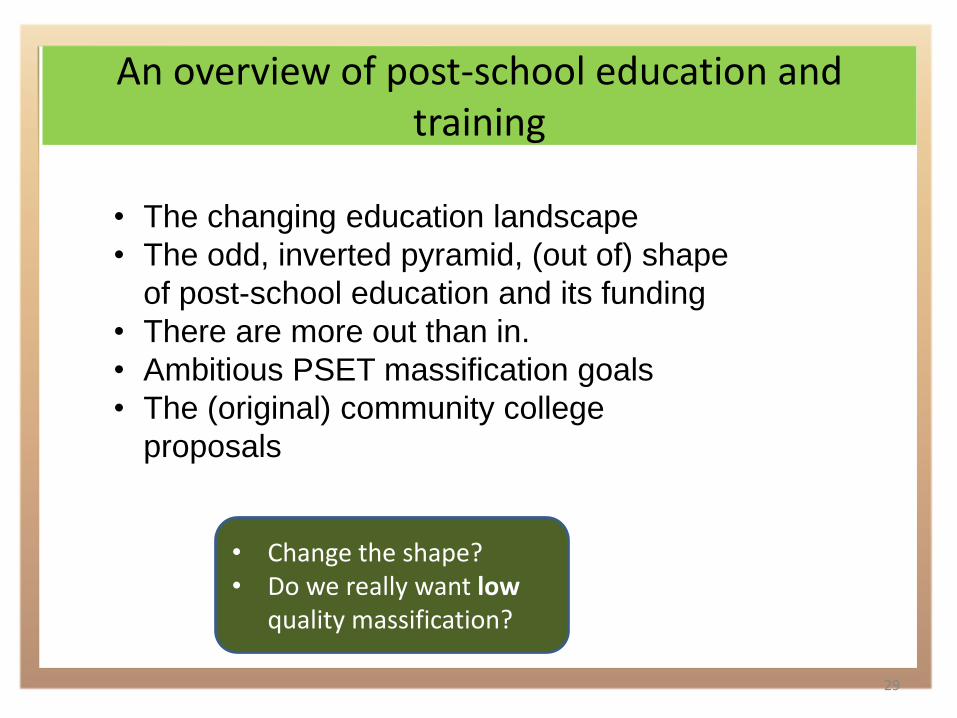
An overview of post-school education and training
29
• The changing education landscape
• The odd, inverted pyramid, (out of) shape
of post-school education and its funding
• There are more out than in.
• Ambitious PSET massification goals
• The (original) community college
proposals
• Change the shape? • Do we really want low
quality massification?
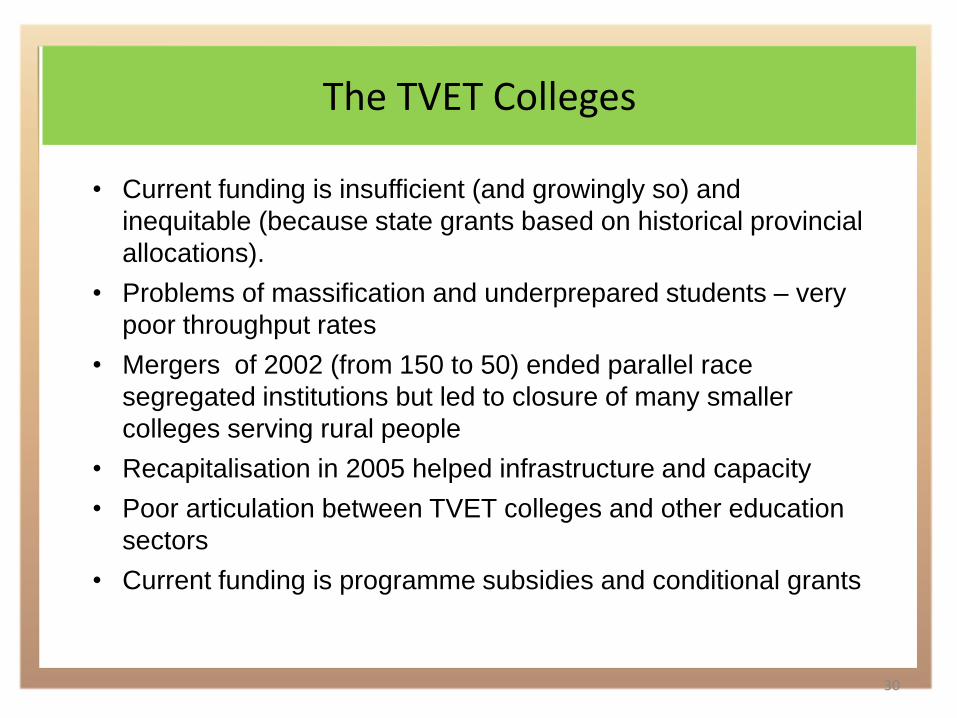
The TVET Colleges
30
• Current funding is insufficient (and growingly so) and
inequitable (because state grants based on historical provincial
allocations).
• Problems of massification and underprepared students – very
poor throughput rates
• Mergers of 2002 (from 150 to 50) ended parallel race
segregated institutions but led to closure of many smaller
colleges serving rural people
• Recapitalisation in 2005 helped infrastructure and capacity
• Poor articulation between TVET colleges and other education
sectors
• Current funding is programme subsidies and conditional grants
The TVET Colleges (continued)
31
• Fair funding would pay equal rand values per weighted
FTEs.
• This is not the case – baseline allocations of conditional
grants are based upon historical allocations (i.e. some
provinces are unfairly advantaged).
• No allowance made for whether colleges are urban or rural,
small or large or effective in throughput or not.
• TVET colleges only receive a percentage of the what they
should be granted according to the funding formula.
• This shortfall has grown from 19% in 2013/2014 to 44% in
2016/2017 – heading towards a major crisis.
The Community Colleges and their Community Learning Centres
32
• The Public Adult Learning Centre (PALC) system
• The new Community College policy
• A transition from PALCs to CCs linked to a
bureaucratic function shift
• There are no actual community colleges or pilots
• Current funding is totally inadequate and pays
mainly temporary contract underqualified educators
• More money (1.5% of education budget and then benchmarked %) • A proper holding operation and new implementation plan • Serious curriculum and materials provision
The Community Colleges and their Community Learning Centres (continued)
33
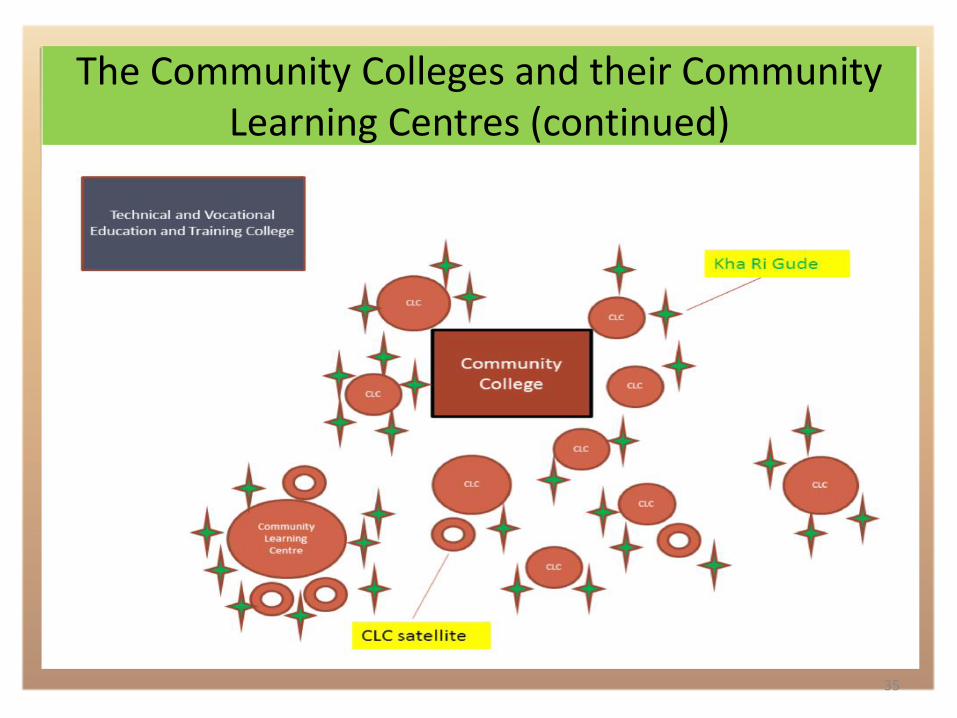
In 2012 a Ministerial Task Team on Community Education and Training
Centres ( DHET 2012c, 2012d) report proposed a new institutional set up
including Community Colleges as district hubs for Community Learning
Centres.
The actual proposals were as follows:
• A network rather than a single ‘new’ institution
• The network would be an integral part of the post-school system
• It would have two major components:
Community Learning Centres (and their smaller satellites): (with the
Kha Ri Gude literacy campaign infrastructure, matured into a national
learning network (with some similarities to the Scandinavian study
circles), linked to them
Community Colleges (within a differentiated college sector) as support
hubs for the Community Learning Centres clustered around them)
The Community Colleges and their Community Learning Centres (continued)
34
• Support from an Institute for Adult, Youth and Community
Learning (not merely a sub-section of a TVET Institute)
• Open, distance and e-learning components in all of these
institutions
• There would be strong links to the TVET college system
• There might be a pilot phase in which the model was tested but
the aim was for a community college in every district of the
country.
The Community Colleges and their Community Learning Centres (continued)
35
The Community Colleges and their Community Learning Centres (continued)
36
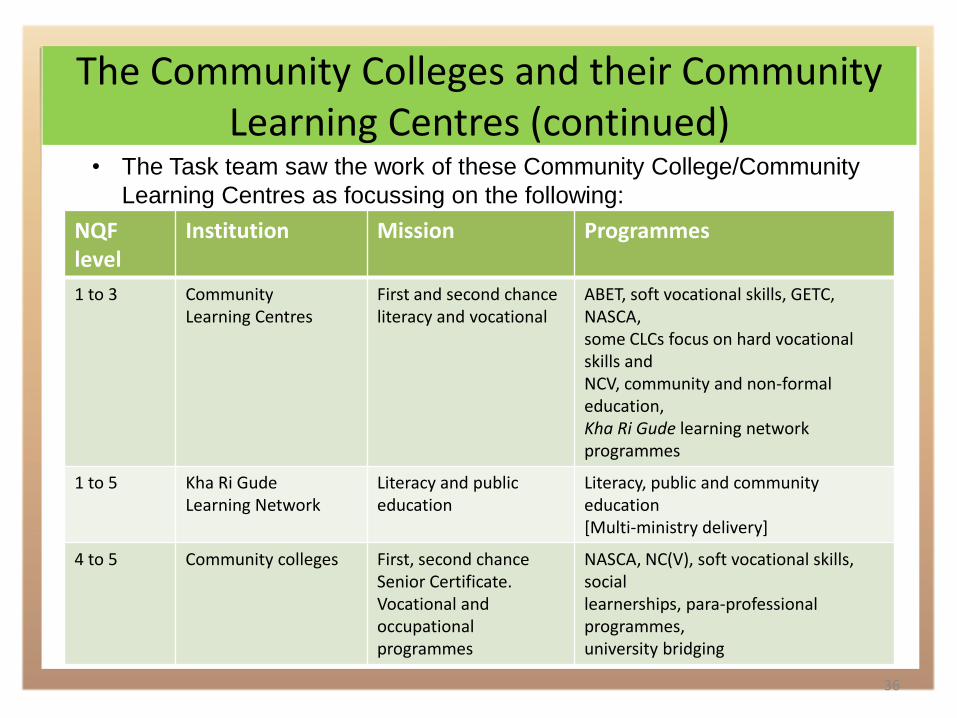
• The Task team saw the work of these Community College/Community
Learning Centres as focussing on the following:
NQF level
Institution Mission Programmes
1 to 3 Community Learning Centres
First and second chance literacy and vocational
ABET, soft vocational skills, GETC, NASCA, some CLCs focus on hard vocational skills and NCV, community and non-formal education, Kha Ri Gude learning network programmes
1 to 5 Kha Ri Gude Learning Network
Literacy and public education
Literacy, public and community education [Multi-ministry delivery]
4 to 5 Community colleges First, second chance Senior Certificate. Vocational and occupational programmes
NASCA, NC(V), soft vocational skills, social learnerships, para-professional programmes, university bridging

37
International Post-school systems
International Post-School Systems
38
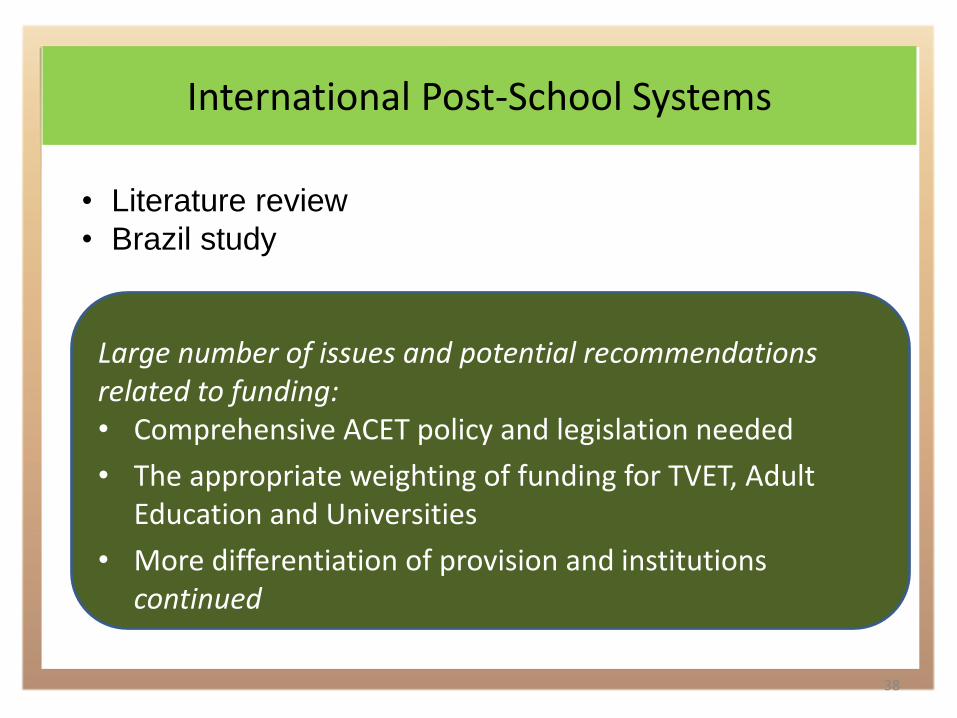
• Literature review
• Brazil study
Large number of issues and potential recommendations related to funding: • Comprehensive ACET policy and legislation needed
• The appropriate weighting of funding for TVET, Adult Education and Universities
• More differentiation of provision and institutions continued
International Post-School Systems
39
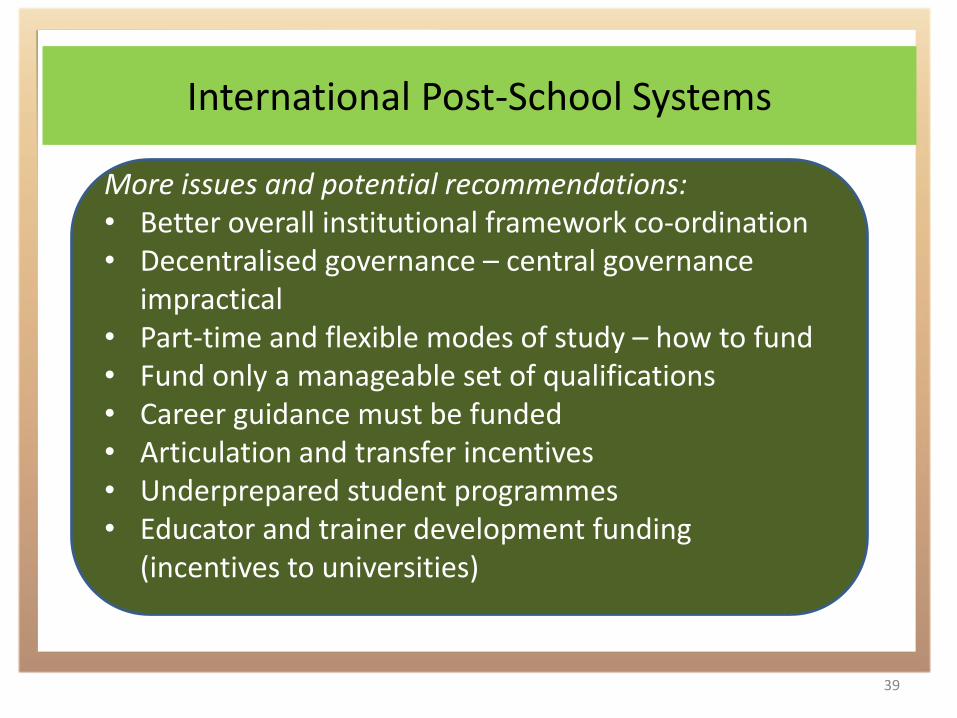
More issues and potential recommendations: • Better overall institutional framework co-ordination • Decentralised governance – central governance
impractical • Part-time and flexible modes of study – how to fund • Fund only a manageable set of qualifications • Career guidance must be funded • Articulation and transfer incentives • Underprepared student programmes • Educator and trainer development funding
(incentives to universities)
continued
International Post-School Systems
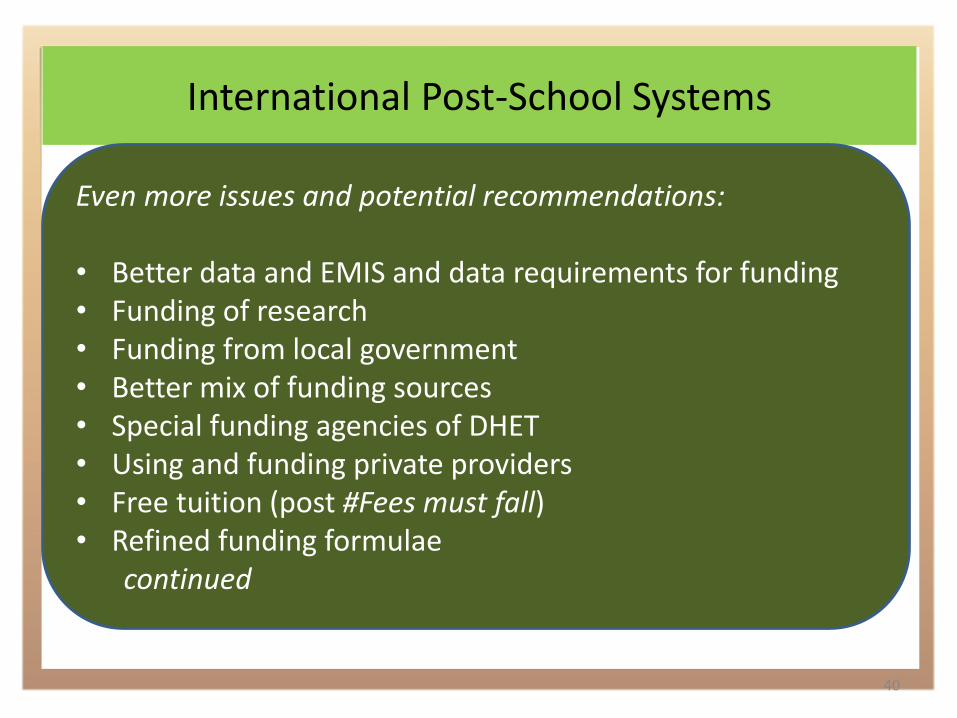
40
Even more issues and potential recommendations: • Better data and EMIS and data requirements for funding • Funding of research • Funding from local government • Better mix of funding sources • Special funding agencies of DHET • Using and funding private providers • Free tuition (post #Fees must fall) • Refined funding formulae
continued
International Post-School Systems
41
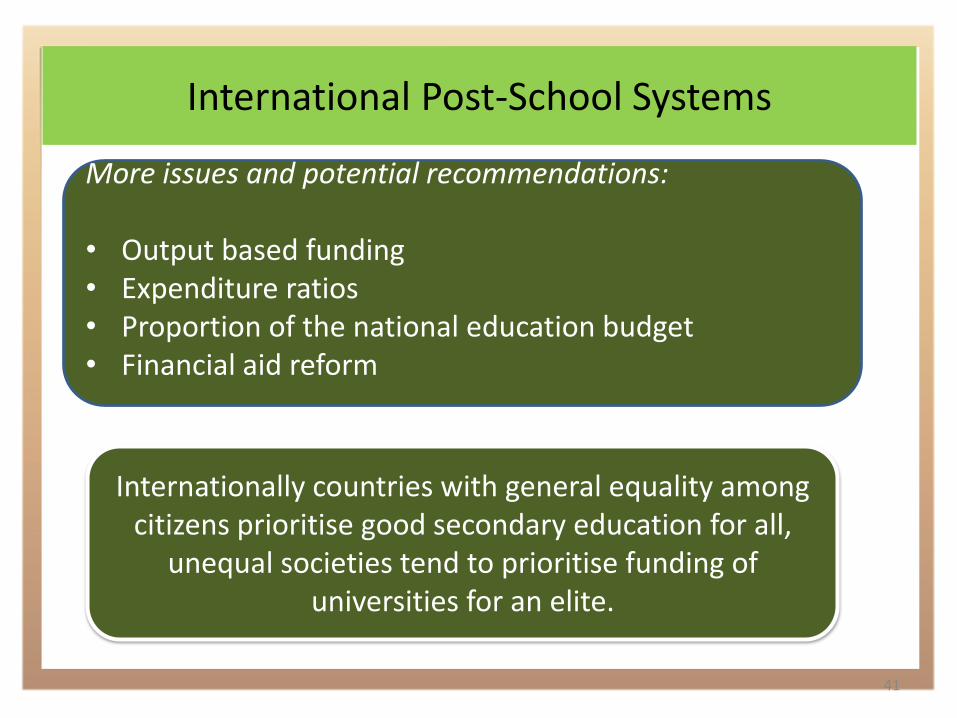
More issues and potential recommendations: • Output based funding • Expenditure ratios • Proportion of the national education budget • Financial aid reform
Internationally countries with general equality among citizens prioritise good secondary education for all,
unequal societies tend to prioritise funding of universities for an elite.
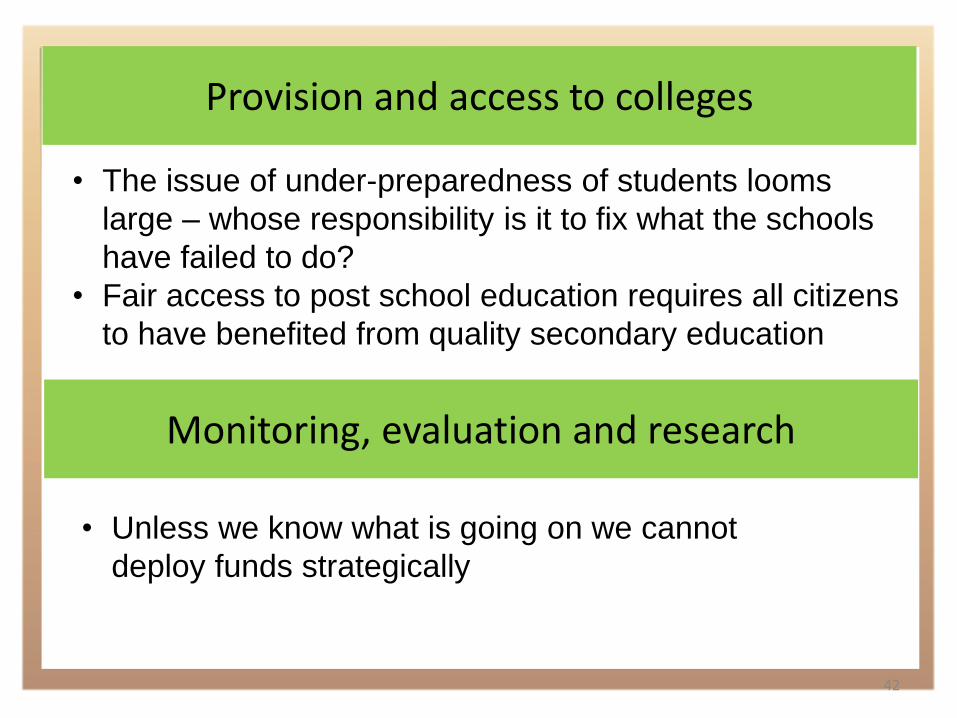
Provision and access to colleges
42
• The issue of under-preparedness of students looms
large – whose responsibility is it to fix what the schools
have failed to do?
• Fair access to post school education requires all citizens
to have benefited from quality secondary education
Monitoring, evaluation and research
• Unless we know what is going on we cannot
deploy funds strategically

43
RECOMMENDATIONS THE
COMMITTEE WILL MAKE
The numerous draft recommendations
are necessarily provisional as the
report still has to be accepted by the
DHET.
A funding framework for Colleges
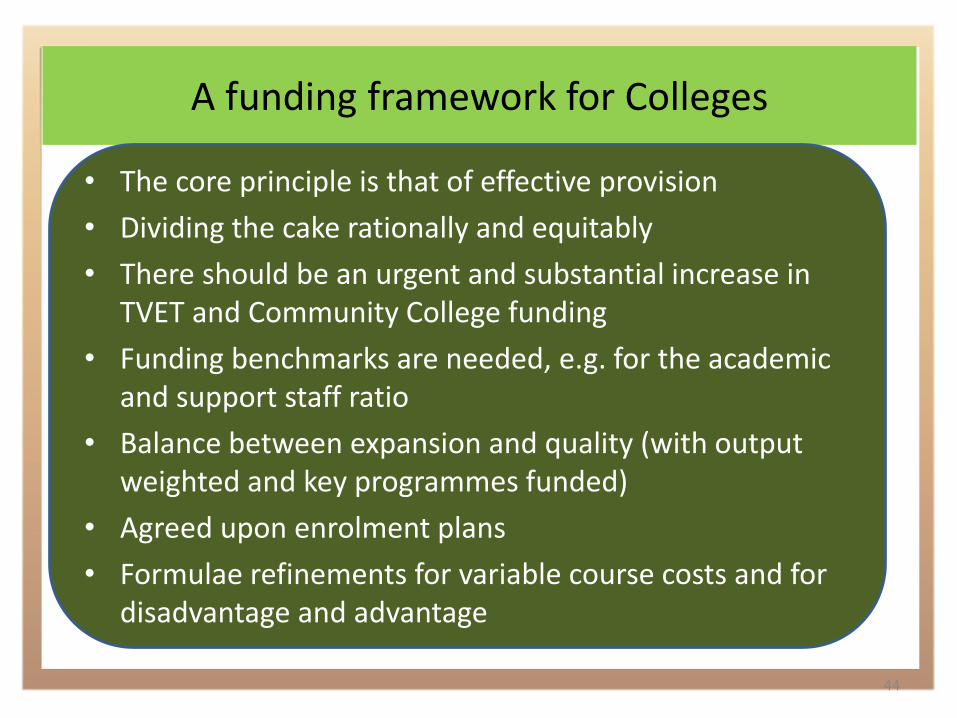
44
• The core principle is that of effective provision
• Dividing the cake rationally and equitably
• There should be an urgent and substantial increase in TVET and Community College funding
• Funding benchmarks are needed, e.g. for the academic and support staff ratio
• Balance between expansion and quality (with output weighted and key programmes funded)
• Agreed upon enrolment plans
• Formulae refinements for variable course costs and for disadvantage and advantage
A funding framework for Colleges (continued)
45
• Provincial disparities in TVET and Community College funding based upon old provincial allocations must end.
• Bridging for underprepared students for foreseeable future (and this will cost)
• Major development funding needed for community colleges (adult education)
• Major course and materials development (especially for Community Colleges)
• Poor performance remedies – output based factor in subsidy formulae
A funding framework for Colleges (continued)
46
• Funding predictability is essential – growing shortfalls in TVET college grants a recipe for disaster
• There should be free tuition in TVET and Community Colleges – but if there is a serious shortage of funds the students in TVET Colleges that pay fees should however continue to do so until more funding is available. No fees should be paid by students in Community Colleges because these students are predominantly from the poor.
• Current NSFAS funding to TVET colleges (which are grants not loans) should become part of baseline funding.
• Living allowances for indigent students should be in the form of vouchers and linked to performance.
A funding framework for Colleges (continued)
47
• TVET Colleges should retain profits from programmes
• Fiscal governance of TVET Colleges should be improved and started in the to be Community Colleges
• Universities should restore the capacity they abandoned in the last 15 years to support adult educator development

48
Thank You