Embed Size (px)
Citation preview
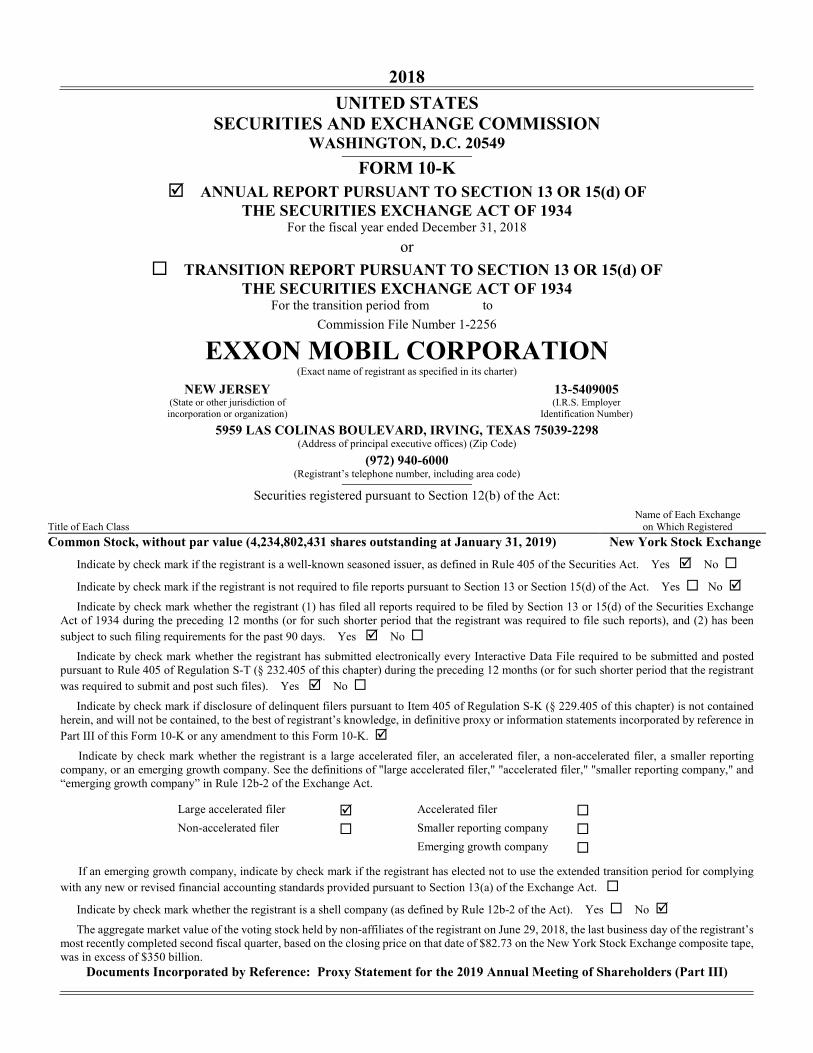
2018
UNITED STATES
SECURITIES AND EXCHANGE COMMISSION WASHINGTON, D.C. 20549
FORM 10-K
� ANNUAL REPORT PURSUANT TO SECTION 13 OR 15(d) OF
THE SECURITIES EXCHANGE ACT OF 1934 For the fiscal year ended December 31, 2018
or
� TRANSITION REPORT PURSUANT TO SECTION 13 OR 15(d) OF
THE SECURITIES EXCHANGE ACT OF 1934 For the transition period from to
Commission File Number 1-2256
EXXON MOBIL CORPORATION (Exact name of registrant as specified in its charter)
NEW JERSEY 13-5409005 (State or other jurisdiction of incorporation or organization)
(I.R.S. Employer Identification Number)
5959 LAS COLINAS BOULEVARD, IRVING, TEXAS 75039-2298 (Address of principal executive offices) (Zip Code)
(972) 940-6000 (Registrant’s telephone number, including area code)
Securities registered pursuant to Section 12(b) of the Act:
Title of Each Class Name of Each Exchange
on Which Registered
Common Stock, without par value (4,234,802,431 shares outstanding at January 31, 2019) New York Stock Exchange
Indicate by check mark if the registrant is a well-known seasoned issuer, as defined in Rule 405 of the Securities Act. Yes � No �
Indicate by check mark if the registrant is not required to file reports pursuant to Section 13 or Section 15(d) of the Act. Yes � No �
Indicate by check mark whether the registrant (1) has filed all reports required to be filed by Section 13 or 15(d) of the Securities Exchange Act of 1934 during the preceding 12 months (or for such shorter period that the registrant was required to file such reports), and (2) has been
subject to such filing requirements for the past 90 days. Yes � No �
Indicate by check mark whether the registrant has submitted electronically every Interactive Data File required to be submitted and posted pursuant to Rule 405 of Regulation S-T (§ 232.405 of this chapter) during the preceding 12 months (or for such shorter period that the registrant
was required to submit and post such files). Yes � No �
Indicate by check mark if disclosure of delinquent filers pursuant to Item 405 of Regulation S-K (§ 229.405 of this chapter) is not contained herein, and will not be contained, to the best of registrant’s knowledge, in definitive proxy or information statements incorporated by reference in
Part III of this Form 10-K or any amendment to this Form 10-K. �
Indicate by check mark whether the registrant is a large accelerated filer, an accelerated filer, a non-accelerated filer, a smaller reporting company, or an emerging growth company. See the definitions of "large accelerated filer," "accelerated filer," "smaller reporting company," and “emerging growth company” in Rule 12b-2 of the Exchange Act.
Large accelerated filer � Accelerated filer �
Non-accelerated filer � Smaller reporting company �
Emerging growth company �
If an emerging growth company, indicate by check mark if the registrant has elected not to use the extended transition period for complying
with any new or revised financial accounting standards provided pursuant to Section 13(a) of the Exchange Act. �
Indicate by check mark whether the registrant is a shell company (as defined by Rule 12b-2 of the Act). Yes � No �
The aggregate market value of the voting stock held by non-affiliates of the registrant on June 29, 2018, the last business day of the registrant’s most recently completed second fiscal quarter, based on the closing price on that date of $82.73 on the New York Stock Exchange composite tape, was in excess of $350 billion.
Documents Incorporated by Reference: Proxy Statement for the 2019 Annual Meeting of Shareholders (Part III)
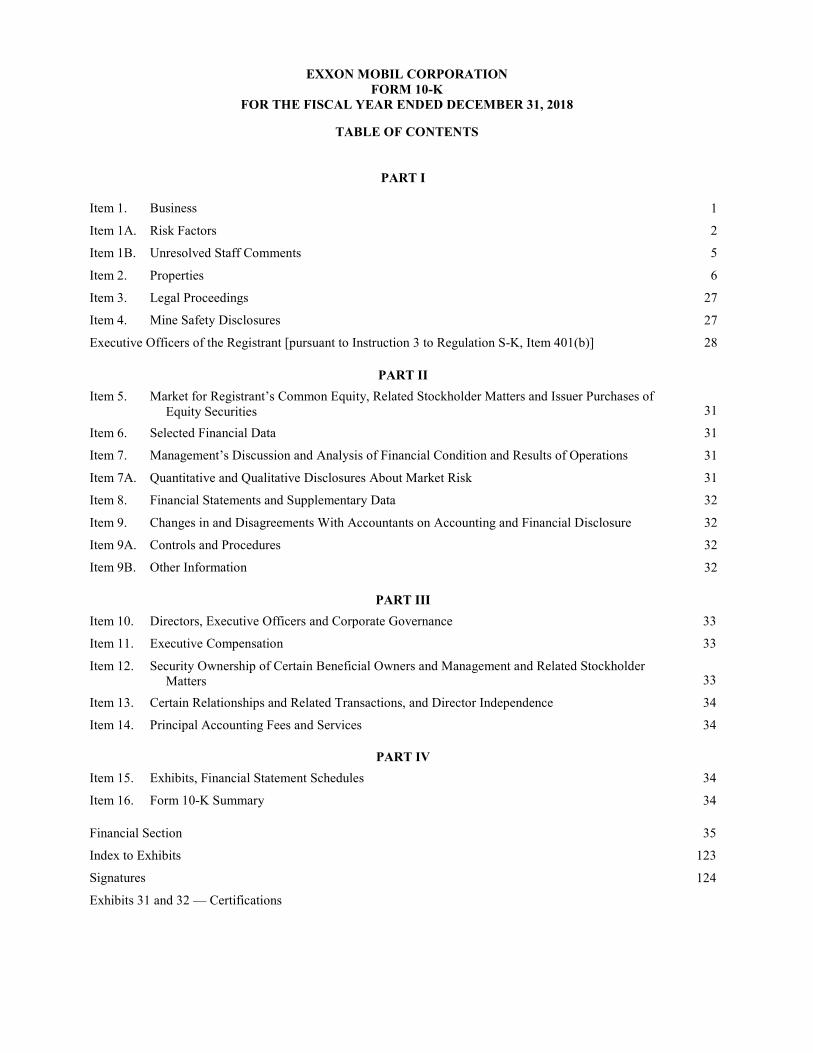
EXXON MOBIL CORPORATION FORM 10-K
FOR THE FISCAL YEAR ENDED DECEMBER 31, 2018
TABLE OF CONTENTS
PART I Item 1. Business 1
Item 1A. Risk Factors 2
Item 1B. Unresolved Staff Comments 5
Item 2. Properties 6
Item 3. Legal Proceedings 27
Item 4. Mine Safety Disclosures 27
Executive Officers of the Registrant [pursuant to Instruction 3 to Regulation S-K, Item 401(b)] 28
PART II
Item 5. Market for Registrant’s Common Equity, Related Stockholder Matters and Issuer Purchases of Equity Securities 31
Item 6. Selected Financial Data 31
Item 7. Management’s Discussion and Analysis of Financial Condition and Results of Operations 31
Item 7A. Quantitative and Qualitative Disclosures About Market Risk 31
Item 8. Financial Statements and Supplementary Data 32
Item 9. Changes in and Disagreements With Accountants on Accounting and Financial Disclosure 32
Item 9A. Controls and Procedures 32
Item 9B. Other Information 32
PART III
Item 10. Directors, Executive Officers and Corporate Governance 33
Item 11. Executive Compensation 33
Item 12. Security Ownership of Certain Beneficial Owners and Management and Related Stockholder Matters 33
Item 13. Certain Relationships and Related Transactions, and Director Independence 34
Item 14. Principal Accounting Fees and Services 34
PART IV
Item 15. Exhibits, Financial Statement Schedules 34
Item 16. Form 10-K Summary 34
Financial Section 35
Index to Exhibits 123
Signatures 124
Exhibits 31 and 32 — Certifications
1
PART I ITEM 1. BUSINESS
Exxon Mobil Corporation was incorporated in the State of New Jersey in 1882. Divisions and affiliated companies of ExxonMobil
operate or market products in the United States and most other countries of the world. Their principal business involves exploration for, and production of, crude oil and natural gas and manufacture, trade, transport and sale of crude oil, natural gas, petroleum products, petrochemicals and a wide variety of specialty products. Affiliates of ExxonMobil conduct extensive research programs in support of these businesses.
Exxon Mobil Corporation has several divisions and hundreds of affiliates, many with names that include ExxonMobil, Exxon, Esso,
Mobil or XTO. For convenience and simplicity, in this report the terms ExxonMobil, Exxon, Esso, Mobil and XTO, as well as terms like Corporation, Company, our, we and its, are sometimes used as abbreviated references to specific affiliates or groups of affiliates. The precise meaning depends on the context in question.
The energy and petrochemical industries are highly competitive. There is competition within the industries and also with other industries in supplying the energy, fuel and chemical needs of both industrial and individual consumers. The Corporation competes with other firms in the sale or purchase of needed goods and services in many national and international markets and employs all methods of competition which are lawful and appropriate for such purposes.
Operating data and industry segment information for the Corporation are contained in the Financial Section of this report under the following: “Quarterly Information”, “Note 18: Disclosures about Segments and Related Information” and “Operating Information”. Information on oil and gas reserves is contained in the “Oil and Gas Reserves” part of the “Supplemental Information on Oil and Gas Exploration and Production Activities” portion of the Financial Section of this report.
ExxonMobil has a long-standing commitment to the development of proprietary technology. We have a wide array of research
programs designed to meet the needs identified in each of our business segments. ExxonMobil held nearly 13 thousand active patents worldwide at the end of 2018. For technology licensed to third parties, revenues totaled approximately $119 million in 2018. Although technology is an important contributor to the overall operations and results of our Company, the profitability of each business segment is not dependent on any individual patent, trade secret, trademark, license, franchise or concession.
The number of regular employees was 71.0 thousand, 69.6 thousand, and 71.1 thousand at years ended 2018, 2017 and 2016, respectively. Regular employees are defined as active executive, management, professional, technical and wage employees who work full time or part time for the Corporation and are covered by the Corporation’s benefit plans and programs.
Throughout ExxonMobil’s businesses, new and ongoing measures are taken to prevent and minimize the impact of our operations on air, water and ground. These include a significant investment in refining infrastructure and technology to manufacture clean fuels, as well as projects to monitor and reduce nitrogen oxide, sulfur oxide and greenhouse gas emissions, and expenditures for asset retirement obligations. Using definitions and guidelines established by the American Petroleum Institute, ExxonMobil’s 2018 worldwide environmental expenditures for all such preventative and remediation steps, including ExxonMobil’s share of equity company expenditures, were $4.9 billion, of which $3.6 billion were included in expenses with the remainder in capital expenditures. The total cost for such activities is expected to increase to approximately $5.7 billion in 2019 and 2020. Capital expenditures are expected to account for approximately 30 percent of the total.
Information concerning the source and availability of raw materials used in the Corporation’s business, the extent of seasonality in the business, the possibility of renegotiation of profits or termination of contracts at the election of governments and risks attendant to foreign operations may be found in “Item 1A. Risk Factors” and “Item 2. Properties” in this report.
ExxonMobil maintains a website at exxonmobil.com. Our annual report on Form 10-K, quarterly reports on Form 10-Q, current reports on Form 8-K and any amendments to those reports filed or furnished pursuant to Section 13(a) of the Securities Exchange Act of 1934 are made available through our website as soon as reasonably practical after we electronically file or furnish the reports to the Securities and Exchange Commission (SEC). Also available on the Corporation’s website are the Company’s Corporate Governance Guidelines and Code of Ethics and Business Conduct, as well as the charters of the audit, compensation and nominating committees of the Board of Directors. Information on our website is not incorporated into this report.
The SEC maintains an internet site (http://www.sec.gov) that contains reports, proxy and information statements, and other information regarding issuers that file electronically with the SEC.
2
ITEM 1A. RISK FACTORS
ExxonMobil’s financial and operating results are subject to a variety of risks inherent in the global oil, gas, and petrochemical businesses. Many of these risk factors are not within the Company’s control and could adversely affect our business, our financial and operating results, or our financial condition. These risk factors include:
Supply and Demand
The oil, gas, and petrochemical businesses are fundamentally commodity businesses. This means ExxonMobil’s operations and earnings may be significantly affected by changes in oil, gas, and petrochemical prices and by changes in margins on refined products. Oil, gas, petrochemical, and product prices and margins in turn depend on local, regional, and global events or conditions that affect supply and demand for the relevant commodity. Any material decline in oil or natural gas prices could have a material adverse effect on certain of the Company’s operations, especially in the Upstream segment, financial condition, and proved reserves. On the other hand, a material increase in oil or natural gas prices could have a material adverse effect on certain of the Company’s operations, especially in the Downstream and Chemical segments.
Economic conditions. The demand for energy and petrochemicals is generally linked closely with broad-based economic activities and levels of prosperity. The occurrence of recessions or other periods of low or negative economic growth will typically have a direct adverse impact on our results. Other factors that affect general economic conditions in the world or in a major region, such as changes in population growth rates, periods of civil unrest, government austerity programs, or currency exchange rate fluctuations, can also impact the demand for energy and petrochemicals. Sovereign debt downgrades, defaults, inability to access debt markets due to credit or legal constraints, liquidity crises, the breakup or restructuring of fiscal, monetary, or political systems such as the European Union, and other events or conditions that impair the functioning of financial markets and institutions also pose risks to ExxonMobil, including risks to the safety of our financial assets and to the ability of our partners and customers to fulfill their commitments to ExxonMobil.
Other demand-related factors. Other factors that may affect the demand for oil, gas, and petrochemicals, and therefore impact our results, include technological improvements in energy efficiency; seasonal weather patterns; increased competitiveness of alternative energy sources; changes in technology or consumer preferences that alter fuel choices, such as technological advances in energy storage that make wind and solar more competitive for power generation or increased consumer demand for alternative fueled or electric vehicles; and broad-based changes in personal income levels.
Other supply-related factors. Commodity prices and margins also vary depending on a number of factors affecting supply. For example, increased supply from the development of new oil and gas supply sources and technologies to enhance recovery from existing sources tend to reduce commodity prices to the extent such supply increases are not offset by commensurate growth in demand. Similarly, increases in industry refining or petrochemical manufacturing capacity relative to demand tend to reduce margins on the affected products. World oil, gas, and petrochemical supply levels can also be affected by factors that reduce available supplies, such as adherence by countries to OPEC production quotas and other agreements among sovereigns, and the occurrence of wars, hostile actions, natural disasters, disruptions in competitors’ operations, logistics constraints or unexpected unavailability of distribution channels that may disrupt supplies. Technological change can also alter the relative costs for competitors to find, produce, and refine oil and gas and to manufacture petrochemicals.
Other market factors. ExxonMobil’s business results are also exposed to potential negative impacts due to changes in interest rates, inflation, currency exchange rates, and other local or regional market conditions.
Government and Political Factors
ExxonMobil’s results can be adversely affected by political or regulatory developments affecting our operations.
Access limitations. A number of countries limit access to their oil and gas resources, or may place resources off-limits from development altogether. Restrictions on foreign investment in the oil and gas sector tend to increase in times of high commodity prices, when national governments may have less need of outside sources of private capital. Many countries also restrict the import or export of certain products based on point of origin.
Restrictions on doing business. ExxonMobil is subject to laws and sanctions imposed by the United States or by other jurisdictions where we do business that may prohibit ExxonMobil or certain of its affiliates from doing business in certain countries, or restricting the kind of business that may be conducted. Such restrictions may provide a competitive advantage to competitors who may not be subject to comparable restrictions.
Lack of legal certainty. Some countries in which we do business lack well-developed legal systems, or have not yet adopted, or may be unable to maintain, clear regulatory frameworks for oil and gas development. Lack of legal certainty exposes our operations to increased risk of adverse or unpredictable actions by government officials, and also makes it more difficult for us to enforce our contracts. In some cases these risks can be partially offset by agreements to arbitrate disputes in an international forum, but the adequacy of this remedy may still depend on the local legal system to enforce an award.
3
Regulatory and litigation risks. Even in countries with well-developed legal systems where ExxonMobil does business, we remain exposed to changes in law or interpretation of settled law (including changes that result from international treaties and accords) that could adversely affect our results, such as:
• increases in taxes, duties, or government royalty rates (including retroactive claims);
• price controls;
• changes in environmental regulations or other laws that increase our cost of compliance or reduce or delay available businessopportunities (including changes in laws related to offshore drilling operations, water use, methane emissions, hydraulicfracturing or plastics);
• adoption of regulations mandating efficiency standards, the use of alternative fuels or uncompetitive fuel components;
• adoption of government payment transparency regulations that could require us to disclose competitively sensitivecommercial information, or that could cause us to violate the non-disclosure laws of other countries; and
• government actions to cancel contracts, re-denominate the official currency, renounce or default on obligations, renegotiateterms unilaterally, or expropriate assets.
Legal remedies available to compensate us for expropriation or other takings may be inadequate.
We also may be adversely affected by the outcome of litigation, especially in countries such as the United States in which very large and unpredictable punitive damage awards may occur, or by government enforcement proceedings alleging non-compliance with applicable laws or regulations.
Security concerns. Successful operation of particular facilities or projects may be disrupted by civil unrest, acts of sabotage or terrorism, cybersecurity attacks, and other local security concerns. Such concerns may require us to incur greater costs for security or to shut down operations for a period of time.
Climate change and greenhouse gas restrictions. Due to concern over the risks of climate change, a number of countries have adopted, or are considering the adoption of, regulatory frameworks to reduce greenhouse gas emissions. These include adoption of cap and trade regimes, carbon taxes, minimum renewable usage requirements, restrictive permitting, increased efficiency standards, and incentives or mandates for renewable energy. Such policies could make our products more expensive, less competitive, lengthen project implementation times, and reduce demand for hydrocarbons, as well as shift hydrocarbon demand toward relatively lower-carbon sources such as natural gas. Current and pending greenhouse gas regulations or policies may also increase our compliance costs, such as for monitoring or sequestering emissions.
Government sponsorship of alternative energy. Many governments are providing tax advantages and other subsidies to support alternative energy sources or are mandating the use of specific fuels or technologies. Governments and others are also promoting research into new technologies to reduce the cost and increase the scalability of alternative energy sources. We are conducting our own research both in-house and by working with more than 80 leading universities around the world, including the Massachusetts Institute of Technology, Princeton University, The University of Texas, and Stanford University. Our research projects focus on developing algae-based biofuels, carbon capture and storage, breakthrough energy efficiency processes, advanced energy-saving materials, and other technologies. For example, ExxonMobil is working with Fuel Cell Energy Inc. to explore using carbonate fuel cells to economically capture CO2 emissions from gas-fired power plants. Our future results may depend in part on the success of our research efforts and on our ability to adapt and apply the strengths of our current business model to providing the energy products of the future in a cost-competitive manner. See “Operational and Other Factors” below.
Operational and Other Factors
In addition to external economic and political factors, our future business results also depend on our ability to manage successfully those factors that are at least in part within our control. The extent to which we manage these factors will impact our performance relative to competition. For projects in which we are not the operator, we depend on the management effectiveness of one or more co-venturers whom we do not control.
Exploration and development program. Our ability to maintain and grow our oil and gas production depends on the success of our exploration and development efforts. Among other factors, we must continuously improve our ability to identify the most promising resource prospects and apply our project management expertise to bring discovered resources on line as scheduled and within budget.
4
Project and portfolio management. The long-term success of ExxonMobil’s Upstream, Downstream, and Chemical businesses depends on complex, long-term, capital intensive projects. These projects in turn require a high degree of project management expertise to maximize efficiency. Specific factors that can affect the performance of major projects include our ability to: negotiate successfully with joint venturers, partners, governments, suppliers, customers, or others; model and optimize reservoir performance; develop markets for project outputs, whether through long-term contracts or the development of effective spot markets; manage changes in operating conditions and costs, including costs of third party equipment or services such as drilling rigs and shipping; prevent, to the extent possible, and respond effectively to unforeseen technical difficulties that could delay project startup or cause unscheduled project downtime; and influence the performance of project operators where ExxonMobil does not perform that role. In addition to the effective management of individual projects, ExxonMobil’s success, including our ability to mitigate risk and provide attractive returns to shareholders, depends on our ability to successfully manage our overall portfolio, including diversification among types and locations of our projects.
The term “project” as used in this report can refer to a variety of different activities and does not necessarily have the same meaning as in any government payment transparency reports.
Operational efficiency. An important component of ExxonMobil’s competitive performance, especially given the commodity-based nature of many of our businesses, is our ability to operate efficiently, including our ability to manage expenses and improve production yields on an ongoing basis. This requires continuous management focus, including technology improvements, cost control, productivity enhancements, regular reappraisal of our asset portfolio, and the recruitment, development, and retention of high caliber employees.
Research and development and technological change. To maintain our competitive position, especially in light of the technological nature of our businesses and the need for continuous efficiency improvement, ExxonMobil’s research and development organizations must be successful and able to adapt to a changing market and policy environment, including developing technologies to help reduce greenhouse gas emissions. To remain competitive we must also continuously adapt and capture the benefits of new and emerging technologies.
Safety, business controls, and environmental risk management. Our results depend on management’s ability to minimize the inherent risks of oil, gas, and petrochemical operations, to control effectively our business activities, and to minimize the potential for human error. We apply rigorous management systems and continuous focus on workplace safety and avoiding spills or other adverse environmental events. For example, we work to minimize spills through a combined program of effective operations integrity management, ongoing upgrades, key equipment replacements, and comprehensive inspection and surveillance. Similarly, we are implementing cost-effective new technologies and adopting new operating practices to reduce air emissions, not only in response to government requirements but also to address community priorities. We also maintain a disciplined framework of internal controls and apply a controls management system for monitoring compliance with this framework. Substantial liabilities and other adverse impacts could result if our management systems and controls do not function as intended.
Cybersecurity. ExxonMobil is regularly subject to attempted cybersecurity disruptions from a variety of threat actors including state-sponsored actors. ExxonMobil’s defensive preparedness includes multi-layered technological capabilities for prevention and detection of cybersecurity disruptions; non-technological measures such as threat information sharing with governmental and industry groups; internal training and awareness campaigns including routine testing of employee awareness and an emphasis on resiliency including business response and recovery. If the measures we are taking to protect against cybersecurity disruptions prove to be insufficient, ExxonMobil as well as our customers, employees, or third parties could be adversely affected. Cybersecurity disruptions could cause physical harm to people or the environment; damage or destroy assets; compromise business systems; result in proprietary information being altered, lost, or stolen; result in employee, customer, or third-party information being compromised; or otherwise disrupt our business operations. We could incur significant costs to remedy the effects of a major cybersecurity disruption in addition to costs in connection with resulting regulatory actions, litigation or reputational harm.
Preparedness. Our operations may be disrupted by severe weather events, natural disasters, human error, and similar events. For example, hurricanes may damage our offshore production facilities or coastal refining and petrochemical plants in vulnerable areas. Our facilities are designed, constructed, and operated to withstand a variety of extreme climatic and other conditions, with safety factors built in to cover a number of engineering uncertainties, including those associated with wave, wind, and current intensity, marine ice flow patterns, permafrost stability, storm surge magnitude, temperature extremes, extreme rainfall events, and earthquakes. Our consideration of changing weather conditions and inclusion of safety factors in design covers the engineering uncertainties that climate change and other events may potentially introduce. Our ability to mitigate the adverse impacts of these events depends in part upon the effectiveness of our robust facility engineering as well as our rigorous disaster preparedness and response and business continuity planning.
5
Insurance limitations. The ability of the Corporation to insure against many of the risks it faces as described in this Item 1A is limited by the capacity of the applicable insurance markets, which may not be sufficient.
Competition. As noted in Item 1 above, the energy and petrochemical industries are highly competitive. We face competition not only from other private firms, but also from state-owned companies that are increasingly competing for opportunities outside of their home countries. In some cases, these state-owned companies may pursue opportunities in furtherance of strategic objectives of their government owners, with less focus on financial returns than companies owned by private shareholders, such as ExxonMobil. Technology and expertise provided by industry service companies may also enhance the competitiveness of firms that may not have the internal resources and capabilities of ExxonMobil or reduce the need for resource-owning countries to partner with private-sector oil and gas companies in order to monetize national resources.
Reputation. Our reputation is an important corporate asset. An operating incident, significant cybersecurity disruption, or other adverse event such as those described in this Item 1A may have a negative impact on our reputation, which in turn could make it more difficult for us to compete successfully for new opportunities, obtain necessary regulatory approvals, or could reduce consumer demand for our branded products. ExxonMobil’s reputation may also be harmed by events which negatively affect the image of our industry as a whole.
Projections, estimates, and descriptions of ExxonMobil’s plans and objectives included or incorporated in Items 1, 1A, 2, 7 and 7A of this report are forward-looking statements. Actual future results, including project completion dates, production rates, capital expenditures, costs, and business plans could differ materially due to, among other things, the factors discussed above and elsewhere in this report.
ITEM 1B. UNRESOLVED STAFF COMMENTS
None.
6
ITEM 2. PROPERTIES
Information with regard to oil and gas producing activities follows:
1. Disclosure of Reserves
A. Summary of Oil and Gas Reserves at Year-End 2018
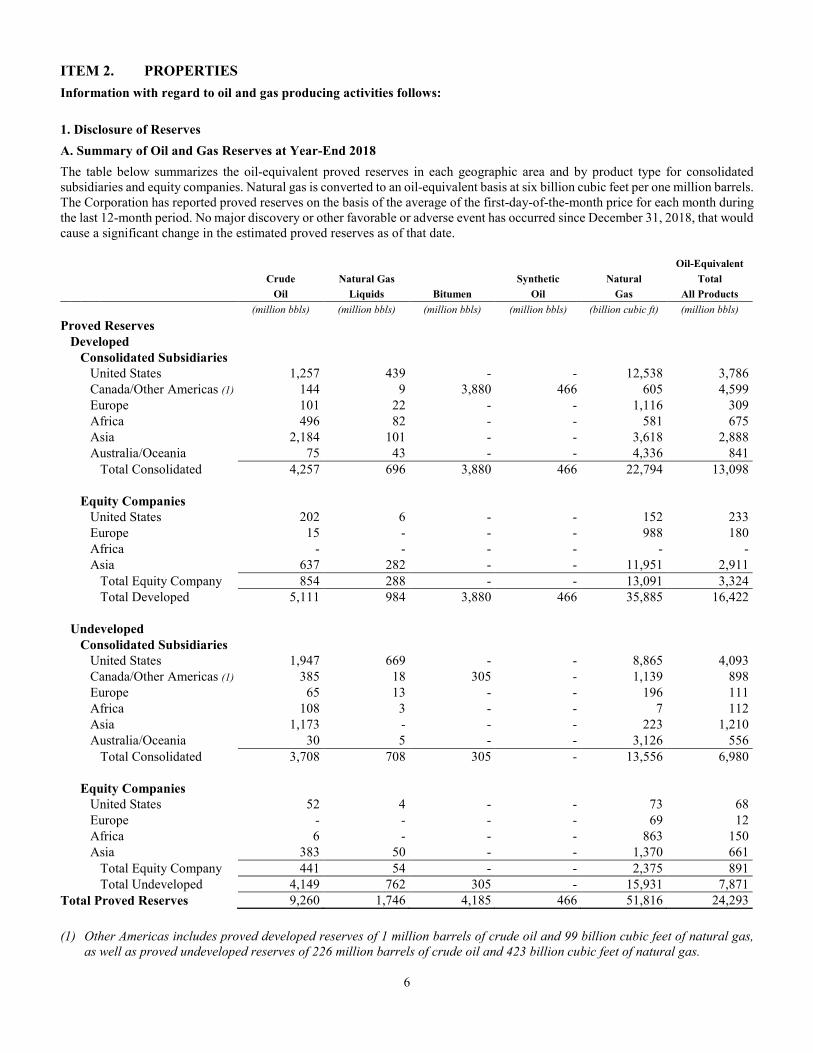
The table below summarizes the oil-equivalent proved reserves in each geographic area and by product type for consolidated subsidiaries and equity companies. Natural gas is converted to an oil-equivalent basis at six billion cubic feet per one million barrels. The Corporation has reported proved reserves on the basis of the average of the first-day-of-the-month price for each month during the last 12-month period. No major discovery or other favorable or adverse event has occurred since December 31, 2018, that would cause a significant change in the estimated proved reserves as of that date. Oil-Equivalent
Crude Natural Gas Synthetic Natural Total
Oil Liquids Bitumen Oil Gas All Products
(million bbls) (million bbls) (million bbls) (million bbls) (billion cubic ft) (million bbls)
Proved Reserves
Developed
Consolidated Subsidiaries
United States 1,257 439 - - 12,538 3,786
Canada/Other Americas (1) 144 9 3,880 466 605 4,599
Europe 101 22 - - 1,116 309
Africa 496 82 - - 581 675
Asia 2,184 101 - - 3,618 2,888
Australia/Oceania 75 43 - - 4,336 841
Total Consolidated 4,257 696 3,880 466 22,794 13,098
Equity Companies
United States 202 6 - - 152 233
Europe 15 - - - 988 180
Africa - - - - - -
Asia 637 282 - - 11,951 2,911
Total Equity Company 854 288 - - 13,091 3,324
Total Developed 5,111 984 3,880 466 35,885 16,422
Undeveloped
Consolidated Subsidiaries
United States 1,947 669 - - 8,865 4,093
Canada/Other Americas (1) 385 18 305 - 1,139 898
Europe 65 13 - - 196 111
Africa 108 3 - - 7 112
Asia 1,173 - - - 223 1,210
Australia/Oceania 30 5 - - 3,126 556
Total Consolidated 3,708 708 305 - 13,556 6,980
Equity Companies
United States 52 4 - - 73 68
Europe - - - - 69 12
Africa 6 - - - 863 150
Asia 383 50 - - 1,370 661
Total Equity Company 441 54 - - 2,375 891
Total Undeveloped 4,149 762 305 - 15,931 7,871
Total Proved Reserves 9,260 1,746 4,185 466 51,816 24,293
(1) Other Americas includes proved developed reserves of 1 million barrels of crude oil and 99 billion cubic feet of natural gas,
as well as proved undeveloped reserves of 226 million barrels of crude oil and 423 billion cubic feet of natural gas.
7
In the preceding reserves information, consolidated subsidiary and equity company reserves are reported separately. However, the Corporation operates its business with the same view of equity company reserves as it has for reserves from consolidated subsidiaries.
The Corporation anticipates several projects will come online over the next few years providing additional production capacity. However, actual volumes will vary from year to year due to the timing of individual project start-ups; operational outages; reservoir performance; performance of enhanced oil recovery projects; regulatory changes; the impact of fiscal and commercial terms; asset sales; weather events; price effects on production sharing contracts; changes in the amount and timing of capital investments that may vary depending on the oil and gas price environment; and other factors described in Item 1A. Risk Factors.
The estimation of proved reserves, which is based on the requirement of reasonable certainty, is an ongoing process based on rigorous technical evaluations, commercial and market assessments and detailed analysis of well and reservoir information such as flow rates and reservoir pressures. Furthermore, the Corporation only records proved reserves for projects which have received significant funding commitments by management made toward the development of the reserves. Although the Corporation is reasonably certain that proved reserves will be produced, the timing and amount recovered can be affected by a number of factors including completion of development projects, reservoir performance, regulatory approvals, government policies, consumer preferences, and significant changes in long-term oil and natural gas price levels. In addition, proved reserves could be affected by an extended period of low prices which could reduce the level of the Corporation’s capital spending and also impact our partners’ capacity to fund their share of joint projects.
B. Technologies Used in Establishing Proved Reserves Additions in 2018
Additions to ExxonMobil’s proved reserves in 2018 were based on estimates generated through the integration of available and
appropriate geological, engineering and production data, utilizing well-established technologies that have been demonstrated in the field to yield repeatable and consistent results.
Data used in these integrated assessments included information obtained directly from the subsurface via wellbores, such as well logs, reservoir core samples, fluid samples, static and dynamic pressure information, production test data, and surveillance and performance information. The data utilized also included subsurface information obtained through indirect measurements including high-quality 3-D and 4-D seismic data, calibrated with available well control information. The tools used to interpret the data included proprietary seismic processing software, proprietary reservoir modeling and simulation software, and commercially available data analysis packages.
In some circumstances, where appropriate analog reservoirs were available, reservoir parameters from these analogs were used to increase the quality of and confidence in the reserves estimates.
C. Qualifications of Reserves Technical Oversight Group and Internal Controls over Proved Reserves
ExxonMobil has a dedicated Global Reserves group that provides technical oversight and is separate from the operating organization. Primary responsibilities of this group include oversight of the reserves estimation process for compliance with Securities and Exchange Commission (SEC) rules and regulations, review of annual changes in reserves estimates, and the reporting of ExxonMobil’s proved reserves. This group also maintains the official company reserves estimates for ExxonMobil’s proved reserves of crude oil, natural gas liquids, bitumen, synthetic oil, and natural gas. In addition, the group provides training to personnel involved in the reserves estimation and reporting process within ExxonMobil and its affiliates. The Manager of the Global Reserves group has more than 25 years of experience in reservoir engineering and reserves assessment, has a degree in Engineering and currently serves on the Oil and Gas Reserves Committee of the Society of Petroleum Engineers (SPE). The group is staffed with individuals that have an average of more than 20 years of technical experience in the petroleum industry, including expertise in the classification and categorization of reserves under the SEC guidelines. This group includes individuals who hold advanced degrees in either Engineering or Geology.
The Global Reserves group maintains a central database containing the official company reserves estimates. Appropriate controls, including limitations on database access and update capabilities, are in place to ensure data integrity within this central database. An annual review of the system’s controls is performed by internal audit. Key components of the reserves estimation process include technical evaluations and analysis of well and field performance and a rigorous peer review. No changes may be made to the reserves estimates in the central database, including additions of any new initial reserves estimates or subsequent revisions, unless these changes have been thoroughly reviewed and evaluated by duly authorized personnel within the operating organization. In addition, changes to reserves estimates that exceed certain thresholds require further review and approval of the appropriate level of management within the operating organization before the changes may be made in the central database. Endorsement by the Global Reserves group for all proved reserves changes is a mandatory component of this review process. After all changes are made, reviews are held with senior management for final endorsement.
8
2. Proved Undeveloped Reserves
At year-end 2018, approximately 7.9 billion oil-equivalent barrels (GOEB) of ExxonMobil’s proved reserves were classified as proved undeveloped. This represents 32 percent of the 24.3 GOEB reported in proved reserves. This compares to the 7.3 GOEB of proved undeveloped reserves reported at the end of 2017. During the year, ExxonMobil conducted development activities that resulted in the transfer of approximately 0.8 GOEB from proved undeveloped to proved developed reserves by year end. The largest transfers were related to drilling activity in the United States, the United Arab Emirates, Canada, and Russia. During 2018, extensions and discoveries, primarily in the United States resulted in an addition of approximately 1.7 GOEB of proved undeveloped reserves. Also, the Corporation reclassified approximately 0.3 GOEB of proved undeveloped reserves which no longer met the SEC definition of proved reserves, primarily in the Netherlands at the Groningen gas field and the United States.
Overall, investments of $13.2 billion were made by the Corporation during 2018 to progress the development of reported proved undeveloped reserves, including $13.1 billion for oil and gas producing activities and additional investments for other non-oil and gas producing activities such as the construction of support infrastructure and other related facilities. These investments represented 65 percent of the $20.2 billion in total reported Upstream capital and exploration expenditures.
One of ExxonMobil’s requirements for reporting proved reserves is that management has made significant funding commitments toward the development of the reserves. ExxonMobil has a disciplined investment strategy and many major fields require long lead-time in order to be developed. Development projects typically take several years from the time of recording proved undeveloped reserves to the start of production and can exceed five years for large and complex projects. Proved undeveloped reserves in the United States, Canada, Australia, and Kazakhstan have remained undeveloped for five years or more primarily due to constraints on the capacity of infrastructure, as well as the time required to complete development for very large projects. The Corporation is reasonably certain that these proved reserves will be produced; however, the timing and amount recovered can be affected by a number of factors including completion of development projects, reservoir performance, regulatory approvals, government policies, consumer preferences, the pace of co-venturer/government funding, changes in the amount and timing of capital investments, and significant changes in long-term oil and natural gas price levels. Of the proved undeveloped reserves that have been reported for five or more years, over 80 percent are contained in the aforementioned countries. In Canada, proved undeveloped reserves are related to drilling activities in the offshore Hebron field and onshore Cold Lake operations. In Australia, proved undeveloped reserves are associated with future compression for the Gorgon Jansz LNG project. In Kazakhstan, the proved undeveloped reserves are related to the remainder of the initial development of the producing offshore Kashagan field which is included in the North Caspian Production Sharing Agreement and the Tengizchevroil joint venture which includes a production license in the Tengiz – Korolev field complex. The Tengizchevroil joint venture is producing, and proved undeveloped reserves will continue to move to proved developed as approved development phases progress.
9
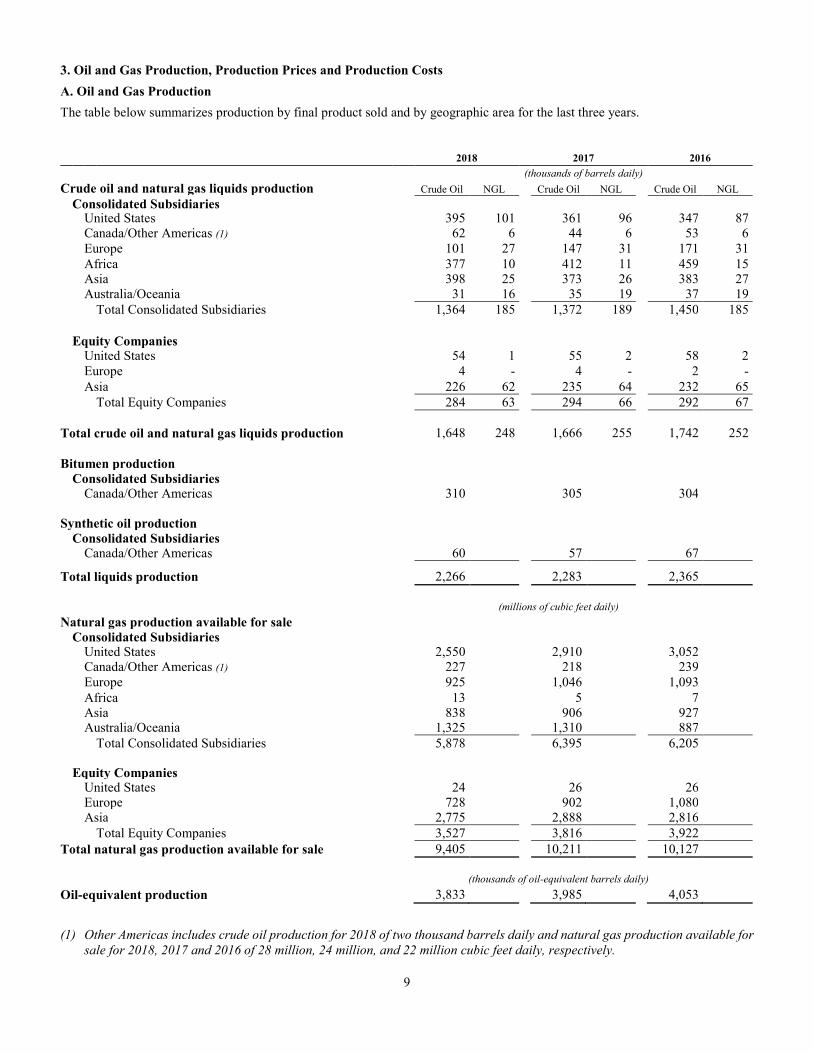
3. Oil and Gas Production, Production Prices and Production Costs
A. Oil and Gas Production
The table below summarizes production by final product sold and by geographic area for the last three years. 2018 2017 2016
(thousands of barrels daily)
Crude oil and natural gas liquids production Crude Oil NGL Crude Oil NGL Crude Oil NGL
Consolidated Subsidiaries United States 395 101 361 96 347 87 Canada/Other Americas (1) 62 6 44 6 53 6
Europe 101 27 147 31 171 31
Africa 377 10 412 11 459 15 Asia 398 25 373 26 383 27 Australia/Oceania 31 16 35 19 37 19
Total Consolidated Subsidiaries 1,364 185 1,372 189 1,450 185
Equity Companies United States 54 1 55 2 58 2
Europe 4 - 4 - 2 -
Asia 226 62 235 64 232 65
Total Equity Companies 284 63 294 66 292 67
Total crude oil and natural gas liquids production 1,648 248 1,666 255 1,742 252
Bitumen production Consolidated Subsidiaries Canada/Other Americas 310 305 304 Synthetic oil production Consolidated Subsidiaries Canada/Other Americas 60 57 67
Total liquids production 2,266 2,283 2,365
(millions of cubic feet daily) Natural gas production available for sale Consolidated Subsidiaries United States 2,550 2,910 3,052 Canada/Other Americas (1) 227 218 239
Europe 925 1,046 1,093
Africa 13 5 7 Asia 838 906 927 Australia/Oceania 1,325 1,310 887
Total Consolidated Subsidiaries 5,878 6,395 6,205 Equity Companies United States 24 26 26 Europe 728 902 1,080 Asia 2,775 2,888 2,816
Total Equity Companies 3,527 3,816 3,922
Total natural gas production available for sale 9,405 10,211 10,127
(thousands of oil-equivalent barrels daily)
Oil-equivalent production 3,833 3,985 4,053
(1) Other Americas includes crude oil production for 2018 of two thousand barrels daily and natural gas production available for
sale for 2018, 2017 and 2016 of 28 million, 24 million, and 22 million cubic feet daily, respectively.
10
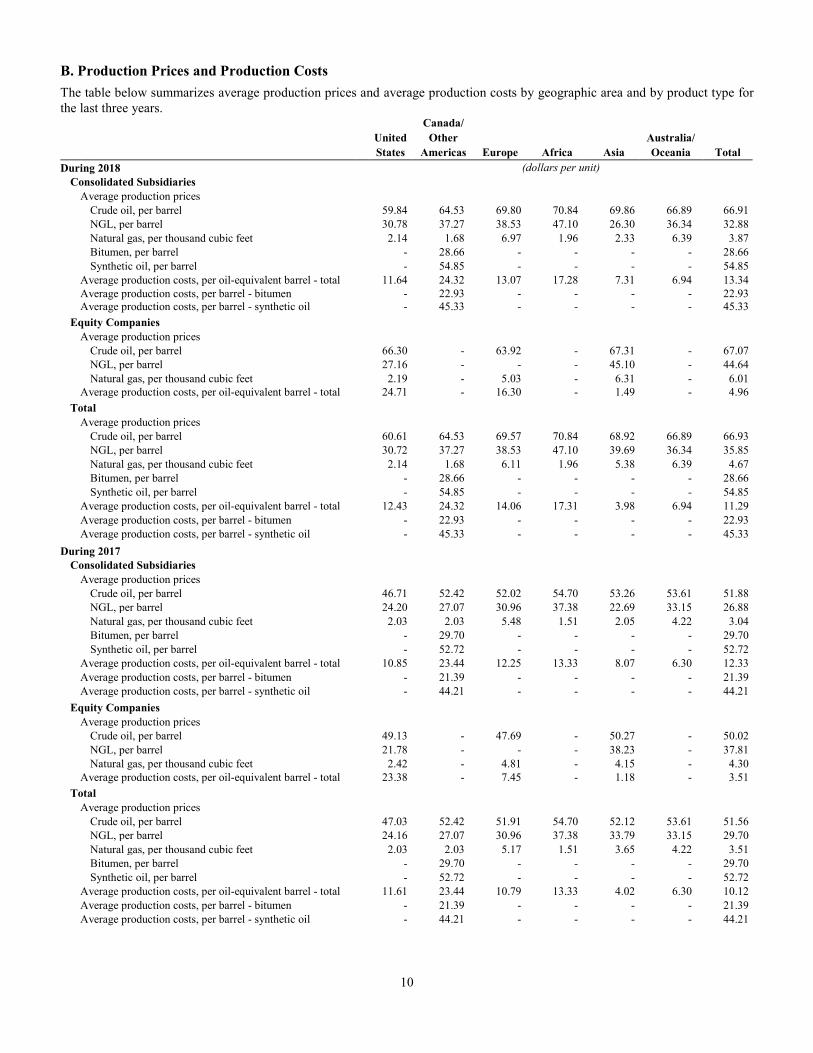
B. Production Prices and Production Costs
The table below summarizes average production prices and average production costs by geographic area and by product type for
the last three years.
Canada/
United Other Australia/
States Americas Europe Africa Asia Oceania Total
During 2018 (dollars per unit)
Consolidated Subsidiaries
Average production prices
Crude oil, per barrel 59.84 64.53 69.80 70.84 69.86 66.89 66.91
NGL, per barrel 30.78 37.27 38.53 47.10 26.30 36.34 32.88
Natural gas, per thousand cubic feet 2.14 1.68 6.97 1.96 2.33 6.39 3.87
Bitumen, per barrel - 28.66 - - - - 28.66
Synthetic oil, per barrel - 54.85 - - - - 54.85
Average production costs, per oil-equivalent barrel - total 11.64 24.32 13.07 17.28 7.31 6.94 13.34
Average production costs, per barrel - bitumen - 22.93 - - - - 22.93
Average production costs, per barrel - synthetic oil - 45.33 - - - - 45.33 Equity Companies
Average production prices
Crude oil, per barrel 66.30 - 63.92 - 67.31 - 67.07
NGL, per barrel 27.16 - - - 45.10 - 44.64
Natural gas, per thousand cubic feet 2.19 - 5.03 - 6.31 - 6.01
Average production costs, per oil-equivalent barrel - total 24.71 - 16.30 - 1.49 - 4.96 Total
Average production prices
Crude oil, per barrel 60.61 64.53 69.57 70.84 68.92 66.89 66.93
NGL, per barrel 30.72 37.27 38.53 47.10 39.69 36.34 35.85
Natural gas, per thousand cubic feet 2.14 1.68 6.11 1.96 5.38 6.39 4.67
Bitumen, per barrel - 28.66 - - - - 28.66
Synthetic oil, per barrel - 54.85 - - - - 54.85
Average production costs, per oil-equivalent barrel - total 12.43 24.32 14.06 17.31 3.98 6.94 11.29
Average production costs, per barrel - bitumen - 22.93 - - - - 22.93
Average production costs, per barrel - synthetic oil - 45.33 - - - - 45.33
During 2017
Consolidated Subsidiaries
Average production prices
Crude oil, per barrel 46.71 52.42 52.02 54.70 53.26 53.61 51.88
NGL, per barrel 24.20 27.07 30.96 37.38 22.69 33.15 26.88
Natural gas, per thousand cubic feet 2.03 2.03 5.48 1.51 2.05 4.22 3.04
Bitumen, per barrel - 29.70 - - - - 29.70
Synthetic oil, per barrel - 52.72 - - - - 52.72
Average production costs, per oil-equivalent barrel - total 10.85 23.44 12.25 13.33 8.07 6.30 12.33
Average production costs, per barrel - bitumen - 21.39 - - - - 21.39
Average production costs, per barrel - synthetic oil - 44.21 - - - - 44.21
Equity Companies
Average production prices
Crude oil, per barrel 49.13 - 47.69 - 50.27 - 50.02
NGL, per barrel 21.78 - - - 38.23 - 37.81
Natural gas, per thousand cubic feet 2.42 - 4.81 - 4.15 - 4.30
Average production costs, per oil-equivalent barrel - total 23.38 - 7.45 - 1.18 - 3.51 Total
Average production prices
Crude oil, per barrel 47.03 52.42 51.91 54.70 52.12 53.61 51.56
NGL, per barrel 24.16 27.07 30.96 37.38 33.79 33.15 29.70
Natural gas, per thousand cubic feet 2.03 2.03 5.17 1.51 3.65 4.22 3.51
Bitumen, per barrel - 29.70 - - - - 29.70
Synthetic oil, per barrel - 52.72 - - - - 52.72
Average production costs, per oil-equivalent barrel - total 11.61 23.44 10.79 13.33 4.02 6.30 10.12
Average production costs, per barrel - bitumen - 21.39 - - - - 21.39
Average production costs, per barrel - synthetic oil - 44.21 - - - - 44.21
11
Canada/
United Other Australia/
States Americas Europe Africa Asia Oceania Total
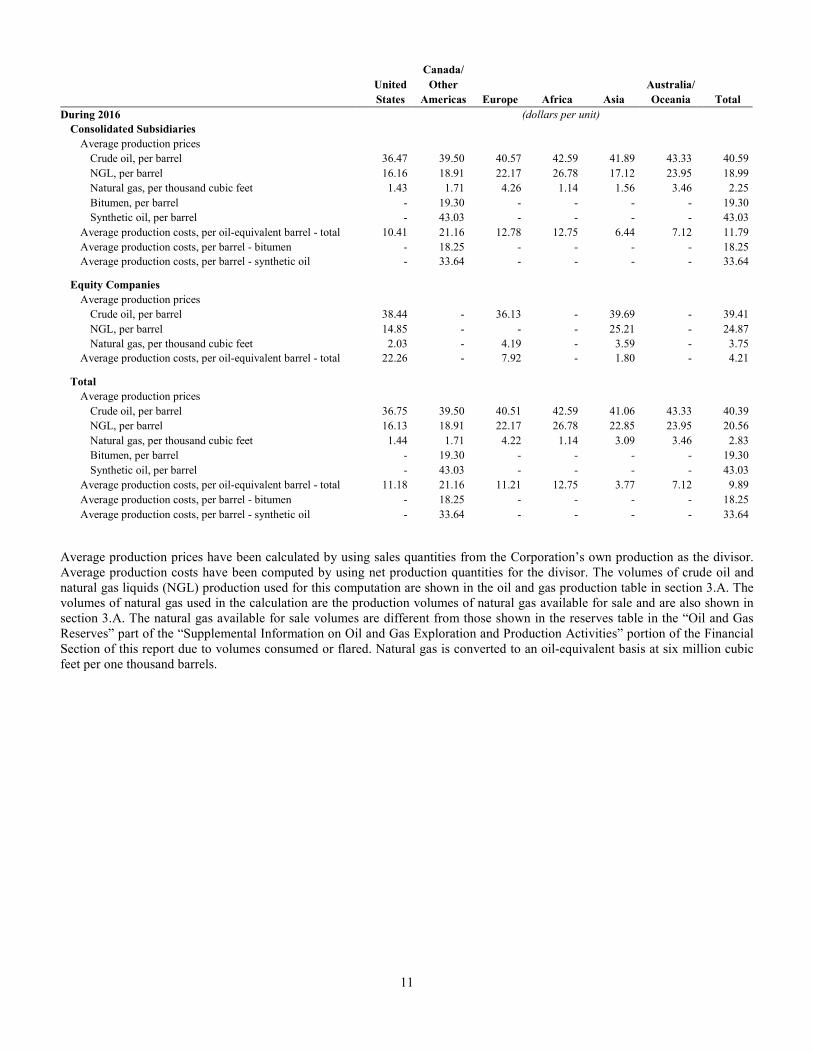
During 2016 (dollars per unit)
Consolidated Subsidiaries
Average production prices
Crude oil, per barrel 36.47 39.50 40.57 42.59 41.89 43.33 40.59
NGL, per barrel 16.16 18.91 22.17 26.78 17.12 23.95 18.99
Natural gas, per thousand cubic feet 1.43 1.71 4.26 1.14 1.56 3.46 2.25
Bitumen, per barrel - 19.30 - - - - 19.30
Synthetic oil, per barrel - 43.03 - - - - 43.03
Average production costs, per oil-equivalent barrel - total 10.41 21.16 12.78 12.75 6.44 7.12 11.79
Average production costs, per barrel - bitumen - 18.25 - - - - 18.25
Average production costs, per barrel - synthetic oil - 33.64 - - - - 33.64
Equity Companies
Average production prices
Crude oil, per barrel 38.44 - 36.13 - 39.69 - 39.41
NGL, per barrel 14.85 - - - 25.21 - 24.87
Natural gas, per thousand cubic feet 2.03 - 4.19 - 3.59 - 3.75
Average production costs, per oil-equivalent barrel - total 22.26 - 7.92 - 1.80 - 4.21
Total
Average production prices
Crude oil, per barrel 36.75 39.50 40.51 42.59 41.06 43.33 40.39
NGL, per barrel 16.13 18.91 22.17 26.78 22.85 23.95 20.56
Natural gas, per thousand cubic feet 1.44 1.71 4.22 1.14 3.09 3.46 2.83
Bitumen, per barrel - 19.30 - - - - 19.30
Synthetic oil, per barrel - 43.03 - - - - 43.03
Average production costs, per oil-equivalent barrel - total 11.18 21.16 11.21 12.75 3.77 7.12 9.89
Average production costs, per barrel - bitumen - 18.25 - - - - 18.25
Average production costs, per barrel - synthetic oil - 33.64 - - - - 33.64
Average production prices have been calculated by using sales quantities from the Corporation’s own production as the divisor. Average production costs have been computed by using net production quantities for the divisor. The volumes of crude oil and natural gas liquids (NGL) production used for this computation are shown in the oil and gas production table in section 3.A. The volumes of natural gas used in the calculation are the production volumes of natural gas available for sale and are also shown in section 3.A. The natural gas available for sale volumes are different from those shown in the reserves table in the “Oil and Gas Reserves” part of the “Supplemental Information on Oil and Gas Exploration and Production Activities” portion of the Financial Section of this report due to volumes consumed or flared. Natural gas is converted to an oil-equivalent basis at six million cubic feet per one thousand barrels.
12
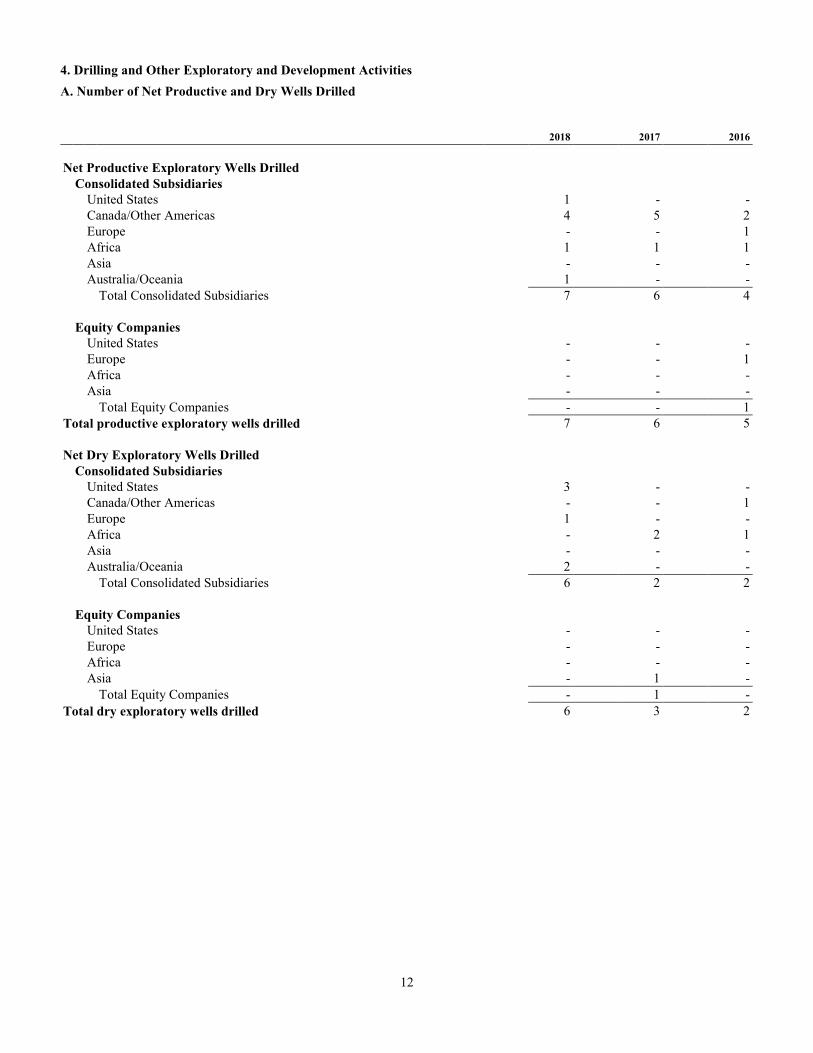
4. Drilling and Other Exploratory and Development Activities
A. Number of Net Productive and Dry Wells Drilled 2018 2017 2016
Net Productive Exploratory Wells Drilled
Consolidated Subsidiaries
United States 1 - -
Canada/Other Americas 4 5 2
Europe - - 1
Africa 1 1 1
Asia - - -
Australia/Oceania 1 - -
Total Consolidated Subsidiaries 7 6 4
Equity Companies
United States - - -
Europe - - 1
Africa - - -
Asia - - -
Total Equity Companies - - 1
Total productive exploratory wells drilled 7 6 5
Net Dry Exploratory Wells Drilled
Consolidated Subsidiaries
United States 3 - -
Canada/Other Americas - - 1
Europe 1 - -
Africa - 2 1
Asia - - -
Australia/Oceania 2 - -
Total Consolidated Subsidiaries 6 2 2
Equity Companies
United States - - -
Europe - - -
Africa - - -
Asia - 1 -
Total Equity Companies - 1 -
Total dry exploratory wells drilled 6 3 2
13
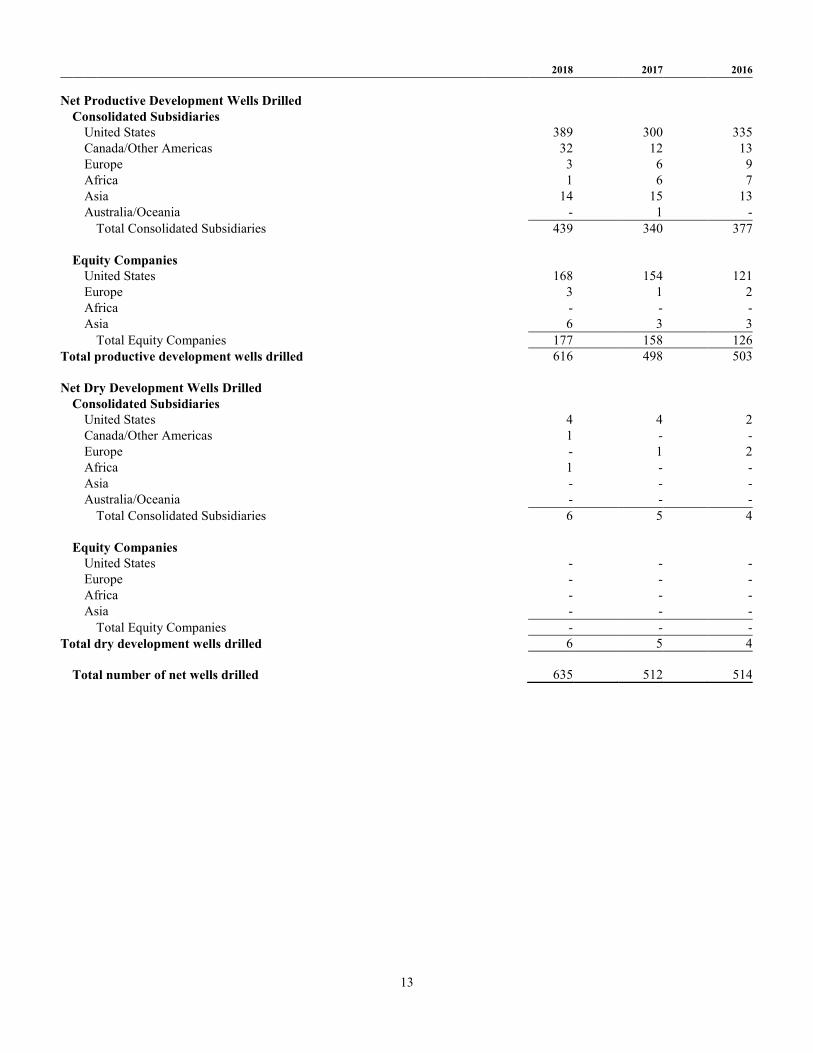
2018 2017 2016
Net Productive Development Wells Drilled
Consolidated Subsidiaries
United States 389 300 335
Canada/Other Americas 32 12 13
Europe 3 6 9
Africa 1 6 7
Asia 14 15 13
Australia/Oceania - 1 -
Total Consolidated Subsidiaries 439 340 377
Equity Companies
United States 168 154 121
Europe 3 1 2
Africa - - -
Asia 6 3 3
Total Equity Companies 177 158 126
Total productive development wells drilled 616 498 503
Net Dry Development Wells Drilled
Consolidated Subsidiaries
United States 4 4 2
Canada/Other Americas 1 - -
Europe - 1 2
Africa 1 - -
Asia - - -
Australia/Oceania - - -
Total Consolidated Subsidiaries 6 5 4
Equity Companies
United States - - -
Europe - - -
Africa - - -
Asia - - -
Total Equity Companies - - -
Total dry development wells drilled 6 5 4
Total number of net wells drilled 635 512 514
14
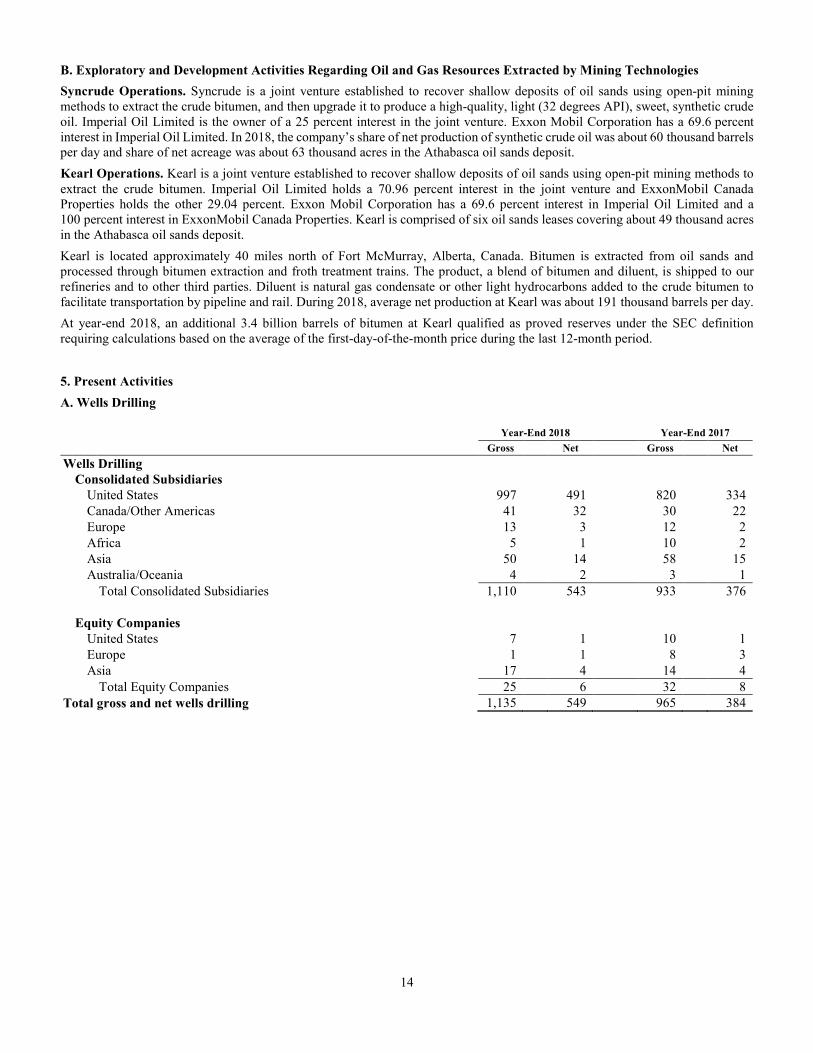
B. Exploratory and Development Activities Regarding Oil and Gas Resources Extracted by Mining Technologies
Syncrude Operations. Syncrude is a joint venture established to recover shallow deposits of oil sands using open-pit mining methods to extract the crude bitumen, and then upgrade it to produce a high-quality, light (32 degrees API), sweet, synthetic crude oil. Imperial Oil Limited is the owner of a 25 percent interest in the joint venture. Exxon Mobil Corporation has a 69.6 percent interest in Imperial Oil Limited. In 2018, the company’s share of net production of synthetic crude oil was about 60 thousand barrels per day and share of net acreage was about 63 thousand acres in the Athabasca oil sands deposit.
Kearl Operations. Kearl is a joint venture established to recover shallow deposits of oil sands using open-pit mining methods to
extract the crude bitumen. Imperial Oil Limited holds a 70.96 percent interest in the joint venture and ExxonMobil Canada Properties holds the other 29.04 percent. Exxon Mobil Corporation has a 69.6 percent interest in Imperial Oil Limited and a 100 percent interest in ExxonMobil Canada Properties. Kearl is comprised of six oil sands leases covering about 49 thousand acres in the Athabasca oil sands deposit.
Kearl is located approximately 40 miles north of Fort McMurray, Alberta, Canada. Bitumen is extracted from oil sands and processed through bitumen extraction and froth treatment trains. The product, a blend of bitumen and diluent, is shipped to our refineries and to other third parties. Diluent is natural gas condensate or other light hydrocarbons added to the crude bitumen to facilitate transportation by pipeline and rail. During 2018, average net production at Kearl was about 191 thousand barrels per day.
At year-end 2018, an additional 3.4 billion barrels of bitumen at Kearl qualified as proved reserves under the SEC definition requiring calculations based on the average of the first-day-of-the-month price during the last 12-month period.
5. Present Activities
A. Wells Drilling
Year-End 2018 Year-End 2017
Gross Net Gross Net
Wells Drilling
Consolidated Subsidiaries
United States 997 491 820 334
Canada/Other Americas 41 32 30 22
Europe 13 3 12 2
Africa 5 1 10 2
Asia 50 14 58 15
Australia/Oceania 4 2 3 1
Total Consolidated Subsidiaries 1,110 543 933 376
Equity Companies
United States 7 1 10 1
Europe 1 1 8 3
Asia 17 4 14 4
Total Equity Companies 25 6 32 8
Total gross and net wells drilling 1,135 549 965 384
15
B. Review of Principal Ongoing Activities
UNITED STATES
ExxonMobil’s year-end 2018 acreage holdings totaled 12.1 million net acres, of which 0.8 million net acres were offshore. ExxonMobil was active in areas onshore and offshore in the lower 48 states and in Alaska.
During the year, 554.6 net exploration and development wells were completed in the inland lower 48 states. Development activities focused on liquids-rich opportunities in the onshore U.S., primarily in the Permian Basin of West Texas and New Mexico and the Bakken oil play in North Dakota. In addition, gas development activities continued in the Marcellus Shale of Pennsylvania and West Virginia, the Utica Shale of Ohio and the Haynesville Shale of East Texas and Louisiana.
ExxonMobil’s net acreage in the Gulf of Mexico at year-end 2018 was 0.7 million acres. A total of 3.5 net exploration and development wells were completed during the year.
Participation in Alaska production and development continued with a total of 7.3 net development wells completed.
CANADA / OTHER AMERICAS
Canada
Oil and Gas Operations: ExxonMobil’s year-end 2018 acreage holdings totaled 6.9 million net acres, of which 3.6 million net acres
were offshore. A total of 20.3 net development wells were completed during the year.
In Situ Bitumen Operations: ExxonMobil’s year-end 2018 in situ bitumen acreage holdings totaled 0.7 million net onshore acres. A total of 10 net development wells at Cold Lake were completed during the year.
Argentina
ExxonMobil’s net acreage totaled 0.3 million onshore acres at year-end 2018, and there were 3.6 net exploration and development wells completed during the year.
Guyana
ExxonMobil’s net acreage totaled 4.7 million offshore acres at year-end 2018, and there were 2.8 net exploration wells completed during the year. Development activities continued on the Liza Phase 1 project.
EUROPE
Germany
A total of 2.3 million net onshore acres were held by ExxonMobil at year-end 2018, with 0.1 net development well completed
during the year.
Netherlands
ExxonMobil’s net interest in licenses totaled approximately 1.4 million acres at year-end 2018, of which 1.1 million acres were onshore. A total of 2.9 net exploration and development wells were completed during the year. In 2018, the Dutch Cabinet notified Parliament of its intention to further reduce previously legislated Groningen gas extraction in response to seismic events over the last several years. Affiliates of the Corporation and their partners have actively been in discussions with the government on the associated implementation measures which resulted in a signed Heads of Agreement and the execution of additional implementation agreements.
Norway
ExxonMobil’s net interest in licenses at year-end 2018 totaled approximately 0.1 million acres, all offshore. A total of 2.7 net
development wells were completed in 2018.
United Kingdom
ExxonMobil’s net interest in licenses at year-end 2018 totaled approximately 0.6 million acres, all offshore. A total of 0.6 net development wells were completed during the year. Development activities continued on the Penguins Redevelopment project.
16
AFRICA
Angola
ExxonMobil’s net acreage totaled 0.2 million offshore acres at year-end 2018, with 2.0 net exploration and development wells completed during the year. On Block 32, development activities continued on the Kaombo Split Hub project as the Norte floating production storage and offloading (FPSO) vessel started up in 2018 and construction progressed on the Sul FPSO.
Chad
At year-end 2018, ExxonMobil’s net acreage holdings totaled 46 thousand onshore acres.
Equatorial Guinea
ExxonMobil’s acreage totaled 0.5 million net offshore acres at year-end 2018, with 0.8 net development well completed during the year. In 2018, ExxonMobil acquired deepwater acreage in Block EG-11.
Mozambique
ExxonMobil’s net acreage totaled approximately 2.6 million offshore acres at year-end 2018. ExxonMobil acquired an interest in offshore blocks Angoche A5-B, Zambezi Z5-C, and Zambezi Z5-D in December 2018. Development activities continued on the Coral South Floating LNG project during 2018.
Nigeria
ExxonMobil’s net acreage totaled 0.8 million offshore acres at year-end 2018, with 0.2 net development well completed during the year. In 2018, ExxonMobil relinquished approximately 0.3 million net acres offshore.
ASIA
Azerbaijan
At year-end 2018, ExxonMobil's net acreage totaled 7 thousand offshore acres. A total of 1.0 net development wells were completed during the year. The production sharing agreement (PSA) for the development of the Azeri-Chirag-Gunashli field was amended in September 2017 to extend the term by 25 years to 2049.
Indonesia
At year-end 2018, ExxonMobil had 0.1 million net acres onshore. The Kedung Keris project was funded in 2018.
Iraq
At year-end 2018, ExxonMobil’s onshore acreage was 0.1 million net acres. A total of 1.7 net development wells were completed
at the West Qurna Phase I oil field during the year. Oil field rehabilitation activities continued during 2018 and across the life of this project will include drilling of new wells, working over of existing wells, and optimization and debottlenecking of existing facilities. In the Kurdistan Region of Iraq, ExxonMobil has continued exploration activities.
Kazakhstan
ExxonMobil’s net acreage totaled 0.1 million acres onshore and 0.2 million acres offshore at year-end 2018. A total of 7.2 net
development wells were completed during 2018. Development activities continued on the Tengiz Expansion project.
Malaysia
ExxonMobil’s interests in production sharing contracts covered 2.4 million net acres offshore at year-end 2018. During the year, a total of 0.5 net development well was completed.
Qatar
Through our joint ventures with Qatar Petroleum, ExxonMobil’s net acreage totaled 65 thousand acres offshore at year-end 2018. ExxonMobil participated in 62.2 million tonnes per year gross liquefied natural gas capacity and 2.0 billion cubic feet per day of flowing gas capacity at year-end. Development activities continued on the Barzan project in 2018.
17
Russia
ExxonMobil’s net acreage holdings in Sakhalin at year-end 2018 were 85 thousand acres, all offshore. A total of 3.0 net development wells were completed.
ExxonMobil withdrew from the joint ventures with Rosneft for the Kara, Laptev, Chukchi and Black Seas and western Siberia,
effective April 30, 2018. ExxonMobil continues to remain in compliance with all laws applicable to its operations and investments in the Russian Federation.
Thailand
ExxonMobil’s net onshore acreage in Thailand concessions totaled 21 thousand acres at year-end 2018.
United Arab Emirates
ExxonMobil’s net acreage in the Abu Dhabi offshore Upper Zakum oil concession was 81 thousand acres at year-end 2018. A total of 6.7 net development wells were completed. During 2018, development activities continued on the Upper Zakum 750 project, and work progressed on the Upper Zakum 1MBD project.
AUSTRALIA / OCEANIA
Australia
ExxonMobil’s net acreage totaled 1.9 million acres offshore and 31 thousand acres onshore at year-end 2018. A total of 2.0 net exploration wells were completed during the year in the Bass Strait. The West Barracouta project was funded in 2018.
The co-venturer-operated Gorgon Jansz liquefied natural gas development consists of a subsea infrastructure for offshore production and transportation of the gas, a 15.6 million tonnes per year liquefied natural gas facility and a 280 million cubic feet per day domestic gas plant located on Barrow Island, Western Australia. The Gorgon Stage Two project was funded in 2018.
Papua New Guinea
A total of 9.9 million net acres were held by ExxonMobil at year-end 2018, of which 5.4 million net acres were offshore. A total of
0.5 net exploration well was completed during the year. The Papua New Guinea (PNG) liquefied natural gas integrated development includes gas production and processing facilities in the southern PNG Highlands, onshore and offshore pipelines, and a 6.9 million tonnes per year liquefied natural gas facility near Port Moresby. During 2018, operations were temporarily interrupted following a magnitude 7.5 earthquake.
WORLDWIDE EXPLORATION
At year-end 2018, exploration activities were under way in several areas in which ExxonMobil has no established production
operations and thus are not included above. A total of 28.4 million net acres were held at year-end 2018 and 1.4 net exploration wells were completed during the year in these countries.
6. Delivery Commitments
ExxonMobil sells crude oil and natural gas from its producing operations under a variety of contractual obligations, some of which may specify the delivery of a fixed and determinable quantity for periods longer than one year. ExxonMobil also enters into natural gas sales contracts where the source of the natural gas used to fulfill the contract can be a combination of our own production and the spot market. Worldwide, we are contractually committed to deliver approximately 57 million barrels of oil and 2,400 billion cubic feet of natural gas for the period from 2019 through 2021. We expect to fulfill the majority of these delivery commitments with production from our proved developed reserves. Any remaining commitments will be fulfilled with production from our proved undeveloped reserves and spot market purchases as necessary.
18
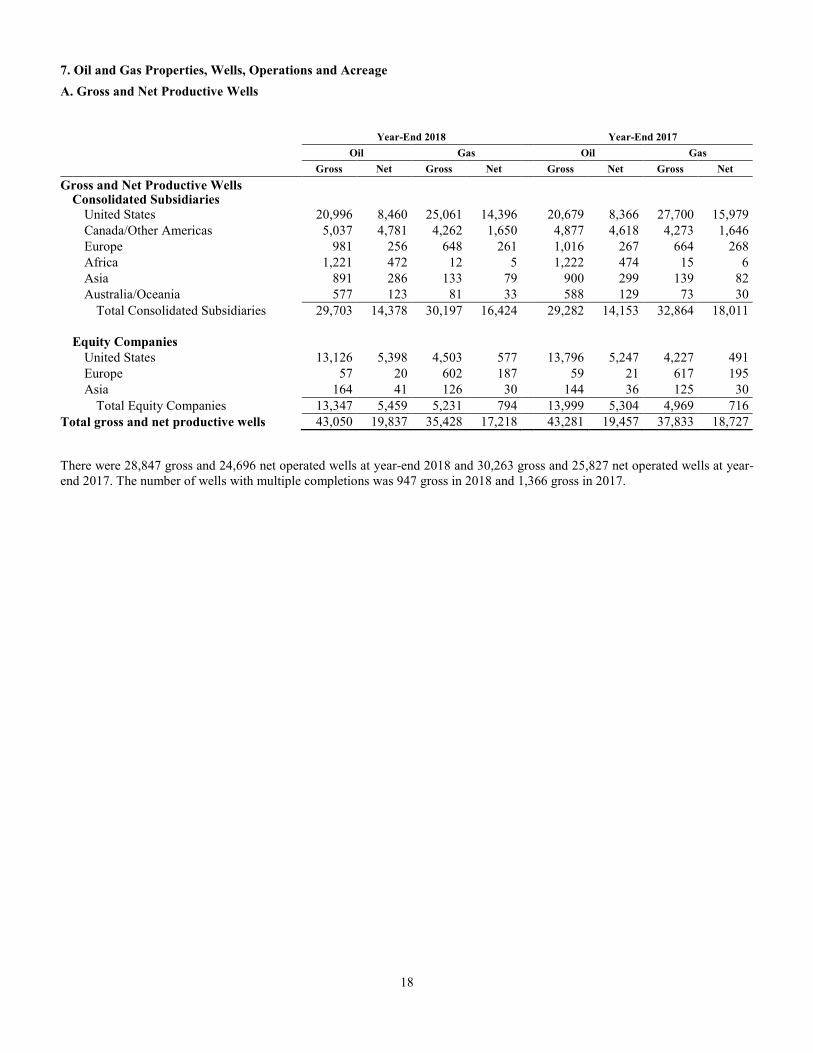
7. Oil and Gas Properties, Wells, Operations and Acreage
A. Gross and Net Productive Wells Year-End 2018 Year-End 2017
Oil Gas Oil Gas
Gross Net Gross Net Gross Net Gross Net
Gross and Net Productive Wells Consolidated Subsidiaries
United States 20,996 8,460 25,061 14,396 20,679 8,366 27,700 15,979
Canada/Other Americas 5,037 4,781 4,262 1,650 4,877 4,618 4,273 1,646
Europe 981 256 648 261 1,016 267 664 268
Africa 1,221 472 12 5 1,222 474 15 6
Asia 891 286 133 79 900 299 139 82
Australia/Oceania 577 123 81 33 588 129 73 30
Total Consolidated Subsidiaries 29,703 14,378 30,197 16,424 29,282 14,153 32,864 18,011
Equity Companies
United States 13,126 5,398 4,503 577 13,796 5,247 4,227 491
Europe 57 20 602 187 59 21 617 195
Asia 164 41 126 30 144 36 125 30
Total Equity Companies 13,347 5,459 5,231 794 13,999 5,304 4,969 716
Total gross and net productive wells 43,050 19,837 35,428 17,218 43,281 19,457 37,833 18,727
There were 28,847 gross and 24,696 net operated wells at year-end 2018 and 30,263 gross and 25,827 net operated wells at year-end 2017. The number of wells with multiple completions was 947 gross in 2018 and 1,366 gross in 2017.
19
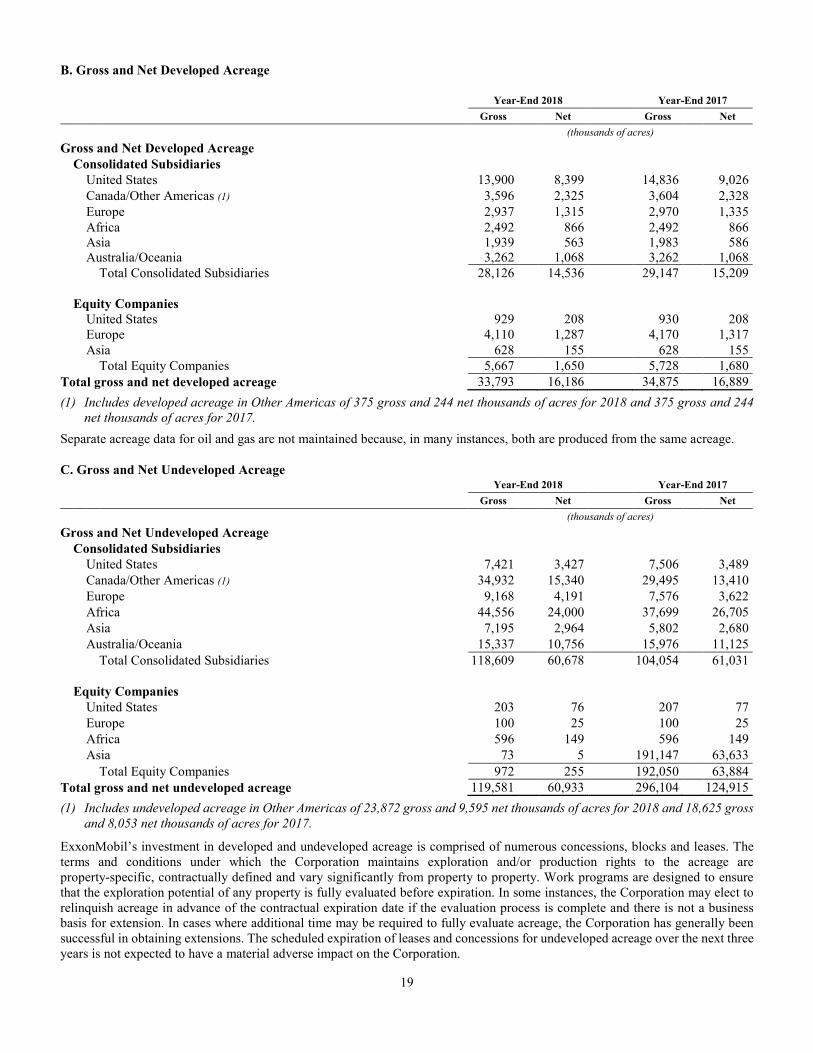
B. Gross and Net Developed Acreage Year-End 2018 Year-End 2017
Gross Net Gross Net
(thousands of acres)
Gross and Net Developed Acreage
Consolidated Subsidiaries
United States 13,900 8,399 14,836 9,026
Canada/Other Americas (1) 3,596 2,325 3,604 2,328
Europe 2,937 1,315 2,970 1,335
Africa 2,492 866 2,492 866 Asia 1,939 563 1,983 586 Australia/Oceania 3,262 1,068 3,262 1,068
Total Consolidated Subsidiaries 28,126 14,536 29,147 15,209
Equity Companies
United States 929 208 930 208
Europe 4,110 1,287 4,170 1,317
Asia 628 155 628 155
Total Equity Companies 5,667 1,650 5,728 1,680
Total gross and net developed acreage 33,793 16,186 34,875 16,889
(1) Includes developed acreage in Other Americas of 375 gross and 244 net thousands of acres for 2018 and 375 gross and 244
net thousands of acres for 2017.
Separate acreage data for oil and gas are not maintained because, in many instances, both are produced from the same acreage.
C. Gross and Net Undeveloped Acreage
Year-End 2018 Year-End 2017
Gross Net Gross Net
(thousands of acres)
Gross and Net Undeveloped Acreage
Consolidated Subsidiaries
United States 7,421 3,427 7,506 3,489
Canada/Other Americas (1) 34,932 15,340 29,495 13,410
Europe 9,168 4,191 7,576 3,622
Africa 44,556 24,000 37,699 26,705
Asia 7,195 2,964 5,802 2,680
Australia/Oceania 15,337 10,756 15,976 11,125
Total Consolidated Subsidiaries 118,609 60,678 104,054 61,031
Equity Companies
United States 203 76 207 77
Europe 100 25 100 25
Africa 596 149 596 149
Asia 73 5 191,147 63,633
Total Equity Companies 972 255 192,050 63,884
Total gross and net undeveloped acreage 119,581 60,933 296,104 124,915
(1) Includes undeveloped acreage in Other Americas of 23,872 gross and 9,595 net thousands of acres for 2018 and 18,625 gross
and 8,053 net thousands of acres for 2017.
ExxonMobil’s investment in developed and undeveloped acreage is comprised of numerous concessions, blocks and leases. The terms and conditions under which the Corporation maintains exploration and/or production rights to the acreage are property-specific, contractually defined and vary significantly from property to property. Work programs are designed to ensure that the exploration potential of any property is fully evaluated before expiration. In some instances, the Corporation may elect to relinquish acreage in advance of the contractual expiration date if the evaluation process is complete and there is not a business basis for extension. In cases where additional time may be required to fully evaluate acreage, the Corporation has generally been successful in obtaining extensions. The scheduled expiration of leases and concessions for undeveloped acreage over the next three years is not expected to have a material adverse impact on the Corporation.
20
D. Summary of Acreage Terms
UNITED STATES
Oil and gas exploration and production rights are acquired from mineral interest owners through a lease. Mineral interest owners include the Federal and State governments, as well as private mineral interest owners. Leases typically have an exploration period ranging from one to ten years, and a production period that normally remains in effect until production ceases. Under certain circumstances, a lease may be held beyond its exploration term even if production has not commenced. In some instances regarding private property, a “fee interest” is acquired where the underlying mineral interests are owned outright.
CANADA / OTHER AMERICAS
Canada
Exploration licenses or leases in onshore areas are acquired for varying periods of time with renewals or extensions possible. These licenses or leases entitle the holder to continue existing licenses or leases upon completing specified work. In general, these license and lease agreements are held as long as there is proven production capability on the licenses and leases. Exploration licenses in offshore eastern Canada and the Beaufort Sea are held by work commitments of various amounts and rentals. They are valid for a maximum term of nine years. Offshore production licenses are valid for 25 years, with rights of extension for continued production. Significant discovery licenses in the offshore, relating to currently undeveloped discoveries, do not have a definite term.
Argentina
The Federal Hydrocarbon Law was amended in December 2014. The onshore concession terms granted prior to the amendment are up to six years, divided into three potential exploration periods, with an optional extension for up to one year depending on the classification of the area. Pursuant to the amended law, the production term for a conventional production concession would be 25 years, and 35 years for an unconventional concession, with unlimited ten-year extensions possible, once a field has been developed.
Guyana
The Petroleum (Exploration and Production) Act authorizes the government of Guyana to grant petroleum prospecting and production licenses and to enter into petroleum agreements for the exploration and production of hydrocarbons. Petroleum agreements provide for an exploration period of up to 10 years with a production period of 20 years with a 10 year extension.
EUROPE
Germany
Exploration concessions are granted for an initial maximum period of five years, with an unlimited number of extensions of up to three years each. Extensions are subject to specific, minimum work commitments. Production licenses are normally granted for 20 to 25 years with multiple possible extensions as long as there is production on the license.
Netherlands
Under the Mining Law, effective January 1, 2003, exploration and production licenses for both onshore and offshore areas are issued for a period as explicitly defined in the license. The term is based on the period of time necessary to perform the activities for which the license is issued. License conditions are stipulated in the license and are based on the Mining Law.
Production rights granted prior to January 1, 2003, remain subject to their existing terms, and differ slightly for onshore and offshore areas. Onshore production licenses issued prior to 1988 were indefinite; from 1988 they were issued for a period as explicitly defined in the license, ranging from 35 to 45 years. Offshore production licenses issued before 1976 were issued for a fixed period of 40 years; from 1976 they were again issued for a period as explicitly defined in the license, ranging from 15 to 40 years.
Norway
Licenses issued between 1972 and 1997 were for an initial period of up to six years (with extension of the initial period of one year at a time up to ten years after 1985), and an extension period of up to 30 years, with relinquishment of at least one-half of the original area required at the end of the initial period. Licenses issued after July 1, 1997, have an initial period of up to ten years and a normal extension period of up to 30 years or in special cases of up to 50 years, and with relinquishment of at least one-half of the original area required at the end of the initial period.
21
United Kingdom
Acreage terms are fixed by the government and are periodically changed. For example, many of the early licenses issued under the first four licensing rounds provided for an initial term of six years with relinquishment of at least one-half of the original area at the end of the initial term, subject to extension for a further 40 years. At the end of any such 40-year term, licenses may continue in producing areas until cessation of production; or licenses may continue in development areas for periods agreed on a case-by-case basis until they become producing areas; or licenses terminate in all other areas. The majority of traditional licenses currently issued have an initial exploration term of four years with a second term extension of four years, and a final production term of 18 years, with a mandatory relinquishment of 50 percent of the acreage after the initial term and of all acreage that is not covered by a development plan at the end of the second term.
Terms for exploration acreage in technically challenged areas are governed by frontier production licenses, generally covering a larger initial area than traditional licenses, with an initial exploration term of six or nine years with a second term extension of six years, and a final production term of 18 years, with relinquishment of 75 percent of the original area after three years and 50 percent of the remaining acreage after the next three years. Innovate licenses issued replace traditional and frontier licenses and offer greater flexibility with respect to periods and work program commitments.
AFRICA
Angola
Exploration and production activities are governed by production sharing agreements with an initial exploration term of four years and an optional second phase of two to three years. The production period is 25 years, and agreements generally provide for a negotiated extension.
Chad
Exploration permits are issued for a period of five years, and are renewable for one or two further five-year periods. The terms and conditions of the permits, including relinquishment obligations, are specified in a negotiated convention. The production term is 30 years and in 2017 was extended by 20 years to 2050.
Equatorial Guinea
Exploration, development and production activities are governed by production sharing contracts (PSCs) negotiated with the State Ministry of Mines and Hydrocarbons. A new PSC was ratified in 2018; the initial exploration period is five years for oil and gas, with multi-year extensions available at the discretion of the Ministry and limited relinquishments in the absence of commercial discoveries. The production period for crude oil ranges from 25 to 30 years, while the production period for natural gas ranges from 25 to 50 years.
Mozambique
Exploration and production activities are generally governed by concession contracts with the Government of the Republic of Mozambique, represented by the Ministry of Mineral Resources and Energy. An interest in Area 4 offshore Mozambique was acquired in 2017. Terms for Area 4 are governed by the Exploration and Production Concession Contract (EPCC) for Area 4 Offshore of the Rovuma Block. The EPCC expires 30 years after the approval of a plan of development for a given discovery area.
In 2018 an interest was acquired in offshore blocks, A5-B, Z5-C and Z5-D. Terms for the three blocks are governed by their respective EPCCs, which have an initial exploration phase that expires in 2022 with the possibility of two additional exploration phases expiring in 2024 and 2025. The EPCCs provide a development and production period that expires 30 years after the approval of a plan of development.
Nigeria
Exploration and production activities in the deepwater offshore areas are typically governed by production sharing contracts (PSCs) with the national oil company, the Nigerian National Petroleum Corporation (NNPC). NNPC typically holds the underlying Oil Prospecting License (OPL) and any resulting Oil Mining Lease (OML). The terms of the PSCs are generally 30 years, including a ten-year exploration period (an initial exploration phase that can be divided into multiple optional periods) covered by an OPL. Upon commercial discovery, an OPL may be converted to an OML. Partial relinquishment is required under the PSC at the end of the ten-year exploration period, and OMLs have a 20-year production period that may be extended.
Some exploration activities are carried out in deepwater by joint ventures with local companies holding interests in an OPL. OPLs in deepwater offshore areas are valid for 10 years, while in all other areas the licenses are for five years. Demonstrating a commercial discovery is the basis for conversion of an OPL to an OML.
22
OMLs granted prior to the 1969 Petroleum Act (i.e., under the Mineral Oils Act 1914, repealed by the 1969 Petroleum Act) were for 30 years onshore and 40 years in offshore areas and have been renewed, effective December 1, 2008, for a further period of 20 years, with a further renewal option of 20 years. Operations under these pre-1969 OMLs are conducted under a joint venture agreement with NNPC rather than a PSC. Commercial terms applicable to the existing joint venture oil production are defined by the Petroleum Profits Tax Act.
OMLs granted under the 1969 Petroleum Act, which include all deepwater OMLs, have a maximum term of 20 years without distinction for onshore or offshore location and are renewable, upon 12 months’ written notice, for another period of 20 years. OMLs not held by NNPC are also subject to a mandatory 50-percent relinquishment after the first 10 years of their duration.
ASIA
Azerbaijan
The production sharing agreement (PSA) for the development of the Azeri-Chirag-Gunashli field was established for an initial period of 30 years starting from the PSA execution date in 1994. The PSA was amended in September 2017 to extend the term by 25 years to 2049.
Other exploration and production activities are governed by PSAs negotiated with the national oil company of Azerbaijan. The exploration period typically consists of three or four years with the possibility of a one to three-year extension. The production period, which includes development, is for 25 years or 35 years with the possibility of one or two five-year extensions.
Indonesia
Exploration and production activities in Indonesia are generally governed by cooperation contracts, usually in the form of a production sharing contract (PSC), negotiated with BPMIGAS, a government agency established in 2002 to manage upstream oil and gas activities. In 2012, Indonesia’s Constitutional Court ruled certain articles of law relating to BPMIGAS to be unconstitutional, but stated that all existing PSCs signed with BPMIGAS should remain in force until their expiry, and the functions and duties previously performed by BPMIGAS are to be carried out by the relevant Ministry of the Government of Indonesia until the promulgation of a new oil and gas law. By presidential decree, SKKMIGAS became the interim successor to BPMIGAS. The current PSCs have an exploration period of six years, which can be extended up to 10 years, and an exploitation period of 20 years. PSCs generally require the contractor to relinquish 10 percent to 20 percent of the contract area after three years and generally allow the contractor to retain no more than 50 percent to 80 percent of the original contract area after six years, depending on the acreage and terms.
Iraq
Development and production activities in the state-owned oil and gas fields are governed by contracts with regional oil companies
of the Iraqi Ministry of Oil. An ExxonMobil affiliate entered into a contract with Basra Oil Company of the Iraqi Ministry of Oil for the rights to participate in the development and production activities of the West Qurna Phase I oil and gas field effective March 1, 2010. The term of the contract is 20 years with the right to extend for five years. The contract provides for cost recovery plus per-barrel fees for incremental production above specified levels.
Exploration and production activities in the Kurdistan Region of Iraq are governed by production sharing contracts (PSCs) negotiated with the regional government of Kurdistan in 2011. The exploration term is for five years, with extensions available as provided by the PSCs and at the discretion of the regional government of Kurdistan. Current PSCs remain in effect by agreement of the regional government to allow additional time for exploration or evaluation of commerciality. The production period is 20 years with the right to extend for five years.
Kazakhstan
Onshore exploration and production activities are governed by the production license, exploration license and joint venture agreements negotiated with the Republic of Kazakhstan. Existing production operations have a 40-year production period that commenced in 1993.
Offshore exploration and production activities are governed by a production sharing agreement negotiated with the Republic of Kazakhstan. The exploration period is six years followed by separate appraisal periods for each discovery. The production period for each discovery, which includes development, is 20 years from the date of declaration of commerciality with the possibility of two ten-year extensions.
Malaysia
Production activities are governed by production sharing contracts (PSCs) negotiated with the national oil company. The PSCs
have exploration and production terms ranging up to 38 years. All extensions are subject to the national oil company’s prior written approval. The production periods range from 15 to 29 years, depending on the provisions of the respective contract.
23
Qatar
The State of Qatar grants gas production development project rights to develop and supply gas from the offshore North Field to permit the economic development and production of gas reserves sufficient to satisfy the gas and LNG sales obligations of these projects.
Russia
Terms for ExxonMobil’s Sakhalin acreage are fixed by the current production sharing agreement (PSA) between the Russian government and the Sakhalin-1 consortium, of which ExxonMobil is the operator.
ExxonMobil withdrew from the joint ventures with Rosneft for the Kara, Laptev, Chukchi and Black Seas, effective April 30, 2018.
ExxonMobil continues to remain in compliance with all laws applicable to its operations and investments in the Russian Federation.
Thailand
The Petroleum Act of 1971 allows production under ExxonMobil’s concession for 30 years with a ten-year extension at terms generally prevalent at the time. The term of the concession expires in 2021.
United Arab Emirates
An interest in the development and production activities of the Upper Zakum field, a major offshore field, was acquired in 2006. In 2017 the governing agreements were extended to 2051.
AUSTRALIA / OCEANIA
Australia
Exploration and production activities conducted offshore in Commonwealth waters are governed by Federal legislation. Exploration permits are granted for an initial term of six years with two possible five-year renewal periods. Retention leases may be granted for resources that are not commercially viable at the time of application, but are expected to become commercially viable within 15 years. These are granted for periods of five years and renewals may be requested. Prior to July 1998, production licenses were granted initially for 21 years, with a further renewal of 21 years and thereafter “indefinitely”, i.e., for the life of the field. Effective from July 1998, new production licenses are granted “indefinitely”. In each case, a production license may be terminated if no production operations have been carried on for five years.
Papua New Guinea
Exploration and production activities are governed by the Oil and Gas Act. Petroleum Prospecting licenses are granted for an initial
term of six years with a five-year extension possible (an additional extension of three years is possible in certain circumstances). Generally, a 50-percent relinquishment of the license area is required at the end of the initial six-year term, if extended. Petroleum Development licenses are granted for an initial 25-year period. An extension of up to 20 years may be granted at the Minister’s discretion. Petroleum Retention licenses may be granted for gas resources that are not commercially viable at the time of application, but may become commercially viable within the maximum possible retention time of 15 years. Petroleum Retention licenses are granted for five-year terms, and may be extended, at the Minister’s discretion, twice for the maximum retention time of 15 years. Extensions of Petroleum Retention licenses may be for periods of less than one year, renewable annually, if the Minister considers at the time of extension that the resources could become commercially viable in less than five years.
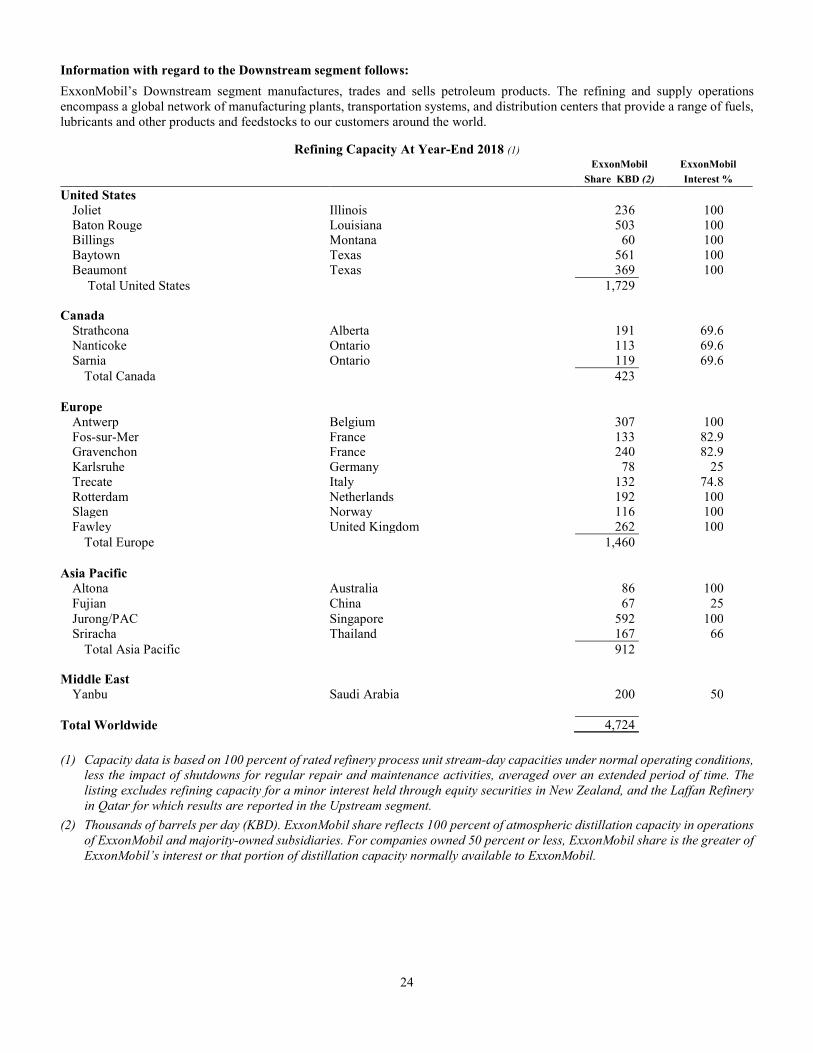
24
Information with regard to the Downstream segment follows:
ExxonMobil’s Downstream segment manufactures, trades and sells petroleum products. The refining and supply operations encompass a global network of manufacturing plants, transportation systems, and distribution centers that provide a range of fuels, lubricants and other products and feedstocks to our customers around the world.
Refining Capacity At Year-End 2018 (1) ExxonMobil ExxonMobil
Share KBD (2) Interest %
United States Joliet Illinois 236 100 Baton Rouge Louisiana 503 100 Billings Montana 60 100 Baytown Texas 561 100 Beaumont Texas 369 100
Total United States 1,729
Canada Strathcona Alberta 191 69.6 Nanticoke Ontario 113 69.6 Sarnia Ontario 119 69.6
Total Canada 423
Europe Antwerp Belgium 307 100 Fos-sur-Mer France 133 82.9 Gravenchon France 240 82.9 Karlsruhe Germany 78 25 Trecate Italy 132 74.8 Rotterdam Netherlands 192 100 Slagen Norway 116 100 Fawley United Kingdom 262 100
Total Europe 1,460
Asia Pacific
Altona Australia 86 100
Fujian China 67 25 Jurong/PAC Singapore 592 100 Sriracha Thailand 167 66
Total Asia Pacific 912
Middle East Yanbu Saudi Arabia 200 50
Total Worldwide 4,724
(1) Capacity data is based on 100 percent of rated refinery process unit stream-day capacities under normal operating conditions,
less the impact of shutdowns for regular repair and maintenance activities, averaged over an extended period of time. The
listing excludes refining capacity for a minor interest held through equity securities in New Zealand, and the Laffan Refinery
in Qatar for which results are reported in the Upstream segment.
(2) Thousands of barrels per day (KBD). ExxonMobil share reflects 100 percent of atmospheric distillation capacity in operations
of ExxonMobil and majority-owned subsidiaries. For companies owned 50 percent or less, ExxonMobil share is the greater of
ExxonMobil’s interest or that portion of distillation capacity normally available to ExxonMobil.
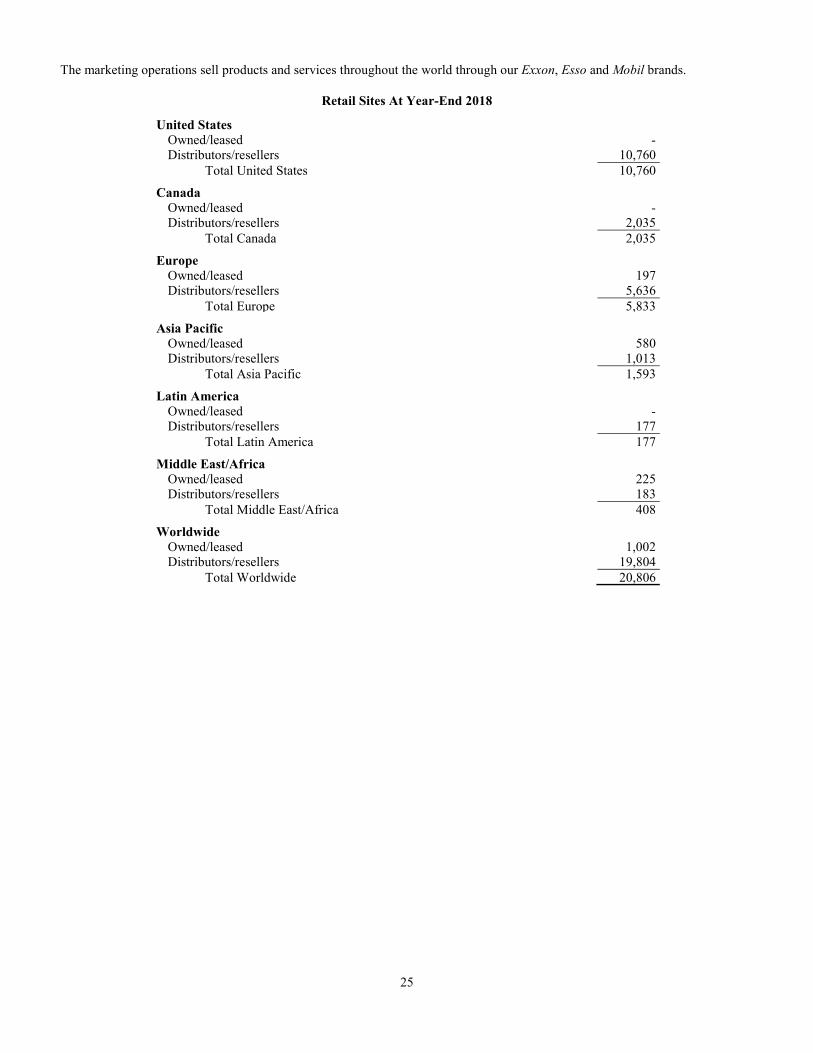
25
The marketing operations sell products and services throughout the world through our Exxon, Esso and Mobil brands.
Retail Sites At Year-End 2018
United States Owned/leased - Distributors/resellers 10,760
Total United States 10,760
Canada Owned/leased - Distributors/resellers 2,035
Total Canada 2,035
Europe Owned/leased 197 Distributors/resellers 5,636
Total Europe 5,833
Asia Pacific Owned/leased 580 Distributors/resellers 1,013
Total Asia Pacific 1,593
Latin America Owned/leased - Distributors/resellers 177
Total Latin America 177
Middle East/Africa Owned/leased 225 Distributors/resellers 183
Total Middle East/Africa 408
Worldwide Owned/leased 1,002 Distributors/resellers 19,804
Total Worldwide 20,806
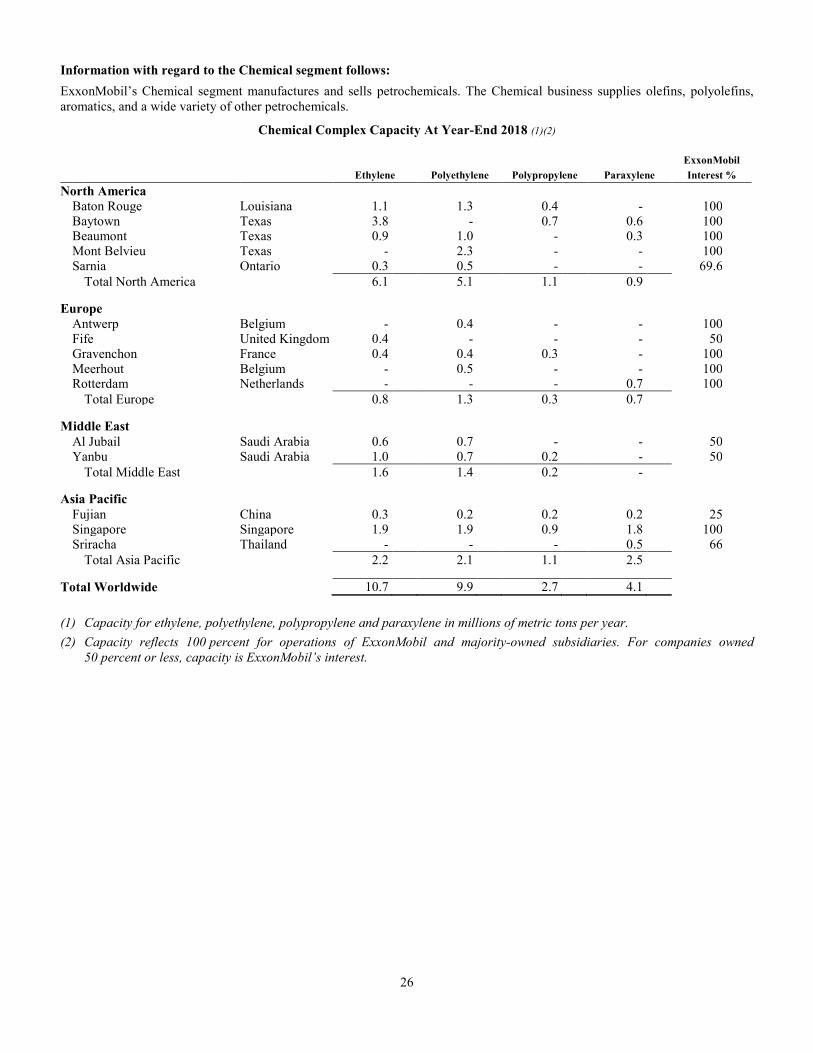
26
Information with regard to the Chemical segment follows:
ExxonMobil’s Chemical segment manufactures and sells petrochemicals. The Chemical business supplies olefins, polyolefins, aromatics, and a wide variety of other petrochemicals.
Chemical Complex Capacity At Year-End 2018 (1)(2) ExxonMobil
Ethylene Polyethylene Polypropylene Paraxylene Interest %
North America
Baton Rouge Louisiana 1.1 1.3 0.4 - 100 Baytown Texas 3.8 - 0.7 0.6 100 Beaumont Texas 0.9 1.0 - 0.3 100 Mont Belvieu Texas - 2.3 - - 100 Sarnia Ontario 0.3 0.5 - - 69.6 Total North America 6.1 5.1 1.1 0.9
Europe
Antwerp Belgium - 0.4 - - 100
Fife United Kingdom 0.4 - - - 50 Gravenchon France 0.4 0.4 0.3 - 100 Meerhout Belgium - 0.5 - - 100 Rotterdam Netherlands - - - 0.7 100 Total Europe 0.8 1.3 0.3 0.7
Middle East
Al Jubail Saudi Arabia 0.6 0.7 - - 50 Yanbu Saudi Arabia 1.0 0.7 0.2 - 50 Total Middle East 1.6 1.4 0.2 -
Asia Pacific
Fujian China 0.3 0.2 0.2 0.2 25 Singapore Singapore 1.9 1.9 0.9 1.8 100 Sriracha Thailand - - - 0.5 66 Total Asia Pacific 2.2 2.1 1.1 2.5
Total Worldwide 10.7 9.9 2.7 4.1
(1) Capacity for ethylene, polyethylene, polypropylene and paraxylene in millions of metric tons per year.
(2) Capacity reflects 100 percent for operations of ExxonMobil and majority-owned subsidiaries. For companies owned
50 percent or less, capacity is ExxonMobil’s interest.
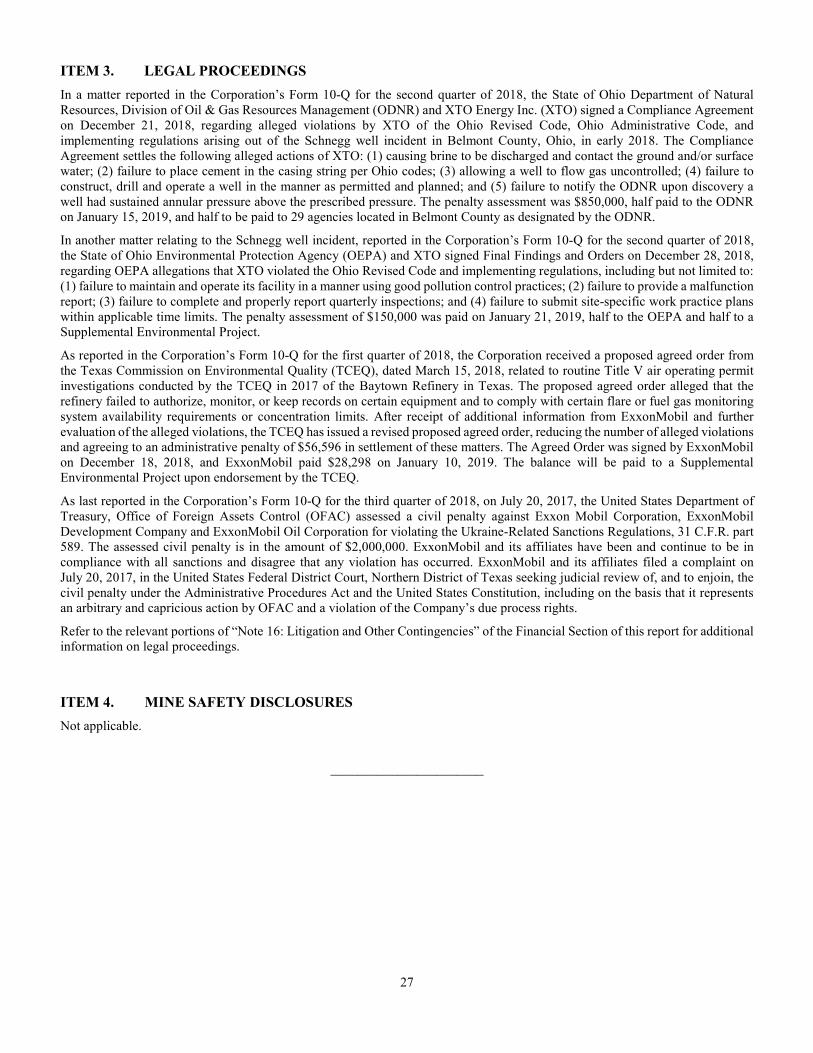
27
ITEM 3. LEGAL PROCEEDINGS
In a matter reported in the Corporation’s Form 10-Q for the second quarter of 2018, the State of Ohio Department of Natural Resources, Division of Oil & Gas Resources Management (ODNR) and XTO Energy Inc. (XTO) signed a Compliance Agreement on December 21, 2018, regarding alleged violations by XTO of the Ohio Revised Code, Ohio Administrative Code, and implementing regulations arising out of the Schnegg well incident in Belmont County, Ohio, in early 2018. The Compliance Agreement settles the following alleged actions of XTO: (1) causing brine to be discharged and contact the ground and/or surface water; (2) failure to place cement in the casing string per Ohio codes; (3) allowing a well to flow gas uncontrolled; (4) failure to construct, drill and operate a well in the manner as permitted and planned; and (5) failure to notify the ODNR upon discovery a well had sustained annular pressure above the prescribed pressure. The penalty assessment was $850,000, half paid to the ODNR on January 15, 2019, and half to be paid to 29 agencies located in Belmont County as designated by the ODNR.
In another matter relating to the Schnegg well incident, reported in the Corporation’s Form 10-Q for the second quarter of 2018, the State of Ohio Environmental Protection Agency (OEPA) and XTO signed Final Findings and Orders on December 28, 2018, regarding OEPA allegations that XTO violated the Ohio Revised Code and implementing regulations, including but not limited to: (1) failure to maintain and operate its facility in a manner using good pollution control practices; (2) failure to provide a malfunction report; (3) failure to complete and properly report quarterly inspections; and (4) failure to submit site-specific work practice plans within applicable time limits. The penalty assessment of $150,000 was paid on January 21, 2019, half to the OEPA and half to a Supplemental Environmental Project.
As reported in the Corporation’s Form 10-Q for the first quarter of 2018, the Corporation received a proposed agreed order from the Texas Commission on Environmental Quality (TCEQ), dated March 15, 2018, related to routine Title V air operating permit investigations conducted by the TCEQ in 2017 of the Baytown Refinery in Texas. The proposed agreed order alleged that the refinery failed to authorize, monitor, or keep records on certain equipment and to comply with certain flare or fuel gas monitoring system availability requirements or concentration limits. After receipt of additional information from ExxonMobil and further evaluation of the alleged violations, the TCEQ has issued a revised proposed agreed order, reducing the number of alleged violations and agreeing to an administrative penalty of $56,596 in settlement of these matters. The Agreed Order was signed by ExxonMobil on December 18, 2018, and ExxonMobil paid $28,298 on January 10, 2019. The balance will be paid to a Supplemental Environmental Project upon endorsement by the TCEQ.
As last reported in the Corporation’s Form 10-Q for the third quarter of 2018, on July 20, 2017, the United States Department of Treasury, Office of Foreign Assets Control (OFAC) assessed a civil penalty against Exxon Mobil Corporation, ExxonMobil Development Company and ExxonMobil Oil Corporation for violating the Ukraine-Related Sanctions Regulations, 31 C.F.R. part 589. The assessed civil penalty is in the amount of $2,000,000. ExxonMobil and its affiliates have been and continue to be in compliance with all sanctions and disagree that any violation has occurred. ExxonMobil and its affiliates filed a complaint on July 20, 2017, in the United States Federal District Court, Northern District of Texas seeking judicial review of, and to enjoin, the civil penalty under the Administrative Procedures Act and the United States Constitution, including on the basis that it represents an arbitrary and capricious action by OFAC and a violation of the Company’s due process rights.
Refer to the relevant portions of “Note 16: Litigation and Other Contingencies” of the Financial Section of this report for additional information on legal proceedings.
ITEM 4. MINE SAFETY DISCLOSURES
Not applicable.
_______________________
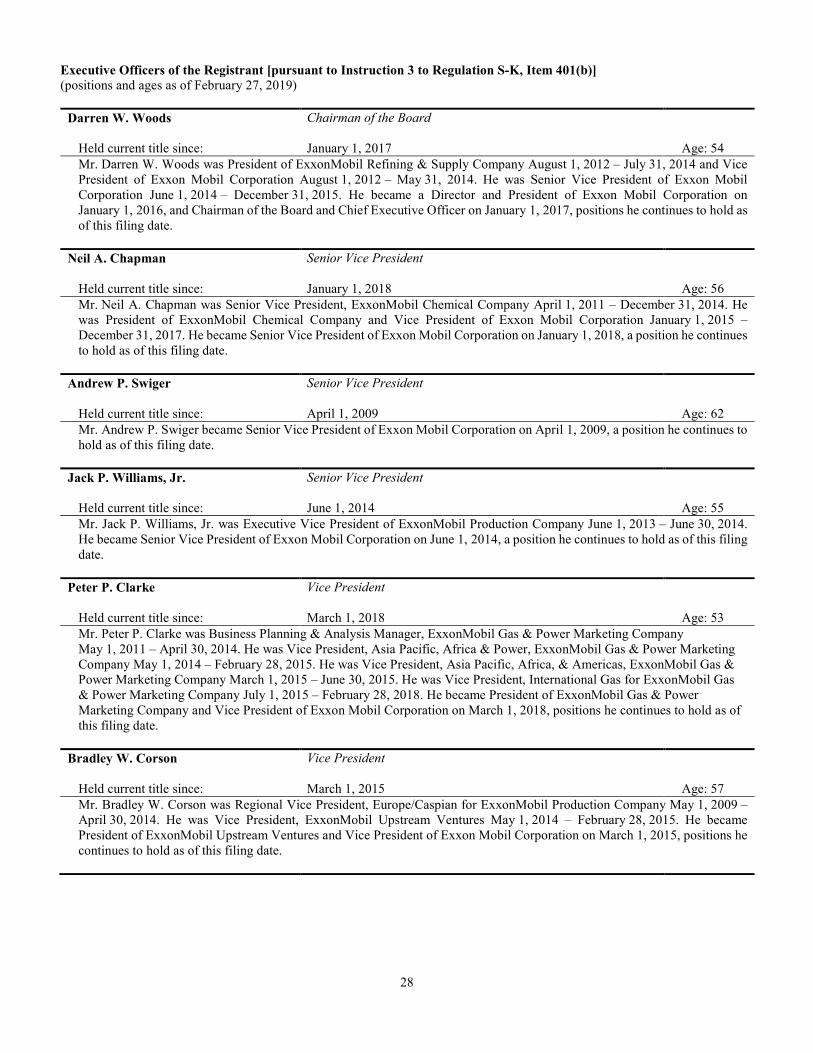
28
Executive Officers of the Registrant [pursuant to Instruction 3 to Regulation S-K, Item 401(b)]
(positions and ages as of February 27, 2019)
Darren W. Woods Chairman of the Board
Held current title since: January 1, 2017 Age: 54
Mr. Darren W. Woods was President of ExxonMobil Refining & Supply Company August 1, 2012 – July 31, 2014 and Vice President of Exxon Mobil Corporation August 1, 2012 – May 31, 2014. He was Senior Vice President of Exxon Mobil Corporation June 1, 2014 – December 31, 2015. He became a Director and President of Exxon Mobil Corporation on January 1, 2016, and Chairman of the Board and Chief Executive Officer on January 1, 2017, positions he continues to hold as of this filing date.
Neil A. Chapman Senior Vice President
Held current title since: January 1, 2018 Age: 56
Mr. Neil A. Chapman was Senior Vice President, ExxonMobil Chemical Company April 1, 2011 – December 31, 2014. He was President of ExxonMobil Chemical Company and Vice President of Exxon Mobil Corporation January 1, 2015 – December 31, 2017. He became Senior Vice President of Exxon Mobil Corporation on January 1, 2018, a position he continues to hold as of this filing date.
Andrew P. Swiger Senior Vice President
Held current title since: April 1, 2009 Age: 62
Mr. Andrew P. Swiger became Senior Vice President of Exxon Mobil Corporation on April 1, 2009, a position he continues to hold as of this filing date.
Jack P. Williams, Jr. Senior Vice President
Held current title since: June 1, 2014 Age: 55
Mr. Jack P. Williams, Jr. was Executive Vice President of ExxonMobil Production Company June 1, 2013 – June 30, 2014. He became Senior Vice President of Exxon Mobil Corporation on June 1, 2014, a position he continues to hold as of this filing date.
Peter P. Clarke Vice President
Held current title since: March 1, 2018 Age: 53
Mr. Peter P. Clarke was Business Planning & Analysis Manager, ExxonMobil Gas & Power Marketing Company May 1, 2011 – April 30, 2014. He was Vice President, Asia Pacific, Africa & Power, ExxonMobil Gas & Power Marketing Company May 1, 2014 – February 28, 2015. He was Vice President, Asia Pacific, Africa, & Americas, ExxonMobil Gas & Power Marketing Company March 1, 2015 – June 30, 2015. He was Vice President, International Gas for ExxonMobil Gas & Power Marketing Company July 1, 2015 – February 28, 2018. He became President of ExxonMobil Gas & Power Marketing Company and Vice President of Exxon Mobil Corporation on March 1, 2018, positions he continues to hold as of this filing date.
Bradley W. Corson Vice President
Held current title since: March 1, 2015 Age: 57
Mr. Bradley W. Corson was Regional Vice President, Europe/Caspian for ExxonMobil Production Company May 1, 2009 – April 30, 2014. He was Vice President, ExxonMobil Upstream Ventures May 1, 2014 – February 28, 2015. He became President of ExxonMobil Upstream Ventures and Vice President of Exxon Mobil Corporation on March 1, 2015, positions he continues to hold as of this filing date.
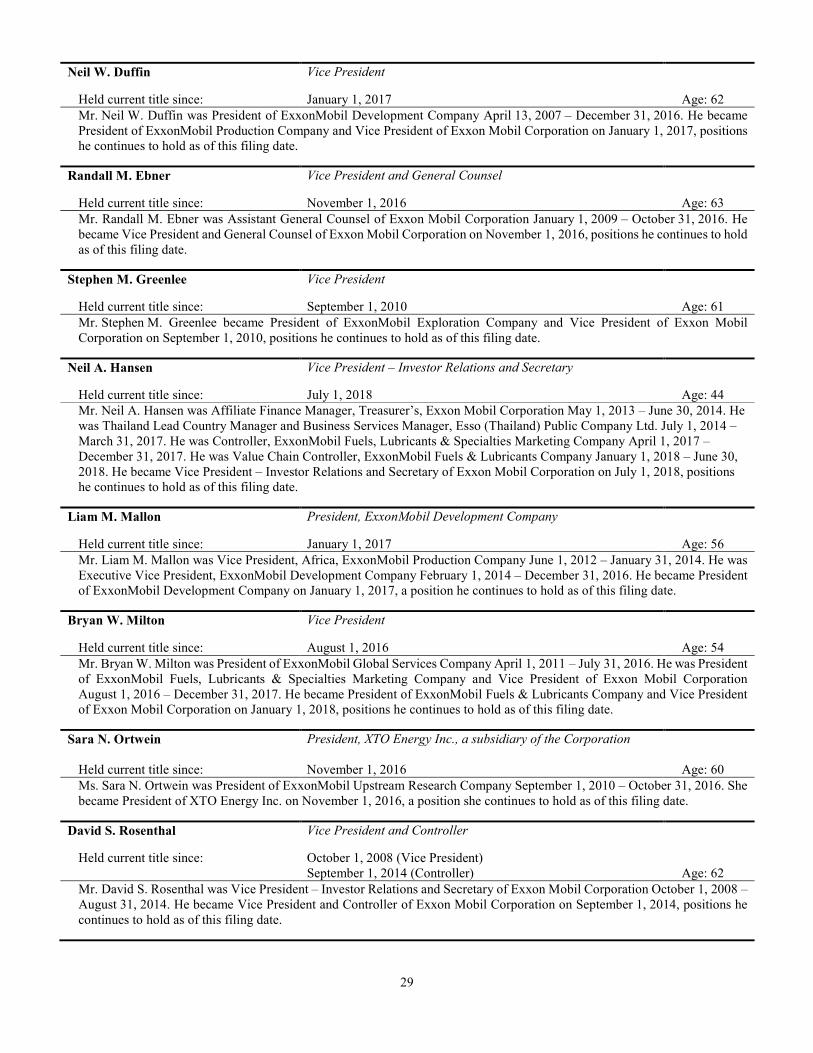
29
Neil W. Duffin Vice President
Held current title since: January 1, 2017 Age: 62
Mr. Neil W. Duffin was President of ExxonMobil Development Company April 13, 2007 – December 31, 2016. He became President of ExxonMobil Production Company and Vice President of Exxon Mobil Corporation on January 1, 2017, positions he continues to hold as of this filing date.
Randall M. Ebner Vice President and General Counsel
Held current title since: November 1, 2016 Age: 63
Mr. Randall M. Ebner was Assistant General Counsel of Exxon Mobil Corporation January 1, 2009 – October 31, 2016. He became Vice President and General Counsel of Exxon Mobil Corporation on November 1, 2016, positions he continues to hold as of this filing date.
Stephen M. Greenlee Vice President
Held current title since: September 1, 2010 Age: 61
Mr. Stephen M. Greenlee became President of ExxonMobil Exploration Company and Vice President of Exxon Mobil Corporation on September 1, 2010, positions he continues to hold as of this filing date.
Neil A. Hansen Vice President – Investor Relations and Secretary
Held current title since: July 1, 2018 Age: 44
Mr. Neil A. Hansen was Affiliate Finance Manager, Treasurer’s, Exxon Mobil Corporation May 1, 2013 – June 30, 2014. He was Thailand Lead Country Manager and Business Services Manager, Esso (Thailand) Public Company Ltd. July 1, 2014 – March 31, 2017. He was Controller, ExxonMobil Fuels, Lubricants & Specialties Marketing Company April 1, 2017 – December 31, 2017. He was Value Chain Controller, ExxonMobil Fuels & Lubricants Company January 1, 2018 – June 30, 2018. He became Vice President – Investor Relations and Secretary of Exxon Mobil Corporation on July 1, 2018, positions he continues to hold as of this filing date.
Liam M. Mallon President, ExxonMobil Development Company
Held current title since: January 1, 2017 Age: 56
Mr. Liam M. Mallon was Vice President, Africa, ExxonMobil Production Company June 1, 2012 – January 31, 2014. He was Executive Vice President, ExxonMobil Development Company February 1, 2014 – December 31, 2016. He became President of ExxonMobil Development Company on January 1, 2017, a position he continues to hold as of this filing date.
Bryan W. Milton Vice President
Held current title since: August 1, 2016 Age: 54
Mr. Bryan W. Milton was President of ExxonMobil Global Services Company April 1, 2011 – July 31, 2016. He was President of ExxonMobil Fuels, Lubricants & Specialties Marketing Company and Vice President of Exxon Mobil Corporation August 1, 2016 – December 31, 2017. He became President of ExxonMobil Fuels & Lubricants Company and Vice President of Exxon Mobil Corporation on January 1, 2018, positions he continues to hold as of this filing date.
Sara N. Ortwein President, XTO Energy Inc., a subsidiary of the Corporation Held current title since: November 1, 2016 Age: 60
Ms. Sara N. Ortwein was President of ExxonMobil Upstream Research Company September 1, 2010 – October 31, 2016. She became President of XTO Energy Inc. on November 1, 2016, a position she continues to hold as of this filing date.
David S. Rosenthal Vice President and Controller
Held current title since: October 1, 2008 (Vice President) September 1, 2014 (Controller)
Age: 62
Mr. David S. Rosenthal was Vice President – Investor Relations and Secretary of Exxon Mobil Corporation October 1, 2008 – August 31, 2014. He became Vice President and Controller of Exxon Mobil Corporation on September 1, 2014, positions he continues to hold as of this filing date.
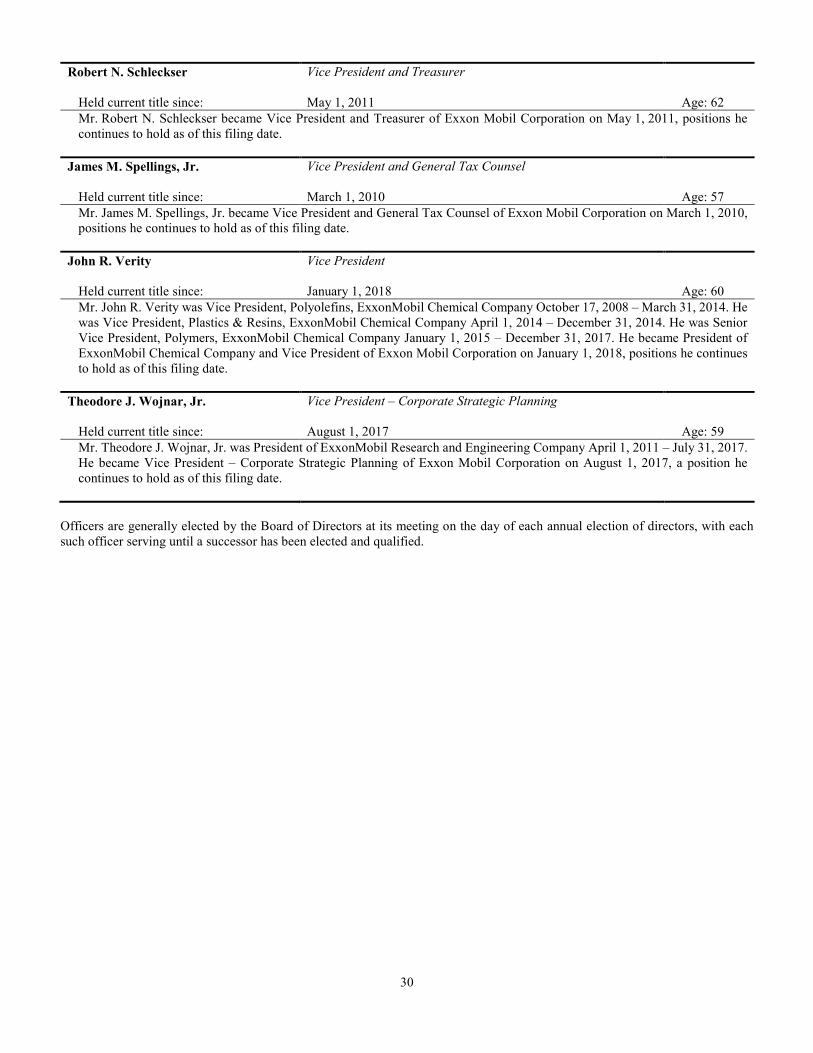
30
Robert N. Schleckser Vice President and Treasurer
Held current title since: May 1, 2011 Age: 62
Mr. Robert N. Schleckser became Vice President and Treasurer of Exxon Mobil Corporation on May 1, 2011, positions he continues to hold as of this filing date.
James M. Spellings, Jr. Vice President and General Tax Counsel Held current title since: March 1, 2010 Age: 57
Mr. James M. Spellings, Jr. became Vice President and General Tax Counsel of Exxon Mobil Corporation on March 1, 2010, positions he continues to hold as of this filing date.
John R. Verity Vice President
Held current title since: January 1, 2018 Age: 60
Mr. John R. Verity was Vice President, Polyolefins, ExxonMobil Chemical Company October 17, 2008 – March 31, 2014. He was Vice President, Plastics & Resins, ExxonMobil Chemical Company April 1, 2014 – December 31, 2014. He was Senior Vice President, Polymers, ExxonMobil Chemical Company January 1, 2015 – December 31, 2017. He became President of ExxonMobil Chemical Company and Vice President of Exxon Mobil Corporation on January 1, 2018, positions he continues to hold as of this filing date.
Theodore J. Wojnar, Jr. Vice President – Corporate Strategic Planning
Held current title since: August 1, 2017 Age: 59
Mr. Theodore J. Wojnar, Jr. was President of ExxonMobil Research and Engineering Company April 1, 2011 – July 31, 2017. He became Vice President – Corporate Strategic Planning of Exxon Mobil Corporation on August 1, 2017, a position he continues to hold as of this filing date.
Officers are generally elected by the Board of Directors at its meeting on the day of each annual election of directors, with each such officer serving until a successor has been elected and qualified.
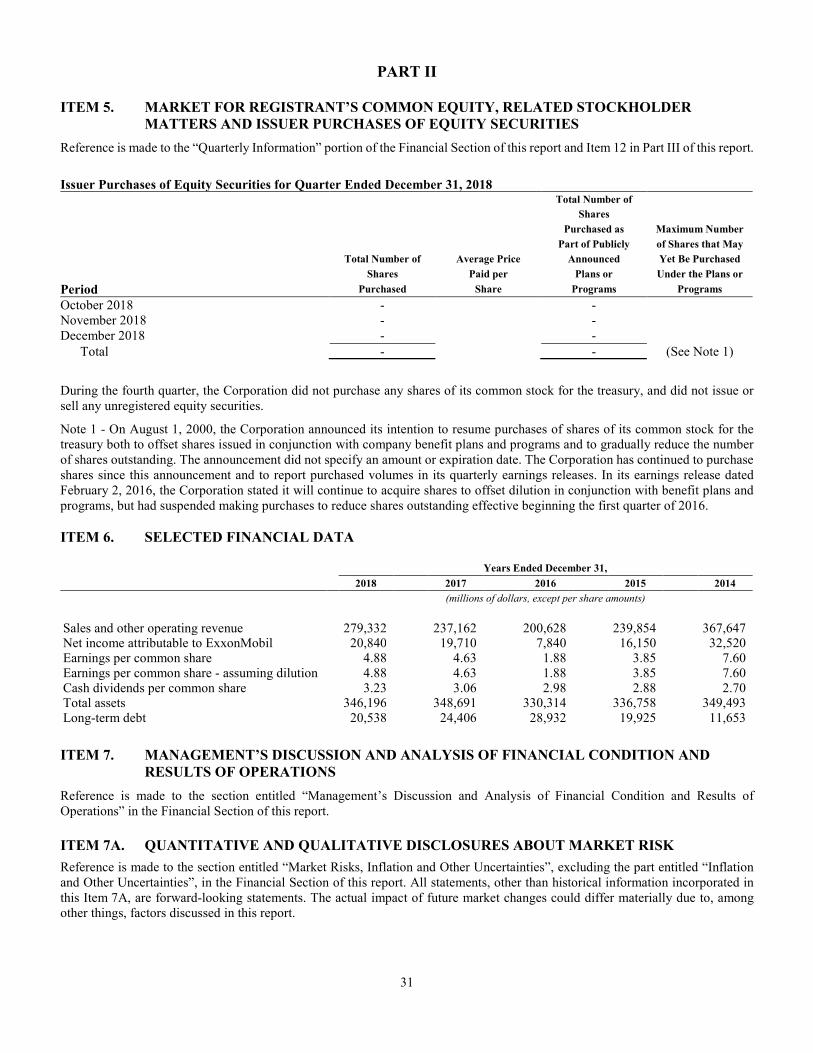
31
PART II
ITEM 5. MARKET FOR REGISTRANT’S COMMON EQUITY, RELATED STOCKHOLDER
MATTERS AND ISSUER PURCHASES OF EQUITY SECURITIES
Reference is made to the “Quarterly Information” portion of the Financial Section of this report and Item 12 in Part III of this report.
Issuer Purchases of Equity Securities for Quarter Ended December 31, 2018
Total Number of
Shares
Purchased as Maximum Number
Part of Publicly of Shares that May
Total Number of Average Price Announced Yet Be Purchased
Shares Paid per Plans or Under the Plans or
Period Purchased Share Programs Programs
October 2018 - - November 2018 - - December 2018 - -
Total - - (See Note 1)
During the fourth quarter, the Corporation did not purchase any shares of its common stock for the treasury, and did not issue or sell any unregistered equity securities.
Note 1 - On August 1, 2000, the Corporation announced its intention to resume purchases of shares of its common stock for the treasury both to offset shares issued in conjunction with company benefit plans and programs and to gradually reduce the number of shares outstanding. The announcement did not specify an amount or expiration date. The Corporation has continued to purchase shares since this announcement and to report purchased volumes in its quarterly earnings releases. In its earnings release dated February 2, 2016, the Corporation stated it will continue to acquire shares to offset dilution in conjunction with benefit plans and programs, but had suspended making purchases to reduce shares outstanding effective beginning the first quarter of 2016.
ITEM 6. SELECTED FINANCIAL DATA
Years Ended December 31,
2018 2017 2016 2015 2014
(millions of dollars, except per share amounts)
Sales and other operating revenue 279,332 237,162 200,628 239,854 367,647 Net income attributable to ExxonMobil 20,840 19,710 7,840 16,150 32,520 Earnings per common share 4.88 4.63 1.88 3.85 7.60 Earnings per common share - assuming dilution 4.88 4.63 1.88 3.85 7.60 Cash dividends per common share 3.23 3.06 2.98 2.88 2.70 Total assets 346,196 348,691 330,314 336,758 349,493 Long-term debt 20,538 24,406 28,932 19,925 11,653
ITEM 7. MANAGEMENT’S DISCUSSION AND ANALYSIS OF FINANCIAL CONDITION AND
RESULTS OF OPERATIONS
Reference is made to the section entitled “Management’s Discussion and Analysis of Financial Condition and Results of Operations” in the Financial Section of this report.
ITEM 7A. QUANTITATIVE AND QUALITATIVE DISCLOSURES ABOUT MARKET RISK
Reference is made to the section entitled “Market Risks, Inflation and Other Uncertainties”, excluding the part entitled “Inflation and Other Uncertainties”, in the Financial Section of this report. All statements, other than historical information incorporated in this Item 7A, are forward-looking statements. The actual impact of future market changes could differ materially due to, among other things, factors discussed in this report.
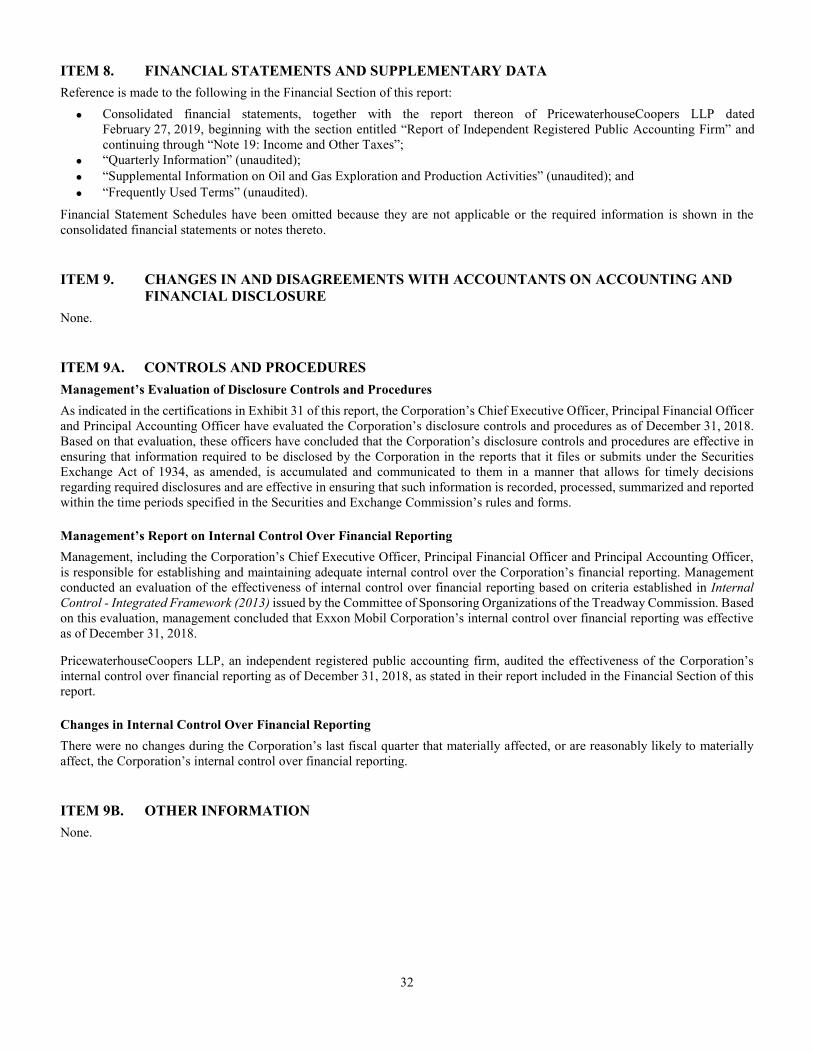
32
ITEM 8. FINANCIAL STATEMENTS AND SUPPLEMENTARY DATA
Reference is made to the following in the Financial Section of this report:
• Consolidated financial statements, together with the report thereon of PricewaterhouseCoopers LLP datedFebruary 27, 2019, beginning with the section entitled “Report of Independent Registered Public Accounting Firm” andcontinuing through “Note 19: Income and Other Taxes”;
• “Quarterly Information” (unaudited);
• “Supplemental Information on Oil and Gas Exploration and Production Activities” (unaudited); and
• “Frequently Used Terms” (unaudited).
Financial Statement Schedules have been omitted because they are not applicable or the required information is shown in the consolidated financial statements or notes thereto.
ITEM 9. CHANGES IN AND DISAGREEMENTS WITH ACCOUNTANTS ON ACCOUNTING AND
FINANCIAL DISCLOSURE
None.
ITEM 9A. CONTROLS AND PROCEDURES
Management’s Evaluation of Disclosure Controls and Procedures
As indicated in the certifications in Exhibit 31 of this report, the Corporation’s Chief Executive Officer, Principal Financial Officer and Principal Accounting Officer have evaluated the Corporation’s disclosure controls and procedures as of December 31, 2018. Based on that evaluation, these officers have concluded that the Corporation’s disclosure controls and procedures are effective in ensuring that information required to be disclosed by the Corporation in the reports that it files or submits under the Securities Exchange Act of 1934, as amended, is accumulated and communicated to them in a manner that allows for timely decisions regarding required disclosures and are effective in ensuring that such information is recorded, processed, summarized and reported within the time periods specified in the Securities and Exchange Commission’s rules and forms.
Management’s Report on Internal Control Over Financial Reporting
Management, including the Corporation’s Chief Executive Officer, Principal Financial Officer and Principal Accounting Officer,
is responsible for establishing and maintaining adequate internal control over the Corporation’s financial reporting. Management conducted an evaluation of the effectiveness of internal control over financial reporting based on criteria established in Internal
Control - Integrated Framework (2013) issued by the Committee of Sponsoring Organizations of the Treadway Commission. Based on this evaluation, management concluded that Exxon Mobil Corporation’s internal control over financial reporting was effective as of December 31, 2018.
PricewaterhouseCoopers LLP, an independent registered public accounting firm, audited the effectiveness of the Corporation’s internal control over financial reporting as of December 31, 2018, as stated in their report included in the Financial Section of this report.
Changes in Internal Control Over Financial Reporting
There were no changes during the Corporation’s last fiscal quarter that materially affected, or are reasonably likely to materially affect, the Corporation’s internal control over financial reporting.
ITEM 9B. OTHER INFORMATION
None.
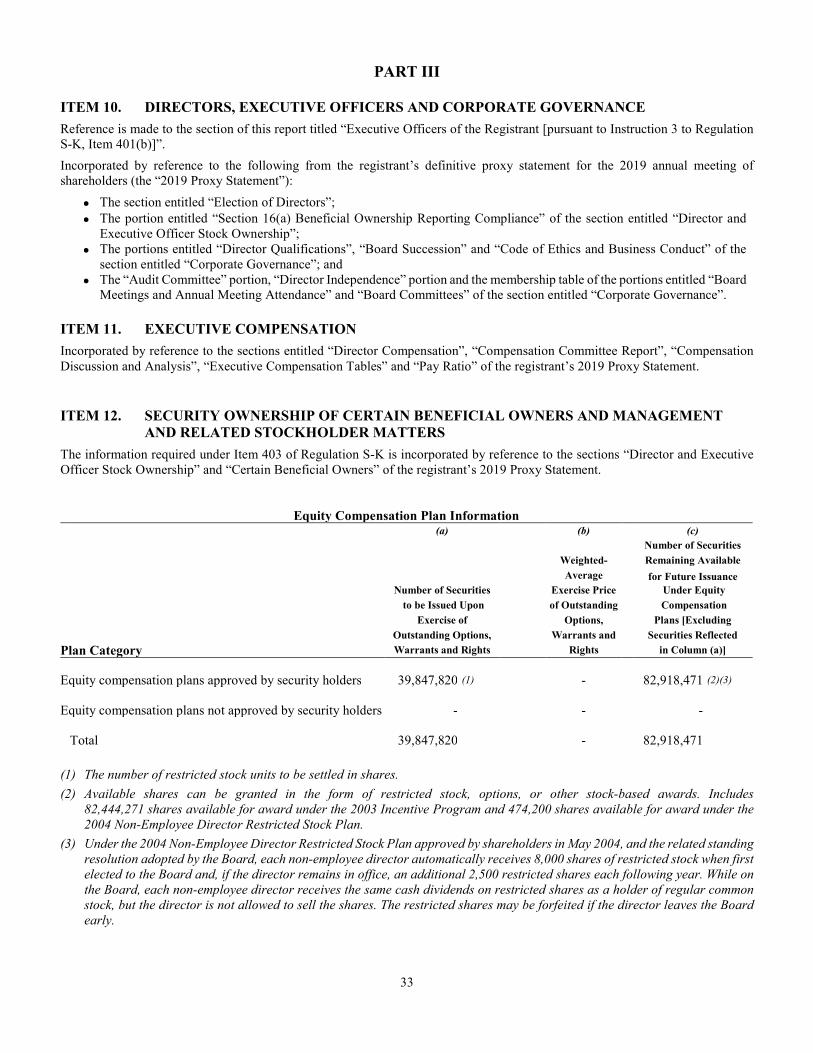
33
PART III
ITEM 10. DIRECTORS, EXECUTIVE OFFICERS AND CORPORATE GOVERNANCE
Reference is made to the section of this report titled “Executive Officers of the Registrant [pursuant to Instruction 3 to Regulation S-K, Item 401(b)]”.
Incorporated by reference to the following from the registrant’s definitive proxy statement for the 2019 annual meeting of shareholders (the “2019 Proxy Statement”):
• The section entitled “Election of Directors”;
• The portion entitled “Section 16(a) Beneficial Ownership Reporting Compliance” of the section entitled “Director and Executive Officer Stock Ownership”;
• The portions entitled “Director Qualifications”, “Board Succession” and “Code of Ethics and Business Conduct” of the section entitled “Corporate Governance”; and
• The “Audit Committee” portion, “Director Independence” portion and the membership table of the portions entitled “Board Meetings and Annual Meeting Attendance” and “Board Committees” of the section entitled “Corporate Governance”.
ITEM 11. EXECUTIVE COMPENSATION
Incorporated by reference to the sections entitled “Director Compensation”, “Compensation Committee Report”, “Compensation
Discussion and Analysis”, “Executive Compensation Tables” and “Pay Ratio” of the registrant’s 2019 Proxy Statement.
ITEM 12. SECURITY OWNERSHIP OF CERTAIN BENEFICIAL OWNERS AND MANAGEMENT
AND RELATED STOCKHOLDER MATTERS
The information required under Item 403 of Regulation S-K is incorporated by reference to the sections “Director and Executive Officer Stock Ownership” and “Certain Beneficial Owners” of the registrant’s 2019 Proxy Statement.
Equity Compensation Plan Information (a) (b) (c)
Number of Securities
Weighted- Remaining Available
Average for Future Issuance
Number of Securities Exercise Price Under Equity
to be Issued Upon of Outstanding Compensation
Exercise of Options, Plans [Excluding
Outstanding Options, Warrants and Securities Reflected
Plan Category Warrants and Rights Rights in Column (a)]
Equity compensation plans approved by security holders 39,847,820 (1) - 82,918,471 (2)(3)
Equity compensation plans not approved by security holders - - - Total 39,847,820 - 82,918,471
(1) The number of restricted stock units to be settled in shares.
(2) Available shares can be granted in the form of restricted stock, options, or other stock-based awards. Includes
82,444,271 shares available for award under the 2003 Incentive Program and 474,200 shares available for award under the
2004 Non-Employee Director Restricted Stock Plan.
(3) Under the 2004 Non-Employee Director Restricted Stock Plan approved by shareholders in May 2004, and the related standing
resolution adopted by the Board, each non-employee director automatically receives 8,000 shares of restricted stock when first
elected to the Board and, if the director remains in office, an additional 2,500 restricted shares each following year. While on
the Board, each non-employee director receives the same cash dividends on restricted shares as a holder of regular common
stock, but the director is not allowed to sell the shares. The restricted shares may be forfeited if the director leaves the Board
early.
34
ITEM 13. CERTAIN RELATIONSHIPS AND RELATED TRANSACTIONS, AND DIRECTOR
INDEPENDENCE
Incorporated by reference to the portions entitled “Related Person Transactions and Procedures” and “Director Independence” of the section entitled “Corporate Governance” of the registrant’s 2019 Proxy Statement.
ITEM 14. PRINCIPAL ACCOUNTING FEES AND SERVICES
Incorporated by reference to the portion entitled “Audit Committee” of the section entitled “Corporate Governance” and the section entitled “Ratification of Independent Auditors” of the registrant’s 2019 Proxy Statement.
PART IV
ITEM 15. EXHIBITS, FINANCIAL STATEMENT SCHEDULES
(a) (1) and (2) Financial Statements: See Table of Contents of the Financial Section of this report.
(a) (3) Exhibits: See Index to Exhibits of this report.
ITEM 16. FORM 10-K SUMMARY
None.
35
FINANCIAL SECTION
TABLE OF CONTENTS
Business Profile 36
Financial Information 37
Frequently Used Terms 38
Quarterly Information 40
Management’s Discussion and Analysis of Financial Condition and Results of Operations
Functional Earnings 41
Forward-Looking Statements 41
Overview 41
Business Environment and Risk Assessment 42
Review of 2018 and 2017 Results 46
Liquidity and Capital Resources 50
Capital and Exploration Expenditures 54
Taxes 55
Environmental Matters 56
Market Risks, Inflation and Other Uncertainties 56
Recently Issued Accounting Standards 58
Critical Accounting Estimates 58
Management’s Report on Internal Control Over Financial Reporting 63
Report of Independent Registered Public Accounting Firm 64
Consolidated Financial Statements
Statement of Income 66
Statement of Comprehensive Income 67
Balance Sheet 68
Statement of Cash Flows 69
Statement of Changes in Equity 70
Notes to Consolidated Financial Statements
1. Summary of Accounting Policies 71
2. Accounting Changes 75
3. Miscellaneous Financial Information 76
4. Other Comprehensive Income Information 77
5. Cash Flow Information 78
6. Additional Working Capital Information 78
7. Equity Company Information 79
8. Investments, Advances and Long-Term Receivables 81
9. Property, Plant and Equipment and Asset Retirement Obligations 81
10. Accounting for Suspended Exploratory Well Costs 83
11. Leased Facilities 85
12. Earnings Per Share 86
13. Financial Instruments and Derivatives 86
14. Long-Term Debt 88
15. Incentive Program 89
16. Litigation and Other Contingencies 90
17. Pension and Other Postretirement Benefits 92
18. Disclosures about Segments and Related Information 100
19. Income and Other Taxes 103
Supplemental Information on Oil and Gas Exploration and Production Activities 107
Operating Information 122
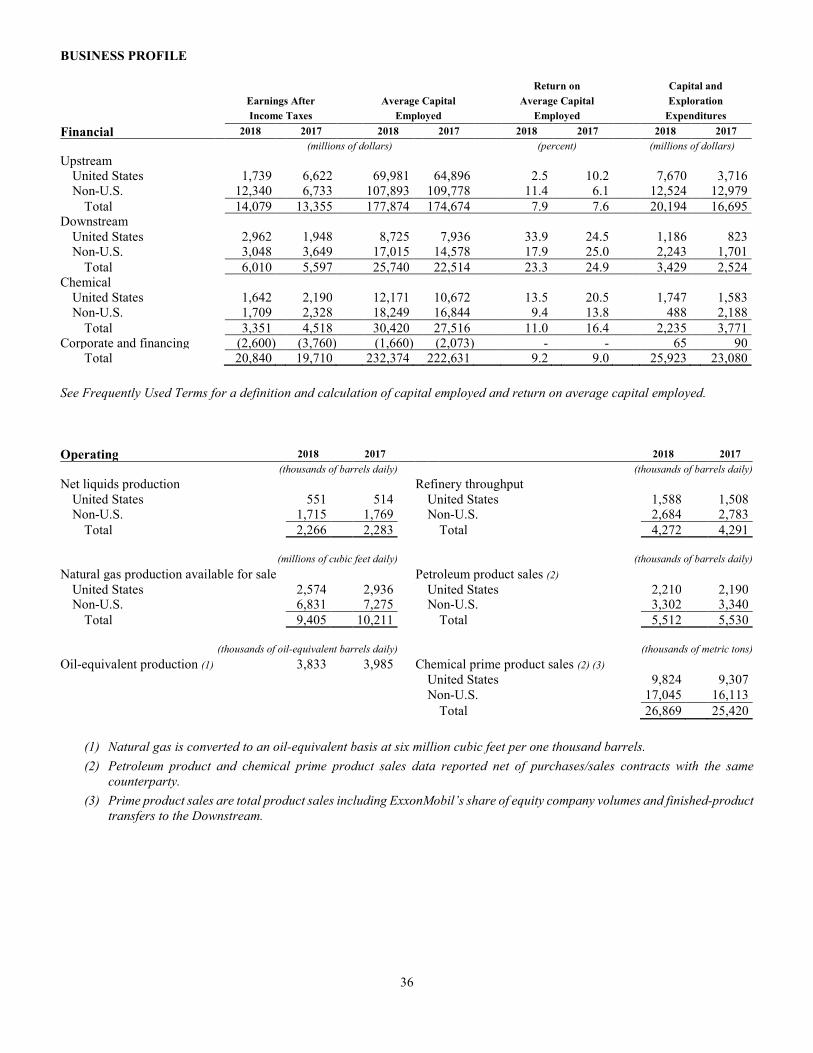
BUSINESS PROFILE
36
Return on Capital and
Earnings After Average Capital Average Capital Exploration
Income Taxes Employed Employed Expenditures
Financial 2018 2017 2018 2017 2018 2017 2018 2017
(millions of dollars) (percent) (millions of dollars)
Upstream United States 1,739 6,622 69,981 64,896 2.5 10.2 7,670 3,716 Non-U.S. 12,340 6,733 107,893 109,778 11.4 6.1 12,524 12,979
Total 14,079 13,355 177,874 174,674 7.9 7.6 20,194 16,695 Downstream United States 2,962 1,948 8,725 7,936 33.9 24.5 1,186 823 Non-U.S. 3,048 3,649 17,015 14,578 17.9 25.0 2,243 1,701
Total 6,010 5,597 25,740 22,514 23.3 24.9 3,429 2,524 Chemical United States 1,642 2,190 12,171 10,672 13.5 20.5 1,747 1,583 Non-U.S. 1,709 2,328 18,249 16,844 9.4 13.8 488 2,188
Total 3,351 4,518 30,420 27,516 11.0 16.4 2,235 3,771 Corporate and financing (2,600) (3,760) (1,660) (2,073) - - 65 90 Total 20,840 19,710 232,374 222,631 9.2 9.0 25,923 23,080
See Frequently Used Terms for a definition and calculation of capital employed and return on average capital employed.
Operating 2018 2017 2018 2017
(thousands of barrels daily) (thousands of barrels daily)
Net liquids production Refinery throughput United States 551 514 United States 1,588 1,508 Non-U.S. 1,715 1,769 Non-U.S. 2,684 2,783
Total 2,266 2,283 Total 4,272 4,291
(millions of cubic feet daily) (thousands of barrels daily)
Natural gas production available for sale Petroleum product sales (2) United States 2,574 2,936 United States 2,210 2,190 Non-U.S. 6,831 7,275 Non-U.S. 3,302 3,340
Total 9,405 10,211 Total 5,512 5,530
(thousands of oil-equivalent barrels daily) (thousands of metric tons)
Oil-equivalent production (1) 3,833 3,985 Chemical prime product sales (2) (3) United States 9,824 9,307 Non-U.S. 17,045 16,113
Total 26,869 25,420
(1) Natural gas is converted to an oil-equivalent basis at six million cubic feet per one thousand barrels.
(2) Petroleum product and chemical prime product sales data reported net of purchases/sales contracts with the same
counterparty.
(3) Prime product sales are total product sales including ExxonMobil’s share of equity company volumes and finished-product
transfers to the Downstream.
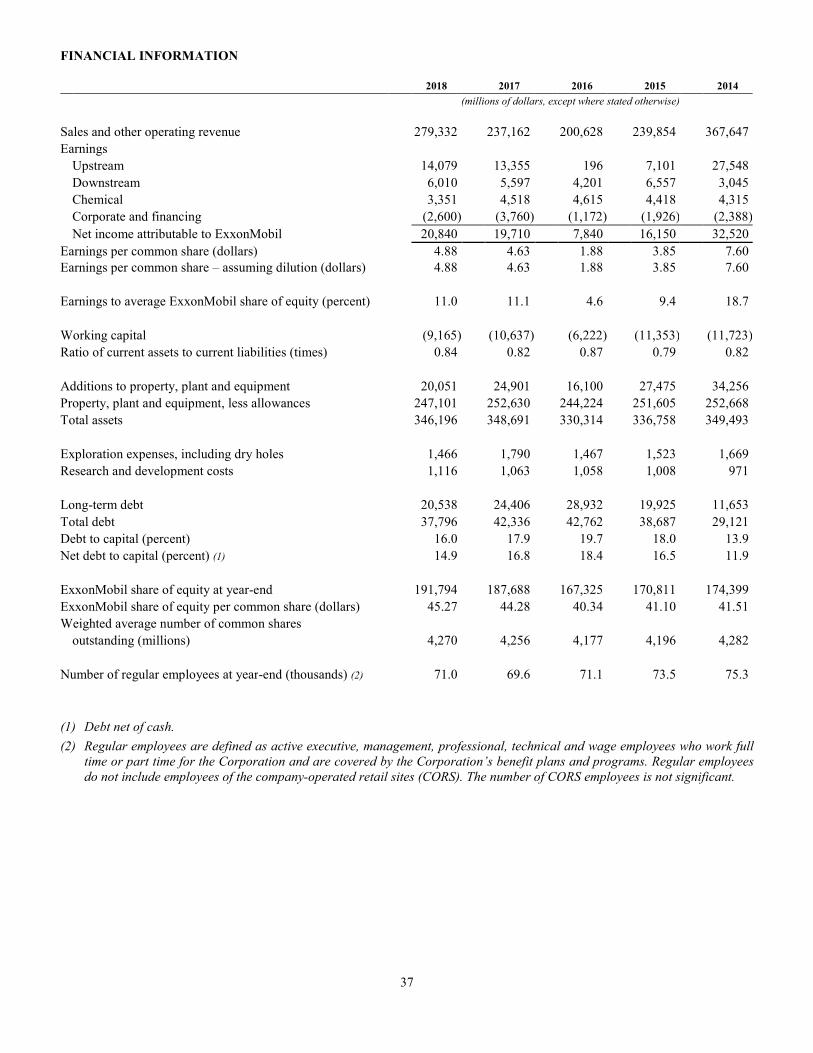
FINANCIAL INFORMATION
37
2018 2017 2016 2015 2014
(millions of dollars, except where stated otherwise)
Sales and other operating revenue 279,332 237,162 200,628 239,854 367,647
Earnings
Upstream 14,079 13,355 196 7,101 27,548
Downstream 6,010 5,597 4,201 6,557 3,045
Chemical 3,351 4,518 4,615 4,418 4,315
Corporate and financing (2,600) (3,760) (1,172) (1,926) (2,388)
Net income attributable to ExxonMobil 20,840 19,710 7,840 16,150 32,520
Earnings per common share (dollars) 4.88 4.63 1.88 3.85 7.60
Earnings per common share – assuming dilution (dollars) 4.88 4.63 1.88 3.85 7.60
Earnings to average ExxonMobil share of equity (percent) 11.0 11.1 4.6 9.4 18.7
Working capital (9,165) (10,637) (6,222) (11,353) (11,723)
Ratio of current assets to current liabilities (times) 0.84 0.82 0.87 0.79 0.82
Additions to property, plant and equipment 20,051 24,901 16,100 27,475 34,256
Property, plant and equipment, less allowances 247,101 252,630 244,224 251,605 252,668
Total assets 346,196 348,691 330,314 336,758 349,493
Exploration expenses, including dry holes 1,466 1,790 1,467 1,523 1,669
Research and development costs 1,116 1,063 1,058 1,008 971
Long-term debt 20,538 24,406 28,932 19,925 11,653
Total debt 37,796 42,336 42,762 38,687 29,121
Debt to capital (percent) 16.0 17.9 19.7 18.0 13.9
Net debt to capital (percent) (1) 14.9 16.8 18.4 16.5 11.9
ExxonMobil share of equity at year-end 191,794 187,688 167,325 170,811 174,399
ExxonMobil share of equity per common share (dollars) 45.27 44.28 40.34 41.10 41.51
Weighted average number of common shares
outstanding (millions) 4,270 4,256 4,177 4,196 4,282
Number of regular employees at year-end (thousands) (2) 71.0 69.6 71.1 73.5 75.3
(1) Debt net of cash.
(2) Regular employees are defined as active executive, management, professional, technical and wage employees who work full
time or part time for the Corporation and are covered by the Corporation’s benefit plans and programs. Regular employees
do not include employees of the company-operated retail sites (CORS). The number of CORS employees is not significant.
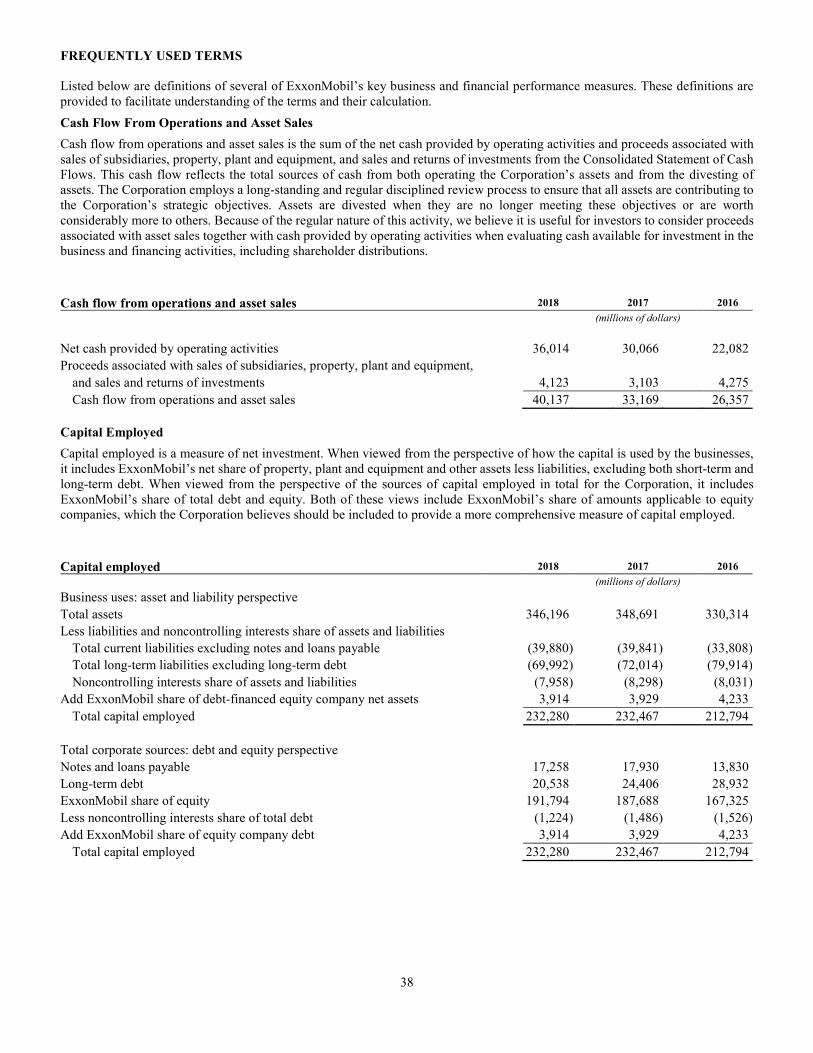
FREQUENTLY USED TERMS
38
Listed below are definitions of several of ExxonMobil’s key business and financial performance measures. These definitions are provided to facilitate understanding of the terms and their calculation.
Cash Flow From Operations and Asset Sales
Cash flow from operations and asset sales is the sum of the net cash provided by operating activities and proceeds associated with sales of subsidiaries, property, plant and equipment, and sales and returns of investments from the Consolidated Statement of Cash Flows. This cash flow reflects the total sources of cash from both operating the Corporation’s assets and from the divesting of assets. The Corporation employs a long-standing and regular disciplined review process to ensure that all assets are contributing to the Corporation’s strategic objectives. Assets are divested when they are no longer meeting these objectives or are worth considerably more to others. Because of the regular nature of this activity, we believe it is useful for investors to consider proceeds associated with asset sales together with cash provided by operating activities when evaluating cash available for investment in the business and financing activities, including shareholder distributions.
Cash flow from operations and asset sales 2018 2017 2016
(millions of dollars)
Net cash provided by operating activities 36,014 30,066 22,082
Proceeds associated with sales of subsidiaries, property, plant and equipment,
and sales and returns of investments 4,123 3,103 4,275
Cash flow from operations and asset sales 40,137 33,169 26,357
Capital Employed
Capital employed is a measure of net investment. When viewed from the perspective of how the capital is used by the businesses, it includes ExxonMobil’s net share of property, plant and equipment and other assets less liabilities, excluding both short-term and long-term debt. When viewed from the perspective of the sources of capital employed in total for the Corporation, it includes ExxonMobil’s share of total debt and equity. Both of these views include ExxonMobil’s share of amounts applicable to equity companies, which the Corporation believes should be included to provide a more comprehensive measure of capital employed.
Capital employed 2018 2017 2016
(millions of dollars)
Business uses: asset and liability perspective
Total assets 346,196 348,691 330,314
Less liabilities and noncontrolling interests share of assets and liabilities
Total current liabilities excluding notes and loans payable (39,880) (39,841) (33,808)
Total long-term liabilities excluding long-term debt (69,992) (72,014) (79,914)
Noncontrolling interests share of assets and liabilities (7,958) (8,298) (8,031)
Add ExxonMobil share of debt-financed equity company net assets 3,914 3,929 4,233
Total capital employed 232,280 232,467 212,794
Total corporate sources: debt and equity perspective
Notes and loans payable 17,258 17,930 13,830
Long-term debt 20,538 24,406 28,932
ExxonMobil share of equity 191,794 187,688 167,325
Less noncontrolling interests share of total debt (1,224) (1,486) (1,526)
Add ExxonMobil share of equity company debt 3,914 3,929 4,233
Total capital employed 232,280 232,467 212,794
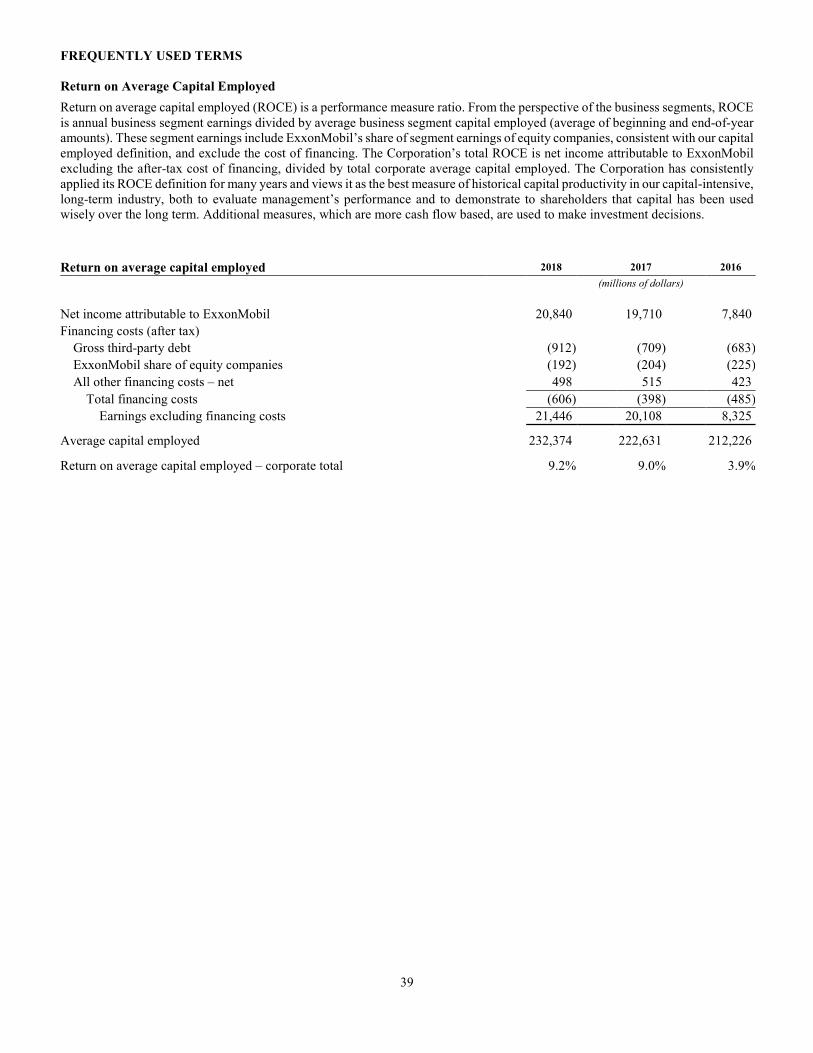
FREQUENTLY USED TERMS
39
Return on Average Capital Employed
Return on average capital employed (ROCE) is a performance measure ratio. From the perspective of the business segments, ROCE
is annual business segment earnings divided by average business segment capital employed (average of beginning and end-of-year amounts). These segment earnings include ExxonMobil’s share of segment earnings of equity companies, consistent with our capital employed definition, and exclude the cost of financing. The Corporation’s total ROCE is net income attributable to ExxonMobil excluding the after-tax cost of financing, divided by total corporate average capital employed. The Corporation has consistently applied its ROCE definition for many years and views it as the best measure of historical capital productivity in our capital-intensive, long-term industry, both to evaluate management’s performance and to demonstrate to shareholders that capital has been used wisely over the long term. Additional measures, which are more cash flow based, are used to make investment decisions.
Return on average capital employed 2018 2017 2016
(millions of dollars)
Net income attributable to ExxonMobil 20,840 19,710 7,840
Financing costs (after tax)
Gross third-party debt (912) (709) (683)
ExxonMobil share of equity companies (192) (204) (225)
All other financing costs – net 498 515 423
Total financing costs (606) (398) (485)
Earnings excluding financing costs 21,446 20,108 8,325
Average capital employed 232,374 222,631 212,226
Return on average capital employed – corporate total 9.2% 9.0% 3.9%
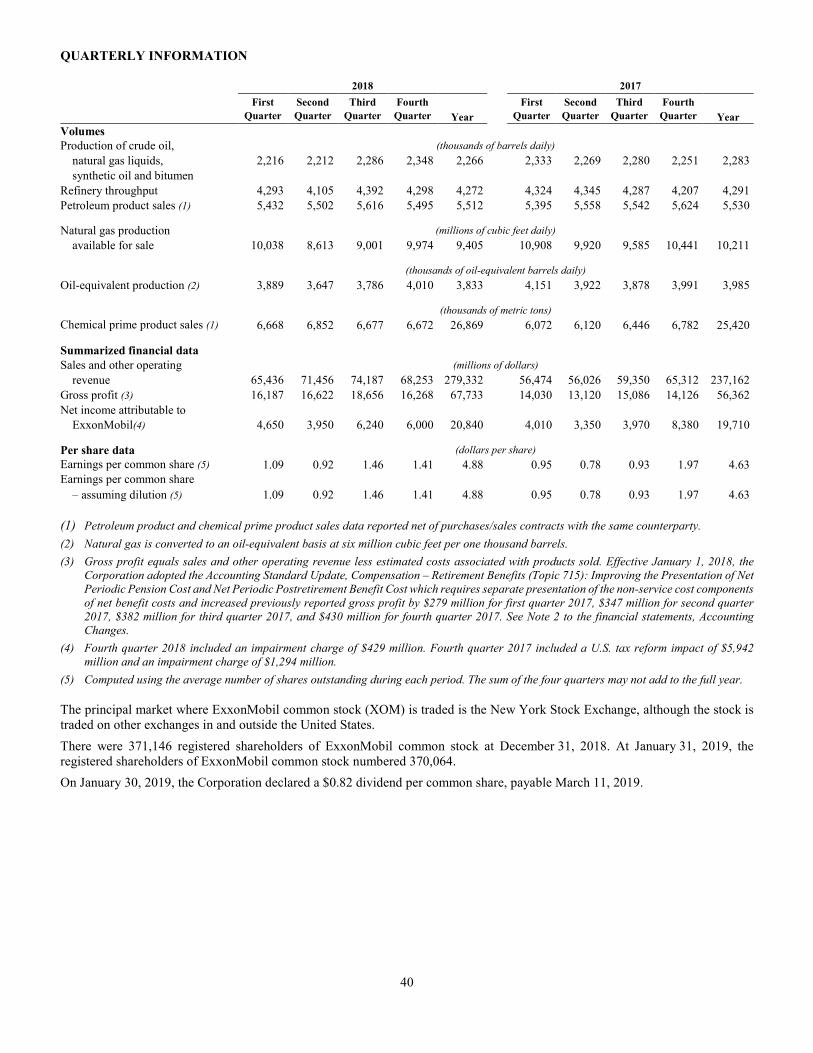
QUARTERLY INFORMATION
40
2018 2017
First Second Third Fourth First Second Third Fourth
Quarter Quarter Quarter Quarter Year Quarter Quarter Quarter Quarter Year
Volumes
Production of crude oil, (thousands of barrels daily)
natural gas liquids, 2,216 2,212 2,286 2,348 2,266 2,333 2,269 2,280 2,251 2,283
synthetic oil and bitumen
Refinery throughput 4,293 4,105 4,392 4,298 4,272 4,324 4,345 4,287 4,207 4,291
Petroleum product sales (1) 5,432 5,502 5,616 5,495 5,512 5,395 5,558 5,542 5,624 5,530
Natural gas production (millions of cubic feet daily)
available for sale 10,038 8,613 9,001 9,974 9,405 10,908 9,920 9,585 10,441 10,211
(thousands of oil-equivalent barrels daily)
Oil-equivalent production (2) 3,889 3,647 3,786 4,010 3,833 4,151 3,922 3,878 3,991 3,985
(thousands of metric tons)
Chemical prime product sales (1) 6,668 6,852 6,677 6,672 26,869 6,072 6,120 6,446 6,782 25,420
Summarized financial data
Sales and other operating (millions of dollars)
revenue 65,436 71,456 74,187 68,253 279,332 56,474 56,026 59,350 65,312 237,162
Gross profit (3) 16,187 16,622 18,656 16,268 67,733 14,030 13,120 15,086 14,126 56,362
Net income attributable to
ExxonMobil(4) 4,650 3,950 6,240 6,000 20,840 4,010 3,350 3,970 8,380 19,710
Per share data (dollars per share)
Earnings per common share (5) 1.09 0.92 1.46 1.41 4.88 0.95 0.78 0.93 1.97 4.63
Earnings per common share
– assuming dilution (5) 1.09 0.92 1.46 1.41 4.88 0.95 0.78 0.93 1.97 4.63
(1) Petroleum product and chemical prime product sales data reported net of purchases/sales contracts with the same counterparty.
(2) Natural gas is converted to an oil-equivalent basis at six million cubic feet per one thousand barrels.
(3) Gross profit equals sales and other operating revenue less estimated costs associated with products sold. Effective January 1, 2018, the
Corporation adopted the Accounting Standard Update, Compensation – Retirement Benefits (Topic 715): Improving the Presentation of Net
Periodic Pension Cost and Net Periodic Postretirement Benefit Cost which requires separate presentation of the non-service cost components
of net benefit costs and increased previously reported gross profit by $279 million for first quarter 2017, $347 million for second quarter
2017, $382 million for third quarter 2017, and $430 million for fourth quarter 2017. See Note 2 to the financial statements, Accounting
Changes.
(4) Fourth quarter 2018 included an impairment charge of $429 million. Fourth quarter 2017 included a U.S. tax reform impact of $5,942
million and an impairment charge of $1,294 million.
(5) Computed using the average number of shares outstanding during each period. The sum of the four quarters may not add to the full year.
The principal market where ExxonMobil common stock (XOM) is traded is the New York Stock Exchange, although the stock is traded on other exchanges in and outside the United States.
There were 371,146 registered shareholders of ExxonMobil common stock at December 31, 2018. At January 31, 2019, the registered shareholders of ExxonMobil common stock numbered 370,064.
On January 30, 2019, the Corporation declared a $0.82 dividend per common share, payable March 11, 2019.
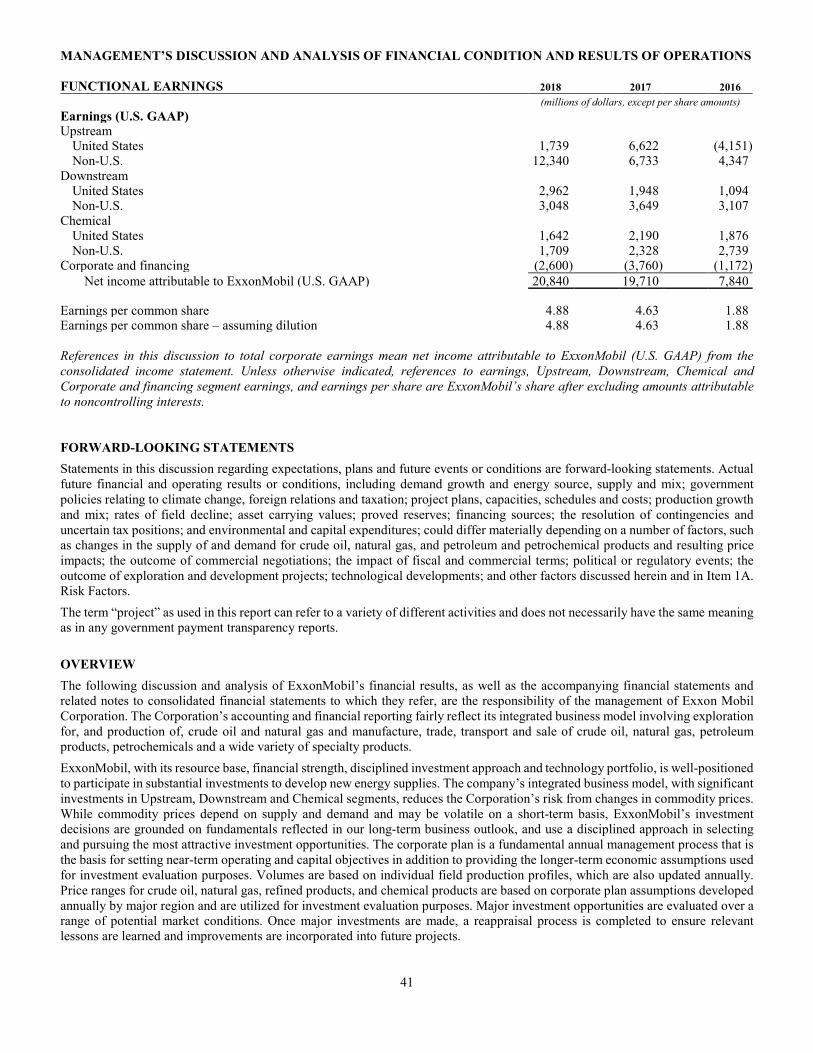
MANAGEMENT’S DISCUSSION AND ANALYSIS OF FINANCIAL CONDITION AND RESULTS OF OPERATIONS
41
FUNCTIONAL EARNINGS 2018 2017 2016
(millions of dollars, except per share amounts)
Earnings (U.S. GAAP) Upstream United States 1,739 6,622 (4,151) Non-U.S. 12,340 6,733 4,347 Downstream United States 2,962 1,948 1,094 Non-U.S. 3,048 3,649 3,107 Chemical United States 1,642 2,190 1,876 Non-U.S. 1,709 2,328 2,739 Corporate and financing (2,600) (3,760) (1,172)
Net income attributable to ExxonMobil (U.S. GAAP) 20,840 19,710 7,840
Earnings per common share 4.88 4.63 1.88 Earnings per common share – assuming dilution 4.88 4.63 1.88 References in this discussion to total corporate earnings mean net income attributable to ExxonMobil (U.S. GAAP) from the
consolidated income statement. Unless otherwise indicated, references to earnings, Upstream, Downstream, Chemical and
Corporate and financing segment earnings, and earnings per share are ExxonMobil’s share after excluding amounts attributable
to noncontrolling interests.
FORWARD-LOOKING STATEMENTS
Statements in this discussion regarding expectations, plans and future events or conditions are forward-looking statements. Actual future financial and operating results or conditions, including demand growth and energy source, supply and mix; government policies relating to climate change, foreign relations and taxation; project plans, capacities, schedules and costs; production growth and mix; rates of field decline; asset carrying values; proved reserves; financing sources; the resolution of contingencies and uncertain tax positions; and environmental and capital expenditures; could differ materially depending on a number of factors, such as changes in the supply of and demand for crude oil, natural gas, and petroleum and petrochemical products and resulting price impacts; the outcome of commercial negotiations; the impact of fiscal and commercial terms; political or regulatory events; the outcome of exploration and development projects; technological developments; and other factors discussed herein and in Item 1A. Risk Factors.
The term “project” as used in this report can refer to a variety of different activities and does not necessarily have the same meaning as in any government payment transparency reports.
OVERVIEW
The following discussion and analysis of ExxonMobil’s financial results, as well as the accompanying financial statements and related notes to consolidated financial statements to which they refer, are the responsibility of the management of Exxon Mobil Corporation. The Corporation’s accounting and financial reporting fairly reflect its integrated business model involving exploration for, and production of, crude oil and natural gas and manufacture, trade, transport and sale of crude oil, natural gas, petroleum products, petrochemicals and a wide variety of specialty products.
ExxonMobil, with its resource base, financial strength, disciplined investment approach and technology portfolio, is well-positioned to participate in substantial investments to develop new energy supplies. The company’s integrated business model, with significant investments in Upstream, Downstream and Chemical segments, reduces the Corporation’s risk from changes in commodity prices. While commodity prices depend on supply and demand and may be volatile on a short-term basis, ExxonMobil’s investment decisions are grounded on fundamentals reflected in our long-term business outlook, and use a disciplined approach in selecting and pursuing the most attractive investment opportunities. The corporate plan is a fundamental annual management process that is the basis for setting near-term operating and capital objectives in addition to providing the longer-term economic assumptions used for investment evaluation purposes. Volumes are based on individual field production profiles, which are also updated annually. Price ranges for crude oil, natural gas, refined products, and chemical products are based on corporate plan assumptions developed annually by major region and are utilized for investment evaluation purposes. Major investment opportunities are evaluated over a range of potential market conditions. Once major investments are made, a reappraisal process is completed to ensure relevant lessons are learned and improvements are incorporated into future projects.
MANAGEMENT’S DISCUSSION AND ANALYSIS OF FINANCIAL CONDITION AND RESULTS OF OPERATIONS
42
BUSINESS ENVIRONMENT AND RISK ASSESSMENT
Long-Term Business Outlook
The Long-Term Business Outlook is based on the Corporation’s 2018 Outlook for Energy, which is used to help inform our long term business strategies and investment plans. By 2040, the world’s population is projected at around 9.2 billion people, or about 1.7 billion more than in 2016. Coincident with this population increase, the Corporation expects worldwide economic growth to average close to 3 percent per year, with economic output nearly doubling by 2040. As economies and populations grow, and as living standards improve for billions of people, the need for energy is expected to continue to rise. Even with significant efficiency gains, global energy demand is projected to rise by about 25 percent from 2016 to 2040. This increase in energy demand is expected to be driven by developing countries (i.e., those that are not member nations of the Organisation for Economic Co-operation and Development (OECD)).
As expanding prosperity helps drive global energy demand higher, increasing use of energy efficient technologies and practices as
well as lower-emission fuels will continue to help significantly reduce energy consumption and emissions per unit of economic output over time. Substantial efficiency gains are likely in all key aspects of the world’s economy through 2040, affecting energy requirements for power generation, transportation, industrial applications, and residential and commercial needs.
Global electricity demand is expected to increase approximately 60 percent from 2016 to 2040, with developing countries likely to account for about 85 percent of the increase. Consistent with this projection, power generation is expected to remain the largest and fastest growing major segment of global primary energy demand, supported by a wide variety of energy sources. The share of coal fired generation is likely to decline substantially and approach 25 percent of the world’s electricity in 2040, versus nearly 40 percent in 2016, in part as a result of policies to improve air quality as well as reduce greenhouse gas emissions to address the risks of climate change. From 2016 to 2040, the amount of electricity supplied using natural gas, nuclear power, and renewables is likely to nearly double, and account for about 95 percent of the growth in electricity supplies. Electricity from wind and solar is likely to increase about 400 percent, helping total renewables (including other sources, e.g. hydropower) to account for about half of the increase in electricity supplies worldwide through 2040. Total renewables will likely reach nearly 35 percent of global electricity supplies by 2040. Natural gas and nuclear are also expected to increase shares over the period to 2040, reaching about 25 percent and 12 percent of global electricity supplies respectively by 2040. Supplies of electricity by energy type will reflect significant differences across regions reflecting a wide range of factors including the cost and availability of various energy supplies.
Energy for transportation – including cars, trucks, ships, trains and airplanes – is expected to increase approximately 30 percent from 2016 to 2040. Transportation energy demand is likely to account for approximately 60 percent of the growth in liquid fuels demand worldwide over this period. Liquid fuels demand for light-duty vehicles is expected to remain relatively flat to 2040 as the impact of better fuel economy and significant growth in electric cars, led by China, Europe, and the United States, work to offset growth in the worldwide car fleet of about 75 percent. By 2040, light-duty vehicles are expected to account for about 20 percent of global liquid fuels demand. During the same time period, nearly all the world’s transportation fleets are likely to continue to run on liquid fuels, which are widely available and offer practical advantages in providing a large quantity of energy in small volumes.
Liquid fuels provide the largest share of global energy supplies today reflecting broad-based availability, affordability, ease of transportation, and fitness as a practical solution to meet a wide variety of needs. By 2040, global demand for liquid fuels is projected to grow to approximately 118 million barrels of oil equivalent per day, an increase of about 20 percent from 2016. The non-OECD share of global liquid fuels demand is expected to increase to about 65 percent by 2040, as liquid fuels demand in the OECD is likely to decline by close to 10 percent. Much of the global liquid fuels demand today is met by crude production from traditional conventional sources; these supplies will remain important and significant development activity is expected to offset much of the natural declines from these fields. At the same time, a variety of emerging supply sources – including tight oil, deepwater, oil sands, natural gas liquids and biofuels – are expected to grow to help meet rising demand. The world’s resource base is sufficient to meet projected demand through 2040 as technology advances continue to expand the availability of economic supply options. However, timely investments will remain critical to meeting global needs with reliable and affordable supplies.
Natural gas is a versatile and practical fuel for a wide variety of applications, and it is expected to grow the most of any primary energy type from 2016 to 2040, meeting more than 35 percent of global energy demand growth. Global natural gas demand is expected to rise nearly 40 percent from 2016 to 2040, with about 45 percent of that increase in the Asia Pacific region. Significant growth in supplies of unconventional gas – the natural gas found in shale and other tight rock formations – will help meet these needs. In total, about 55 percent of the growth in natural gas supplies is expected to be from unconventional sources. At the same time, conventionally-produced natural gas is likely to remain the cornerstone of global supply, meeting about two-thirds of worldwide demand in 2040. Liquefied natural gas (LNG) trade will expand significantly, meeting about one-third of the increase in global demand growth, with much of this supply expected to help meet rising demand in Asia Pacific.
MANAGEMENT’S DISCUSSION AND ANALYSIS OF FINANCIAL CONDITION AND RESULTS OF OPERATIONS
43
The world’s energy mix is highly diverse and will remain so through 2040. Oil is expected to remain the largest source of energy with its share remaining close to one third in 2040. Coal is currently the second largest source of energy, but it is likely to lose that position to natural gas in the 2020-2025 timeframe. The share of natural gas is expected to reach 25 percent by 2040, while the share of coal falls to about 20 percent. Nuclear power is projected to grow significantly, as many nations are likely to expand nuclear capacity to address rising electricity needs as well as energy security and environmental issues. Total renewable energy is likely to exceed 15 percent of global energy by 2040, with biomass, hydro and geothermal contributing a combined share of more than 10 percent. Total energy supplied from wind, solar and biofuels is expected to increase rapidly, growing nearly 250 percent from 2016 to 2040, when they will likely be about 5 percent of the world energy mix.
The Corporation anticipates that the world’s available oil and gas resource base will grow not only from new discoveries, but also from increases in previously discovered fields. Technology will underpin these increases. The investments to develop and supply resources to meet global demand through 2040 will be significant – even if demand remains flat. This reflects a fundamental aspect of the oil and natural gas business, in that, as the International Energy Agency (IEA) notes in its World Energy Outlook 2018, a “key underlying driver for new investment is declining output from existing fields.” According to the IEA’s New Policies Scenario, the investment required to meet oil and natural gas supply requirements worldwide over the period 2018-2040 will be about $21 trillion (measured in 2017 dollars) or approximately $900 billion per year on average.
International accords and underlying regional and national regulations covering greenhouse gas emissions continue to evolve with uncertain timing and outcome, making it difficult to predict their business impact. For many years, the Corporation has taken into account policies established to reduce energy related greenhouse gas emissions in its long-term Outlook for Energy. The climate accord reached at the Conference of the Parties (COP 21) in Paris set many new goals, and many related policies are still emerging. Our Outlook reflects an environment with increasingly stringent climate policies and is consistent with the aggregation of Nationally Determined Contributions which were submitted by signatories to the United Nations Framework Convention on Climate Change (UNFCCC) 2015 Paris Agreement. Our Outlook seeks to identify potential impacts of climate related policies, which often target specific sectors. It estimates potential impacts of these policies on consumer energy demand by using various assumptions and tools – including, depending on the sector, application of a proxy cost of carbon or assessment of targeted policies (e.g. automotive fuel economy standards). For purposes of the Outlook, a proxy cost on energy-related CO2 emissions is assumed to reach about $80 per tonne on average in 2040 in OECD nations. China and other leading non-OECD nations are expected to trail OECD policy initiatives. Nevertheless, as people and nations look for ways to reduce risks of global climate change, they will continue to need practical solutions that do not jeopardize the affordability or reliability of the energy they need.
Practical solutions to the world’s energy and climate challenges will benefit from market competition as well as well informed, well designed, and transparent policy approaches that carefully weigh costs and benefits. Such policies are likely to help manage the risks of climate change while also enabling societies to pursue other high priority goals around the world – including clean air and water, access to reliable, affordable energy, and economic progress for all people. All practical and economically-viable energy sources, both conventional and unconventional, will need to be pursued to continue meeting global energy demand, recognizing the scale and variety of worldwide energy needs as well as the importance of expanding access to modern energy to promote better standards of living for billions of people.
The information provided in the Long-Term Business Outlook includes ExxonMobil’s internal estimates and forecasts based upon internal data and analyses as well as publicly available information from external sources including the International Energy Agency.
Upstream
ExxonMobil continues to sustain a diverse growth portfolio of exploration and development opportunities, which enables the Corporation to be selective, maximizing shareholder value and mitigating political and technical risks. ExxonMobil’s fundamental strategies guide our global Upstream business, including capturing material and accretive opportunities to continually high-grade the resource portfolio, selectively developing attractive oil and natural gas resources, developing and applying high-impact technologies, and pursuing productivity and efficiency gains. These strategies are underpinned by a relentless focus on operational excellence, development of our employees, and investment in the communities within which we operate.
As future development projects and drilling activities bring new production online, the Corporation expects a shift in the geographic mix and in the type of opportunities from which volumes are produced. Based on current investment plans, oil-equivalent production from the Americas is expected to increase to be a majority of total production over the next several years. Further, the proportion of our global production from unconventional, deepwater, and LNG resource types, currently contributes over a third of global production, and is expected to grow to be more than half in the next few years.
MANAGEMENT’S DISCUSSION AND ANALYSIS OF FINANCIAL CONDITION AND RESULTS OF OPERATIONS
44
The Corporation anticipates several projects will come online over the next few years providing additional production capacity. However, actual volumes will vary from year to year due to the timing of individual project start-ups; operational outages; reservoir performance; performance of enhanced oil recovery projects; regulatory changes; the impact of fiscal and commercial terms; asset sales; weather events; price effects on production sharing contracts; changes in the amount and timing of capital investments that may vary depending on the oil and gas price environment; and other factors described in Item 1A. Risk Factors.
The markets for crude oil and natural gas have a history of significant price volatility. ExxonMobil believes prices over the long term will continue to be driven by market supply and demand, with the demand side largely being a function of general economic activities, levels of prosperity, technology advances, consumer preference and government policies. On the supply side, prices may be significantly impacted by political events, the actions of OPEC and other large government resource owners, and other factors. To manage the risks associated with price, ExxonMobil evaluates annual plans and major investments across a range of price scenarios.
In 2018, the Upstream business produced 3.8 million oil-equivalent barrels per day. During the year, the Corporation added 4.5 billion oil-equivalent barrels of proved reserves. The Corporation continued to have exploration success in Guyana and also made strategic acreage acquisitions in Mozambique, Brazil, Papua New Guinea and U.S. tight oil.
Downstream
ExxonMobil’s Downstream is a large, diversified business with global logistics, trading, refining, and marketing. The Corporation has a presence with established markets in the Americas and Europe, as well as in the growing Asia Pacific region.
ExxonMobil’s fundamental Downstream business strategies competitively position the company across a range of market conditions. These strategies include targeting best in class operations in all aspects of the business, maximizing value from advanced technologies, capitalizing on integration across ExxonMobil businesses, selectively investing for resilient, advantaged returns, operating efficiently and effectively, and providing quality, valued and differentiated products and services to customers.
ExxonMobil’s operating results, as noted in Item 2. Properties, reflect 21 refineries, located in 14 countries, with distillation capacity of 4.7 million barrels per day and lubricant basestock manufacturing capacity of 128 thousand barrels per day. ExxonMobil’s fuels and lubes value chains have significant global reach, with multiple channels to market serving a diverse customer base. Our portfolio of world-renowned brands includes Exxon, Mobil, Esso, Synergy, and Mobil 1.
Demand for products continued to grow in 2018. North America’s margins strengthened and refineries within the region also benefitted from crude differentials associated with the Permian Basin and Western Canada. Margins in Europe and Asia weakened under pressure from lower cost production from North America and increased product exports from China. In the near term, we see variability in refining margins as new capacity additions are expected to outpace capacity rationalization and growth in global demand, which can also be affected by global economic conditions and regulatory changes.
Refining margins are largely driven by differences in commodity prices and are a function of the difference between what a refinery pays for its raw materials (primarily crude oil) and the market prices for the range of products produced (primarily gasoline, heating oil, diesel oil, jet fuel and fuel oil). Crude oil and many products are widely traded with published prices, including those quoted on multiple exchanges around the world (e.g., New York Mercantile Exchange and Intercontinental Exchange). Prices for these commodities are determined by the global marketplace and are influenced by many factors, including global and regional supply/demand balances, inventory levels, industry refinery operations, import/export balances, currency fluctuations, seasonal demand, weather, and political climate.
ExxonMobil’s long term outlook is that industry refining margins will remain volatile subject to the pace of new capacity growth relative to global demand growth. ExxonMobil’s integration including logistics, trading, refining, and marketing enhances our ability to generate returns across the value chain in both fuels and lubricants businesses.
As described in more detail in Item 1A. Risk Factors, proposed carbon policy and other climate related regulations in many countries, as well as the continued growth in biofuels mandates, could have negative impacts on the Downstream business.
MANAGEMENT’S DISCUSSION AND ANALYSIS OF FINANCIAL CONDITION AND RESULTS OF OPERATIONS
45
ExxonMobil continued to progress the multi-year transition of the direct served (i.e., dealer, company operated) retail network in portions of Europe to a more capital efficient Branded Wholesaler model. The lubricants business continues to grow, leveraging world class brands and integration with industry leading basestock refining capability. Through the Mobil Branded properties, such as Mobil 1, Mobil is the worldwide leader among synthetic motors oils.
The Downstream portfolio is continually evaluated during all parts of the business cycle, and numerous asset divestments have been made over the past decade. When investing in the Downstream, ExxonMobil remains focused on selective and resilient projects. At the end of 2018, three key projects are in operation with the new delayed coker unit at the refinery in Antwerp, Belgium, to upgrade low value bunker fuel into higher value diesel products, and the proprietary hydrocracker at the refinery in Rotterdam, Netherlands, to produce higher value ultra-low sulfur diesel and Group II basestocks. Finally, the new hydrofiner at the Beaumont, Texas, refinery was completed, which increases production of ultra-low sulfur fuels by approximately 40,000 barrels per day.
Chemical
ExxonMobil is a major manufacturer and marketer of petrochemicals and a wide variety of specialty products. ExxonMobil sustains its competitive advantage through continued operational excellence, investment and cost discipline, a balanced portfolio of products, and integration with downstream and upstream operations, all underpinned by proprietary technology.
Demand for products continued to grow in 2018. Polyolefin and specialty product margins weakened with capacity additions outpacing global demand growth.
Over the long term, demand for chemical products is forecast to outpace growth in global GDP and energy demand for the next two decades. ExxonMobil estimates that global demand for chemicals will rise by approximately 45 percent over the next decade. ExxonMobil’s integration with refining enhances our ability to generate returns across the value chain in chemical businesses.
In 2018, we completed start-up of the new world-scale ethane cracker in Baytown, Texas, the specialty elastomer plant expansion in Newport, Wales, and the new halobutyl rubber unit in Singapore to further extend our specialty product capacity. Construction continues on the expansion of the polyethylene plant in Beaumont, Texas, with startup anticipated in 2019, to capitalize on advantaged feedstock and energy supplies in North America and to meet rapidly growing demand for performance polymers. Work continues to integrate the Singapore Banyan Aromatics unit, acquired in 2017, with our other Singapore facilities to meet growing demand for chemicals products in Asia Pacific. In addition, ExxonMobil announced plans for a flexible-feed cracker in Guangdong Province, China, and a joint venture ethane cracker and associated products with SABIC to be located in San Patricio County, Texas.
MANAGEMENT’S DISCUSSION AND ANALYSIS OF FINANCIAL CONDITION AND RESULTS OF OPERATIONS
46
REVIEW OF 2018 AND 2017 RESULTS 2018 2017 2016
(millions of dollars)
Earnings (U.S. GAAP) Net income attributable to ExxonMobil (U.S. GAAP) 20,840 19,710 7,840
Upstream 2018 2017 2016
(millions of dollars)
Upstream United States 1,739 6,622 (4,151) Non-U.S. 12,340 6,733 4,347
Total 14,079 13,355 196
2018
Upstream earnings were $14,079 million, up $724 million from 2017.
• Higher realizations increased earnings by $7 billion.
• Unfavorable volume and mix effects decreased earnings by $240 million.
• All other items decreased earnings by $6.1 billion, primarily due to lower favorable impacts of $6.9 billion from U.S. tax reform, partly offset by lower asset impairments of $1.1 billion.
• U.S. Upstream earnings were $1,739 million, including asset impairments of $297 million.
• Non-U.S. Upstream earnings were $12,340 million, including a favorable impact of $271 million from U.S. tax reform.
• On an oil-equivalent basis, production of 3.8 million barrels per day was down 4 percent compared to 2017.
• Liquids production of 2.3 million barrels per day decreased 17,000 barrels per day as growth in North America was more than offset by decline, lower entitlements, and divestments.
• Natural gas production of 9.4 billion cubic feet per day decreased 806 million cubic feet per day from 2017 due to decline, lower entitlements, divestments, and higher downtime.
2017
Upstream earnings were $13,355 million, up $13,159 million from 2016.
• Higher realizations increased earnings by $5.3 billion.
• Unfavorable volume and mix effects decreased earnings by $440 million.
• All other items increased earnings by $8.3 billion, primarily due to the $7.1 billion non-cash impact from U.S. tax reform, lower asset impairments of $659 million, lower expenses, and gains from asset management activity.
• U.S. Upstream earnings were $6,622 million in 2017, including $7.6 billion of U.S. tax reform benefits and asset impairments of $521 million.
• Non-U.S. Upstream earnings were $6,733 million, including asset impairments of $983 million and unfavorable impacts of $480 million from U.S. tax reform.
• On an oil-equivalent basis, production of 4 million barrels per day was down 2 percent compared to 2016.
• Liquids production of 2.3 million barrels per day decreased 82,000 barrels per day as field decline and lower entitlements were partly offset by increased project volumes and work programs.
• Natural gas production of 10.2 billion cubic feet per day increased 84 million cubic feet per day from 2016 as project ramp-up, primarily in Australia, was partly offset by field decline and regulatory restrictions in the Netherlands.
MANAGEMENT’S DISCUSSION AND ANALYSIS OF FINANCIAL CONDITION AND RESULTS OF OPERATIONS
47
Upstream Additional Information
2018 2017
(thousands of barrels daily)
Volumes Reconciliation (Oil-equivalent production) (1)
Prior Year 3,985 4,053
Entitlements - Net Interest (3) -
Entitlements - Price / Spend / Other (68) (62)
Quotas - -
Divestments (58) (15)
Growth / Other (23) 9
Current Year 3,833 3,985
(1) Natural gas is converted to an oil-equivalent basis at six million cubic feet per one thousand barrels.
Listed below are descriptions of ExxonMobil’s volumes reconciliation factors which are provided to facilitate understanding of the terms. Entitlements - Net Interest are changes to ExxonMobil’s share of production volumes caused by non-operational changes to volume-determining factors. These factors consist of net interest changes specified in Production Sharing Contracts (PSCs) which typically occur when cumulative investment returns or production volumes achieve defined thresholds, changes in equity upon achieving pay-out in partner investment carry situations, equity redeterminations as specified in venture agreements, or as a result of the termination or expiry of a concession. Once a net interest change has occurred, it typically will not be reversed by subsequent events, such as lower crude oil prices.
Entitlements - Price, Spend and Other are changes to ExxonMobil’s share of production volumes resulting from temporary changes to non-operational volume-determining factors. These factors include changes in oil and gas prices or spending levels from one period to another. According to the terms of contractual arrangements or government royalty regimes, price or spending variability can increase or decrease royalty burdens and/or volumes attributable to ExxonMobil. For example, at higher prices, fewer barrels are required for ExxonMobil to recover its costs. These effects generally vary from period to period with field spending patterns or market prices for oil and natural gas. Such factors can also include other temporary changes in net interest as dictated by specific provisions in production agreements.
Quotas are changes in ExxonMobil’s allowable production arising from production constraints imposed by countries which are members of the Organization of the Petroleum Exporting Countries (OPEC). Volumes reported in this category would have been readily producible in the absence of the quota.
Divestments are reductions in ExxonMobil’s production arising from commercial arrangements to fully or partially reduce equity in a field or asset in exchange for financial or other economic consideration.
Growth and Other factors comprise all other operational and non-operational factors not covered by the above definitions that may affect volumes attributable to ExxonMobil. Such factors include, but are not limited to, production enhancements from project and work program activities, acquisitions including additions from asset exchanges, downtime, market demand, natural field decline, and any fiscal or commercial terms that do not affect entitlements.
MANAGEMENT’S DISCUSSION AND ANALYSIS OF FINANCIAL CONDITION AND RESULTS OF OPERATIONS
48
Downstream 2018 2017 2016
(millions of dollars)
Downstream United States 2,962 1,948 1,094 Non-U.S. 3,048 3,649 3,107
Total 6,010 5,597 4,201
2018
Downstream earnings of $6,010 million increased $413 million from 2017.
• Margins increased earnings by $660 million primarily due to the capture of North American crude differentials.
• Volume and mix effects increased earnings by $650 million due to improved yield/sales mix.
• All other items decreased earnings by $900 million, mainly driven by the absence of favorable U.S. tax reform impacts of $618 million, unfavorable foreign exchange impacts, and higher downtime/maintenance, partly offset by higher divestment gains and favorable tax impacts.
• U.S. Downstream earnings were $2,962 million, compared to $1,948 million in the prior year which included a favorable impact of $618 million from U.S. tax reform.
• Non-U.S. Downstream earnings were $3,048 million, compared to $3,649 million in the prior year.
• Petroleum product sales of 5.5 million barrels per day were 18,000 barrels per day lower than 2017.
2017
Downstream earnings of $5,597 million increased $1,396 million from 2016.
• Stronger refining and marketing margins increased earnings by $1.5 billion.
• Volume and mix effects decreased earnings by $30 million.
• All other items decreased earnings by $40 million, driven by the absence of a $904 million gain from the Canadian retail assets sale, and Hurricane Harvey related expenses, which were mostly offset by $618 million of U.S. tax reform impacts and non-U.S. asset management gains in 2017.
• U.S. Downstream earnings were $1,948 million, including favorable U.S. tax reform impacts of $618 million.
• Non-U.S. Downstream earnings were $3,649 million, compared to $3,107 million in the prior year.
• Petroleum product sales of 5.5 million barrels per day were 48,000 barrels per day higher than 2016.
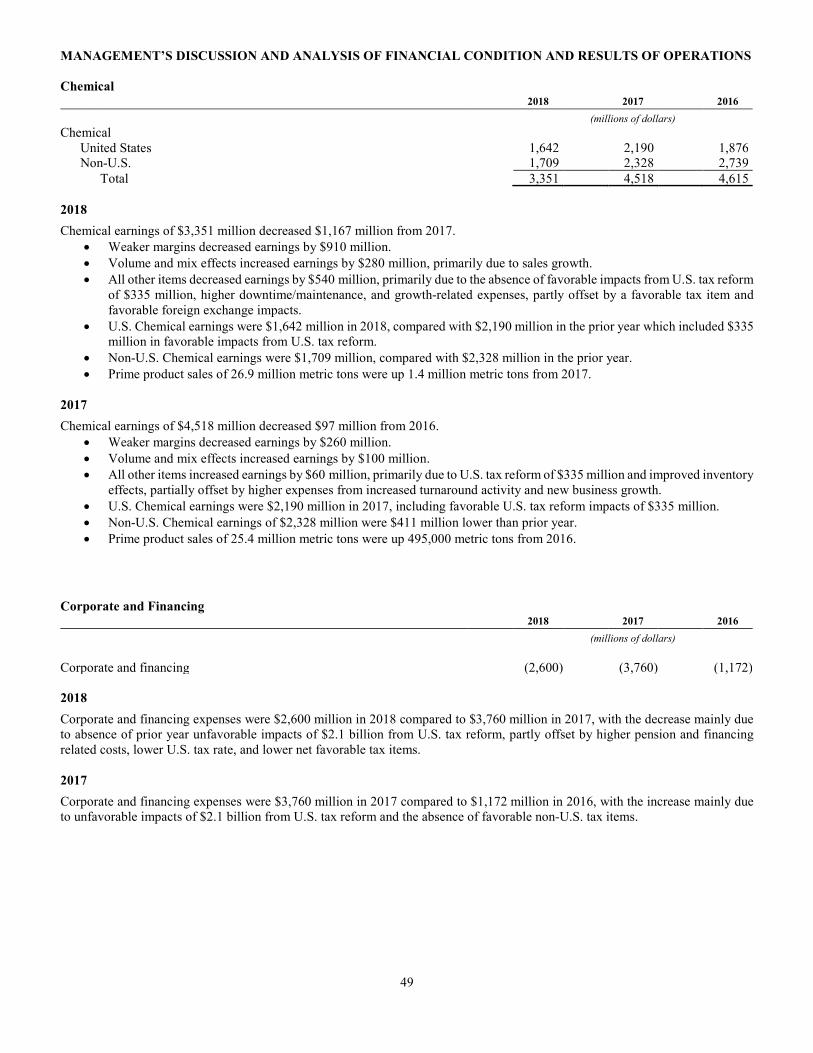
MANAGEMENT’S DISCUSSION AND ANALYSIS OF FINANCIAL CONDITION AND RESULTS OF OPERATIONS
49
Chemical 2018 2017 2016
(millions of dollars)
Chemical United States 1,642 2,190 1,876 Non-U.S. 1,709 2,328 2,739
Total 3,351 4,518 4,615
2018
Chemical earnings of $3,351 million decreased $1,167 million from 2017.
• Weaker margins decreased earnings by $910 million.
• Volume and mix effects increased earnings by $280 million, primarily due to sales growth.
• All other items decreased earnings by $540 million, primarily due to the absence of favorable impacts from U.S. tax reform of $335 million, higher downtime/maintenance, and growth-related expenses, partly offset by a favorable tax item and favorable foreign exchange impacts.
• U.S. Chemical earnings were $1,642 million in 2018, compared with $2,190 million in the prior year which included $335 million in favorable impacts from U.S. tax reform.
• Non-U.S. Chemical earnings were $1,709 million, compared with $2,328 million in the prior year.
• Prime product sales of 26.9 million metric tons were up 1.4 million metric tons from 2017.
2017
Chemical earnings of $4,518 million decreased $97 million from 2016.
• Weaker margins decreased earnings by $260 million.
• Volume and mix effects increased earnings by $100 million.
• All other items increased earnings by $60 million, primarily due to U.S. tax reform of $335 million and improved inventory effects, partially offset by higher expenses from increased turnaround activity and new business growth.
• U.S. Chemical earnings were $2,190 million in 2017, including favorable U.S. tax reform impacts of $335 million.
• Non-U.S. Chemical earnings of $2,328 million were $411 million lower than prior year.
• Prime product sales of 25.4 million metric tons were up 495,000 metric tons from 2016. Corporate and Financing
2018 2017 2016
(millions of dollars)
Corporate and financing (2,600) (3,760) (1,172)
2018
Corporate and financing expenses were $2,600 million in 2018 compared to $3,760 million in 2017, with the decrease mainly due to absence of prior year unfavorable impacts of $2.1 billion from U.S. tax reform, partly offset by higher pension and financing related costs, lower U.S. tax rate, and lower net favorable tax items.
2017
Corporate and financing expenses were $3,760 million in 2017 compared to $1,172 million in 2016, with the increase mainly due to unfavorable impacts of $2.1 billion from U.S. tax reform and the absence of favorable non-U.S. tax items.
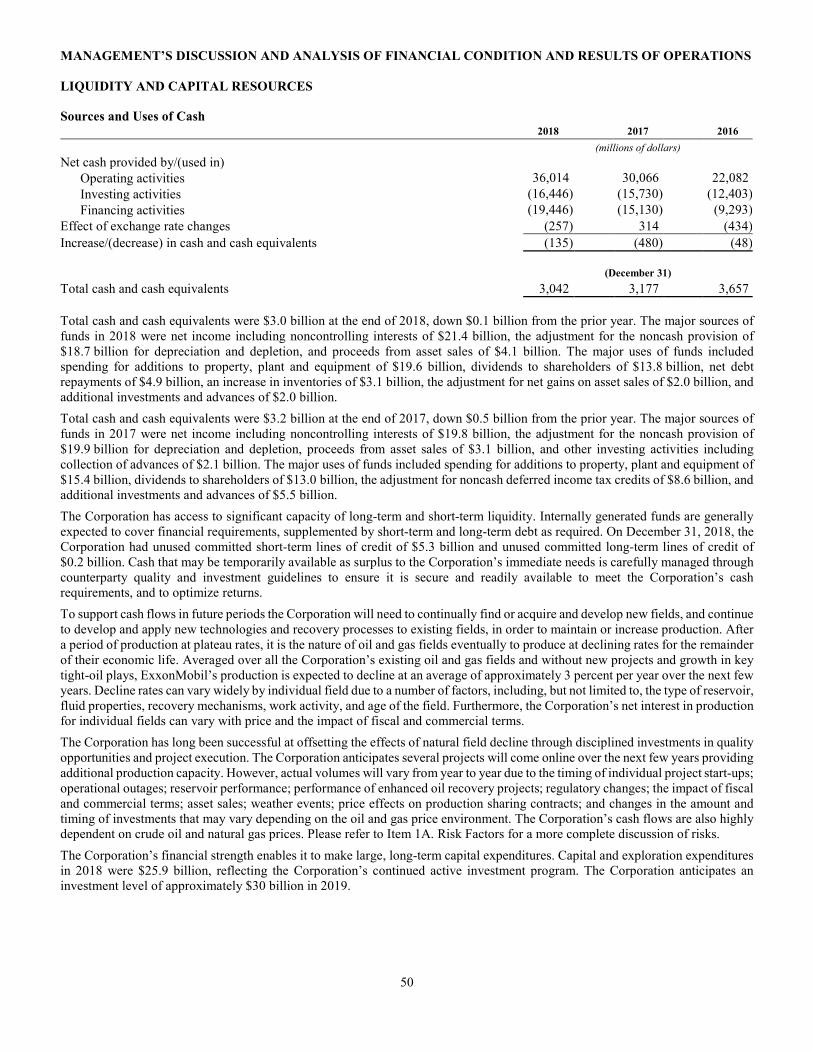
MANAGEMENT’S DISCUSSION AND ANALYSIS OF FINANCIAL CONDITION AND RESULTS OF OPERATIONS
50
LIQUIDITY AND CAPITAL RESOURCES Sources and Uses of Cash 2018 2017 2016
(millions of dollars)
Net cash provided by/(used in)
Operating activities 36,014 30,066 22,082
Investing activities (16,446) (15,730) (12,403)
Financing activities (19,446) (15,130) (9,293)
Effect of exchange rate changes (257) 314 (434)
Increase/(decrease) in cash and cash equivalents (135) (480) (48)
(December 31)
Total cash and cash equivalents 3,042 3,177 3,657
Total cash and cash equivalents were $3.0 billion at the end of 2018, down $0.1 billion from the prior year. The major sources of funds in 2018 were net income including noncontrolling interests of $21.4 billion, the adjustment for the noncash provision of $18.7 billion for depreciation and depletion, and proceeds from asset sales of $4.1 billion. The major uses of funds included spending for additions to property, plant and equipment of $19.6 billion, dividends to shareholders of $13.8 billion, net debt repayments of $4.9 billion, an increase in inventories of $3.1 billion, the adjustment for net gains on asset sales of $2.0 billion, and additional investments and advances of $2.0 billion.
Total cash and cash equivalents were $3.2 billion at the end of 2017, down $0.5 billion from the prior year. The major sources of funds in 2017 were net income including noncontrolling interests of $19.8 billion, the adjustment for the noncash provision of $19.9 billion for depreciation and depletion, proceeds from asset sales of $3.1 billion, and other investing activities including collection of advances of $2.1 billion. The major uses of funds included spending for additions to property, plant and equipment of $15.4 billion, dividends to shareholders of $13.0 billion, the adjustment for noncash deferred income tax credits of $8.6 billion, and additional investments and advances of $5.5 billion.
The Corporation has access to significant capacity of long-term and short-term liquidity. Internally generated funds are generally expected to cover financial requirements, supplemented by short-term and long-term debt as required. On December 31, 2018, the Corporation had unused committed short-term lines of credit of $5.3 billion and unused committed long-term lines of credit of $0.2 billion. Cash that may be temporarily available as surplus to the Corporation’s immediate needs is carefully managed through counterparty quality and investment guidelines to ensure it is secure and readily available to meet the Corporation’s cash requirements, and to optimize returns.
To support cash flows in future periods the Corporation will need to continually find or acquire and develop new fields, and continue to develop and apply new technologies and recovery processes to existing fields, in order to maintain or increase production. After a period of production at plateau rates, it is the nature of oil and gas fields eventually to produce at declining rates for the remainder of their economic life. Averaged over all the Corporation’s existing oil and gas fields and without new projects and growth in key tight-oil plays, ExxonMobil’s production is expected to decline at an average of approximately 3 percent per year over the next few years. Decline rates can vary widely by individual field due to a number of factors, including, but not limited to, the type of reservoir, fluid properties, recovery mechanisms, work activity, and age of the field. Furthermore, the Corporation’s net interest in production for individual fields can vary with price and the impact of fiscal and commercial terms.
The Corporation has long been successful at offsetting the effects of natural field decline through disciplined investments in quality opportunities and project execution. The Corporation anticipates several projects will come online over the next few years providing additional production capacity. However, actual volumes will vary from year to year due to the timing of individual project start-ups; operational outages; reservoir performance; performance of enhanced oil recovery projects; regulatory changes; the impact of fiscal and commercial terms; asset sales; weather events; price effects on production sharing contracts; and changes in the amount and timing of investments that may vary depending on the oil and gas price environment. The Corporation’s cash flows are also highly dependent on crude oil and natural gas prices. Please refer to Item 1A. Risk Factors for a more complete discussion of risks.
The Corporation’s financial strength enables it to make large, long-term capital expenditures. Capital and exploration expenditures in 2018 were $25.9 billion, reflecting the Corporation’s continued active investment program. The Corporation anticipates an investment level of approximately $30 billion in 2019.
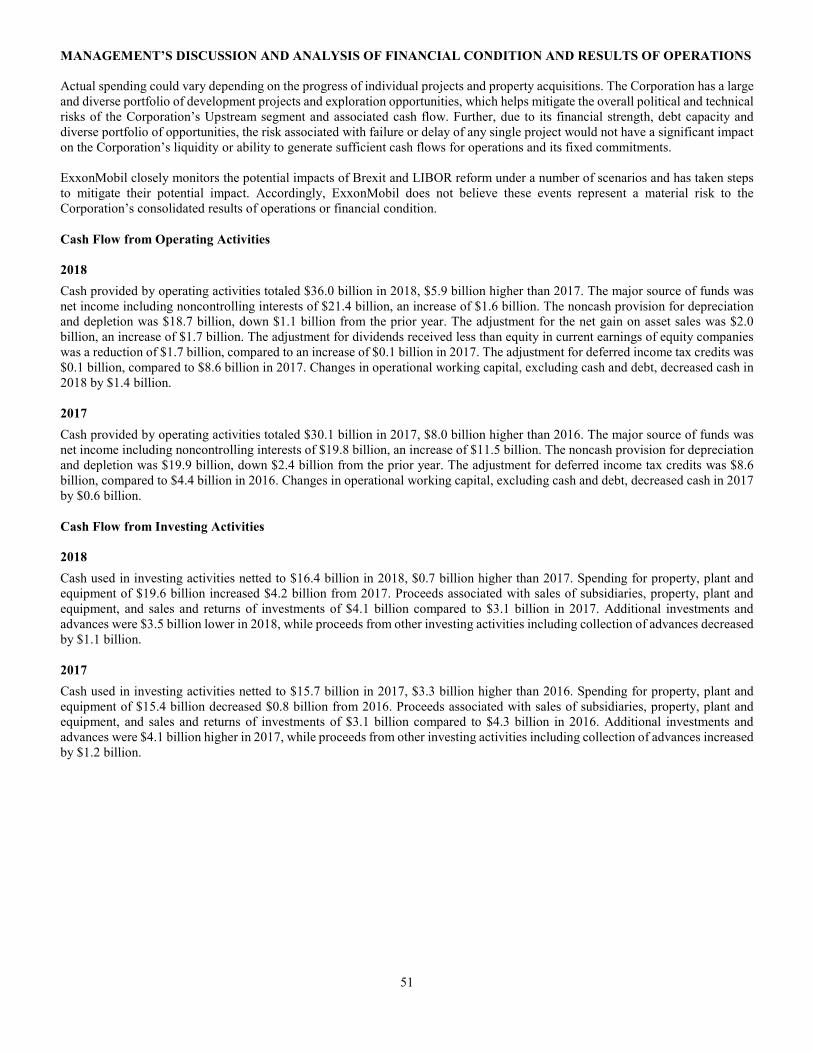
MANAGEMENT’S DISCUSSION AND ANALYSIS OF FINANCIAL CONDITION AND RESULTS OF OPERATIONS
51
Actual spending could vary depending on the progress of individual projects and property acquisitions. The Corporation has a large and diverse portfolio of development projects and exploration opportunities, which helps mitigate the overall political and technical risks of the Corporation’s Upstream segment and associated cash flow. Further, due to its financial strength, debt capacity and diverse portfolio of opportunities, the risk associated with failure or delay of any single project would not have a significant impact on the Corporation’s liquidity or ability to generate sufficient cash flows for operations and its fixed commitments. ExxonMobil closely monitors the potential impacts of Brexit and LIBOR reform under a number of scenarios and has taken steps to mitigate their potential impact. Accordingly, ExxonMobil does not believe these events represent a material risk to the Corporation’s consolidated results of operations or financial condition.
Cash Flow from Operating Activities
2018
Cash provided by operating activities totaled $36.0 billion in 2018, $5.9 billion higher than 2017. The major source of funds was net income including noncontrolling interests of $21.4 billion, an increase of $1.6 billion. The noncash provision for depreciation and depletion was $18.7 billion, down $1.1 billion from the prior year. The adjustment for the net gain on asset sales was $2.0 billion, an increase of $1.7 billion. The adjustment for dividends received less than equity in current earnings of equity companies was a reduction of $1.7 billion, compared to an increase of $0.1 billion in 2017. The adjustment for deferred income tax credits was $0.1 billion, compared to $8.6 billion in 2017. Changes in operational working capital, excluding cash and debt, decreased cash in 2018 by $1.4 billion.
2017
Cash provided by operating activities totaled $30.1 billion in 2017, $8.0 billion higher than 2016. The major source of funds was net income including noncontrolling interests of $19.8 billion, an increase of $11.5 billion. The noncash provision for depreciation and depletion was $19.9 billion, down $2.4 billion from the prior year. The adjustment for deferred income tax credits was $8.6 billion, compared to $4.4 billion in 2016. Changes in operational working capital, excluding cash and debt, decreased cash in 2017 by $0.6 billion. Cash Flow from Investing Activities
2018
Cash used in investing activities netted to $16.4 billion in 2018, $0.7 billion higher than 2017. Spending for property, plant and equipment of $19.6 billion increased $4.2 billion from 2017. Proceeds associated with sales of subsidiaries, property, plant and equipment, and sales and returns of investments of $4.1 billion compared to $3.1 billion in 2017. Additional investments and advances were $3.5 billion lower in 2018, while proceeds from other investing activities including collection of advances decreased by $1.1 billion.
2017
Cash used in investing activities netted to $15.7 billion in 2017, $3.3 billion higher than 2016. Spending for property, plant and equipment of $15.4 billion decreased $0.8 billion from 2016. Proceeds associated with sales of subsidiaries, property, plant and equipment, and sales and returns of investments of $3.1 billion compared to $4.3 billion in 2016. Additional investments and advances were $4.1 billion higher in 2017, while proceeds from other investing activities including collection of advances increased by $1.2 billion.
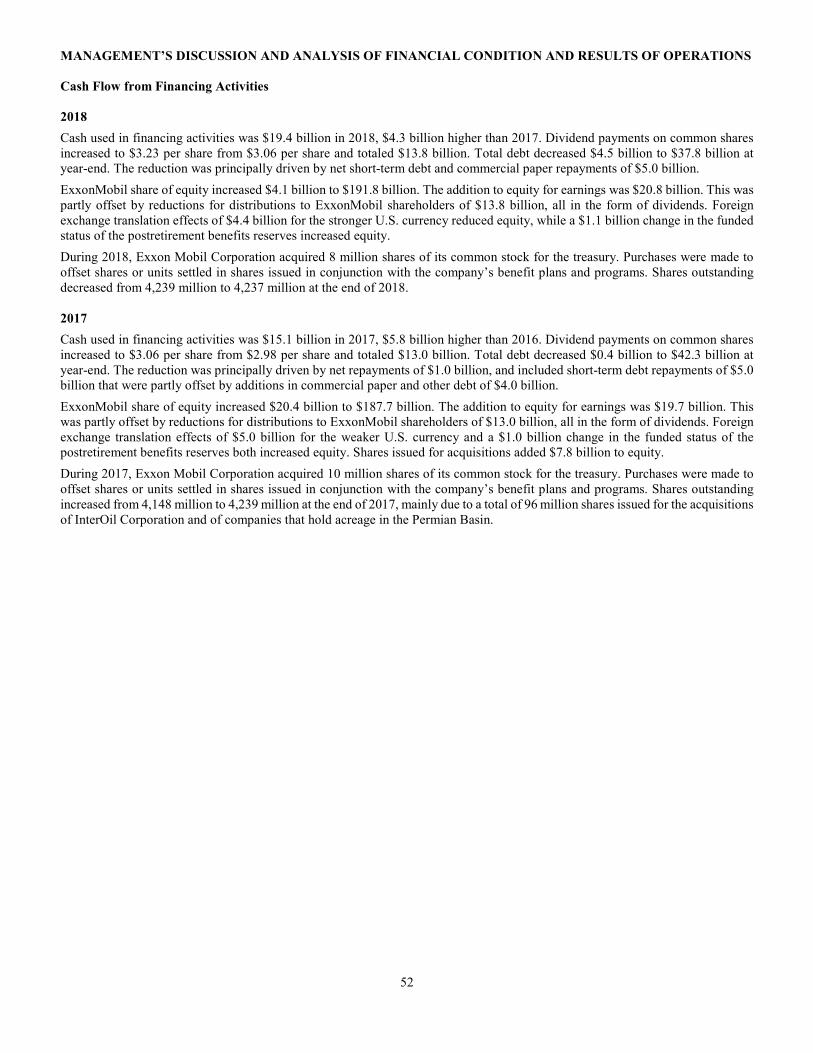
MANAGEMENT’S DISCUSSION AND ANALYSIS OF FINANCIAL CONDITION AND RESULTS OF OPERATIONS
52
Cash Flow from Financing Activities
2018
Cash used in financing activities was $19.4 billion in 2018, $4.3 billion higher than 2017. Dividend payments on common shares increased to $3.23 per share from $3.06 per share and totaled $13.8 billion. Total debt decreased $4.5 billion to $37.8 billion at year-end. The reduction was principally driven by net short-term debt and commercial paper repayments of $5.0 billion.
ExxonMobil share of equity increased $4.1 billion to $191.8 billion. The addition to equity for earnings was $20.8 billion. This was partly offset by reductions for distributions to ExxonMobil shareholders of $13.8 billion, all in the form of dividends. Foreign exchange translation effects of $4.4 billion for the stronger U.S. currency reduced equity, while a $1.1 billion change in the funded status of the postretirement benefits reserves increased equity.
During 2018, Exxon Mobil Corporation acquired 8 million shares of its common stock for the treasury. Purchases were made to offset shares or units settled in shares issued in conjunction with the company’s benefit plans and programs. Shares outstanding decreased from 4,239 million to 4,237 million at the end of 2018.
2017
Cash used in financing activities was $15.1 billion in 2017, $5.8 billion higher than 2016. Dividend payments on common shares increased to $3.06 per share from $2.98 per share and totaled $13.0 billion. Total debt decreased $0.4 billion to $42.3 billion at year-end. The reduction was principally driven by net repayments of $1.0 billion, and included short-term debt repayments of $5.0 billion that were partly offset by additions in commercial paper and other debt of $4.0 billion.
ExxonMobil share of equity increased $20.4 billion to $187.7 billion. The addition to equity for earnings was $19.7 billion. This was partly offset by reductions for distributions to ExxonMobil shareholders of $13.0 billion, all in the form of dividends. Foreign exchange translation effects of $5.0 billion for the weaker U.S. currency and a $1.0 billion change in the funded status of the postretirement benefits reserves both increased equity. Shares issued for acquisitions added $7.8 billion to equity.
During 2017, Exxon Mobil Corporation acquired 10 million shares of its common stock for the treasury. Purchases were made to offset shares or units settled in shares issued in conjunction with the company’s benefit plans and programs. Shares outstanding increased from 4,148 million to 4,239 million at the end of 2017, mainly due to a total of 96 million shares issued for the acquisitions of InterOil Corporation and of companies that hold acreage in the Permian Basin.
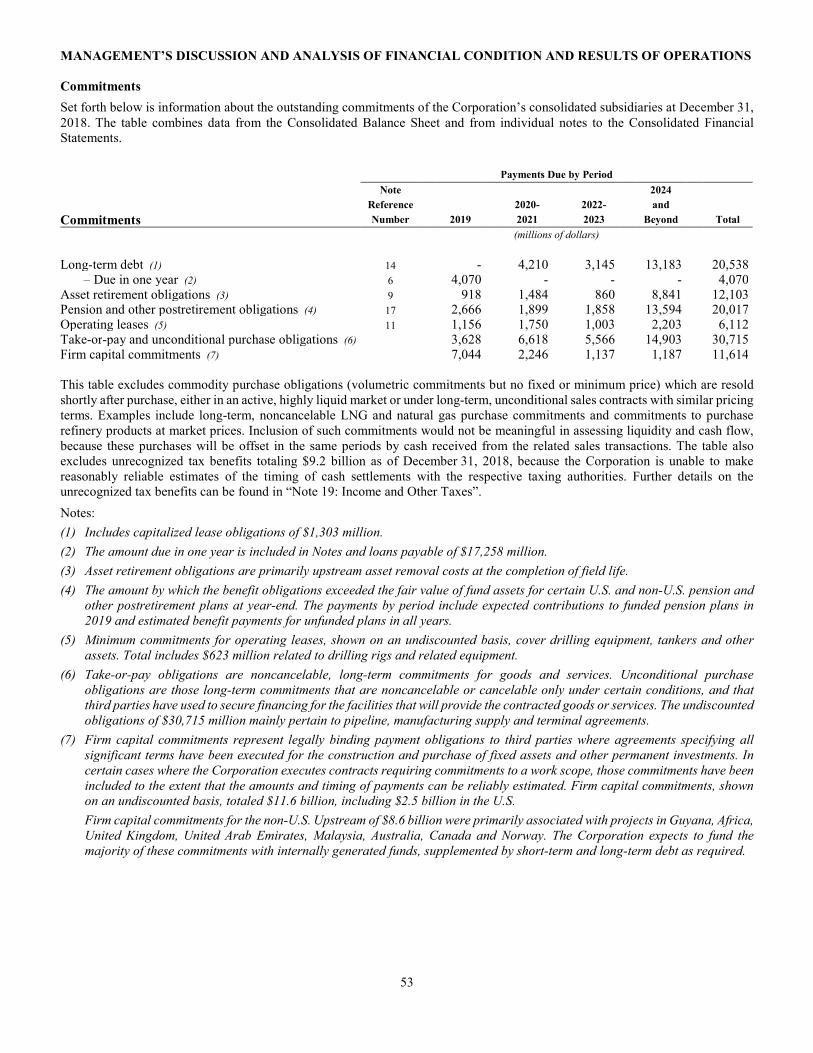
MANAGEMENT’S DISCUSSION AND ANALYSIS OF FINANCIAL CONDITION AND RESULTS OF OPERATIONS
53
Commitments
Set forth below is information about the outstanding commitments of the Corporation’s consolidated subsidiaries at December 31,
2018. The table combines data from the Consolidated Balance Sheet and from individual notes to the Consolidated Financial Statements.
Payments Due by Period
Note 2024
Reference 2020- 2022- and
Commitments Number 2019 2021 2023 Beyond Total
(millions of dollars)
Long-term debt (1) 14 - 4,210 3,145 13,183 20,538 – Due in one year (2) 6 4,070 - - - 4,070 Asset retirement obligations (3) 9 918 1,484 860 8,841 12,103 Pension and other postretirement obligations (4) 17 2,666 1,899 1,858 13,594 20,017 Operating leases (5) 11 1,156 1,750 1,003 2,203 6,112 Take-or-pay and unconditional purchase obligations (6) 3,628 6,618 5,566 14,903 30,715 Firm capital commitments (7) 7,044 2,246 1,137 1,187 11,614 This table excludes commodity purchase obligations (volumetric commitments but no fixed or minimum price) which are resold shortly after purchase, either in an active, highly liquid market or under long-term, unconditional sales contracts with similar pricing terms. Examples include long-term, noncancelable LNG and natural gas purchase commitments and commitments to purchase refinery products at market prices. Inclusion of such commitments would not be meaningful in assessing liquidity and cash flow, because these purchases will be offset in the same periods by cash received from the related sales transactions. The table also excludes unrecognized tax benefits totaling $9.2 billion as of December 31, 2018, because the Corporation is unable to make reasonably reliable estimates of the timing of cash settlements with the respective taxing authorities. Further details on the unrecognized tax benefits can be found in “Note 19: Income and Other Taxes”.
Notes:
(1) Includes capitalized lease obligations of $1,303 million.
(2) The amount due in one year is included in Notes and loans payable of $17,258 million.
(3) Asset retirement obligations are primarily upstream asset removal costs at the completion of field life.
(4) The amount by which the benefit obligations exceeded the fair value of fund assets for certain U.S. and non-U.S. pension and
other postretirement plans at year-end. The payments by period include expected contributions to funded pension plans in
2019 and estimated benefit payments for unfunded plans in all years.
(5) Minimum commitments for operating leases, shown on an undiscounted basis, cover drilling equipment, tankers and other
assets. Total includes $623 million related to drilling rigs and related equipment.
(6) Take-or-pay obligations are noncancelable, long-term commitments for goods and services. Unconditional purchase
obligations are those long-term commitments that are noncancelable or cancelable only under certain conditions, and that
third parties have used to secure financing for the facilities that will provide the contracted goods or services. The undiscounted
obligations of $30,715 million mainly pertain to pipeline, manufacturing supply and terminal agreements.
(7) Firm capital commitments represent legally binding payment obligations to third parties where agreements specifying all
significant terms have been executed for the construction and purchase of fixed assets and other permanent investments. In
certain cases where the Corporation executes contracts requiring commitments to a work scope, those commitments have been
included to the extent that the amounts and timing of payments can be reliably estimated. Firm capital commitments, shown
on an undiscounted basis, totaled $11.6 billion, including $2.5 billion in the U.S.
Firm capital commitments for the non-U.S. Upstream of $8.6 billion were primarily associated with projects in Guyana, Africa,
United Kingdom, United Arab Emirates, Malaysia, Australia, Canada and Norway. The Corporation expects to fund the
majority of these commitments with internally generated funds, supplemented by short-term and long-term debt as required.
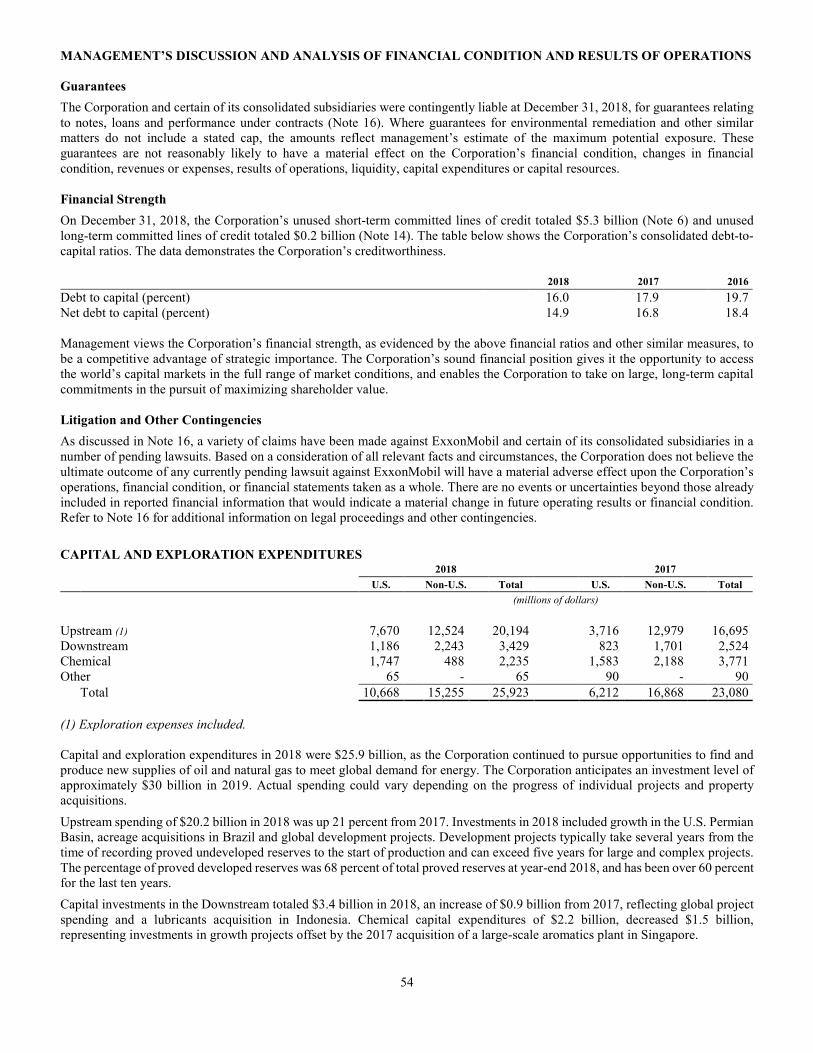
MANAGEMENT’S DISCUSSION AND ANALYSIS OF FINANCIAL CONDITION AND RESULTS OF OPERATIONS
54
Guarantees
The Corporation and certain of its consolidated subsidiaries were contingently liable at December 31, 2018, for guarantees relating
to notes, loans and performance under contracts (Note 16). Where guarantees for environmental remediation and other similar matters do not include a stated cap, the amounts reflect management’s estimate of the maximum potential exposure. These guarantees are not reasonably likely to have a material effect on the Corporation’s financial condition, changes in financial condition, revenues or expenses, results of operations, liquidity, capital expenditures or capital resources.
Financial Strength
On December 31, 2018, the Corporation’s unused short-term committed lines of credit totaled $5.3 billion (Note 6) and unused long-term committed lines of credit totaled $0.2 billion (Note 14). The table below shows the Corporation’s consolidated debt-to-capital ratios. The data demonstrates the Corporation’s creditworthiness. 2018 2017 2016
Debt to capital (percent) 16.0 17.9 19.7 Net debt to capital (percent) 14.9 16.8 18.4 Management views the Corporation’s financial strength, as evidenced by the above financial ratios and other similar measures, to be a competitive advantage of strategic importance. The Corporation’s sound financial position gives it the opportunity to access the world’s capital markets in the full range of market conditions, and enables the Corporation to take on large, long-term capital commitments in the pursuit of maximizing shareholder value.
Litigation and Other Contingencies
As discussed in Note 16, a variety of claims have been made against ExxonMobil and certain of its consolidated subsidiaries in a number of pending lawsuits. Based on a consideration of all relevant facts and circumstances, the Corporation does not believe the ultimate outcome of any currently pending lawsuit against ExxonMobil will have a material adverse effect upon the Corporation’s operations, financial condition, or financial statements taken as a whole. There are no events or uncertainties beyond those already included in reported financial information that would indicate a material change in future operating results or financial condition. Refer to Note 16 for additional information on legal proceedings and other contingencies.
CAPITAL AND EXPLORATION EXPENDITURES 2018 2017
U.S. Non-U.S. Total U.S. Non-U.S. Total
(millions of dollars)
Upstream (1) 7,670 12,524 20,194 3,716 12,979 16,695 Downstream 1,186 2,243 3,429 823 1,701 2,524 Chemical 1,747 488 2,235 1,583 2,188 3,771 Other 65 - 65 90 - 90
Total 10,668 15,255 25,923 6,212 16,868 23,080
(1) Exploration expenses included. Capital and exploration expenditures in 2018 were $25.9 billion, as the Corporation continued to pursue opportunities to find and produce new supplies of oil and natural gas to meet global demand for energy. The Corporation anticipates an investment level of approximately $30 billion in 2019. Actual spending could vary depending on the progress of individual projects and property acquisitions.
Upstream spending of $20.2 billion in 2018 was up 21 percent from 2017. Investments in 2018 included growth in the U.S. Permian Basin, acreage acquisitions in Brazil and global development projects. Development projects typically take several years from the time of recording proved undeveloped reserves to the start of production and can exceed five years for large and complex projects. The percentage of proved developed reserves was 68 percent of total proved reserves at year-end 2018, and has been over 60 percent for the last ten years.
Capital investments in the Downstream totaled $3.4 billion in 2018, an increase of $0.9 billion from 2017, reflecting global project spending and a lubricants acquisition in Indonesia. Chemical capital expenditures of $2.2 billion, decreased $1.5 billion, representing investments in growth projects offset by the 2017 acquisition of a large-scale aromatics plant in Singapore.
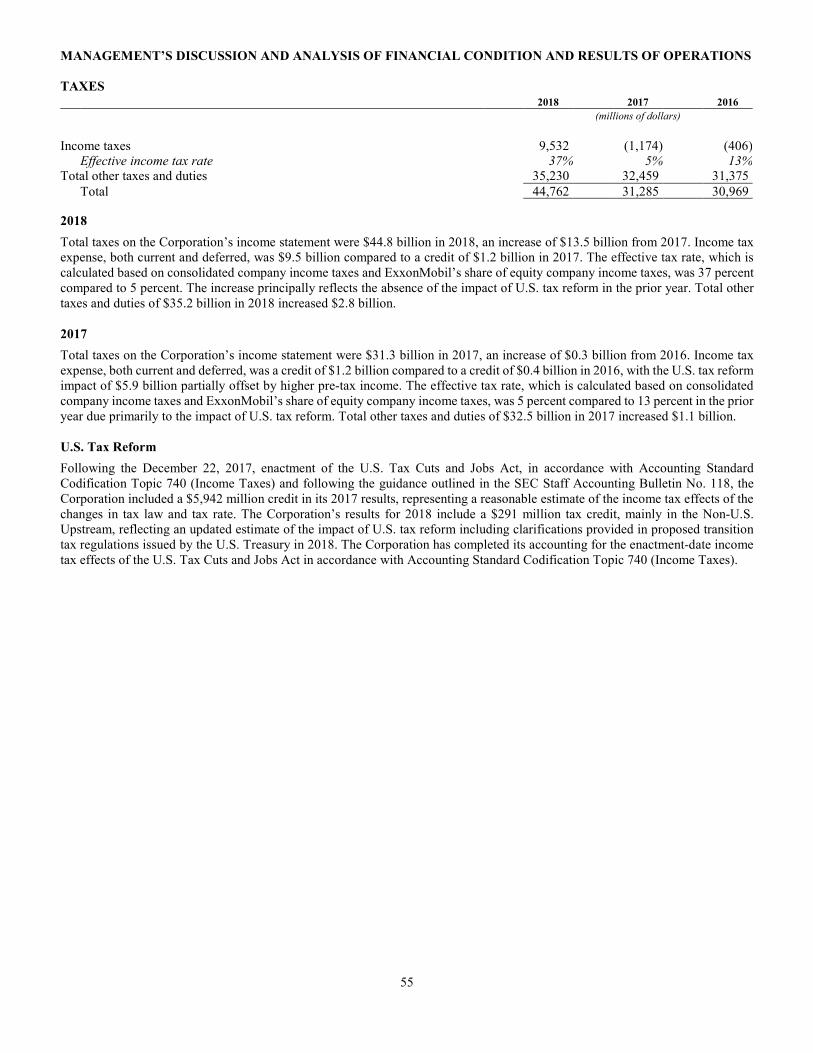
MANAGEMENT’S DISCUSSION AND ANALYSIS OF FINANCIAL CONDITION AND RESULTS OF OPERATIONS
55
TAXES 2018 2017 2016
(millions of dollars)
Income taxes 9,532 (1,174) (406) Effective income tax rate 37% 5% 13%Total other taxes and duties 35,230 32,459 31,375
Total 44,762 31,285 30,969 2018
Total taxes on the Corporation’s income statement were $44.8 billion in 2018, an increase of $13.5 billion from 2017. Income tax expense, both current and deferred, was $9.5 billion compared to a credit of $1.2 billion in 2017. The effective tax rate, which is calculated based on consolidated company income taxes and ExxonMobil’s share of equity company income taxes, was 37 percent compared to 5 percent. The increase principally reflects the absence of the impact of U.S. tax reform in the prior year. Total other taxes and duties of $35.2 billion in 2018 increased $2.8 billion.
2017
Total taxes on the Corporation’s income statement were $31.3 billion in 2017, an increase of $0.3 billion from 2016. Income tax expense, both current and deferred, was a credit of $1.2 billion compared to a credit of $0.4 billion in 2016, with the U.S. tax reform impact of $5.9 billion partially offset by higher pre-tax income. The effective tax rate, which is calculated based on consolidated company income taxes and ExxonMobil’s share of equity company income taxes, was 5 percent compared to 13 percent in the prior year due primarily to the impact of U.S. tax reform. Total other taxes and duties of $32.5 billion in 2017 increased $1.1 billion.
U.S. Tax Reform
Following the December 22, 2017, enactment of the U.S. Tax Cuts and Jobs Act, in accordance with Accounting Standard Codification Topic 740 (Income Taxes) and following the guidance outlined in the SEC Staff Accounting Bulletin No. 118, the Corporation included a $5,942 million credit in its 2017 results, representing a reasonable estimate of the income tax effects of the changes in tax law and tax rate. The Corporation’s results for 2018 include a $291 million tax credit, mainly in the Non-U.S. Upstream, reflecting an updated estimate of the impact of U.S. tax reform including clarifications provided in proposed transition tax regulations issued by the U.S. Treasury in 2018. The Corporation has completed its accounting for the enactment-date income tax effects of the U.S. Tax Cuts and Jobs Act in accordance with Accounting Standard Codification Topic 740 (Income Taxes).
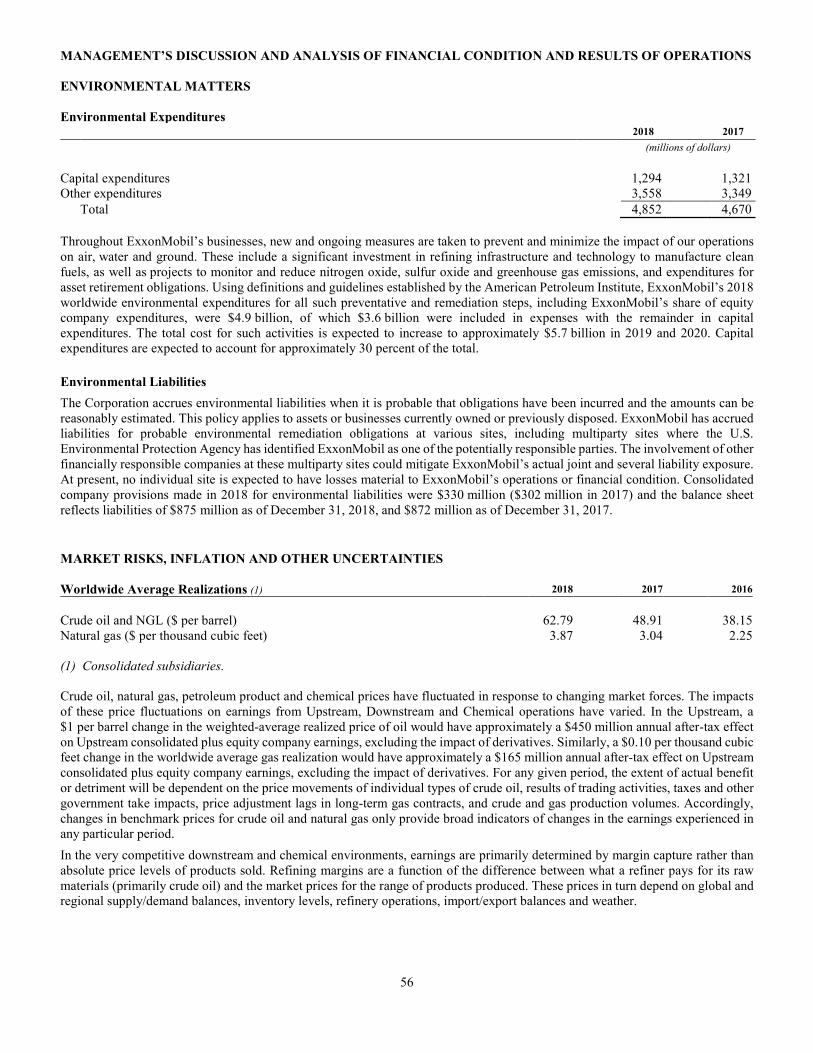
MANAGEMENT’S DISCUSSION AND ANALYSIS OF FINANCIAL CONDITION AND RESULTS OF OPERATIONS
56
ENVIRONMENTAL MATTERS
Environmental Expenditures 2018 2017
(millions of dollars)
Capital expenditures 1,294 1,321 Other expenditures 3,558 3,349
Total 4,852 4,670
Throughout ExxonMobil’s businesses, new and ongoing measures are taken to prevent and minimize the impact of our operations on air, water and ground. These include a significant investment in refining infrastructure and technology to manufacture clean fuels, as well as projects to monitor and reduce nitrogen oxide, sulfur oxide and greenhouse gas emissions, and expenditures for asset retirement obligations. Using definitions and guidelines established by the American Petroleum Institute, ExxonMobil’s 2018 worldwide environmental expenditures for all such preventative and remediation steps, including ExxonMobil’s share of equity company expenditures, were $4.9 billion, of which $3.6 billion were included in expenses with the remainder in capital expenditures. The total cost for such activities is expected to increase to approximately $5.7 billion in 2019 and 2020. Capital expenditures are expected to account for approximately 30 percent of the total.
Environmental Liabilities
The Corporation accrues environmental liabilities when it is probable that obligations have been incurred and the amounts can be reasonably estimated. This policy applies to assets or businesses currently owned or previously disposed. ExxonMobil has accrued liabilities for probable environmental remediation obligations at various sites, including multiparty sites where the U.S. Environmental Protection Agency has identified ExxonMobil as one of the potentially responsible parties. The involvement of other financially responsible companies at these multiparty sites could mitigate ExxonMobil’s actual joint and several liability exposure. At present, no individual site is expected to have losses material to ExxonMobil’s operations or financial condition. Consolidated company provisions made in 2018 for environmental liabilities were $330 million ($302 million in 2017) and the balance sheet reflects liabilities of $875 million as of December 31, 2018, and $872 million as of December 31, 2017.
MARKET RISKS, INFLATION AND OTHER UNCERTAINTIES
Worldwide Average Realizations (1) 2018 2017 2016
Crude oil and NGL ($ per barrel) 62.79 48.91 38.15Natural gas ($ per thousand cubic feet) 3.87 3.04 2.25 (1) Consolidated subsidiaries. Crude oil, natural gas, petroleum product and chemical prices have fluctuated in response to changing market forces. The impacts of these price fluctuations on earnings from Upstream, Downstream and Chemical operations have varied. In the Upstream, a $1 per barrel change in the weighted-average realized price of oil would have approximately a $450 million annual after-tax effect on Upstream consolidated plus equity company earnings, excluding the impact of derivatives. Similarly, a $0.10 per thousand cubic feet change in the worldwide average gas realization would have approximately a $165 million annual after-tax effect on Upstream consolidated plus equity company earnings, excluding the impact of derivatives. For any given period, the extent of actual benefit or detriment will be dependent on the price movements of individual types of crude oil, results of trading activities, taxes and other government take impacts, price adjustment lags in long-term gas contracts, and crude and gas production volumes. Accordingly, changes in benchmark prices for crude oil and natural gas only provide broad indicators of changes in the earnings experienced in any particular period.
In the very competitive downstream and chemical environments, earnings are primarily determined by margin capture rather than absolute price levels of products sold. Refining margins are a function of the difference between what a refiner pays for its raw materials (primarily crude oil) and the market prices for the range of products produced. These prices in turn depend on global and regional supply/demand balances, inventory levels, refinery operations, import/export balances and weather.
MANAGEMENT’S DISCUSSION AND ANALYSIS OF FINANCIAL CONDITION AND RESULTS OF OPERATIONS
57
The global energy markets can give rise to extended periods in which market conditions are adverse to one or more of the Corporation’s businesses. Such conditions, along with the capital-intensive nature of the industry and very long lead times associated with many of our projects, underscore the importance of maintaining a strong financial position. Management views the Corporation’s financial strength as a competitive advantage.
In general, segment results are not dependent on the ability to sell and/or purchase products to/from other segments. Instead, where such sales take place, they are the result of efficiencies and competitive advantages of integrated refinery/chemical complexes. Additionally, intersegment sales are at market-based prices. The products bought and sold between segments can also be acquired in worldwide markets that have substantial liquidity, capacity and transportation capabilities. About 35 percent of the Corporation’s intersegment sales represent Upstream production sold to the Downstream. Other intersegment sales include those between refineries and chemical plants related to raw materials, feedstocks and finished products.
Although price levels of crude oil and natural gas may rise or fall significantly over the short to medium term due to global economic conditions, political events, decisions by OPEC and other major government resource owners and other factors, industry economics over the long term will continue to be driven by market supply and demand. Accordingly, the Corporation evaluates the viability of its major investments over a range of prices.
The Corporation has an active asset management program in which underperforming assets are either improved to acceptable levels or considered for divestment. The asset management program includes a disciplined, regular review to ensure that all assets are contributing to the Corporation’s strategic objectives resulting in an efficient capital base.
Risk Management
The Corporation’s size, strong capital structure, geographic diversity and the complementary nature of the Upstream, Downstream and Chemical businesses reduce the Corporation’s enterprise-wide risk from changes in commodity prices, currency rates and interest rates. In addition, the Corporation uses commodity-based contracts, including derivatives, to manage commodity price risk and for trading purposes. The Corporation’s commodity derivatives are not accounted for under hedge accounting. At times, the Corporation also enters into forward currency and interest rate derivatives, none of which are material to the Corporation’s financial position as of December 31, 2018 and 2017, or results of operations for the years ended 2018, 2017 and 2016. Credit risk associated with the Corporation’s derivative position is mitigated by several factors, including the use of derivative clearing exchanges and the quality of and financial limits placed on derivative counterparties. No material market or credit risks to the Corporation’s financial position, results of operations or liquidity exist as a result of the derivatives described in Note 13. The Corporation maintains a system of controls that includes the authorization, reporting and monitoring of derivative activity.
The Corporation is exposed to changes in interest rates, primarily on its short-term debt and the portion of long-term debt that carries floating interest rates. The impact of a 100-basis-point change in interest rates affecting the Corporation’s debt would not be material to earnings, cash flow or fair value. The Corporation has access to significant capacity of long-term and short-term liquidity. Internally generated funds are expected to cover the majority of financial requirements, supplemented by long-term and short-term debt. Some joint-venture partners are dependent on the credit markets, and their funding ability may impact the development pace of joint-venture projects.
The Corporation conducts business in many foreign currencies and is subject to exchange rate risk on cash flows related to sales, expenses, financing and investment transactions. Fluctuations in exchange rates are often offsetting and the impacts on ExxonMobil’s geographically and functionally diverse operations are varied. The Corporation makes limited use of currency exchange contracts to mitigate the impact of changes in currency values, and exposures related to the Corporation’s limited use of the currency exchange contracts are not material.
Inflation and Other Uncertainties
The general rate of inflation in many major countries of operation has remained moderate over the past few years, and the associated impact on non-energy costs has generally been mitigated by cost reductions from efficiency and productivity improvements. Prices for services and materials continue to evolve in response to constant changes in commodity markets and industry activities, impacting operating and capital costs. The Corporation monitors market trends and works to minimize costs in all commodity price environments through its economies of scale in global procurement and its efficient project management practices.
MANAGEMENT’S DISCUSSION AND ANALYSIS OF FINANCIAL CONDITION AND RESULTS OF OPERATIONS
58
RECENTLY ISSUED ACCOUNTING STANDARDS
Effective January 1, 2019, the Corporation adopted the Financial Accounting Standards Board’s Standard, Leases (Topic 842), as amended. The standard requires all leases to be recorded on the balance sheet as a right of use asset and a lease liability. The Corporation used a transition method that applies the new lease standard at January 1, 2019, and recognizes any cumulative-effect adjustments to the opening balance of 2019 retained earnings. The Corporation applied a policy election to exclude short-term leases from balance sheet recognition and also elected certain practical expedients at adoption. As permitted under these expedients the Corporation did not reassess whether existing contracts are or contain leases, the lease classification for any existing leases, initial direct costs for any existing lease and whether existing land easements and rights of way, that were not previously accounted for as leases, are or contain a lease. At January 1, 2019, the operating lease liability is estimated to be in the range of $3.3 billion and the operating lease right of use asset is estimated to be in the range of $4.3 billion, including about $1.0 billion related to prepaid leases. The cumulative effect adjustment is expected to be de minimis.
CRITICAL ACCOUNTING ESTIMATES
The Corporation’s accounting and financial reporting fairly reflect its integrated business model involving exploration for, and production of, crude oil and natural gas and manufacture, trade, transport and sale of crude oil, natural gas, petroleum products, petrochemicals and a wide variety of specialty products. The preparation of financial statements in conformity with U.S. Generally Accepted Accounting Principles (GAAP) requires management to make estimates and judgments that affect the reported amounts of assets, liabilities, revenues and expenses and the disclosure of contingent assets and liabilities. The Corporation’s accounting policies are summarized in Note 1.
Oil and Natural Gas Reserves
The estimation of proved reserves is an ongoing process based on rigorous technical evaluations, commercial and market assessments and detailed analysis of well information such as flow rates and reservoir pressure declines, among other factors. The estimation of proved reserves is controlled by the Corporation through long-standing approval guidelines. Reserve changes are made within a well-established, disciplined process driven by senior level geoscience and engineering professionals, assisted by the Global Reserves group which has significant technical experience, culminating in reviews with and approval by senior management. Notably, the Corporation does not use specific quantitative reserve targets to determine compensation. Key features of the reserve estimation process are covered in Disclosure of Reserves in Item 2.
Oil and natural gas reserves include both proved and unproved reserves.
• Proved oil and natural gas reserves are determined in accordance with Securities and Exchange Commission (SEC) requirements. Proved reserves are those quantities of oil and natural gas which, by analysis of geoscience and engineering data, can be estimated with reasonable certainty to be economically producible under existing economic and operating conditions and government regulations. Proved reserves are determined using the average of first-of-month oil and natural gas prices during the reporting year.
Proved reserves can be further subdivided into developed and undeveloped reserves. Proved developed reserves include amounts which are expected to be recovered through existing wells with existing equipment and operating methods. Proved undeveloped reserves include amounts expected to be recovered from new wells on undrilled proved acreage or from existing wells where a relatively major expenditure is required for completion. Proved undeveloped reserves are recognized only if a development plan has been adopted indicating that the reserves are scheduled to be drilled within five years, unless specific circumstances support a longer period of time.
The percentage of proved developed reserves was 68 percent of total proved reserves at year-end 2018 (including both consolidated and equity company reserves), an increase from 66 percent in 2017, and has been over 60 percent for the last ten years. Although the Corporation is reasonably certain that proved reserves will be produced, the timing and amount recovered can be affected by a number of factors including completion of development projects, reservoir performance, regulatory approvals, government policy, consumer preferences and significant changes in long-term oil and natural gas prices.
• Unproved reserves are quantities of oil and natural gas with less than reasonable certainty of recoverability and include probable reserves. Probable reserves are reserves that, together with proved reserves, are as likely as not to be recovered.
Revisions in previously estimated volumes of proved reserves for existing fields can occur due to the evaluation or re-evaluation of (1) already available geologic, reservoir or production data, (2) new geologic, reservoir or production data or (3) changes in the average of first-of-month oil and natural gas prices and / or costs that are used in the estimation of reserves. Revisions can also result from significant changes in development strategy or production equipment and facility capacity.
MANAGEMENT’S DISCUSSION AND ANALYSIS OF FINANCIAL CONDITION AND RESULTS OF OPERATIONS
59
Unit-of-Production Depreciation
Oil and natural gas reserve quantities are used as the basis to calculate unit-of-production depreciation rates for most upstream assets. Depreciation is calculated by taking the ratio of asset cost to total proved reserves or proved developed reserves applied to actual production. The volumes produced and asset cost are known, while proved reserves are based on estimates that are subject to some variability.
In the event that the unit-of-production method does not result in an equitable allocation of cost over the economic life of an upstream asset, an alternative method is used. The straight-line method may be used in limited situations where the expected life of the asset does not reasonably correlate with that of the underlying reserves. For example, certain assets used in the production of oil and natural gas have a shorter life than the reserves, and as such, the Corporation uses straight-line depreciation to ensure the asset is fully depreciated by the end of its useful life.
To the extent that proved reserves for a property are substantially de-booked and that property continues to produce such that the resulting depreciation charge does not result in an equitable allocation of cost over the expected life, assets will be depreciated using a unit-of-production method based on reserves determined at the most recent SEC price which results in a more meaningful quantity of proved reserves, appropriately adjusted for production and technical changes. The effect of this approach on the Corporation’s 2018 depreciation expense versus 2017 was immaterial.
Impairment
The Corporation tests assets or groups of assets for recoverability on an ongoing basis whenever events or changes in circumstances indicate that the carrying amounts may not be recoverable. Among the events or changes in circumstances which could indicate that the carrying value of an asset or asset group may not be recoverable are the following:
• a significant decrease in the market price of a long-lived asset;
• a significant adverse change in the extent or manner in which an asset is being used or in its physical condition including a significant decrease in current and projected reserve volumes;
• a significant adverse change in legal factors or in the business climate that could affect the value, including an adverse action or assessment by a regulator;
• an accumulation of project costs significantly in excess of the amount originally expected;
• a current-period operating loss combined with a history and forecast of operating or cash flow losses; and
• a current expectation that, more likely than not, a long-lived asset will be sold or otherwise disposed of significantly before the end of its previously estimated useful life.
Asset valuation analyses performed as part of its asset management program and other profitability reviews assist the Corporation in assessing whether events or changes in circumstances indicate the carrying amounts of any of its assets may not be recoverable.
In general, the Corporation does not view temporarily low prices or margins as an indication of impairment. Management believes that prices over the long term must be sufficient to generate investments in energy supply to meet global demand. Although prices will occasionally drop significantly, industry prices over the long term will continue to be driven by market supply and demand fundamentals. On the supply side, industry production from mature fields is declining. This is being offset by investments to generate production from new discoveries, field developments and technology and efficiency advancements. OPEC investment activities and production policies also have an impact on world oil supplies. The demand side is largely a function of general economic activities and levels of prosperity. Because the lifespans of the vast majority of the Corporation’s major assets are measured in decades, the value of these assets is predominantly based on long-term views of future commodity prices and production costs. During the lifespan of these major assets, the Corporation expects that oil and gas prices will experience significant volatility, and consequently these assets will experience periods of higher earnings and periods of lower earnings, or even losses.
In assessing whether the events or changes in circumstances indicate the carrying value of an asset may not be recoverable, the Corporation considers recent periods of operating losses in the context of its longer-term view of prices. While near-term prices are subject to wide fluctuations, longer-term price views are more stable and meaningful for purposes of assessing future cash flows.
When the industry experiences a prolonged and deep reduction in commodity prices, the market supply and demand conditions may result in changes to the Corporation’s long-term price or margin assumptions it uses for its capital investment decisions. To the extent those changes result in a significant reduction to its long-term oil price, natural gas price or margin ranges, the Corporation may consider that situation, in conjunction with other events or changes in circumstances such as a history of operating losses, an indicator of potential impairment for certain assets.
MANAGEMENT’S DISCUSSION AND ANALYSIS OF FINANCIAL CONDITION AND RESULTS OF OPERATIONS
60
In the Upstream, the standardized measure of discounted cash flows included in the Supplemental Information on Oil and Gas Exploration and Production Activities is required to use prices based on the average of first-of-month prices. These prices represent discrete points in time and could be higher or lower than the Corporation’s long-term price assumptions which are used for impairment assessments. The Corporation believes the standardized measure does not provide a reliable estimate of the expected future cash flows to be obtained from the development and production of its oil and gas properties or of the value of its oil and gas reserves and therefore does not consider it relevant in determining whether events or changes in circumstances indicate the need for an impairment assessment.
If events or changes in circumstances indicate that the carrying value of an asset may not be recoverable, the Corporation estimates the future undiscounted cash flows of the affected properties to judge the recoverability of carrying amounts. In performing this assessment, assets are grouped at the lowest level for which there are identifiable cash flows that are largely independent of the cash flows of other groups of assets. Cash flows used in recoverability assessments are based on the Corporation’s assumptions which are developed in the annual planning and budgeting process, and are consistent with the criteria management uses to evaluate investment opportunities. These evaluations make use of the Corporation’s assumptions of future capital allocations, crude oil and natural gas commodity prices, refining and chemical margins, volumes, costs, and foreign currency exchange rates. Volumes are based on projected field and facility production profiles, throughput, or sales. Where unproved reserves exist, an appropriately risk-adjusted amount of these reserves may be included in the evaluation. Cash flow estimates for impairment testing exclude the effects of derivative instruments.
An asset group is impaired if its estimated undiscounted cash flows are less than the asset’s carrying value. Impairments are measured by the amount by which the carrying value exceeds fair value. Fair value is based on market prices if an active market exists for the asset group, or discounted cash flows using a discount rate commensurate with the risk. Significant unproved properties are assessed for impairment individually, and valuation allowances against the capitalized costs are recorded based on the estimated economic chance of success and the length of time that the Corporation expects to hold the properties. Properties that are not individually significant are aggregated by groups and amortized based on development risk and average holding period.
The Corporation has a robust process to monitor for indicators of potential impairment across its asset groups throughout the year. This process is aligned with the requirements of ASC 360 and relies in part on the Corporation’s planning and budgeting cycle. In 2018, the Corporation identified a number of situations where events or changes in circumstances indicated that the carrying value of certain long-lived assets, mainly in North America, may not be recoverable. Accordingly, impairment assessments were performed which indicated that certain asset groups assessed have future undiscounted cash flow estimates that do not recover their carrying values. The Corporation’s 2018 results include after-tax charges of $0.5 billion to reduce the carrying value of those assets to fair value.
The assessment of fair values required the use of Level 3 inputs and assumptions that are based upon the views of a likely market participant. The principal parameters used to establish fair values included estimates of both proved and unproved reserves, future commodity prices which were consistent with the average of third-party industry experts and government agencies, drilling and development costs, discount rates ranging from 6 percent to 8 percent depending on the characteristics of the asset group, and comparable market transactions. Factors which could put further assets at risk of impairment in the future include reductions in the Corporation’s long-term price outlooks, changes in the allocation of capital, and operating cost increases which exceed the pace of efficiencies or the pace of oil and natural gas price increases. However, due to the inherent difficulty in predicting future commodity prices, and the relationship between industry prices and costs, it is not practicable to reasonably estimate the existence or range of any potential future impairment charges related to the Corporation’s long-lived assets.
Asset Retirement Obligations
The Corporation incurs retirement obligations for certain assets. The fair values of these obligations are recorded as liabilities on a discounted basis, which is typically at the time the assets are installed. In the estimation of fair value, the Corporation uses assumptions and judgments regarding such factors as the existence of a legal obligation for an asset retirement obligation; technical assessments of the assets; estimated amounts and timing of settlements; discount rates; and inflation rates. Asset retirement obligations are disclosed in Note 9 to the financial statements.
Suspended Exploratory Well Costs
The Corporation continues capitalization of exploratory well costs when the well has found a sufficient quantity of reserves to justify its completion as a producing well and the Corporation is making sufficient progress assessing the reserves and the economic and operating viability of the project. Exploratory well costs not meeting these criteria are charged to expense. The facts and circumstances that support continued capitalization of suspended wells at year-end are disclosed in Note 10 to the financial statements.
MANAGEMENT’S DISCUSSION AND ANALYSIS OF FINANCIAL CONDITION AND RESULTS OF OPERATIONS
61
Consolidations
The Consolidated Financial Statements include the accounts of subsidiaries the Corporation controls. They also include the Corporation’s share of the undivided interest in certain upstream assets, liabilities, revenues and expenses. Amounts representing the Corporation’s interest in entities that it does not control, but over which it exercises significant influence, are accounted for using the equity method of accounting.
Investments in companies that are partially owned by the Corporation are integral to the Corporation’s operations. In some cases they serve to balance worldwide risks, and in others they provide the only available means of entry into a particular market or area of interest. The other parties, who also have an equity interest in these companies, are either independent third parties or host governments that share in the business results according to their ownership. The Corporation does not invest in these companies in order to remove liabilities from its balance sheet. In fact, the Corporation has long been on record supporting an alternative accounting method that would require each investor to consolidate its share of all assets and liabilities in these partially-owned companies rather than only its interest in net equity. This method of accounting for investments in partially-owned companies is not permitted by U.S. GAAP except where the investments are in the direct ownership of a share of upstream assets and liabilities. However, for purposes of calculating return on average capital employed, which is not covered by U.S. GAAP standards, the Corporation includes its share of debt of these partially-owned companies in the determination of average capital employed.
Pension Benefits
The Corporation and its affiliates sponsor nearly 100 defined benefit (pension) plans in over 40 countries. The Pension and Other Postretirement Benefits footnote (Note 17) provides details on pension obligations, fund assets and pension expense.
Some of these plans (primarily non-U.S.) provide pension benefits that are paid directly by their sponsoring affiliates out of corporate cash flow rather than a separate pension fund because applicable tax rules and regulatory practices do not encourage advance funding. Book reserves are established for these plans. The portion of the pension cost attributable to employee service is expensed as services are rendered. The portion attributable to the increase in pension obligations due to the passage of time is expensed over the term of the obligations, which ends when all benefits are paid. The primary difference in pension expense for unfunded versus funded plans is that pension expense for funded plans also includes a credit for the expected long-term return on fund assets.
For funded plans, including those in the U.S., pension obligations are financed in advance through segregated assets or insurance arrangements. These plans are managed in compliance with the requirements of governmental authorities and meet or exceed required funding levels as measured by relevant actuarial and government standards at the mandated measurement dates. In determining liabilities and required contributions, these standards often require approaches and assumptions that differ from those used for accounting purposes.
The Corporation will continue to make contributions to these funded plans as necessary. All defined-benefit pension obligations, regardless of the funding status of the underlying plans, are fully supported by the financial strength of the Corporation or the respective sponsoring affiliate.
Pension accounting requires explicit assumptions regarding, among others, the long-term expected earnings rate on fund assets, the discount rate for the benefit obligations and the long-term rate for future salary increases. Pension assumptions are reviewed annually by outside actuaries and senior management. These assumptions are adjusted as appropriate to reflect changes in market rates and outlook. The long-term expected earnings rate on U.S. pension plan assets in 2018 was 6 percent. The 10-year and 20-year actual returns on U.S. pension plan assets were 8 percent and 7 percent, respectively. The Corporation establishes the long-term expected rate of return by developing a forward-looking, long-term return assumption for each pension fund asset class, taking into account factors such as the expected real return for the specific asset class and inflation. A single, long-term rate of return is then calculated as the weighted average of the target asset allocation percentages and the long-term return assumption for each asset class. A worldwide reduction of 0.5 percent in the long-term rate of return on assets would increase annual pension expense by approximately $150 million before tax.
Differences between actual returns on fund assets and the long-term expected return are not recognized in pension expense in the year that the difference occurs. Such differences are deferred, along with other actuarial gains and losses, and are amortized into pension expense over the expected remaining service life of employees.
MANAGEMENT’S DISCUSSION AND ANALYSIS OF FINANCIAL CONDITION AND RESULTS OF OPERATIONS
62
Litigation Contingencies
A variety of claims have been made against the Corporation and certain of its consolidated subsidiaries in a number of pending lawsuits. Management has regular litigation reviews, including updates from corporate and outside counsel, to assess the need for accounting recognition or disclosure of these contingencies. The status of significant claims is summarized in Note 16.
The Corporation accrues an undiscounted liability for those contingencies where the incurrence of a loss is probable, and the amount can be reasonably estimated. These amounts are not reduced by amounts that may be recovered under insurance or claims against third parties, but undiscounted receivables from insurers or other third parties may be accrued separately. The Corporation revises such accruals in light of new information. For contingencies where an unfavorable outcome is reasonably possible and which are significant, the Corporation discloses the nature of the contingency and, where feasible, an estimate of the possible loss. For purposes of our litigation contingency disclosures, “significant” includes material matters as well as other items which management believes should be disclosed.
Management judgment is required related to contingent liabilities and the outcome of litigation because both are difficult to predict. However, the Corporation has been successful in defending litigation in the past. Payments have not had a material adverse effect on operations or financial condition. In the Corporation’s experience, large claims often do not result in large awards. Large awards are often reversed or substantially reduced as a result of appeal or settlement.
Tax Contingencies
The Corporation is subject to income taxation in many jurisdictions around the world. Significant management judgment is required in the accounting for income tax contingencies and tax disputes because the outcomes are often difficult to predict.
The benefits of uncertain tax positions that the Corporation has taken or expects to take in its income tax returns are recognized in the financial statements if management concludes that it is more likely than not that the position will be sustained with the tax authorities. For a position that is likely to be sustained, the benefit recognized in the financial statements is measured at the largest amount that is greater than 50 percent likely of being realized. A reserve is established for the difference between a position taken or expected to be taken in an income tax return and the amount recognized in the financial statements. The Corporation’s unrecognized tax benefits and a description of open tax years are summarized in Note 19.
Foreign Currency Translation
The method of translating the foreign currency financial statements of the Corporation’s international subsidiaries into U.S. dollars is prescribed by U.S. GAAP. Under these principles, it is necessary to select the functional currency of these subsidiaries. The functional currency is the currency of the primary economic environment in which the subsidiary operates. Management selects the functional currency after evaluating this economic environment.
Factors considered by management when determining the functional currency for a subsidiary include the currency used for cash flows related to individual assets and liabilities; the responsiveness of sales prices to changes in exchange rates; the history of inflation in the country; whether sales are into local markets or exported; the currency used to acquire raw materials, labor, services and supplies; sources of financing; and significance of intercompany transactions.
MANAGEMENT’S REPORT ON INTERNAL CONTROL OVER FINANCIAL REPORTING
63
Management, including the Corporation’s Chief Executive Officer, Principal Financial Officer, and Principal Accounting Officer, is responsible for establishing and maintaining adequate internal control over the Corporation’s financial reporting. Management conducted an evaluation of the effectiveness of internal control over financial reporting based on criteria established in Internal
Control – Integrated Framework (2013) issued by the Committee of Sponsoring Organizations of the Treadway Commission. Based on this evaluation, management concluded that Exxon Mobil Corporation’s internal control over financial reporting was effective as of December 31, 2018.
PricewaterhouseCoopers LLP, an independent registered public accounting firm, audited the effectiveness of the Corporation’s internal control over financial reporting as of December 31, 2018, as stated in their report included in the Financial Section of this report.
Darren W. Woods Chief Executive Officer
Andrew P. Swiger Senior Vice President (Principal Financial Officer)
David S. Rosenthal Vice President and Controller (Principal Accounting Officer)
REPORT OF INDEPENDENT REGISTERED PUBLIC ACCOUNTING FIRM
64
To the Board of Directors and Shareholders of Exxon Mobil Corporation
Opinions on the Financial Statements and Internal Control over Financial Reporting
We have audited the accompanying consolidated balance sheets of Exxon Mobil Corporation and its subsidiaries (the “Corporation”) as of December 31, 2018 and 2017, and the related consolidated statements of income, comprehensive income, changes in equity and cash flows for each of the three years in the period ended December 31, 2018, including the related notes (collectively referred to as the “consolidated financial statements”). We also have audited the Corporation's internal control over financial reporting as of December 31, 2018 based on criteria established in Internal Control - Integrated Framework (2013) issued by the Committee of Sponsoring Organizations of the Treadway Commission (COSO).
In our opinion, the consolidated financial statements referred to above present fairly, in all material respects, the financial position of the Corporation as of December 31, 2018 and 2017, and the results of its operations and its cash flows for each of the three years in the period ended December 31, 2018 in conformity with accounting principles generally accepted in the United States of America. Also in our opinion, the Corporation maintained, in all material respects, effective internal control over financial reporting as of December 31, 2018, based on criteria established in Internal Control - Integrated Framework (2013) issued by the COSO.
Basis for Opinions
The Corporation's management is responsible for these consolidated financial statements, for maintaining effective internal control over financial reporting, and for its assessment of the effectiveness of internal control over financial reporting, included in the accompanying Management’s Report on Internal Control over Financial Reporting. Our responsibility is to express opinions on the Corporation’s consolidated financial statements and on the Corporation's internal control over financial reporting based on our audits. We are a public accounting firm registered with the Public Company Accounting Oversight Board (United States) (PCAOB) and are required to be independent with respect to the Corporation in accordance with the U.S. federal securities laws and the applicable rules and regulations of the Securities and Exchange Commission and the PCAOB.
We conducted our audits in accordance with the standards of the PCAOB. Those standards require that we plan and perform the audits to obtain reasonable assurance about whether the consolidated financial statements are free of material misstatement, whether due to error or fraud, and whether effective internal control over financial reporting was maintained in all material respects.
Our audits of the consolidated financial statements included performing procedures to assess the risks of material misstatement of the consolidated financial statements, whether due to error or fraud, and performing procedures that respond to those risks. Such procedures included examining, on a test basis, evidence regarding the amounts and disclosures in the consolidated financial statements. Our audits also included evaluating the accounting principles used and significant estimates made by management, as well as evaluating the overall presentation of the consolidated financial statements. Our audit of internal control over financial reporting included obtaining an understanding of internal control over financial reporting, assessing the risk that a material weakness exists, and testing and evaluating the design and operating effectiveness of internal control based on the assessed risk. Our audits also included performing such other procedures as we considered necessary in the circumstances. We believe that our audits provide a reasonable basis for our opinions.
REPORT OF INDEPENDENT REGISTERED PUBLIC ACCOUNTING FIRM
65
Definition and Limitations of Internal Control over Financial Reporting
A company’s internal control over financial reporting is a process designed to provide reasonable assurance regarding the reliability of financial reporting and the preparation of financial statements for external purposes in accordance with generally accepted accounting principles. A company’s internal control over financial reporting includes those policies and procedures that (i) pertain to the maintenance of records that, in reasonable detail, accurately and fairly reflect the transactions and dispositions of the assets of the company; (ii) provide reasonable assurance that transactions are recorded as necessary to permit preparation of financial statements in accordance with generally accepted accounting principles, and that receipts and expenditures of the company are being made only in accordance with authorizations of management and directors of the company; and (iii) provide reasonable assurance regarding prevention or timely detection of unauthorized acquisition, use, or disposition of the company’s assets that could have a material effect on the financial statements.
Because of its inherent limitations, internal control over financial reporting may not prevent or detect misstatements. Also, projections of any evaluation of effectiveness to future periods are subject to the risk that controls may become inadequate because of changes in conditions, or that the degree of compliance with the policies or procedures may deteriorate.
/s/ PricewaterhouseCoopers LLP
Dallas, Texas February 27, 2019 We have served as the Corporation’s auditor since 1934.
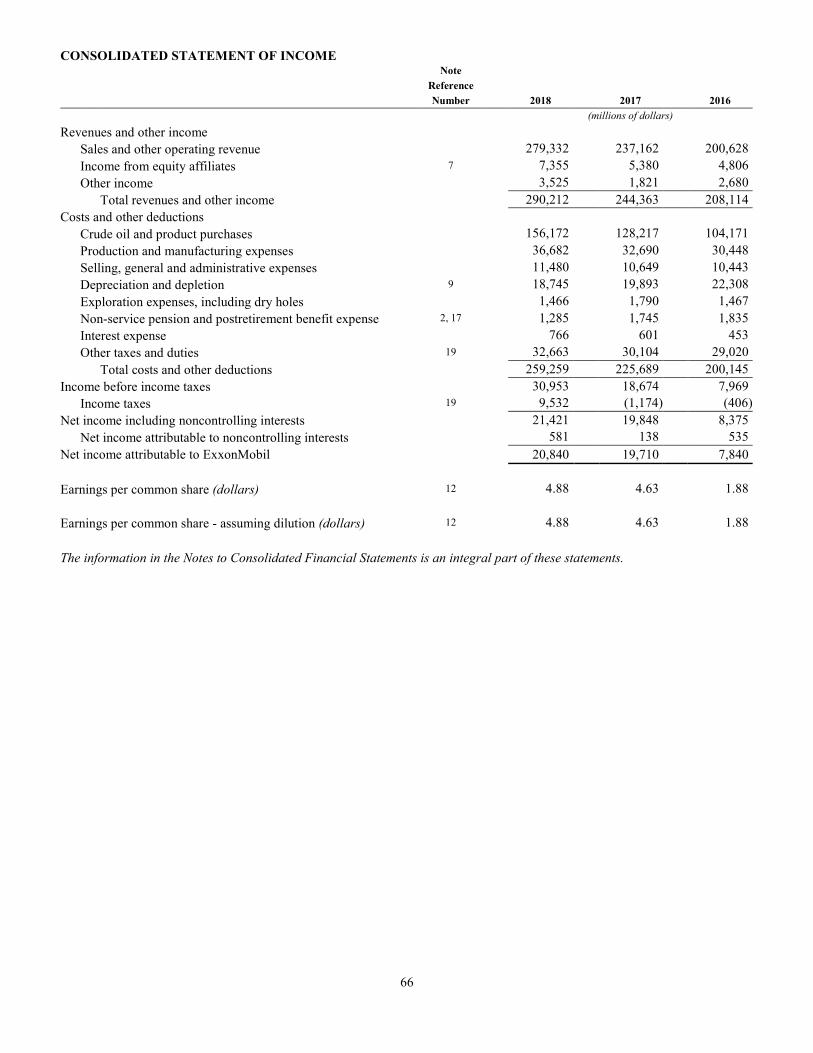
CONSOLIDATED STATEMENT OF INCOME
66
Note Reference Number 2018 2017 2016
(millions of dollars)
Revenues and other income
Sales and other operating revenue 279,332 237,162 200,628
Income from equity affiliates 7 7,355 5,380 4,806
Other income 3,525 1,821 2,680
Total revenues and other income 290,212 244,363 208,114
Costs and other deductions
Crude oil and product purchases 156,172 128,217 104,171
Production and manufacturing expenses 36,682 32,690 30,448
Selling, general and administrative expenses 11,480 10,649 10,443
Depreciation and depletion 9 18,745 19,893 22,308
Exploration expenses, including dry holes 1,466 1,790 1,467
Non-service pension and postretirement benefit expense 2, 17 1,285 1,745 1,835
Interest expense 766 601 453
Other taxes and duties 19 32,663 30,104 29,020
Total costs and other deductions 259,259 225,689 200,145
Income before income taxes 30,953 18,674 7,969
Income taxes 19 9,532 (1,174) (406)
Net income including noncontrolling interests 21,421 19,848 8,375
Net income attributable to noncontrolling interests 581 138 535
Net income attributable to ExxonMobil 20,840 19,710 7,840
Earnings per common share (dollars) 12 4.88 4.63 1.88
Earnings per common share - assuming dilution (dollars) 12 4.88 4.63 1.88
The information in the Notes to Consolidated Financial Statements is an integral part of these statements.
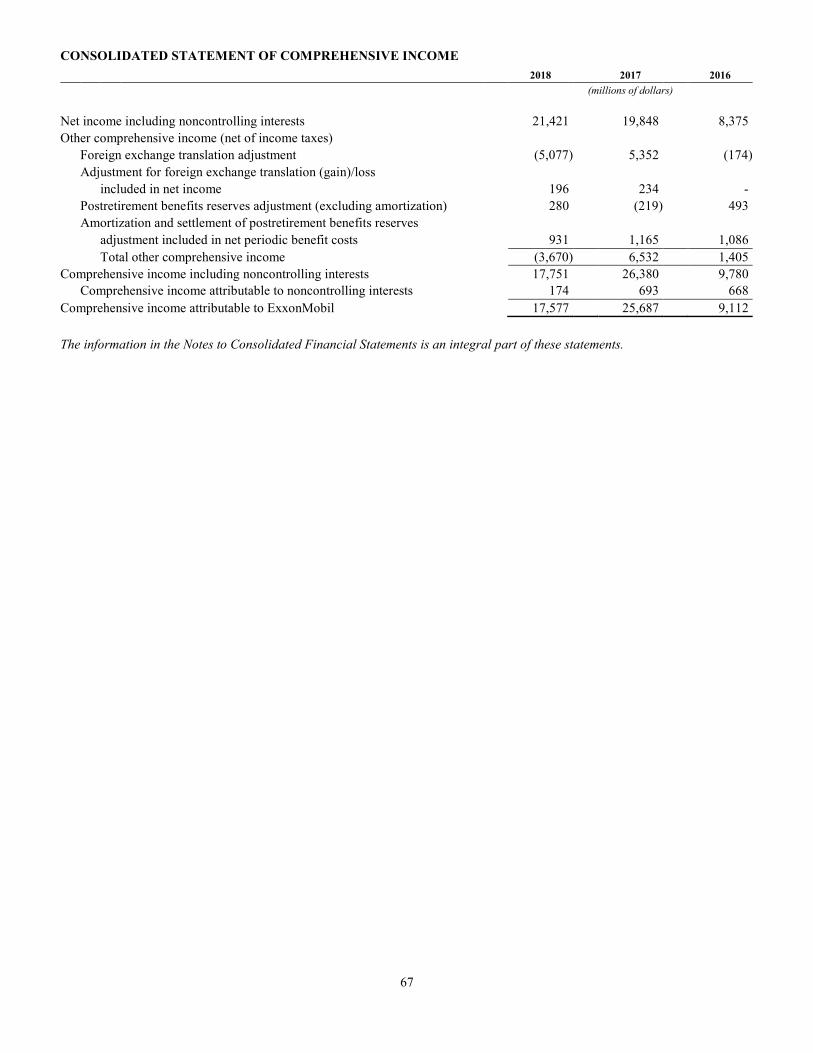
CONSOLIDATED STATEMENT OF COMPREHENSIVE INCOME
67
2018 2017 2016
(millions of dollars)
Net income including noncontrolling interests 21,421 19,848 8,375
Other comprehensive income (net of income taxes)
Foreign exchange translation adjustment (5,077) 5,352 (174)
Adjustment for foreign exchange translation (gain)/loss
included in net income 196 234 -
Postretirement benefits reserves adjustment (excluding amortization) 280 (219) 493
Amortization and settlement of postretirement benefits reserves
adjustment included in net periodic benefit costs 931 1,165 1,086
Total other comprehensive income (3,670) 6,532 1,405
Comprehensive income including noncontrolling interests 17,751 26,380 9,780
Comprehensive income attributable to noncontrolling interests 174 693 668
Comprehensive income attributable to ExxonMobil 17,577 25,687 9,112
The information in the Notes to Consolidated Financial Statements is an integral part of these statements.
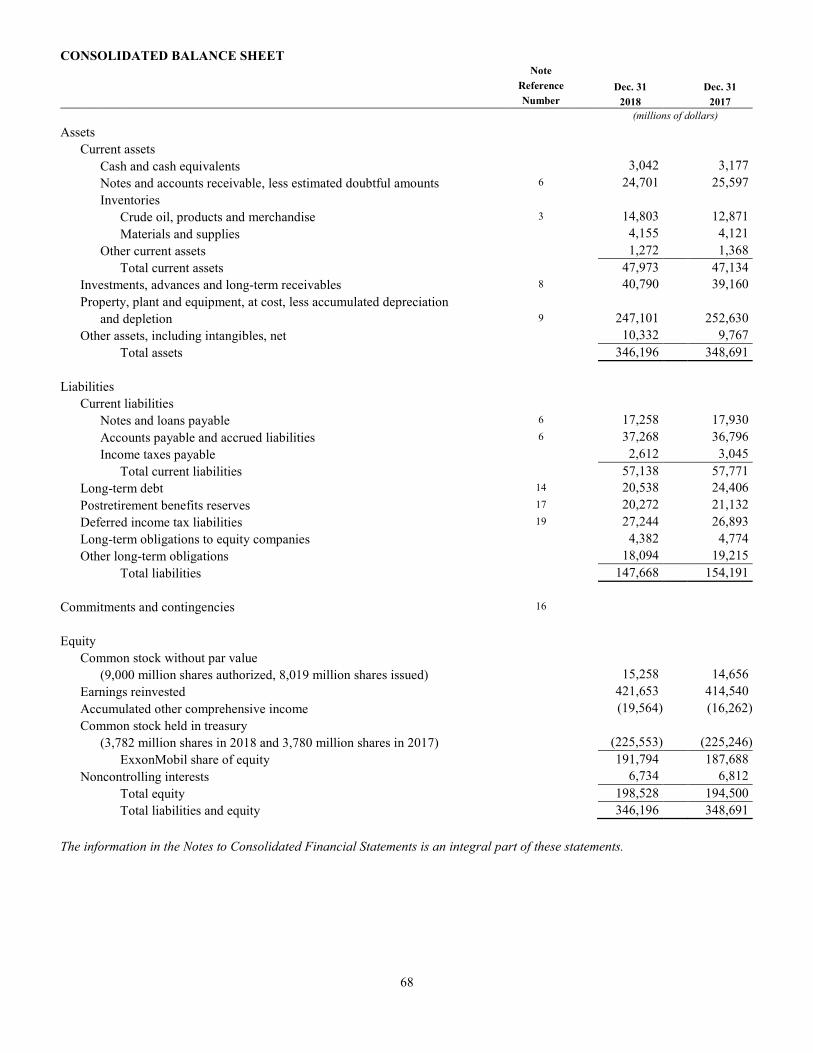
CONSOLIDATED BALANCE SHEET
68
Note
Reference Dec. 31 Dec. 31
Number 2018 2017
(millions of dollars)
Assets
Current assets
Cash and cash equivalents 3,042 3,177
Notes and accounts receivable, less estimated doubtful amounts 6 24,701 25,597
Inventories
Crude oil, products and merchandise 3 14,803 12,871
Materials and supplies 4,155 4,121
Other current assets 1,272 1,368
Total current assets 47,973 47,134
Investments, advances and long-term receivables 8 40,790 39,160
Property, plant and equipment, at cost, less accumulated depreciation
and depletion 9 247,101 252,630
Other assets, including intangibles, net 10,332 9,767
Total assets 346,196 348,691
Liabilities
Current liabilities
Notes and loans payable 6 17,258 17,930
Accounts payable and accrued liabilities 6 37,268 36,796
Income taxes payable 2,612 3,045
Total current liabilities 57,138 57,771
Long-term debt 14 20,538 24,406
Postretirement benefits reserves 17 20,272 21,132
Deferred income tax liabilities 19 27,244 26,893
Long-term obligations to equity companies 4,382 4,774
Other long-term obligations 18,094 19,215
Total liabilities 147,668 154,191
Commitments and contingencies 16
Equity
Common stock without par value
(9,000 million shares authorized, 8,019 million shares issued) 15,258 14,656
Earnings reinvested 421,653 414,540
Accumulated other comprehensive income (19,564) (16,262)
Common stock held in treasury
(3,782 million shares in 2018 and 3,780 million shares in 2017) (225,553) (225,246)
ExxonMobil share of equity 191,794 187,688
Noncontrolling interests 6,734 6,812
Total equity 198,528 194,500
Total liabilities and equity 346,196 348,691
The information in the Notes to Consolidated Financial Statements is an integral part of these statements.
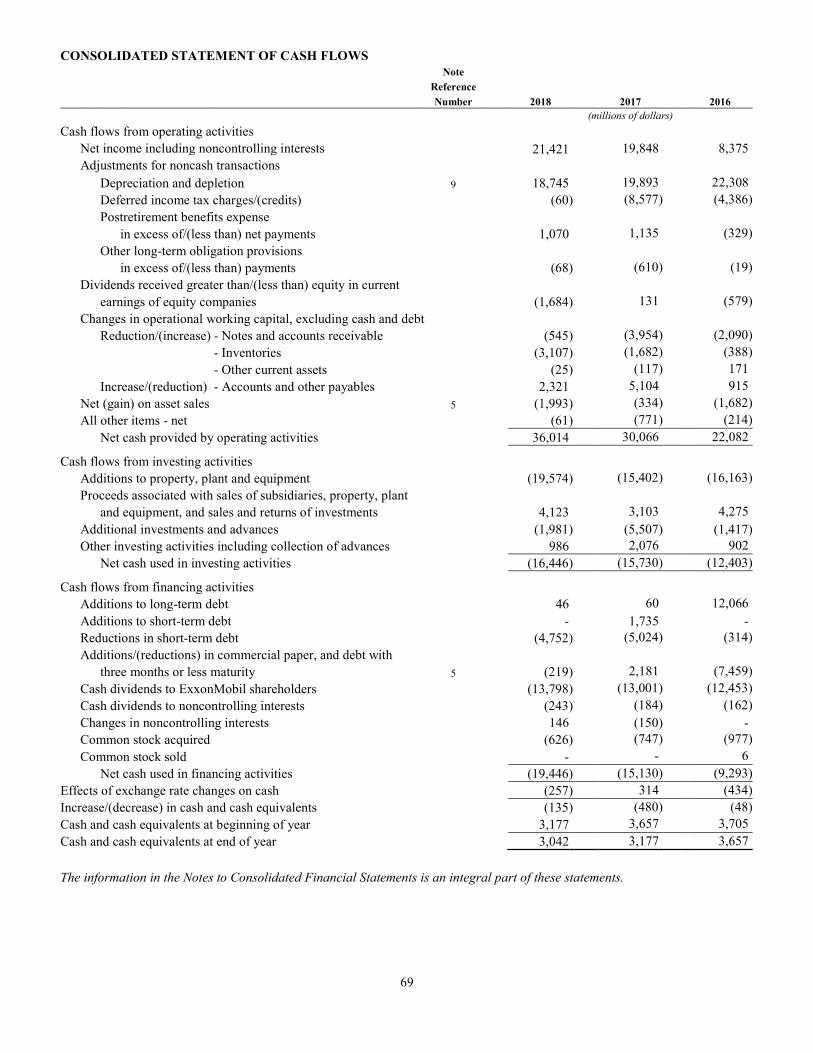
CONSOLIDATED STATEMENT OF CASH FLOWS
69
Note Reference Number 2018 2017 2016
(millions of dollars)
Cash flows from operating activities
Net income including noncontrolling interests 21,421 19,848 8,375
Adjustments for noncash transactions
Depreciation and depletion 9 18,745 19,893 22,308
Deferred income tax charges/(credits) (60) (8,577) (4,386)
Postretirement benefits expense
in excess of/(less than) net payments 1,070 1,135 (329)
Other long-term obligation provisions
in excess of/(less than) payments (68) (610) (19)
Dividends received greater than/(less than) equity in current
earnings of equity companies (1,684) 131 (579)
Changes in operational working capital, excluding cash and debt
Reduction/(increase) - Notes and accounts receivable (545) (3,954) (2,090)
- Inventories (3,107) (1,682) (388)
- Other current assets (25) (117) 171
Increase/(reduction) - Accounts and other payables 2,321 5,104 915
Net (gain) on asset sales 5 (1,993) (334) (1,682)
All other items - net (61) (771) (214)
Net cash provided by operating activities 36,014 30,066 22,082
Cash flows from investing activities
Additions to property, plant and equipment (19,574) (15,402) (16,163)
Proceeds associated with sales of subsidiaries, property, plant
and equipment, and sales and returns of investments 4,123 3,103 4,275
Additional investments and advances (1,981) (5,507) (1,417)
Other investing activities including collection of advances 986 2,076 902
Net cash used in investing activities (16,446) (15,730) (12,403)
Cash flows from financing activities
Additions to long-term debt 46 60 12,066
Additions to short-term debt - 1,735 -
Reductions in short-term debt (4,752) (5,024) (314)
Additions/(reductions) in commercial paper, and debt with
three months or less maturity 5 (219) 2,181 (7,459)
Cash dividends to ExxonMobil shareholders (13,798) (13,001) (12,453)
Cash dividends to noncontrolling interests (243) (184) (162)
Changes in noncontrolling interests 146 (150) -
Common stock acquired (626) (747) (977)
Common stock sold - - 6
Net cash used in financing activities (19,446) (15,130) (9,293)
Effects of exchange rate changes on cash (257) 314 (434)
Increase/(decrease) in cash and cash equivalents (135) (480) (48)
Cash and cash equivalents at beginning of year 3,177 3,657 3,705
Cash and cash equivalents at end of year 3,042 3,177 3,657
The information in the Notes to Consolidated Financial Statements is an integral part of these statements.
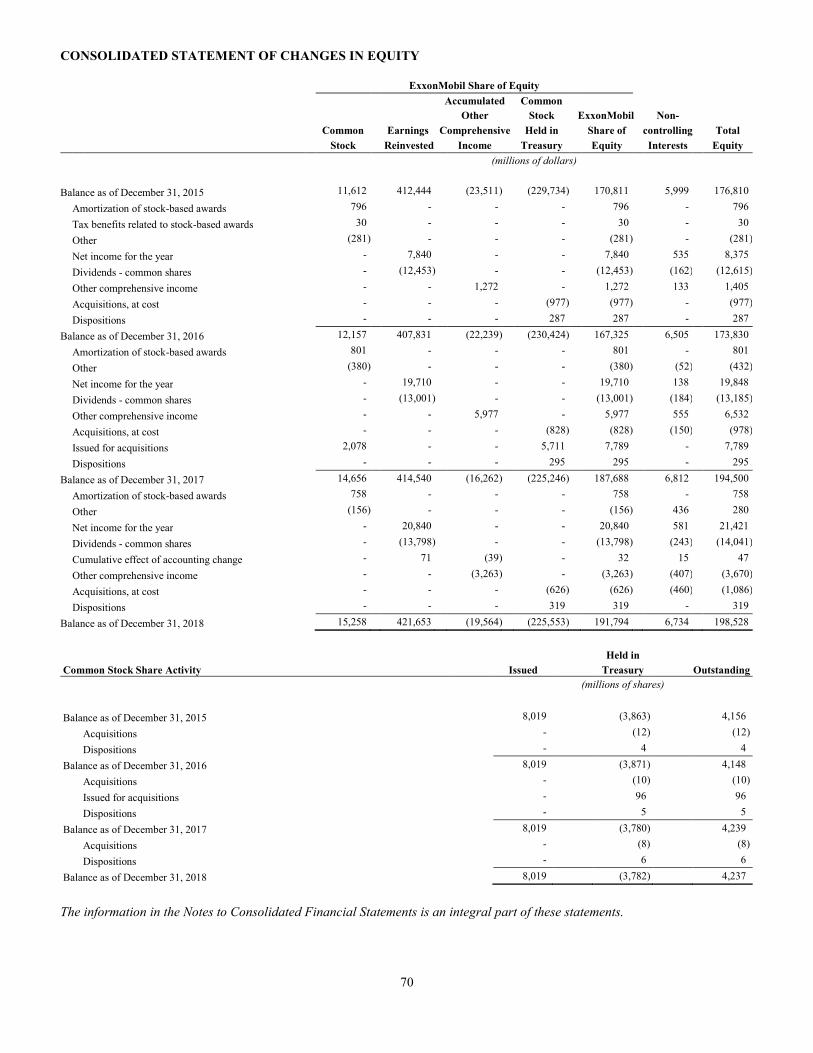
CONSOLIDATED STATEMENT OF CHANGES IN EQUITY
70
ExxonMobil Share of Equity
Accumulated Common
Other Stock ExxonMobil Non-
Common Earnings Comprehensive Held in Share of controlling Total
Stock Reinvested Income Treasury Equity Interests Equity
(millions of dollars)
Balance as of December 31, 2015 11,612 412,444 (23,511) (229,734) 170,811 5,999 176,810
Amortization of stock-based awards 796 - - - 796 - 796
Tax benefits related to stock-based awards 30 - - - 30 - 30
Other (281) - - - (281) - (281)
Net income for the year - 7,840 - - 7,840 535 8,375
Dividends - common shares - (12,453) - - (12,453) (162) (12,615)
Other comprehensive income - - 1,272 - 1,272 133 1,405
Acquisitions, at cost - - - (977) (977) - (977)
Dispositions - - - 287 287 - 287
Balance as of December 31, 2016 12,157 407,831 (22,239) (230,424) 167,325 6,505 173,830
Amortization of stock-based awards 801 - - - 801 - 801
Other (380) - - - (380) (52) (432)
Net income for the year - 19,710 - - 19,710 138 19,848
Dividends - common shares - (13,001) - - (13,001) (184) (13,185)
Other comprehensive income - - 5,977 - 5,977 555 6,532
Acquisitions, at cost - - - (828) (828) (150) (978)
Issued for acquisitions 2,078 - - 5,711 7,789 - 7,789
Dispositions - - - 295 295 - 295
Balance as of December 31, 2017 14,656 414,540 (16,262) (225,246) 187,688 6,812 194,500
Amortization of stock-based awards 758 - - - 758 - 758
Other (156) - - - (156) 436 280
Net income for the year - 20,840 - - 20,840 581 21,421
Dividends - common shares - (13,798) - - (13,798) (243) (14,041)
Cumulative effect of accounting change - 71 (39) - 32 15 47
Other comprehensive income - - (3,263) - (3,263) (407) (3,670)
Acquisitions, at cost - - - (626) (626) (460) (1,086)
Dispositions - - - 319 319 - 319
Balance as of December 31, 2018 15,258 421,653 (19,564) (225,553) 191,794 6,734 198,528
Held in
Common Stock Share Activity Issued Treasury Outstanding
(millions of shares)
Balance as of December 31, 2015 8,019 (3,863) 4,156
Acquisitions - (12) (12)
Dispositions - 4 4
Balance as of December 31, 2016 8,019 (3,871) 4,148
Acquisitions - (10) (10)
Issued for acquisitions - 96 96
Dispositions - 5 5
Balance as of December 31, 2017 8,019 (3,780) 4,239
Acquisitions - (8) (8)
Dispositions - 6 6
Balance as of December 31, 2018 8,019 (3,782) 4,237
The information in the Notes to Consolidated Financial Statements is an integral part of these statements.
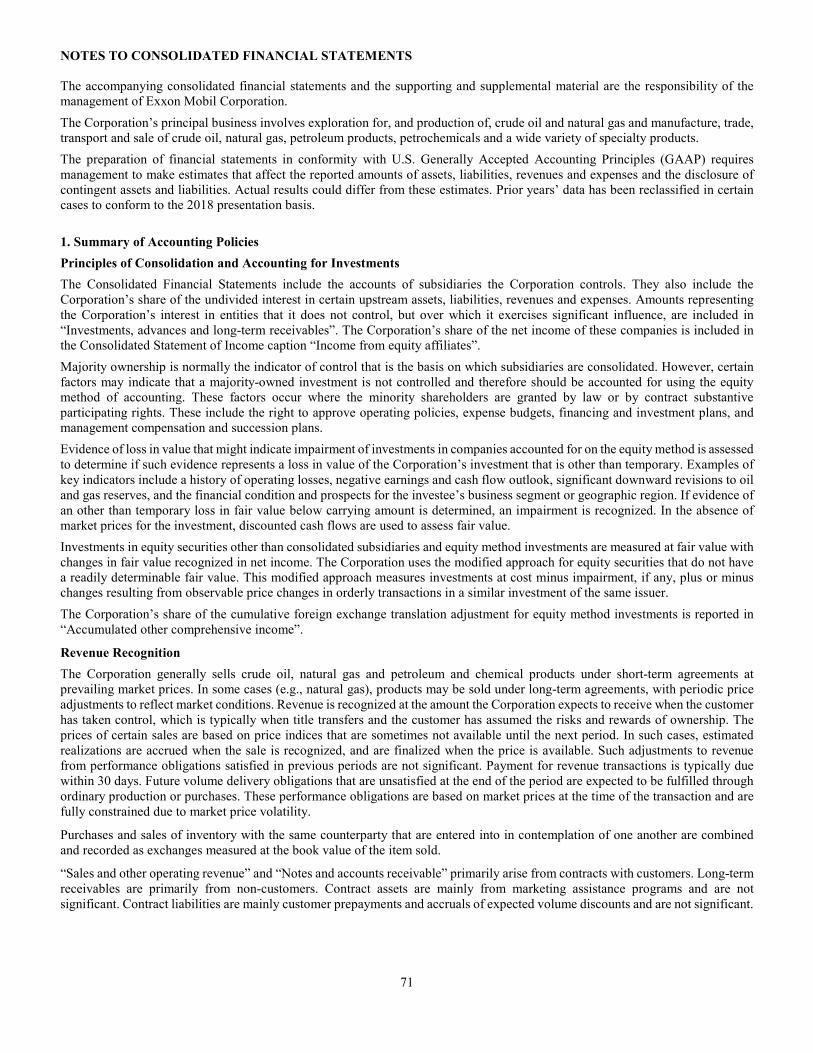
NOTES TO CONSOLIDATED FINANCIAL STATEMENTS
71
The accompanying consolidated financial statements and the supporting and supplemental material are the responsibility of the management of Exxon Mobil Corporation.
The Corporation’s principal business involves exploration for, and production of, crude oil and natural gas and manufacture, trade, transport and sale of crude oil, natural gas, petroleum products, petrochemicals and a wide variety of specialty products.
The preparation of financial statements in conformity with U.S. Generally Accepted Accounting Principles (GAAP) requires management to make estimates that affect the reported amounts of assets, liabilities, revenues and expenses and the disclosure of contingent assets and liabilities. Actual results could differ from these estimates. Prior years’ data has been reclassified in certain cases to conform to the 2018 presentation basis.
1. Summary of Accounting Policies
Principles of Consolidation and Accounting for Investments
The Consolidated Financial Statements include the accounts of subsidiaries the Corporation controls. They also include the Corporation’s share of the undivided interest in certain upstream assets, liabilities, revenues and expenses. Amounts representing the Corporation’s interest in entities that it does not control, but over which it exercises significant influence, are included in “Investments, advances and long-term receivables”. The Corporation’s share of the net income of these companies is included in the Consolidated Statement of Income caption “Income from equity affiliates”.
Majority ownership is normally the indicator of control that is the basis on which subsidiaries are consolidated. However, certain factors may indicate that a majority-owned investment is not controlled and therefore should be accounted for using the equity method of accounting. These factors occur where the minority shareholders are granted by law or by contract substantive participating rights. These include the right to approve operating policies, expense budgets, financing and investment plans, and management compensation and succession plans.
Evidence of loss in value that might indicate impairment of investments in companies accounted for on the equity method is assessed to determine if such evidence represents a loss in value of the Corporation’s investment that is other than temporary. Examples of key indicators include a history of operating losses, negative earnings and cash flow outlook, significant downward revisions to oil and gas reserves, and the financial condition and prospects for the investee’s business segment or geographic region. If evidence of an other than temporary loss in fair value below carrying amount is determined, an impairment is recognized. In the absence of market prices for the investment, discounted cash flows are used to assess fair value.
Investments in equity securities other than consolidated subsidiaries and equity method investments are measured at fair value with changes in fair value recognized in net income. The Corporation uses the modified approach for equity securities that do not have a readily determinable fair value. This modified approach measures investments at cost minus impairment, if any, plus or minus changes resulting from observable price changes in orderly transactions in a similar investment of the same issuer.
The Corporation’s share of the cumulative foreign exchange translation adjustment for equity method investments is reported in “Accumulated other comprehensive income”.
Revenue Recognition
The Corporation generally sells crude oil, natural gas and petroleum and chemical products under short-term agreements at prevailing market prices. In some cases (e.g., natural gas), products may be sold under long-term agreements, with periodic price adjustments to reflect market conditions. Revenue is recognized at the amount the Corporation expects to receive when the customer has taken control, which is typically when title transfers and the customer has assumed the risks and rewards of ownership. The prices of certain sales are based on price indices that are sometimes not available until the next period. In such cases, estimated realizations are accrued when the sale is recognized, and are finalized when the price is available. Such adjustments to revenue from performance obligations satisfied in previous periods are not significant. Payment for revenue transactions is typically due within 30 days. Future volume delivery obligations that are unsatisfied at the end of the period are expected to be fulfilled through ordinary production or purchases. These performance obligations are based on market prices at the time of the transaction and are fully constrained due to market price volatility.
Purchases and sales of inventory with the same counterparty that are entered into in contemplation of one another are combined and recorded as exchanges measured at the book value of the item sold.
“Sales and other operating revenue” and “Notes and accounts receivable” primarily arise from contracts with customers. Long-term receivables are primarily from non-customers. Contract assets are mainly from marketing assistance programs and are not significant. Contract liabilities are mainly customer prepayments and accruals of expected volume discounts and are not significant.
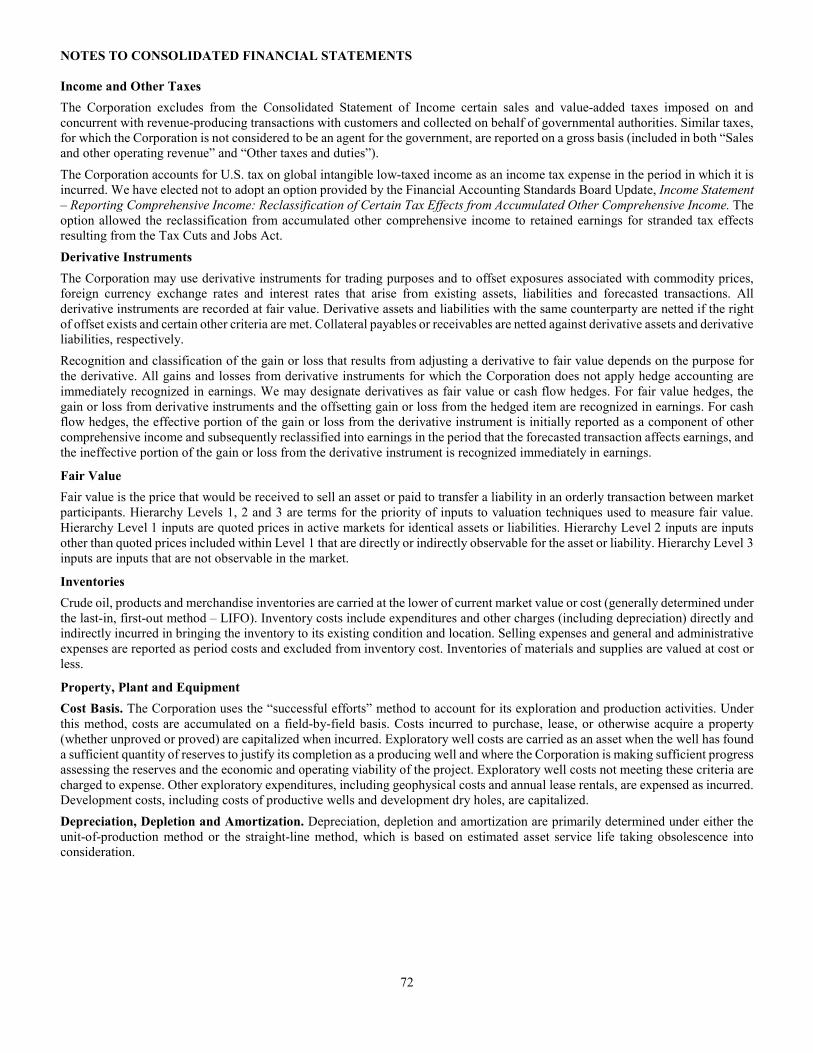
NOTES TO CONSOLIDATED FINANCIAL STATEMENTS
72
Income and Other Taxes
The Corporation excludes from the Consolidated Statement of Income certain sales and value-added taxes imposed on and concurrent with revenue-producing transactions with customers and collected on behalf of governmental authorities. Similar taxes, for which the Corporation is not considered to be an agent for the government, are reported on a gross basis (included in both “Sales and other operating revenue” and “Other taxes and duties”).
The Corporation accounts for U.S. tax on global intangible low-taxed income as an income tax expense in the period in which it is incurred. We have elected not to adopt an option provided by the Financial Accounting Standards Board Update, Income Statement
– Reporting Comprehensive Income: Reclassification of Certain Tax Effects from Accumulated Other Comprehensive Income. The option allowed the reclassification from accumulated other comprehensive income to retained earnings for stranded tax effects resulting from the Tax Cuts and Jobs Act.
Derivative Instruments
The Corporation may use derivative instruments for trading purposes and to offset exposures associated with commodity prices, foreign currency exchange rates and interest rates that arise from existing assets, liabilities and forecasted transactions. All derivative instruments are recorded at fair value. Derivative assets and liabilities with the same counterparty are netted if the right of offset exists and certain other criteria are met. Collateral payables or receivables are netted against derivative assets and derivative liabilities, respectively.
Recognition and classification of the gain or loss that results from adjusting a derivative to fair value depends on the purpose for the derivative. All gains and losses from derivative instruments for which the Corporation does not apply hedge accounting are immediately recognized in earnings. We may designate derivatives as fair value or cash flow hedges. For fair value hedges, the gain or loss from derivative instruments and the offsetting gain or loss from the hedged item are recognized in earnings. For cash flow hedges, the effective portion of the gain or loss from the derivative instrument is initially reported as a component of other comprehensive income and subsequently reclassified into earnings in the period that the forecasted transaction affects earnings, and the ineffective portion of the gain or loss from the derivative instrument is recognized immediately in earnings.
Fair Value
Fair value is the price that would be received to sell an asset or paid to transfer a liability in an orderly transaction between market participants. Hierarchy Levels 1, 2 and 3 are terms for the priority of inputs to valuation techniques used to measure fair value. Hierarchy Level 1 inputs are quoted prices in active markets for identical assets or liabilities. Hierarchy Level 2 inputs are inputs other than quoted prices included within Level 1 that are directly or indirectly observable for the asset or liability. Hierarchy Level 3 inputs are inputs that are not observable in the market.
Inventories
Crude oil, products and merchandise inventories are carried at the lower of current market value or cost (generally determined under the last-in, first-out method – LIFO). Inventory costs include expenditures and other charges (including depreciation) directly and indirectly incurred in bringing the inventory to its existing condition and location. Selling expenses and general and administrative expenses are reported as period costs and excluded from inventory cost. Inventories of materials and supplies are valued at cost or less.
Property, Plant and Equipment
Cost Basis. The Corporation uses the “successful efforts” method to account for its exploration and production activities. Under this method, costs are accumulated on a field-by-field basis. Costs incurred to purchase, lease, or otherwise acquire a property (whether unproved or proved) are capitalized when incurred. Exploratory well costs are carried as an asset when the well has found a sufficient quantity of reserves to justify its completion as a producing well and where the Corporation is making sufficient progress assessing the reserves and the economic and operating viability of the project. Exploratory well costs not meeting these criteria are charged to expense. Other exploratory expenditures, including geophysical costs and annual lease rentals, are expensed as incurred. Development costs, including costs of productive wells and development dry holes, are capitalized.
Depreciation, Depletion and Amortization. Depreciation, depletion and amortization are primarily determined under either the unit-of-production method or the straight-line method, which is based on estimated asset service life taking obsolescence into consideration.
NOTES TO CONSOLIDATED FINANCIAL STATEMENTS
73
Acquisition costs of proved properties are amortized using a unit-of-production method, computed on the basis of total proved oil and gas reserves. Capitalized exploratory drilling and development costs associated with productive depletable extractive properties are amortized using the unit-of-production rates based on the amount of proved developed reserves of oil and gas that are estimated to be recoverable from existing facilities using current operating methods. Under the unit-of-production method, oil and gas volumes are considered produced once they have been measured through meters at custody transfer or sales transaction points at the outlet valve on the lease or field storage tank. In the event that the unit-of-production method does not result in an equitable allocation of cost over the economic life of an upstream asset, an alternative method is used. The straight-line method is used in limited situations where the expected life of the asset does not reasonably correlate with that of the underlying reserves. For example, certain assets used in the production of oil and natural gas have a shorter life than the reserves, and as such, the Corporation uses straight-line depreciation to ensure the asset is fully depreciated by the end of its useful life.
To the extent that proved reserves for a property are substantially de-booked and that property continues to produce such that the resulting depreciation charge does not result in an equitable allocation of cost over the expected life, assets will be depreciated using a unit-of-production method based on reserves determined at the most recent SEC price which results in a more meaningful quantity of proved reserves, appropriately adjusted for production and technical changes.
Investments in refinery, chemical process, and lubes basestock manufacturing equipment are generally depreciated on a straight-line basis over a 25-year life. Service station buildings and fixed improvements generally are depreciated over a 20-year life. Maintenance and repairs, including planned major maintenance, are expensed as incurred. Major renewals and improvements are capitalized and the assets replaced are retired.
Impairment Assessment. The Corporation tests assets or groups of assets for recoverability on an ongoing basis whenever events or changes in circumstances indicate that the carrying amounts may not be recoverable. Among the events or changes in circumstances which could indicate that the carrying value of an asset or asset group may not be recoverable are the following:
• a significant decrease in the market price of a long-lived asset;
• a significant adverse change in the extent or manner in which an asset is being used or in its physical condition including a significant decrease in current and projected reserve volumes;
• a significant adverse change in legal factors or in the business climate that could affect the value, including an adverse action or assessment by a regulator;
• an accumulation of project costs significantly in excess of the amount originally expected;
• a current-period operating loss combined with a history and forecast of operating or cash flow losses; and
• a current expectation that, more likely than not, a long-lived asset will be sold or otherwise disposed of significantly before the end of its previously estimated useful life.
Asset valuation analyses performed as part of its asset management program and other profitability reviews assist the Corporation in assessing whether events or changes in circumstances indicate the carrying amounts of any of its assets may not be recoverable.
In general, the Corporation does not view temporarily low prices or margins as an indication of impairment. Management believes that prices over the long term must be sufficient to generate investments in energy supply to meet global demand. Although prices will occasionally drop significantly, industry prices over the long term will continue to be driven by market supply and demand fundamentals. On the supply side, industry production from mature fields is declining. This is being offset by investments to generate production from new discoveries, field developments and technology and efficiency advancements. OPEC investment activities and production policies also have an impact on world oil supplies. The demand side is largely a function of general economic activities and levels of prosperity. Because the lifespans of the vast majority of the Corporation’s major assets are measured in decades, the value of these assets is predominantly based on long-term views of future commodity prices and production costs. During the lifespan of these major assets, the Corporation expects that oil and gas prices will experience significant volatility, and consequently these assets will experience periods of higher earnings and periods of lower earnings, or even losses. In assessing whether the events or changes in circumstances indicate the carrying value of an asset may not be recoverable, the Corporation considers recent periods of operating losses in the context of its longer-term view of prices. While near-term prices are subject to wide fluctuations, longer-term price views are more stable and meaningful for purposes of assessing future cash flows.
When the industry experiences a prolonged and deep reduction in commodity prices, the market supply and demand conditions may result in changes to the Corporation’s long-term price or margin assumptions it uses for its capital investment decisions. To the extent those changes result in a significant reduction to its long-term oil price, natural gas price or margin ranges, the Corporation may consider that situation, in conjunction with other events or changes in circumstances such as a history of operating losses, an indicator of potential impairment for certain assets.
NOTES TO CONSOLIDATED FINANCIAL STATEMENTS
74
In the Upstream, the standardized measure of discounted cash flows included in the Supplemental Information on Oil and Gas Exploration and Production activities is required to use prices based on the average of first-of-month prices. These prices represent discrete points in time and could be higher or lower than the Corporation’s long-term price assumptions which are used for impairment assessments. The Corporation believes the standardized measure does not provide a reliable estimate of the expected future cash flows to be obtained from the development and production of its oil and gas properties or of the value of its oil and gas reserves and therefore does not consider it relevant in determining whether events or changes in circumstances indicate the need for an impairment assessment.
If events or changes in circumstances indicate that the carrying value of an asset may not be recoverable, the Corporation estimates the future undiscounted cash flows of the affected properties to judge the recoverability of carrying amounts. In performing this assessment, assets are grouped at the lowest level for which there are identifiable cash flows that are largely independent of the cash flows of other groups of assets. Cash flows used in recoverability assessments are based on the Corporation’s assumptions which are developed in the annual planning and budgeting process, and are consistent with the criteria management uses to evaluate investment opportunities. These evaluations make use of the Corporation’s assumptions of future capital allocations, crude oil and natural gas commodity prices, refining and chemical margins, volumes, costs, and foreign currency exchange rates. Volumes are based on projected field and facility production profiles, throughput, or sales. Where unproved reserves exist, an appropriately risk-adjusted amount of these reserves may be included in the evaluation. Cash flow estimates for impairment testing exclude the effects of derivative instruments.
An asset group is impaired if its estimated undiscounted cash flows are less than the asset’s carrying value. Impairments are measured by the amount by which the carrying value exceeds fair value. Fair value is based on market prices if an active market exists for the asset group, or discounted cash flows using a discount rate commensurate with the risk. Significant unproved properties are assessed for impairment individually, and valuation allowances against the capitalized costs are recorded based on the estimated economic chance of success and the length of time that the Corporation expects to hold the properties. Properties that are not individually significant are aggregated by groups and amortized based on development risk and average holding period.
Other. Gains on sales of proved and unproved properties are only recognized when there is neither uncertainty about the recovery of costs applicable to any interest retained nor any substantial obligation for future performance by the Corporation. Losses on properties sold are recognized when incurred or when the properties are held for sale and the fair value of the properties is less than the carrying value.
Interest costs incurred to finance expenditures during the construction phase of multiyear projects are capitalized as part of the historical cost of acquiring the constructed assets. The project construction phase commences with the development of the detailed engineering design and ends when the constructed assets are ready for their intended use. Capitalized interest costs are included in property, plant and equipment and are depreciated over the service life of the related assets.
Asset Retirement Obligations and Environmental Liabilities
The Corporation incurs retirement obligations for certain assets. The fair values of these obligations are recorded as liabilities on a discounted basis, which is typically at the time the assets are installed. The costs associated with these liabilities are capitalized as part of the related assets and depreciated. Over time, the liabilities are accreted for the change in their present value.
Liabilities for environmental costs are recorded when it is probable that obligations have been incurred and the amounts can be reasonably estimated. These liabilities are not reduced by possible recoveries from third parties, and projected cash expenditures are not discounted.
Foreign Currency Translation
The Corporation selects the functional reporting currency for its international subsidiaries based on the currency of the primary economic environment in which each subsidiary operates.
Downstream and Chemical operations primarily use the local currency. However, the U.S. dollar is used in countries with a history of high inflation (primarily in Latin America) and Singapore, which predominantly sells into the U.S. dollar export market. Upstream operations which are relatively self-contained and integrated within a particular country, such as Canada, the United Kingdom, Norway and continental Europe, use the local currency. Some Upstream operations, primarily in Asia and Africa, use the U.S. dollar because they predominantly sell crude and natural gas production into U.S. dollar-denominated markets.
For all operations, gains or losses from remeasuring foreign currency transactions into the functional currency are included in income.
NOTES TO CONSOLIDATED FINANCIAL STATEMENTS
75
2. Accounting Changes
Effective January 1, 2018, ExxonMobil adopted the Financial Accounting Standards Board’s Standard, Revenue from Contracts
with Customers (Topic 606), as amended. The standard establishes a single revenue recognition model for all contracts with customers, eliminates industry and transaction specific requirements, and expands disclosure requirements. The standard was adopted using the Modified Retrospective method, under which prior year results are not restated, but supplemental information is provided for any material impacts of the standard on 2018 results. The adoption of the standard did not have a material impact on any of the lines reported in the Corporation’s financial statements. The cumulative effect of adoption of the standard was de minimis. The Corporation did not elect any practical expedients that require disclosure.
Effective January 1, 2018, ExxonMobil adopted the Financial Accounting Standards Board’s Update, Financial Instruments – Overall (Subtopic 825-10): Recognition and Measurement of Financial Assets and Financial Liabilities. The standard requires investments in equity securities other than consolidated subsidiaries and equity method investments to be measured at fair value with changes in the fair value recognized through net income. The Corporation elected a modified approach for equity securities that do not have a readily determinable fair value. This modified approach measures investments at cost minus impairment, if any, plus or minus changes resulting from observable price changes in orderly transactions for the identical or a similar investment of the same issuer. The cumulative effect adjustment related to the adoption of this standard increased opening 2018 retained earnings $47 million.
Effective January 1, 2018, ExxonMobil adopted the Financial Accounting Standards Board’s Update, Compensation – Retirement
Benefits (Topic 715): Improving the Presentation of Net Periodic Pension Cost and Net Periodic Postretirement Benefit Cost. The update requires separate presentation of the service cost component from other components of net benefit costs. The other components are reported in a new line on the Corporation’s Statement of Income, “Non-service pension and postretirement benefit expense”. The Corporation elected to use the practical expedient which uses the amounts disclosed in the pension and other postretirement benefit plan note for the prior comparative periods as the estimation basis for applying the retrospective presentation requirements, as it is impracticable to determine the amounts capitalized in those periods. Beginning in 2018, the other components of net benefit costs are included in the Corporate and financing segment. The estimated after-tax impact from the change in segmentation is an increase in Corporate and financing expenses of about $450 million for 2018. The increase in the Corporate and financing expenses is offset by lower expenses across the operating segments. Additionally, only the service cost component of net benefit costs is eligible for capitalization in situations where it is otherwise appropriate to capitalize employee costs in connection with the construction or production of an asset.
The impact of the retrospective presentation change on ExxonMobil's Consolidated Statement of Income for 2017 and 2016 is shown below.
2017 2016
As
Reported Change As
Adjusted As
Reported Change As
Adjusted
(millions of dollars)
Production and manufacturing expenses 34,128 (1,438) 32,690 31,927 (1,479) 30,448
Selling, general and administrative expenses 10,956 (307) 10,649 10,799 (356) 10,443
Non-service pension and postretirement benefit expense - 1,745 1,745 - 1,835 1,835
NOTES TO CONSOLIDATED FINANCIAL STATEMENTS
76
Effective January 1, 2019, the Corporation adopted the Financial Accounting Standards Board’s Standard, Leases (Topic 842), as amended. The standard requires all leases to be recorded on the balance sheet as a right of use asset and a lease liability. The Corporation used a transition method that applies the new lease standard at January 1, 2019, and recognizes any cumulative-effect adjustments to the opening balance of 2019 retained earnings. The Corporation applied a policy election to exclude short-term leases from balance sheet recognition and also elected certain practical expedients at adoption. As permitted under these expedients the Corporation did not reassess whether existing contracts are or contain leases, the lease classification for any existing leases, initial direct costs for any existing lease and whether existing land easements and rights of way, that were not previously accounted for as leases, are or contain a lease. At January 1, 2019, the operating lease liability is estimated to be in the range of $3.3 billion and the operating lease right of use asset is estimated to be in the range of $4.3 billion, including about $1.0 billion related to prepaid leases. The cumulative effect adjustment is expected to be de minimis.
3. Miscellaneous Financial Information
Research and development expenses totaled $1,116 million in 2018, $1,063 million in 2017, and $1,058 million in 2016.
Net income included before-tax aggregate foreign exchange transaction losses of $138 million in 2018, and gains of $6 million and $29 million in 2017 and 2016, respectively.
In 2018, 2017 and 2016, net income included a gain of $107 million, and losses of $10 million, and $295 million, respectively, attributable to the combined effects of LIFO inventory accumulations and drawdowns. The aggregate replacement cost of inventories was estimated to exceed their LIFO carrying values by $8.2 billion and $10.8 billion at December 31, 2018, and 2017, respectively.
Crude oil, products and merchandise as of year-end 2018 and 2017 consist of the following: 2018 2017
(millions of dollars)
Crude oil 4,783 4,635 Petroleum products 5,666 4,333 Chemical products 3,821 3,283 Gas/other 533 620
Total 14,803 12,871
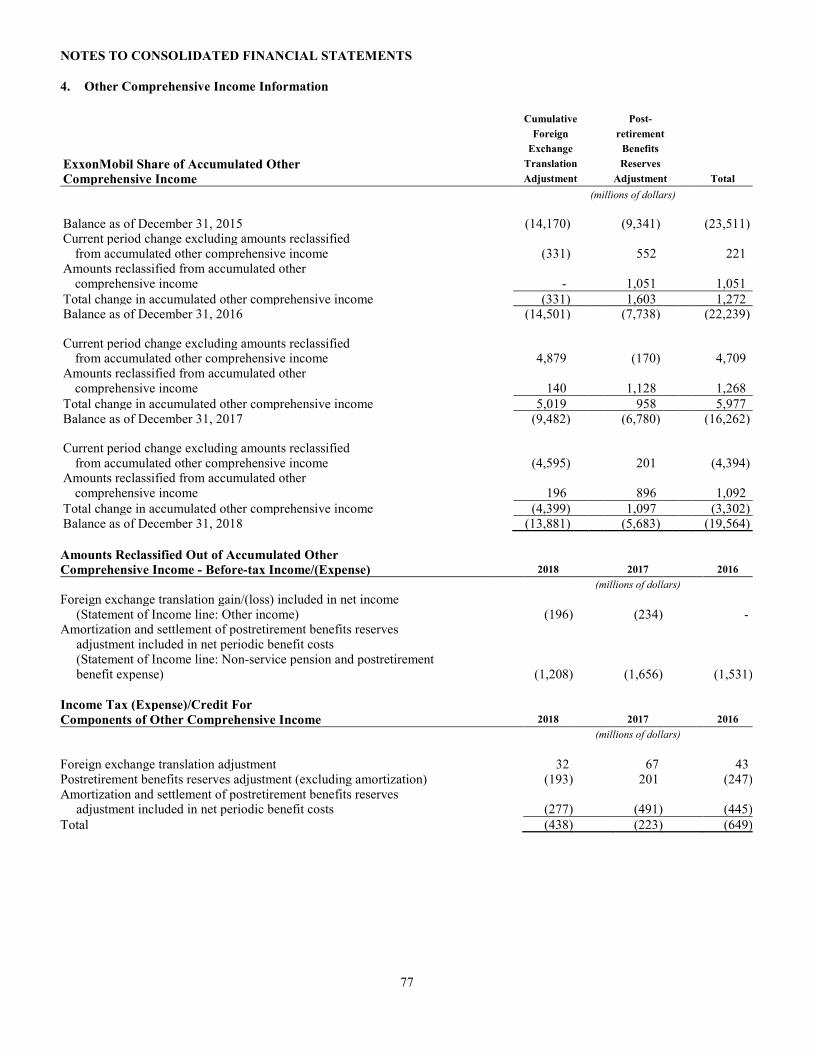
NOTES TO CONSOLIDATED FINANCIAL STATEMENTS
77
4. Other Comprehensive Income Information
Cumulative Post-
Foreign retirement
Exchange Benefits
ExxonMobil Share of Accumulated Other Translation Reserves
Comprehensive Income Adjustment Adjustment Total
(millions of dollars)
Balance as of December 31, 2015 (14,170) (9,341) (23,511) Current period change excluding amounts reclassified from accumulated other comprehensive income (331) 552 221 Amounts reclassified from accumulated other comprehensive income - 1,051 1,051
Total change in accumulated other comprehensive income (331) 1,603 1,272 Balance as of December 31, 2016 (14,501) (7,738) (22,239) Current period change excluding amounts reclassified from accumulated other comprehensive income 4,879 (170) 4,709 Amounts reclassified from accumulated other comprehensive income 140 1,128 1,268
Total change in accumulated other comprehensive income 5,019 958 5,977 Balance as of December 31, 2017 (9,482) (6,780) (16,262) Current period change excluding amounts reclassified from accumulated other comprehensive income (4,595) 201 (4,394) Amounts reclassified from accumulated other comprehensive income 196 896 1,092
Total change in accumulated other comprehensive income (4,399) 1,097 (3,302) Balance as of December 31, 2018 (13,881) (5,683) (19,564)
Amounts Reclassified Out of Accumulated Other
Comprehensive Income - Before-tax Income/(Expense) 2018 2017 2016
(millions of dollars)
Foreign exchange translation gain/(loss) included in net income (Statement of Income line: Other income) (196) (234) - Amortization and settlement of postretirement benefits reserves adjustment included in net periodic benefit costs (Statement of Income line: Non-service pension and postretirement benefit expense) (1,208) (1,656) (1,531)
Income Tax (Expense)/Credit For
Components of Other Comprehensive Income 2018 2017 2016
(millions of dollars)
Foreign exchange translation adjustment 32 67 43 Postretirement benefits reserves adjustment (excluding amortization) (193) 201 (247)Amortization and settlement of postretirement benefits reserves adjustment included in net periodic benefit costs (277) (491) (445)
Total (438) (223) (649)
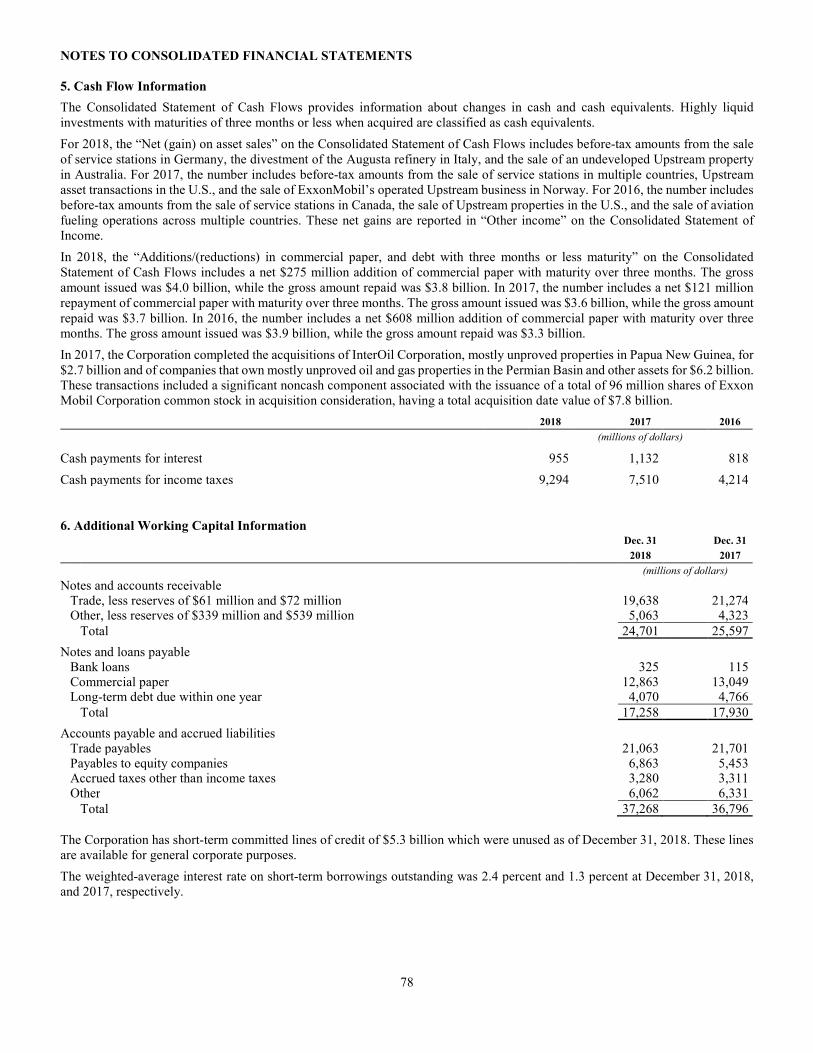
NOTES TO CONSOLIDATED FINANCIAL STATEMENTS
78
5. Cash Flow Information
The Consolidated Statement of Cash Flows provides information about changes in cash and cash equivalents. Highly liquid investments with maturities of three months or less when acquired are classified as cash equivalents.
For 2018, the “Net (gain) on asset sales” on the Consolidated Statement of Cash Flows includes before-tax amounts from the sale of service stations in Germany, the divestment of the Augusta refinery in Italy, and the sale of an undeveloped Upstream property in Australia. For 2017, the number includes before-tax amounts from the sale of service stations in multiple countries, Upstream asset transactions in the U.S., and the sale of ExxonMobil’s operated Upstream business in Norway. For 2016, the number includes before-tax amounts from the sale of service stations in Canada, the sale of Upstream properties in the U.S., and the sale of aviation fueling operations across multiple countries. These net gains are reported in “Other income” on the Consolidated Statement of Income.
In 2018, the “Additions/(reductions) in commercial paper, and debt with three months or less maturity” on the Consolidated Statement of Cash Flows includes a net $275 million addition of commercial paper with maturity over three months. The gross amount issued was $4.0 billion, while the gross amount repaid was $3.8 billion. In 2017, the number includes a net $121 million repayment of commercial paper with maturity over three months. The gross amount issued was $3.6 billion, while the gross amount repaid was $3.7 billion. In 2016, the number includes a net $608 million addition of commercial paper with maturity over three months. The gross amount issued was $3.9 billion, while the gross amount repaid was $3.3 billion.
In 2017, the Corporation completed the acquisitions of InterOil Corporation, mostly unproved properties in Papua New Guinea, for $2.7 billion and of companies that own mostly unproved oil and gas properties in the Permian Basin and other assets for $6.2 billion. These transactions included a significant noncash component associated with the issuance of a total of 96 million shares of Exxon Mobil Corporation common stock in acquisition consideration, having a total acquisition date value of $7.8 billion.
2018 2017 2016
(millions of dollars)
Cash payments for interest 955 1,132 818 Cash payments for income taxes 9,294 7,510 4,214
6. Additional Working Capital Information Dec. 31 Dec. 31
2018 2017
(millions of dollars)
Notes and accounts receivable Trade, less reserves of $61 million and $72 million 19,638 21,274 Other, less reserves of $339 million and $539 million 5,063 4,323
Total 24,701 25,597
Notes and loans payable Bank loans 325 115 Commercial paper 12,863 13,049 Long-term debt due within one year 4,070 4,766
Total 17,258 17,930
Accounts payable and accrued liabilities Trade payables 21,063 21,701 Payables to equity companies 6,863 5,453 Accrued taxes other than income taxes 3,280 3,311 Other 6,062 6,331
Total 37,268 36,796
The Corporation has short-term committed lines of credit of $5.3 billion which were unused as of December 31, 2018. These lines are available for general corporate purposes.
The weighted-average interest rate on short-term borrowings outstanding was 2.4 percent and 1.3 percent at December 31, 2018, and 2017, respectively.
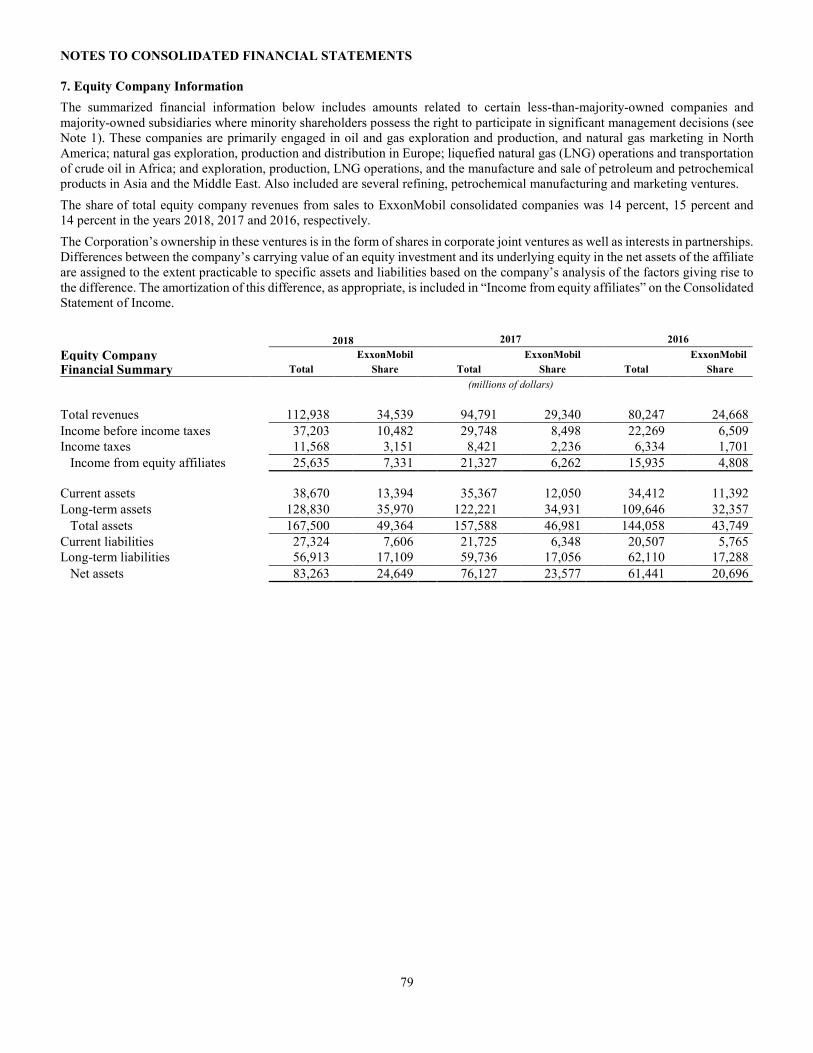
NOTES TO CONSOLIDATED FINANCIAL STATEMENTS
79
7. Equity Company Information
The summarized financial information below includes amounts related to certain less-than-majority-owned companies and
majority-owned subsidiaries where minority shareholders possess the right to participate in significant management decisions (see Note 1). These companies are primarily engaged in oil and gas exploration and production, and natural gas marketing in North America; natural gas exploration, production and distribution in Europe; liquefied natural gas (LNG) operations and transportation of crude oil in Africa; and exploration, production, LNG operations, and the manufacture and sale of petroleum and petrochemical products in Asia and the Middle East. Also included are several refining, petrochemical manufacturing and marketing ventures.
The share of total equity company revenues from sales to ExxonMobil consolidated companies was 14 percent, 15 percent and 14 percent in the years 2018, 2017 and 2016, respectively.
The Corporation’s ownership in these ventures is in the form of shares in corporate joint ventures as well as interests in partnerships. Differences between the company’s carrying value of an equity investment and its underlying equity in the net assets of the affiliate are assigned to the extent practicable to specific assets and liabilities based on the company’s analysis of the factors giving rise to the difference. The amortization of this difference, as appropriate, is included in “Income from equity affiliates” on the Consolidated Statement of Income.
2018 2017 2016
Equity Company ExxonMobil ExxonMobil ExxonMobil
Financial Summary Total Share Total Share Total Share
(millions of dollars)
Total revenues 112,938 34,539 94,791 29,340 80,247 24,668
Income before income taxes 37,203 10,482 29,748 8,498 22,269 6,509
Income taxes 11,568 3,151 8,421 2,236 6,334 1,701
Income from equity affiliates 25,635 7,331 21,327 6,262 15,935 4,808
Current assets 38,670 13,394 35,367 12,050 34,412 11,392
Long-term assets 128,830 35,970 122,221 34,931 109,646 32,357
Total assets 167,500 49,364 157,588 46,981 144,058 43,749
Current liabilities 27,324 7,606 21,725 6,348 20,507 5,765
Long-term liabilities 56,913 17,109 59,736 17,056 62,110 17,288
Net assets 83,263 24,649 76,127 23,577 61,441 20,696
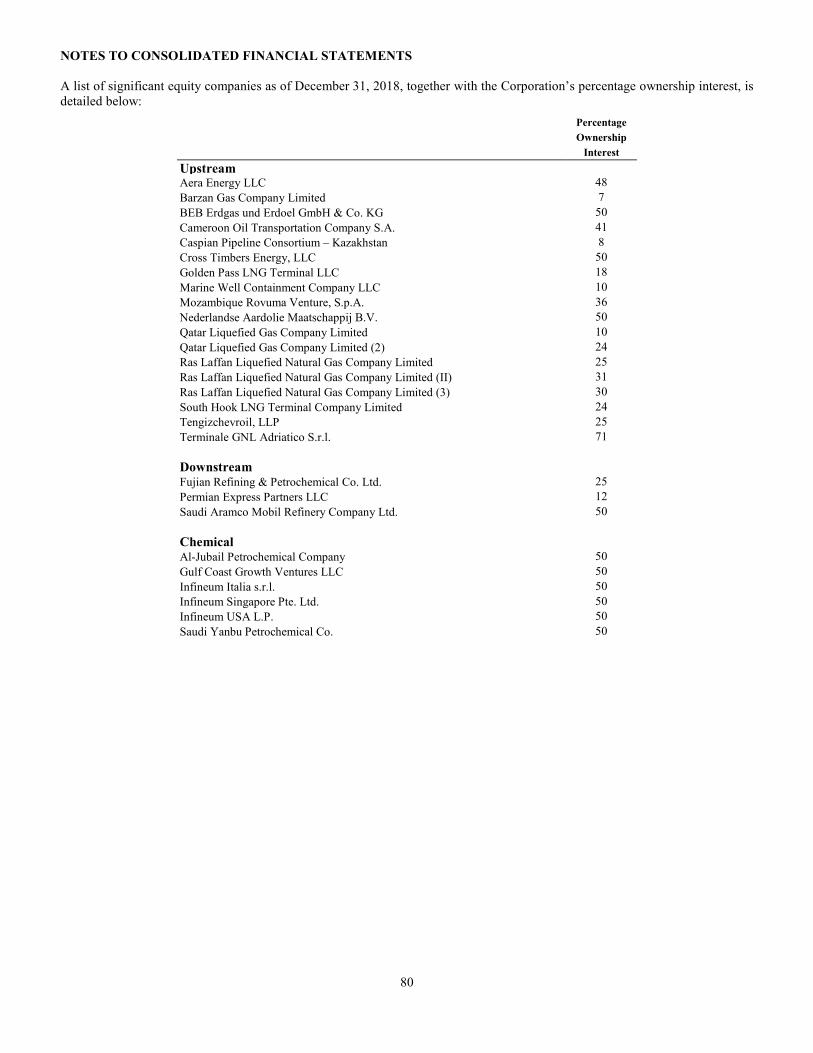
NOTES TO CONSOLIDATED FINANCIAL STATEMENTS
80
A list of significant equity companies as of December 31, 2018, together with the Corporation’s percentage ownership interest, is detailed below:
Percentage
Ownership
Interest
Upstream Aera Energy LLC 48
Barzan Gas Company Limited 7
BEB Erdgas und Erdoel GmbH & Co. KG 50
Cameroon Oil Transportation Company S.A. 41
Caspian Pipeline Consortium – Kazakhstan 8
Cross Timbers Energy, LLC 50
Golden Pass LNG Terminal LLC 18
Marine Well Containment Company LLC 10
Mozambique Rovuma Venture, S.p.A. 36
Nederlandse Aardolie Maatschappij B.V. 50
Qatar Liquefied Gas Company Limited 10
Qatar Liquefied Gas Company Limited (2) 24
Ras Laffan Liquefied Natural Gas Company Limited 25
Ras Laffan Liquefied Natural Gas Company Limited (II) 31
Ras Laffan Liquefied Natural Gas Company Limited (3) 30
South Hook LNG Terminal Company Limited 24
Tengizchevroil, LLP 25
Terminale GNL Adriatico S.r.l. 71
Downstream
Fujian Refining & Petrochemical Co. Ltd. 25
Permian Express Partners LLC 12
Saudi Aramco Mobil Refinery Company Ltd. 50
Chemical
Al-Jubail Petrochemical Company 50
Gulf Coast Growth Ventures LLC 50
Infineum Italia s.r.l. 50
Infineum Singapore Pte. Ltd. 50
Infineum USA L.P. 50
Saudi Yanbu Petrochemical Co. 50
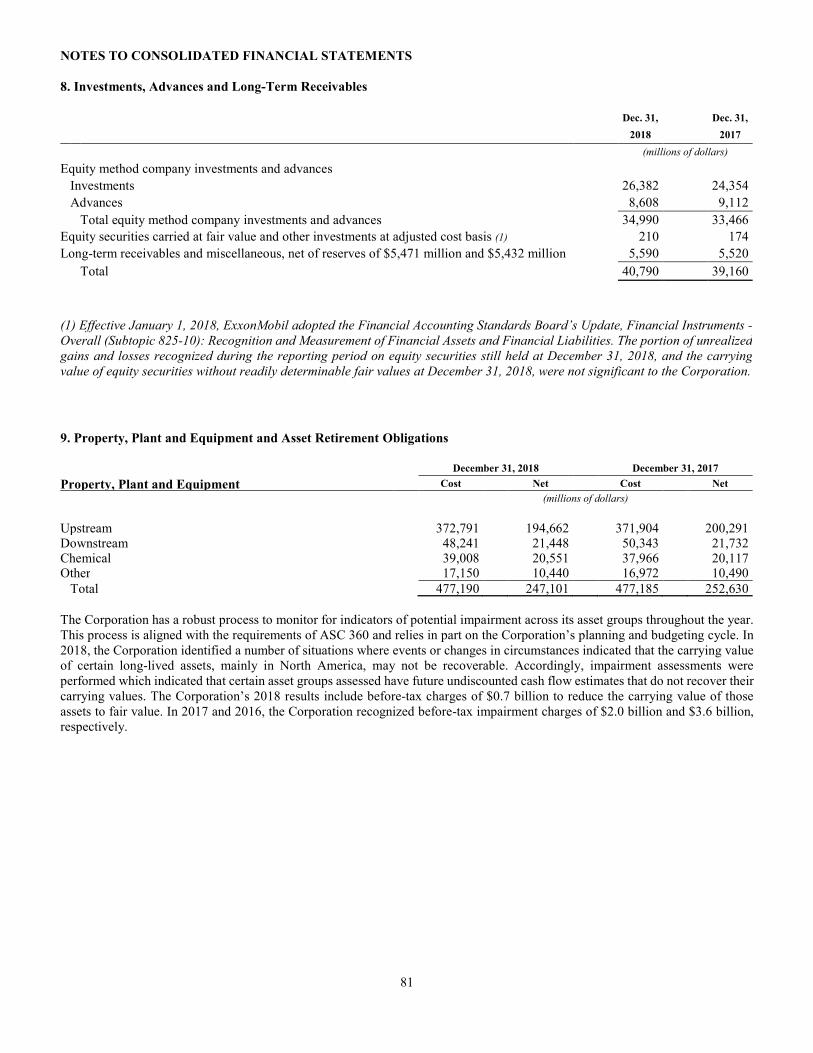
NOTES TO CONSOLIDATED FINANCIAL STATEMENTS
81
8. Investments, Advances and Long-Term Receivables
Dec. 31, Dec. 31,
2018 2017
(millions of dollars)
Equity method company investments and advances
Investments 26,382 24,354
Advances 8,608 9,112
Total equity method company investments and advances 34,990 33,466
Equity securities carried at fair value and other investments at adjusted cost basis (1) 210 174
Long-term receivables and miscellaneous, net of reserves of $5,471 million and $5,432 million 5,590 5,520
Total 40,790 39,160
(1) Effective January 1, 2018, ExxonMobil adopted the Financial Accounting Standards Board’s Update, Financial Instruments -
Overall (Subtopic 825-10): Recognition and Measurement of Financial Assets and Financial Liabilities. The portion of unrealized
gains and losses recognized during the reporting period on equity securities still held at December 31, 2018, and the carrying
value of equity securities without readily determinable fair values at December 31, 2018, were not significant to the Corporation.
9. Property, Plant and Equipment and Asset Retirement Obligations
December 31, 2018 December 31, 2017
Property, Plant and Equipment Cost Net Cost Net
(millions of dollars)
Upstream 372,791 194,662 371,904 200,291 Downstream 48,241 21,448 50,343 21,732 Chemical 39,008 20,551 37,966 20,117 Other 17,150 10,440 16,972 10,490
Total 477,190 247,101 477,185 252,630
The Corporation has a robust process to monitor for indicators of potential impairment across its asset groups throughout the year. This process is aligned with the requirements of ASC 360 and relies in part on the Corporation’s planning and budgeting cycle. In 2018, the Corporation identified a number of situations where events or changes in circumstances indicated that the carrying value of certain long-lived assets, mainly in North America, may not be recoverable. Accordingly, impairment assessments were performed which indicated that certain asset groups assessed have future undiscounted cash flow estimates that do not recover their carrying values. The Corporation’s 2018 results include before-tax charges of $0.7 billion to reduce the carrying value of those assets to fair value. In 2017 and 2016, the Corporation recognized before-tax impairment charges of $2.0 billion and $3.6 billion, respectively.
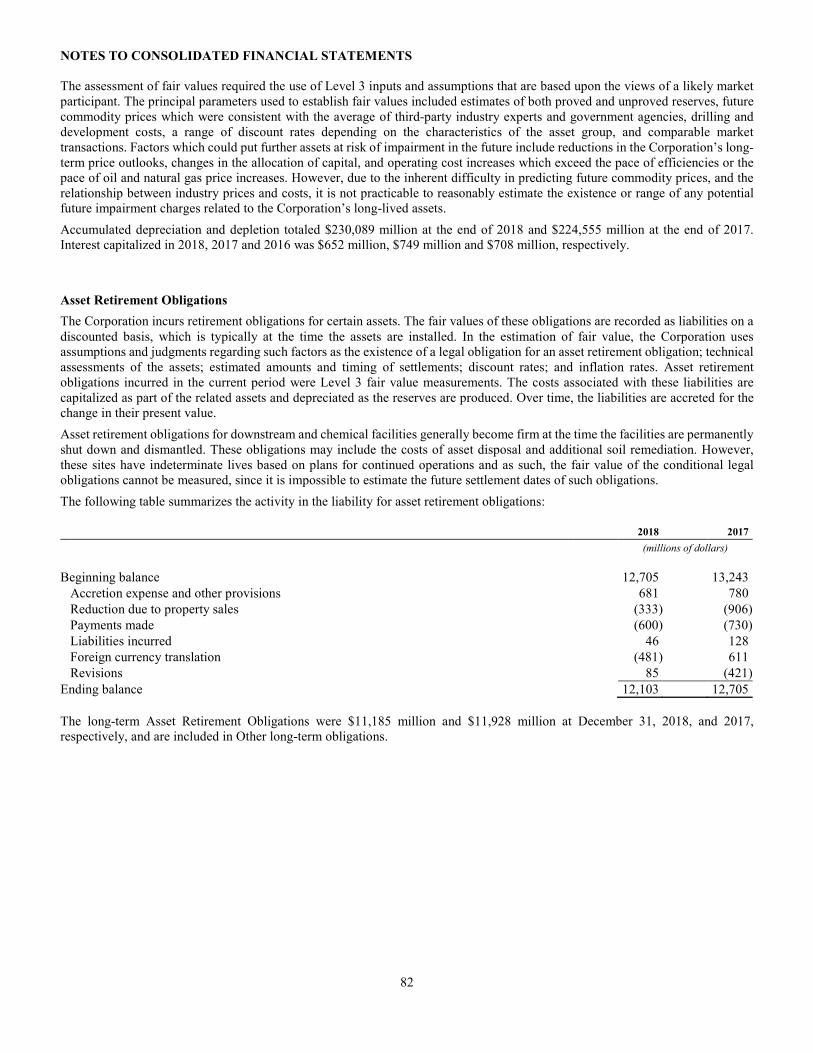
NOTES TO CONSOLIDATED FINANCIAL STATEMENTS
82
The assessment of fair values required the use of Level 3 inputs and assumptions that are based upon the views of a likely market participant. The principal parameters used to establish fair values included estimates of both proved and unproved reserves, future commodity prices which were consistent with the average of third-party industry experts and government agencies, drilling and development costs, a range of discount rates depending on the characteristics of the asset group, and comparable market transactions. Factors which could put further assets at risk of impairment in the future include reductions in the Corporation’s long-term price outlooks, changes in the allocation of capital, and operating cost increases which exceed the pace of efficiencies or the pace of oil and natural gas price increases. However, due to the inherent difficulty in predicting future commodity prices, and the relationship between industry prices and costs, it is not practicable to reasonably estimate the existence or range of any potential future impairment charges related to the Corporation’s long-lived assets.
Accumulated depreciation and depletion totaled $230,089 million at the end of 2018 and $224,555 million at the end of 2017. Interest capitalized in 2018, 2017 and 2016 was $652 million, $749 million and $708 million, respectively.
Asset Retirement Obligations
The Corporation incurs retirement obligations for certain assets. The fair values of these obligations are recorded as liabilities on a
discounted basis, which is typically at the time the assets are installed. In the estimation of fair value, the Corporation uses assumptions and judgments regarding such factors as the existence of a legal obligation for an asset retirement obligation; technical assessments of the assets; estimated amounts and timing of settlements; discount rates; and inflation rates. Asset retirement obligations incurred in the current period were Level 3 fair value measurements. The costs associated with these liabilities are capitalized as part of the related assets and depreciated as the reserves are produced. Over time, the liabilities are accreted for the change in their present value.
Asset retirement obligations for downstream and chemical facilities generally become firm at the time the facilities are permanently shut down and dismantled. These obligations may include the costs of asset disposal and additional soil remediation. However, these sites have indeterminate lives based on plans for continued operations and as such, the fair value of the conditional legal obligations cannot be measured, since it is impossible to estimate the future settlement dates of such obligations.
The following table summarizes the activity in the liability for asset retirement obligations: 2018 2017
(millions of dollars)
Beginning balance 12,705 13,243
Accretion expense and other provisions 681 780
Reduction due to property sales (333) (906)
Payments made (600) (730)
Liabilities incurred 46 128
Foreign currency translation (481) 611
Revisions 85 (421)
Ending balance 12,103 12,705
The long-term Asset Retirement Obligations were $11,185 million and $11,928 million at December 31, 2018, and 2017, respectively, and are included in Other long-term obligations.
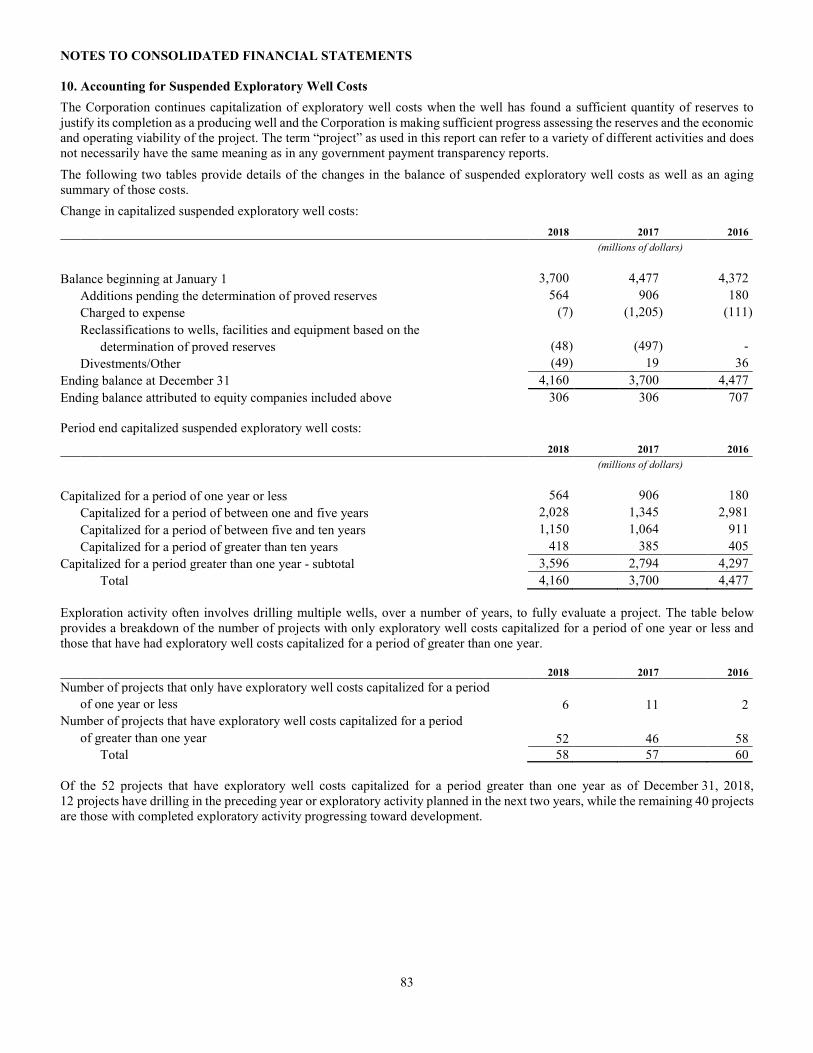
NOTES TO CONSOLIDATED FINANCIAL STATEMENTS
83
10. Accounting for Suspended Exploratory Well Costs
The Corporation continues capitalization of exploratory well costs when the well has found a sufficient quantity of reserves to
justify its completion as a producing well and the Corporation is making sufficient progress assessing the reserves and the economic and operating viability of the project. The term “project” as used in this report can refer to a variety of different activities and does not necessarily have the same meaning as in any government payment transparency reports.
The following two tables provide details of the changes in the balance of suspended exploratory well costs as well as an aging summary of those costs.
Change in capitalized suspended exploratory well costs:
2018 2017 2016
(millions of dollars)
Balance beginning at January 1 3,700 4,477 4,372
Additions pending the determination of proved reserves 564 906 180
Charged to expense (7) (1,205) (111)
Reclassifications to wells, facilities and equipment based on the
determination of proved reserves (48) (497) -
Divestments/Other (49) 19 36
Ending balance at December 31 4,160 3,700 4,477
Ending balance attributed to equity companies included above 306 306 707
Period end capitalized suspended exploratory well costs:
2018 2017 2016
(millions of dollars)
Capitalized for a period of one year or less 564 906 180
Capitalized for a period of between one and five years 2,028 1,345 2,981
Capitalized for a period of between five and ten years 1,150 1,064 911
Capitalized for a period of greater than ten years 418 385 405
Capitalized for a period greater than one year - subtotal 3,596 2,794 4,297
Total 4,160 3,700 4,477
Exploration activity often involves drilling multiple wells, over a number of years, to fully evaluate a project. The table below provides a breakdown of the number of projects with only exploratory well costs capitalized for a period of one year or less and those that have had exploratory well costs capitalized for a period of greater than one year.
2018 2017 2016
Number of projects that only have exploratory well costs capitalized for a period
of one year or less 6 11 2
Number of projects that have exploratory well costs capitalized for a period
of greater than one year 52 46 58
Total 58 57 60
Of the 52 projects that have exploratory well costs capitalized for a period greater than one year as of December 31, 2018, 12 projects have drilling in the preceding year or exploratory activity planned in the next two years, while the remaining 40 projects are those with completed exploratory activity progressing toward development.
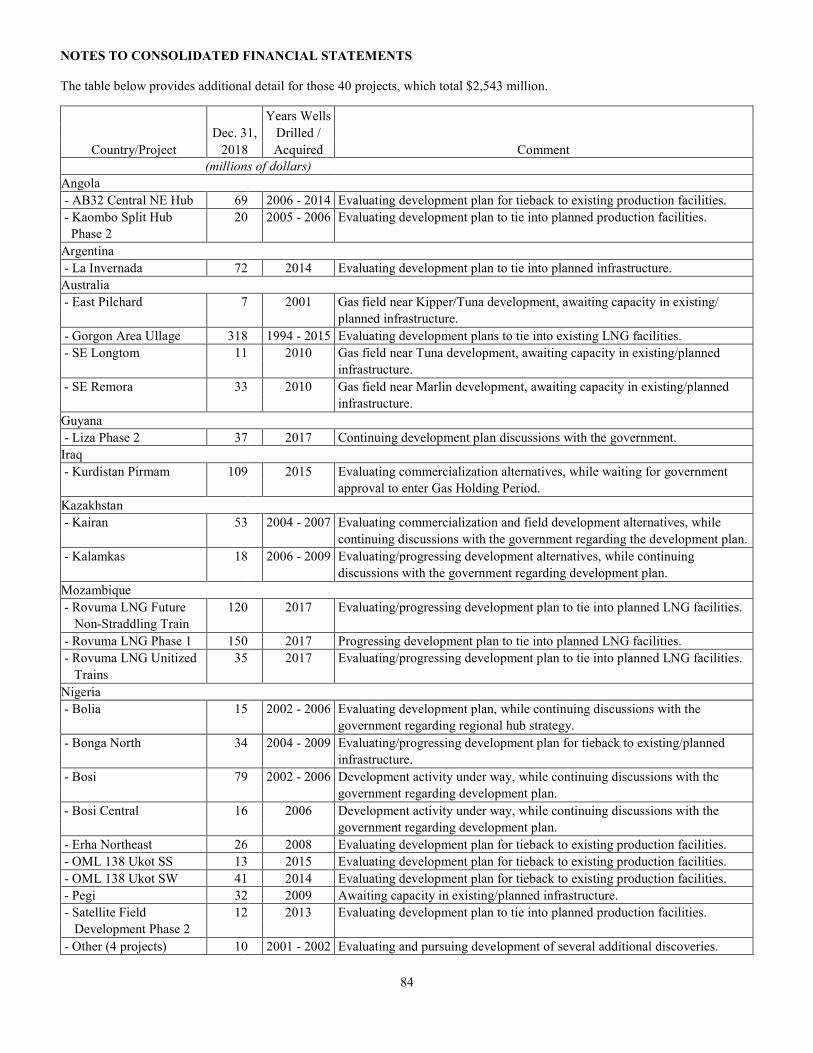
NOTES TO CONSOLIDATED FINANCIAL STATEMENTS
84
The table below provides additional detail for those 40 projects, which total $2,543 million.
Years Wells
Dec. 31, Drilled /
Country/Project 2018 Acquired Comment
(millions of dollars)
Angola
- AB32 Central NE Hub 69 2006 - 2014 Evaluating development plan for tieback to existing production facilities.
- Kaombo Split Hub 20 2005 - 2006 Evaluating development plan to tie into planned production facilities.
Phase 2
Argentina
- La Invernada 72 2014 Evaluating development plan to tie into planned infrastructure.
Australia
- East Pilchard 7 2001 Gas field near Kipper/Tuna development, awaiting capacity in existing/
planned infrastructure.
- Gorgon Area Ullage 318 1994 - 2015 Evaluating development plans to tie into existing LNG facilities.
- SE Longtom 11 2010 Gas field near Tuna development, awaiting capacity in existing/planned
infrastructure.
- SE Remora 33 2010 Gas field near Marlin development, awaiting capacity in existing/planned
infrastructure.
Guyana
- Liza Phase 2 37 2017 Continuing development plan discussions with the government.
Iraq
- Kurdistan Pirmam 109 2015 Evaluating commercialization alternatives, while waiting for government
approval to enter Gas Holding Period.
Kazakhstan
- Kairan 53 2004 - 2007 Evaluating commercialization and field development alternatives, while
continuing discussions with the government regarding the development plan.
- Kalamkas 18 2006 - 2009 Evaluating/progressing development alternatives, while continuing
discussions with the government regarding development plan.
Mozambique
- Rovuma LNG Future 120 2017 Evaluating/progressing development plan to tie into planned LNG facilities.
Non-Straddling Train
- Rovuma LNG Phase 1 150 2017 Progressing development plan to tie into planned LNG facilities.
- Rovuma LNG Unitized 35 2017 Evaluating/progressing development plan to tie into planned LNG facilities.
Trains
Nigeria
- Bolia 15 2002 - 2006 Evaluating development plan, while continuing discussions with the
government regarding regional hub strategy.
- Bonga North 34 2004 - 2009 Evaluating/progressing development plan for tieback to existing/planned
infrastructure.
- Bosi 79 2002 - 2006 Development activity under way, while continuing discussions with the
government regarding development plan.
- Bosi Central 16 2006 Development activity under way, while continuing discussions with the
government regarding development plan.
- Erha Northeast 26 2008 Evaluating development plan for tieback to existing production facilities.
- OML 138 Ukot SS 13 2015 Evaluating development plan for tieback to existing production facilities.
- OML 138 Ukot SW 41 2014 Evaluating development plan for tieback to existing production facilities.
- Pegi 32 2009 Awaiting capacity in existing/planned infrastructure.
- Satellite Field 12 2013 Evaluating development plan to tie into planned production facilities.
Development Phase 2
- Other (4 projects) 10 2001 - 2002 Evaluating and pursuing development of several additional discoveries.
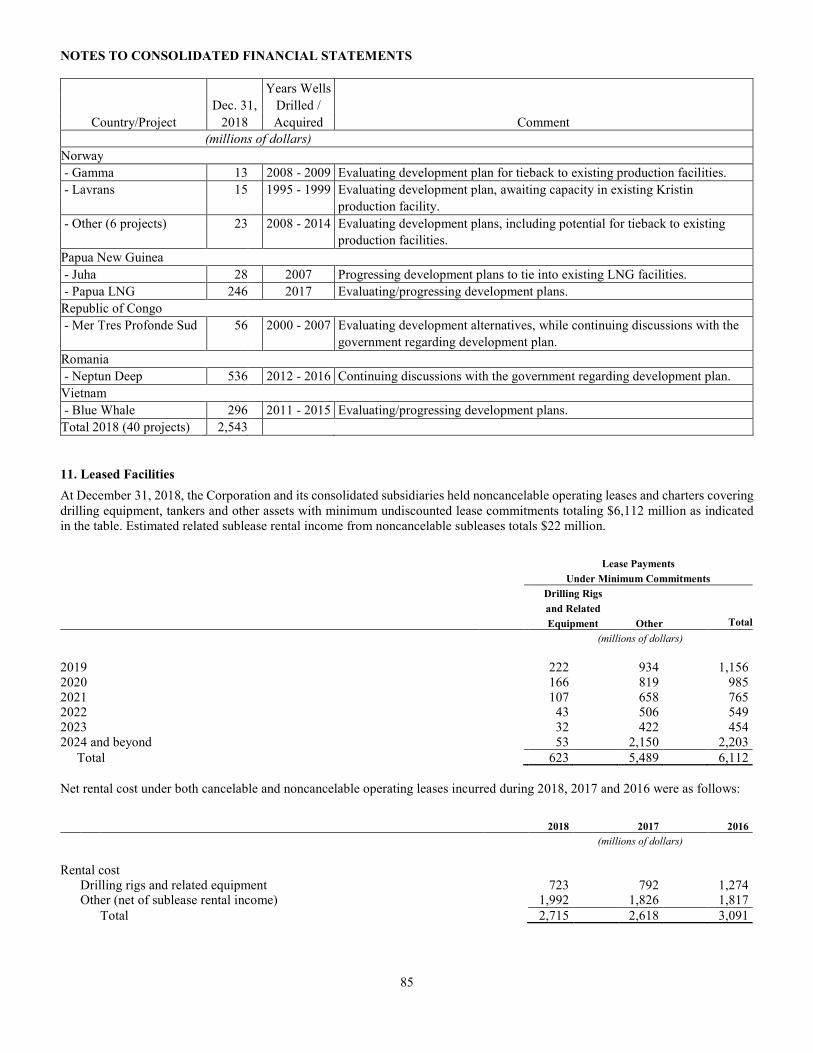
NOTES TO CONSOLIDATED FINANCIAL STATEMENTS
85
Years Wells
Dec. 31, Drilled /
Country/Project 2018 Acquired Comment
(millions of dollars)
Norway
- Gamma 13 2008 - 2009 Evaluating development plan for tieback to existing production facilities.
- Lavrans 15 1995 - 1999 Evaluating development plan, awaiting capacity in existing Kristin
production facility.
- Other (6 projects) 23 2008 - 2014 Evaluating development plans, including potential for tieback to existing
production facilities.
Papua New Guinea
- Juha 28 2007 Progressing development plans to tie into existing LNG facilities.
- Papua LNG 246 2017 Evaluating/progressing development plans.
Republic of Congo
- Mer Tres Profonde Sud 56 2000 - 2007 Evaluating development alternatives, while continuing discussions with the
government regarding development plan.
Romania
- Neptun Deep 536 2012 - 2016 Continuing discussions with the government regarding development plan.
Vietnam
- Blue Whale 296 2011 - 2015 Evaluating/progressing development plans.
Total 2018 (40 projects) 2,543
11. Leased Facilities
At December 31, 2018, the Corporation and its consolidated subsidiaries held noncancelable operating leases and charters covering drilling equipment, tankers and other assets with minimum undiscounted lease commitments totaling $6,112 million as indicated in the table. Estimated related sublease rental income from noncancelable subleases totals $22 million.
Lease Payments
Under Minimum Commitments
Drilling Rigs
and Related
Equipment Other Total
(millions of dollars)
2019 222 934 1,156 2020 166 819 985 2021 107 658 765 2022 43 506 549 2023 32 422 454 2024 and beyond 53 2,150 2,203
Total 623 5,489 6,112
Net rental cost under both cancelable and noncancelable operating leases incurred during 2018, 2017 and 2016 were as follows:
2018 2017 2016
(millions of dollars)
Rental cost Drilling rigs and related equipment 723 792 1,274 Other (net of sublease rental income) 1,992 1,826 1,817
Total 2,715 2,618 3,091
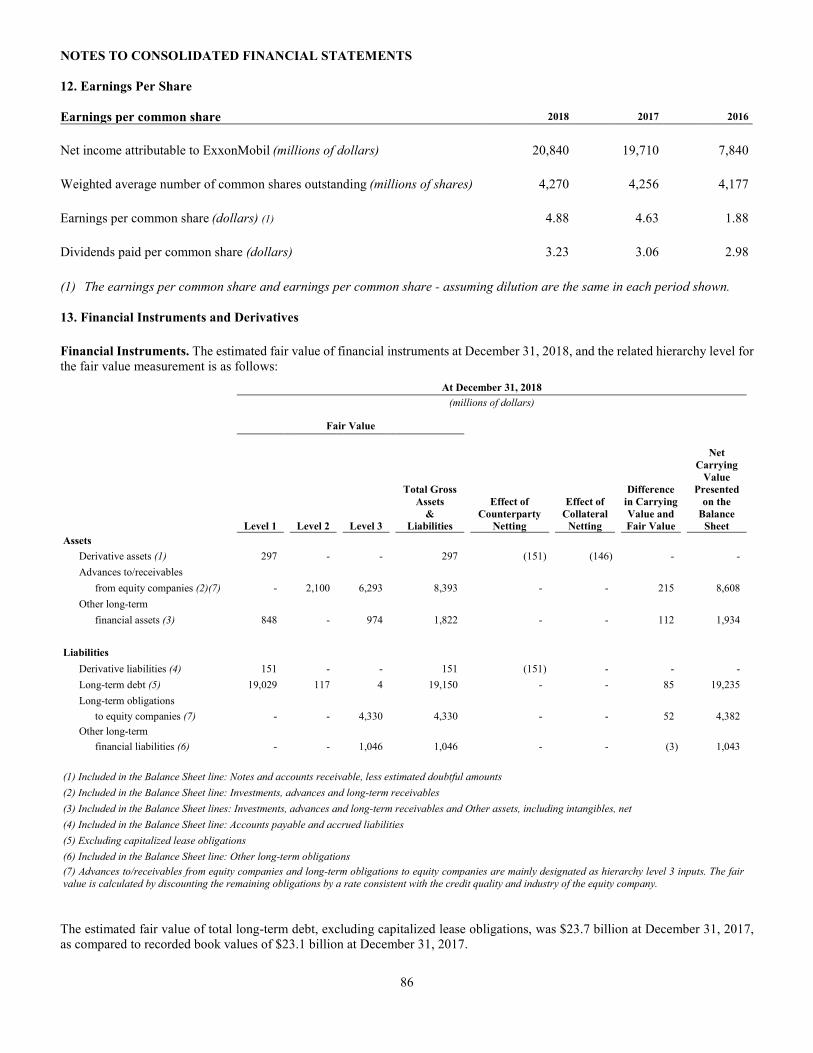
NOTES TO CONSOLIDATED FINANCIAL STATEMENTS
86
12. Earnings Per Share
Earnings per common share 2018 2017 2016
Net income attributable to ExxonMobil (millions of dollars) 20,840 19,710 7,840
Weighted average number of common shares outstanding (millions of shares) 4,270 4,256 4,177
Earnings per common share (dollars) (1) 4.88 4.63 1.88
Dividends paid per common share (dollars) 3.23 3.06 2.98
(1) The earnings per common share and earnings per common share - assuming dilution are the same in each period shown.
13. Financial Instruments and Derivatives
Financial Instruments. The estimated fair value of financial instruments at December 31, 2018, and the related hierarchy level for the fair value measurement is as follows:
At December 31, 2018
(millions of dollars)
Fair Value
Level 1 Level 2 Level 3
Total Gross
Assets
&
Liabilities
Effect of
Counterparty
Netting
Effect of
Collateral
Netting
Difference
in Carrying
Value and
Fair Value
Net
Carrying
Value
Presented
on the
Balance
Sheet
Assets
Derivative assets (1) 297 - - 297 (151) (146) - -
Advances to/receivables
from equity companies (2)(7) - 2,100 6,293 8,393 - - 215 8,608
Other long-term
financial assets (3) 848 - 974 1,822 - - 112 1,934
Liabilities
Derivative liabilities (4) 151 - - 151 (151) - - -
Long-term debt (5) 19,029 117 4 19,150 - - 85 19,235
Long-term obligations
to equity companies (7) - - 4,330 4,330 - - 52 4,382
Other long-term
financial liabilities (6) - - 1,046 1,046 - - (3) 1,043
(1) Included in the Balance Sheet line: Notes and accounts receivable, less estimated doubtful amounts
(2) Included in the Balance Sheet line: Investments, advances and long-term receivables
(3) Included in the Balance Sheet lines: Investments, advances and long-term receivables and Other assets, including intangibles, net
(4) Included in the Balance Sheet line: Accounts payable and accrued liabilities
(5) Excluding capitalized lease obligations
(6) Included in the Balance Sheet line: Other long-term obligations
(7) Advances to/receivables from equity companies and long-term obligations to equity companies are mainly designated as hierarchy level 3 inputs. The fair
value is calculated by discounting the remaining obligations by a rate consistent with the credit quality and industry of the equity company.
The estimated fair value of total long-term debt, excluding capitalized lease obligations, was $23.7 billion at December 31, 2017, as compared to recorded book values of $23.1 billion at December 31, 2017.
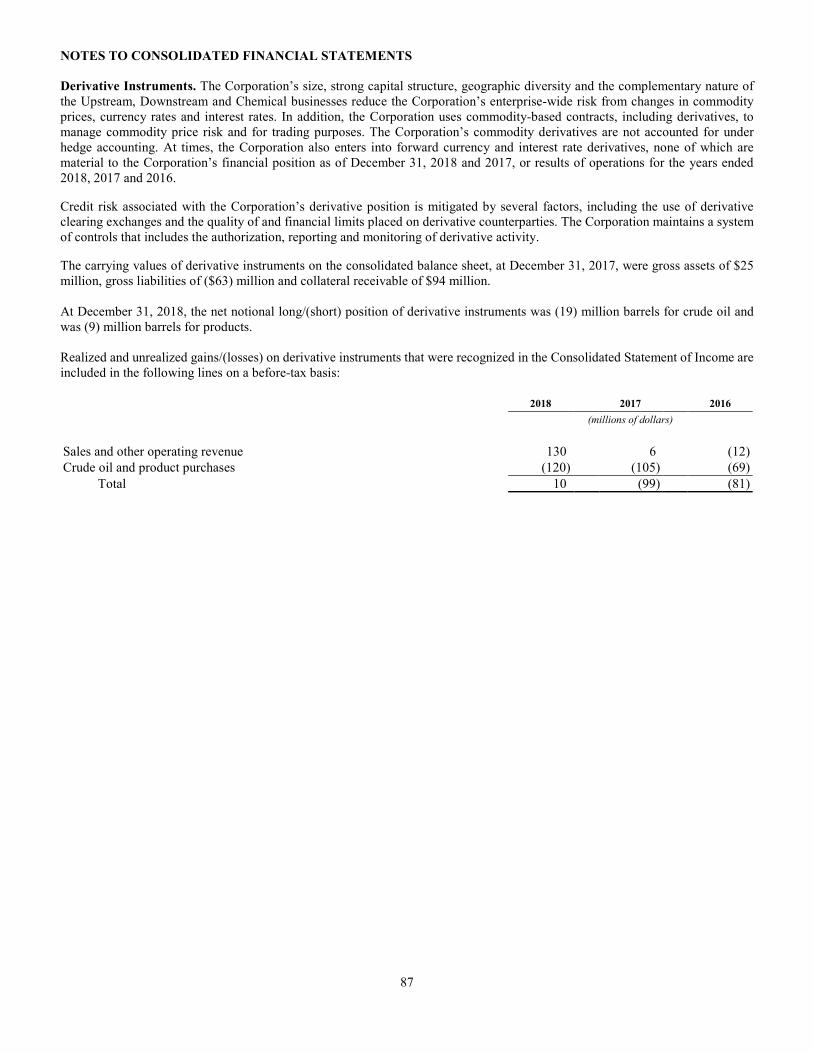
NOTES TO CONSOLIDATED FINANCIAL STATEMENTS
87
Derivative Instruments. The Corporation’s size, strong capital structure, geographic diversity and the complementary nature of the Upstream, Downstream and Chemical businesses reduce the Corporation’s enterprise-wide risk from changes in commodity prices, currency rates and interest rates. In addition, the Corporation uses commodity-based contracts, including derivatives, to manage commodity price risk and for trading purposes. The Corporation’s commodity derivatives are not accounted for under hedge accounting. At times, the Corporation also enters into forward currency and interest rate derivatives, none of which are material to the Corporation’s financial position as of December 31, 2018 and 2017, or results of operations for the years ended 2018, 2017 and 2016.
Credit risk associated with the Corporation’s derivative position is mitigated by several factors, including the use of derivative clearing exchanges and the quality of and financial limits placed on derivative counterparties. The Corporation maintains a system of controls that includes the authorization, reporting and monitoring of derivative activity.
The carrying values of derivative instruments on the consolidated balance sheet, at December 31, 2017, were gross assets of $25 million, gross liabilities of ($63) million and collateral receivable of $94 million. At December 31, 2018, the net notional long/(short) position of derivative instruments was (19) million barrels for crude oil and was (9) million barrels for products. Realized and unrealized gains/(losses) on derivative instruments that were recognized in the Consolidated Statement of Income are included in the following lines on a before-tax basis:
2018 2017 2016
(millions of dollars)
Sales and other operating revenue 130 6 (12)
Crude oil and product purchases (120) (105) (69)
Total 10 (99) (81)
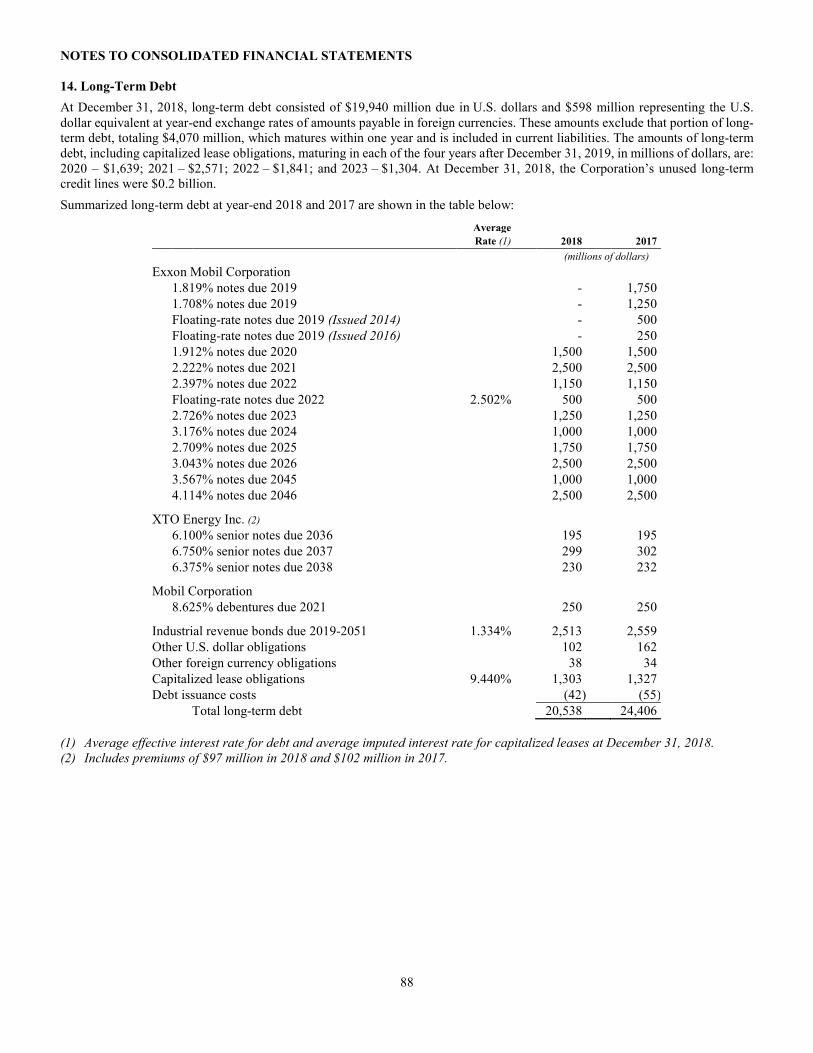
NOTES TO CONSOLIDATED FINANCIAL STATEMENTS
88
14. Long-Term Debt
At December 31, 2018, long-term debt consisted of $19,940 million due in U.S. dollars and $598 million representing the U.S.
dollar equivalent at year-end exchange rates of amounts payable in foreign currencies. These amounts exclude that portion of long-term debt, totaling $4,070 million, which matures within one year and is included in current liabilities. The amounts of long-term debt, including capitalized lease obligations, maturing in each of the four years after December 31, 2019, in millions of dollars, are: 2020 – $1,639; 2021 – $2,571; 2022 – $1,841; and 2023 – $1,304. At December 31, 2018, the Corporation’s unused long-term credit lines were $0.2 billion.
Summarized long-term debt at year-end 2018 and 2017 are shown in the table below:
Average Rate (1) 2018 2017
(millions of dollars) Exxon Mobil Corporation
1.819% notes due 2019 - 1,750
1.708% notes due 2019 - 1,250
Floating-rate notes due 2019 (Issued 2014) - 500
Floating-rate notes due 2019 (Issued 2016) - 250
1.912% notes due 2020 1,500 1,500
2.222% notes due 2021 2,500 2,500
2.397% notes due 2022 1,150 1,150
Floating-rate notes due 2022 2.502% 500 500
2.726% notes due 2023 1,250 1,250
3.176% notes due 2024 1,000 1,000
2.709% notes due 2025 1,750 1,750
3.043% notes due 2026 2,500 2,500
3.567% notes due 2045 1,000 1,000
4.114% notes due 2046 2,500 2,500
XTO Energy Inc. (2)
6.100% senior notes due 2036 195 195
6.750% senior notes due 2037 299 302
6.375% senior notes due 2038 230 232 Mobil Corporation
8.625% debentures due 2021 250 250 Industrial revenue bonds due 2019-2051 1.334% 2,513 2,559
Other U.S. dollar obligations 102 162
Other foreign currency obligations 38 34
Capitalized lease obligations 9.440% 1,303 1,327
Debt issuance costs (42) (55)
Total long-term debt 20,538 24,406
(1) Average effective interest rate for debt and average imputed interest rate for capitalized leases at December 31, 2018.
(2) Includes premiums of $97 million in 2018 and $102 million in 2017.
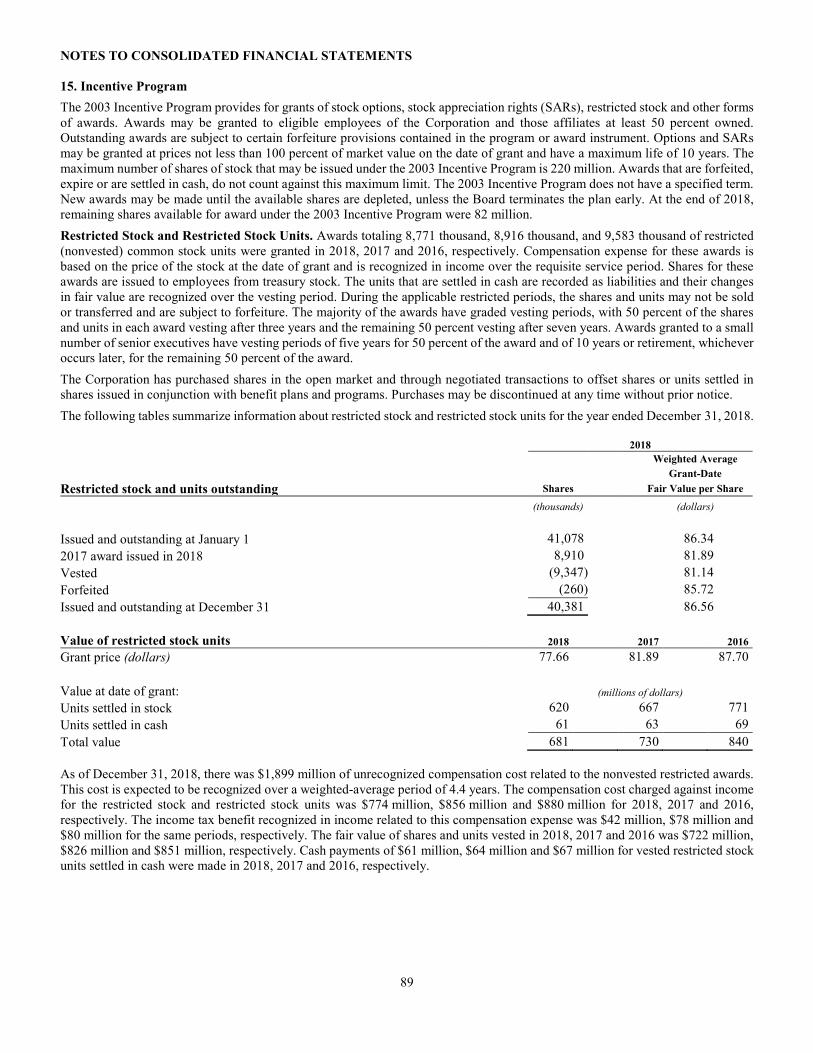
NOTES TO CONSOLIDATED FINANCIAL STATEMENTS
89
15. Incentive Program
The 2003 Incentive Program provides for grants of stock options, stock appreciation rights (SARs), restricted stock and other forms
of awards. Awards may be granted to eligible employees of the Corporation and those affiliates at least 50 percent owned. Outstanding awards are subject to certain forfeiture provisions contained in the program or award instrument. Options and SARs may be granted at prices not less than 100 percent of market value on the date of grant and have a maximum life of 10 years. The maximum number of shares of stock that may be issued under the 2003 Incentive Program is 220 million. Awards that are forfeited, expire or are settled in cash, do not count against this maximum limit. The 2003 Incentive Program does not have a specified term. New awards may be made until the available shares are depleted, unless the Board terminates the plan early. At the end of 2018, remaining shares available for award under the 2003 Incentive Program were 82 million.
Restricted Stock and Restricted Stock Units. Awards totaling 8,771 thousand, 8,916 thousand, and 9,583 thousand of restricted (nonvested) common stock units were granted in 2018, 2017 and 2016, respectively. Compensation expense for these awards is based on the price of the stock at the date of grant and is recognized in income over the requisite service period. Shares for these awards are issued to employees from treasury stock. The units that are settled in cash are recorded as liabilities and their changes in fair value are recognized over the vesting period. During the applicable restricted periods, the shares and units may not be sold or transferred and are subject to forfeiture. The majority of the awards have graded vesting periods, with 50 percent of the shares and units in each award vesting after three years and the remaining 50 percent vesting after seven years. Awards granted to a small number of senior executives have vesting periods of five years for 50 percent of the award and of 10 years or retirement, whichever occurs later, for the remaining 50 percent of the award.
The Corporation has purchased shares in the open market and through negotiated transactions to offset shares or units settled in shares issued in conjunction with benefit plans and programs. Purchases may be discontinued at any time without prior notice.
The following tables summarize information about restricted stock and restricted stock units for the year ended December 31, 2018.
2018
Weighted Average
Grant-Date
Restricted stock and units outstanding Shares Fair Value per Share
(thousands) (dollars)
Issued and outstanding at January 1 41,078 86.34
2017 award issued in 2018 8,910 81.89
Vested (9,347) 81.14
Forfeited (260) 85.72
Issued and outstanding at December 31 40,381 86.56
Value of restricted stock units 2018 2017 2016
Grant price (dollars) 77.66 81.89 87.70
Value at date of grant: (millions of dollars)
Units settled in stock 620 667 771
Units settled in cash 61 63 69
Total value 681 730 840
As of December 31, 2018, there was $1,899 million of unrecognized compensation cost related to the nonvested restricted awards. This cost is expected to be recognized over a weighted-average period of 4.4 years. The compensation cost charged against income for the restricted stock and restricted stock units was $774 million, $856 million and $880 million for 2018, 2017 and 2016, respectively. The income tax benefit recognized in income related to this compensation expense was $42 million, $78 million and $80 million for the same periods, respectively. The fair value of shares and units vested in 2018, 2017 and 2016 was $722 million, $826 million and $851 million, respectively. Cash payments of $61 million, $64 million and $67 million for vested restricted stock units settled in cash were made in 2018, 2017 and 2016, respectively.
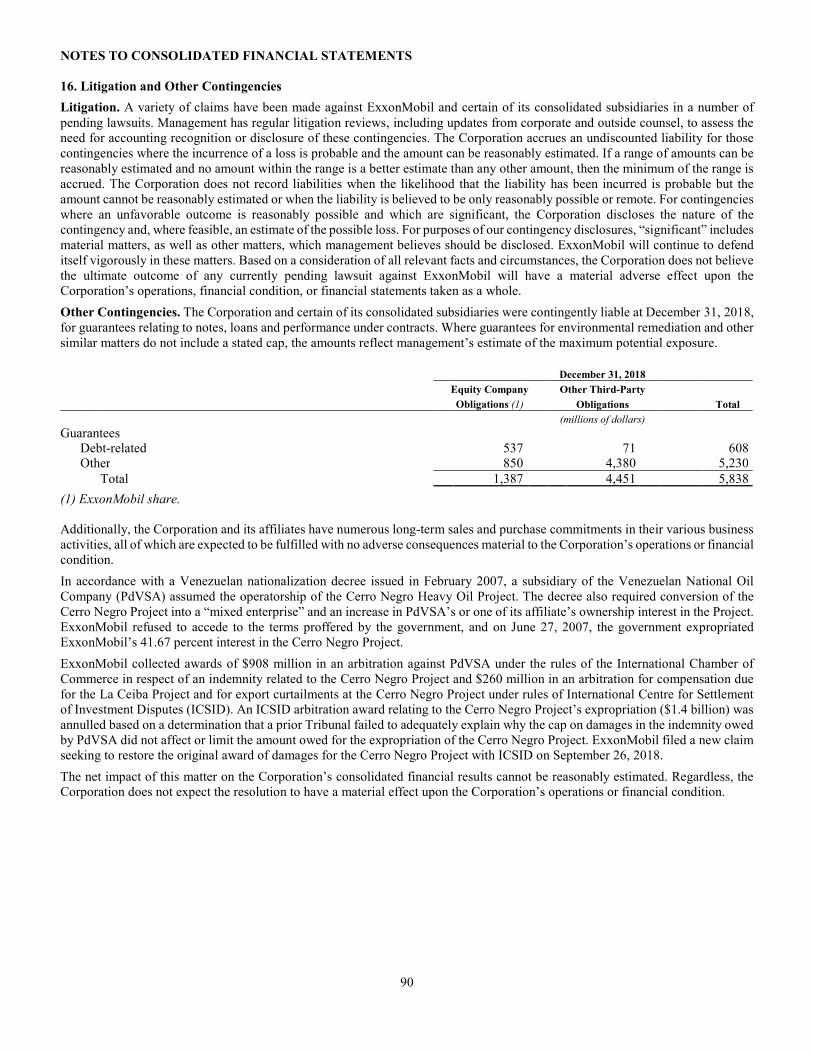
NOTES TO CONSOLIDATED FINANCIAL STATEMENTS
90
16. Litigation and Other Contingencies
Litigation. A variety of claims have been made against ExxonMobil and certain of its consolidated subsidiaries in a number of
pending lawsuits. Management has regular litigation reviews, including updates from corporate and outside counsel, to assess the need for accounting recognition or disclosure of these contingencies. The Corporation accrues an undiscounted liability for those contingencies where the incurrence of a loss is probable and the amount can be reasonably estimated. If a range of amounts can be reasonably estimated and no amount within the range is a better estimate than any other amount, then the minimum of the range is accrued. The Corporation does not record liabilities when the likelihood that the liability has been incurred is probable but the amount cannot be reasonably estimated or when the liability is believed to be only reasonably possible or remote. For contingencies where an unfavorable outcome is reasonably possible and which are significant, the Corporation discloses the nature of the contingency and, where feasible, an estimate of the possible loss. For purposes of our contingency disclosures, “significant” includes material matters, as well as other matters, which management believes should be disclosed. ExxonMobil will continue to defend itself vigorously in these matters. Based on a consideration of all relevant facts and circumstances, the Corporation does not believe the ultimate outcome of any currently pending lawsuit against ExxonMobil will have a material adverse effect upon the Corporation’s operations, financial condition, or financial statements taken as a whole.
Other Contingencies. The Corporation and certain of its consolidated subsidiaries were contingently liable at December 31, 2018, for guarantees relating to notes, loans and performance under contracts. Where guarantees for environmental remediation and other similar matters do not include a stated cap, the amounts reflect management’s estimate of the maximum potential exposure. December 31, 2018
Equity Company Other Third-Party
Obligations (1) Obligations Total
(millions of dollars)
Guarantees Debt-related 537 71 608 Other 850 4,380 5,230
Total 1,387 4,451 5,838
(1) ExxonMobil share. Additionally, the Corporation and its affiliates have numerous long-term sales and purchase commitments in their various business activities, all of which are expected to be fulfilled with no adverse consequences material to the Corporation’s operations or financial condition.
In accordance with a Venezuelan nationalization decree issued in February 2007, a subsidiary of the Venezuelan National Oil Company (PdVSA) assumed the operatorship of the Cerro Negro Heavy Oil Project. The decree also required conversion of the Cerro Negro Project into a “mixed enterprise” and an increase in PdVSA’s or one of its affiliate’s ownership interest in the Project. ExxonMobil refused to accede to the terms proffered by the government, and on June 27, 2007, the government expropriated ExxonMobil’s 41.67 percent interest in the Cerro Negro Project.
ExxonMobil collected awards of $908 million in an arbitration against PdVSA under the rules of the International Chamber of Commerce in respect of an indemnity related to the Cerro Negro Project and $260 million in an arbitration for compensation due for the La Ceiba Project and for export curtailments at the Cerro Negro Project under rules of International Centre for Settlement of Investment Disputes (ICSID). An ICSID arbitration award relating to the Cerro Negro Project’s expropriation ($1.4 billion) was annulled based on a determination that a prior Tribunal failed to adequately explain why the cap on damages in the indemnity owed by PdVSA did not affect or limit the amount owed for the expropriation of the Cerro Negro Project. ExxonMobil filed a new claim seeking to restore the original award of damages for the Cerro Negro Project with ICSID on September 26, 2018.
The net impact of this matter on the Corporation’s consolidated financial results cannot be reasonably estimated. Regardless, the Corporation does not expect the resolution to have a material effect upon the Corporation’s operations or financial condition.
NOTES TO CONSOLIDATED FINANCIAL STATEMENTS
91
An affiliate of ExxonMobil is one of the Contractors under a Production Sharing Contract (PSC) with the Nigerian National Petroleum Corporation (NNPC) covering the Erha block located in the offshore waters of Nigeria. ExxonMobil's affiliate is the operator of the block and owns a 56.25 percent interest under the PSC. The Contractors are in dispute with NNPC regarding NNPC's lifting of crude oil in excess of its entitlement under the terms of the PSC. In accordance with the terms of the PSC, the Contractors initiated arbitration in Abuja, Nigeria, under the Nigerian Arbitration and Conciliation Act. On October 24, 2011, a three-member arbitral Tribunal issued an award upholding the Contractors' position in all material respects and awarding damages to the Contractors jointly in an amount of approximately $1.8 billion plus $234 million in accrued interest. The Contractors petitioned a Nigerian federal court for enforcement of the award, and NNPC petitioned the same court to have the award set aside. On May 22, 2012, the court set aside the award. The Contractors appealed that judgment to the Court of Appeal, Abuja Judicial Division. On July 22, 2016, the Court of Appeal upheld the decision of the lower court setting aside the award. On October 21, 2016, the Contractors appealed the decision to the Supreme Court of Nigeria. In June 2013, the Contractors filed a lawsuit against NNPC in the Nigerian federal high court in order to preserve their ability to seek enforcement of the PSC in the courts if necessary. Following dismissal by this court, the Contractors appealed to the Nigerian Court of Appeal in June 2016. In October 2014, the Contractors filed suit in the United States District Court for the Southern District of New York to enforce, if necessary, the arbitration award against NNPC assets residing within that jurisdiction. NNPC has moved to dismiss the lawsuit. At this time, the net impact of this matter on the Corporation's consolidated financial results cannot be reasonably estimated. However, regardless of the outcome of enforcement proceedings, the Corporation does not expect the proceedings to have a material effect upon the Corporation's operations or financial condition.
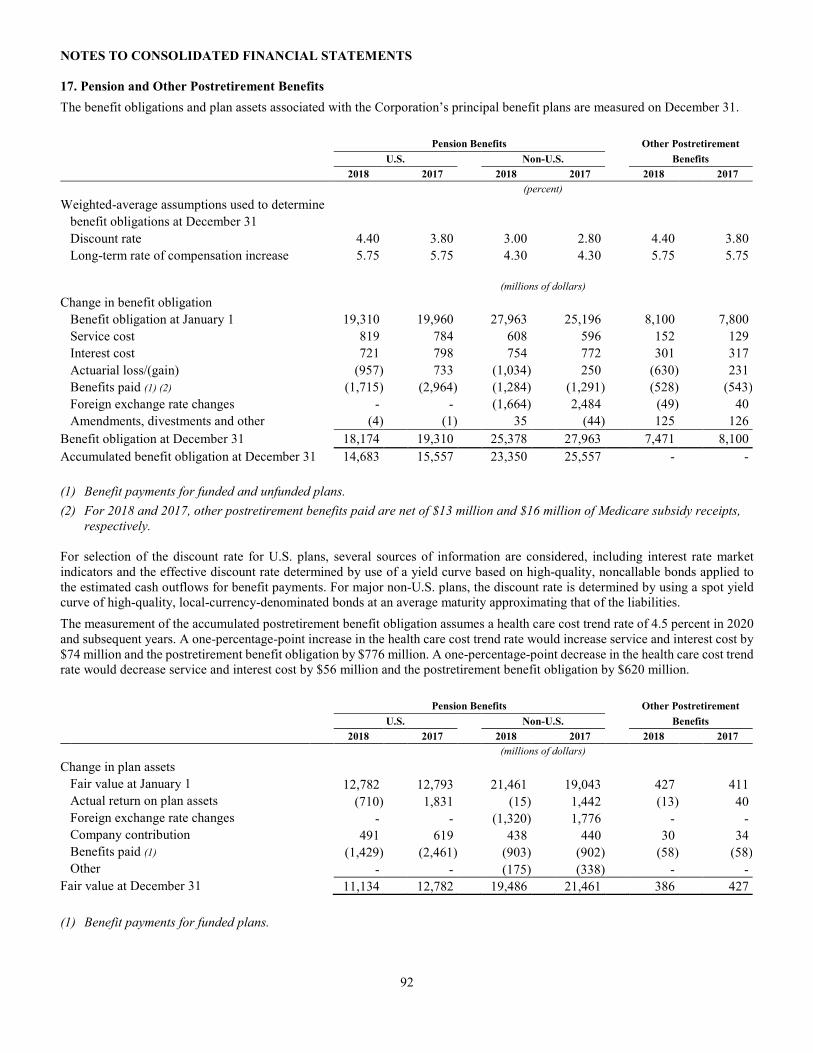
NOTES TO CONSOLIDATED FINANCIAL STATEMENTS
92
17. Pension and Other Postretirement Benefits
The benefit obligations and plan assets associated with the Corporation’s principal benefit plans are measured on December 31.
Pension Benefits Other Postretirement
U.S. Non-U.S. Benefits
2018 2017 2018 2017 2018 2017
(percent)
Weighted-average assumptions used to determine
benefit obligations at December 31
Discount rate 4.40 3.80 3.00 2.80 4.40 3.80
Long-term rate of compensation increase 5.75 5.75 4.30 4.30 5.75 5.75
(millions of dollars)
Change in benefit obligation
Benefit obligation at January 1 19,310 19,960 27,963 25,196 8,100 7,800
Service cost 819 784 608 596 152 129
Interest cost 721 798 754 772 301 317
Actuarial loss/(gain) (957) 733 (1,034) 250 (630) 231
Benefits paid (1) (2) (1,715) (2,964) (1,284) (1,291) (528) (543)
Foreign exchange rate changes - - (1,664) 2,484 (49) 40
Amendments, divestments and other (4) (1) 35 (44) 125 126
Benefit obligation at December 31 18,174 19,310 25,378 27,963 7,471 8,100
Accumulated benefit obligation at December 31 14,683 15,557 23,350 25,557 - -
(1) Benefit payments for funded and unfunded plans.
(2) For 2018 and 2017, other postretirement benefits paid are net of $13 million and $16 million of Medicare subsidy receipts,
respectively. For selection of the discount rate for U.S. plans, several sources of information are considered, including interest rate market indicators and the effective discount rate determined by use of a yield curve based on high-quality, noncallable bonds applied to the estimated cash outflows for benefit payments. For major non-U.S. plans, the discount rate is determined by using a spot yield curve of high-quality, local-currency-denominated bonds at an average maturity approximating that of the liabilities.
The measurement of the accumulated postretirement benefit obligation assumes a health care cost trend rate of 4.5 percent in 2020 and subsequent years. A one-percentage-point increase in the health care cost trend rate would increase service and interest cost by $74 million and the postretirement benefit obligation by $776 million. A one-percentage-point decrease in the health care cost trend rate would decrease service and interest cost by $56 million and the postretirement benefit obligation by $620 million.
Pension Benefits Other Postretirement
U.S. Non-U.S. Benefits
2018 2017 2018 2017 2018 2017
(millions of dollars)
Change in plan assets
Fair value at January 1 12,782 12,793 21,461 19,043 427 411
Actual return on plan assets (710) 1,831 (15) 1,442 (13) 40
Foreign exchange rate changes - - (1,320) 1,776 - -
Company contribution 491 619 438 440 30 34
Benefits paid (1) (1,429) (2,461) (903) (902) (58) (58)
Other - - (175) (338) - -
Fair value at December 31 11,134 12,782 19,486 21,461 386 427
(1) Benefit payments for funded plans.
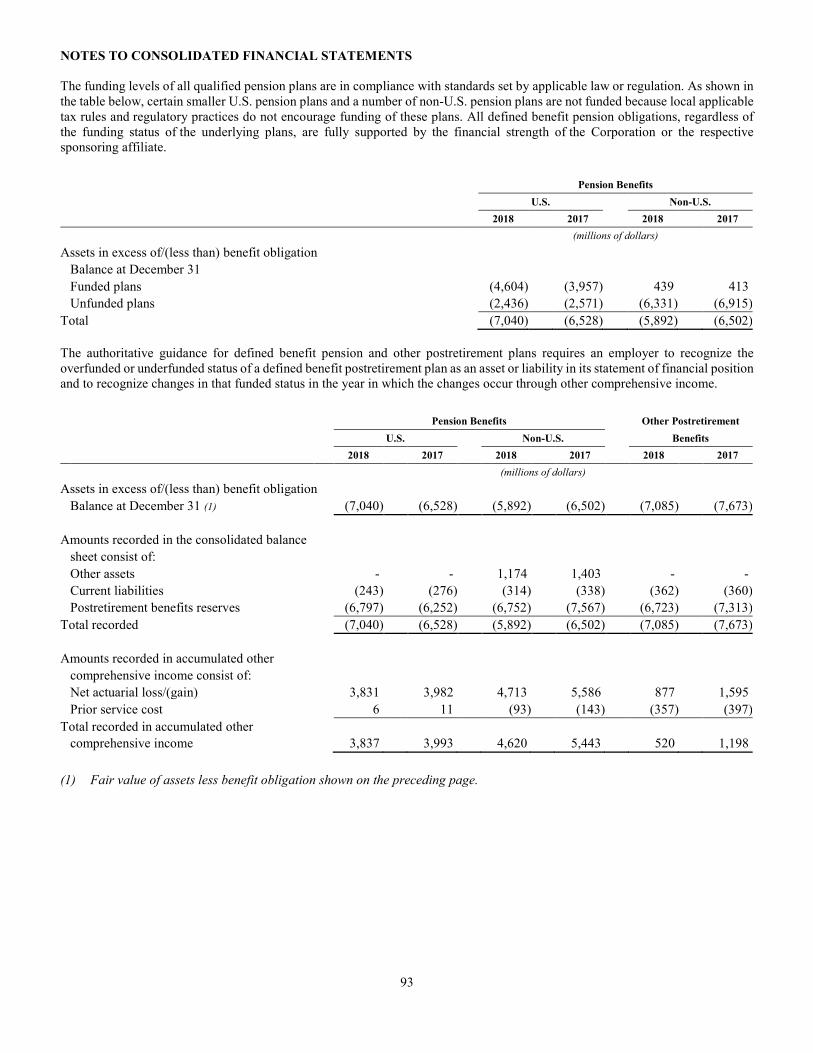
NOTES TO CONSOLIDATED FINANCIAL STATEMENTS
93
The funding levels of all qualified pension plans are in compliance with standards set by applicable law or regulation. As shown in the table below, certain smaller U.S. pension plans and a number of non-U.S. pension plans are not funded because local applicable tax rules and regulatory practices do not encourage funding of these plans. All defined benefit pension obligations, regardless of the funding status of the underlying plans, are fully supported by the financial strength of the Corporation or the respective sponsoring affiliate.
Pension Benefits
U.S. Non-U.S.
2018 2017 2018 2017
(millions of dollars)
Assets in excess of/(less than) benefit obligation
Balance at December 31
Funded plans (4,604) (3,957) 439 413
Unfunded plans (2,436) (2,571) (6,331) (6,915)
Total (7,040) (6,528) (5,892) (6,502)
The authoritative guidance for defined benefit pension and other postretirement plans requires an employer to recognize the overfunded or underfunded status of a defined benefit postretirement plan as an asset or liability in its statement of financial position and to recognize changes in that funded status in the year in which the changes occur through other comprehensive income.
Pension Benefits Other Postretirement
U.S. Non-U.S. Benefits
2018 2017 2018 2017 2018 2017
(millions of dollars)
Assets in excess of/(less than) benefit obligation
Balance at December 31 (1) (7,040) (6,528) (5,892) (6,502) (7,085) (7,673)
Amounts recorded in the consolidated balance
sheet consist of:
Other assets - - 1,174 1,403 - -
Current liabilities (243) (276) (314) (338) (362) (360)
Postretirement benefits reserves (6,797) (6,252) (6,752) (7,567) (6,723) (7,313)
Total recorded (7,040) (6,528) (5,892) (6,502) (7,085) (7,673)
Amounts recorded in accumulated other
comprehensive income consist of:
Net actuarial loss/(gain) 3,831 3,982 4,713 5,586 877 1,595
Prior service cost 6 11 (93) (143) (357) (397)
Total recorded in accumulated other
comprehensive income 3,837 3,993 4,620 5,443 520 1,198
(1) Fair value of assets less benefit obligation shown on the preceding page.
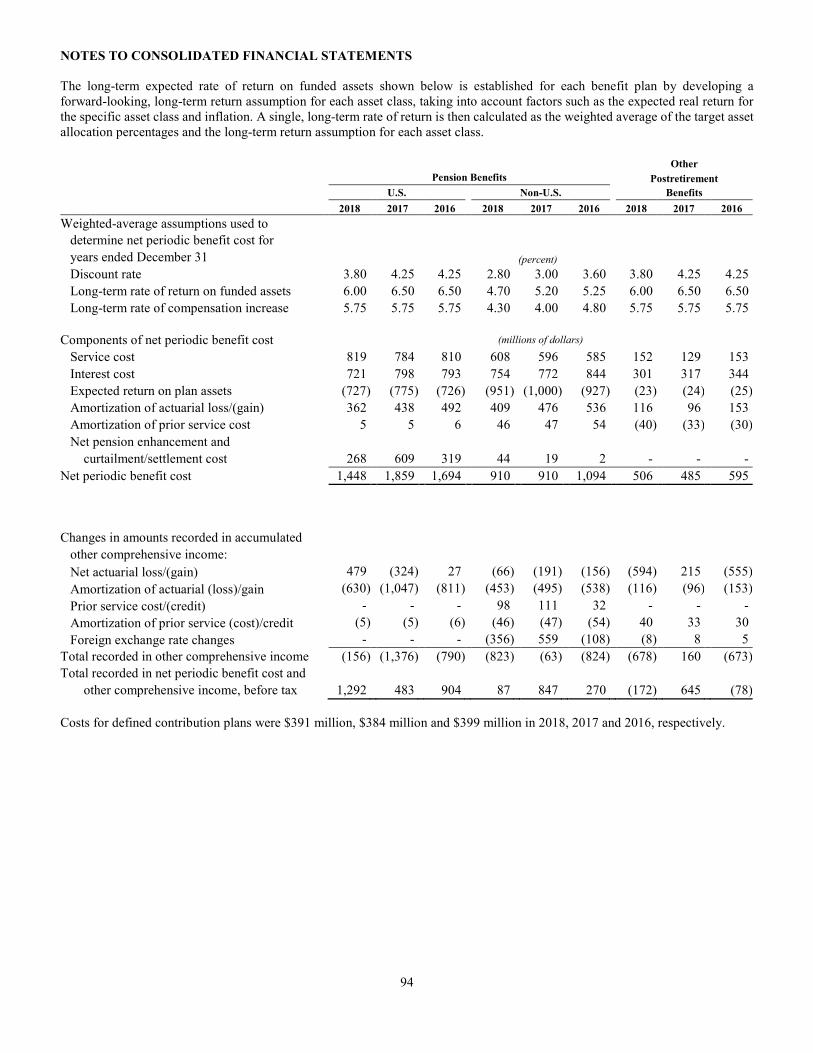
NOTES TO CONSOLIDATED FINANCIAL STATEMENTS
94
The long-term expected rate of return on funded assets shown below is established for each benefit plan by developing a forward-looking, long-term return assumption for each asset class, taking into account factors such as the expected real return for the specific asset class and inflation. A single, long-term rate of return is then calculated as the weighted average of the target asset allocation percentages and the long-term return assumption for each asset class. Other
Pension Benefits Postretirement
U.S. Non-U.S. Benefits
2018 2017 2016 2018 2017 2016 2018 2017 2016
Weighted-average assumptions used to
determine net periodic benefit cost for
years ended December 31 (percent)
Discount rate 3.80 4.25 4.25 2.80 3.00 3.60 3.80 4.25 4.25
Long-term rate of return on funded assets 6.00 6.50 6.50 4.70 5.20 5.25 6.00 6.50 6.50
Long-term rate of compensation increase 5.75 5.75 5.75 4.30 4.00 4.80 5.75 5.75 5.75
Components of net periodic benefit cost (millions of dollars)
Service cost 819 784 810 608 596 585 152 129 153
Interest cost 721 798 793 754 772 844 301 317 344
Expected return on plan assets (727) (775) (726) (951) (1,000) (927) (23) (24) (25)
Amortization of actuarial loss/(gain) 362 438 492 409 476 536 116 96 153
Amortization of prior service cost 5 5 6 46 47 54 (40) (33) (30)
Net pension enhancement and
curtailment/settlement cost 268 609 319 44 19 2 - - -
Net periodic benefit cost 1,448 1,859 1,694 910 910 1,094 506 485 595
Changes in amounts recorded in accumulated
other comprehensive income:
Net actuarial loss/(gain) 479 (324) 27 (66) (191) (156) (594) 215 (555)
Amortization of actuarial (loss)/gain (630) (1,047) (811) (453) (495) (538) (116) (96) (153)
Prior service cost/(credit) - - - 98 111 32 - - -
Amortization of prior service (cost)/credit (5) (5) (6) (46) (47) (54) 40 33 30
Foreign exchange rate changes - - - (356) 559 (108) (8) 8 5
Total recorded in other comprehensive income (156) (1,376) (790) (823) (63) (824) (678) 160 (673)
Total recorded in net periodic benefit cost and
other comprehensive income, before tax 1,292 483 904 87 847 270 (172) 645 (78)
Costs for defined contribution plans were $391 million, $384 million and $399 million in 2018, 2017 and 2016, respectively.
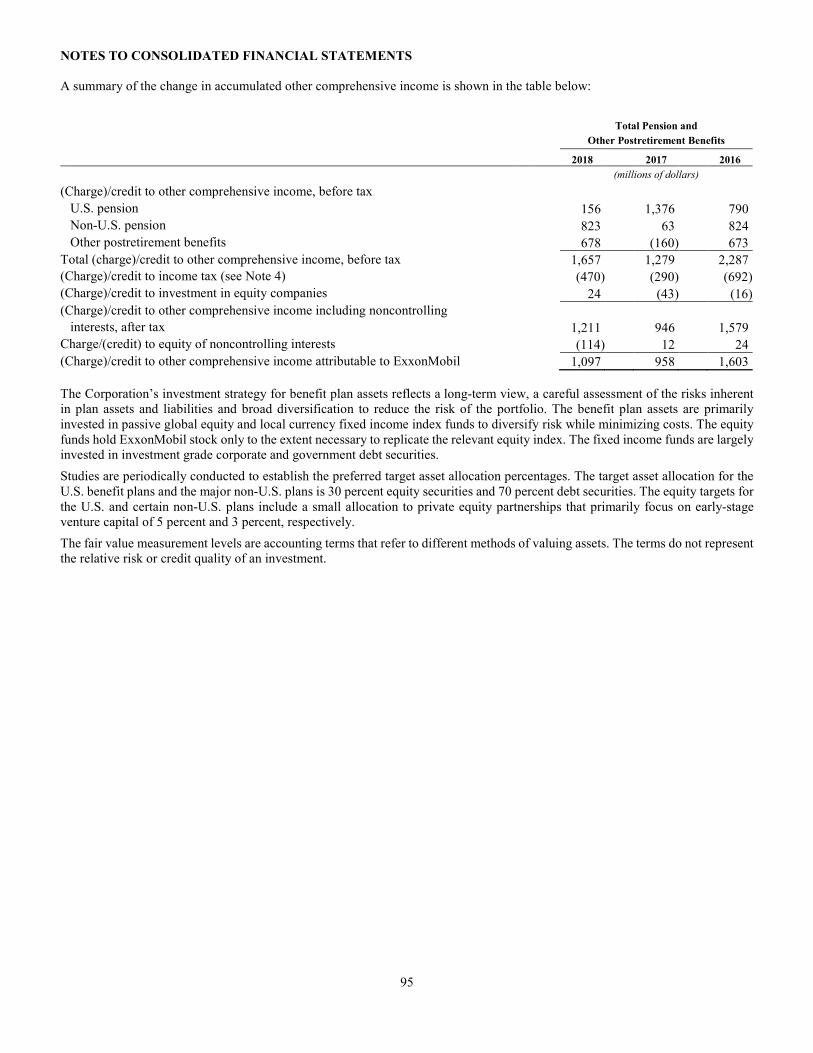
NOTES TO CONSOLIDATED FINANCIAL STATEMENTS
95
A summary of the change in accumulated other comprehensive income is shown in the table below:
Total Pension and
Other Postretirement Benefits
2018 2017 2016
(millions of dollars)
(Charge)/credit to other comprehensive income, before tax
U.S. pension 156 1,376 790
Non-U.S. pension 823 63 824
Other postretirement benefits 678 (160) 673
Total (charge)/credit to other comprehensive income, before tax 1,657 1,279 2,287
(Charge)/credit to income tax (see Note 4) (470) (290) (692)
(Charge)/credit to investment in equity companies 24 (43) (16)
(Charge)/credit to other comprehensive income including noncontrolling
interests, after tax 1,211 946 1,579
Charge/(credit) to equity of noncontrolling interests (114) 12 24
(Charge)/credit to other comprehensive income attributable to ExxonMobil 1,097 958 1,603
The Corporation’s investment strategy for benefit plan assets reflects a long-term view, a careful assessment of the risks inherent in plan assets and liabilities and broad diversification to reduce the risk of the portfolio. The benefit plan assets are primarily invested in passive global equity and local currency fixed income index funds to diversify risk while minimizing costs. The equity funds hold ExxonMobil stock only to the extent necessary to replicate the relevant equity index. The fixed income funds are largely invested in investment grade corporate and government debt securities.
Studies are periodically conducted to establish the preferred target asset allocation percentages. The target asset allocation for the U.S. benefit plans and the major non-U.S. plans is 30 percent equity securities and 70 percent debt securities. The equity targets for the U.S. and certain non-U.S. plans include a small allocation to private equity partnerships that primarily focus on early-stage venture capital of 5 percent and 3 percent, respectively.
The fair value measurement levels are accounting terms that refer to different methods of valuing assets. The terms do not represent the relative risk or credit quality of an investment.
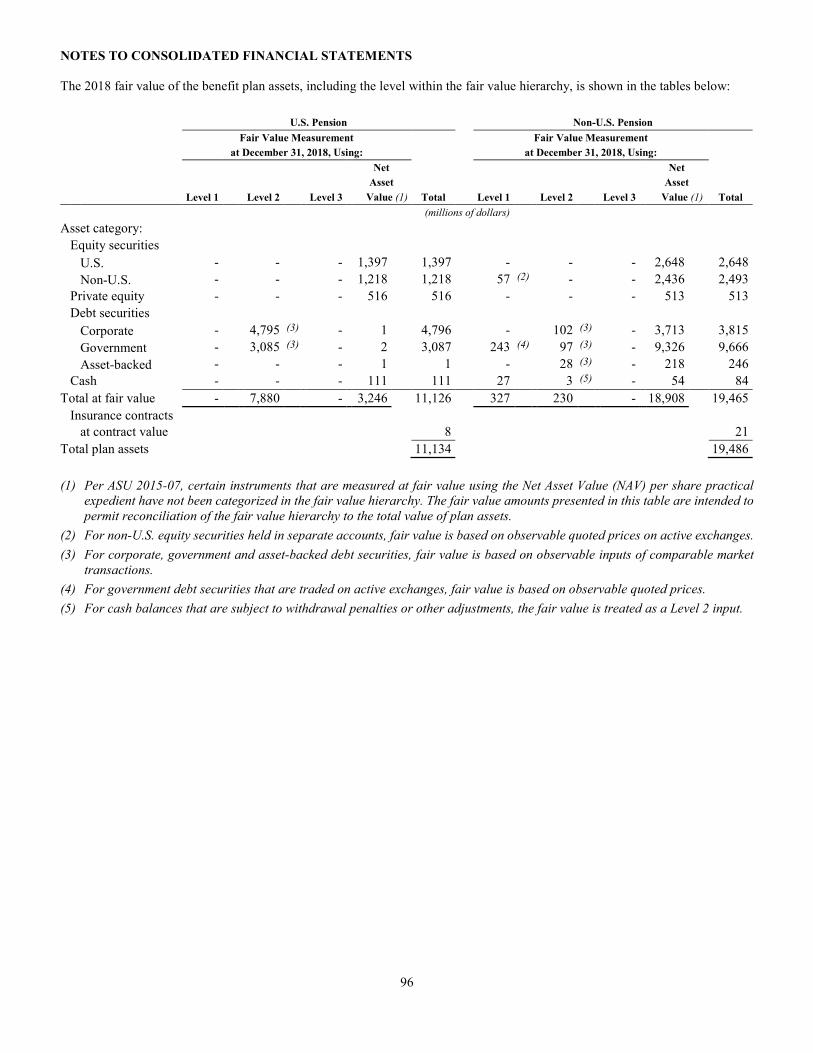
NOTES TO CONSOLIDATED FINANCIAL STATEMENTS
96
The 2018 fair value of the benefit plan assets, including the level within the fair value hierarchy, is shown in the tables below:
U.S. Pension Non-U.S. Pension
Fair Value Measurement Fair Value Measurement
at December 31, 2018, Using: at December 31, 2018, Using:
Net Net
Asset Asset
Level 1 Level 2 Level 3 Value (1) Total Level 1 Level 2 Level 3 Value (1) Total
(millions of dollars)
Asset category:
Equity securities
U.S. - - -
1,397 1,397 -
- -
2,648 2,648
Non-U.S. - - -
1,218 1,218 57 (2) - -
2,436 2,493
Private equity - -
- 516 516 -
-
- 513 513
Debt securities
Corporate - 4,795 (3) - 1 4,796 - 102 (3) -
3,713 3,815
Government - 3,085 (3) - 2 3,087 243 (4) 97 (3) -
9,326 9,666
Asset-backed - - - 1 1 - 28 (3) -
218 246
Cash - - - 111 111 27 3 (5) - 54 84
Total at fair value - 7,880 - 3,246 11,126 327 230 - 18,908 19,465
Insurance contracts
at contract value 8 21
Total plan assets 11,134 19,486
(1) Per ASU 2015-07, certain instruments that are measured at fair value using the Net Asset Value (NAV) per share practical
expedient have not been categorized in the fair value hierarchy. The fair value amounts presented in this table are intended to
permit reconciliation of the fair value hierarchy to the total value of plan assets.
(2) For non-U.S. equity securities held in separate accounts, fair value is based on observable quoted prices on active exchanges.
(3) For corporate, government and asset-backed debt securities, fair value is based on observable inputs of comparable market
transactions.
(4) For government debt securities that are traded on active exchanges, fair value is based on observable quoted prices.
(5) For cash balances that are subject to withdrawal penalties or other adjustments, the fair value is treated as a Level 2 input.
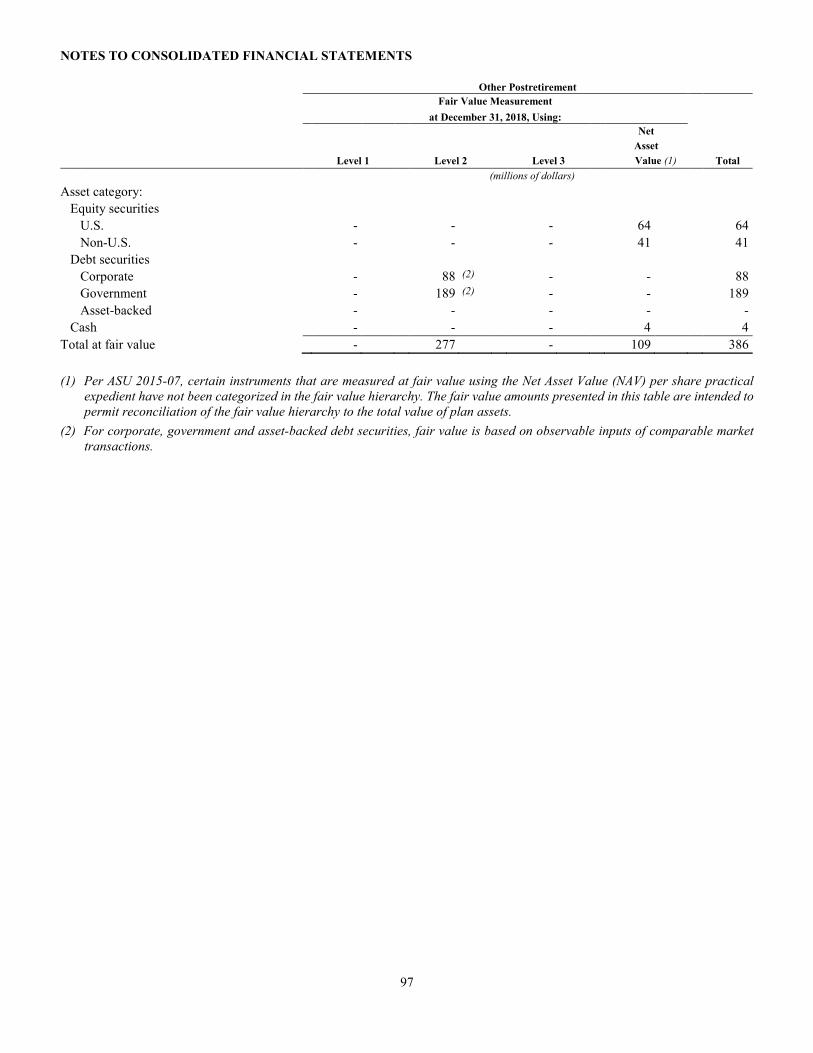
NOTES TO CONSOLIDATED FINANCIAL STATEMENTS
97
Other Postretirement
Fair Value Measurement
at December 31, 2018, Using:
Net
Asset
Level 1 Level 2 Level 3 Value (1) Total
(millions of dollars)
Asset category:
Equity securities
U.S. - - -
64
64
Non-U.S. - - -
41 41
Debt securities
Corporate - 88 (2) - - 88
Government - 189 (2) - - 189
Asset-backed - - - - -
Cash - - - 4 4
Total at fair value - 277 - 109 386
(1) Per ASU 2015-07, certain instruments that are measured at fair value using the Net Asset Value (NAV) per share practical
expedient have not been categorized in the fair value hierarchy. The fair value amounts presented in this table are intended to
permit reconciliation of the fair value hierarchy to the total value of plan assets.
(2) For corporate, government and asset-backed debt securities, fair value is based on observable inputs of comparable market
transactions.
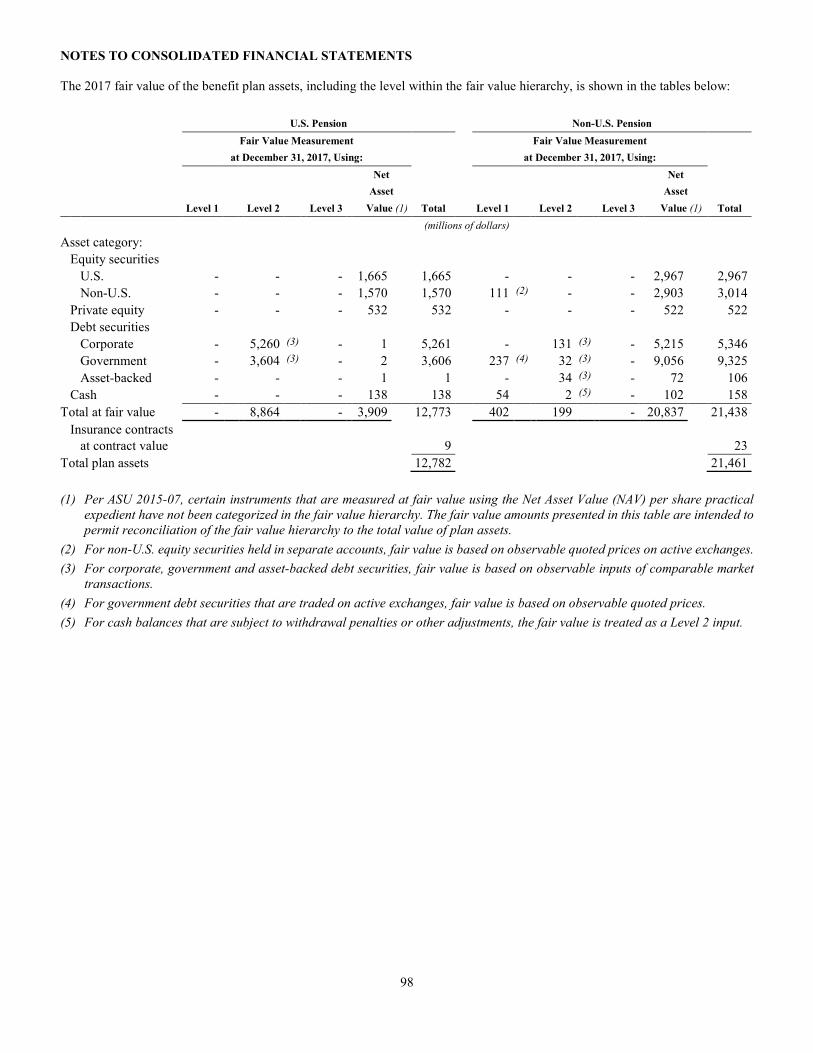
NOTES TO CONSOLIDATED FINANCIAL STATEMENTS
98
The 2017 fair value of the benefit plan assets, including the level within the fair value hierarchy, is shown in the tables below:
U.S. Pension Non-U.S. Pension
Fair Value Measurement Fair Value Measurement
at December 31, 2017, Using: at December 31, 2017, Using:
Net Net
Asset Asset
Level 1 Level 2 Level 3 Value (1) Total Level 1 Level 2 Level 3 Value (1) Total
(millions of dollars)
Asset category:
Equity securities
U.S. - - - 1,665 1,665 -
- - 2,967 2,967
Non-U.S. - - - 1,570 1,570 111 (2) - - 2,903 3,014
Private equity - -
- 532 532 -
- - 522 522
Debt securities
Corporate - 5,260 (3) - 1 5,261 - 131 (3) - 5,215 5,346
Government - 3,604 (3) - 2 3,606 237 (4) 32 (3) - 9,056 9,325
Asset-backed - - - 1 1 -
34 (3) - 72 106
Cash - - - 138 138 54 2 (5) - 102 158
Total at fair value - 8,864 - 3,909 12,773 402 199 - 20,837 21,438
Insurance contracts
at contract value 9 23
Total plan assets 12,782 21,461
(1) Per ASU 2015-07, certain instruments that are measured at fair value using the Net Asset Value (NAV) per share practical
expedient have not been categorized in the fair value hierarchy. The fair value amounts presented in this table are intended to
permit reconciliation of the fair value hierarchy to the total value of plan assets.
(2) For non-U.S. equity securities held in separate accounts, fair value is based on observable quoted prices on active exchanges.
(3) For corporate, government and asset-backed debt securities, fair value is based on observable inputs of comparable market
transactions.
(4) For government debt securities that are traded on active exchanges, fair value is based on observable quoted prices.
(5) For cash balances that are subject to withdrawal penalties or other adjustments, the fair value is treated as a Level 2 input.
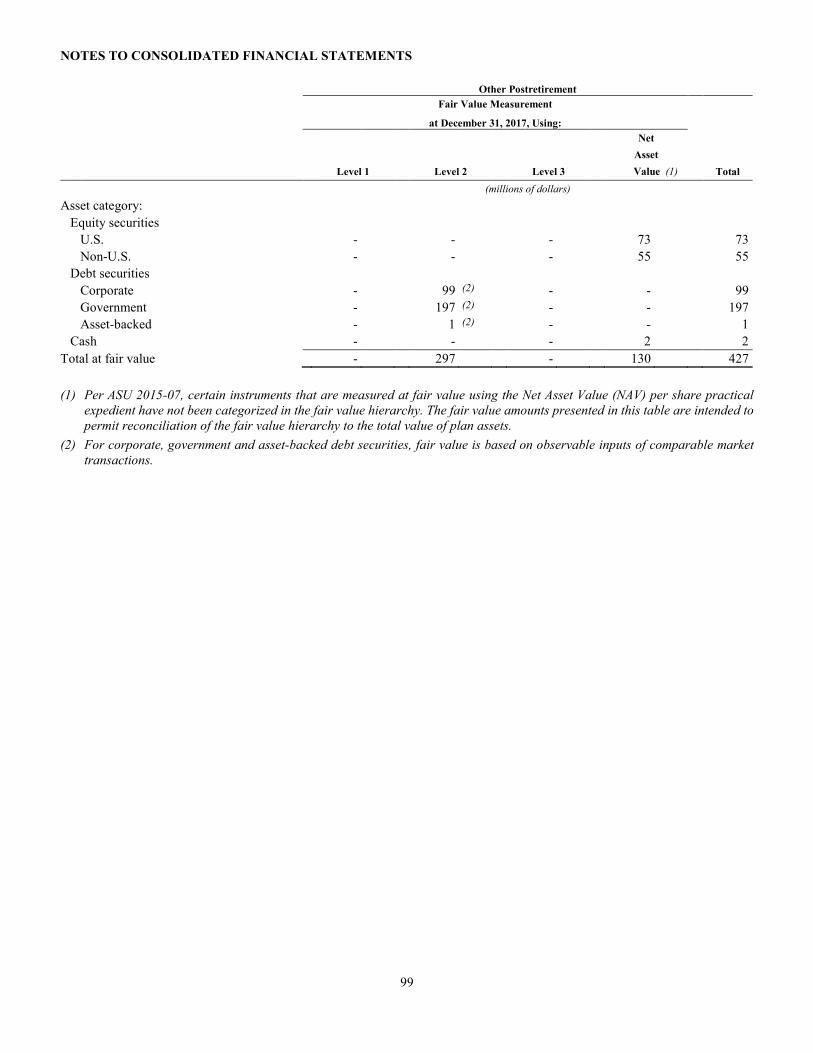
NOTES TO CONSOLIDATED FINANCIAL STATEMENTS
99
Other Postretirement
Fair Value Measurement
at December 31, 2017, Using:
Net
Asset
Level 1 Level 2 Level 3 Value (1) Total
(millions of dollars)
Asset category:
Equity securities
U.S. - - -
73
73
Non-U.S. - - -
55
55
Debt securities
Corporate - 99 (2) -
-
99
Government - 197 (2) -
-
197
Asset-backed - 1 (2) -
-
1
Cash - -
-
2
2
Total at fair value - 297 - 130 427
(1) Per ASU 2015-07, certain instruments that are measured at fair value using the Net Asset Value (NAV) per share practical
expedient have not been categorized in the fair value hierarchy. The fair value amounts presented in this table are intended to
permit reconciliation of the fair value hierarchy to the total value of plan assets.
(2) For corporate, government and asset-backed debt securities, fair value is based on observable inputs of comparable market
transactions.
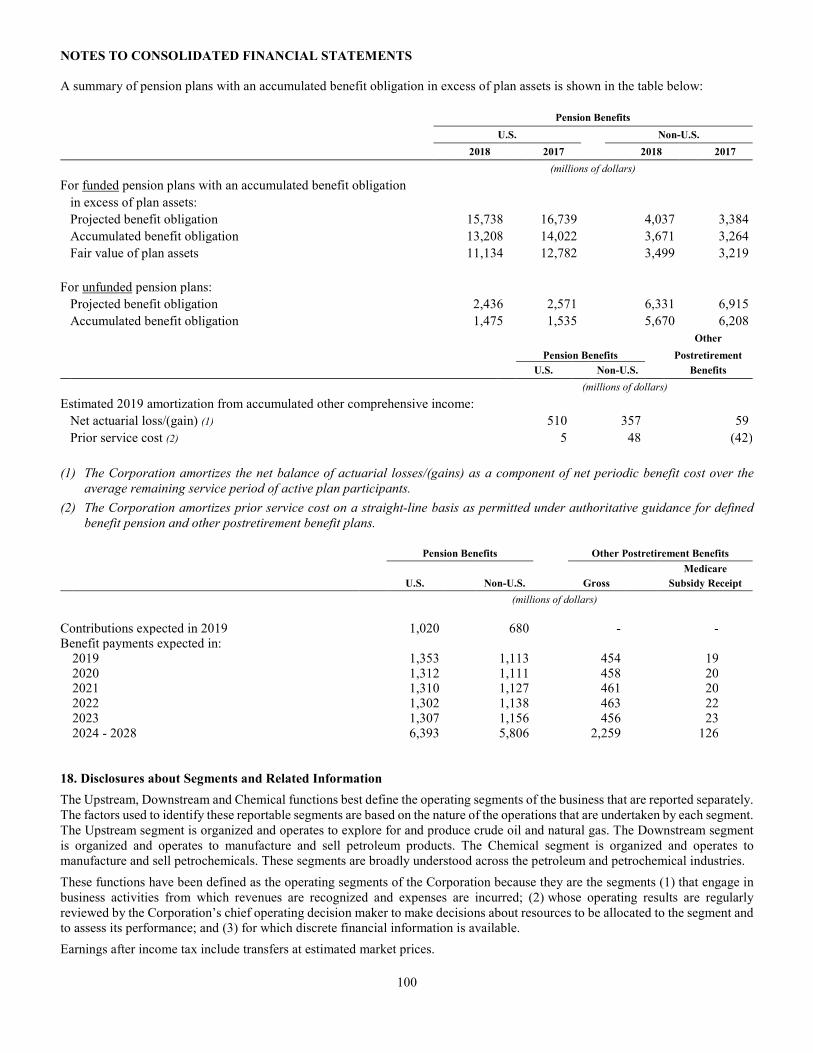
NOTES TO CONSOLIDATED FINANCIAL STATEMENTS
100
A summary of pension plans with an accumulated benefit obligation in excess of plan assets is shown in the table below: Pension Benefits
U.S. Non-U.S.
2018 2017 2018 2017
(millions of dollars)
For funded pension plans with an accumulated benefit obligation
in excess of plan assets:
Projected benefit obligation 15,738 16,739 4,037 3,384
Accumulated benefit obligation 13,208 14,022 3,671 3,264
Fair value of plan assets 11,134 12,782 3,499 3,219
For unfunded pension plans:
Projected benefit obligation 2,436 2,571 6,331 6,915
Accumulated benefit obligation 1,475 1,535 5,670 6,208
Other
Pension Benefits Postretirement
U.S. Non-U.S. Benefits
(millions of dollars)
Estimated 2019 amortization from accumulated other comprehensive income:
Net actuarial loss/(gain) (1) 510 357 59
Prior service cost (2) 5 48 (42)
(1) The Corporation amortizes the net balance of actuarial losses/(gains) as a component of net periodic benefit cost over the
average remaining service period of active plan participants.
(2) The Corporation amortizes prior service cost on a straight-line basis as permitted under authoritative guidance for defined
benefit pension and other postretirement benefit plans. Pension Benefits Other Postretirement Benefits
Medicare
U.S. Non-U.S. Gross Subsidy Receipt
(millions of dollars)
Contributions expected in 2019 1,020 680 - - Benefit payments expected in: 2019 1,353 1,113 454 19 2020 1,312 1,111 458 20 2021 1,310 1,127 461 20 2022 1,302 1,138 463 22 2023 1,307 1,156 456 23 2024 - 2028 6,393 5,806 2,259 126
18. Disclosures about Segments and Related Information
The Upstream, Downstream and Chemical functions best define the operating segments of the business that are reported separately. The factors used to identify these reportable segments are based on the nature of the operations that are undertaken by each segment. The Upstream segment is organized and operates to explore for and produce crude oil and natural gas. The Downstream segment is organized and operates to manufacture and sell petroleum products. The Chemical segment is organized and operates to manufacture and sell petrochemicals. These segments are broadly understood across the petroleum and petrochemical industries.
These functions have been defined as the operating segments of the Corporation because they are the segments (1) that engage in business activities from which revenues are recognized and expenses are incurred; (2) whose operating results are regularly reviewed by the Corporation’s chief operating decision maker to make decisions about resources to be allocated to the segment and to assess its performance; and (3) for which discrete financial information is available.
Earnings after income tax include transfers at estimated market prices.
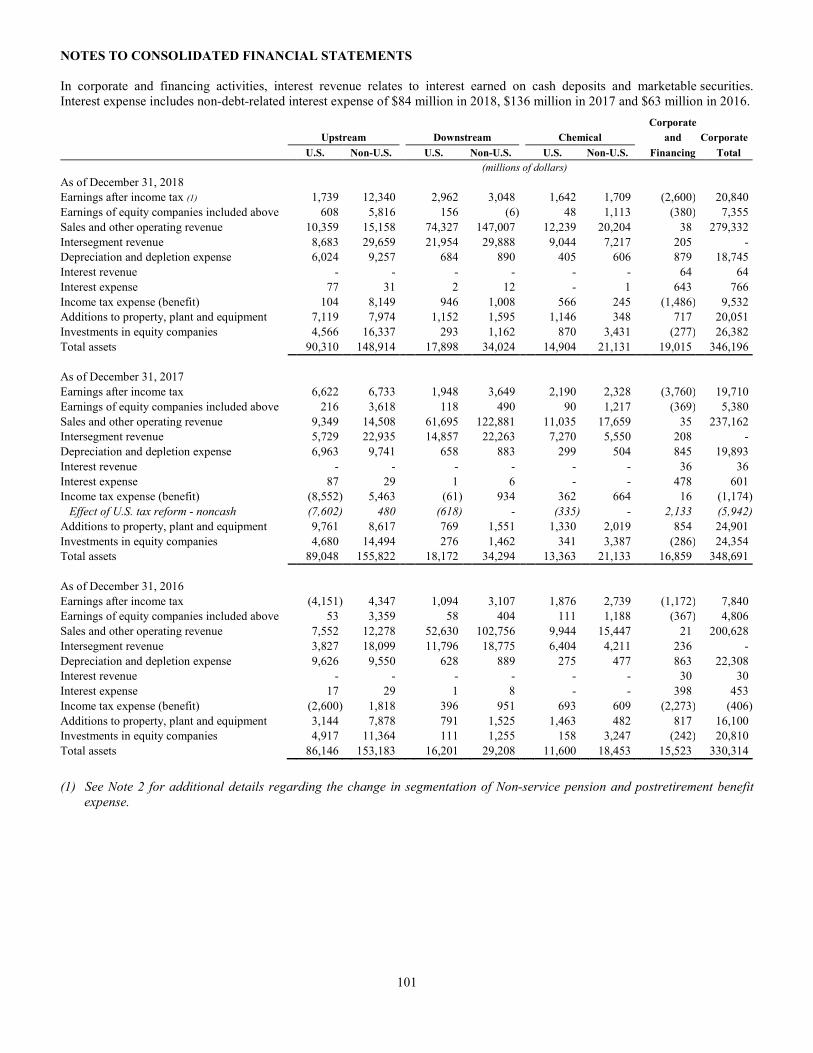
NOTES TO CONSOLIDATED FINANCIAL STATEMENTS
101
In corporate and financing activities, interest revenue relates to interest earned on cash deposits and marketable securities. Interest expense includes non-debt-related interest expense of $84 million in 2018, $136 million in 2017 and $63 million in 2016.
Corporate
Upstream Downstream Chemical and Corporate
U.S. Non-U.S. U.S. Non-U.S. U.S. Non-U.S. Financing Total
(millions of dollars)
As of December 31, 2018 Earnings after income tax (1) 1,739 12,340 2,962 3,048 1,642 1,709 (2,600) 20,840
Earnings of equity companies included above 608 5,816 156 (6) 48 1,113 (380) 7,355
Sales and other operating revenue 10,359 15,158 74,327 147,007 12,239 20,204 38 279,332
Intersegment revenue 8,683 29,659 21,954 29,888 9,044 7,217 205 -
Depreciation and depletion expense 6,024 9,257 684 890 405 606 879 18,745
Interest revenue - - - - - - 64 64
Interest expense 77 31 2 12 - 1 643 766
Income tax expense (benefit) 104 8,149 946 1,008 566 245 (1,486) 9,532
Additions to property, plant and equipment 7,119 7,974 1,152 1,595 1,146 348 717 20,051
Investments in equity companies 4,566 16,337 293 1,162 870 3,431 (277) 26,382
Total assets 90,310 148,914 17,898 34,024 14,904 21,131 19,015 346,196
As of December 31, 2017
Earnings after income tax 6,622 6,733 1,948 3,649 2,190 2,328 (3,760) 19,710
Earnings of equity companies included above 216 3,618 118 490 90 1,217 (369) 5,380
Sales and other operating revenue 9,349 14,508 61,695 122,881 11,035 17,659 35 237,162
Intersegment revenue 5,729 22,935 14,857 22,263 7,270 5,550 208 -
Depreciation and depletion expense 6,963 9,741 658 883 299 504 845 19,893
Interest revenue - - - - - - 36 36
Interest expense 87 29 1 6 - - 478 601
Income tax expense (benefit) (8,552) 5,463 (61) 934 362 664 16 (1,174)
Effect of U.S. tax reform - noncash (7,602) 480 (618) - (335) - 2,133 (5,942)
Additions to property, plant and equipment 9,761 8,617 769 1,551 1,330 2,019 854 24,901
Investments in equity companies 4,680 14,494 276 1,462 341 3,387 (286) 24,354
Total assets 89,048 155,822 18,172 34,294 13,363 21,133 16,859 348,691
As of December 31, 2016
Earnings after income tax (4,151) 4,347 1,094 3,107 1,876 2,739 (1,172) 7,840
Earnings of equity companies included above 53 3,359 58 404 111 1,188 (367) 4,806
Sales and other operating revenue 7,552 12,278 52,630 102,756 9,944 15,447 21 200,628
Intersegment revenue 3,827 18,099 11,796 18,775 6,404 4,211 236 -
Depreciation and depletion expense 9,626 9,550 628 889 275 477 863 22,308
Interest revenue - - - - - - 30 30
Interest expense 17 29 1 8 - - 398 453
Income tax expense (benefit) (2,600) 1,818 396 951 693 609 (2,273) (406)
Additions to property, plant and equipment 3,144 7,878 791 1,525 1,463 482 817 16,100
Investments in equity companies 4,917 11,364 111 1,255 158 3,247 (242) 20,810
Total assets 86,146 153,183 16,201 29,208 11,600 18,453 15,523 330,314
(1) See Note 2 for additional details regarding the change in segmentation of Non-service pension and postretirement benefit
expense.
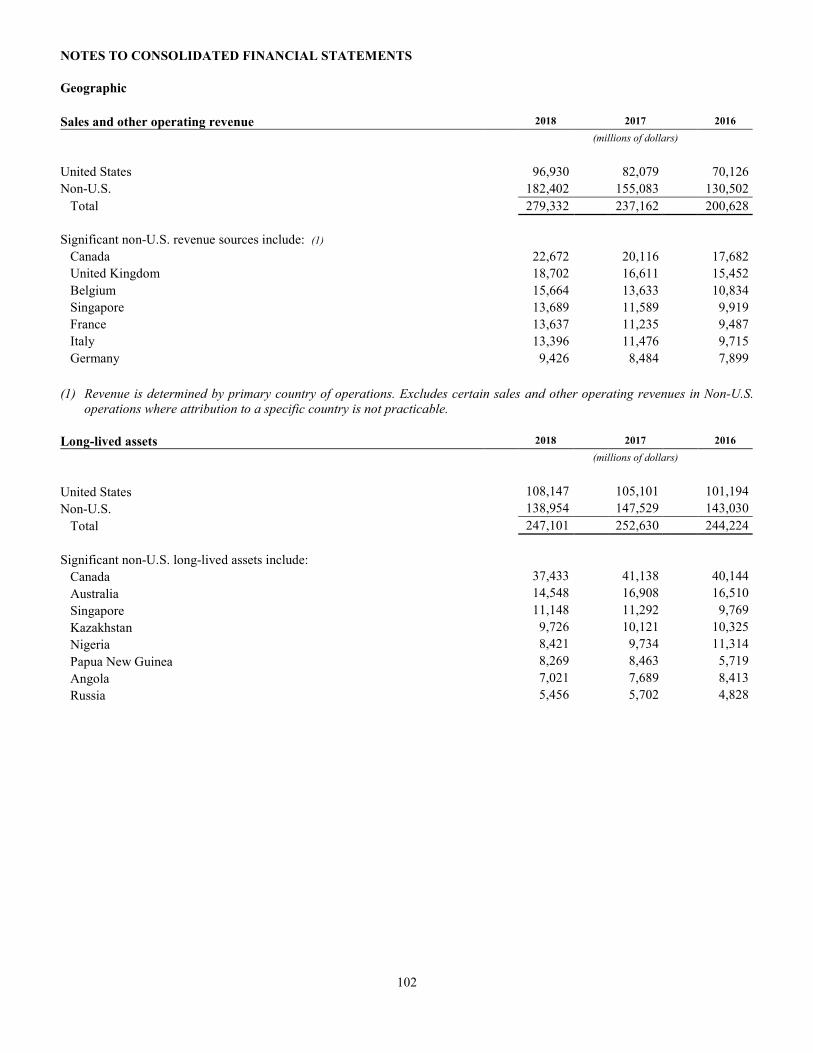
NOTES TO CONSOLIDATED FINANCIAL STATEMENTS
102
Geographic
Sales and other operating revenue 2018 2017 2016
(millions of dollars)
United States 96,930 82,079 70,126
Non-U.S. 182,402 155,083 130,502
Total 279,332 237,162 200,628
Significant non-U.S. revenue sources include: (1)
Canada 22,672 20,116 17,682
United Kingdom 18,702 16,611 15,452
Belgium 15,664 13,633 10,834
Singapore 13,689 11,589 9,919
France 13,637 11,235 9,487
Italy 13,396 11,476 9,715
Germany 9,426 8,484 7,899
(1) Revenue is determined by primary country of operations. Excludes certain sales and other operating revenues in Non-U.S.
operations where attribution to a specific country is not practicable.
Long-lived assets 2018 2017 2016
(millions of dollars)
United States 108,147 105,101 101,194
Non-U.S. 138,954 147,529 143,030
Total 247,101 252,630 244,224
Significant non-U.S. long-lived assets include:
Canada 37,433 41,138 40,144
Australia 14,548 16,908 16,510
Singapore 11,148 11,292 9,769
Kazakhstan 9,726 10,121 10,325
Nigeria 8,421 9,734 11,314
Papua New Guinea 8,269 8,463 5,719
Angola 7,021 7,689 8,413
Russia 5,456 5,702 4,828
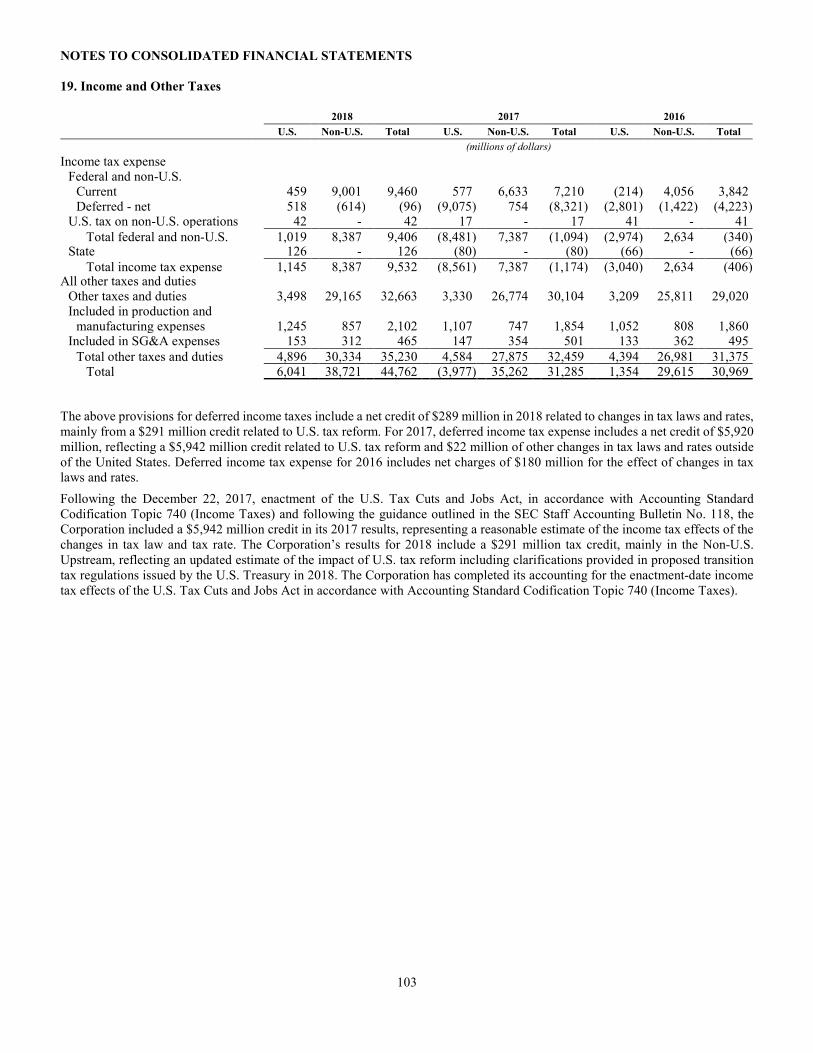
NOTES TO CONSOLIDATED FINANCIAL STATEMENTS
103
19. Income and Other Taxes 2018 2017 2016
U.S. Non-U.S. Total U.S. Non-U.S. Total U.S. Non-U.S. Total
(millions of dollars) Income tax expense Federal and non-U.S. Current 459 9,001 9,460 577 6,633 7,210 (214) 4,056 3,842 Deferred - net 518 (614) (96) (9,075) 754 (8,321) (2,801) (1,422) (4,223) U.S. tax on non-U.S. operations 42 - 42 17 - 17 41 - 41
Total federal and non-U.S. 1,019 8,387 9,406 (8,481) 7,387 (1,094) (2,974) 2,634 (340) State 126 - 126 (80) - (80) (66) - (66)
Total income tax expense 1,145 8,387 9,532 (8,561) 7,387 (1,174) (3,040) 2,634 (406)All other taxes and duties Other taxes and duties 3,498 29,165 32,663 3,330 26,774 30,104 3,209 25,811 29,020 Included in production and manufacturing expenses 1,245 857 2,102 1,107 747 1,854 1,052 808 1,860 Included in SG&A expenses 153 312 465 147 354 501 133 362 495
Total other taxes and duties 4,896 30,334 35,230 4,584 27,875 32,459 4,394 26,981 31,375 Total 6,041 38,721 44,762 (3,977) 35,262 31,285 1,354 29,615 30,969
The above provisions for deferred income taxes include a net credit of $289 million in 2018 related to changes in tax laws and rates, mainly from a $291 million credit related to U.S. tax reform. For 2017, deferred income tax expense includes a net credit of $5,920 million, reflecting a $5,942 million credit related to U.S. tax reform and $22 million of other changes in tax laws and rates outside of the United States. Deferred income tax expense for 2016 includes net charges of $180 million for the effect of changes in tax laws and rates.
Following the December 22, 2017, enactment of the U.S. Tax Cuts and Jobs Act, in accordance with Accounting Standard Codification Topic 740 (Income Taxes) and following the guidance outlined in the SEC Staff Accounting Bulletin No. 118, the Corporation included a $5,942 million credit in its 2017 results, representing a reasonable estimate of the income tax effects of the changes in tax law and tax rate. The Corporation’s results for 2018 include a $291 million tax credit, mainly in the Non-U.S. Upstream, reflecting an updated estimate of the impact of U.S. tax reform including clarifications provided in proposed transition tax regulations issued by the U.S. Treasury in 2018. The Corporation has completed its accounting for the enactment-date income tax effects of the U.S. Tax Cuts and Jobs Act in accordance with Accounting Standard Codification Topic 740 (Income Taxes).
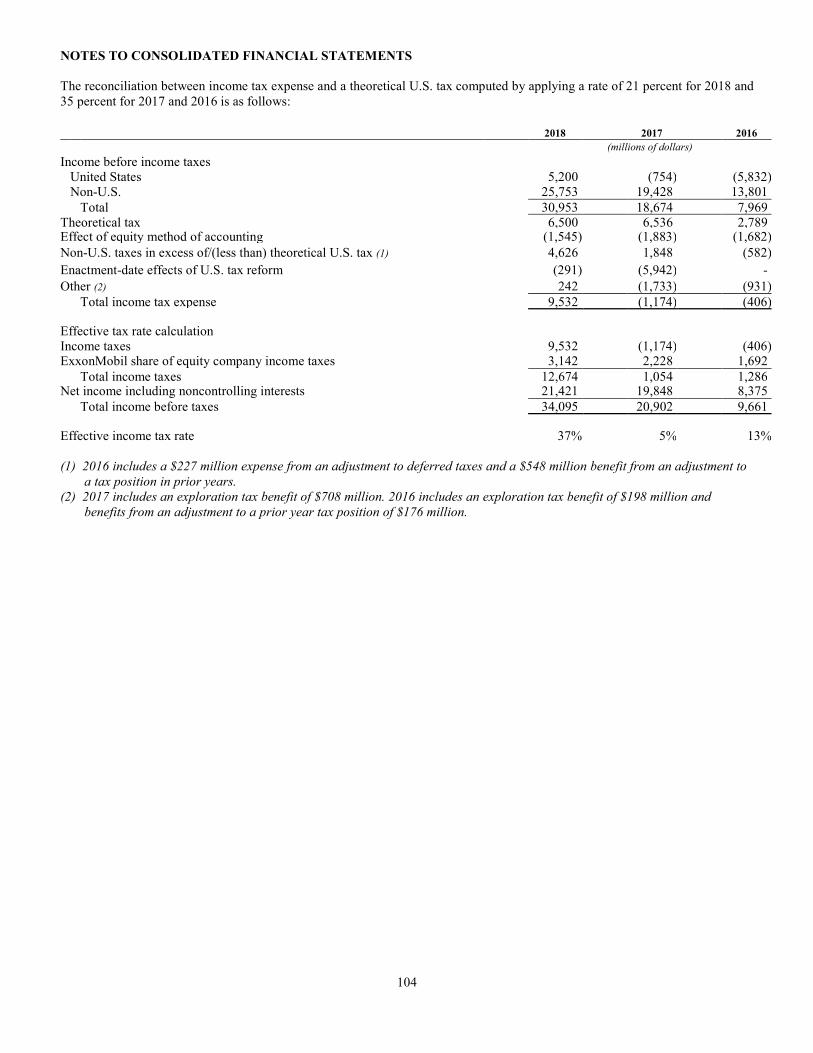
NOTES TO CONSOLIDATED FINANCIAL STATEMENTS
104
The reconciliation between income tax expense and a theoretical U.S. tax computed by applying a rate of 21 percent for 2018 and 35 percent for 2017 and 2016 is as follows: 2018 2017 2016
(millions of dollars)
Income before income taxes United States 5,200 (754) (5,832) Non-U.S. 25,753 19,428 13,801
Total 30,953 18,674 7,969 Theoretical tax 6,500 6,536 2,789 Effect of equity method of accounting (1,545) (1,883) (1,682)
Non-U.S. taxes in excess of/(less than) theoretical U.S. tax (1) 4,626 1,848 (582)
Enactment-date effects of U.S. tax reform (291) (5,942) -
Other (2) 242 (1,733) (931)
Total income tax expense 9,532 (1,174) (406)
Effective tax rate calculation Income taxes 9,532 (1,174) (406)ExxonMobil share of equity company income taxes 3,142 2,228 1,692
Total income taxes 12,674 1,054 1,286 Net income including noncontrolling interests 21,421 19,848 8,375
Total income before taxes 34,095 20,902 9,661
Effective income tax rate 37% 5% 13% (1) 2016 includes a $227 million expense from an adjustment to deferred taxes and a $548 million benefit from an adjustment to
a tax position in prior years.
(2) 2017 includes an exploration tax benefit of $708 million. 2016 includes an exploration tax benefit of $198 million and
benefits from an adjustment to a prior year tax position of $176 million.
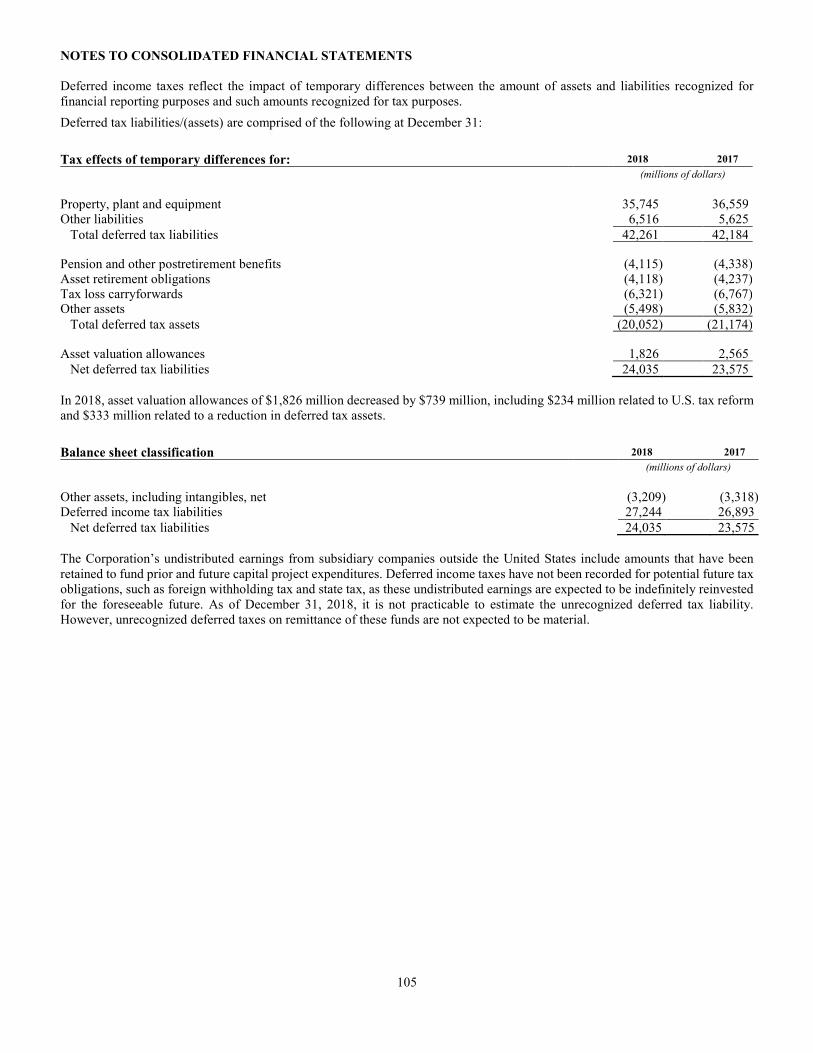
NOTES TO CONSOLIDATED FINANCIAL STATEMENTS
105
Deferred income taxes reflect the impact of temporary differences between the amount of assets and liabilities recognized for financial reporting purposes and such amounts recognized for tax purposes.
Deferred tax liabilities/(assets) are comprised of the following at December 31:
Tax effects of temporary differences for: 2018 2017
(millions of dollars)
Property, plant and equipment 35,745 36,559 Other liabilities 6,516 5,625
Total deferred tax liabilities 42,261 42,184 Pension and other postretirement benefits (4,115) (4,338)Asset retirement obligations (4,118) (4,237)Tax loss carryforwards (6,321) (6,767)Other assets (5,498) (5,832)
Total deferred tax assets (20,052) (21,174) Asset valuation allowances 1,826 2,565
Net deferred tax liabilities 24,035 23,575
In 2018, asset valuation allowances of $1,826 million decreased by $739 million, including $234 million related to U.S. tax reform and $333 million related to a reduction in deferred tax assets.
Balance sheet classification 2018 2017
(millions of dollars)
Other assets, including intangibles, net (3,209) (3,318)Deferred income tax liabilities 27,244 26,893
Net deferred tax liabilities 24,035 23,575
The Corporation’s undistributed earnings from subsidiary companies outside the United States include amounts that have been retained to fund prior and future capital project expenditures. Deferred income taxes have not been recorded for potential future tax obligations, such as foreign withholding tax and state tax, as these undistributed earnings are expected to be indefinitely reinvested for the foreseeable future. As of December 31, 2018, it is not practicable to estimate the unrecognized deferred tax liability. However, unrecognized deferred taxes on remittance of these funds are not expected to be material.
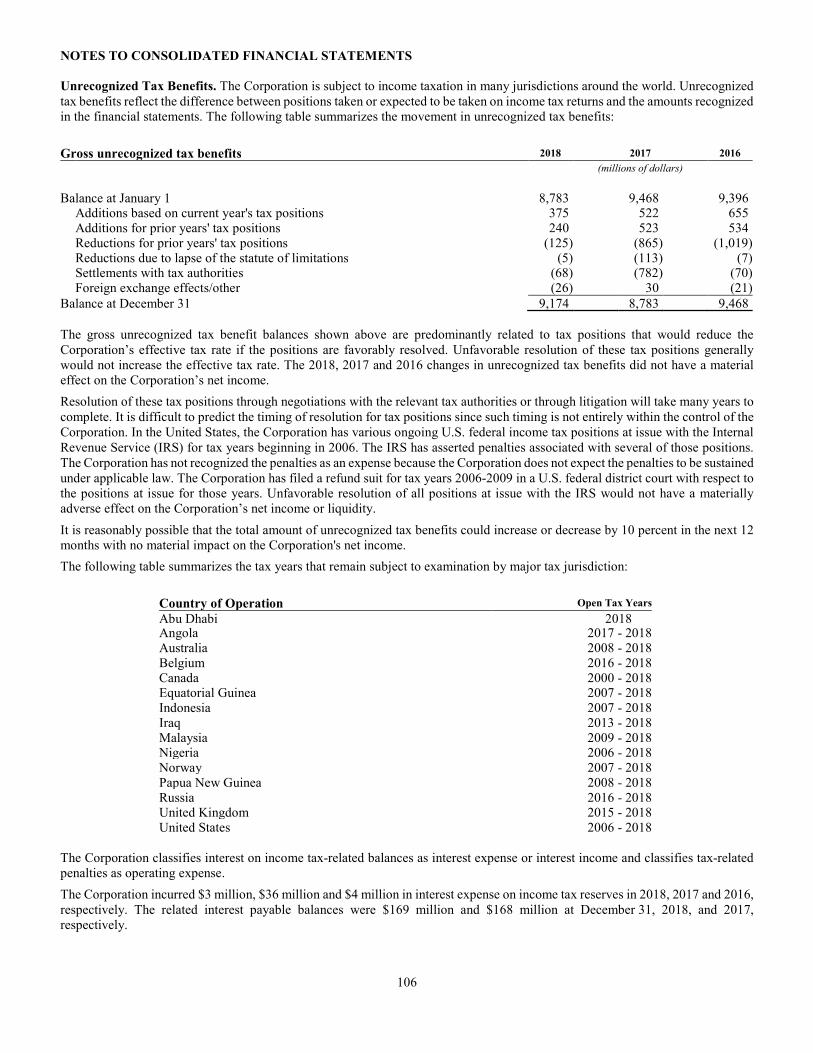
NOTES TO CONSOLIDATED FINANCIAL STATEMENTS
106
Unrecognized Tax Benefits. The Corporation is subject to income taxation in many jurisdictions around the world. Unrecognized tax benefits reflect the difference between positions taken or expected to be taken on income tax returns and the amounts recognized in the financial statements. The following table summarizes the movement in unrecognized tax benefits:
Gross unrecognized tax benefits 2018 2017 2016
(millions of dollars)
Balance at January 1 8,783 9,468 9,396 Additions based on current year's tax positions 375 522 655 Additions for prior years' tax positions 240 523 534 Reductions for prior years' tax positions (125) (865) (1,019) Reductions due to lapse of the statute of limitations (5) (113) (7) Settlements with tax authorities (68) (782) (70) Foreign exchange effects/other (26) 30 (21)
Balance at December 31 9,174 8,783 9,468
The gross unrecognized tax benefit balances shown above are predominantly related to tax positions that would reduce the Corporation’s effective tax rate if the positions are favorably resolved. Unfavorable resolution of these tax positions generally would not increase the effective tax rate. The 2018, 2017 and 2016 changes in unrecognized tax benefits did not have a material effect on the Corporation’s net income.
Resolution of these tax positions through negotiations with the relevant tax authorities or through litigation will take many years to complete. It is difficult to predict the timing of resolution for tax positions since such timing is not entirely within the control of the Corporation. In the United States, the Corporation has various ongoing U.S. federal income tax positions at issue with the Internal Revenue Service (IRS) for tax years beginning in 2006. The IRS has asserted penalties associated with several of those positions. The Corporation has not recognized the penalties as an expense because the Corporation does not expect the penalties to be sustained under applicable law. The Corporation has filed a refund suit for tax years 2006-2009 in a U.S. federal district court with respect to the positions at issue for those years. Unfavorable resolution of all positions at issue with the IRS would not have a materially adverse effect on the Corporation’s net income or liquidity.
It is reasonably possible that the total amount of unrecognized tax benefits could increase or decrease by 10 percent in the next 12 months with no material impact on the Corporation's net income.
The following table summarizes the tax years that remain subject to examination by major tax jurisdiction:
Country of Operation Open Tax Years
Abu Dhabi 2018….. Angola 2017 - 2018 Australia 2008 - 2018 Belgium 2016 - 2018 Canada 2000 - 2018 Equatorial Guinea 2007 - 2018 Indonesia 2007 - 2018 Iraq 2013 - 2018 Malaysia 2009 - 2018 Nigeria 2006 - 2018 Norway 2007 - 2018 Papua New Guinea 2008 - 2018 Russia 2016 - 2018 United Kingdom 2015 - 2018 United States 2006 - 2018 The Corporation classifies interest on income tax-related balances as interest expense or interest income and classifies tax-related penalties as operating expense.
The Corporation incurred $3 million, $36 million and $4 million in interest expense on income tax reserves in 2018, 2017 and 2016, respectively. The related interest payable balances were $169 million and $168 million at December 31, 2018, and 2017, respectively.
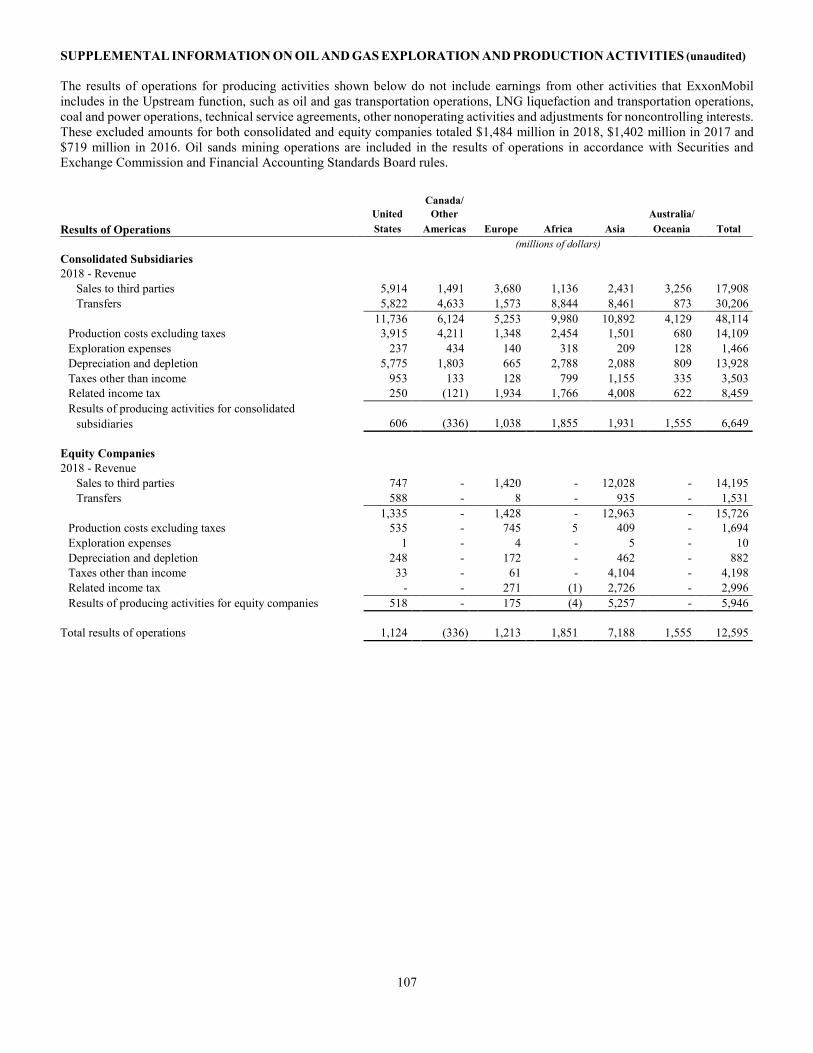
SUPPLEMENTAL INFORMATION ON OIL AND GAS EXPLORATION AND PRODUCTION ACTIVITIES (unaudited)
107
The results of operations for producing activities shown below do not include earnings from other activities that ExxonMobil includes in the Upstream function, such as oil and gas transportation operations, LNG liquefaction and transportation operations, coal and power operations, technical service agreements, other nonoperating activities and adjustments for noncontrolling interests. These excluded amounts for both consolidated and equity companies totaled $1,484 million in 2018, $1,402 million in 2017 and $719 million in 2016. Oil sands mining operations are included in the results of operations in accordance with Securities and Exchange Commission and Financial Accounting Standards Board rules.
Canada/
United Other Australia/
Results of Operations States Americas Europe Africa Asia Oceania Total
(millions of dollars)
Consolidated Subsidiaries
2018 - Revenue
Sales to third parties 5,914 1,491 3,680 1,136 2,431 3,256 17,908
Transfers 5,822 4,633 1,573 8,844 8,461 873 30,206
11,736 6,124 5,253 9,980 10,892 4,129 48,114
Production costs excluding taxes 3,915 4,211 1,348 2,454 1,501 680 14,109
Exploration expenses 237 434 140 318 209 128 1,466
Depreciation and depletion 5,775 1,803 665 2,788 2,088 809 13,928
Taxes other than income 953 133 128 799 1,155 335 3,503
Related income tax 250 (121) 1,934 1,766 4,008 622 8,459
Results of producing activities for consolidated
subsidiaries 606 (336) 1,038 1,855 1,931 1,555 6,649
Equity Companies
2018 - Revenue
Sales to third parties 747 - 1,420 - 12,028 - 14,195
Transfers 588 - 8 - 935 - 1,531
1,335 - 1,428 - 12,963 - 15,726
Production costs excluding taxes 535 - 745 5 409 - 1,694
Exploration expenses 1 - 4 - 5 - 10
Depreciation and depletion 248 - 172 - 462 - 882
Taxes other than income 33 - 61 - 4,104 - 4,198
Related income tax - - 271 (1) 2,726 - 2,996
Results of producing activities for equity companies 518 - 175 (4) 5,257 - 5,946
Total results of operations 1,124 (336) 1,213 1,851 7,188 1,555 12,595
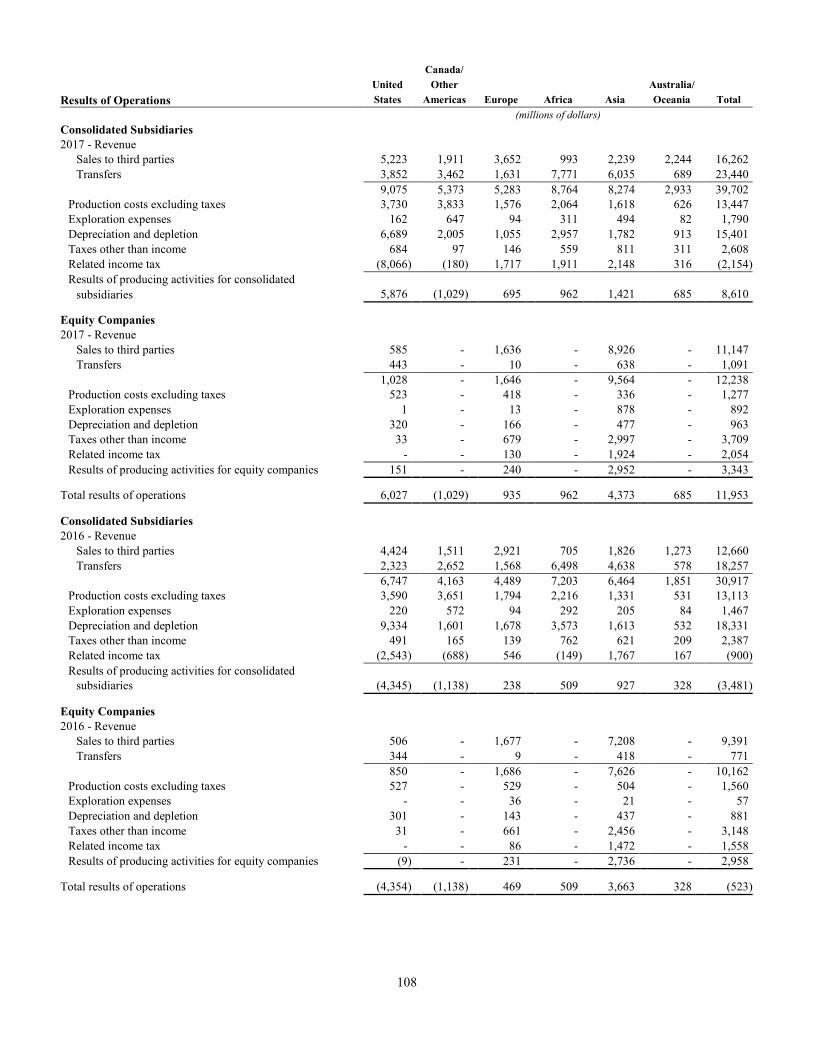
108
Canada/
United Other Australia/
Results of Operations States Americas Europe Africa Asia Oceania Total
(millions of dollars)
Consolidated Subsidiaries
2017 - Revenue
Sales to third parties 5,223 1,911 3,652 993 2,239 2,244 16,262
Transfers 3,852 3,462 1,631 7,771 6,035 689 23,440
9,075 5,373 5,283 8,764 8,274 2,933 39,702
Production costs excluding taxes 3,730 3,833 1,576 2,064 1,618 626 13,447
Exploration expenses 162 647 94 311 494 82 1,790
Depreciation and depletion 6,689 2,005 1,055 2,957 1,782 913 15,401
Taxes other than income 684 97 146 559 811 311 2,608
Related income tax (8,066) (180) 1,717 1,911 2,148 316 (2,154)
Results of producing activities for consolidated
subsidiaries 5,876 (1,029) 695 962 1,421 685 8,610
Equity Companies
2017 - Revenue
Sales to third parties 585 - 1,636 - 8,926 - 11,147
Transfers 443 - 10 - 638 - 1,091
1,028 - 1,646 - 9,564 - 12,238
Production costs excluding taxes 523 - 418 - 336 - 1,277
Exploration expenses 1 - 13 - 878 - 892
Depreciation and depletion 320 - 166 - 477 - 963
Taxes other than income 33 - 679 - 2,997 - 3,709
Related income tax - - 130 - 1,924 - 2,054
Results of producing activities for equity companies 151 - 240 - 2,952 - 3,343
Total results of operations 6,027 (1,029) 935 962 4,373 685 11,953
Consolidated Subsidiaries
2016 - Revenue
Sales to third parties 4,424 1,511 2,921 705 1,826 1,273 12,660
Transfers 2,323 2,652 1,568 6,498 4,638 578 18,257
6,747 4,163 4,489 7,203 6,464 1,851 30,917
Production costs excluding taxes 3,590 3,651 1,794 2,216 1,331 531 13,113
Exploration expenses 220 572 94 292 205 84 1,467
Depreciation and depletion 9,334 1,601 1,678 3,573 1,613 532 18,331
Taxes other than income 491 165 139 762 621 209 2,387
Related income tax (2,543) (688) 546 (149) 1,767 167 (900)
Results of producing activities for consolidated
subsidiaries (4,345) (1,138) 238 509 927 328 (3,481)
Equity Companies
2016 - Revenue
Sales to third parties 506 - 1,677 - 7,208 - 9,391
Transfers 344 - 9 - 418 - 771
850 - 1,686 - 7,626 - 10,162
Production costs excluding taxes 527 - 529 - 504 - 1,560
Exploration expenses - - 36 - 21 - 57
Depreciation and depletion 301 - 143 - 437 - 881
Taxes other than income 31 - 661 - 2,456 - 3,148
Related income tax - - 86 - 1,472 - 1,558
Results of producing activities for equity companies (9) - 231 - 2,736 - 2,958
Total results of operations (4,354) (1,138) 469 509 3,663 328 (523)
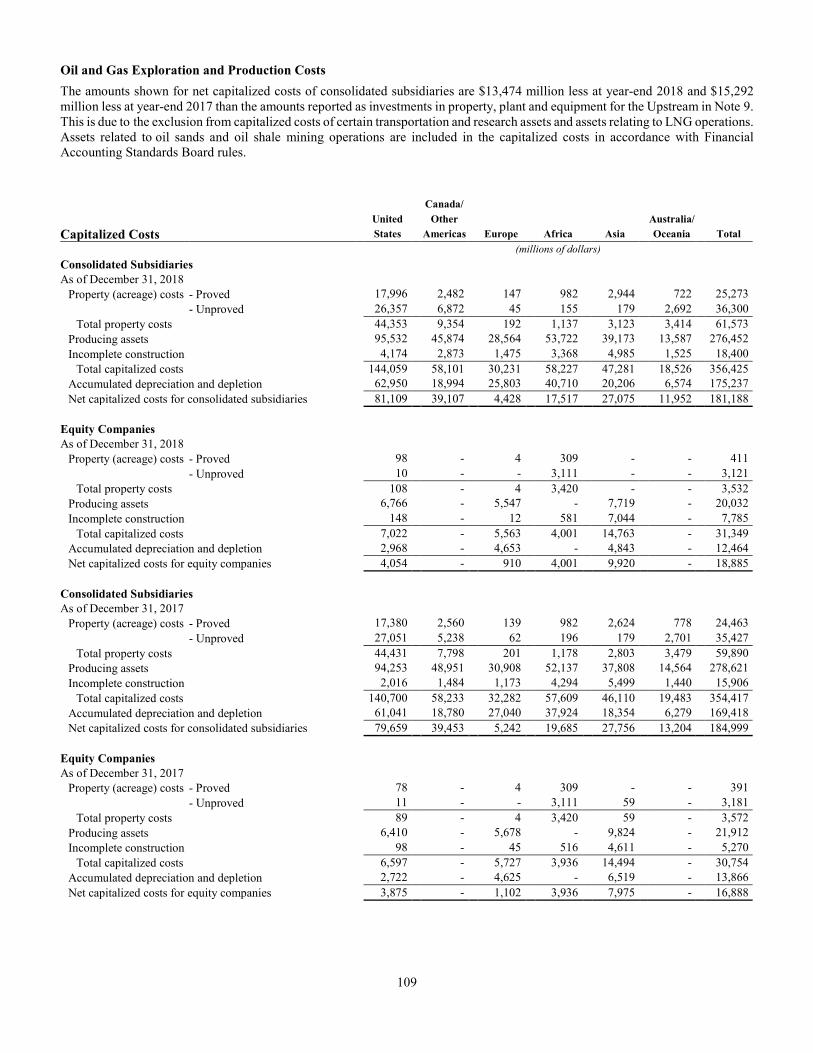
109
Oil and Gas Exploration and Production Costs
The amounts shown for net capitalized costs of consolidated subsidiaries are $13,474 million less at year-end 2018 and $15,292 million less at year-end 2017 than the amounts reported as investments in property, plant and equipment for the Upstream in Note 9. This is due to the exclusion from capitalized costs of certain transportation and research assets and assets relating to LNG operations. Assets related to oil sands and oil shale mining operations are included in the capitalized costs in accordance with Financial Accounting Standards Board rules.
Canada/
United Other Australia/
Capitalized Costs States Americas Europe Africa Asia Oceania Total
(millions of dollars)
Consolidated Subsidiaries
As of December 31, 2018
Property (acreage) costs - Proved 17,996 2,482 147 982 2,944 722 25,273
- Unproved 26,357 6,872 45 155 179 2,692 36,300
Total property costs 44,353 9,354 192 1,137 3,123 3,414 61,573
Producing assets 95,532 45,874 28,564 53,722 39,173 13,587 276,452
Incomplete construction 4,174 2,873 1,475 3,368 4,985 1,525 18,400
Total capitalized costs 144,059 58,101 30,231 58,227 47,281 18,526 356,425
Accumulated depreciation and depletion 62,950 18,994 25,803 40,710 20,206 6,574 175,237
Net capitalized costs for consolidated subsidiaries 81,109 39,107 4,428 17,517 27,075 11,952 181,188
Equity Companies
As of December 31, 2018
Property (acreage) costs - Proved 98 - 4 309 - - 411
- Unproved 10 - - 3,111 - - 3,121
Total property costs 108 - 4 3,420 - - 3,532
Producing assets 6,766 - 5,547 - 7,719 - 20,032
Incomplete construction 148 - 12 581 7,044 - 7,785
Total capitalized costs 7,022 - 5,563 4,001 14,763 - 31,349
Accumulated depreciation and depletion 2,968 - 4,653 - 4,843 - 12,464
Net capitalized costs for equity companies 4,054 - 910 4,001 9,920 - 18,885
Consolidated Subsidiaries
As of December 31, 2017
Property (acreage) costs - Proved 17,380 2,560 139 982 2,624 778 24,463
- Unproved 27,051 5,238 62 196 179 2,701 35,427
Total property costs 44,431 7,798 201 1,178 2,803 3,479 59,890
Producing assets 94,253 48,951 30,908 52,137 37,808 14,564 278,621
Incomplete construction 2,016 1,484 1,173 4,294 5,499 1,440 15,906
Total capitalized costs 140,700 58,233 32,282 57,609 46,110 19,483 354,417
Accumulated depreciation and depletion 61,041 18,780 27,040 37,924 18,354 6,279 169,418
Net capitalized costs for consolidated subsidiaries 79,659 39,453 5,242 19,685 27,756 13,204 184,999
Equity Companies
As of December 31, 2017
Property (acreage) costs - Proved 78 - 4 309 - - 391
- Unproved 11 - - 3,111 59 - 3,181
Total property costs 89 - 4 3,420 59 - 3,572
Producing assets 6,410 - 5,678 - 9,824 - 21,912
Incomplete construction 98 - 45 516 4,611 - 5,270
Total capitalized costs 6,597 - 5,727 3,936 14,494 - 30,754
Accumulated depreciation and depletion 2,722 - 4,625 - 6,519 - 13,866
Net capitalized costs for equity companies 3,875 - 1,102 3,936 7,975 - 16,888
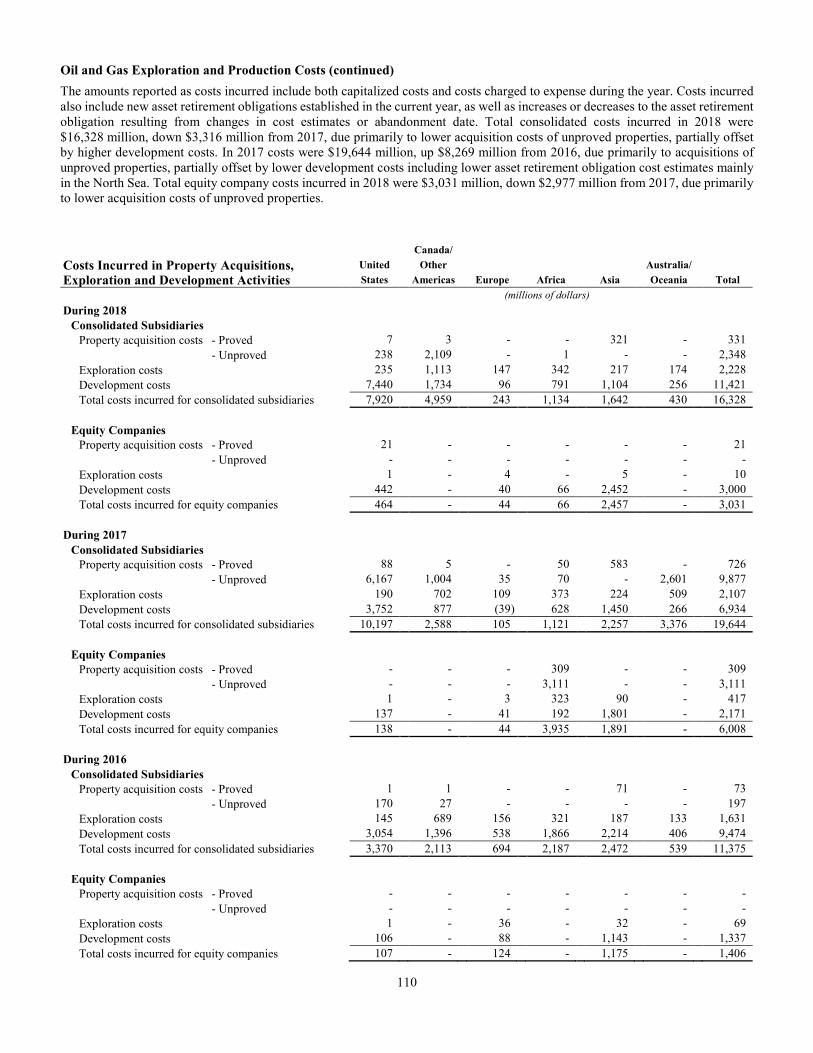
110
Oil and Gas Exploration and Production Costs (continued)
The amounts reported as costs incurred include both capitalized costs and costs charged to expense during the year. Costs incurred also include new asset retirement obligations established in the current year, as well as increases or decreases to the asset retirement obligation resulting from changes in cost estimates or abandonment date. Total consolidated costs incurred in 2018 were $16,328 million, down $3,316 million from 2017, due primarily to lower acquisition costs of unproved properties, partially offset by higher development costs. In 2017 costs were $19,644 million, up $8,269 million from 2016, due primarily to acquisitions of unproved properties, partially offset by lower development costs including lower asset retirement obligation cost estimates mainly in the North Sea. Total equity company costs incurred in 2018 were $3,031 million, down $2,977 million from 2017, due primarily to lower acquisition costs of unproved properties.
Canada/
Costs Incurred in Property Acquisitions, United Other Australia/
Exploration and Development Activities States Americas Europe Africa Asia Oceania Total
(millions of dollars)
During 2018
Consolidated Subsidiaries
Property acquisition costs - Proved 7 3 - - 321 - 331
- Unproved 238 2,109 - 1 - - 2,348
Exploration costs 235 1,113 147 342 217 174 2,228
Development costs 7,440 1,734 96 791 1,104 256 11,421
Total costs incurred for consolidated subsidiaries 7,920 4,959 243 1,134 1,642 430 16,328
Equity Companies
Property acquisition costs - Proved 21 - - - - - 21
- Unproved - - - - - - -
Exploration costs 1 - 4 - 5 - 10
Development costs 442 - 40 66 2,452 - 3,000
Total costs incurred for equity companies 464 - 44 66 2,457 - 3,031
During 2017
Consolidated Subsidiaries
Property acquisition costs - Proved 88 5 - 50 583 - 726
- Unproved 6,167 1,004 35 70 - 2,601 9,877
Exploration costs 190 702 109 373 224 509 2,107
Development costs 3,752 877 (39) 628 1,450 266 6,934
Total costs incurred for consolidated subsidiaries 10,197 2,588 105 1,121 2,257 3,376 19,644
Equity Companies
Property acquisition costs - Proved - - - 309 - - 309
- Unproved - - - 3,111 - - 3,111
Exploration costs 1 - 3 323 90 - 417
Development costs 137 - 41 192 1,801 - 2,171
Total costs incurred for equity companies 138 - 44 3,935 1,891 - 6,008
During 2016
Consolidated Subsidiaries
Property acquisition costs - Proved 1 1 - - 71 - 73
- Unproved 170 27 - - - - 197
Exploration costs 145 689 156 321 187 133 1,631
Development costs 3,054 1,396 538 1,866 2,214 406 9,474
Total costs incurred for consolidated subsidiaries 3,370 2,113 694 2,187 2,472 539 11,375
Equity Companies
Property acquisition costs - Proved - - - - - - -
- Unproved - - - - - - -
Exploration costs 1 - 36 - 32 - 69
Development costs 106 - 88 - 1,143 - 1,337
Total costs incurred for equity companies 107 - 124 - 1,175 - 1,406
111
Oil and Gas Reserves
The following information describes changes during the years and balances of proved oil and gas reserves at year-end 2016, 2017 and 2018.
The definitions used are in accordance with the Securities and Exchange Commission’s Rule 4-10 (a) of Regulation S-X.
Proved oil and natural gas reserves are those quantities of oil and natural gas, which, by analysis of geoscience and engineering data, can be estimated with reasonable certainty to be economically producible – from a given date forward, from known reservoirs, and under existing economic conditions, operating methods and government regulations – prior to the time at which contracts providing the right to operate expire, unless evidence indicates that renewal is reasonably certain. In some cases, substantial new investments in additional wells and related facilities will be required to recover these proved reserves.
In accordance with the Securities and Exchange Commission’s (SEC) rules, the Corporation’s year-end reserves volumes as well as the reserves change categories shown in the following tables are required to be calculated on the basis of average prices during the 12-month period prior to the ending date of the period covered by the report, determined as an unweighted arithmetic average of the first-day-of-the-month price for each month within such period. These reserves quantities are also used in calculating unit-of-production depreciation rates and in calculating the standardized measure of discounted net cash flows.
Revisions can include upward or downward changes in previously estimated volumes of proved reserves for existing fields due to the evaluation or re-evaluation of (1) already available geologic, reservoir or production data, (2) new geologic, reservoir or production data or (3) changes in the average of first-of-month oil and natural gas prices and / or costs that are used in the estimation of reserves. Revisions can also result from significant changes in either development strategy or production equipment/facility capacity. Reserve volumes that were subject to a downward revision can be revised upward at some point in the future when price levels increase, costs decline, and / or operating efficiencies occur.
Proved reserves include 100 percent of each majority-owned affiliate’s participation in proved reserves and ExxonMobil’s ownership percentage of the proved reserves of equity companies, but exclude royalties and quantities due others. Natural gas reserves exclude the gaseous equivalent of liquids expected to be removed from the natural gas on leases, at field facilities and at gas processing plants. These liquids are included in net proved reserves of crude oil and natural gas liquids.
In the proved reserves tables, consolidated reserves and equity company reserves are reported separately. However, the Corporation does not view equity company reserves any differently than those from consolidated companies.
Reserves reported under production sharing and other nonconcessionary agreements are based on the economic interest as defined by the specific fiscal terms in the agreement. The production and reserves reported for these types of arrangements typically vary inversely with oil and natural gas price changes. As oil and natural gas prices increase, the cash flow and value received by the company increase; however, the production volumes and reserves required to achieve this value will typically be lower because of the higher prices. When prices decrease, the opposite effect generally occurs. The percentage of total liquids and natural gas proved reserves (consolidated subsidiaries plus equity companies) at year-end 2018 that were associated with production sharing contract arrangements was 8 percent of liquids, 10 percent of natural gas and 9 percent on an oil-equivalent basis (natural gas is converted to an oil-equivalent basis at six billion cubic feet per one million barrels).
Net proved developed reserves are those volumes that are expected to be recovered through existing wells with existing equipment and operating methods or in which the cost of the required equipment is relatively minor compared to the cost of a new well. Net proved undeveloped reserves are those volumes that are expected to be recovered from new wells on undrilled acreage, or from existing wells where a relatively major expenditure is required for recompletion.
Crude oil, natural gas liquids, and natural gas production quantities shown are the net volumes withdrawn from ExxonMobil’s oil and natural gas reserves. The natural gas quantities differ from the quantities of natural gas delivered for sale by the producing function as reported in the Operating Information due to volumes consumed or flared and inventory changes.
The changes between 2018 year-end proved reserves and 2017 year-end proved reserves include upward revisions of 3.4 billion barrels of bitumen at Kearl as a result of improved prices; downward natural gas revisions for the Groningen field in the Netherlands; and extensions/discoveries primarily in the United States. In 2018, the Dutch Cabinet notified Parliament of its intention to further reduce previously legislated Groningen gas extraction in response to seismic events over the last several years. In anticipation of a lower production outlook, the Corporation reduced its estimate of proved reserves by 0.8 billion oil-equivalent barrels for the Groningen gas field.
The changes between 2017 year-end proved reserves and 2016 year-end proved reserves primarily reflect extensions/discoveries in the United States, Guyana, and the United Arab Emirates, as well as purchases in the Permian Basin and offshore Area 4 in Mozambique, along with upward revisions to North America natural gas, liquids in the United Arab Emirates, and bitumen at Kearl and Cold Lake. Downward revisions are reflected in Europe for the Groningen gas field.
The downward revisions in 2016, as the result of very low prices during 2016, included the entire 3.5 billion barrels of bitumen at Kearl. In addition, 0.8 billion barrels of oil equivalent across the remainder of North America no longer qualified as proved reserves at year-end 2016 mainly due to the acceleration of the projected end-of-field-life.
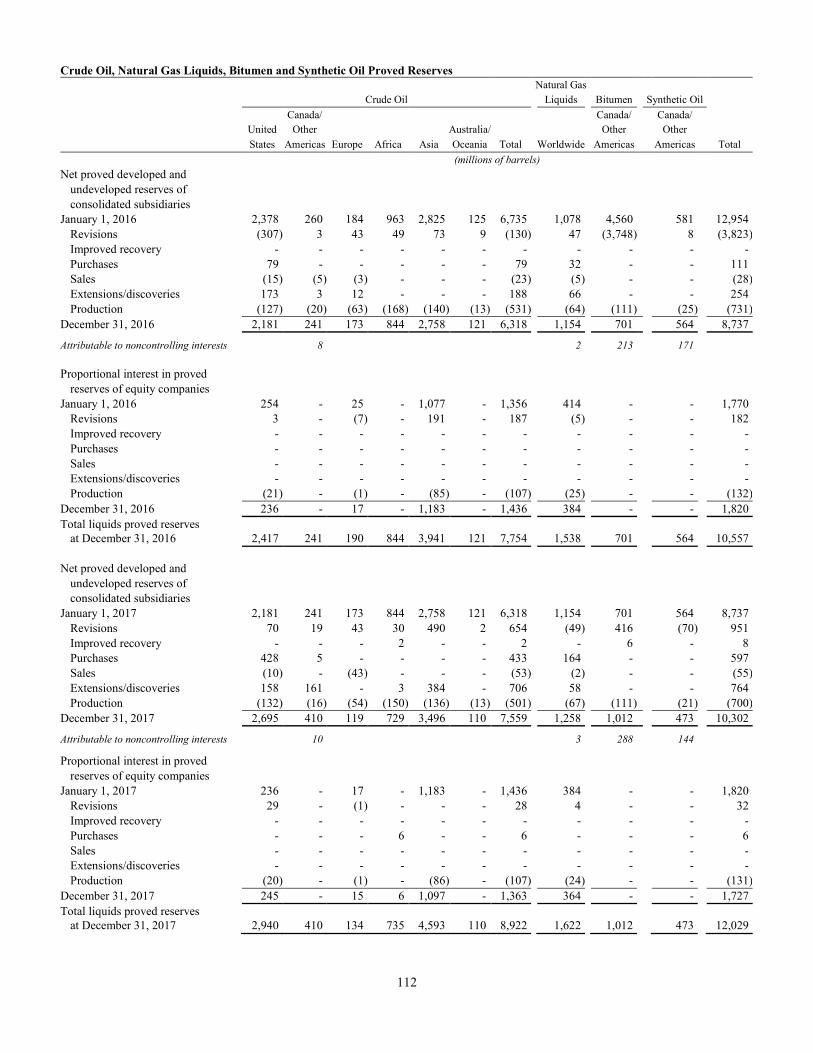
112
Crude Oil, Natural Gas Liquids, Bitumen and Synthetic Oil Proved Reserves
Natural Gas
Crude Oil Liquids Bitumen Synthetic Oil
Canada/ Canada/ Canada/
United Other Australia/ Other Other
States Americas Europe Africa Asia Oceania Total Worldwide Americas Americas Total
(millions of barrels)
Net proved developed and
undeveloped reserves of
consolidated subsidiaries
January 1, 2016 2,378 260 184 963 2,825 125 6,735 1,078 4,560 581 12,954
Revisions (307) 3 43 49 73 9 (130) 47 (3,748) 8 (3,823)
Improved recovery - - - - - - - - - - -
Purchases 79 - - - - - 79 32 - - 111
Sales (15) (5) (3) - - - (23) (5) - - (28)
Extensions/discoveries 173 3 12 - - - 188 66 - - 254
Production (127) (20) (63) (168) (140) (13) (531) (64) (111) (25) (731)
December 31, 2016 2,181 241 173 844 2,758 121 6,318 1,154 701 564 8,737
Attributable to noncontrolling interests 8 2 213 171
Proportional interest in proved
reserves of equity companies
January 1, 2016 254 - 25 - 1,077 - 1,356 414 - - 1,770
Revisions 3 - (7) - 191 - 187 (5) - - 182
Improved recovery - - - - - - - - - - -
Purchases - - - - - - - - - - -
Sales - - - - - - - - - - -
Extensions/discoveries - - - - - - - - - - -
Production (21) - (1) - (85) - (107) (25) - - (132)
December 31, 2016 236 - 17 - 1,183 - 1,436 384 - - 1,820
Total liquids proved reserves
at December 31, 2016 2,417 241 190 844 3,941 121 7,754 1,538 701 564 10,557
Net proved developed and
undeveloped reserves of
consolidated subsidiaries
January 1, 2017 2,181 241 173 844 2,758 121 6,318 1,154 701 564 8,737
Revisions 70 19 43 30 490 2 654 (49) 416 (70) 951
Improved recovery - - - 2 - - 2 - 6 - 8
Purchases 428 5 - - - - 433 164 - - 597
Sales (10) - (43) - - - (53) (2) - - (55)
Extensions/discoveries 158 161 - 3 384 - 706 58 - - 764
Production (132) (16) (54) (150) (136) (13) (501) (67) (111) (21) (700)
December 31, 2017 2,695 410 119 729 3,496 110 7,559 1,258 1,012 473 10,302
Attributable to noncontrolling interests 10 3 288 144
Proportional interest in proved
reserves of equity companies
January 1, 2017 236 - 17 - 1,183 - 1,436 384 - - 1,820
Revisions 29 - (1) - - - 28 4 - - 32
Improved recovery - - - - - - - - - - -
Purchases - - - 6 - - 6 - - - 6
Sales - - - - - - - - - - -
Extensions/discoveries - - - - - - - - - - -
Production (20) - (1) - (86) - (107) (24) - - (131)
December 31, 2017 245 - 15 6 1,097 - 1,363 364 - - 1,727
Total liquids proved reserves
at December 31, 2017 2,940 410 134 735 4,593 110 8,922 1,622 1,012 473 12,029
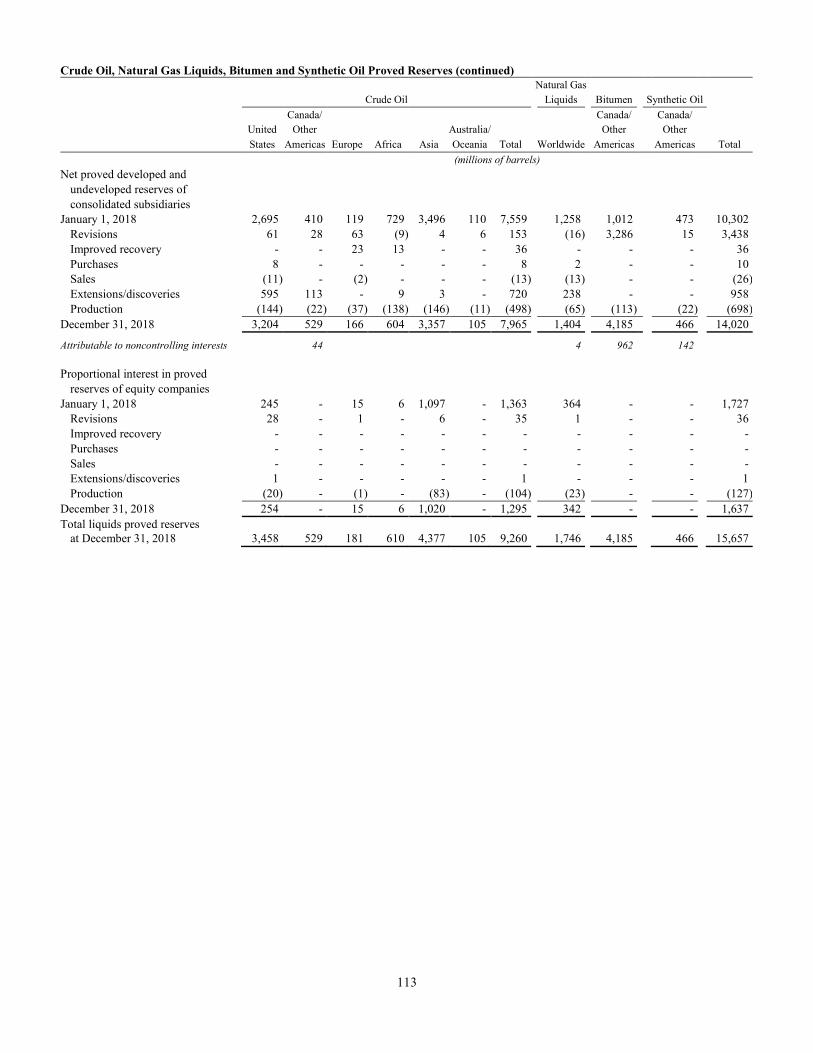
113
Crude Oil, Natural Gas Liquids, Bitumen and Synthetic Oil Proved Reserves (continued)
Natural Gas
Crude Oil Liquids Bitumen Synthetic Oil
Canada/ Canada/ Canada/
United Other Australia/ Other Other
States Americas Europe Africa Asia Oceania Total Worldwide Americas Americas Total
(millions of barrels)
Net proved developed and
undeveloped reserves of
consolidated subsidiaries
January 1, 2018 2,695 410 119 729 3,496 110 7,559 1,258 1,012 473 10,302
Revisions 61 28 63 (9) 4 6 153 (16) 3,286 15 3,438
Improved recovery - - 23 13 - - 36 - - - 36
Purchases 8 - - - - - 8 2 - - 10
Sales (11) - (2) - - - (13) (13) - - (26)
Extensions/discoveries 595 113 - 9 3 - 720 238 - - 958
Production (144) (22) (37) (138) (146) (11) (498) (65) (113) (22) (698)
December 31, 2018 3,204 529 166 604 3,357 105 7,965 1,404 4,185 466 14,020
Attributable to noncontrolling interests 44 4 962 142
Proportional interest in proved
reserves of equity companies
January 1, 2018 245 - 15 6 1,097 - 1,363 364 - - 1,727
Revisions 28 - 1 - 6 - 35 1 - - 36
Improved recovery - - - - - - - - - - -
Purchases - - - - - - - - - - -
Sales - - - - - - - - - - -
Extensions/discoveries 1 - - - - - 1 - - - 1
Production (20) - (1) - (83) - (104) (23) - - (127)
December 31, 2018 254 - 15 6 1,020 - 1,295 342 - - 1,637
Total liquids proved reserves
at December 31, 2018 3,458 529 181 610 4,377 105 9,260 1,746 4,185 466 15,657
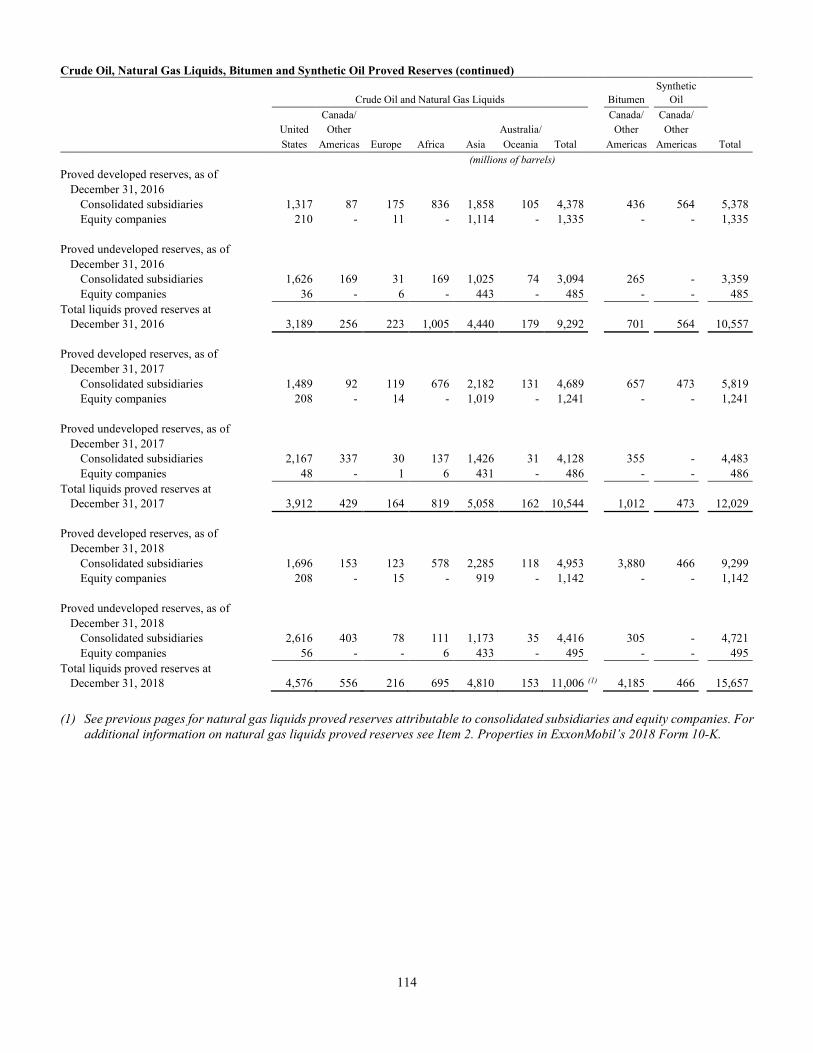
114
Crude Oil, Natural Gas Liquids, Bitumen and Synthetic Oil Proved Reserves (continued)
Synthetic
Crude Oil and Natural Gas Liquids Bitumen Oil
Canada/ Canada/ Canada/
United Other Australia/ Other Other
States Americas Europe Africa Asia Oceania Total Americas Americas Total
(millions of barrels)
Proved developed reserves, as of
December 31, 2016
Consolidated subsidiaries 1,317 87 175 836 1,858 105 4,378 436 564 5,378
Equity companies 210 - 11 - 1,114 - 1,335 - - 1,335
Proved undeveloped reserves, as of
December 31, 2016
Consolidated subsidiaries 1,626 169 31 169 1,025 74 3,094 265 - 3,359
Equity companies 36 - 6 - 443 - 485 - - 485
Total liquids proved reserves at
December 31, 2016 3,189 256 223 1,005 4,440 179 9,292 701 564 10,557
Proved developed reserves, as of
December 31, 2017
Consolidated subsidiaries 1,489 92 119 676 2,182 131 4,689 657 473 5,819
Equity companies 208 - 14 - 1,019 - 1,241 - - 1,241
Proved undeveloped reserves, as of
December 31, 2017
Consolidated subsidiaries 2,167 337 30 137 1,426 31 4,128 355 - 4,483
Equity companies 48 - 1 6 431 - 486 - - 486
Total liquids proved reserves at
December 31, 2017 3,912 429 164 819 5,058 162 10,544 1,012 473 12,029
Proved developed reserves, as of
December 31, 2018
Consolidated subsidiaries 1,696 153 123 578 2,285 118 4,953 3,880 466 9,299
Equity companies 208 - 15 - 919 - 1,142 - - 1,142
Proved undeveloped reserves, as of
December 31, 2018
Consolidated subsidiaries 2,616 403 78 111 1,173 35 4,416 305 - 4,721
Equity companies 56 - - 6 433 - 495 - - 495
Total liquids proved reserves at
December 31, 2018 4,576 556 216 695 4,810 153 11,006 (1) 4,185 466 15,657
(1) See previous pages for natural gas liquids proved reserves attributable to consolidated subsidiaries and equity companies. For
additional information on natural gas liquids proved reserves see Item 2. Properties in ExxonMobil’s 2018 Form 10-K.
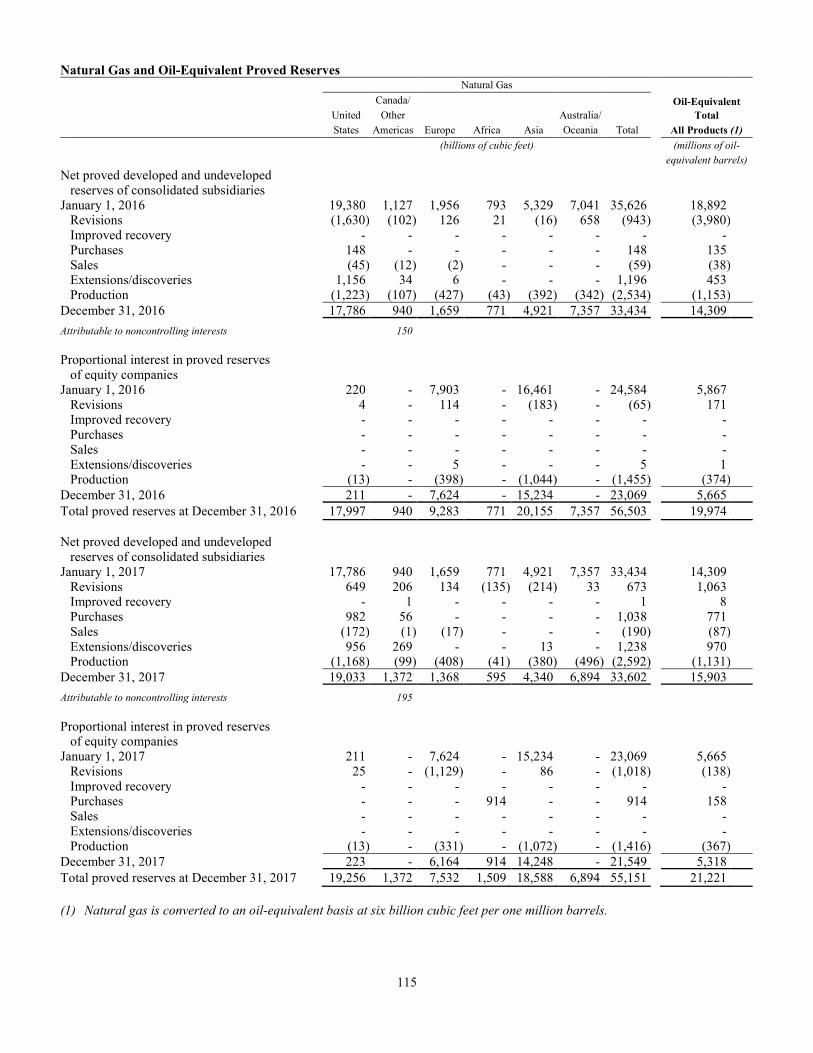
115
Natural Gas and Oil-Equivalent Proved Reserves Natural Gas
Canada/ Oil-Equivalent
United Other Australia/ Total
States Americas Europe Africa Asia Oceania Total All Products (1)
(billions of cubic feet) (millions of oil-
equivalent barrels)
Net proved developed and undeveloped reserves of consolidated subsidiaries January 1, 2016 19,380 1,127 1,956 793 5,329 7,041 35,626 18,892 Revisions (1,630) (102) 126 21 (16) 658 (943) (3,980) Improved recovery - - - - - - - - Purchases 148 - - - - - 148 135 Sales (45) (12) (2) - - - (59) (38) Extensions/discoveries 1,156 34 6 - - - 1,196 453 Production (1,223) (107) (427) (43) (392) (342) (2,534) (1,153)
December 31, 2016 17,786 940 1,659 771 4,921 7,357 33,434 14,309
Attributable to noncontrolling interests 150
Proportional interest in proved reserves of equity companies January 1, 2016 220 - 7,903 - 16,461 - 24,584 5,867 Revisions 4 - 114 - (183) - (65) 171 Improved recovery - - - - - - - - Purchases - - - - - - - - Sales - - - - - - - - Extensions/discoveries - - 5 - - - 5 1 Production (13) - (398) - (1,044) - (1,455) (374)
December 31, 2016 211 - 7,624 - 15,234 - 23,069 5,665
Total proved reserves at December 31, 2016 17,997 940 9,283 771 20,155 7,357 56,503 19,974
Net proved developed and undeveloped reserves of consolidated subsidiaries January 1, 2017 17,786 940 1,659 771 4,921 7,357 33,434 14,309 Revisions 649 206 134 (135) (214) 33 673 1,063 Improved recovery - 1 - - - - 1 8 Purchases 982 56 - - - - 1,038 771 Sales (172) (1) (17) - - - (190) (87) Extensions/discoveries 956 269 - - 13 - 1,238 970 Production (1,168) (99) (408) (41) (380) (496) (2,592) (1,131)
December 31, 2017 19,033 1,372 1,368 595 4,340 6,894 33,602 15,903
Attributable to noncontrolling interests 195
Proportional interest in proved reserves of equity companies January 1, 2017 211 - 7,624 - 15,234 - 23,069 5,665 Revisions 25 - (1,129) - 86 - (1,018) (138) Improved recovery - - - - - - - - Purchases - - - 914 - - 914 158 Sales - - - - - - - - Extensions/discoveries - - - - - - - - Production (13) - (331) - (1,072) - (1,416) (367)
December 31, 2017 223 - 6,164 914 14,248 - 21,549 5,318
Total proved reserves at December 31, 2017 19,256 1,372 7,532 1,509 18,588 6,894 55,151 21,221
(1) Natural gas is converted to an oil-equivalent basis at six billion cubic feet per one million barrels.
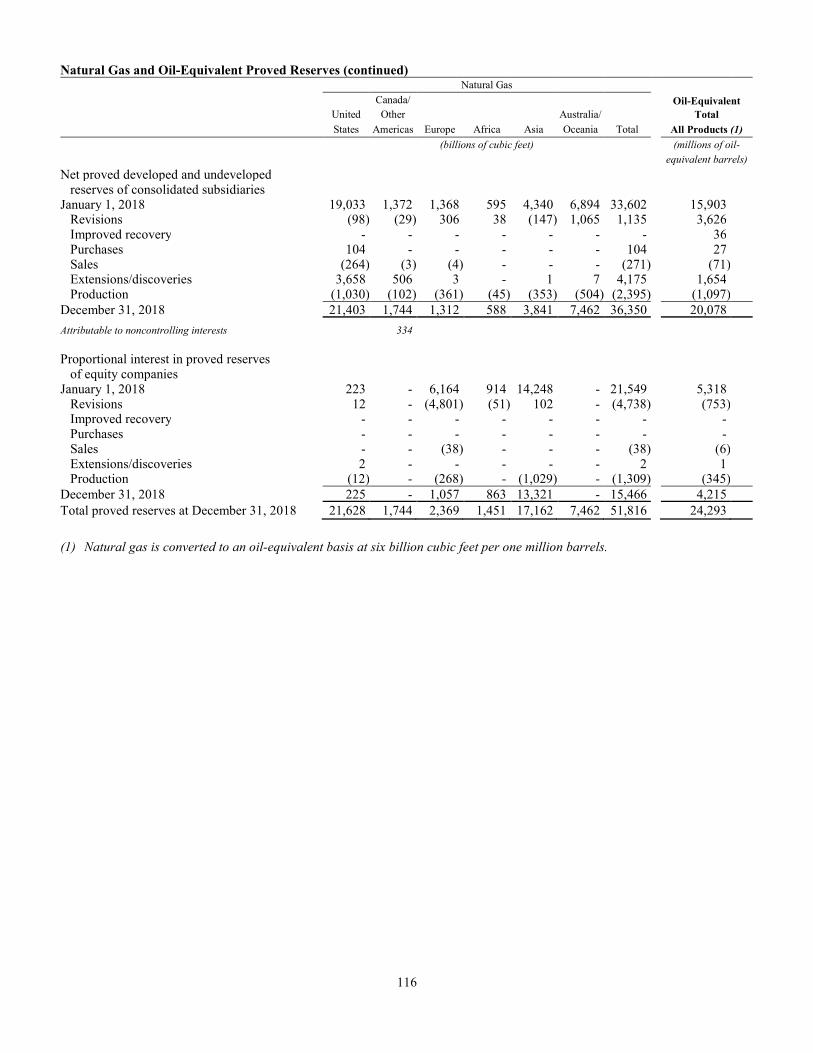
116
Natural Gas and Oil-Equivalent Proved Reserves (continued) Natural Gas
Canada/ Oil-Equivalent
United Other Australia/ Total
States Americas Europe Africa Asia Oceania Total All Products (1)
(billions of cubic feet) (millions of oil-
equivalent barrels)
Net proved developed and undeveloped reserves of consolidated subsidiaries January 1, 2018 19,033 1,372 1,368 595 4,340 6,894 33,602 15,903 Revisions (98) (29) 306 38 (147) 1,065 1,135 3,626 Improved recovery - - - - - - - 36 Purchases 104 - - - - - 104 27 Sales (264) (3) (4) - - - (271) (71) Extensions/discoveries 3,658 506 3 - 1 7 4,175 1,654 Production (1,030) (102) (361) (45) (353) (504) (2,395) (1,097)
December 31, 2018 21,403 1,744 1,312 588 3,841 7,462 36,350 20,078
Attributable to noncontrolling interests 334
Proportional interest in proved reserves of equity companies January 1, 2018 223 - 6,164 914 14,248 - 21,549 5,318 Revisions 12 - (4,801) (51) 102 - (4,738) (753) Improved recovery - - - - - - - - Purchases - - - - - - - - Sales - - (38) - - - (38) (6) Extensions/discoveries 2 - - - - - 2 1 Production (12) - (268) - (1,029) - (1,309) (345)
December 31, 2018 225 - 1,057 863 13,321 - 15,466 4,215
Total proved reserves at December 31, 2018 21,628 1,744 2,369 1,451 17,162 7,462 51,816 24,293
(1) Natural gas is converted to an oil-equivalent basis at six billion cubic feet per one million barrels.
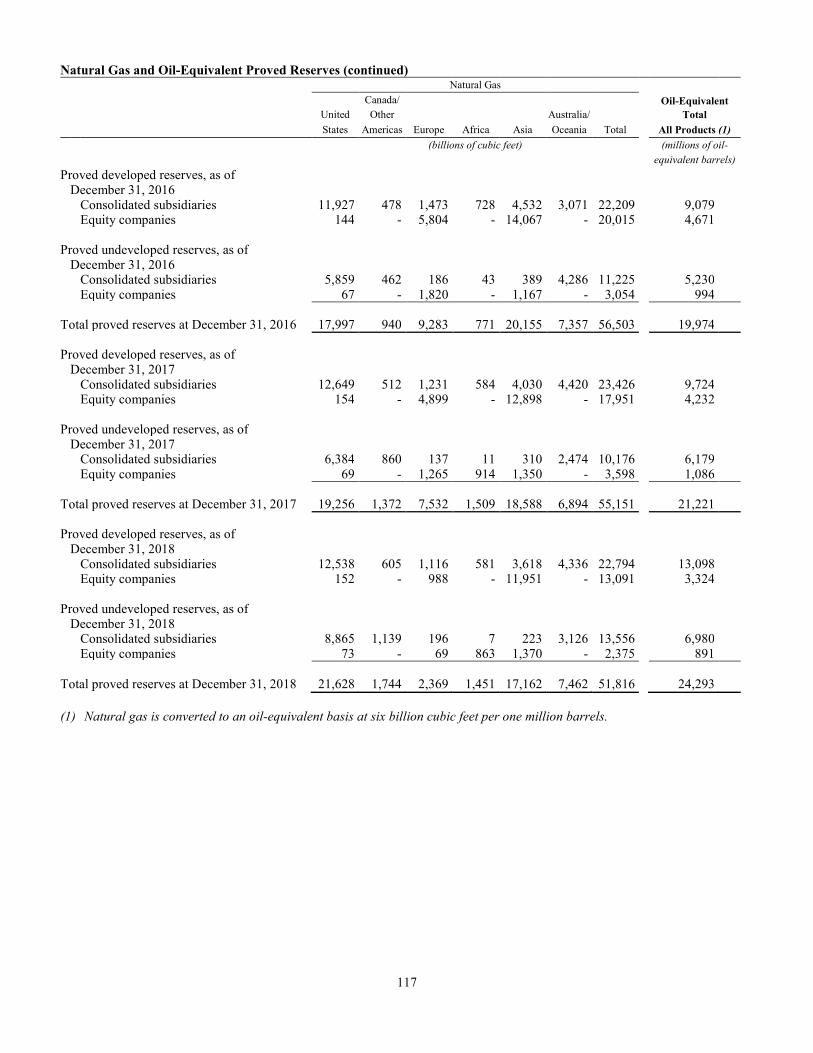
117
Natural Gas and Oil-Equivalent Proved Reserves (continued)
Natural Gas
Canada/ Oil-Equivalent
United Other Australia/ Total
States Americas Europe Africa Asia Oceania Total All Products (1)
(billions of cubic feet) (millions of oil-
equivalent barrels)
Proved developed reserves, as of December 31, 2016 Consolidated subsidiaries 11,927 478 1,473 728 4,532 3,071 22,209 9,079 Equity companies 144 - 5,804 - 14,067 - 20,015 4,671 Proved undeveloped reserves, as of December 31, 2016 Consolidated subsidiaries 5,859 462 186 43 389 4,286 11,225 5,230 Equity companies 67 - 1,820 - 1,167 - 3,054 994
Total proved reserves at December 31, 2016 17,997 940 9,283 771 20,155 7,357 56,503 19,974
Proved developed reserves, as of December 31, 2017 Consolidated subsidiaries 12,649 512 1,231 584 4,030 4,420 23,426 9,724 Equity companies 154 - 4,899 - 12,898 - 17,951 4,232 Proved undeveloped reserves, as of December 31, 2017 Consolidated subsidiaries 6,384 860 137 11 310 2,474 10,176 6,179 Equity companies 69 - 1,265 914 1,350 - 3,598 1,086
Total proved reserves at December 31, 2017 19,256 1,372 7,532 1,509 18,588 6,894 55,151 21,221
Proved developed reserves, as of December 31, 2018 Consolidated subsidiaries 12,538 605 1,116 581 3,618 4,336 22,794 13,098 Equity companies 152 - 988 - 11,951 - 13,091 3,324 Proved undeveloped reserves, as of December 31, 2018 Consolidated subsidiaries 8,865 1,139 196 7 223 3,126 13,556 6,980 Equity companies 73 - 69 863 1,370 - 2,375 891
Total proved reserves at December 31, 2018 21,628 1,744 2,369 1,451 17,162 7,462 51,816 24,293
(1) Natural gas is converted to an oil-equivalent basis at six billion cubic feet per one million barrels.
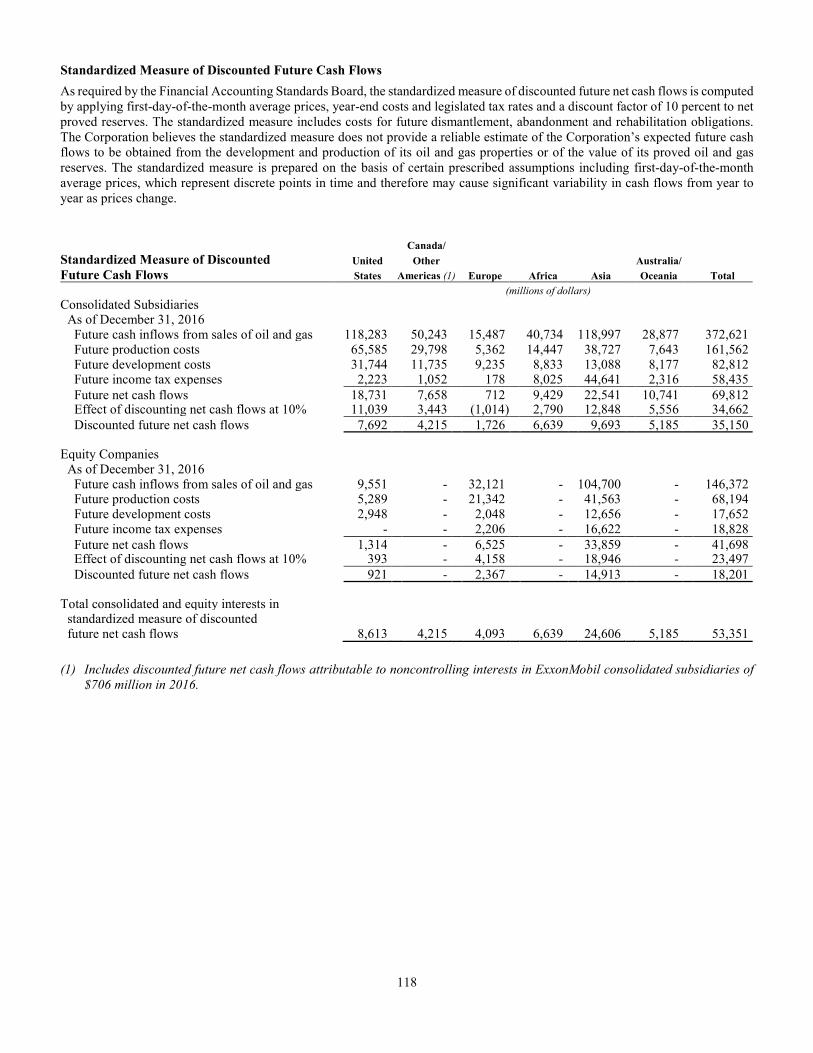
118
Standardized Measure of Discounted Future Cash Flows
As required by the Financial Accounting Standards Board, the standardized measure of discounted future net cash flows is computed by applying first-day-of-the-month average prices, year-end costs and legislated tax rates and a discount factor of 10 percent to net proved reserves. The standardized measure includes costs for future dismantlement, abandonment and rehabilitation obligations. The Corporation believes the standardized measure does not provide a reliable estimate of the Corporation’s expected future cash flows to be obtained from the development and production of its oil and gas properties or of the value of its proved oil and gas reserves. The standardized measure is prepared on the basis of certain prescribed assumptions including first-day-of-the-month average prices, which represent discrete points in time and therefore may cause significant variability in cash flows from year to year as prices change. Canada/
Standardized Measure of Discounted United Other Australia/
Future Cash Flows States Americas (1) Europe Africa Asia Oceania Total
(millions of dollars)
Consolidated Subsidiaries As of December 31, 2016 Future cash inflows from sales of oil and gas 118,283 50,243 15,487 40,734 118,997 28,877 372,621 Future production costs 65,585 29,798 5,362 14,447 38,727 7,643 161,562 Future development costs 31,744 11,735 9,235 8,833 13,088 8,177 82,812 Future income tax expenses 2,223 1,052 178 8,025 44,641 2,316 58,435
Future net cash flows 18,731 7,658 712 9,429 22,541 10,741 69,812 Effect of discounting net cash flows at 10% 11,039 3,443 (1,014) 2,790 12,848 5,556 34,662
Discounted future net cash flows 7,692 4,215 1,726 6,639 9,693 5,185 35,150
Equity Companies As of December 31, 2016 Future cash inflows from sales of oil and gas 9,551 - 32,121 - 104,700 - 146,372 Future production costs 5,289 - 21,342 - 41,563 - 68,194 Future development costs 2,948 - 2,048 - 12,656 - 17,652 Future income tax expenses - - 2,206 - 16,622 - 18,828
Future net cash flows 1,314 - 6,525 - 33,859 - 41,698 Effect of discounting net cash flows at 10% 393 - 4,158 - 18,946 - 23,497
Discounted future net cash flows 921 - 2,367 - 14,913 - 18,201
Total consolidated and equity interests in standardized measure of discounted future net cash flows 8,613 4,215 4,093 6,639 24,606 5,185 53,351
(1) Includes discounted future net cash flows attributable to noncontrolling interests in ExxonMobil consolidated subsidiaries of
$706 million in 2016.
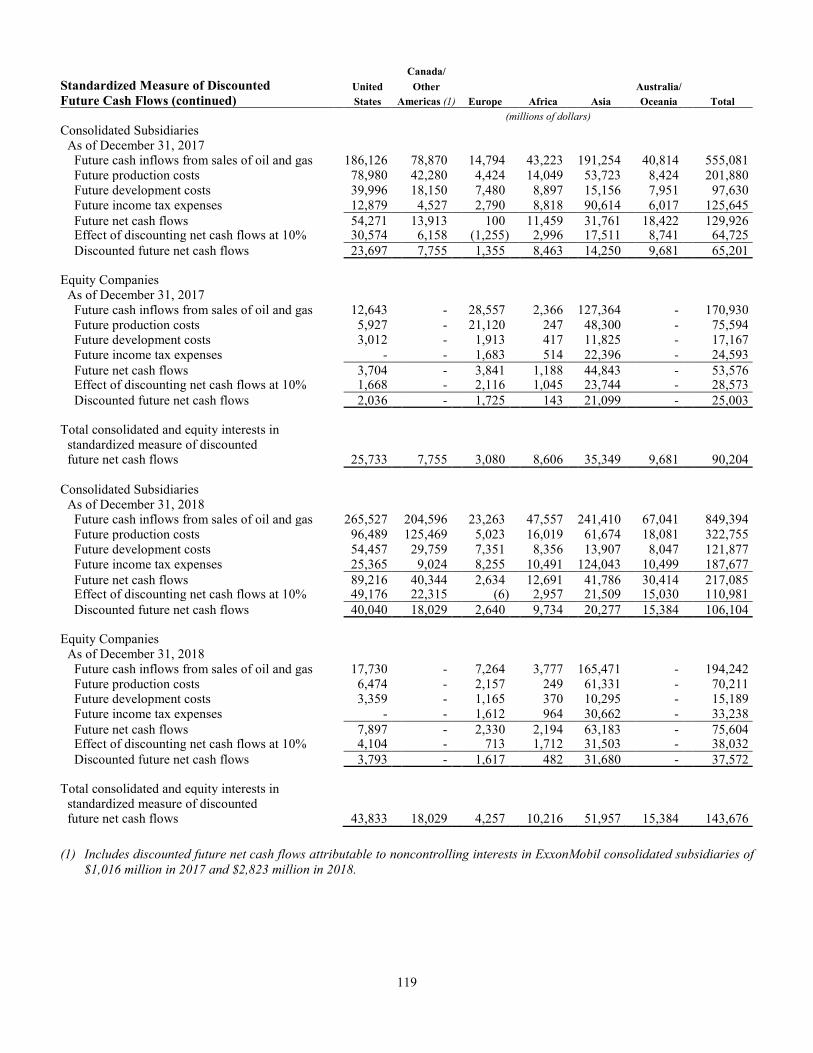
119
Canada/
Standardized Measure of Discounted United Other Australia/
Future Cash Flows (continued) States Americas (1) Europe Africa Asia Oceania Total
(millions of dollars)
Consolidated Subsidiaries As of December 31, 2017 Future cash inflows from sales of oil and gas 186,126 78,870 14,794 43,223 191,254 40,814 555,081 Future production costs 78,980 42,280 4,424 14,049 53,723 8,424 201,880 Future development costs 39,996 18,150 7,480 8,897 15,156 7,951 97,630 Future income tax expenses 12,879 4,527 2,790 8,818 90,614 6,017 125,645
Future net cash flows 54,271 13,913 100 11,459 31,761 18,422 129,926 Effect of discounting net cash flows at 10% 30,574 6,158 (1,255) 2,996 17,511 8,741 64,725
Discounted future net cash flows 23,697 7,755 1,355 8,463 14,250 9,681 65,201
Equity Companies As of December 31, 2017 Future cash inflows from sales of oil and gas 12,643 - 28,557 2,366 127,364 - 170,930 Future production costs 5,927 - 21,120 247 48,300 - 75,594 Future development costs 3,012 - 1,913 417 11,825 - 17,167 Future income tax expenses - - 1,683 514 22,396 - 24,593
Future net cash flows 3,704 - 3,841 1,188 44,843 - 53,576 Effect of discounting net cash flows at 10% 1,668 - 2,116 1,045 23,744 - 28,573
Discounted future net cash flows 2,036 - 1,725 143 21,099 - 25,003
Total consolidated and equity interests in standardized measure of discounted future net cash flows 25,733 7,755 3,080 8,606 35,349 9,681 90,204
Consolidated Subsidiaries As of December 31, 2018 Future cash inflows from sales of oil and gas 265,527 204,596 23,263 47,557 241,410 67,041 849,394 Future production costs 96,489 125,469 5,023 16,019 61,674 18,081 322,755 Future development costs 54,457 29,759 7,351 8,356 13,907 8,047 121,877 Future income tax expenses 25,365 9,024 8,255 10,491 124,043 10,499 187,677
Future net cash flows 89,216 40,344 2,634 12,691 41,786 30,414 217,085 Effect of discounting net cash flows at 10% 49,176 22,315 (6) 2,957 21,509 15,030 110,981
Discounted future net cash flows 40,040 18,029 2,640 9,734 20,277 15,384 106,104
Equity Companies As of December 31, 2018 Future cash inflows from sales of oil and gas 17,730 - 7,264 3,777 165,471 - 194,242 Future production costs 6,474 - 2,157 249 61,331 - 70,211 Future development costs 3,359 - 1,165 370 10,295 - 15,189 Future income tax expenses - - 1,612 964 30,662 - 33,238
Future net cash flows 7,897 - 2,330 2,194 63,183 - 75,604 Effect of discounting net cash flows at 10% 4,104 - 713 1,712 31,503 - 38,032
Discounted future net cash flows 3,793 - 1,617 482 31,680 - 37,572
Total consolidated and equity interests in standardized measure of discounted future net cash flows 43,833 18,029 4,257 10,216 51,957 15,384 143,676
(1) Includes discounted future net cash flows attributable to noncontrolling interests in ExxonMobil consolidated subsidiaries of
$1,016 million in 2017 and $2,823 million in 2018.
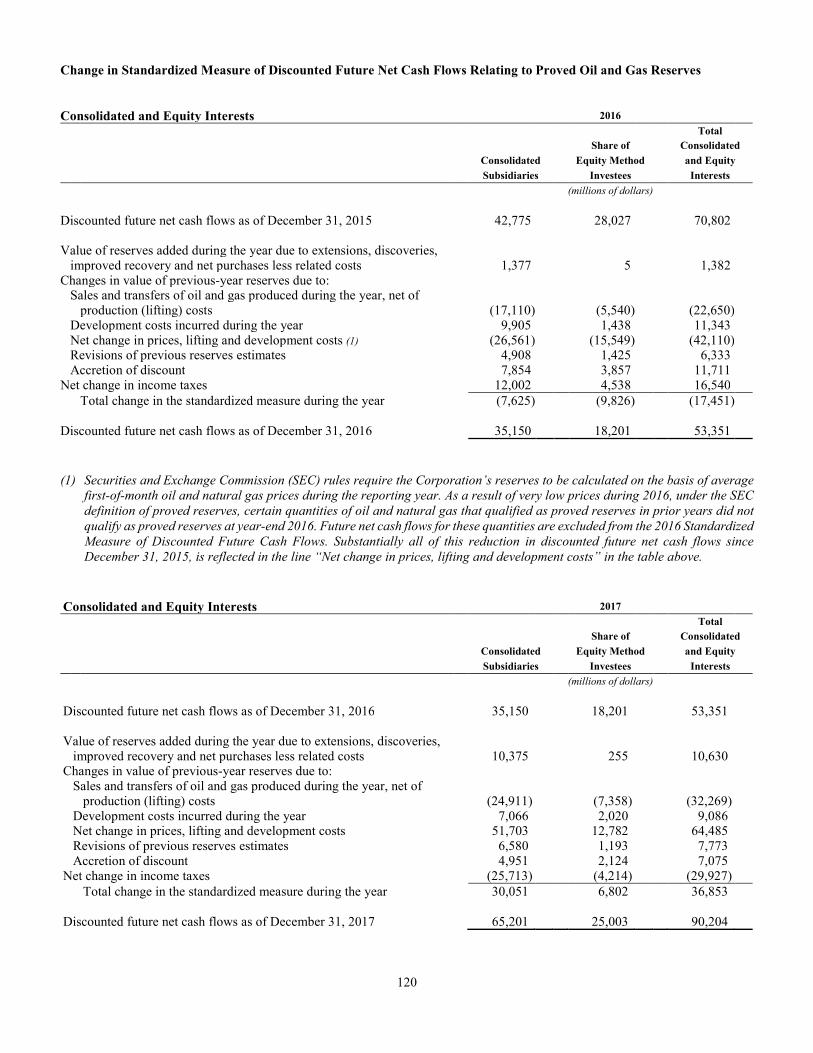
120
Change in Standardized Measure of Discounted Future Net Cash Flows Relating to Proved Oil and Gas Reserves
Consolidated and Equity Interests 2016
Total
Share of Consolidated
Consolidated Equity Method and Equity
Subsidiaries Investees Interests
(millions of dollars)
Discounted future net cash flows as of December 31, 2015 42,775 28,027 70,802 Value of reserves added during the year due to extensions, discoveries, improved recovery and net purchases less related costs 1,377 5 1,382 Changes in value of previous-year reserves due to: Sales and transfers of oil and gas produced during the year, net of production (lifting) costs (17,110) (5,540) (22,650) Development costs incurred during the year 9,905 1,438 11,343 Net change in prices, lifting and development costs (1) (26,561) (15,549) (42,110) Revisions of previous reserves estimates 4,908 1,425 6,333 Accretion of discount 7,854 3,857 11,711 Net change in income taxes 12,002 4,538 16,540
Total change in the standardized measure during the year (7,625) (9,826) (17,451) Discounted future net cash flows as of December 31, 2016 35,150 18,201 53,351
(1) Securities and Exchange Commission (SEC) rules require the Corporation’s reserves to be calculated on the basis of average
first-of-month oil and natural gas prices during the reporting year. As a result of very low prices during 2016, under the SEC
definition of proved reserves, certain quantities of oil and natural gas that qualified as proved reserves in prior years did not
qualify as proved reserves at year-end 2016. Future net cash flows for these quantities are excluded from the 2016 Standardized
Measure of Discounted Future Cash Flows. Substantially all of this reduction in discounted future net cash flows since
December 31, 2015, is reflected in the line “Net change in prices, lifting and development costs” in the table above.
Consolidated and Equity Interests 2017
Total
Share of Consolidated
Consolidated Equity Method and Equity
Subsidiaries Investees Interests
(millions of dollars)
Discounted future net cash flows as of December 31, 2016 35,150 18,201 53,351 Value of reserves added during the year due to extensions, discoveries, improved recovery and net purchases less related costs 10,375 255 10,630 Changes in value of previous-year reserves due to: Sales and transfers of oil and gas produced during the year, net of production (lifting) costs (24,911) (7,358) (32,269) Development costs incurred during the year 7,066 2,020 9,086 Net change in prices, lifting and development costs 51,703 12,782 64,485 Revisions of previous reserves estimates 6,580 1,193 7,773 Accretion of discount 4,951 2,124 7,075 Net change in income taxes (25,713) (4,214) (29,927)
Total change in the standardized measure during the year 30,051 6,802 36,853 Discounted future net cash flows as of December 31, 2017 65,201 25,003 90,204
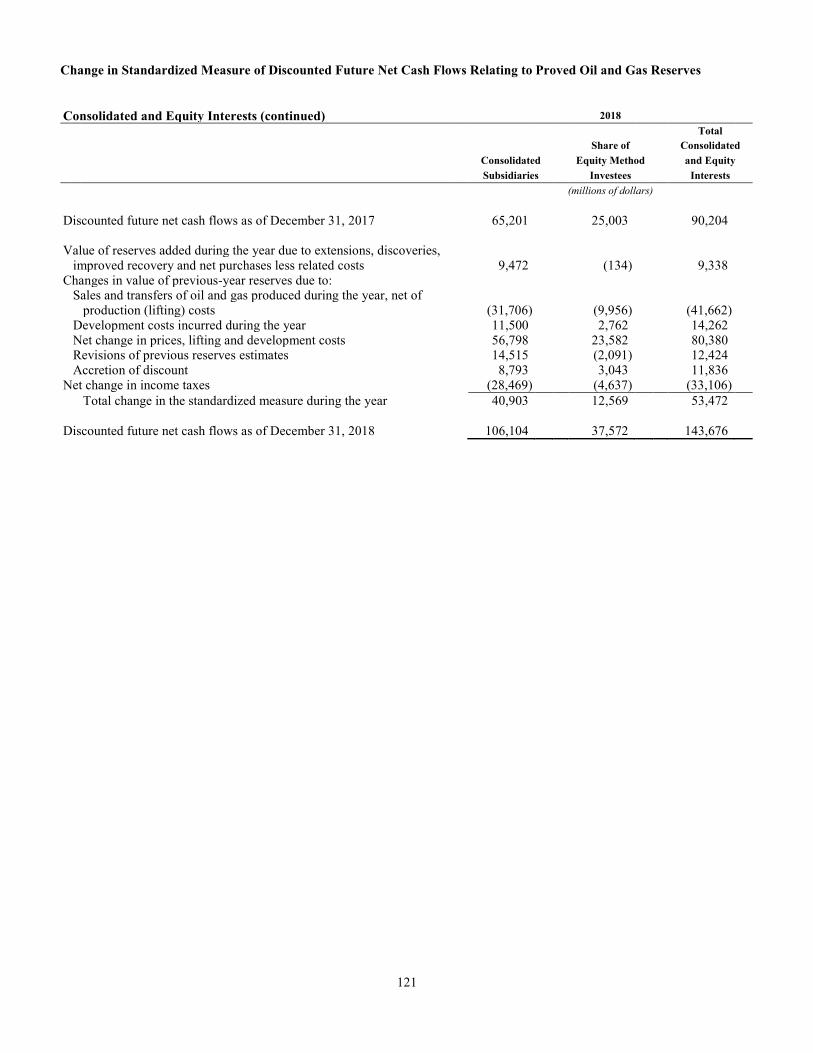
121
Change in Standardized Measure of Discounted Future Net Cash Flows Relating to Proved Oil and Gas Reserves
Consolidated and Equity Interests (continued) 2018
Total
Share of Consolidated
Consolidated Equity Method and Equity
Subsidiaries Investees Interests
(millions of dollars)
Discounted future net cash flows as of December 31, 2017 65,201 25,003 90,204 Value of reserves added during the year due to extensions, discoveries, improved recovery and net purchases less related costs 9,472 (134) 9,338 Changes in value of previous-year reserves due to: Sales and transfers of oil and gas produced during the year, net of production (lifting) costs (31,706) (9,956) (41,662) Development costs incurred during the year 11,500 2,762 14,262 Net change in prices, lifting and development costs 56,798 23,582 80,380 Revisions of previous reserves estimates 14,515 (2,091) 12,424 Accretion of discount 8,793 3,043 11,836 Net change in income taxes (28,469) (4,637) (33,106)
Total change in the standardized measure during the year 40,903 12,569 53,472 Discounted future net cash flows as of December 31, 2018 106,104 37,572 143,676
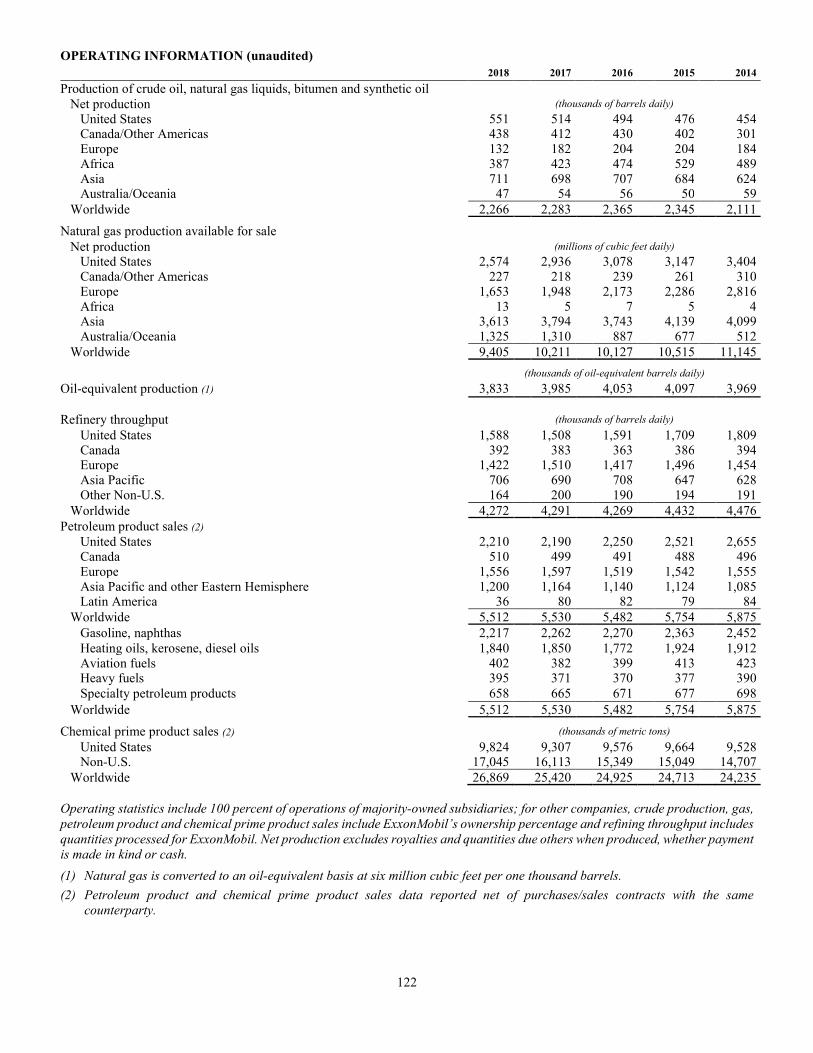
OPERATING INFORMATION (unaudited)
122
2018 2017 2016 2015 2014
Production of crude oil, natural gas liquids, bitumen and synthetic oil
Net production (thousands of barrels daily)
United States 551 514 494 476 454 Canada/Other Americas 438 412 430 402 301 Europe 132 182 204 204 184 Africa 387 423 474 529 489 Asia 711 698 707 684 624 Australia/Oceania 47 54 56 50 59
Worldwide 2,266 2,283 2,365 2,345 2,111
Natural gas production available for sale
Net production (millions of cubic feet daily)
United States 2,574 2,936 3,078 3,147 3,404 Canada/Other Americas 227 218 239 261 310 Europe 1,653 1,948 2,173 2,286 2,816 Africa 13 5 7 5 4 Asia 3,613 3,794 3,743 4,139 4,099 Australia/Oceania 1,325 1,310 887 677 512
Worldwide 9,405 10,211 10,127 10,515 11,145
(thousands of oil-equivalent barrels daily)
Oil-equivalent production (1) 3,833 3,985 4,053 4,097 3,969
Refinery throughput (thousands of barrels daily)
United States 1,588 1,508 1,591 1,709 1,809 Canada 392 383 363 386 394 Europe 1,422 1,510 1,417 1,496 1,454 Asia Pacific 706 690 708 647 628 Other Non-U.S. 164 200 190 194 191
Worldwide 4,272 4,291 4,269 4,432 4,476
Petroleum product sales (2) United States 2,210 2,190 2,250 2,521 2,655 Canada 510 499 491 488 496 Europe 1,556 1,597 1,519 1,542 1,555 Asia Pacific and other Eastern Hemisphere 1,200 1,164 1,140 1,124 1,085 Latin America 36 80 82 79 84
Worldwide 5,512 5,530 5,482 5,754 5,875
Gasoline, naphthas 2,217 2,262 2,270 2,363 2,452 Heating oils, kerosene, diesel oils 1,840 1,850 1,772 1,924 1,912 Aviation fuels 402 382 399 413 423 Heavy fuels 395 371 370 377 390
Specialty petroleum products 658 665 671 677 698
Worldwide 5,512 5,530 5,482 5,754 5,875
Chemical prime product sales (2) (thousands of metric tons)
United States 9,824 9,307 9,576 9,664 9,528 Non-U.S. 17,045 16,113 15,349 15,049 14,707
Worldwide 26,869 25,420 24,925 24,713 24,235
Operating statistics include 100 percent of operations of majority-owned subsidiaries; for other companies, crude production, gas,
petroleum product and chemical prime product sales include ExxonMobil’s ownership percentage and refining throughput includes
quantities processed for ExxonMobil. Net production excludes royalties and quantities due others when produced, whether payment
is made in kind or cash.
(1) Natural gas is converted to an oil-equivalent basis at six million cubic feet per one thousand barrels.
(2) Petroleum product and chemical prime product sales data reported net of purchases/sales contracts with the same
counterparty.
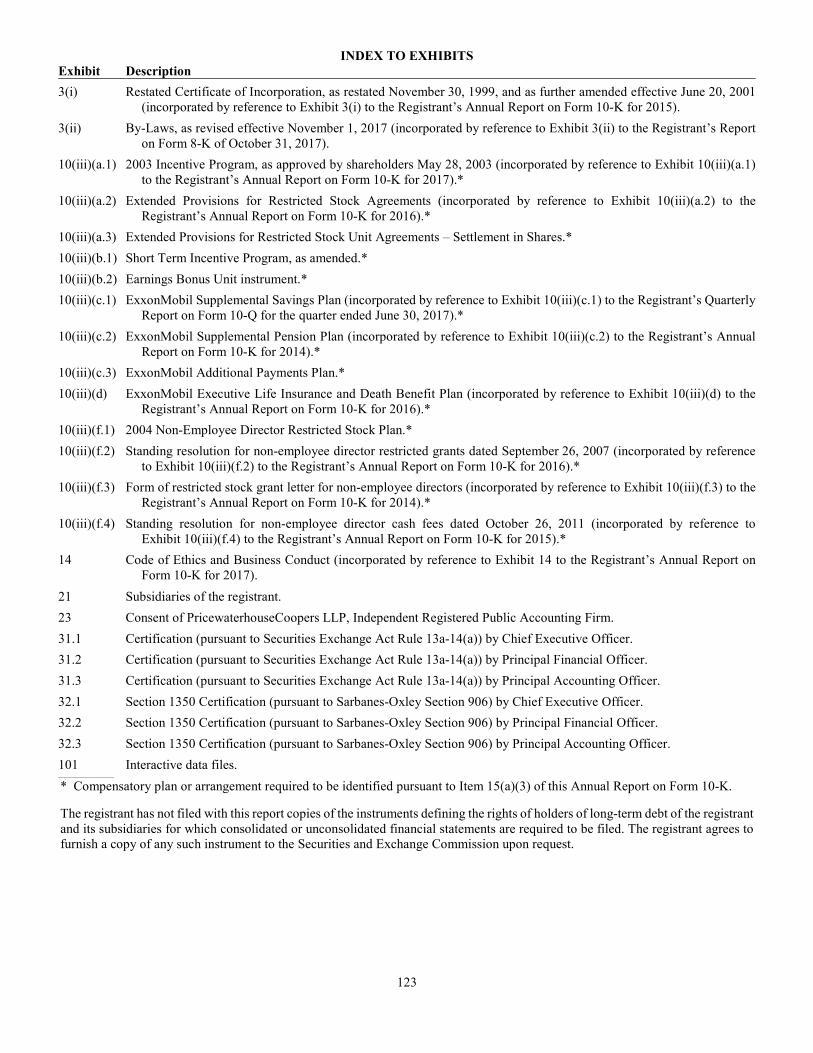
INDEX TO EXHIBITS
123
Exhibit Description
3(i) Restated Certificate of Incorporation, as restated November 30, 1999, and as further amended effective June 20, 2001(incorporated by reference to Exhibit 3(i) to the Registrant’s Annual Report on Form 10-K for 2015).
3(ii) By-Laws, as revised effective November 1, 2017 (incorporated by reference to Exhibit 3(ii) to the Registrant’s Reporton Form 8-K of October 31, 2017).
10(iii)(a.1) 2003 Incentive Program, as approved by shareholders May 28, 2003 (incorporated by reference to Exhibit 10(iii)(a.1)to the Registrant’s Annual Report on Form 10-K for 2017).*
10(iii)(a.2) Extended Provisions for Restricted Stock Agreements (incorporated by reference to Exhibit 10(iii)(a.2) to theRegistrant’s Annual Report on Form 10-K for 2016).*
10(iii)(a.3) Extended Provisions for Restricted Stock Unit Agreements – Settlement in Shares.*
10(iii)(b.1) Short Term Incentive Program, as amended.*
10(iii)(b.2) Earnings Bonus Unit instrument.*
10(iii)(c.1) ExxonMobil Supplemental Savings Plan (incorporated by reference to Exhibit 10(iii)(c.1) to the Registrant’s QuarterlyReport on Form 10-Q for the quarter ended June 30, 2017).*
10(iii)(c.2) ExxonMobil Supplemental Pension Plan (incorporated by reference to Exhibit 10(iii)(c.2) to the Registrant’s AnnualReport on Form 10-K for 2014).*
10(iii)(c.3) ExxonMobil Additional Payments Plan.*
10(iii)(d) ExxonMobil Executive Life Insurance and Death Benefit Plan (incorporated by reference to Exhibit 10(iii)(d) to theRegistrant’s Annual Report on Form 10-K for 2016).*
10(iii)(f.1) 2004 Non-Employee Director Restricted Stock Plan.*
10(iii)(f.2) Standing resolution for non-employee director restricted grants dated September 26, 2007 (incorporated by referenceto Exhibit 10(iii)(f.2) to the Registrant’s Annual Report on Form 10-K for 2016).*
10(iii)(f.3) Form of restricted stock grant letter for non-employee directors (incorporated by reference to Exhibit 10(iii)(f.3) to theRegistrant’s Annual Report on Form 10-K for 2014).*
10(iii)(f.4) Standing resolution for non-employee director cash fees dated October 26, 2011 (incorporated by reference toExhibit 10(iii)(f.4) to the Registrant’s Annual Report on Form 10-K for 2015).*
14 Code of Ethics and Business Conduct (incorporated by reference to Exhibit 14 to the Registrant’s Annual Report onForm 10-K for 2017).
21 Subsidiaries of the registrant.
23 Consent of PricewaterhouseCoopers LLP, Independent Registered Public Accounting Firm.
31.1 Certification (pursuant to Securities Exchange Act Rule 13a-14(a)) by Chief Executive Officer.
31.2 Certification (pursuant to Securities Exchange Act Rule 13a-14(a)) by Principal Financial Officer.
31.3 Certification (pursuant to Securities Exchange Act Rule 13a-14(a)) by Principal Accounting Officer.
32.1 Section 1350 Certification (pursuant to Sarbanes-Oxley Section 906) by Chief Executive Officer.
32.2 Section 1350 Certification (pursuant to Sarbanes-Oxley Section 906) by Principal Financial Officer.
32.3 Section 1350 Certification (pursuant to Sarbanes-Oxley Section 906) by Principal Accounting Officer.
101 Interactive data files. _____________________
* Compensatory plan or arrangement required to be identified pursuant to Item 15(a)(3) of this Annual Report on Form 10-K.
The registrant has not filed with this report copies of the instruments defining the rights of holders of long-term debt of the registrant and its subsidiaries for which consolidated or unconsolidated financial statements are required to be filed. The registrant agrees to furnish a copy of any such instrument to the Securities and Exchange Commission upon request.
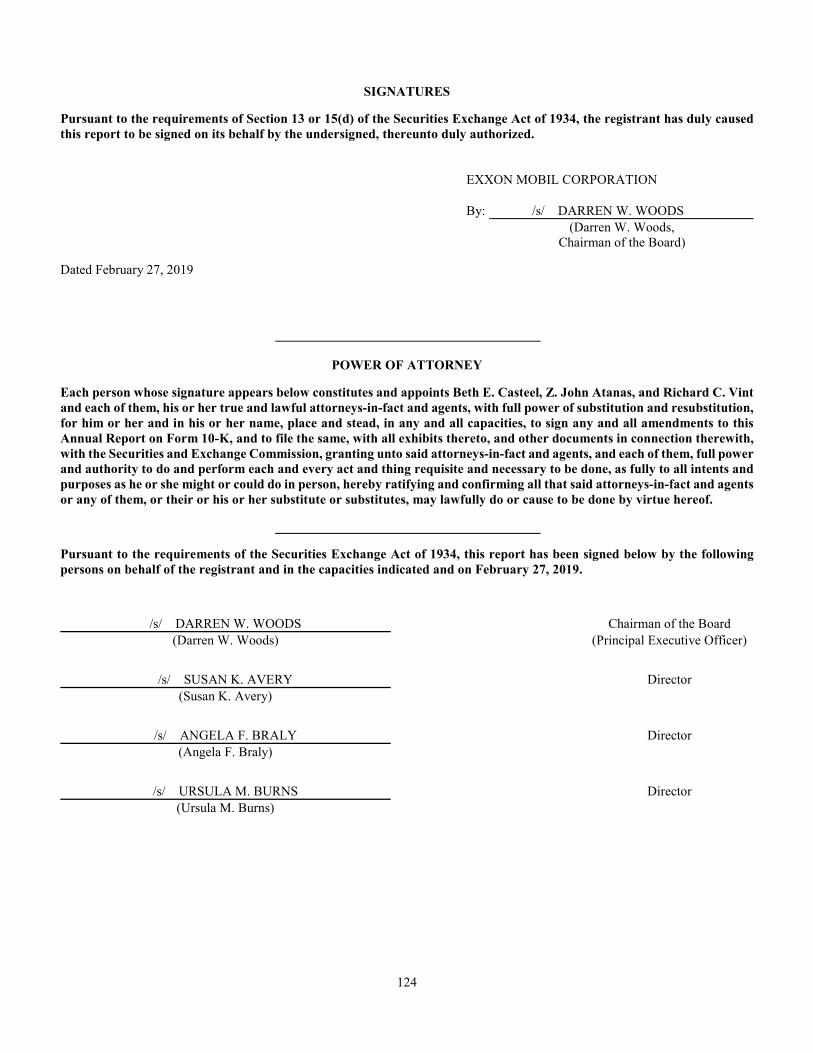
124
SIGNATURES
Pursuant to the requirements of Section 13 or 15(d) of the Securities Exchange Act of 1934, the registrant has duly caused
this report to be signed on its behalf by the undersigned, thereunto duly authorized. EXXON MOBIL CORPORATION
By: /s/ DARREN W. WOODS
(Darren W. Woods, Chairman of the Board)
Dated February 27, 2019
POWER OF ATTORNEY
Each person whose signature appears below constitutes and appoints Beth E. Casteel, Z. John Atanas, and Richard C. Vint
and each of them, his or her true and lawful attorneys-in-fact and agents, with full power of substitution and resubstitution,
for him or her and in his or her name, place and stead, in any and all capacities, to sign any and all amendments to this
Annual Report on Form 10-K, and to file the same, with all exhibits thereto, and other documents in connection therewith,
with the Securities and Exchange Commission, granting unto said attorneys-in-fact and agents, and each of them, full power
and authority to do and perform each and every act and thing requisite and necessary to be done, as fully to all intents and
purposes as he or she might or could do in person, hereby ratifying and confirming all that said attorneys-in-fact and agents
or any of them, or their or his or her substitute or substitutes, may lawfully do or cause to be done by virtue hereof.
Pursuant to the requirements of the Securities Exchange Act of 1934, this report has been signed below by the following
persons on behalf of the registrant and in the capacities indicated and on February 27, 2019.
/s/ DARREN W. WOODS
Chairman of the Board
(Darren W. Woods) (Principal Executive Officer)
/s/ SUSAN K. AVERY
Director
(Susan K. Avery)
/s/ ANGELA F. BRALY
Director
(Angela F. Braly)
/s/ URSULA M. BURNS
Director
(Ursula M. Burns)
125
/s/ KENNETH C. FRAZIER Director
(Kenneth C. Frazier)
/s/ STEVEN A. KANDARIAN Director
(Steven A. Kandarian)
/s/ DOUGLAS R. OBERHELMAN Director
(Douglas R. Oberhelman)
/s/ SAMUEL J. PALMISANO Director
(Samuel J. Palmisano)
/s/ STEVEN S REINEMUND Director
(Steven S Reinemund)
/s/ WILLIAM C. WELDON Director
(William C. Weldon)
/s/ ANDREW P. SWIGER Senior Vice President
(Andrew P. Swiger) (Principal Financial Officer)
/s/ DAVID S. ROSENTHAL Vice President and Controller
(David S. Rosenthal) (Principal Accounting Officer)
EXHIBIT 31.1
Certification by Darren W. Woods
Pursuant to Securities Exchange Act Rule 13a-14(a)
I, Darren W. Woods, certify that:
1. I have reviewed this annual report on Form 10-K of Exxon Mobil Corporation;
2. Based on my knowledge, this report does not contain any untrue statement of a material fact or omit to state a material
fact necessary to make the statements made, in light of the circumstances under which such statements were made, not
misleading with respect to the period covered by this report;
3. Based on my knowledge, the financial statements, and other financial information included in this report, fairly present
in all material respects the financial condition, results of operations and cash flows of the registrant as of, and for, the
periods presented in this report;
4. The registrant’s other certifying officers and I are responsible for establishing and maintaining disclosure controls and
procedures (as defined in Exchange Act Rules 13a-15(e) and 15d-15(e)) and internal control over financial reporting (as
defined in Exchange Act Rules 13a-15(f) and 15d-15(f)) for the registrant and have:
(a) Designed such disclosure controls and procedures, or caused such disclosure controls and procedures to be designed
under our supervision, to ensure that material information relating to the registrant, including its consolidated
subsidiaries, is made known to us by others within those entities, particularly during the period in which this report
is being prepared;
(b) Designed such internal control over financial reporting, or caused such internal control over financial reporting to be
designed under our supervision, to provide reasonable assurance regarding the reliability of financial reporting and
the preparation of financial statements for external purposes in accordance with generally accepted accounting
principles;
(c) Evaluated the effectiveness of the registrant's disclosure controls and procedures and presented in this report our
conclusions about the effectiveness of the disclosure controls and procedures, as of the end of the period covered by
this report based on such evaluation; and
(d) Disclosed in this report any change in the registrant's internal control over financial reporting that occurred during
the registrant's most recent fiscal quarter (the registrant's fourth fiscal quarter in the case of an annual report) that
has materially affected, or is reasonably likely to materially affect, the registrant's internal control over financial
reporting; and
5. The registrant's other certifying officers and I have disclosed, based on our most recent evaluation of internal control
over financial reporting, to the registrant's auditors and the audit committee of the registrant's board of directors (or
persons performing the equivalent functions):
(a) All significant deficiencies and material weaknesses in the design or operation of internal control over financial
reporting which are reasonably likely to adversely affect the registrant's ability to record, process, summarize and
report financial information; and
(b) Any fraud, whether or not material, that involves management or other employees who have a significant role in the
registrant's internal control over financial reporting.
Date: February 27, 2019
/s/ DARREN W. WOODS
Darren W. Woods
Chief Executive Officer

EXHIBIT 31.2
Certification by Andrew P. Swiger
Pursuant to Securities Exchange Act Rule 13a-14(a)
I, Andrew P. Swiger, certify that:
1. I have reviewed this annual report on Form 10-K of Exxon Mobil Corporation;
2. Based on my knowledge, this report does not contain any untrue statement of a material fact or omit to state a material
fact necessary to make the statements made, in light of the circumstances under which such statements were made, not
misleading with respect to the period covered by this report;
3. Based on my knowledge, the financial statements, and other financial information included in this report, fairly present
in all material respects the financial condition, results of operations and cash flows of the registrant as of, and for, the
periods presented in this report;
4. The registrant’s other certifying officers and I are responsible for establishing and maintaining disclosure controls and
procedures (as defined in Exchange Act Rules 13a-15(e) and 15d-15(e)) and internal control over financial reporting (as
defined in Exchange Act Rules 13a-15(f) and 15d-15(f)) for the registrant and have:
(a) Designed such disclosure controls and procedures, or caused such disclosure controls and procedures to be designed
under our supervision, to ensure that material information relating to the registrant, including its consolidated
subsidiaries, is made known to us by others within those entities, particularly during the period in which this report
is being prepared;
(b) Designed such internal control over financial reporting, or caused such internal control over financial reporting to be
designed under our supervision, to provide reasonable assurance regarding the reliability of financial reporting and
the preparation of financial statements for external purposes in accordance with generally accepted accounting
principles;
(c) Evaluated the effectiveness of the registrant's disclosure controls and procedures and presented in this report our
conclusions about the effectiveness of the disclosure controls and procedures, as of the end of the period covered by
this report based on such evaluation; and
(d) Disclosed in this report any change in the registrant's internal control over financial reporting that occurred during
the registrant's most recent fiscal quarter (the registrant's fourth fiscal quarter in the case of an annual report) that
has materially affected, or is reasonably likely to materially affect, the registrant's internal control over financial
reporting; and
5. The registrant's other certifying officers and I have disclosed, based on our most recent evaluation of internal control
over financial reporting, to the registrant's auditors and the audit committee of the registrant's board of directors (or
persons performing the equivalent functions):
(a) All significant deficiencies and material weaknesses in the design or operation of internal control over financial
reporting which are reasonably likely to adversely affect the registrant's ability to record, process, summarize and
report financial information; and
(b) Any fraud, whether or not material, that involves management or other employees who have a significant role in the
registrant's internal control over financial reporting.
Date: February 27, 2019
/s/ ANDREW P. SWIGER
Andrew P. Swiger
Senior Vice President
(Principal Financial Officer)
EXHIBIT 31.3
Certification by David S. Rosenthal
Pursuant to Securities Exchange Act Rule 13a-14(a)
I, David S. Rosenthal, certify that:
1. I have reviewed this annual report on Form 10-K of Exxon Mobil Corporation;
2. Based on my knowledge, this report does not contain any untrue statement of a material fact or omit to state a material
fact necessary to make the statements made, in light of the circumstances under which such statements were made, not
misleading with respect to the period covered by this report;
3. Based on my knowledge, the financial statements, and other financial information included in this report, fairly present
in all material respects the financial condition, results of operations and cash flows of the registrant as of, and for, the
periods presented in this report;
4. The registrant’s other certifying officers and I are responsible for establishing and maintaining disclosure controls and
procedures (as defined in Exchange Act Rules 13a-15(e) and 15d-15(e)) and internal control over financial reporting (as
defined in Exchange Act Rules 13a-15(f) and 15d-15(f)) for the registrant and have:
(a) Designed such disclosure controls and procedures, or caused such disclosure controls and procedures to be designed
under our supervision, to ensure that material information relating to the registrant, including its consolidated
subsidiaries, is made known to us by others within those entities, particularly during the period in which this report
is being prepared;
(b) Designed such internal control over financial reporting, or caused such internal control over financial reporting to be
designed under our supervision, to provide reasonable assurance regarding the reliability of financial reporting and
the preparation of financial statements for external purposes in accordance with generally accepted accounting
principles;
(c) Evaluated the effectiveness of the registrant's disclosure controls and procedures and presented in this report our
conclusions about the effectiveness of the disclosure controls and procedures, as of the end of the period covered by
this report based on such evaluation; and
(d) Disclosed in this report any change in the registrant's internal control over financial reporting that occurred during
the registrant's most recent fiscal quarter (the registrant's fourth fiscal quarter in the case of an annual report) that
has materially affected, or is reasonably likely to materially affect, the registrant's internal control over financial
reporting; and
5. The registrant's other certifying officers and I have disclosed, based on our most recent evaluation of internal control
over financial reporting, to the registrant's auditors and the audit committee of the registrant's board of directors (or
persons performing the equivalent functions):
(a) All significant deficiencies and material weaknesses in the design or operation of internal control over financial
reporting which are reasonably likely to adversely affect the registrant's ability to record, process, summarize and
report financial information; and
(b) Any fraud, whether or not material, that involves management or other employees who have a significant role in the
registrant's internal control over financial reporting.
Date: February 27, 2019
/s/ DAVID S. ROSENTHAL
David S. Rosenthal
Vice President and Controller
(Principal Accounting Officer)
EXHIBIT 32.1
Certification of Periodic Financial Report
Pursuant to 18 U.S.C. Section 1350
For purposes of 18 U.S.C. Section 1350, as adopted pursuant to Section 906 of the Sarbanes-Oxley Act of 2002, the undersigned,
Darren W. Woods, the chief executive officer of Exxon Mobil Corporation (the “Company”), hereby certifies that, to his
knowledge:
(i) the Annual Report on Form 10-K of the Company for the year ended December 31, 2018, as filed with the Securities and
Exchange Commission on the date hereof (the “Report”) fully complies with the requirements of section 13(a) or 15(d) of the
Securities Exchange Act of 1934; and
(ii) the information contained in the Report fairly presents, in all material respects, the financial condition and results of
operations of the Company.
Date: February 27, 2019
/s/ DARREN W. WOODS
Darren W. Woods
Chief Executive Officer
A signed original of this written statement required by Section 906 has been provided to Exxon Mobil Corporation and will be
retained by Exxon Mobil Corporation and furnished to the Securities and Exchange Commission or its staff upon request.
EXHIBIT 32.2
Certification of Periodic Financial Report
Pursuant to 18 U.S.C. Section 1350
For purposes of 18 U.S.C. Section 1350, as adopted pursuant to Section 906 of the Sarbanes-Oxley Act of 2002, the undersigned,
Andrew P. Swiger, the principal financial officer of Exxon Mobil Corporation (the “Company”), hereby certifies that, to his
knowledge:
(i) the Annual Report on Form 10-K of the Company for the year ended December 31, 2018, as filed with the Securities and
Exchange Commission on the date hereof (the “Report”) fully complies with the requirements of section 13(a) or 15(d) of the
Securities Exchange Act of 1934; and
(ii) the information contained in the Report fairly presents, in all material respects, the financial condition and results of
operations of the Company.
Date: February 27, 2019
/s/ ANDREW P. SWIGER
Andrew P. Swiger
Senior Vice President
(Principal Financial Officer)
A signed original of this written statement required by Section 906 has been provided to Exxon Mobil Corporation and will be
retained by Exxon Mobil Corporation and furnished to the Securities and Exchange Commission or its staff upon request.
EXHIBIT 32.3
Certification of Periodic Financial Report
Pursuant to 18 U.S.C. Section 1350
For purposes of 18 U.S.C. Section 1350, as adopted pursuant to Section 906 of the Sarbanes-Oxley Act of 2002, the undersigned,
David S. Rosenthal, the principal accounting officer of Exxon Mobil Corporation (the “Company”), hereby certifies that, to his
knowledge:
(i) the Annual Report on Form 10-K of the Company for the year ended December 31, 2018, as filed with the Securities and
Exchange Commission on the date hereof (the “Report”) fully complies with the requirements of section 13(a) or 15(d) of the
Securities Exchange Act of 1934; and
(ii) the information contained in the Report fairly presents, in all material respects, the financial condition and results of
operations of the Company.
Date: February 27, 2019
/s/ DAVID S. ROSENTHAL
David S. Rosenthal
Vice President and Controller
(Principal Accounting Officer)
A signed original of this written statement required by Section 906 has been provided to Exxon Mobil Corporation and will be
retained by Exxon Mobil Corporation and furnished to the Securities and Exchange Commission or its staff upon request.