Embed Size (px)
Citation preview
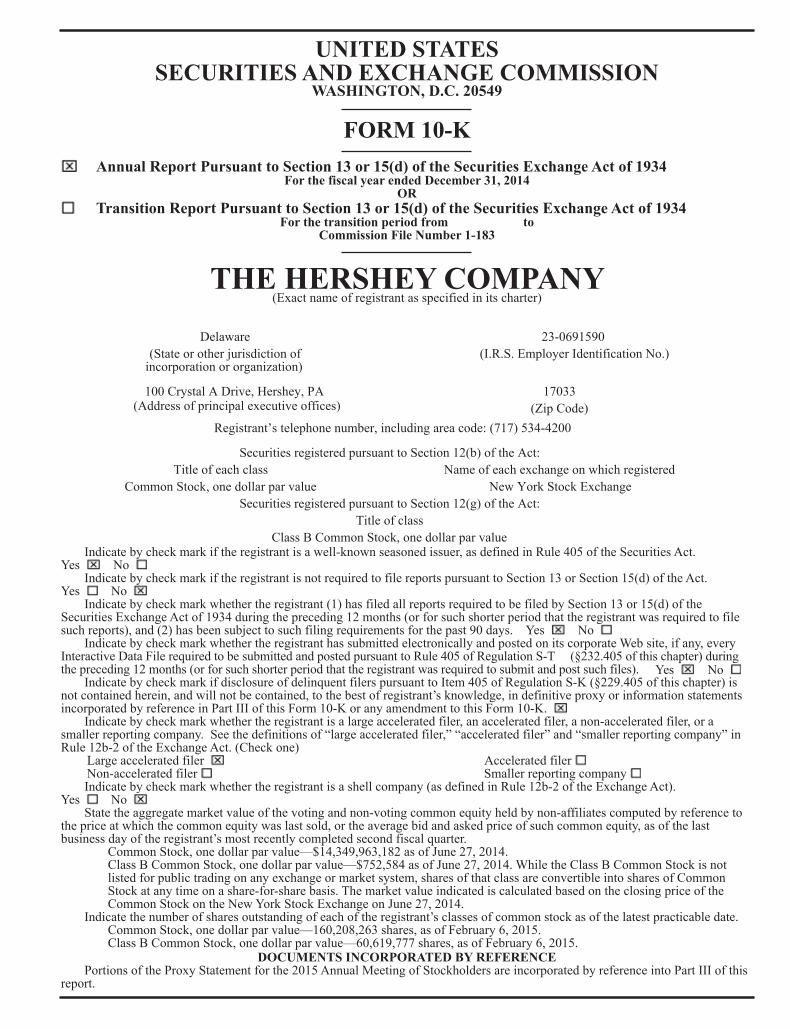
UNITED STATES SECURITIES AND EXCHANGE COMMISSION
WASHINGTON, D.C. 20549
FORM 10-K Annual Report Pursuant to Section 13 or 15(d) of the Securities Exchange Act of 1934
For the fiscal year ended December 31, 2014OR
Transition Report Pursuant to Section 13 or 15(d) of the Securities Exchange Act of 1934 For the transition period from to
Commission File Number 1-183
THE HERSHEY COMPANY(Exact name of registrant as specified in its charter)
Delaware 23-0691590(State or other jurisdiction of
incorporation or organization)(I.R.S. Employer Identification No.)
100 Crystal A Drive, Hershey, PA 17033(Address of principal executive offices) (Zip Code)
Registrant’s telephone number, including area code: (717) 534-4200
Securities registered pursuant to Section 12(b) of the Act:Title of each class Name of each exchange on which registered
Common Stock, one dollar par value New York Stock ExchangeSecurities registered pursuant to Section 12(g) of the Act:
Title of classClass B Common Stock, one dollar par value
Indicate by check mark if the registrant is a well-known seasoned issuer, as defined in Rule 405 of the Securities Act. Yes No Indicate by check mark if the registrant is not required to file reports pursuant to Section 13 or Section 15(d) of the Act. Yes No Indicate by check mark whether the registrant (1) has filed all reports required to be filed by Section 13 or 15(d) of the Securities Exchange Act of 1934 during the preceding 12 months (or for such shorter period that the registrant was required to file such reports), and (2) has been subject to such filing requirements for the past 90 days. Yes No Indicate by check mark whether the registrant has submitted electronically and posted on its corporate Web site, if any, every Interactive Data File required to be submitted and posted pursuant to Rule 405 of Regulation S-T (§232.405 of this chapter) during the preceding 12 months (or for such shorter period that the registrant was required to submit and post such files). Yes No Indicate by check mark if disclosure of delinquent filers pursuant to Item 405 of Regulation S-K (§229.405 of this chapter) is not contained herein, and will not be contained, to the best of registrant’s knowledge, in definitive proxy or information statements incorporated by reference in Part III of this Form 10-K or any amendment to this Form 10-K. Indicate by check mark whether the registrant is a large accelerated filer, an accelerated filer, a non-accelerated filer, or a smaller reporting company. See the definitions of “large accelerated filer,” “accelerated filer” and “smaller reporting company” in Rule 12b-2 of the Exchange Act. (Check one) Large accelerated filer Accelerated filer Non-accelerated filer Smaller reporting company Indicate by check mark whether the registrant is a shell company (as defined in Rule 12b-2 of the Exchange Act).Yes No State the aggregate market value of the voting and non-voting common equity held by non-affiliates computed by reference to the price at which the common equity was last sold, or the average bid and asked price of such common equity, as of the last business day of the registrant’s most recently completed second fiscal quarter.
Common Stock, one dollar par value—$14,349,963,182 as of June 27, 2014. Class B Common Stock, one dollar par value—$752,584 as of June 27, 2014. While the Class B Common Stock is not listed for public trading on any exchange or market system, shares of that class are convertible into shares of Common Stock at any time on a share-for-share basis. The market value indicated is calculated based on the closing price of the Common Stock on the New York Stock Exchange on June 27, 2014.
Indicate the number of shares outstanding of each of the registrant’s classes of common stock as of the latest practicable date. Common Stock, one dollar par value—160,208,263 shares, as of February 6, 2015. Class B Common Stock, one dollar par value—60,619,777 shares, as of February 6, 2015.
DOCUMENTS INCORPORATED BY REFERENCE Portions of the Proxy Statement for the 2015 Annual Meeting of Stockholders are incorporated by reference into Part III of this report.
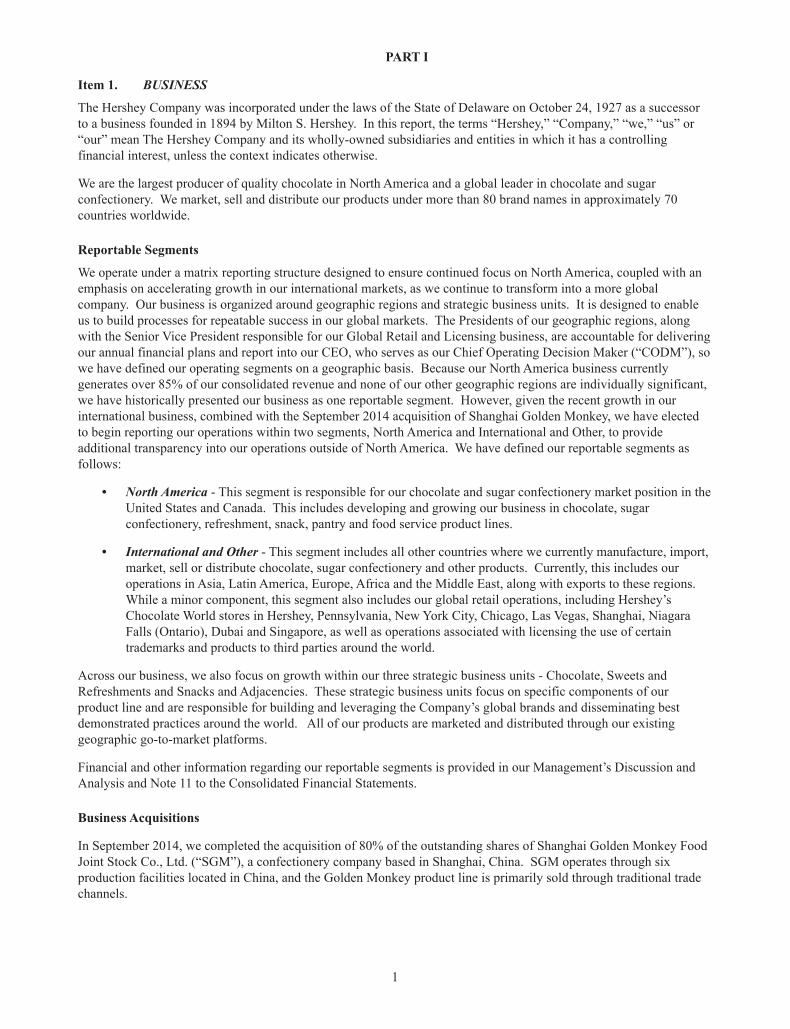
PART I
Item 1. BUSINESS
The Hershey Company was incorporated under the laws of the State of Delaware on October 24, 1927 as a successor to a business founded in 1894 by Milton S. Hershey. In this report, the terms “Hershey,” “Company,” “we,” “us” or “our” mean The Hershey Company and its wholly-owned subsidiaries and entities in which it has a controlling financial interest, unless the context indicates otherwise.
We are the largest producer of quality chocolate in North America and a global leader in chocolate and sugar confectionery. We market, sell and distribute our products under more than 80 brand names in approximately 70 countries worldwide.
Reportable Segments
We operate under a matrix reporting structure designed to ensure continued focus on North America, coupled with an emphasis on accelerating growth in our international markets, as we continue to transform into a more global company. Our business is organized around geographic regions and strategic business units. It is designed to enable us to build processes for repeatable success in our global markets. The Presidents of our geographic regions, along with the Senior Vice President responsible for our Global Retail and Licensing business, are accountable for delivering our annual financial plans and report into our CEO, who serves as our Chief Operating Decision Maker (“CODM”), so we have defined our operating segments on a geographic basis. Because our North America business currently generates over 85% of our consolidated revenue and none of our other geographic regions are individually significant, we have historically presented our business as one reportable segment. However, given the recent growth in our international business, combined with the September 2014 acquisition of Shanghai Golden Monkey, we have elected to begin reporting our operations within two segments, North America and International and Other, to provide additional transparency into our operations outside of North America. We have defined our reportable segments as follows:
• North America - This segment is responsible for our chocolate and sugar confectionery market position in the United States and Canada. This includes developing and growing our business in chocolate, sugar confectionery, refreshment, snack, pantry and food service product lines.
• International and Other - This segment includes all other countries where we currently manufacture, import, market, sell or distribute chocolate, sugar confectionery and other products. Currently, this includes our operations in Asia, Latin America, Europe, Africa and the Middle East, along with exports to these regions. While a minor component, this segment also includes our global retail operations, including Hershey’s Chocolate World stores in Hershey, Pennsylvania, New York City, Chicago, Las Vegas, Shanghai, Niagara Falls (Ontario), Dubai and Singapore, as well as operations associated with licensing the use of certain trademarks and products to third parties around the world.
Across our business, we also focus on growth within our three strategic business units - Chocolate, Sweets and Refreshments and Snacks and Adjacencies. These strategic business units focus on specific components of our product line and are responsible for building and leveraging the Company’s global brands and disseminating best demonstrated practices around the world. All of our products are marketed and distributed through our existing geographic go-to-market platforms.
Financial and other information regarding our reportable segments is provided in our Management’s Discussion and Analysis and Note 11 to the Consolidated Financial Statements.
Business Acquisitions
In September 2014, we completed the acquisition of 80% of the outstanding shares of Shanghai Golden Monkey Food Joint Stock Co., Ltd. (“SGM”), a confectionery company based in Shanghai, China. SGM operates through six production facilities located in China, and the Golden Monkey product line is primarily sold through traditional trade channels.
1
In 2014, we also acquired all of the outstanding shares of The Allan Candy Company Limited (“Allan”) headquartered in Ontario, Canada and a controlling interest in Lotte Shanghai Food Company, a joint venture established in 2007 in China for the purpose of manufacturing and selling product to the joint venture partners. These acquisitions provide us with additional manufacturing and distribution capacity to serve primarily the North America and Asia markets, respectively.
In January 2012, we acquired all of the outstanding stock of Brookside Foods Ltd. (“Brookside”), a privately held confectionery company based in Abbottsford, British Columbia, Canada. As part of this transaction, we acquired two production facilities located in British Columbia and Quebec and expanded our product line to include Brookside’s chocolate covered, fruit-flavored confectionery products.
Products
Our principal confectionery offerings include chocolate and sugar confectionery products; gum and mint refreshment products; pantry items, such as baking ingredients, toppings and beverages; and snack items such as spreads.
• Within our North America markets, our product portfolio includes a wide variety of chocolate offerings marketed and sold under the renowned brands of Hershey’s, Reese’s, and Kisses, along with other popular chocolate and sugar confectionery brands such as Jolly Rancher, Almond Joy, Brookside, Good & Plenty, Heath, Kit Kat, Lancaster, Payday, Rolo, Twizzlers, Whoppers and York. We also offer premium chocolate products, primarily in the U.S., through the Scharffen Berger and Dagoba brands. Our refreshment products including Ice Breakers mints and chewing gum, Breathsavers mints, and Bubble Yum bubble gum. Our pantry and snack items that are principally sold in North America include baking products and toppings and sundae syrups sold under the Hershey’s, Reese’s and Heath brands, as well as our new family of Hershey’s and Reese’s chocolate spreads.
• Within our International and Other markets, we manufacture, market and sell many of these same brands, as well as other brands that are marketed regionally, such as Golden Monkey confectionery and snack products in China, Pelon Pelo Rico confectionery products in Mexico, IO-IO snack products in Brazil, and Nutrine and Maha Lacto confectionery products and Jumpin and Sofit beverage products in India.
Principal Customers and Marketing Strategy
Our customers are mainly wholesale distributors, chain grocery stores, mass merchandisers, chain drug stores, vending companies, wholesale clubs, convenience stores, dollar stores, concessionaires and department stores. The majority of our customers, with the exception of wholesale distributors, resell our products to end-consumers in retail outlets in North America and other locations worldwide.
In 2014, approximately 25% of our consolidated net sales were made to McLane Company, Inc., one of the largest wholesale distributors in the United States to convenience stores, drug stores, wholesale clubs and mass merchandisers and the primary distributor of our products to Wal-Mart Stores, Inc.
The foundation of our marketing strategy is our strong brand equities, product innovation and the consistently superior quality of our products. We devote considerable resources to the identification, development, testing, manufacturing and marketing of new products. We utilize a variety of promotional programs directed towards our customers, as well as advertising and promotional programs for consumers of our products, to stimulate sales of certain products at various times throughout the year.
In conjunction with our sales and marketing efforts, our efficient product distribution network helps us maintain sales growth and provide superior customer service. We plan optimum stock levels and work with our customers to set reasonable delivery times. Our distribution network provides for the efficient shipment of our products from our manufacturing plants to strategically located distribution centers. We primarily use common carriers to deliver our products from these distribution points to our customers.
2
Raw Materials and Pricing
Cocoa products, including cocoa liquor, cocoa butter and cocoa powder processed from cocoa beans, are the most significant raw materials we use to produce our chocolate products. These cocoa products are purchased directly from third-party suppliers, who source cocoa beans that are grown principally in Far Eastern, West African and South American equatorial regions. West Africa accounts for approximately 72% of the world’s supply of cocoa beans.
Adverse weather, crop disease, political unrest and other problems in cocoa-producing countries have caused price fluctuations in the past, but have never resulted in the total loss of a particular producing country’s cocoa crop and/or exports. In the event that a significant disruption occurs in any given country, we believe cocoa from other producing countries and from current physical cocoa stocks in consuming countries would provide a significant supply buffer.
We also use substantial quantities of sugar, Class II fluid dairy milk, peanuts, almonds and energy in our production process. Most of these inputs for our domestic and Canadian operations are purchased from suppliers in the United States. For our international operations, inputs not locally available may be imported from other countries.
We change prices and weights of our products when necessary to accommodate changes in input costs, the competitive environment and profit objectives, while at the same time maintaining consumer value. Price increases and weight changes help to offset increases in our input costs, including raw and packaging materials, fuel, utilities, transportation and employee benefits. When we implement price increases, as we did in July 2014 in North America, there is usually a time lag between the effective date of the list price increases and the impact of the price increases on net sales, in part because we honor previous commitments to planned consumer and customer promotions and merchandising events subsequent to the effective date of the price increases. In addition, promotional allowances may be increased subsequent to the effective date, delaying or partially offsetting the impact of price increases on net sales.
Competition
Many of our brands enjoy wide consumer acceptance and are among the leading brands sold in the marketplace in North America and certain markets in Latin America. We sell our brands in highly competitive markets with many other global multinational, national, regional and local firms. Some of our competitors are large companies with significant resources and substantial international operations. Competition in our product categories is based on product innovation, product quality, price, brand recognition and loyalty, effectiveness of marketing, promotional activity, the ability to identify and satisfy consumer preferences, as well as convenience and service.
Seasonality and Backlog
Our sales are typically higher during the third and fourth quarters of the year, representing seasonal and holiday-related sales patterns. We manufacture primarily for stock and typically fill customer orders within a few days of receipt. Therefore, the backlog of any unfilled orders is not material to our total annual sales.
Trademarks, Service Marks and License Agreements
We own various registered and unregistered trademarks and service marks. The trademarks covering our key product brands are of material importance to our business. We follow a practice of seeking trademark protection in the U.S. and other key international markets where our products are sold. We also grant trademark licenses to third parties to produce and sell pantry items, flavored milks and various other products primarily under the Hershey’s and Reese’s brand names.
3
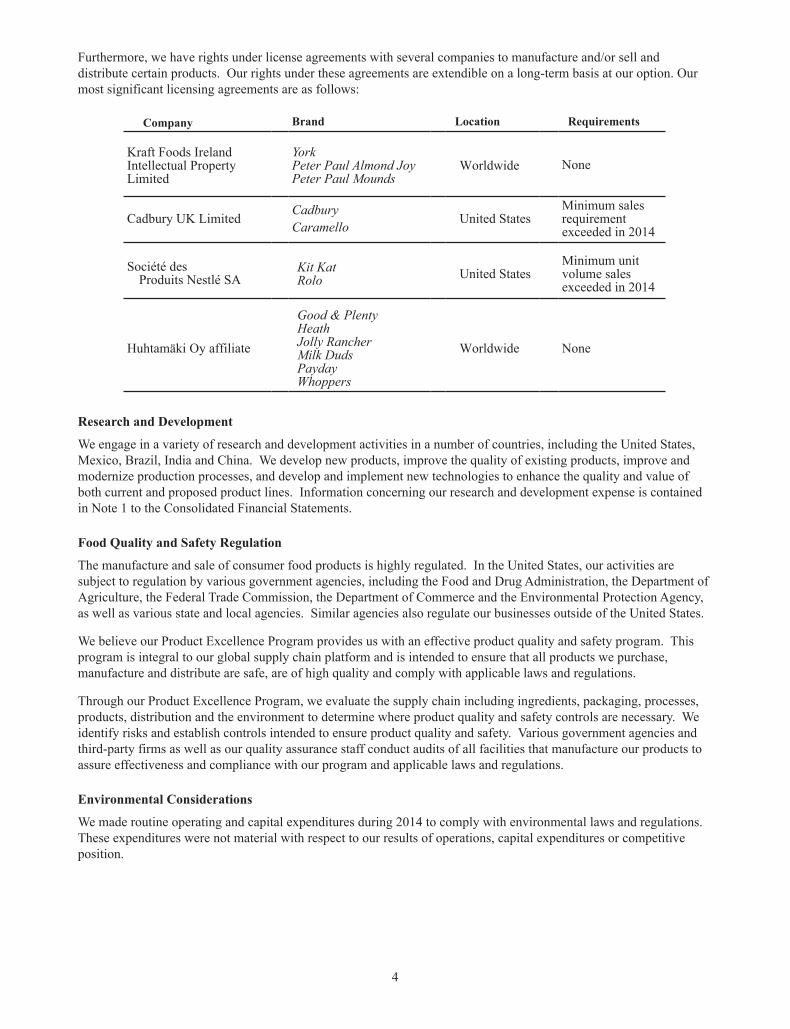
Furthermore, we have rights under license agreements with several companies to manufacture and/or sell and distribute certain products. Our rights under these agreements are extendible on a long-term basis at our option. Our most significant licensing agreements are as follows:
Company Brand Location Requirements
Kraft Foods IrelandIntellectual PropertyLimited
YorkPeter Paul Almond JoyPeter Paul Mounds
Worldwide None
Cadbury UK Limited CadburyCaramello United States
Minimum salesrequirementexceeded in 2014
Société desProduits Nestlé SA
Kit KatRolo United States
Minimum unitvolume salesexceeded in 2014
Huhtamäki Oy affiliate
Good & PlentyHeathJolly RancherMilk DudsPaydayWhoppers
Worldwide None
Research and Development
We engage in a variety of research and development activities in a number of countries, including the United States, Mexico, Brazil, India and China. We develop new products, improve the quality of existing products, improve and modernize production processes, and develop and implement new technologies to enhance the quality and value of both current and proposed product lines. Information concerning our research and development expense is contained in Note 1 to the Consolidated Financial Statements.
Food Quality and Safety Regulation
The manufacture and sale of consumer food products is highly regulated. In the United States, our activities are subject to regulation by various government agencies, including the Food and Drug Administration, the Department of Agriculture, the Federal Trade Commission, the Department of Commerce and the Environmental Protection Agency, as well as various state and local agencies. Similar agencies also regulate our businesses outside of the United States.
We believe our Product Excellence Program provides us with an effective product quality and safety program. This program is integral to our global supply chain platform and is intended to ensure that all products we purchase, manufacture and distribute are safe, are of high quality and comply with applicable laws and regulations.
Through our Product Excellence Program, we evaluate the supply chain including ingredients, packaging, processes, products, distribution and the environment to determine where product quality and safety controls are necessary. We identify risks and establish controls intended to ensure product quality and safety. Various government agencies and third-party firms as well as our quality assurance staff conduct audits of all facilities that manufacture our products to assure effectiveness and compliance with our program and applicable laws and regulations.
Environmental Considerations
We made routine operating and capital expenditures during 2014 to comply with environmental laws and regulations. These expenditures were not material with respect to our results of operations, capital expenditures or competitive position.
4
Employees
As of December 31, 2014, we employed approximately 20,800 full-time and 1,650 part-time employees worldwide. Our employee headcount has increased compared to prior years due mainly to recent acquisitions, most notably SGM. Collective bargaining agreements covered approximately 5,750 employees. During 2015, agreements are expected to be negotiated for certain employees at four facilities outside of the United States, comprising approximately 64% of total employees under collective bargaining agreements. We believe that our employee relations are good.
Financial Information by Geographic Area
Our principal operations and markets are located in the United States. The percentage of total consolidated net sales for our businesses outside of the United States was 17.5% for 2014, 16.6% for 2013 and 16.2% for 2012. The percentage of total consolidated assets outside of the United States was 35.4% as of December 31, 2014 and 19.4% as of December 31, 2013.
Corporate Social Responsibility
Our founder, Milton S. Hershey, established an enduring model of responsible citizenship while creating a successful business. Driving sustainable business practices, making a difference in our communities and operating with the highest integrity are vital parts of our heritage. Milton Hershey School, established by Milton and Catherine Hershey, lies at the center of our unique heritage. Mr. Hershey donated and bequeathed almost his entire fortune to Milton Hershey School, which remains our primary beneficiary and provides a world-class education and nurturing home to nearly 2,000 children in need annually. We continue Milton Hershey's legacy of commitment to consumers, community and children by providing high-quality products while conducting our business in a socially responsible and environmentally sustainable manner.
In 2014, we published our third full corporate social responsibility (“CSR”) report, which provided an update on the progress we have made in advancing the priorities that were discussed in our last CSR report. The report outlined how we performed against the identified performance indicators and unveiled our new CSR framework, titled Shared Goodness.
The safety and health of our employees, and the safety and quality of our products, are at the core of our operations and are areas of ongoing focus. Our over-arching safety goal is to consistently achieve best in class safety performance. We continue to invest in our quality management systems to ensure that product quality and food safety remain top priorities. We carefully monitor and rigorously enforce our high standards of excellence for superior quality, consistency, taste and food safety.
In 2014, Hershey was recognized for its environmental, social and governance performance by being named to both the Dow Jones Sustainability World Index and the North America Index. Hershey is one of only 13 companies from the Food, Beverage and Tobacco Industry recognized in the Dow Jones Sustainability World Index and ranked in at least the 90th percentile in this evaluation of economic, environmental and social criteria. The Dow Jones Sustainability World Index tracks the performance of the top 10% of the 2,500 largest companies in the S&P Global Broad Market Index that lead the field in terms of sustainability.
We have committed to minimizing our impact on the environment, regularly reviewing the ways in which we manage our operations and secure our supply of raw materials. Eleven of our facilities, including six manufacturing sites, have achieved zero-waste-to-landfill status. At the beginning of 2014, we reset our environmental goals, as we had achieved many of them ahead of schedule. We now have goals to reduce our environmental impact through efforts such as reducing waste, increasing recycling rates and using water more efficiently.
We focus on promoting fair and ethical business dealings. A condition of doing business with us is compliance with our Supplier Code of Conduct, which outlines our expectations with regard to our suppliers' commitment to legal compliance and business integrity, social and working conditions, food safety and the environment.
We continue our leadership role in supporting programs to improve the lives of cocoa farming families through a variety of initiatives. In 2014, we announced our role as a founding member of CocoaAction, a new strategy to align the cocoa sustainability efforts of the world’s largest cocoa and chocolate companies. This new level of coordination and commitment seeks to build a rejuvenated and economically viable cocoa sector for at least 300,000 cocoa farmers
5
in Cote d’Ivoire and Ghana by 2020. Our 21st Century Cocoa Strategy aims to impact more than two million West Africans by 2017 through public/private programs as well as through Hershey initiatives, including CocoaLink, a first-of-its kind approach that uses mobile technology to deliver practical information on agricultural and social programs to rural cocoa farmers. It is our goal to source 100% certified cocoa for our global chocolate product lines by 2020, assuming adequate supply. We are progressing ahead of schedule as during 2014, 30% of the cocoa we sourced globally was certified. Our active engagement and financial support also continues for the World Cocoa Foundation and the International Cocoa Initiative.
Our employees share their time and resources generously in their communities. Both directly and through the United Way, we contribute to hundreds of agencies that deliver much needed services and resources. In 2014, Hershey donated more than $8 million in cash and product to worthy causes, including more than $3 million through our United Way Campaign. In 2014, we expanded our annual week of volunteerism, Good to Give Back Week, around the world. More than 1,700 employees volunteered with a variety of causes, and over 600 employees in Hershey, Pennsylvania partnered with the nonprofit Stop Hunger Now to pack 210,000 meals for families in need.
Our Company was founded on an enduring social mission – helping children in need. In North America, we are proud of our Project Fellowship program where employees partner with student homes at the Milton Hershey School, and our longstanding partnership with Children’s Miracle Network Hospitals. Around the world our employees are supporting local programs, such as an orphanage for special needs children in the Philippines and a children's burn center in Guadalajara, Mexico.
We have also initiated efforts to align our global citizenship priorities with our business expertise in manufacturing high quality food. We are working with the non-profit organization Project Peanut Butter to advance the treatment of severe malnutrition, the single largest cause of child death in the world today, through the production of locally produced, peanut-based, ready-to-use therapeutic foods. Hershey has sponsored a new manufacturing facility and feeding clinic and donated significant employee time and expertise to expand this program to Ghana.
Our commitment to CSR is yielding powerful results. As we expand into new markets and build upon our leadership in North America, we are convinced that our values and heritage will be fundamental to our continuing success.
Available Information
The Company's website address is www.thehersheycompany.com. We file or furnish annual, quarterly and current reports, proxy statements and other information with the United States Securities and Exchange Commission (“SEC”). You may obtain a copy of any of these reports, free of charge, from the Investors section of our website as soon as reasonably practicable after we electronically file such material with, or furnish it to, the SEC. The SEC maintains an Internet site that also contains these reports at: www.sec.gov. In addition, copies of the Company's annual report will be made available, free of charge, on written request to the Company.
We have a Code of Ethical Business Conduct that applies to our Board of Directors (“Board”) and all Company officers and employees, including, without limitation, our Chief Executive Officer and “senior financial officers” (including the Interim Principal Financial Officer, Chief Accounting Officer and persons performing similar functions). You can obtain a copy of our Code of Ethical Business Conduct, as well as our Corporate Governance Guidelines and charters for each of the Board’s standing committees, from the Investors section of our website. If we change or waive any portion of the Code of Ethical Business Conduct that applies to any of our directors, executive officers or senior financial officers, we will post that information on our website.
6
Item 1A. RISK FACTORS
Cautionary Note Regarding Forward-Looking Statements
This Annual Report on Form 10-K, including the exhibits hereto and the information incorporated by reference herein, contains “forward-looking statements” within the meaning of Section 27A of the Securities Act of 1933, as amended, and Section 21E of the Securities Exchange Act of 1934, as amended, which are subject to risks and uncertainties. Other than statements of historical fact, information regarding activities, events and developments that we expect or anticipate will or may occur in the future, including, but not limited to, information relating to our future growth and profitability targets and strategies designed to increase total shareholder value, are forward-looking statements based on management’s estimates, assumptions and projections. Forward-looking statements also include, but are not limited to, statements regarding our future economic and financial condition and results of operations, the plans and objectives of management and our assumptions regarding our performance and such plans and objectives. Many of the forward-looking statements contained in this document may be identified by the use of words such as “intend,” “believe,” “expect,” “anticipate,” “should,” “planned,” “projected,” “estimated” and “potential,” among others. Forward-looking statements contained in this Annual Report on Form 10-K are predictions only and actual results could differ materially from management’s expectations due to a variety of factors, including those described below. All forward-looking statements attributable to us or persons working on our behalf are expressly qualified in their entirety by such risk factors. The forward-looking statements that we make in this Annual Report on Form 10-K are based on management’s current views and assumptions regarding future events and speak only as of their dates. We assume no obligation to update developments of these risk factors or to announce publicly any revisions to any of the forward-looking statements that we make, or to make corrections to reflect future events or developments, except as required by the federal securities laws.
Issues or concerns related to the quality and safety of our products, ingredients or packaging could cause a product recall and/or result in harm to the Company’s reputation, negatively impacting our operating results.
In order to sell our iconic, branded products, we need to maintain a good reputation with our customers and consumers. Issues related to the quality and safety of our products, ingredients or packaging could jeopardize our Company’s image and reputation. Negative publicity related to these types of concerns, or related to product contamination or product tampering, whether valid or not, could decrease demand for our products or cause production and delivery disruptions. We may need to recall products if any of our products become unfit for consumption. In addition, we could potentially be subject to litigation or government actions, which could result in payments of fines or damages. Costs associated with these potential actions could negatively affect our operating results.
Increases in raw material and energy costs along with the availability of adequate supplies of raw materials could affect future financial results.
We use many different commodities for our business, including cocoa products, sugar, dairy products, peanuts, almonds, corn sweeteners, natural gas and fuel oil.
Commodities are subject to price volatility and changes in supply caused by numerous factors, including:
Commodity market fluctuations;Currency exchange rates;Imbalances between supply and demand;The effect of weather on crop yield;Speculative influences;Trade agreements among producing and consuming nations;Supplier compliance with commitments;Political unrest in producing countries; andChanges in governmental agricultural programs and energy policies.
Although we use forward contracts and commodity futures and options contracts where possible to hedge commodity prices, commodity price increases ultimately result in corresponding increases in our raw material and energy costs. If
7
we are unable to offset cost increases for major raw materials and energy, there could be a negative impact on our financial condition and results of operations.
Price increases may not be sufficient to offset cost increases and maintain profitability or may result in sales volume declines associated with pricing elasticity.
We may be able to pass some or all raw material, energy and other input cost increases to customers by increasing the selling prices of our products or decreasing the size of our products; however, higher product prices or decreased product sizes may also result in a reduction in sales volume and/or consumption. If we are not able to increase our selling prices or reduce product sizes sufficiently, or in a timely manner, to offset increased raw material, energy or other input costs, including packaging, direct labor, overhead and employee benefits, or if our sales volume decreases significantly, there could be a negative impact on our financial condition and results of operations.
In North America, we announced a weighted average price increase in July 2014 of approximately 8% across our instant consumable, multi-pack, packaged candy and grocery lines to help offset part of the significant increases in our input costs, including raw materials, packaging, fuel, utilities and transportation, which we expect to incur in the future. While the increase was effective immediately, direct buying customers were given an opportunity to purchase transitional amounts of product at price points prior to the increase during the immediately following four-week period, and the increase is not expected to benefit seasonal sales until Halloween 2015. Accordingly, we expect that the majority of the financial benefit from this pricing action will impact earnings in 2015.
Market demand for new and existing products could decline.
We operate in highly competitive markets and rely on continued demand for our products. To generate revenues and profits, we must sell products that appeal to our customers and to consumers. Our continued success is impacted by many factors, including the following:
Effective retail execution;Appropriate advertising campaigns and marketing programs;Our ability to secure adequate shelf space at retail locations;Our ability to drive innovation and maintain a strong pipeline of new products in the confectionery andbroader snacking categories;Changes in product category consumption;Our response to consumer demographics and trends; andConsumer health concerns, including obesity and the consumption of certain ingredients.
There continue to be competitive product and pricing pressures in these markets, as well as challenges in maintaining profit margins. We must maintain mutually beneficial relationships with our key customers, including retailers and distributors, to compete effectively. Our largest customer, McLane Company, Inc., accounted for approximately 25% of our total net sales in 2014. McLane Company, Inc. is one of the largest wholesale distributors in the United States to convenience stores, drug stores, wholesale clubs and mass merchandisers, including Wal-Mart Stores, Inc.
Increased marketplace competition could hurt our business.
The global confectionery packaged goods industry is intensely competitive and consolidation in this industry continues. Some of our competitors are large companies that have significant resources and substantial international operations. In 2014, we also experienced increased levels of in-store activity for other snack items, which pressured confectionery category growth. In order to protect our existing market share or capture increased market share in this highly competitive retail environment, we may be required to increase expenditures for promotions and advertising, and must continue to introduce and establish new products. Due to inherent risks in the marketplace associated with advertising and new product introductions, including uncertainties about trade and consumer acceptance, increased expenditures may not prove successful in maintaining or enhancing our market share and could result in lower sales and profits. In addition, we may incur increased credit and other business risks because we operate in a highly competitive retail environment.
8
Disruption to our manufacturing operations or supply chain could impair our ability to produce or deliver finished products, resulting in a negative impact on our operating results.
Approximately two-thirds of our manufacturing capacity is located in the United States. Disruption to our global manufacturing operations or our supply chain could result from, among other factors, the following:
Natural disaster;Pandemic outbreak of disease;Weather;Fire or explosion;Terrorism or other acts of violence;Labor strikes or other labor activities;Unavailability of raw or packaging materials; andOperational and/or financial instability of key suppliers, and other vendors or service providers.
We believe that we take adequate precautions to mitigate the impact of possible disruptions. We have strategies and plans in place to manage disruptive events if they were to occur, including our global supply chain strategies and our principle-based global labor relations strategy. If we are unable, or find that it is not financially feasible, to effectively plan for or mitigate the potential impacts of such disruptive events on our manufacturing operations or supply chain, our financial condition and results of operations could be negatively impacted if such events were to occur.
Our financial results may be adversely impacted by the failure to successfully execute or integrate acquisitions, divestitures and joint ventures.
From time to time, we may evaluate potential acquisitions, divestitures or joint ventures that align with our strategic objectives. The success of such activity depends, in part, upon our ability to identify suitable buyers, sellers or business partners; perform effective assessments prior to contract execution; negotiate contract terms; and, if applicable, obtain government approval. These activities may present certain financial, managerial, staffing and talent, and operational risks, including diversion of management’s attention from existing core businesses; difficulties integrating or separating businesses from existing operations; and challenges presented by acquisitions or joint ventures which may not achieve sales levels and profitability that justify the investments made. If the acquisitions, divestitures or joint ventures are not successfully implemented or completed, there could be a negative impact on our financial condition, results of operations and cash flows.
Changes in governmental laws and regulations could increase our costs and liabilities or impact demand for our products.
Changes in laws and regulations and the manner in which they are interpreted or applied may alter our business environment. These negative impacts could result from changes in food and drug laws, laws related to advertising and marketing practices, accounting standards, taxation requirements, competition laws, employment laws and environmental laws, among others. It is possible that we could become subject to additional liabilities in the future resulting from changes in laws and regulations that could result in an adverse effect on our financial condition and results of operations.
Political, economic and/or financial market conditions could negatively impact our financial results.
Our operations are impacted by consumer spending levels and impulse purchases which are affected by general macroeconomic conditions, consumer confidence, employment levels, the availability of consumer credit and interest rates on that credit, consumer debt levels, energy costs and other factors. Volatility in food and energy costs, sustained global recessions, rising unemployment and declines in personal spending could adversely impact our revenues, profitability and financial condition.
Changes in financial market conditions may make it difficult to access credit markets on commercially acceptable terms, which may reduce liquidity or increase borrowing costs for our Company, our customers and our suppliers. A significant reduction in liquidity could increase counterparty risk associated with certain suppliers and service
9
providers, resulting in disruption to our supply chain and/or higher costs, and could impact our customers, resulting in a reduction in our revenue, or a possible increase in bad debt expense.
Our expanding international operations may not achieve projected growth objectives, which could adversely impact our overall business and results of operations.
In 2014, we derived approximately 18% of our net sales from customers located outside of the United States, versus 17% in 2013 and 16% in 2012. Additionally, 35% of our total consolidated assets were located outside of the United States as of December 31, 2014. As part of our global growth strategy, we are increasing our investments outside of the United States, particularly in Mexico, Brazil, India and China. As a result, we are subject to risks and uncertainties relating to international sales and operations, including:
Unforeseen global economic and environmental changes resulting in business interruption, supplyconstraints, inflation, deflation or decreased demand;Inability to establish, develop and achieve market acceptance of our global brands in international markets;Difficulties and costs associated with compliance and enforcement of remedies under a wide variety ofcomplex laws, treaties and regulations;Unexpected changes in regulatory environments;Political and economic instability, including the possibility of civil unrest, terrorism, mass violence or armedconflict;Nationalization of our properties by foreign governments;Tax rates that may exceed those in the United States and earnings that may be subject to withholdingrequirements and incremental taxes upon repatriation;Potentially negative consequences from changes in tax laws;The imposition of tariffs, quotas, trade barriers, other trade protection measures and import or exportlicensing requirements;Increased costs, disruptions in shipping or reduced availability of freight transportation;The impact of currency exchange rate fluctuations between the U.S. dollar and foreign currencies;Failure to gain sufficient profitable scale in certain international markets resulting in losses from impairmentor sale of assets; andFailure to recruit, retain and build a talented and engaged global workforce.
If we are not able to achieve our projected international growth objectives and mitigate the numerous risks and uncertainties associated with our international operations, there could be a negative impact on our financial condition and results of operations.
Disruptions, failures or security breaches of our information technology infrastructure could have a negative impact on our operations.
Information technology is critically important to our business operations. We use information technology to manage all business processes including manufacturing, financial, logistics, sales, marketing and administrative functions. These processes collect, interpret and distribute business data and communicate internally and externally with employees, suppliers, customers and others.
We invest in industry standard security technology to protect the Company’s data and business processes against risk of data security breach and cyber attack. Our data security management program includes identity, trust, vulnerability and threat management business processes as well as adoption of standard data protection policies. We measure our data security effectiveness through industry accepted methods and remediate significant findings. Additionally, we certify our major technology suppliers and any outsourced services through accepted security certification standards. We maintain and routinely test backup systems and disaster recovery, along with external network security penetration testing by an independent third party as part of our business continuity preparedness. We also have processes in place to prevent disruptions resulting from the implementation of new software and systems of the latest technology.
While we believe that our security technology and processes provide adequate measures of protection against security breaches and in reducing cybersecurity risks, disruptions in or failures of information technology systems are possible
10
and could have a negative impact on our operations or business reputation. Failure of our systems, including failures due to cyber attacks that would prevent the ability of systems to function as intended, could cause transaction errors, loss of customers and sales, and could have negative consequences to our Company, our employees, and those with whom we do business.
Future developments related to civil antitrust lawsuits and the possible investigation by government regulators of alleged pricing practices by members of the confectionery industry in the United States could negatively impact our reputation and our operating results.
We are a defendant in a number of civil antitrust lawsuits in the United States, including individual, class and putative class actions brought against us by purchasers of our products. The U.S. Department of Justice also notified the Company in 2007 that it had opened an inquiry into certain alleged pricing practices by members of the confectionery industry, but has not requested any information or documents. Additional information about these proceedings is contained in Note 13 to the Consolidated Financial Statements.
Competition and antitrust law investigations can be lengthy and violators are subject to civil and/or criminal fines and other sanctions. Class action civil antitrust lawsuits are expensive to defend and could result in significant judgments, including in some cases, payment of treble damages and/or attorneys' fees to the successful plaintiff. Additionally, negative publicity involving these proceedings could affect our Company's brands and reputation, possibly resulting in decreased demand for our products. These possible consequences, in our opinion, currently are not expected to materially impact our financial position or liquidity, but could materially impact our results of operations and cash flows in the period in which any fines, settlements or judgments are accrued or paid, respectively.
Item 1B. UNRESOLVED STAFF COMMENTS
None.
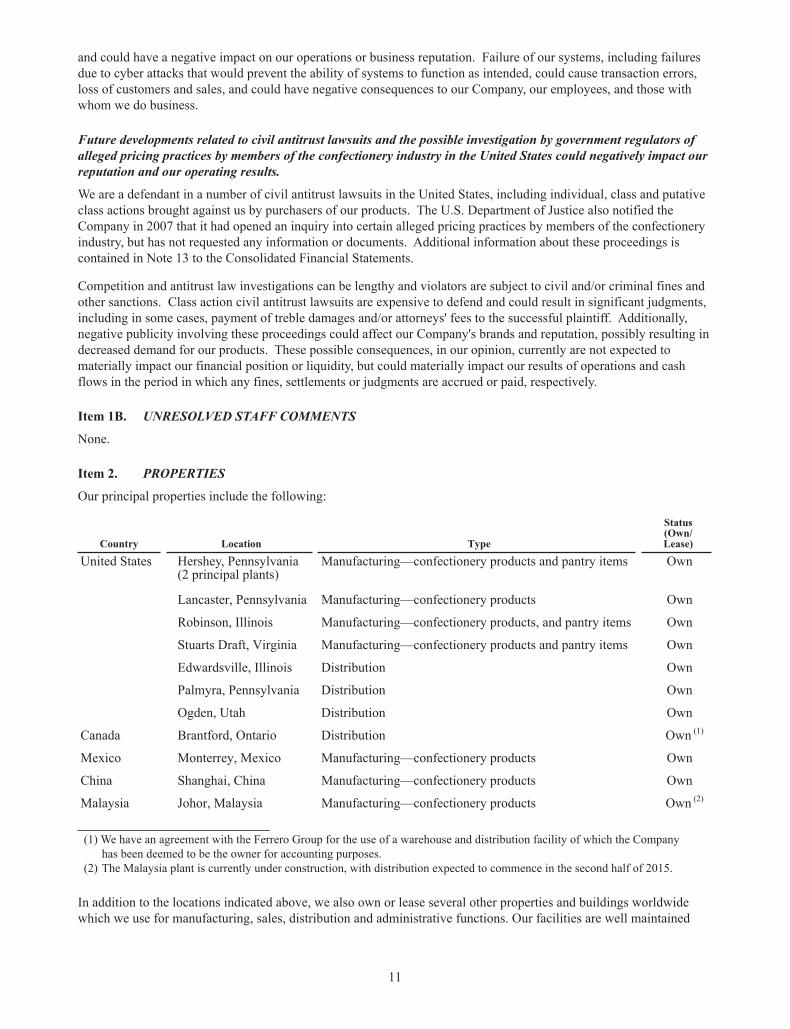
Item 2. PROPERTIES
Our principal properties include the following:
Country Location Type
Status(Own/Lease)
United States Hershey, Pennsylvania(2 principal plants)
Manufacturing—confectionery products and pantry items Own
Lancaster, Pennsylvania Manufacturing—confectionery products Own
Robinson, Illinois Manufacturing—confectionery products, and pantry items Own
Stuarts Draft, Virginia Manufacturing—confectionery products and pantry items Own
Edwardsville, Illinois Distribution Own
Palmyra, Pennsylvania Distribution Own
Ogden, Utah Distribution Own
Canada Brantford, Ontario Distribution Own (1)
Mexico Monterrey, Mexico Manufacturing—confectionery products Own
China Shanghai, China Manufacturing—confectionery products Own
Malaysia Johor, Malaysia Manufacturing—confectionery products Own (2)
(1) We have an agreement with the Ferrero Group for the use of a warehouse and distribution facility of which the Company
has been deemed to be the owner for accounting purposes.(2) The Malaysia plant is currently under construction, with distribution expected to commence in the second half of 2015.
In addition to the locations indicated above, we also own or lease several other properties and buildings worldwide which we use for manufacturing, sales, distribution and administrative functions. Our facilities are well maintained
11
and generally have adequate capacity to accommodate seasonal demands, changing product mixes and certain additional growth. We continually improve our facilities to incorporate the latest technologies. The largest facilities are located in Hershey and Lancaster, Pennsylvania; Monterrey, Mexico; and Stuarts Draft, Virginia. The U.S., Canada and Mexico facilities in the table above primarily support our North America segment, while the China and Malaysia facilities primarily serve our International and Other segment. As discussed in Note 11 to the Consolidated Financial Statements, we do not manage our assets on a segment basis given the integration of certain manufacturing, warehousing, distribution and other activities in support of our global operations.
Item 3. LEGAL PROCEEDINGS
The Company is subject to certain legal proceedings and claims arising out of the ordinary course of our business, which cover a wide range of matters including antitrust and trade regulation, product liability, advertising, contracts, environmental issues, patent and trademark matters, labor and employment matters and tax. See Note 13 to the Consolidated Financial Statements for information on certain legal proceedings for which there are contingencies.
Item 4. MINE SAFETY DISCLOSURES
Not applicable.
12
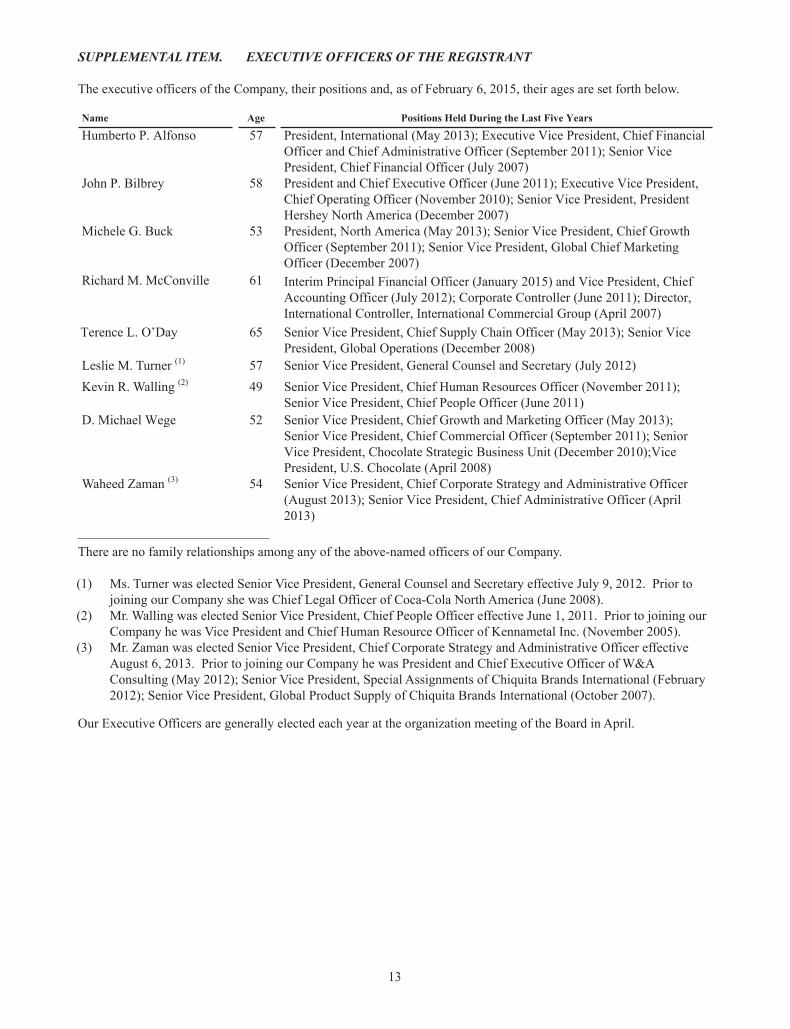
SUPPLEMENTAL ITEM. EXECUTIVE OFFICERS OF THE REGISTRANT
The executive officers of the Company, their positions and, as of February 6, 2015, their ages are set forth below.
Name Age Positions Held During the Last Five Years
Humberto P. Alfonso 57 President, International (May 2013); Executive Vice President, Chief FinancialOfficer and Chief Administrative Officer (September 2011); Senior VicePresident, Chief Financial Officer (July 2007)
John P. Bilbrey 58 President and Chief Executive Officer (June 2011); Executive Vice President,Chief Operating Officer (November 2010); Senior Vice President, PresidentHershey North America (December 2007)
Michele G. Buck 53 President, North America (May 2013); Senior Vice President, Chief GrowthOfficer (September 2011); Senior Vice President, Global Chief MarketingOfficer (December 2007)
Richard M. McConville 61 Interim Principal Financial Officer (January 2015) and Vice President, ChiefAccounting Officer (July 2012); Corporate Controller (June 2011); Director,International Controller, International Commercial Group (April 2007)
Terence L. O’Day 65 Senior Vice President, Chief Supply Chain Officer (May 2013); Senior VicePresident, Global Operations (December 2008)
Leslie M. Turner (1) 57 Senior Vice President, General Counsel and Secretary (July 2012)Kevin R. Walling (2) 49 Senior Vice President, Chief Human Resources Officer (November 2011);
Senior Vice President, Chief People Officer (June 2011)D. Michael Wege 52 Senior Vice President, Chief Growth and Marketing Officer (May 2013);
Senior Vice President, Chief Commercial Officer (September 2011); SeniorVice President, Chocolate Strategic Business Unit (December 2010);VicePresident, U.S. Chocolate (April 2008)
Waheed Zaman (3) 54 Senior Vice President, Chief Corporate Strategy and Administrative Officer(August 2013); Senior Vice President, Chief Administrative Officer (April2013)
There are no family relationships among any of the above-named officers of our Company.
(1) Ms. Turner was elected Senior Vice President, General Counsel and Secretary effective July 9, 2012. Prior to joining our Company she was Chief Legal Officer of Coca-Cola North America (June 2008).
(2) Mr. Walling was elected Senior Vice President, Chief People Officer effective June 1, 2011. Prior to joining our Company he was Vice President and Chief Human Resource Officer of Kennametal Inc. (November 2005).
(3) Mr. Zaman was elected Senior Vice President, Chief Corporate Strategy and Administrative Officer effective August 6, 2013. Prior to joining our Company he was President and Chief Executive Officer of W&A Consulting (May 2012); Senior Vice President, Special Assignments of Chiquita Brands International (February 2012); Senior Vice President, Global Product Supply of Chiquita Brands International (October 2007).
Our Executive Officers are generally elected each year at the organization meeting of the Board in April.
13
PART II
Item 5. MARKET FOR THE REGISTRANT’S COMMON EQUITY, RELATED STOCKHOLDER MATTERS AND ISSUER PURCHASES OF EQUITY SECURITIES
Our Common Stock is listed and traded principally on the New York Stock Exchange under the ticker symbol “HSY.” The Class B Common Stock (“Class B Stock”) is not publicly traded.
The closing price of our Common Stock on December 31, 2014, was $103.93. There were 33,689 stockholders of record of our Common Stock and 6 stockholders of record of our Class B Stock as of December 31, 2014.
We paid $440.4 million in cash dividends on our Common Stock and Class B Stock in 2014 and $393.8 million in 2013. The annual dividend rate on our Common Stock in 2014 was $2.04 per share.
Information regarding dividends paid and the quarterly high and low market prices for our Common Stock and dividends paid for our Class B Stock for the two most recent fiscal years is disclosed in Note 16 to the Consolidated Financial Statements.
On January 29, 2015, our Board declared a quarterly dividend of $0.535 per share of Common Stock payable on March 16, 2015, to stockholders of record as of February 25, 2015. It is the Company’s 341st consecutive quarterly Common Stock dividend. A quarterly dividend of $0.486 per share of Class B Stock also was declared.
Unregistered Sales of Equity Securities and Use of Proceeds
None.
Issuer Purchases of Equity Securities
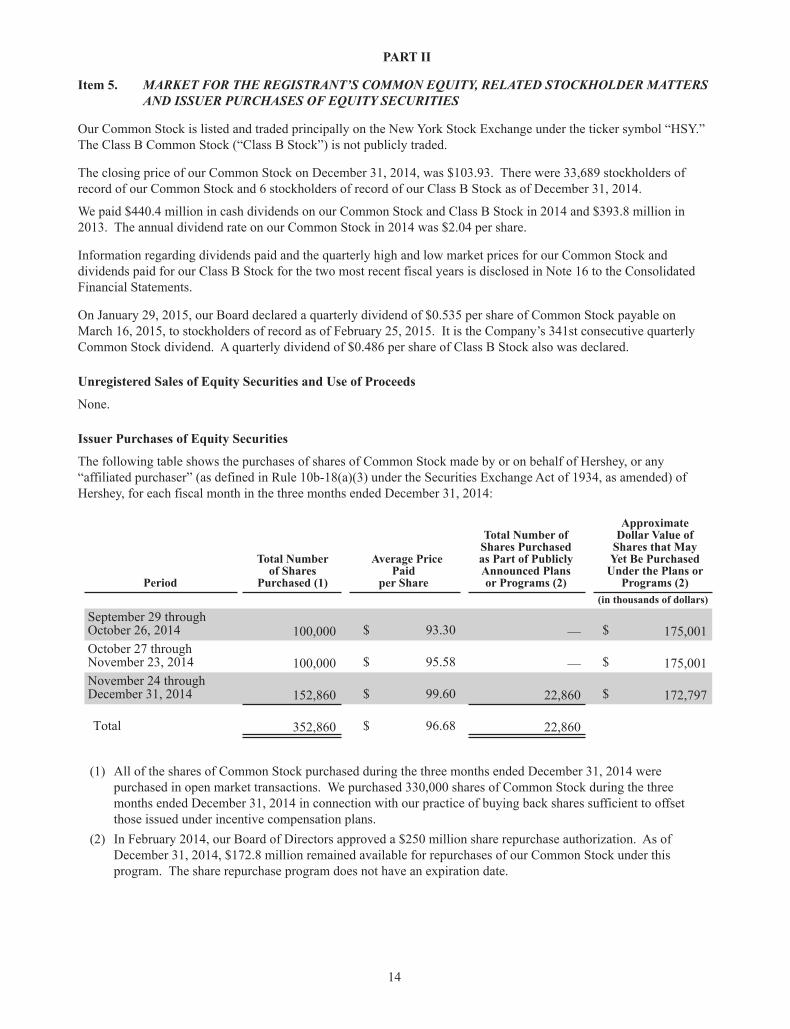
The following table shows the purchases of shares of Common Stock made by or on behalf of Hershey, or any “affiliated purchaser” (as defined in Rule 10b-18(a)(3) under the Securities Exchange Act of 1934, as amended) of Hershey, for each fiscal month in the three months ended December 31, 2014:
Period
Total Numberof Shares
Purchased (1)
Average PricePaid
per Share
Total Number ofShares Purchasedas Part of Publicly Announced Plans or Programs (2)
ApproximateDollar Value of
Shares that MayYet Be Purchased
Under the Plans orPrograms (2)
(in thousands of dollars)
September 29 throughOctober 26, 2014 100,000 $ 93.30 — $ 175,001October 27 throughNovember 23, 2014 100,000 $ 95.58 — $ 175,001November 24 throughDecember 31, 2014 152,860 $ 99.60 22,860 $ 172,797
Total 352,860 $ 96.68 22,860
(1) All of the shares of Common Stock purchased during the three months ended December 31, 2014 were purchased in open market transactions. We purchased 330,000 shares of Common Stock during the three months ended December 31, 2014 in connection with our practice of buying back shares sufficient to offset those issued under incentive compensation plans.
(2) In February 2014, our Board of Directors approved a $250 million share repurchase authorization. As of December 31, 2014, $172.8 million remained available for repurchases of our Common Stock under this program. The share repurchase program does not have an expiration date.
14
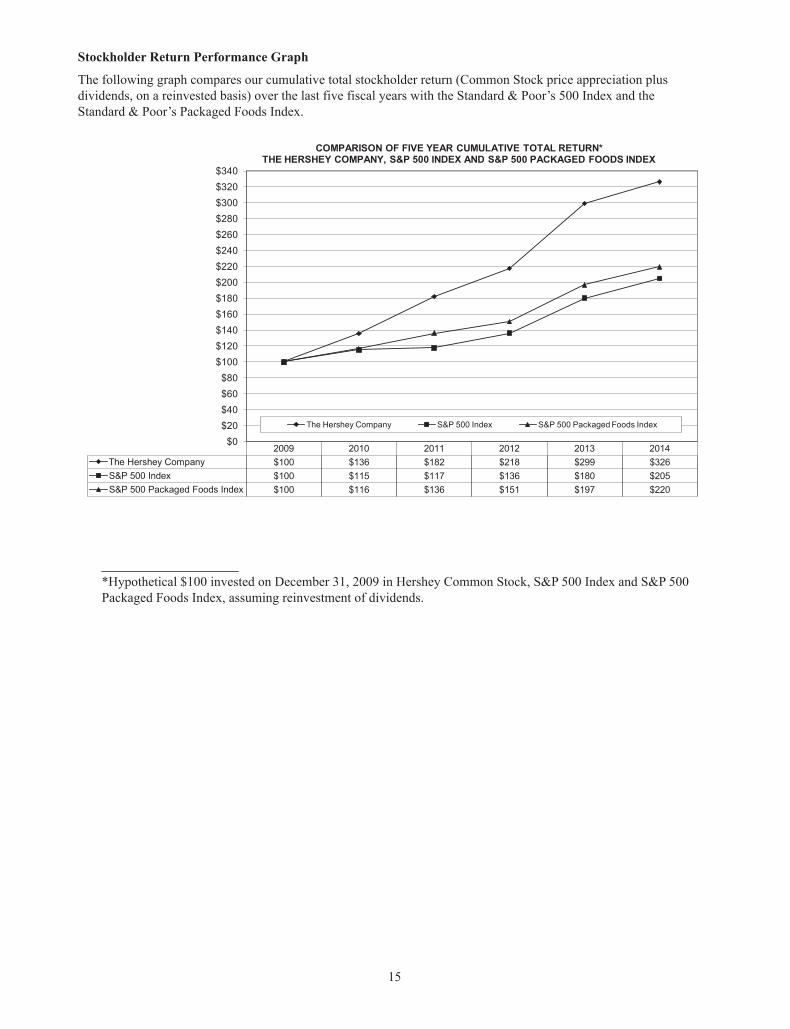
Stockholder Return Performance Graph
The following graph compares our cumulative total stockholder return (Common Stock price appreciation plus dividends, on a reinvested basis) over the last five fiscal years with the Standard & Poor’s 500 Index and the Standard & Poor’s Packaged Foods Index.
*Hypothetical $100 invested on December 31, 2009 in Hershey Common Stock, S&P 500 Index and S&P 500 Packaged Foods Index, assuming reinvestment of dividends.
2009 2010 2011 2012 2013 2014 The Hershey Company $100 $136 $182 $218 $299 $326 S&P 500 Index $100 $115 $117 $136 $180 $205 S&P 500 Packaged Foods Index $100 $116 $136 $151 $197 $220
$0 $20 $40 $60 $80
$100 $120 $140 $160 $180 $200 $220 $240 $260 $280 $300 $320 $340
COMPARISON OF FIVE YEAR CUMULATIVE TOTAL RETURN* THE HERSHEY COMPANY, S&P 500 INDEX AND S&P 500 PACKAGED FOODS INDEX
The Hershey Company S&P 500 Index S&P 500 Packaged Foods Index
15
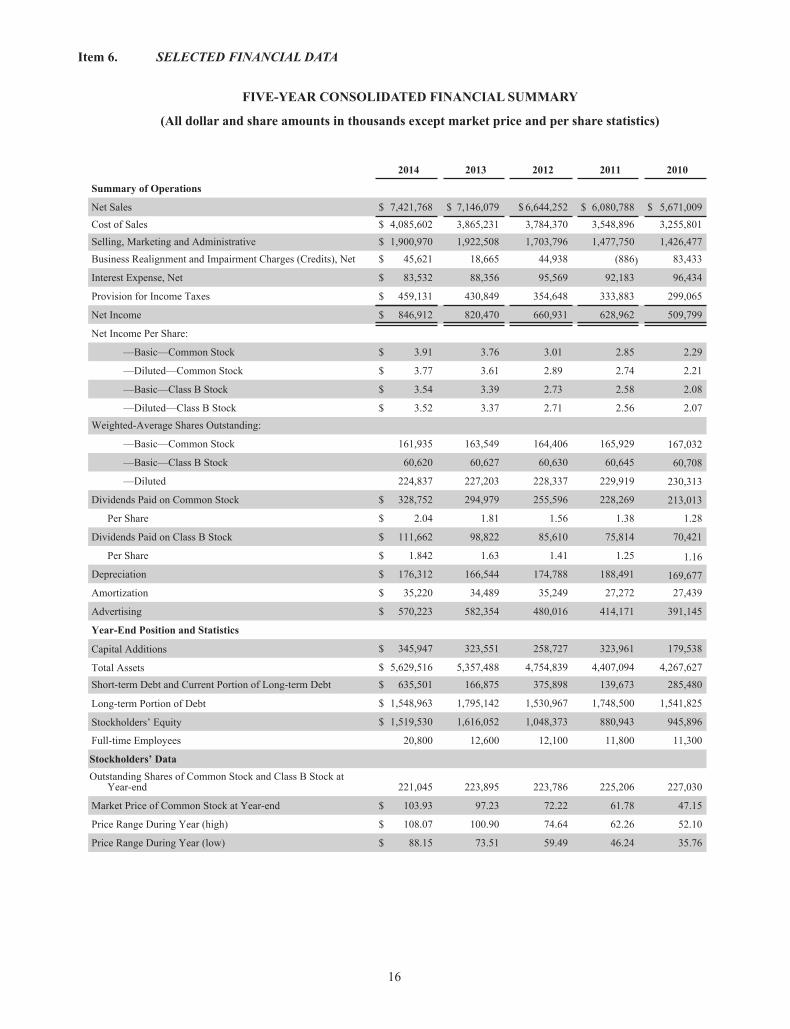
Item 6. SELECTED FINANCIAL DATA
FIVE-YEAR CONSOLIDATED FINANCIAL SUMMARY
(All dollar and share amounts in thousands except market price and per share statistics)
2014 2013 2012 2011 2010
Summary of Operations
Net Sales $ 7,421,768 $ 7,146,079 $ 6,644,252 $ 6,080,788 $ 5,671,009Cost of Sales $ 4,085,602 3,865,231 3,784,370 3,548,896 3,255,801Selling, Marketing and Administrative $ 1,900,970 1,922,508 1,703,796 1,477,750 1,426,477Business Realignment and Impairment Charges (Credits), Net $ 45,621 18,665 44,938 (886) 83,433
Interest Expense, Net $ 83,532 88,356 95,569 92,183 96,434
Provision for Income Taxes $ 459,131 430,849 354,648 333,883 299,065
Net Income $ 846,912 820,470 660,931 628,962 509,799
Net Income Per Share:
—Basic—Common Stock $ 3.91 3.76 3.01 2.85 2.29
—Diluted—Common Stock $ 3.77 3.61 2.89 2.74 2.21
—Basic—Class B Stock $ 3.54 3.39 2.73 2.58 2.08
—Diluted—Class B Stock $ 3.52 3.37 2.71 2.56 2.07Weighted-Average Shares Outstanding:
—Basic—Common Stock 161,935 163,549 164,406 165,929 167,032
—Basic—Class B Stock 60,620 60,627 60,630 60,645 60,708
—Diluted 224,837 227,203 228,337 229,919 230,313
Dividends Paid on Common Stock $ 328,752 294,979 255,596 228,269 213,013
Per Share $ 2.04 1.81 1.56 1.38 1.28
Dividends Paid on Class B Stock $ 111,662 98,822 85,610 75,814 70,421
Per Share $ 1.842 1.63 1.41 1.25 1.16Depreciation $ 176,312 166,544 174,788 188,491 169,677Amortization $ 35,220 34,489 35,249 27,272 27,439
Advertising $ 570,223 582,354 480,016 414,171 391,145
Year-End Position and Statistics
Capital Additions $ 345,947 323,551 258,727 323,961 179,538
Total Assets $ 5,629,516 5,357,488 4,754,839 4,407,094 4,267,627Short-term Debt and Current Portion of Long-term Debt $ 635,501 166,875 375,898 139,673 285,480
Long-term Portion of Debt $ 1,548,963 1,795,142 1,530,967 1,748,500 1,541,825
Stockholders’ Equity $ 1,519,530 1,616,052 1,048,373 880,943 945,896
Full-time Employees 20,800 12,600 12,100 11,800 11,300
Stockholders’ DataOutstanding Shares of Common Stock and Class B Stock at
Year-end 221,045 223,895 223,786 225,206 227,030
Market Price of Common Stock at Year-end $ 103.93 97.23 72.22 61.78 47.15
Price Range During Year (high) $ 108.07 100.90 74.64 62.26 52.10
Price Range During Year (low) $ 88.15 73.51 59.49 46.24 35.76
16
Item 7. MANAGEMENT’S DISCUSSION AND ANALYSIS OF FINANCIAL CONDITION AND RESULTS OF OPERATIONS
This Management's Discussion and Analysis (“MD&A”) is intended to provide an understanding of Hershey's financial condition, results of operations and cash flows by focusing on changes in certain key measures from year to year. The MD&A should be read in conjunction with our Consolidated Financial Statements and accompanying Notes included in Item 8 of this Annual Report on Form 10-K. This discussion contains forward-looking statements that involve risks and uncertainties. Our actual results could differ materially from those anticipated in these forward-looking statements as a result of various factors, including those discussed elsewhere in this Annual Report on Form 10-K, particularly in Item 1A. “Risk Factors.”
The MD&A is organized in the following sections:
• Overview and Outlook
• Non-GAAP Information
• Consolidated Results of Operations
• Segment Results
• Financial Condition
• Critical Accounting Policies and Estimates
OVERVIEW AND OUTLOOK
We are the largest producer of quality chocolate in North America and a global leader in chocolate and sugar confectionery. We market, sell and distribute our products under more than 80 brand names in approximately 70 countries worldwide. As of December 31, 2014, we began reporting our operations through two segments: North America and International and Other.
In 2014, we continued to make progress against our strategic initiatives:
• Our U.S. business increased its overall candy, mint and gum (“CMG”) market share to 31.4%, an increase of 0.3 share points versus 2013.
• We acquired Shanghai Golden Monkey, more than doubling our presence in China.
• We expanded into snacks and adjacencies with the launch of Hershey’s Spreads and the related Snacksters Graham Dippers.
• We sourced 30% of our cocoa needs from certified and sustainable cocoa farms, putting us in a solid position to deliver on our goal of sourcing 100% certified cocoa by 2020.
However, 2014 also presented some challenges. In our U.S. markets, we believe lower retail store traffic and changes in consumer spending patterns impacted how consumers shopped for snacks, while a number of our international markets continued to experience macroeconomic headwinds. Despite these challenges, our 2014 net sales and net income growth of 3.9% and 3.2%, respectively, reflects solid performance.
For the full year 2014, our U.S. CMG retail takeaway increase of 2.7% was about one full percentage point greater than the category growth rate. However, throughout the year, retail store traffic and consumer trips were irregular. Additionally, increased levels of distribution and in-store activity of items such as salty, bakery and meat snacks, by both mainstream and newer contemporary niche manufacturers, were prevalent throughout the year and drove broader snacking category growth in 2014, which we believe adversely impacted purchases of non-seasonal candy products.
Our 2014 international net sales increased nearly 15%, including a 2.7% unfavorable impact of foreign currency exchange rates and net sales contribution of approximately 7%, or $54 million, from Shanghai Golden Monkey Food Joint Stock Co., Ltd. (“SGM”). Excluding SGM and the unfavorable foreign currency exchange impact, our international net sales increased approximately 10%.
Our 2014 results were also impacted by increasing commodity and other input costs. In North America, we announced a weighted average price increase in July 2014 of approximately 8% across our instant consumable, multi-pack, packaged candy and grocery lines to help offset part of the significant increases in our input costs, including raw
17
materials, packaging, fuel, utilities and transportation, which we expect to incur in the future. While the increase was effective immediately, direct buying customers were given an opportunity to purchase transitional amounts of product at price points prior to the increase during the immediately following four-week period, and the increase is not expected to benefit seasonal sales until Halloween 2015. Therefore, this action did not materially benefit our 2014 results, but should be beneficial to our 2015 earnings.
Entering 2015, we are focused on accelerating growth and we have a solid line-up of new products that will bring variety, news and excitement to the category. In addition to the fourth quarter carryover benefit from Brookside Crunchy Clusters and Reese’s Spreads take home jar, we are also launching Kit Kat White Minis, Hershey’s Caramels, Ice Breakers Cool Blasts Chews, Reese’s Spreads Snacksters Graham Dippers and some other yet-to-be-announced new candy and snacking products. These launches will be supported with higher levels of advertising and in-store merchandising and programming that should enable us to mitigate the impact of volume elasticity related to the 2014 price increase and compete effectively across the CMG and broader snack categories. Additionally, we expect advertising, including a greater shift to digital and mobile communication, to increase at a rate greater than net sales growth.
We currently estimate full year 2015 net sales growth of 5.5% to 7.5%, including the impact of foreign currency exchange rates and a net contribution from acquisitions and divestitures of approximately 2.5%. This reflects our expectation for continued macroeconomic headwinds in international markets and slowly improving U.S. non-seasonal trends. In addition, we now anticipate foreign currency exchange impacts to be greater than our previous estimate and to have an unfavorable impact of approximately 1% on full year net sales growth.
We continue to focus on growth initiatives and margin-enhancing opportunities in addition to normal productivity gains. With the conclusion of the Project Next Century (“PNC”) program, in 2015 we will begin to focus on the opportunities that exist for future incremental increases in productivity and costs savings. A portion of any potential savings from this assessment would be reinvested in initiatives to accelerate revenue growth. We continue to have good visibility into our cost structure, with the exception of dairy products which cannot be effectively hedged. We currently expect 2015 gross margin to increase approximately 135 to 145 basis points driven by the 2014 pricing action and productivity. Therefore, we expect 2015 growth in earnings per share-diluted in a range of 10% to 13%, including net dilution from acquisitions and divestitures of $0.03 to $0.05 per share. We expect growth in adjusted earnings per share-diluted of 8% to 10%, as reflected in the reconciliation of reported to adjusted projections for 2015 provided below.
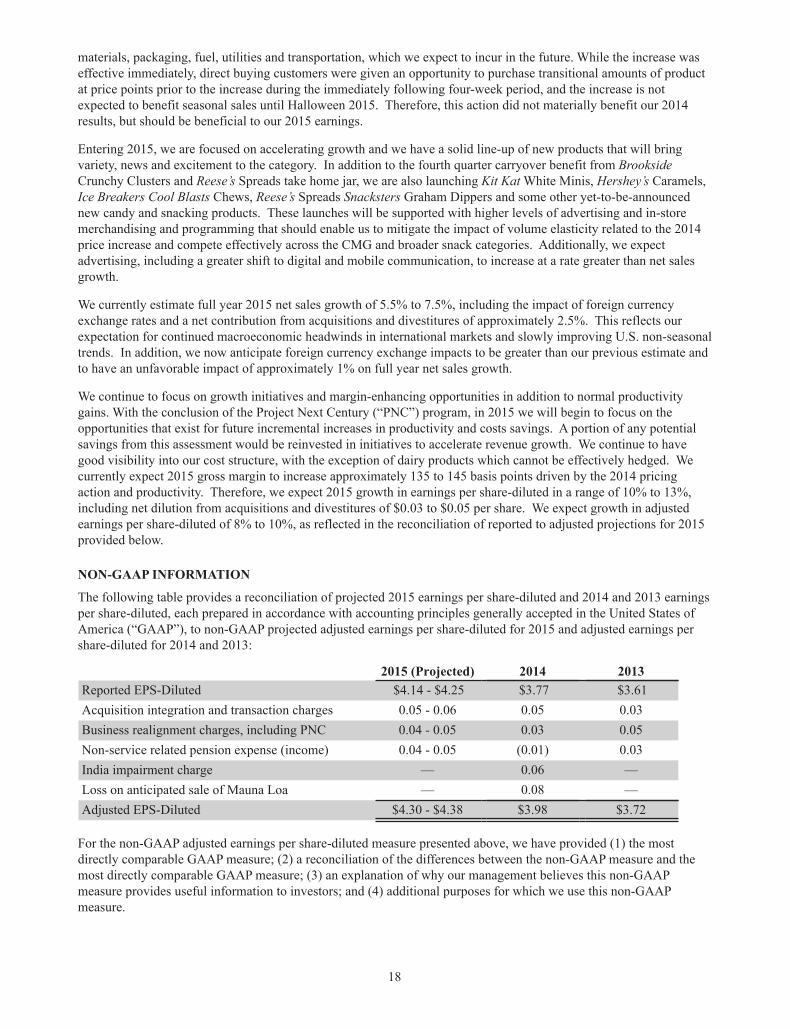
NON-GAAP INFORMATION
The following table provides a reconciliation of projected 2015 earnings per share-diluted and 2014 and 2013 earnings per share-diluted, each prepared in accordance with accounting principles generally accepted in the United States of America (“GAAP”), to non-GAAP projected adjusted earnings per share-diluted for 2015 and adjusted earnings per share-diluted for 2014 and 2013:
2015 (Projected) 2014 2013Reported EPS-Diluted $4.14 - $4.25 $3.77 $3.61Acquisition integration and transaction charges 0.05 - 0.06 0.05 0.03Business realignment charges, including PNC 0.04 - 0.05 0.03 0.05Non-service related pension expense (income) 0.04 - 0.05 (0.01) 0.03India impairment charge — 0.06 —Loss on anticipated sale of Mauna Loa — 0.08 —Adjusted EPS-Diluted $4.30 - $4.38 $3.98 $3.72
For the non-GAAP adjusted earnings per share-diluted measure presented above, we have provided (1) the most directly comparable GAAP measure; (2) a reconciliation of the differences between the non-GAAP measure and the most directly comparable GAAP measure; (3) an explanation of why our management believes this non-GAAP measure provides useful information to investors; and (4) additional purposes for which we use this non-GAAP measure.
18
We believe that the disclosure of adjusted earnings per share-diluted provides investors with a better comparison of our year-to-year operating results. We exclude the effects of certain items from earnings per share-diluted when we evaluate key measures of our performance internally, and in assessing the impact of known trends and uncertainties on our business. We also believe that excluding the effects of these items provides a more balanced view of the underlying dynamics of our business.
Adjusted earnings per share-diluted excludes the impacts of acquisition integration and transaction costs; charges and non-cash impairments associated with our business realignment initiatives; the non-cash goodwill impairment charge relating to our India business; the estimated loss on the anticipated sale of our Mauna Loa business; and non-service-related pension expense (income).
Non-service-related pension expense (income) includes interest costs, the expected return on pension plan assets, the amortization of actuarial gains and losses, and certain curtailment and settlement losses or credits. The non-service-related pension expense (income) may be quite volatile from year-to-year as a result of changes in market interest rates and market returns on pension plan assets. Therefore, we have excluded non-service-related pension expense (income) from our internal performance measures, and we believe that adjusted earnings per share-diluted, excluding non-service-related pension expense (income), will provide investors with a better understanding of the underlying profitability of our ongoing business. We believe that the service cost component of our total pension benefit costs closely reflects the operating costs of our business and provides for a better comparison of our operating results from year-to-year. Our most significant defined benefit pension plans were closed to most new participants in 2007, resulting in ongoing service costs that are stable and predictable.
19
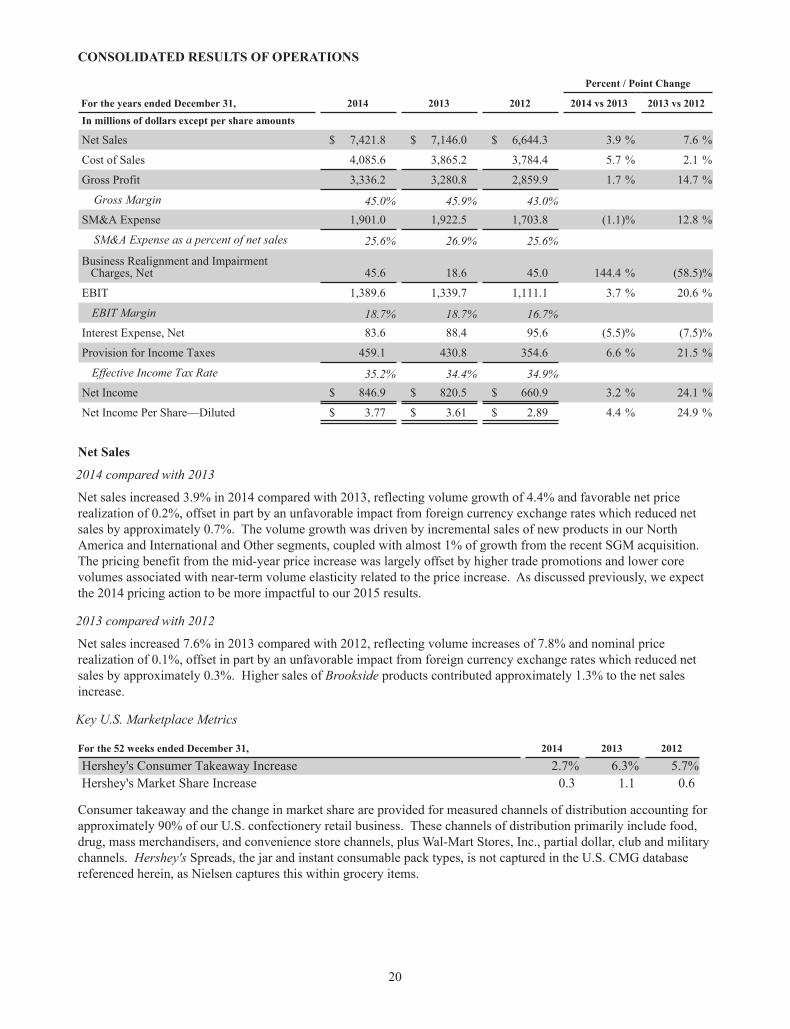
CONSOLIDATED RESULTS OF OPERATIONS
Percent / Point Change
For the years ended December 31, 2014 2013 2012 2014 vs 2013 2013 vs 2012In millions of dollars except per share amounts
Net Sales $ 7,421.8 $ 7,146.0 $ 6,644.3 3.9 % 7.6 %
Cost of Sales 4,085.6 3,865.2 3,784.4 5.7 % 2.1 %
Gross Profit 3,336.2 3,280.8 2,859.9 1.7 % 14.7 %
Gross Margin 45.0% 45.9% 43.0%SM&A Expense 1,901.0 1,922.5 1,703.8 (1.1)% 12.8 %
SM&A Expense as a percent of net sales 25.6% 26.9% 25.6%
Business Realignment and Impairment Charges, Net 45.6 18.6 45.0 144.4 % (58.5)%
EBIT 1,389.6 1,339.7 1,111.1 3.7 % 20.6 %
EBIT Margin 18.7% 18.7% 16.7%Interest Expense, Net 83.6 88.4 95.6 (5.5)% (7.5)%
Provision for Income Taxes 459.1 430.8 354.6 6.6 % 21.5 %
Effective Income Tax Rate 35.2% 34.4% 34.9%Net Income $ 846.9 $ 820.5 $ 660.9 3.2 % 24.1 %
Net Income Per Share—Diluted $ 3.77 $ 3.61 $ 2.89 4.4 % 24.9 %
Net Sales
2014 compared with 2013
Net sales increased 3.9% in 2014 compared with 2013, reflecting volume growth of 4.4% and favorable net price realization of 0.2%, offset in part by an unfavorable impact from foreign currency exchange rates which reduced net sales by approximately 0.7%. The volume growth was driven by incremental sales of new products in our North America and International and Other segments, coupled with almost 1% of growth from the recent SGM acquisition. The pricing benefit from the mid-year price increase was largely offset by higher trade promotions and lower core volumes associated with near-term volume elasticity related to the price increase. As discussed previously, we expect the 2014 pricing action to be more impactful to our 2015 results.
2013 compared with 2012
Net sales increased 7.6% in 2013 compared with 2012, reflecting volume increases of 7.8% and nominal price realization of 0.1%, offset in part by an unfavorable impact from foreign currency exchange rates which reduced net sales by approximately 0.3%. Higher sales of Brookside products contributed approximately 1.3% to the net sales increase.
Key U.S. Marketplace Metrics
For the 52 weeks ended December 31, 2014 2013 2012
Hershey's Consumer Takeaway Increase 2.7% 6.3% 5.7%Hershey's Market Share Increase 0.3 1.1 0.6
Consumer takeaway and the change in market share are provided for measured channels of distribution accounting for approximately 90% of our U.S. confectionery retail business. These channels of distribution primarily include food, drug, mass merchandisers, and convenience store channels, plus Wal-Mart Stores, Inc., partial dollar, club and military channels. Hershey's Spreads, the jar and instant consumable pack types, is not captured in the U.S. CMG database referenced herein, as Nielsen captures this within grocery items.
20
These metrics are based on measured market scanned purchases as reported by Nielsen and provide a means to assess our retail takeaway and market position relative to the overall category. In 2014, the category and Hershey growth rates were below historical levels as retail store traffic and consumer trips were irregular during the year. Additionally, increased levels of distribution and in-store activity of items such as salty, bakery and meat snacks, by both mainstream and newer contemporary niche manufacturers, were prevalent throughout the year and drove broader snacking category growth in 2014. Despite these market dynamics, for the full year 2014, our U.S. CMG retail takeaway increased 2.7%, which exceeded the category growth rate of 1.8%, and our market share increased by 30 basis points.
Cost of Sales and Gross Margin
2014 compared with 2013
Cost of sales increased 5.7% in 2014 compared with 2013. Higher costs associated with sales volume increases, higher commodity and other incremental supply chain costs and unfavorable sales mix increased total cost of sales by approximately 7.8%. The higher commodity costs were largely driven by higher dairy ingredient costs, which cannot be effectively hedged, while the unfavorable sales mix resulted from a greater proportion of seasonal sales volumes, which are typically at lower margins than non-seasonal products. These cost increases were offset in part by supply chain productivity improvements and lower pension costs, which together reduced cost of sales by approximately 2.1%.
Gross margin decreased by 90 basis points in 2014 compared with 2013. Supply chain productivity and other cost savings initiatives, favorable net price realization, and operating leverage from the higher sales volumes collectively improved gross margin by 150 basis points. The impact of lower pension expenses in 2014 in comparison with 2013 benefited 2014 gross margin by 20 basis points. However, these benefits were more than offset by higher commodity and other input costs and unfavorable sales mix which together reduced gross profit margin by approximately 260 basis points.
2013 compared with 2012
Cost of sales increased 2.1% in 2013 compared with 2012. The impact of sales volume increases and supply chain cost inflation together increased cost of sales by approximately 9.4%. Lower input costs, supply chain productivity improvements and a favorable sales mix reduced cost of sales by approximately 6.3%. Business realignment and impairment charges of $0.4 million were included in cost of sales in 2013, compared with $36.4 million in the prior year, benefiting 2013 cost of sales by 1.0%.
Gross margin increased by 290 basis points in 2013 compared with 2012. Reduced input costs, supply chain productivity improvements, a favorable sales mix and lower fixed costs as a percent of sales together improved gross margin by 390 basis points. These improvements were partially offset by supply chain cost inflation which reduced gross margin by 160 basis points. The impact of lower business realignment and impairment charges recorded in 2013 compared with 2012 benefited 2013 gross margin by 60 basis points.
Selling, Marketing and Administrative
2014 compared with 2013
Selling, marketing and administrative (“SM&A”) expenses decreased $21.5 million or 1.1% in 2014. This includes a 3.1% reduction in advertising and related consumer marketing expenses due to the timing of new product launches, a reduction in media production costs and a decision to shift resources to other more productive areas. Excluding advertising and related consumer marketing expenses, selling and administrative expenses were relatively flat compared to 2013 due to lower incentive compensation costs and discretionary cost containment efforts, offset in part by higher employee-related costs, including additional headcount in our China business and additional focused selling resources, as well as transaction costs associated with the acquisition of SGM. Selling and administrative expenses in 2014 also benefited from the $4.6 million gain recorded in the first quarter on the Lotte Shanghai Food Company (“LSFC”) acquisition and the $5.6 million in foreign currency gains realized on forward contracts related to the manufacturing facility under construction in Johor, Malaysia.
21
2013 compared with 2012
SM&A expenses increased $218.7 million or 12.8% in 2013. Contributing to the overall increase was a 19.7% increase in advertising, consumer promotions and other marketing expenses to support core brands and the introduction of new products in the U.S. and international markets. Excluding the advertising and related consumer marketing costs, selling and administrative expenses increased 8.8% primarily as a result of higher employee-related expenses, increased incentive compensation costs, legal fees and increased marketing research expenses, along with the write-off of certain assets associated with the remodeling of increased office space. There were minimal business realignment charges included in SM&A in 2013 compared with $2.5 million in 2012.
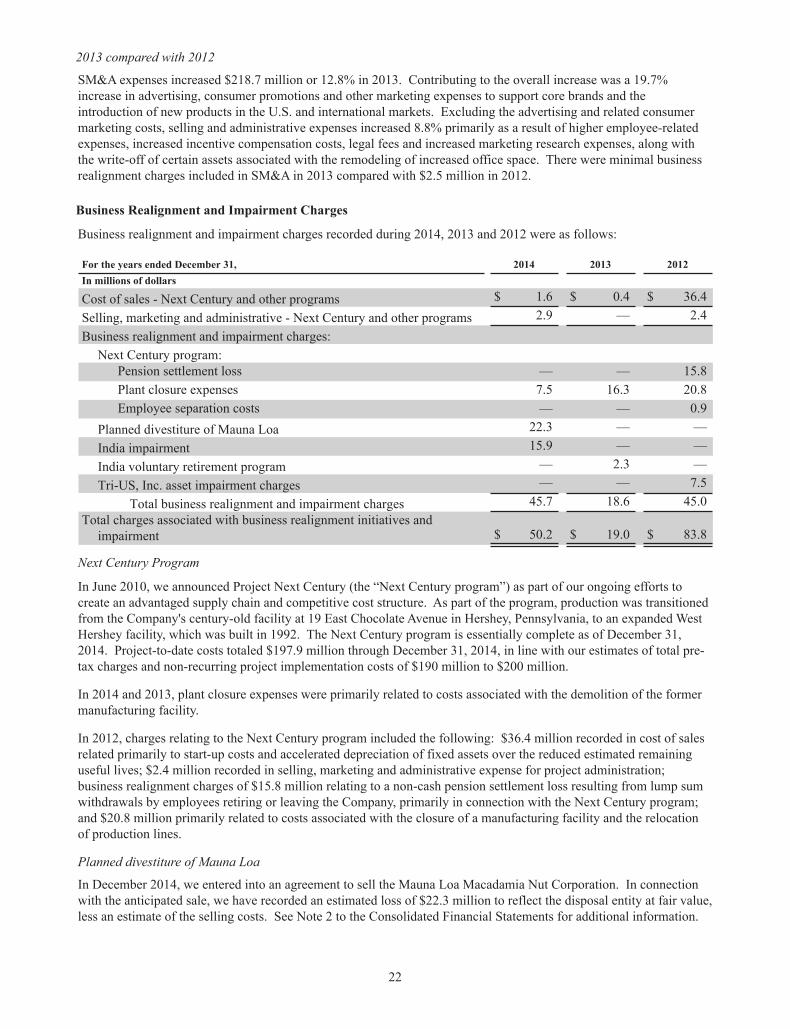
Business Realignment and Impairment Charges
Business realignment and impairment charges recorded during 2014, 2013 and 2012 were as follows:
For the years ended December 31, 2014 2013 2012In millions of dollars
Cost of sales - Next Century and other programs $ 1.6 $ 0.4 $ 36.4Selling, marketing and administrative - Next Century and other programs 2.9 — 2.4Business realignment and impairment charges:
Next Century program:Pension settlement loss — — 15.8Plant closure expenses 7.5 16.3 20.8Employee separation costs — — 0.9
Planned divestiture of Mauna Loa 22.3 — —India impairment 15.9 — —India voluntary retirement program — 2.3 —Tri-US, Inc. asset impairment charges — — 7.5
Total business realignment and impairment charges 45.7 18.6 45.0Total charges associated with business realignment initiatives and
impairment $ 50.2 $ 19.0 $ 83.8
Next Century Program
In June 2010, we announced Project Next Century (the “Next Century program”) as part of our ongoing efforts to create an advantaged supply chain and competitive cost structure. As part of the program, production was transitioned from the Company's century-old facility at 19 East Chocolate Avenue in Hershey, Pennsylvania, to an expanded West Hershey facility, which was built in 1992. The Next Century program is essentially complete as of December 31, 2014. Project-to-date costs totaled $197.9 million through December 31, 2014, in line with our estimates of total pre-tax charges and non-recurring project implementation costs of $190 million to $200 million.
In 2014 and 2013, plant closure expenses were primarily related to costs associated with the demolition of the former manufacturing facility.
In 2012, charges relating to the Next Century program included the following: $36.4 million recorded in cost of sales related primarily to start-up costs and accelerated depreciation of fixed assets over the reduced estimated remaining useful lives; $2.4 million recorded in selling, marketing and administrative expense for project administration; business realignment charges of $15.8 million relating to a non-cash pension settlement loss resulting from lump sum withdrawals by employees retiring or leaving the Company, primarily in connection with the Next Century program; and $20.8 million primarily related to costs associated with the closure of a manufacturing facility and the relocation of production lines.
Planned divestiture of Mauna Loa
In December 2014, we entered into an agreement to sell the Mauna Loa Macadamia Nut Corporation. In connection with the anticipated sale, we have recorded an estimated loss of $22.3 million to reflect the disposal entity at fair value, less an estimate of the selling costs. See Note 2 to the Consolidated Financial Statements for additional information.
22
India impairment
In connection with our annual goodwill and other intangible asset impairment testing, in December 2014, we recorded non-cash goodwill and trademark impairment charges totaling $15.9 million associated with our business in India. See Note 3 to the Consolidated Financial Statements for additional information.
Other international restructuring programs
During 2014, we implemented restructuring programs at several non-U.S. entities to rationalize select manufacturing and distribution activities, resulting in severance and accelerated depreciation costs of $4.5 million. These costs are recorded within cost of sales and selling, marketing and administrative costs. We expect to incur approximately $3.7 million of additional accelerated depreciation in 2015; other remaining costs relating to these programs are not expected to be significant.
Tri-US, Inc. impairment charges
In December 2012, the board of directors of Tri-US, Inc., a company that manufactured, marketed and sold nutritional beverages in which we held a controlling ownership interest, decided to cease operations as a result of operational difficulties, quality issues and competitive constraints. It was determined that investments necessary to continue the business would not generate sufficient return. Accordingly, in December 2012, the Company recorded non-cash impairment charges of approximately $7.5 million, primarily associated with the write off of goodwill and other intangible assets. These charges excluded the portion of the losses attributable to the noncontrolling interests.
Income Before Interest and Income Taxes ("EBIT") and EBIT Margin
2014 compared with 2013
EBIT increased 3.7% in 2014 compared with 2013 due primarily to the higher level of gross profit and lower overall selling, marketing and administrative costs, offset in part by the higher business realignment and impairment charges in 2014, as discussed above.
EBIT margin was 18.7% in 2014 and 2013, respectively. While gross margin declined by 90 basis points in 2014, this was offset by a lower level of SM&A expense as a percent of sales, which was favorable by 130 basis points in 2014.
2013 compared with 2012
EBIT increased in 2013 compared with 2012 as a result of higher gross profit and lower business realignment charges, partially offset by higher selling, marketing and administrative expenses. Pre-tax net business realignment and impairment charges of $19.1 million were recorded in 2013 compared with $83.8 million recorded in 2012.
EBIT margin increased from 16.7% in 2012 to 18.7% in 2013 as a result of higher gross margin and lower business realignment charges, partially offset by higher SM&A expenses as a percent of sales. The net impact of business realignment, impairment and acquisition charges recorded in 2013 reduced EBIT margin by 30 basis points, while business realignment and impairment charges recorded in 2012 reduced EBIT margin by 130 basis point.
Interest Expense, Net
2014 compared with 2013
Net interest expense was $4.8 million lower in 2014 than in 2013 due primarily to a greater level of capitalized interest in 2014 as well as higher interest income earned on short-term investments.
2013 compared with 2012
Net interest expense in 2013 was $7.2 million lower than in 2012 primarily as a result of lower short-term borrowings, partially offset by a decrease in capitalized interest and higher interest expense on long-term debt.
23
Income Taxes and Effective Tax Rate
2014 compared with 2013
Our effective income tax rate was 35.2% for 2014 compared with 34.4% for 2013. The 2014 effective income tax rate was higher due to unfavorable tax return true-up adjustments, unfavorable shifts of taxable income to higher tax jurisdictions, and the impact of business realignment and impairment charges with minimal tax benefit, partly offset by favorable settlement of Canadian assessments and favorable settlement of U.S. audits.
2013 compared with 2012
Our effective income tax rate was 34.4% for 2013 compared with 34.9% for 2012. The decrease in the effective income tax rate in 2013 reflected lower state income taxes, which were higher in 2012 as a result of the impact of certain state tax legislation, and an increase in deductions associated with certain foreign tax jurisdictions, partly offset by a higher benefit in 2012 resulting from the completion of tax audits.
Net Income and Net Income Per Share
2014 compared with 2013
Net income increased $26.4 million, or 3.2%, while earnings per share-diluted (“EPS”) increased $0.16, or 4.4%, in 2014 compared with 2013. The increases in both net income and EPS were driven by higher sales, offset by higher commodity costs and unfavorable sales mix, as noted above. Our 2014 EPS also benefited from lower weighted-average shares outstanding, as a result of share repurchases pursuant to our Board-approved repurchase programs.
2013 compared with 2012
Net income increased $159.6 million, or 24.1%, while EPS-diluted increased $0.72, or 24.9%, in 2013 compared with 2012. The increases in both net income and EPS were driven by higher sales, lower input costs, favorable sales mix and lower business realignment and impairment charges.
24
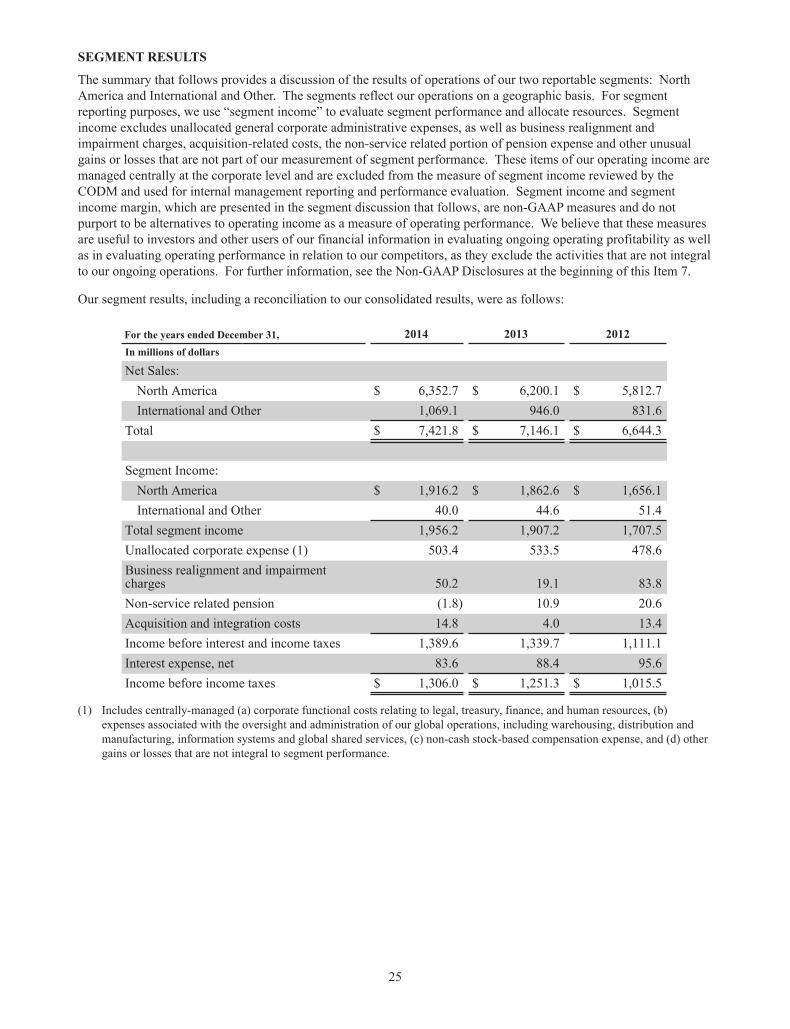
SEGMENT RESULTS
The summary that follows provides a discussion of the results of operations of our two reportable segments: North America and International and Other. The segments reflect our operations on a geographic basis. For segment reporting purposes, we use “segment income” to evaluate segment performance and allocate resources. Segment income excludes unallocated general corporate administrative expenses, as well as business realignment and impairment charges, acquisition-related costs, the non-service related portion of pension expense and other unusual gains or losses that are not part of our measurement of segment performance. These items of our operating income are managed centrally at the corporate level and are excluded from the measure of segment income reviewed by the CODM and used for internal management reporting and performance evaluation. Segment income and segment income margin, which are presented in the segment discussion that follows, are non-GAAP measures and do not purport to be alternatives to operating income as a measure of operating performance. We believe that these measures are useful to investors and other users of our financial information in evaluating ongoing operating profitability as well as in evaluating operating performance in relation to our competitors, as they exclude the activities that are not integral to our ongoing operations. For further information, see the Non-GAAP Disclosures at the beginning of this Item 7.
Our segment results, including a reconciliation to our consolidated results, were as follows:
For the years ended December 31, 2014 2013 2012In millions of dollars
Net Sales:North America $ 6,352.7 $ 6,200.1 $ 5,812.7International and Other 1,069.1 946.0 831.6
Total $ 7,421.8 $ 7,146.1 $ 6,644.3
Segment Income:North America $ 1,916.2 $ 1,862.6 $ 1,656.1International and Other 40.0 44.6 51.4
Total segment income 1,956.2 1,907.2 1,707.5Unallocated corporate expense (1) 503.4 533.5 478.6Business realignment and impairmentcharges 50.2 19.1 83.8Non-service related pension (1.8) 10.9 20.6Acquisition and integration costs 14.8 4.0 13.4Income before interest and income taxes 1,389.6 1,339.7 1,111.1Interest expense, net 83.6 88.4 95.6Income before income taxes $ 1,306.0 $ 1,251.3 $ 1,015.5
(1) Includes centrally-managed (a) corporate functional costs relating to legal, treasury, finance, and human resources, (b) expenses associated with the oversight and administration of our global operations, including warehousing, distribution and manufacturing, information systems and global shared services, (c) non-cash stock-based compensation expense, and (d) other gains or losses that are not integral to segment performance.
25
North America
The North America segment is responsible for our chocolate and sugar confectionery market position in the United States and Canada. This includes developing and growing our business in chocolate, sugar confectionery, refreshment, snack, pantry and food service product lines. North America accounted for 85.6%, 86.8% and 87.5% of our net sales in 2014, 2013 and 2012, respectively. North America results for the years ended December 31, 2014, 2013 and 2012 were as follows:
Percent / Point Change
For the years ended December 31, 2014 2013 2012 2014 vs 2013 2013 vs 2012In millions of dollarsNet sales $ 6,352.7 $ 6,200.1 $ 5,812.7 2.5% 6.7%Segment income 1,916.2 1,862.6 1,656.1 2.9% 12.5%Segment margin 30.2% 30.0% 28.5%
2014 compared with 2013
Net sales of our North America segment increased $152.6 million or 2.5% in 2014 compared to 2013, reflecting volume growth of 2.4%, net price realization of 0.5% and an unfavorable impact from foreign currency exchange rates that reduced net sales by approximately 0.4%. 2014 new product introductions, including York and Kit Kat Minis, Nutrageous relaunch, Brookside Crunchy Clusters, Lancaster Soft Cremes and Hershey's Spreads, drove the volume growth, as sales volumes for core, everyday products were unfavorably impacted by increased levels of distribution and in-store activity from confection and other snacking categories. Higher levels of trade promotion reduced the benefit from the mid-year pricing action. Our Canada operations were impacted by the stronger U.S. dollar, which drove the unfavorable foreign currency impact.
Our North America segment income increased $53.6 million or 2.9% in 2014 compared to 2013, principally due to higher sales volumes and supply chain productivity improvements, which offset input cost increases and unfavorable sales mix. Our core product mix in 2014 was more heavily weighted toward seasonal offerings which typically generate lower margins than our core, everyday instant consumable products. Additionally, advertising, consumer promotions and marketing expenses decreased 2.8% in 2014 due to the timing of new product launches, a reduction in media production costs, and a decision to shift resources to other more productive areas.
2013 compared with 2012
Net sales of our North America segment increased $387.4 million or 6.7% in 2013 compared to 2012, reflecting volume growth of 6.4%, positive net price realization of 0.5% and an unfavorable impact from foreign currency exchange rates of 0.2%. Higher sales of Brookside products contributed 1.4% to the 2013 net sales increase for the segment.
Our North America segment income increased $206.5 million or 12.5% in 2013 compared to 2012, principally due to higher sales volumes, positive sales mix and lower commodity input costs. However, advertising, consumer promotions and marketing expenses increased 15.0% to support core brands and the introduction of new products, which offset some of the increase. Additionally, segment expenses were higher as a result of increased employee-related, incentive compensation and marketing research expenses.
International and Other
The International and Other segment includes all other countries where we currently manufacture, import, market, sell or distribute chocolate, sugar confectionery and other products. Currently, this includes our operations in Asia, Latin America, Europe, Africa, and the Middle East, along with exports to these regions. While a minor component, this segment also includes our global retail operations, including Hershey’s Chocolate World stores in Hershey, Pennsylvania, New York City, Chicago, Las Vegas, Shanghai, Niagara Falls (Ontario), Dubai and Singapore, as well as operations associated with licensing the use of certain trademarks and products to third parties around the world. International and Other accounted for 14.4%, 13.2% and 12.5% of our net sales in 2014, 2013 and 2012, respectively. International and Other results for the years ended December 31, 2014, 2013 and 2012 were as follows:
26
Percent / Point Change
For the years ended December 31, 2014 2013 2012 2014 vs 2013 2013 vs 2012In millions of dollars
Net sales $ 1,069.1 $ 946.0 $ 831.6 13.0 % 13.8 %Segment income 40.0 44.6 51.4 (10.3)% (13.2)%Segment margin 3.7% 4.7% 6.2%
2014 compared with 2013
Net sales of our International and Other segment increased $123.1 million or 13.0% in 2014 compared to 2013, reflecting volume growth of 17.0%, unfavorable net price realization of 1.7%, and an unfavorable impact from foreign currency exchange rates that reduced net sales by approximately 2.3%. The sales volume increase was primarily due to increased demand for new and existing products in China as well as $54 million of incremental sales from the newly acquired SGM business. Excluding SGM, our 2014 chocolate net sales grew 35% in China and we increased our market share to almost 10% of the chocolate category. Our 2014 sales in Mexico were unfavorably impacted by the challenging economic environment, while our Brazil performance improved sequentially as the year progressed, finishing 2014 up approximately 7% from the prior year, excluding the impact of unfavorable currency. The unfavorable price realization reflects increased trade promotions and allowances, particularly in China and Mexico where we have made additional investments to drive sales volume growth.
Our International and Other segment income decreased $4.6 million or 10.3% in 2014 compared to 2013, as the benefit from higher sales volume was more than offset by higher trade promotions and a 5.9% higher investment in advertising to support core brands and the introduction of new products in our international markets. The most significant portion of this investment was focused on our China and Mexico markets. We also increased headcount, particularly in China in support of sales growth.
2013 compared with 2012
Net sales of our International and Other segment increased $114.4 million or 13.8% in 2013 compared to 2012, reflecting volume growth of 17.0%, unfavorable net price realization of 2.4%, and an unfavorable impact from foreign currency exchange rates that reduced net sales by approximately 0.9%. The sales volume increase was primarily due to sales growth in China, Mexico and Brazil, while the unfavorable price realization reflects increased trade promotions and allowances, particularly in China and Mexico where we have made additional investments to drive sales volume growth.
Our International and Other segment income decreased $6.8 million or 13.2% in 2013 compared to 2012, as the benefit from higher sales volume and improved gross margins was more than offset by a 44.8% higher investment in advertising, consumer promotions and marketing expenses to support core brands and the introduction of new products in our international markets. The most significant portion of this investment was focused on our China and Mexico markets.
Unallocated Corporate Items
Unallocated corporate administration includes centrally-managed (a) corporate functional costs relating to legal, treasury, finance and human resources, (b) expenses associated with the oversight and administration of our global operations, including warehousing, distribution and manufacturing, information systems and global shared services, (c) non-cash stock-based compensation expense, and (d) other gains or losses that are not integral to segment performance.
In 2014, unallocated corporate items totaled $503.4 million compared to $533.5 million in 2013, with the reduction driven by lower incentive compensation expense as well as discretionary cost containment measures intended to mitigate the higher commodity and other input costs in 2014.
In 2013, unallocated corporate items totaled $533.5 million compared to $478.6 million in 2012, with the increase primarily a result of higher salaries, benefits and incentive compensation, higher spending on outside services and consulting, and higher legal fees and accruals.
27
FINANCIAL CONDITION
We assess our liquidity in terms of our ability to generate cash to fund our operating, investing and financing activities. Significant factors affecting liquidity include cash flows generated from operating activities, capital expenditures, acquisitions, dividends, repurchase of outstanding shares, adequacy of available commercial paper and bank lines of credit, and the ability to attract long-term capital with satisfactory terms. We generate substantial cash from operations and remain in a strong financial position, with sufficient liquidity available for capital reinvestment, payment of dividends and strategic acquisitions.
Cash Flow Summary
The following table is derived from our Consolidated Statement of Cash Flows:
In millions of dollars 2014 2013 2012
Net cash provided by (used in):Operating activities $ 838.2 $ 1,188.4 $ 1,094.8Investing activities (862.6) (351.6) (473.4)Financing activities (719.3) (446.6) (586.9)Increase (decrease) in cash and cash equivalents (743.7) 390.2 34.5
Operating activities
Our principal source of liquidity is operating cash flows. Our net income and, consequently, our cash provided by operations are impacted by sales volume, seasonal sales patterns, timing of new product introductions, profit margins and price changes. Sales are typically higher during the third and fourth quarters of the year due to seasonal and holiday-related sales patterns. Generally, working capital needs peak during the summer months. We meet these needs primarily with cash on hand, bank borrowings or the issuance of commercial paper.
Cash provided by operating activities in 2014 decreased $350.2 million relative to 2013. This decline was driven by the following factors:
• Working capital (comprised of accounts receivable, inventory and accounts payable) consumed cash of $169 million in 2014 compared to $29 million in 2013. Higher sales volumes late in the year and slightly higher accounts receivable days sales outstanding drove higher accounts receivable balances, while bulk purchases of certain ingredients at favorable pricing resulted in higher inventory balances.
• The impact of our hedging activities unfavorably impacted cash flow by $78 million in 2014 versus a positive $101 million impact in 2013. This reflects the impact of non-cash gains and losses amortized to income from accumulated other comprehensive income, coupled with the cash flow impact of market gains and losses on our commodity futures. Our cash outlays typically increase when futures market prices are decreasing.
• Lower incentive accruals and advertising and promotion accruals drove additional reductions in 2014 operating cash flow relative to 2013.
Partially offsetting these declines were higher net earnings adjusted for non-cash items (depreciation and amortization, stock-based compensation, deferred income taxes, impairments and loss on disposal of business) resulting from higher sales volumes during the year.
Cash provided by operating activities in 2013 increased $93.6 million as compared to 2012, primarily due to increased net earnings in 2013, partly offset by a $27 million incrementally higher investment in working capital to support the higher sales volumes. Derivative activities had a similar impact on 2013 and 2012 operating cash flow.
Pension and Post-Retirement Activity. We recorded net periodic benefit costs of $38.2 million, $55.8 million, and$83.5 million in 2014, 2013, and 2012, respectively, relating to our benefit plans (including our defined benefit and other post retirement plans). The main drivers of fluctuations in expense from year to year are assumptions in formulating our long-term estimates, including discount rates used to value plan obligations, expected returns on plan assets, the service and interest costs, and the amortization of actuarial gains and losses, as well as a $20 million settlement loss in 2012 relating largely to the Next Century program.
28
The funded status of our qualified defined benefit pension plans is dependent upon many factors, including returns on invested assets, the level of market interest rates and the level of funding. We contribute cash to our plans at our discretion, subject to applicable regulations and minimum contribution requirements. Cash contributions to our pension and post retirement plans totaled $53.1 million, $57.2 million and $44.2 million in 2014, 2013 and 2012,respectively.
Investing activities
Our principal uses of cash for investment purposes relate to purchases of property, plant and equipment and capitalized software, purchases of short-term investments and acquisitions of businesses, partially offset by proceeds from sales of property, plant and equipment. We used cash of $862.6 million for investing activities in 2014 compared to $351.6 million in 2013, with the increase driven by 2014 business acquisitions and the purchase of short term investments. We used cash of $473.4 million for investing activities in 2012, which exceeded the use in 2013 due mainly to the 2012 Brookside acquisition.
Primary investing activities include the following:
• Capital spending. Capital expenditures, primarily to support capacity expansion, innovation, and cost savings, were $345.9 million in 2014, $323.6 million in 2013 and $258.7 million in 2012. Our 2014 expenditures include $115 million relating to the construction of a manufacturing facility in Malaysia, compared to $40 million in 2013. Capital expenditures in 2013 and 2012 included $11.8 million and $74.7 million, respectively, relating to the Next Century program. Capitalized software additions were primarily related to ongoing enhancements of our information systems. We expect 2015 capital expenditures, including capitalized software, to approximate $375 million to $400 million, of which $90 million to $110 million relates to the facility in Malaysia.
• Acquisitions. In 2014, we spent $396.3 million to acquire three businesses, including $379.7 million for SGM and $26.6 million for Allan, partially offset by net cash received of $10.0 million relating to the LSFC acquisition, whereby cash acquired in the transaction exceeded the $5.6 million paid for the controlling interest. In 2012, we acquired Brookside for approximately $172.9 million. See Note 2 to the Consolidated Financial Statements for additional information regarding our recent acquisitions.
Financing activities
Our cash flow from financing activities generally relates to the use of cash for purchases of our Common Stock and payment of dividends, offset by net borrowing activity and proceeds from the exercise of stock options. We used cash of $719.3 million for financing activities in 2014 compared to $446.6 million in 2013, with the increase due mainly to higher dividend payments and share repurchases, offset in part by higher short term borrowings. We used cash of $586.9 million for financing activities in 2012, which exceeded the use in 2013 primarily due to higher share repurchases, offset in part by higher proceeds from the exercise of stock options and lower dividend payments.
The majority of our financing activity was attributed to the following:
• Short-term borrowings, net. In addition to utilizing cash on hand, we use short-term borrowings (commercial paper and bank borrowings) to fund seasonal working capital requirements and ongoing business needs. In 2014, we generated additional cash flow from the issuance of $55.0 million in commercial paper, as well as incrementally higher borrowings at certain of our international businesses in support of sales growth.
• Long-term debt borrowings and repayments. In 2013, we repaid $250 million of 5.0% Notes due in 2013 and issued $250 million of 2.625% Notes due in 2023. In August 2012, we repaid $92.5 million of 6.95% Notes due in 2012.
• Share repurchases. We repurchase shares of Common Stock to offset the dilutive impact of treasury shares issued under our equity compensation plans. The value of these share repurchases in a given period varies based on the volume of stock options exercised and our market price. In addition, we periodically repurchase shares of Common Stock pursuant to Board-authorized programs intended to drive additional stockholder value. In 2014, we used $202.3 million to purchase 2.1 million shares pursuant to authorized programs, while we had no share repurchases under these programs in 2013. In 2012, we repurchased 2.1 million shares for $124.9 million pursuant to authorized programs. As of December 31, 2014, approximately $173 million
29
remained available under the $250 million share repurchase authorization approved by the Board in February 2014.
• Dividend payments. Total dividend payments to holders of our Common Stock and Class B Common Stock were $440.4 million in 2014, $393.8 million in 2013 and $341.2 million in 2012. Dividends per share of Common Stock increased 13% to $2.04 per share in 2014 compared to $1.81 per share in 2013, while dividends per share of Class B Common Stock increased 13%.
• Proceeds from the exercise of stock options, including tax benefits. We received $175.8 million from employee exercises of stock options, including excess tax benefits, in 2014, as compared to $195.7 million in 2013 and $295.5 million in 2012. Variances are driven by the number of shares exercised and the share price at the date of grant.
• Other. In September 2012, we acquired the remaining 49% interest in Godrej Hershey Ltd. for approximately $15.8 million. Since May of 2007, we had owned a 51% controlling interest on the basis of an agreement with Godrej Beverages and Foods, Ltd., a consumer goods, confectionery and food company, to manufacture and distribute confectionery products, snacks and beverages across India.
Liquidity and Capital Resources
At December 31, 2014, our cash and cash equivalents totaled $374.9 million, and we held short-term investments in the form of term deposits with original maturities of one-year totaling $97.1 million. In total, our cash and short-term investments declined $646.5 million compared to the 2013 year-end balance of $1.1 billion as a result of the net uses of cash outlined in the previous discussion.
Approximately half of the balance of our cash, cash equivalents and short term investments at December 31, 2014 was held by subsidiaries domiciled outside of the United States. If these amounts held outside of the United States were to be repatriated, under current law, they would be subject to U.S. federal income taxes, less applicable foreign tax credits. However, our intent is to permanently reinvest these funds outside of the United States. The cash that our foreign subsidiaries hold for indefinite reinvestment is expected to be used to finance foreign operations and investments. We believe we have sufficient liquidity to satisfy our cash needs, including our cash needs in the United States.
We maintain debt levels we consider prudent based on our cash flow, interest coverage ratio and percentage of debt to capital. We use debt financing to lower our overall cost of capital which increases our return on stockholders’ equity. Our total debt was $2.2 billion at December 31, 2014 and $2.0 billion at December 31, 2013. Our total debt increased in 2014 mainly due to the increase in commercial paper outstanding, additional debt assumed in the SGM acquisition and additional short-term borrowings used to fund growth in our existing China operations.
In October 2011, we entered into a five-year agreement establishing an unsecured revolving credit facility to borrow up to $1.1 billion, with an option to increase borrowings by an additional $400 million with the consent of the lenders. In November 2013, this agreement was amended to reduce the amount of borrowings available under the unsecured revolving credit facility to $1.0 billion, maintain the option to increase borrowings by an additional $400 million with the consent of the lenders, and extend the termination date to November 2018. In November 2014, the termination date of this agreement was extended an additional year to November 2019. As of December 31, 2014, $1.0 billion was available to borrow under the agreement and no borrowings were outstanding. The unsecured revolving credit agreement contains certain financial and other covenants, customary representations, warranties and events of default. We were in compliance with all covenants as of December 31, 2014. We may use these funds for general corporate purposes, including commercial paper backstop and business acquisitions.
In addition to the revolving credit facility, we maintain lines of credit in various currencies with domestic and international commercial banks. As of December 31, 2014, we had available capacity of $117.9 million under these lines of credit.
Furthermore, we have a current shelf registration statement filed with the United States Securities and Exchange Commission that allows for the issuance of an indeterminate amount of debt securities. Proceeds from the debt issuances and any other offerings under the current registration statement may be used for general corporate
30
requirements, including reducing existing borrowings, financing capital additions, and funding contributions to our pension plans, future business acquisitions and working capital requirements.
Our ability to obtain debt financing at comparable risk-based interest rates is partly a function of our existing cash-flow-to-debt and debt-to-capitalization levels as well as our current credit standing.
We believe that our existing sources of liquidity are adequate to meet anticipated funding needs at comparable risk-based interest rates for the foreseeable future. Acquisition spending and/or share repurchases could potentially increase our debt. Operating cash flow and access to capital markets are expected to satisfy our various cash flow requirements, including acquisitions and capital expenditures.
Equity Structure
We have two classes of stock outstanding – Common Stock and Class B Common Stock (“Class B Stock”). Holders of the Common Stock and the Class B Stock generally vote together without regard to class on matters submitted to stockholders, including the election of directors. Holders of the Common Stock have 1 vote per share. Holders of the Class B Stock have 10 votes per share. Holders of the Common Stock, voting separately as a class, are entitled to elect one-sixth of our Board. With respect to dividend rights, holders of the Common Stock are entitled to cash dividends 10% higher than those declared and paid on the Class B Stock.
Hershey Trust Company, as trustee for the benefit of Milton Hershey School, maintains voting control over The Hershey Company. In addition, Hershey Trust Company currently has three representatives who are members of the Company's Board, one of whom is the Chairman of the Board. These representatives, from time to time in performing their responsibilities on the Company’s Board, may exercise influence with regard to the ongoing business decisions of our Board or management. Hershey Trust Company, as trustee for the benefit of Milton Hershey School, in its role as controlling stockholder of the Company, has indicated it intends to retain its controlling interest in The Hershey Company and that the Company Board, and not the Hershey Trust Company board, is solely responsible and accountable for the Company’s management and performance.
Pennsylvania law requires that the Office of Attorney General be provided advance notice of any transaction that would result in Hershey Trust Company, as trustee for the benefit of Milton Hershey School, no longer having voting control of the Company. The law provides specific statutory authority for the Attorney General to intercede and petition the Court having jurisdiction over the Hershey Trust Company, as trustee for the benefit of Milton Hershey School, to stop such a transaction if the Attorney General can prove that the transaction is unnecessary for the future economic viability of the Company and is inconsistent with investment and management considerations under fiduciary obligations. This legislation makes it more difficult for a third party to acquire a majority of our outstanding voting stock and thereby may delay or prevent a change in control of the Company.
Guarantees and Other Off-Balance Sheet Arrangements
We do not have guarantees or other off-balance sheet financing arrangements, including variable interest entities, which we believe could have a material impact on our financial condition or liquidity.
31
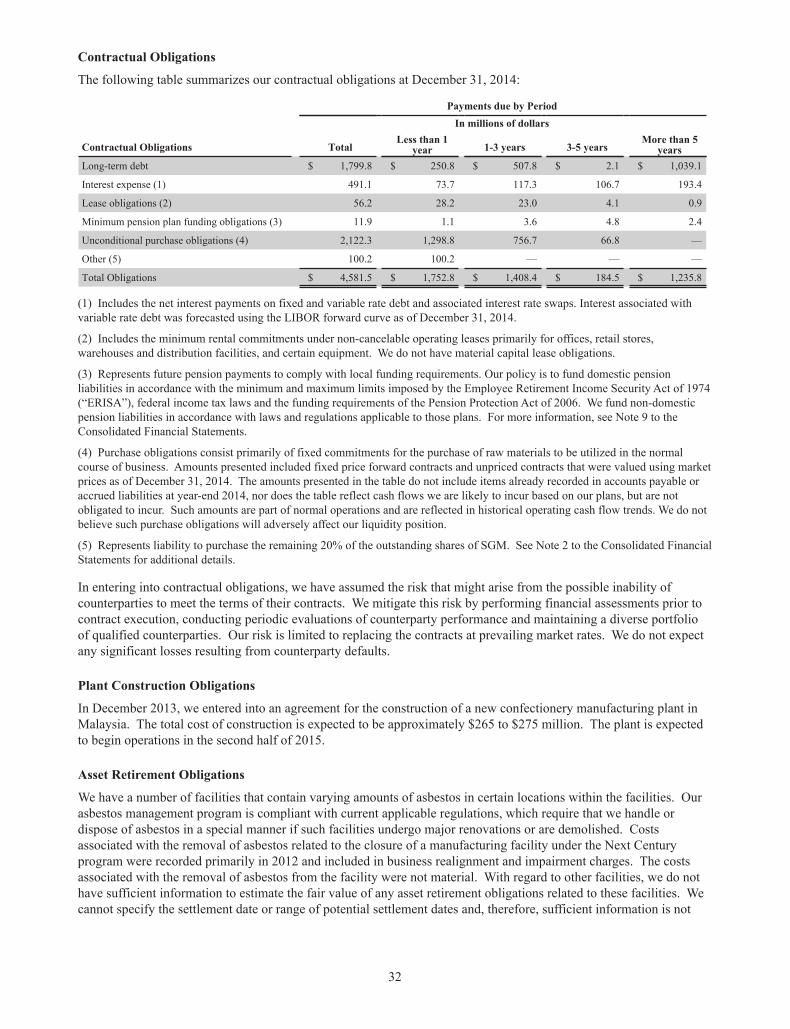
Contractual Obligations
The following table summarizes our contractual obligations at December 31, 2014:
Payments due by PeriodIn millions of dollars
Contractual Obligations TotalLess than 1
year 1-3 years 3-5 yearsMore than 5
yearsLong-term debt $ 1,799.8 $ 250.8 $ 507.8 $ 2.1 $ 1,039.1
Interest expense (1) 491.1 73.7 117.3 106.7 193.4
Lease obligations (2) 56.2 28.2 23.0 4.1 0.9
Minimum pension plan funding obligations (3) 11.9 1.1 3.6 4.8 2.4
Unconditional purchase obligations (4) 2,122.3 1,298.8 756.7 66.8 —
Other (5) 100.2 100.2 — — —
Total Obligations $ 4,581.5 $ 1,752.8 $ 1,408.4 $ 184.5 $ 1,235.8
(1) Includes the net interest payments on fixed and variable rate debt and associated interest rate swaps. Interest associated with variable rate debt was forecasted using the LIBOR forward curve as of December 31, 2014.
(2) Includes the minimum rental commitments under non-cancelable operating leases primarily for offices, retail stores, warehouses and distribution facilities, and certain equipment. We do not have material capital lease obligations.
(3) Represents future pension payments to comply with local funding requirements. Our policy is to fund domestic pension liabilities in accordance with the minimum and maximum limits imposed by the Employee Retirement Income Security Act of 1974 (“ERISA”), federal income tax laws and the funding requirements of the Pension Protection Act of 2006. We fund non-domestic pension liabilities in accordance with laws and regulations applicable to those plans. For more information, see Note 9 to the Consolidated Financial Statements.
(4) Purchase obligations consist primarily of fixed commitments for the purchase of raw materials to be utilized in the normal course of business. Amounts presented included fixed price forward contracts and unpriced contracts that were valued using market prices as of December 31, 2014. The amounts presented in the table do not include items already recorded in accounts payable or accrued liabilities at year-end 2014, nor does the table reflect cash flows we are likely to incur based on our plans, but are not obligated to incur. Such amounts are part of normal operations and are reflected in historical operating cash flow trends. We do not believe such purchase obligations will adversely affect our liquidity position.
(5) Represents liability to purchase the remaining 20% of the outstanding shares of SGM. See Note 2 to the Consolidated Financial Statements for additional details.
In entering into contractual obligations, we have assumed the risk that might arise from the possible inability of counterparties to meet the terms of their contracts. We mitigate this risk by performing financial assessments prior to contract execution, conducting periodic evaluations of counterparty performance and maintaining a diverse portfolio of qualified counterparties. Our risk is limited to replacing the contracts at prevailing market rates. We do not expect any significant losses resulting from counterparty defaults.
Plant Construction Obligations
In December 2013, we entered into an agreement for the construction of a new confectionery manufacturing plant in Malaysia. The total cost of construction is expected to be approximately $265 to $275 million. The plant is expected to begin operations in the second half of 2015.
Asset Retirement Obligations
We have a number of facilities that contain varying amounts of asbestos in certain locations within the facilities. Our asbestos management program is compliant with current applicable regulations, which require that we handle or dispose of asbestos in a special manner if such facilities undergo major renovations or are demolished. Costs associated with the removal of asbestos related to the closure of a manufacturing facility under the Next Century program were recorded primarily in 2012 and included in business realignment and impairment charges. The costs associated with the removal of asbestos from the facility were not material. With regard to other facilities, we do not have sufficient information to estimate the fair value of any asset retirement obligations related to these facilities. We cannot specify the settlement date or range of potential settlement dates and, therefore, sufficient information is not
32
available to apply an expected present value technique. We expect to maintain the facilities with repairs and maintenance activities that would not involve or require the removal of significant quantities of asbestos.
Income Tax Obligations
Liabilities for unrecognized income tax benefits are excluded from the table above as we are unable to reasonably predict the ultimate amount or timing of a settlement of these potential liabilities. See Note 7 to our Consolidated Financial Statements for more information.
CRITICAL ACCOUNTING POLICIES AND ESTIMATES
The preparation of financial statements requires management to use judgment and make estimates and assumptions. We believe that our most critical accounting policies and estimates relate to the following:
Accrued Liabilities for Trade Promotion ActivitiesPension and Other Post-Retirement Benefits PlansGoodwill and Other Intangible AssetsCommodities Futures and Options ContractsIncome Taxes
Management has discussed the development, selection and disclosure of critical accounting policies and estimates with the Audit Committee of our Board. While we base estimates and assumptions on our knowledge of current events and actions we may undertake in the future, actual results may ultimately differ from these estimates and assumptions. Other significant accounting policies are outlined in Note 1 to our Consolidated Financial Statements.
Accrued Liabilities for Trade Promotion Activities
We promote our products with advertising, trade promotions and consumer incentives. These programs include, but are not limited to, discounts, coupons, rebates, in-store display incentives and volume-based incentives. We expense advertising costs and other direct marketing expenses as incurred. We recognize the costs of trade promotion and consumer incentive activities as a reduction to net sales along with a corresponding accrued liability based on estimates at the time of revenue recognition. These estimates are based on our analysis of the programs offered, historical trends, expectations regarding customer and consumer participation, sales and payment trends and our experience with payment patterns associated with similar programs offered in the past.
Our trade promotional costs totaled $1,125.5 million, $995.7 million and $949.3 million in 2014, 2013 and 2012, respectively. The estimated costs of these programs are reasonably likely to change in the future due to changes in trends with regard to customer and consumer participation, particularly for new programs and for programs related to the introduction of new products. Differences between estimated expense and actual program performance are recognized as a change in estimate in a subsequent period and are normally not significant. Over the three-year period ended December 31, 2014, actual promotional costs have not deviated from the estimated amount for a given year by more than approximately 3%.
Pension and Other Post-Retirement Benefits Plans
We sponsor various defined benefit pension plans. The primary plans are The Hershey Company Retirement Plan and The Hershey Company Retirement Plan for Hourly Employees, which are cash balance plans that provide pension benefits for most U.S. employees hired prior to January 1, 2007. We also sponsor two primary other post-employment benefit (“OPEB”) plans, consisting of a health care plan and life insurance plan for retirees. The health care plan is contributory, with participants’ contributions adjusted annually, and the life insurance plan is non-contributory.
For accounting purposes, the defined benefit pension and OPEB plans require assumptions to estimate the projected and accumulated benefit obligations, including the following variables: discount rate; expected salary increases; certain employee-related factors, such as turnover, retirement age and mortality; expected return on assets; and health care cost trend rates. These and other assumptions affect the annual expense and obligations recognized for the underlying plans. Our assumptions reflect our historical experiences and management's best judgment regarding future expectations.
33
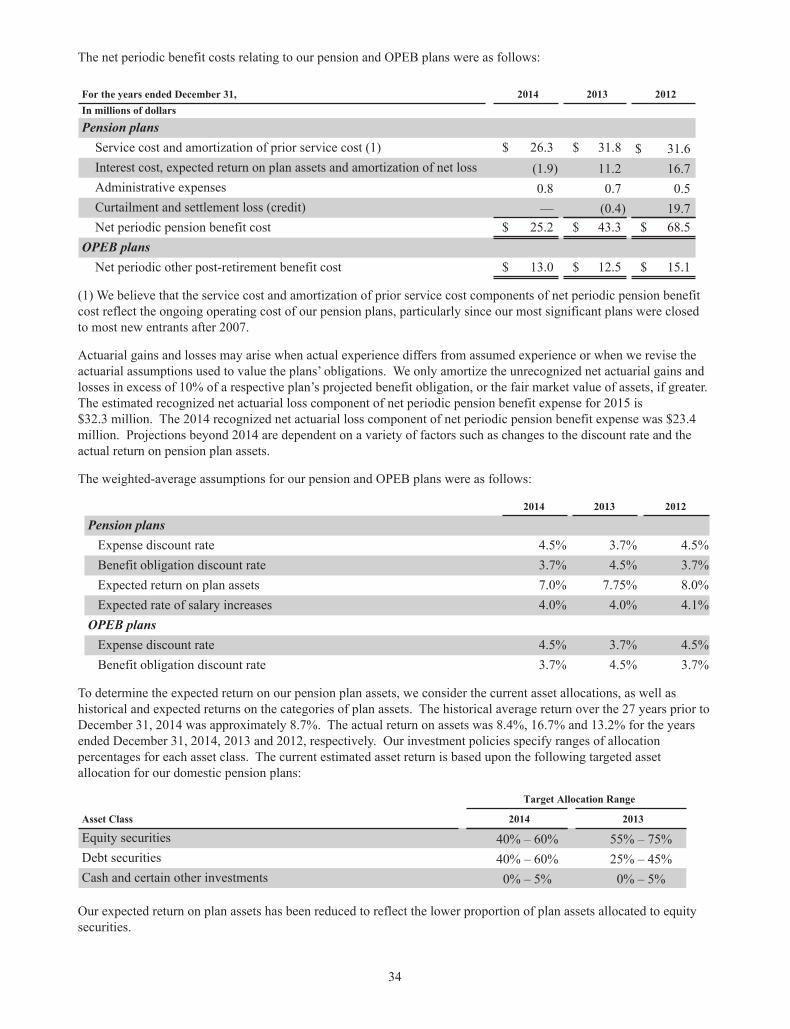
The net periodic benefit costs relating to our pension and OPEB plans were as follows:
For the years ended December 31, 2014 2013 2012In millions of dollars
Pension plans Service cost and amortization of prior service cost (1) $ 26.3 $ 31.8 $ 31.6 Interest cost, expected return on plan assets and amortization of net loss (1.9) 11.2 16.7 Administrative expenses 0.8 0.7 0.5 Curtailment and settlement loss (credit) — (0.4) 19.7 Net periodic pension benefit cost $ 25.2 $ 43.3 $ 68.5OPEB plans Net periodic other post-retirement benefit cost $ 13.0 $ 12.5 $ 15.1
(1) We believe that the service cost and amortization of prior service cost components of net periodic pension benefit cost reflect the ongoing operating cost of our pension plans, particularly since our most significant plans were closed to most new entrants after 2007.
Actuarial gains and losses may arise when actual experience differs from assumed experience or when we revise the actuarial assumptions used to value the plans’ obligations. We only amortize the unrecognized net actuarial gains and losses in excess of 10% of a respective plan’s projected benefit obligation, or the fair market value of assets, if greater. The estimated recognized net actuarial loss component of net periodic pension benefit expense for 2015 is $32.3 million. The 2014 recognized net actuarial loss component of net periodic pension benefit expense was $23.4 million. Projections beyond 2014 are dependent on a variety of factors such as changes to the discount rate and the actual return on pension plan assets.
The weighted-average assumptions for our pension and OPEB plans were as follows:
2014 2013 2012
Pension plans Expense discount rate 4.5% 3.7% 4.5% Benefit obligation discount rate 3.7% 4.5% 3.7% Expected return on plan assets 7.0% 7.75% 8.0% Expected rate of salary increases 4.0% 4.0% 4.1%OPEB plans Expense discount rate 4.5% 3.7% 4.5% Benefit obligation discount rate 3.7% 4.5% 3.7%
To determine the expected return on our pension plan assets, we consider the current asset allocations, as well as historical and expected returns on the categories of plan assets. The historical average return over the 27 years prior to December 31, 2014 was approximately 8.7%. The actual return on assets was 8.4%, 16.7% and 13.2% for the years ended December 31, 2014, 2013 and 2012, respectively. Our investment policies specify ranges of allocation percentages for each asset class. The current estimated asset return is based upon the following targeted asset allocation for our domestic pension plans:
Target Allocation Range
Asset Class 2014 2013
Equity securities 40% – 60% 55% – 75%Debt securities 40% – 60% 25% – 45%Cash and certain other investments 0% – 5% 0% – 5%
Our expected return on plan assets has been reduced to reflect the lower proportion of plan assets allocated to equity securities.
34
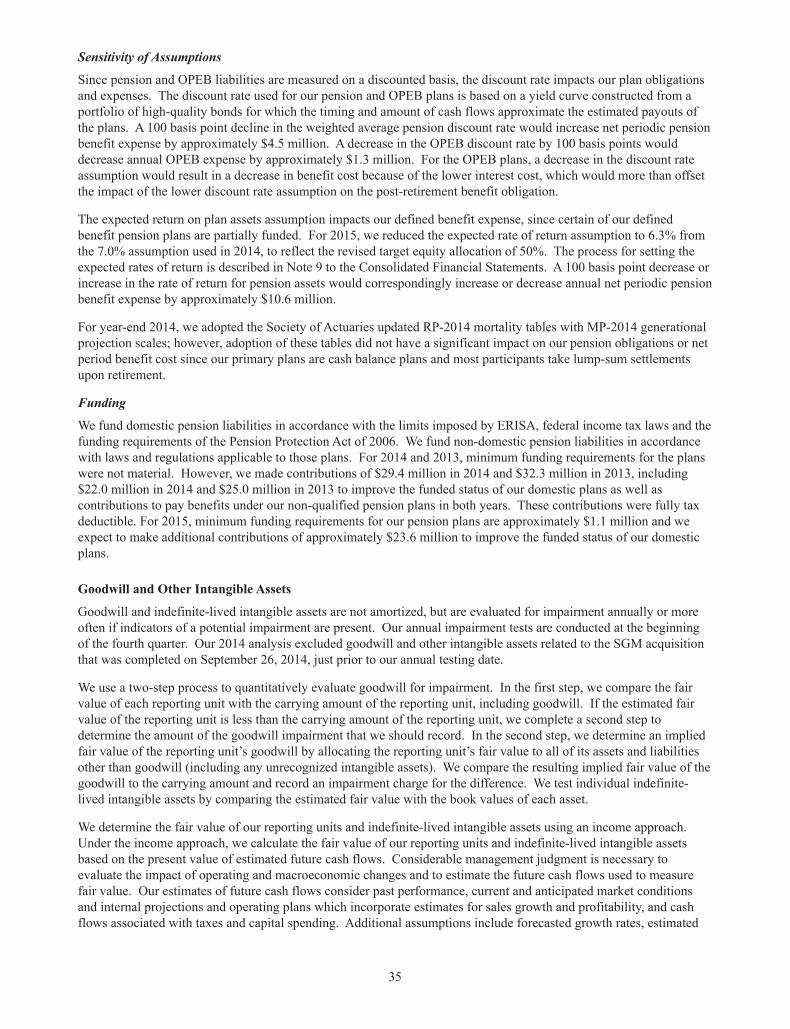
Sensitivity of Assumptions
Since pension and OPEB liabilities are measured on a discounted basis, the discount rate impacts our plan obligations and expenses. The discount rate used for our pension and OPEB plans is based on a yield curve constructed from a portfolio of high-quality bonds for which the timing and amount of cash flows approximate the estimated payouts of the plans. A 100 basis point decline in the weighted average pension discount rate would increase net periodic pension benefit expense by approximately $4.5 million. A decrease in the OPEB discount rate by 100 basis points would decrease annual OPEB expense by approximately $1.3 million. For the OPEB plans, a decrease in the discount rate assumption would result in a decrease in benefit cost because of the lower interest cost, which would more than offset the impact of the lower discount rate assumption on the post-retirement benefit obligation.
The expected return on plan assets assumption impacts our defined benefit expense, since certain of our defined benefit pension plans are partially funded. For 2015, we reduced the expected rate of return assumption to 6.3% from the 7.0% assumption used in 2014, to reflect the revised target equity allocation of 50%. The process for setting the expected rates of return is described in Note 9 to the Consolidated Financial Statements. A 100 basis point decrease or increase in the rate of return for pension assets would correspondingly increase or decrease annual net periodic pension benefit expense by approximately $10.6 million.
For year-end 2014, we adopted the Society of Actuaries updated RP-2014 mortality tables with MP-2014 generational projection scales; however, adoption of these tables did not have a significant impact on our pension obligations or net period benefit cost since our primary plans are cash balance plans and most participants take lump-sum settlements upon retirement.
Funding
We fund domestic pension liabilities in accordance with the limits imposed by ERISA, federal income tax laws and the funding requirements of the Pension Protection Act of 2006. We fund non-domestic pension liabilities in accordance with laws and regulations applicable to those plans. For 2014 and 2013, minimum funding requirements for the plans were not material. However, we made contributions of $29.4 million in 2014 and $32.3 million in 2013, including $22.0 million in 2014 and $25.0 million in 2013 to improve the funded status of our domestic plans as well as contributions to pay benefits under our non-qualified pension plans in both years. These contributions were fully tax deductible. For 2015, minimum funding requirements for our pension plans are approximately $1.1 million and we expect to make additional contributions of approximately $23.6 million to improve the funded status of our domestic plans.
Goodwill and Other Intangible Assets
Goodwill and indefinite-lived intangible assets are not amortized, but are evaluated for impairment annually or more often if indicators of a potential impairment are present. Our annual impairment tests are conducted at the beginning of the fourth quarter. Our 2014 analysis excluded goodwill and other intangible assets related to the SGM acquisition that was completed on September 26, 2014, just prior to our annual testing date.
We use a two-step process to quantitatively evaluate goodwill for impairment. In the first step, we compare the fair value of each reporting unit with the carrying amount of the reporting unit, including goodwill. If the estimated fair value of the reporting unit is less than the carrying amount of the reporting unit, we complete a second step to determine the amount of the goodwill impairment that we should record. In the second step, we determine an implied fair value of the reporting unit’s goodwill by allocating the reporting unit’s fair value to all of its assets and liabilities other than goodwill (including any unrecognized intangible assets). We compare the resulting implied fair value of the goodwill to the carrying amount and record an impairment charge for the difference. We test individual indefinite-lived intangible assets by comparing the estimated fair value with the book values of each asset.
We determine the fair value of our reporting units and indefinite-lived intangible assets using an income approach. Under the income approach, we calculate the fair value of our reporting units and indefinite-lived intangible assets based on the present value of estimated future cash flows. Considerable management judgment is necessary to evaluate the impact of operating and macroeconomic changes and to estimate the future cash flows used to measure fair value. Our estimates of future cash flows consider past performance, current and anticipated market conditions and internal projections and operating plans which incorporate estimates for sales growth and profitability, and cash flows associated with taxes and capital spending. Additional assumptions include forecasted growth rates, estimated
35
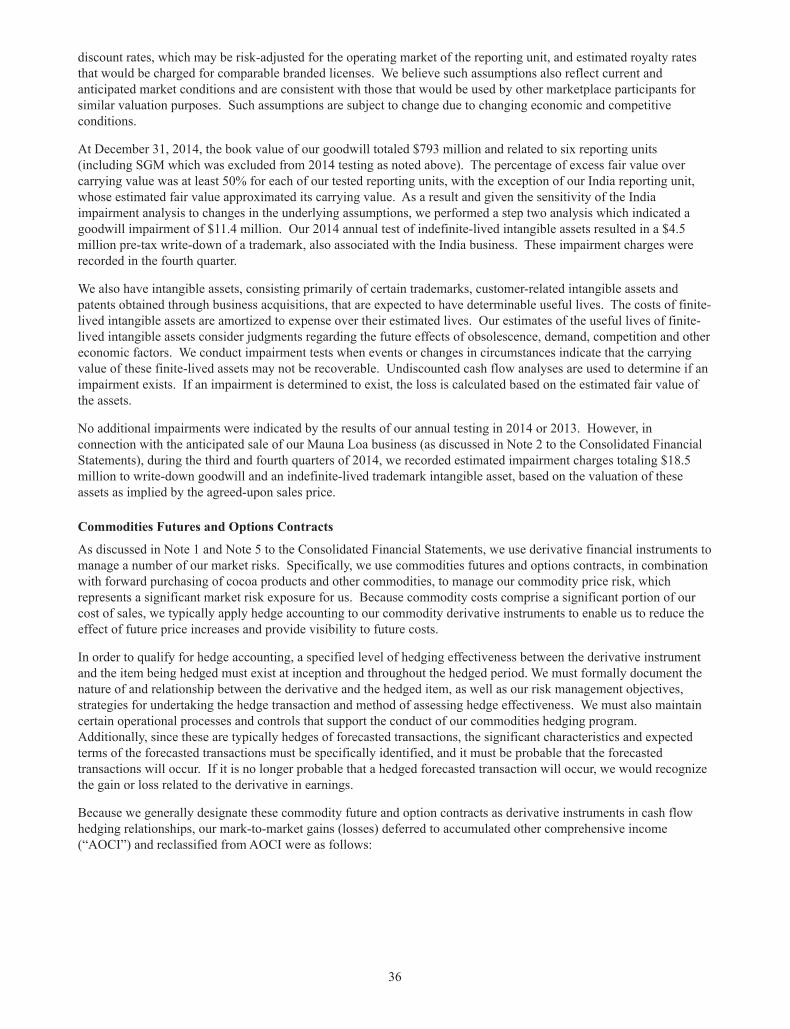
discount rates, which may be risk-adjusted for the operating market of the reporting unit, and estimated royalty rates that would be charged for comparable branded licenses. We believe such assumptions also reflect current and anticipated market conditions and are consistent with those that would be used by other marketplace participants for similar valuation purposes. Such assumptions are subject to change due to changing economic and competitive conditions.
At December 31, 2014, the book value of our goodwill totaled $793 million and related to six reporting units (including SGM which was excluded from 2014 testing as noted above). The percentage of excess fair value over carrying value was at least 50% for each of our tested reporting units, with the exception of our India reporting unit, whose estimated fair value approximated its carrying value. As a result and given the sensitivity of the India impairment analysis to changes in the underlying assumptions, we performed a step two analysis which indicated a goodwill impairment of $11.4 million. Our 2014 annual test of indefinite-lived intangible assets resulted in a $4.5 million pre-tax write-down of a trademark, also associated with the India business. These impairment charges were recorded in the fourth quarter.
We also have intangible assets, consisting primarily of certain trademarks, customer-related intangible assets and patents obtained through business acquisitions, that are expected to have determinable useful lives. The costs of finite-lived intangible assets are amortized to expense over their estimated lives. Our estimates of the useful lives of finite-lived intangible assets consider judgments regarding the future effects of obsolescence, demand, competition and other economic factors. We conduct impairment tests when events or changes in circumstances indicate that the carrying value of these finite-lived assets may not be recoverable. Undiscounted cash flow analyses are used to determine if an impairment exists. If an impairment is determined to exist, the loss is calculated based on the estimated fair value of the assets.
No additional impairments were indicated by the results of our annual testing in 2014 or 2013. However, in connection with the anticipated sale of our Mauna Loa business (as discussed in Note 2 to the Consolidated Financial Statements), during the third and fourth quarters of 2014, we recorded estimated impairment charges totaling $18.5 million to write-down goodwill and an indefinite-lived trademark intangible asset, based on the valuation of these assets as implied by the agreed-upon sales price.
Commodities Futures and Options Contracts
As discussed in Note 1 and Note 5 to the Consolidated Financial Statements, we use derivative financial instruments to manage a number of our market risks. Specifically, we use commodities futures and options contracts, in combination with forward purchasing of cocoa products and other commodities, to manage our commodity price risk, which represents a significant market risk exposure for us. Because commodity costs comprise a significant portion of our cost of sales, we typically apply hedge accounting to our commodity derivative instruments to enable us to reduce the effect of future price increases and provide visibility to future costs.
In order to qualify for hedge accounting, a specified level of hedging effectiveness between the derivative instrument and the item being hedged must exist at inception and throughout the hedged period. We must formally document the nature of and relationship between the derivative and the hedged item, as well as our risk management objectives, strategies for undertaking the hedge transaction and method of assessing hedge effectiveness. We must also maintain certain operational processes and controls that support the conduct of our commodities hedging program. Additionally, since these are typically hedges of forecasted transactions, the significant characteristics and expected terms of the forecasted transactions must be specifically identified, and it must be probable that the forecasted transactions will occur. If it is no longer probable that a hedged forecasted transaction will occur, we would recognize the gain or loss related to the derivative in earnings.
Because we generally designate these commodity future and option contracts as derivative instruments in cash flow hedging relationships, our mark-to-market gains (losses) deferred to accumulated other comprehensive income (“AOCI”) and reclassified from AOCI were as follows:
36
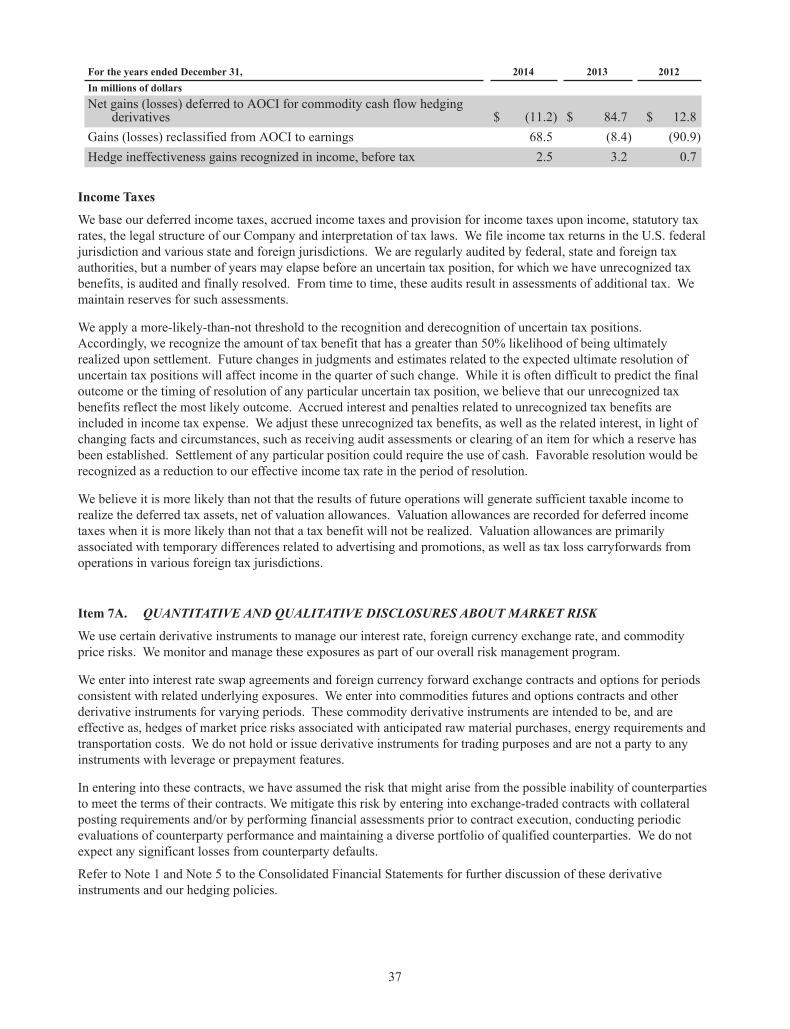
For the years ended December 31, 2014 2013 2012In millions of dollarsNet gains (losses) deferred to AOCI for commodity cash flow hedging
derivatives $ (11.2) $ 84.7 $ 12.8Gains (losses) reclassified from AOCI to earnings 68.5 (8.4) (90.9)Hedge ineffectiveness gains recognized in income, before tax 2.5 3.2 0.7
Income Taxes
We base our deferred income taxes, accrued income taxes and provision for income taxes upon income, statutory tax rates, the legal structure of our Company and interpretation of tax laws. We file income tax returns in the U.S. federal jurisdiction and various state and foreign jurisdictions. We are regularly audited by federal, state and foreign tax authorities, but a number of years may elapse before an uncertain tax position, for which we have unrecognized tax benefits, is audited and finally resolved. From time to time, these audits result in assessments of additional tax. We maintain reserves for such assessments.
We apply a more-likely-than-not threshold to the recognition and derecognition of uncertain tax positions. Accordingly, we recognize the amount of tax benefit that has a greater than 50% likelihood of being ultimately realized upon settlement. Future changes in judgments and estimates related to the expected ultimate resolution of uncertain tax positions will affect income in the quarter of such change. While it is often difficult to predict the final outcome or the timing of resolution of any particular uncertain tax position, we believe that our unrecognized tax benefits reflect the most likely outcome. Accrued interest and penalties related to unrecognized tax benefits are included in income tax expense. We adjust these unrecognized tax benefits, as well as the related interest, in light of changing facts and circumstances, such as receiving audit assessments or clearing of an item for which a reserve has been established. Settlement of any particular position could require the use of cash. Favorable resolution would be recognized as a reduction to our effective income tax rate in the period of resolution.
We believe it is more likely than not that the results of future operations will generate sufficient taxable income to realize the deferred tax assets, net of valuation allowances. Valuation allowances are recorded for deferred income taxes when it is more likely than not that a tax benefit will not be realized. Valuation allowances are primarily associated with temporary differences related to advertising and promotions, as well as tax loss carryforwards from operations in various foreign tax jurisdictions.
Item 7A. QUANTITATIVE AND QUALITATIVE DISCLOSURES ABOUT MARKET RISK
We use certain derivative instruments to manage our interest rate, foreign currency exchange rate, and commodity price risks. We monitor and manage these exposures as part of our overall risk management program.
We enter into interest rate swap agreements and foreign currency forward exchange contracts and options for periods consistent with related underlying exposures. We enter into commodities futures and options contracts and other derivative instruments for varying periods. These commodity derivative instruments are intended to be, and are effective as, hedges of market price risks associated with anticipated raw material purchases, energy requirements and transportation costs. We do not hold or issue derivative instruments for trading purposes and are not a party to any instruments with leverage or prepayment features.
In entering into these contracts, we have assumed the risk that might arise from the possible inability of counterparties to meet the terms of their contracts. We mitigate this risk by entering into exchange-traded contracts with collateral posting requirements and/or by performing financial assessments prior to contract execution, conducting periodic evaluations of counterparty performance and maintaining a diverse portfolio of qualified counterparties. We do not expect any significant losses from counterparty defaults.
Refer to Note 1 and Note 5 to the Consolidated Financial Statements for further discussion of these derivative instruments and our hedging policies.
37
Interest Rate Risk
In order to manage interest rate exposure, we periodically enter into interest rate swap agreements. We are currently using forward starting interest rate swap agreements to reduce interest volatility associated with certain anticipated debt issues and fixed-to-floating interest rate swaps to achieve a desired proportion of variable versus fixed rate debt, based on current and projected market conditions. The notional amount, interest payment and maturity date of these swaps generally match the principal, interest payment and maturity date of the related debt, and the swaps are valued using observable benchmark rates.
The total notional amount of interest rate swaps outstanding at December 31, 2014 and 2013 was $1.2 billion and $250 million, respectively. The notional amount at December 31, 2014, includes $450 million of fixed-to-floating interest rate swaps which convert a comparable amount of fixed-rate debt to variable rate debt. A hypothetical 100 basis point increase in interest rates applied to this now variable rate debt as of December 31, 2014 would have increased interest expense by approximately $4.6 million for the full year 2014. We had minimal variable rate interest exposure as of December 31, 2013.
We consider our current risk related to market fluctuations in interest rates on our remaining debt portfolio, excluding fixed-rate debt converted to variable with fixed-to-floating instruments, to be minimal since this debt is largely long-term and fixed-rate in nature. Generally, the fair market value of fixed-rate debt will increase as interest rates fall and decrease as interest rates rise. A 100 basis point increase in market interest rates would decrease the 2014 year-end fair value of our fixed-rate long-term debt by approximately $83 million. However, since we currently have no plans to repurchase our outstanding fixed-rate instruments before their maturities, the impact of market interest rate fluctuations on our long-term debt does not affect our results of operations or financial position.
Foreign Currency Exchange Rate Risk
We are exposed to currency fluctuations related to manufacturing or selling products in currencies other than the U.S. dollar. We may enter into foreign currency forward exchange contracts and options to reduce fluctuations in our long or short currency positions relating primarily to purchase commitments or forecasted purchases for equipment, raw materials and finished goods denominated in foreign currencies. We also may hedge payment of forecasted intercompany transactions with our subsidiaries outside of the United States. We generally hedge foreign currency price risks for periods from 3 to 24 months.
A summary of foreign currency forward exchange contracts and the corresponding amounts at contracted forward rates is as follows:
December 31, 2014 2013
ContractAmount
PrimaryCurrencies
ContractAmount
PrimaryCurrencies
In millions of dollars
Foreign currency forward exchangecontracts to purchase foreigncurrencies $ 21.9 Euros $ 158.4
Malaysian ringgitsSwiss francsEuros
Foreign currency forward exchangecontracts to sell foreign currencies $ 48.8
Canadian dollarsBrazilian realsJapanese yen $ 2.8 Japanese yen
In 2013, foreign currency forward exchange contracts for the purchase of Malaysian ringgits and certain other currencies were associated with the construction of the manufacturing facility in Malaysia.
The fair value of foreign currency forward exchange contracts represents the difference between the contracted and current market foreign currency exchange rates at the end of the period. We estimate the fair value of foreign currency forward exchange contracts on a quarterly basis by obtaining market quotes of spot and forward rates for contracts with similar terms, adjusted where necessary for maturity differences. At December 31, 2014 and 2013, the net fair value of these instruments was an asset of $1.5 million and $3.2 million, respectively. Assuming an unfavorable 10% change in year-end foreign currency exchange rates, the fair value of these instruments would have declined by $7.0 million and $12.9 million, respectively. Our risk related to foreign currency forward exchange contracts is limited to the cost of replacing the contracts at prevailing market rates.
38

Commodities—Price Risk Management and Futures Contracts
Our most significant raw material requirements include cocoa products, sugar, dairy products, peanuts and almonds. The cost of cocoa products and prices for related futures contracts and costs for certain other raw materials historically have been subject to wide fluctuations attributable to a variety of factors. These factors include:
Commodity market fluctuations;Foreign currency exchange rates;Imbalances between supply and demand;The effect of weather on crop yield;Speculative influences;Trade agreements among producing and consuming nations;Supplier compliance with commitments;Political unrest in producing countries; andChanges in governmental agricultural programs and energy policies.
We use futures and options contracts and other commodity derivative instruments in combination with forward purchasing of cocoa products, sugar, corn sweeteners, natural gas and certain dairy products primarily to reduce the risk of future price increases and provide visibility to future costs. Currently, active futures contracts are not available for use in pricing our other major raw material requirements, primarily peanuts and almonds. We attempt to minimize the effect of future price fluctuations related to the purchase of raw materials by using forward purchasing to cover future manufacturing requirements generally for 3 to 24 months. However, the dairy futures markets are not as developed as many of the other commodities futures markets and, therefore, it is difficult to hedge our costs for dairy products by entering into futures contracts or other derivative instruments to extend coverage for long periods of time. We use diesel swap futures contracts to minimize price fluctuations associated with our transportation costs. Our commodity procurement practices are intended to reduce the risk of future price increases and provide visibility to future costs, but also may potentially limit our ability to benefit from possible price decreases. Our costs for major raw materials will not necessarily reflect market price fluctuations primarily because of our forward purchasing and hedging practices.
During 2014, average cocoa futures contract prices increased compared with 2013 and traded in a range between $1.25 and $1.45 per pound, based on the Intercontinental Exchange futures contract. Cocoa production was higher in 2014 and global demand was slightly higher, which produced a small surplus in cocoa supplies over the past year. Despite the small increase in global cocoa inventories, prices remained elevated in response to concerns over the future balance of global cocoa supply and demand.
The table below shows annual average cocoa futures prices and the highest and lowest monthly averages for each of the calendar years indicated. The prices reflect the monthly averages of the quotations at noon of the three active futures trading contracts closest to maturity on the Intercontinental Exchange.
Cocoa Futures Contract Prices(dollars per pound)
2014 2013 2012 2011 2010
Annual Average $ 1.36 $ 1.09 $ 1.07 $ 1.34 $ 1.36
High 1.45 1.26 1.17 1.55 1.53
Low 1.25 0.97 1.00 0.99 1.26Source: International Cocoa Organization Quarterly Bulletin of Cocoa Statistics
Our costs for cocoa products will not necessarily reflect market price fluctuations because of our forward purchasing and hedging practices, premiums and discounts reflective of varying delivery times, and supply and demand for our specific varieties and grades of cocoa liquor, cocoa butter and cocoa powder. As a result, the average futures contract prices are not necessarily indicative of our average costs.
39
During 2014, prices for fluid dairy milk ranged from a low of $0.22 per pound to a high of $0.26 per pound, on a class II fluid milk basis. Dairy prices reached historically high levels during 2014, driven by increased imports by China and supply challenges due to the 2013 drought in New Zealand.
The price of sugar is subject to price supports under U.S. farm legislation. Such legislation establishes import quotas and duties to support the price of sugar. As a result, sugar prices paid by users in the United States are currently higher than prices on the world sugar market. In 2014, U.S. sugar producers filed an Anti-dumping suit against Mexico, which reduced sugar imports from Mexico. As a result, refined sugar prices increased compared to 2013, trading higher in a range from $0.31 to $0.42 per pound.
Peanut prices in the United States began the year around $0.49 per pound and closed the year at $0.53 per pound. Peanut supply is ample to support U.S. demand heading into 2015. Almond prices began the year at $3.69 per pound and increased to $4.39 per pound during 2014. The third consecutive year of droughts in California had a negative impact on yields, with the 2014 crop estimated to be 10% lower than 2013.
We make or receive cash transfers to or from commodity futures brokers on a daily basis reflecting changes in the value of futures contracts on the Intercontinental Exchange or various other exchanges. These changes in value represent unrealized gains and losses. We report these cash transfers as a component of other comprehensive income. The cash transfers offset higher or lower cash requirements for the payment of future invoice prices of raw materials, energy requirements and transportation costs.
Commodity Position Sensitivity Analysis
The following sensitivity analysis reflects our market risk to a hypothetical adverse market price movement of 10%, based on our net commodity positions at four dates spaced equally throughout the year. Our net commodity positions consist of the amount of futures contracts we hold over or under the amount of futures contracts we need to price unpriced physical forward contracts for the same commodities (our “requirements”). Inventories, fixed-price forward contracts and anticipated purchases not yet under contract are not included in the sensitivity analysis calculations. The fair values of net commodity positions reflect quoted market prices or estimated future prices, including estimated carrying costs corresponding with the future delivery period. The market risk noted below reflects the potential loss in future earnings resulting from the hypothetical adverse market price movement.
For the years ended December 31, 2014 2013
FairValue
Market Risk(Hypothetical10% Change)
FairValue
Market Risk(Hypothetical10% Change)
In millions of dollars
Highest position of futures contracts held over (under)requirements $ (362.7) $ 36.3 $ (29.3) $ 2.9Lowest position of futures contracts held over (under)requirements (612.9) 61.3 (249.4) 24.9Average of futures contracts held over (under)requirements (506.6) 50.7 (105.6) 10.6
The negative positions primarily resulted as our requirements exceeded the amount of commodities futures that we held at certain points in time during the years.
40
Item 8. FINANCIAL STATEMENTS AND SUPPLEMENTARY DATA
PAGE
INDEX TO CONSOLIDATED FINANCIAL STATEMENTS
Responsibility for Financial Statements 42
Report of Independent Registered Public Accounting Firm 43
Consolidated Statements of Income for the years ended December 31, 2014, 2013 and 2012 45
Consolidated Statements of Comprehensive Income for the years ended December 31, 2014, 2013 and 2012 46
Consolidated Balance Sheets as of December 31, 2014 and 2013 47
Consolidated Statements of Cash Flows for the years ended December 31, 2014, 2013 and 2012 48
Consolidated Statements of Stockholders’ Equity for the years ended December 31, 2014, 2013 and 2012 49
Notes to Consolidated Financial Statements 50
41
RESPONSIBILITY FOR FINANCIAL STATEMENTS
The Hershey Company is responsible for the financial statements and other financial information contained in this report. We believe that the financial statements have been prepared in conformity with U.S. generally accepted accounting principles appropriate under the circumstances to reflect in all material respects the substance of applicable events and transactions. In preparing the financial statements, it is necessary that management make informed estimates and judgments. The other financial information in this annual report is consistent with the financial statements.
We maintain a system of internal accounting controls designed to provide reasonable assurance that financial records are reliable for purposes of preparing financial statements and that assets are properly accounted for and safeguarded. The concept of reasonable assurance is based on the recognition that the cost of the system must be related to the benefits to be derived. We believe our system provides an appropriate balance in this regard. We maintain an Internal Audit Department which reviews the adequacy and tests the application of internal accounting controls.
The 2014, 2013 and 2012 financial statements have been audited by KPMG LLP, an independent registered public accounting firm. KPMG LLP's report on our financial statements and internal controls over financial reporting is included on page 43.
The Audit Committee of the Board of Directors of the Company, consisting solely of independent, non-management directors, meets regularly with the independent auditors, internal auditors and management to discuss, among other things, the audit scope and results. KPMG LLP and the internal auditors both have full and free access to the Audit Committee, with and without the presence of management.
John P. BilbreyChief Executive Officer
Richard M. McConvilleInterim Principal Financial Officer
42
REPORT OF INDEPENDENT REGISTERED PUBLIC ACCOUNTING FIRM
The Board of Directors and StockholdersThe Hershey Company:
We have audited the accompanying consolidated balance sheets of The Hershey Company and subsidiaries (the “Company”) as of December 31, 2014 and 2013, and the related consolidated statements of income, comprehensive income, cash flows and stockholders’ equity for each of the years in the three-year period ended December 31, 2014. In connection with our audits of the consolidated financial statements, we also have audited the related consolidated financial statement schedule. We also have audited the Company’s internal control over financial reporting as of December 31, 2014, based on criteria established in Internal Control – Integrated Framework (2013 edition) issued by the Committee of Sponsoring Organizations of the Treadway Commission (“COSO”). The Company’s management is responsible for these consolidated financial statements and financial statement schedule, for maintaining effective internal control over financial reporting, and for its assessment of the effectiveness of internal control over financial reporting, included in the accompanying Management Report on Internal Control over Financial Reporting. Our responsibility is to express an opinion on these consolidated financial statements and financial statement schedule, and an opinion on the Company’s internal control over financial reporting based on our audits.
We conducted our audits in accordance with the standards of the Public Company Accounting Oversight Board (United States). Those standards require that we plan and perform the audits to obtain reasonable assurance about whether the financial statements are free of material misstatement and whether effective internal control over financial reporting was maintained in all material respects. Our audits of the consolidated financial statements included examining, on a test basis, evidence supporting the amounts and disclosures in the financial statements, assessing the accounting principles used and significant estimates made by management, and evaluating the overall financial statement presentation. Our audit of internal control over financial reporting included obtaining an understanding of internal control over financial reporting, assessing the risk that a material weakness exists, and testing and evaluating the design and operating effectiveness of internal control based on the assessed risk. Our audits also included performing such other procedures as we considered necessary in the circumstances. We believe that our audits provide a reasonable basis for our opinions.
A company’s internal control over financial reporting is a process designed to provide reasonable assurance regarding the reliability of financial reporting and the preparation of financial statements for external purposes in accordance with generally accepted accounting principles. A company’s internal control over financial reporting includes those policies and procedures that (1) pertain to the maintenance of records that, in reasonable detail, accurately and fairly reflect the transactions and dispositions of the assets of the company; (2) provide reasonable assurance that transactions are recorded as necessary to permit preparation of financial statements in accordance with generally accepted accounting principles, and that receipts and expenditures of the company are being made only in accordance with authorizations of management and directors of the company; and (3) provide reasonable assurance regarding prevention or timely detection of unauthorized acquisition, use, or disposition of the company’s assets that could have a material effect on the financial statements.
Because of its inherent limitations, internal control over financial reporting may not prevent or detect misstatements. Also, projections of any evaluation of effectiveness to future periods are subject to the risk that controls may become inadequate because of changes in conditions, or that the degree of compliance with the policies or procedures may deteriorate.
In our opinion, the consolidated financial statements referred to above present fairly, in all material respects, the financial position of The Hershey Company and subsidiaries as of December 31, 2014 and 2013, and the results of their operations and their cash flows for each of the years in the three-year period ended December 31, 2014, in conformity with U.S. generally accepted accounting principles. Also, in our opinion, the related consolidated financial statement schedule, when considered in relation to the basic consolidated financial statements taken as a whole, presents fairly, in all material respects, the information set forth therein.
43
Also in our opinion, The Hershey Company and subsidiaries maintained, in all material respects, effective internal control over financial reporting as of December 31, 2014, based on criteria established in Internal Control – Integrated Framework (2013 edition) issued by the Committee of Sponsoring Organizations of the Treadway Commission.
Management excluded Shanghai Golden Monkey Food Joint Stock Co., Ltd., an entity acquired during 2014, from its assessment of the effectiveness of the Company's internal control over financial reporting as of December 31, 2014. This entity’s net sales and assets excluded from management's assessment of internal control represented 0.7% and 4.7% of the Company’s total net sales and total assets, respectively, for the year ended December 31, 2014. Our audit of internal control over financial reporting of the Company also excluded an evaluation of the internal control over financial reporting of Shanghai Golden Monkey Food Joint Stock Co., Ltd.
New York, New YorkFebruary 20, 2015
44
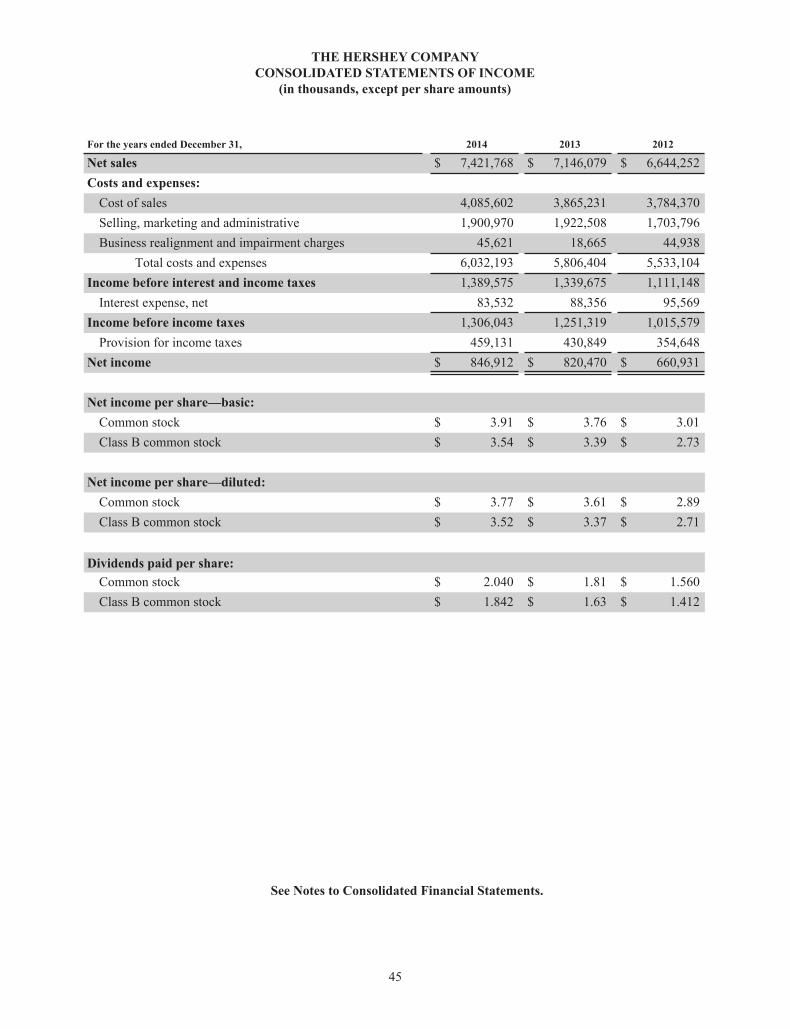
THE HERSHEY COMPANY CONSOLIDATED STATEMENTS OF INCOME
(in thousands, except per share amounts)
For the years ended December 31, 2014 2013 2012
Net sales $ 7,421,768 $ 7,146,079 $ 6,644,252Costs and expenses:
Cost of sales 4,085,602 3,865,231 3,784,370Selling, marketing and administrative 1,900,970 1,922,508 1,703,796Business realignment and impairment charges 45,621 18,665 44,938
Total costs and expenses 6,032,193 5,806,404 5,533,104Income before interest and income taxes 1,389,575 1,339,675 1,111,148
Interest expense, net 83,532 88,356 95,569Income before income taxes 1,306,043 1,251,319 1,015,579
Provision for income taxes 459,131 430,849 354,648Net income $ 846,912 $ 820,470 $ 660,931
Net income per share—basic:Common stock $ 3.91 $ 3.76 $ 3.01Class B common stock $ 3.54 $ 3.39 $ 2.73
Net income per share—diluted:Common stock $ 3.77 $ 3.61 $ 2.89Class B common stock $ 3.52 $ 3.37 $ 2.71
Dividends paid per share:Common stock $ 2.040 $ 1.81 $ 1.560Class B common stock $ 1.842 $ 1.63 $ 1.412
See Notes to Consolidated Financial Statements.
45
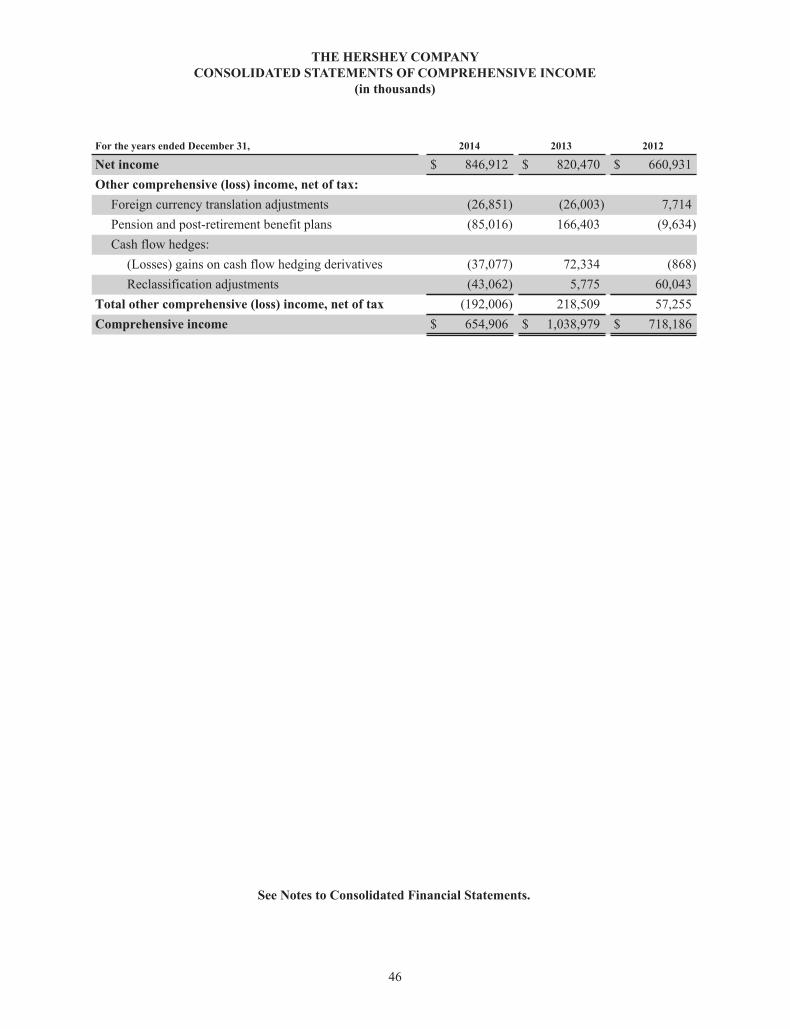
THE HERSHEY COMPANY CONSOLIDATED STATEMENTS OF COMPREHENSIVE INCOME
(in thousands)
For the years ended December 31, 2014 2013 2012
Net income $ 846,912 $ 820,470 $ 660,931Other comprehensive (loss) income, net of tax:
Foreign currency translation adjustments (26,851) (26,003) 7,714Pension and post-retirement benefit plans (85,016) 166,403 (9,634)Cash flow hedges:
(Losses) gains on cash flow hedging derivatives (37,077) 72,334 (868)Reclassification adjustments (43,062) 5,775 60,043
Total other comprehensive (loss) income, net of tax (192,006) 218,509 57,255Comprehensive income $ 654,906 $ 1,038,979 $ 718,186
See Notes to Consolidated Financial Statements.
46
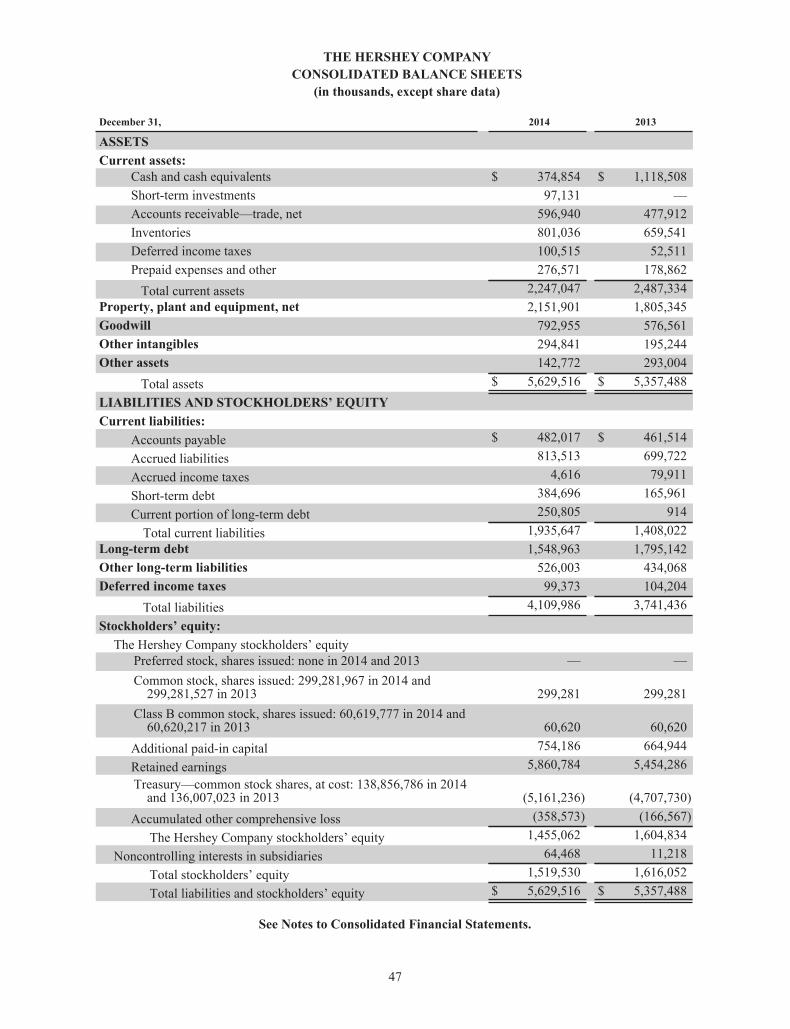
THE HERSHEY COMPANY CONSOLIDATED BALANCE SHEETS
(in thousands, except share data)
December 31, 2014 2013
ASSETSCurrent assets:
Cash and cash equivalents $ 374,854 $ 1,118,508Short-term investments 97,131 —Accounts receivable—trade, net 596,940 477,912Inventories 801,036 659,541Deferred income taxes 100,515 52,511Prepaid expenses and other 276,571 178,862
Total current assets 2,247,047 2,487,334Property, plant and equipment, net 2,151,901 1,805,345Goodwill 792,955 576,561Other intangibles 294,841 195,244Other assets 142,772 293,004
Total assets $ 5,629,516 $ 5,357,488LIABILITIES AND STOCKHOLDERS’ EQUITYCurrent liabilities:
Accounts payable $ 482,017 $ 461,514Accrued liabilities 813,513 699,722Accrued income taxes 4,616 79,911Short-term debt 384,696 165,961Current portion of long-term debt 250,805 914
Total current liabilities 1,935,647 1,408,022Long-term debt 1,548,963 1,795,142Other long-term liabilities 526,003 434,068Deferred income taxes 99,373 104,204
Total liabilities 4,109,986 3,741,436Stockholders’ equity:
The Hershey Company stockholders’ equityPreferred stock, shares issued: none in 2014 and 2013 — —Common stock, shares issued: 299,281,967 in 2014 and
299,281,527 in 2013 299,281 299,281Class B common stock, shares issued: 60,619,777 in 2014 and
60,620,217 in 2013 60,620 60,620Additional paid-in capital 754,186 664,944Retained earnings 5,860,784 5,454,286Treasury—common stock shares, at cost: 138,856,786 in 2014
and 136,007,023 in 2013 (5,161,236) (4,707,730)Accumulated other comprehensive loss (358,573) (166,567)
The Hershey Company stockholders’ equity 1,455,062 1,604,834Noncontrolling interests in subsidiaries 64,468 11,218
Total stockholders’ equity 1,519,530 1,616,052Total liabilities and stockholders’ equity $ 5,629,516 $ 5,357,488
See Notes to Consolidated Financial Statements.
47
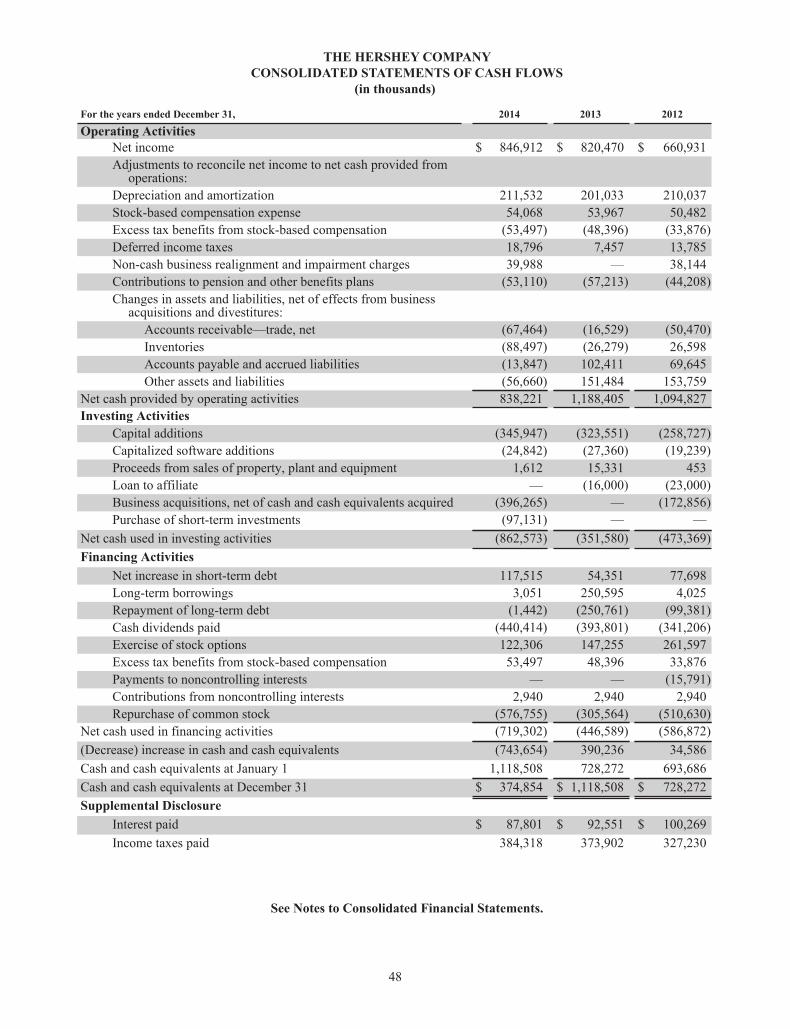
THE HERSHEY COMPANY CONSOLIDATED STATEMENTS OF CASH FLOWS
(in thousands)
For the years ended December 31, 2014 2013 2012
Operating ActivitiesNet income $ 846,912 $ 820,470 $ 660,931Adjustments to reconcile net income to net cash provided from
operations:Depreciation and amortization 211,532 201,033 210,037Stock-based compensation expense 54,068 53,967 50,482Excess tax benefits from stock-based compensation (53,497) (48,396) (33,876)Deferred income taxes 18,796 7,457 13,785Non-cash business realignment and impairment charges 39,988 — 38,144Contributions to pension and other benefits plans (53,110) (57,213) (44,208)Changes in assets and liabilities, net of effects from business
acquisitions and divestitures:Accounts receivable—trade, net (67,464) (16,529) (50,470)Inventories (88,497) (26,279) 26,598Accounts payable and accrued liabilities (13,847) 102,411 69,645Other assets and liabilities (56,660) 151,484 153,759
Net cash provided by operating activities 838,221 1,188,405 1,094,827Investing Activities
Capital additions (345,947) (323,551) (258,727)Capitalized software additions (24,842) (27,360) (19,239)Proceeds from sales of property, plant and equipment 1,612 15,331 453Loan to affiliate — (16,000) (23,000)Business acquisitions, net of cash and cash equivalents acquired (396,265) — (172,856)Purchase of short-term investments (97,131) — —
Net cash used in investing activities (862,573) (351,580) (473,369)Financing Activities
Net increase in short-term debt 117,515 54,351 77,698Long-term borrowings 3,051 250,595 4,025Repayment of long-term debt (1,442) (250,761) (99,381)Cash dividends paid (440,414) (393,801) (341,206)Exercise of stock options 122,306 147,255 261,597Excess tax benefits from stock-based compensation 53,497 48,396 33,876Payments to noncontrolling interests — — (15,791)Contributions from noncontrolling interests 2,940 2,940 2,940Repurchase of common stock (576,755) (305,564) (510,630)
Net cash used in financing activities (719,302) (446,589) (586,872)(Decrease) increase in cash and cash equivalents (743,654) 390,236 34,586Cash and cash equivalents at January 1 1,118,508 728,272 693,686Cash and cash equivalents at December 31 $ 374,854 $ 1,118,508 $ 728,272Supplemental Disclosure
Interest paid $ 87,801 $ 92,551 $ 100,269Income taxes paid 384,318 373,902 327,230
See Notes to Consolidated Financial Statements.
48
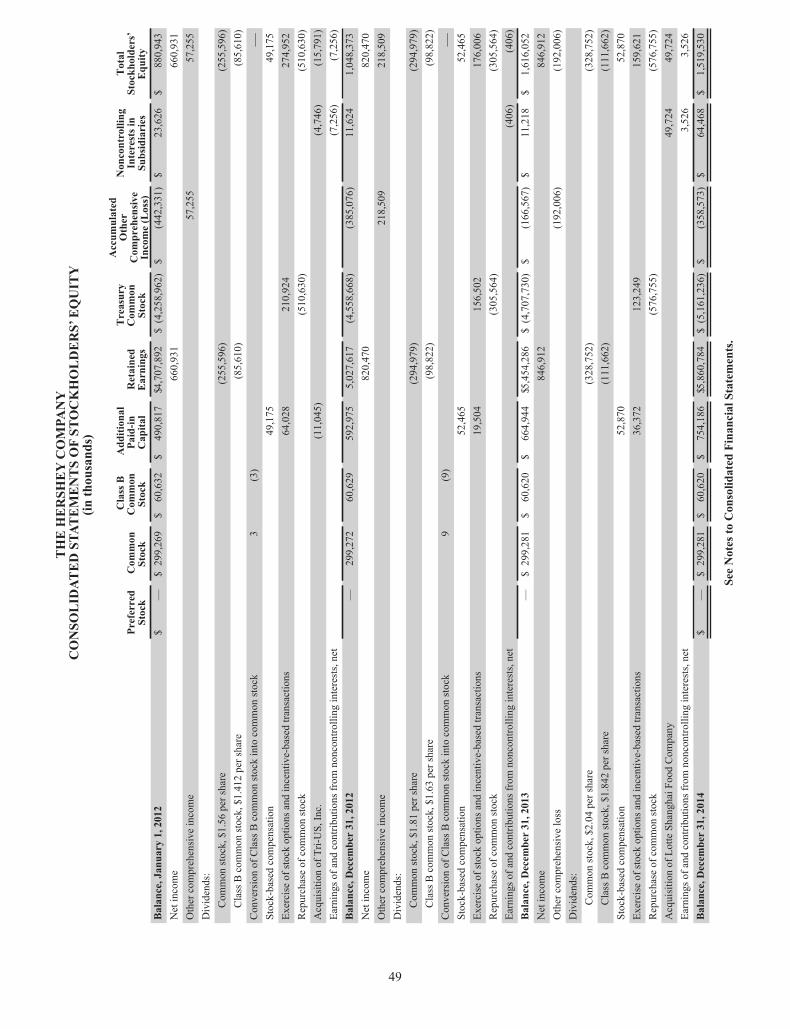
TH
E H
ER
SHE
Y C
OM
PAN
YC
ON
SOL
IDAT
ED
STA
TE
ME
NT
S O
F ST
OC
KH
OL
DE
RS’
EQ
UIT
Y(in
thou
sand
s)
Pref
erre
dSt
ock
Com
mon
Stoc
k
Cla
ss B
Com
mon
Stoc
k
Add
ition
alPa
id-in
Cap
ital
Ret
aine
dE
arni
ngs
Tre
asur
yC
omm
onSt
ock
Acc
umul
ated
Oth
erC
ompr
ehen
sive
Inco
me
(Los
s)
Non
cont
rolli
ngIn
tere
sts i
nSu
bsid
iari
es
Tot
alSt
ockh
olde
rs’
Equ
ityB
alan
ce, J
anua
ry 1
, 201
2$
—$
299,
269
$60
,632
$49
0,81
7$4
,707
,892
$(4
,258
,962
)$
(442
,331
)$
23,6
26$
880,
943
Net
inco
me
660,
931
660,
931
Oth
er c
ompr
ehen
sive
inco
me
57,2
5557
,255
Div
iden
ds:
Com
mon
stoc
k, $
1.56
per
shar
e(2
55,5
96)
(255
,596
)C
lass
B c
omm
on st
ock,
$1.
412
per s
hare
(85,
610)
(85,
610 )
Con
vers
ion
of C
lass
B c
omm
on st
ock
into
com
mon
stoc
k3
(3)
—St
ock-
base
d co
mpe
nsat
ion
49,1
7549
,175
Exer
cise
of s
tock
opt
ions
and
ince
ntiv
e-ba
sed
trans
actio
ns64
,028
210,
924
274,
952
Rep
urch
ase
of c
omm
on st
ock
(510
,630
)(5
10,6
30)
Acq
uisi
tion
of T
ri-U
S, In
c.(1
1,04
5)(4
,746
)(1
5,79
1 )Ea
rnin
gs o
f and
con
tribu
tions
from
non
cont
rolli
ng in
tere
sts,
net
(7,2
56)
(7,2
56)
Bal
ance
, Dec
embe
r 31
, 201
2—
299,
272
60,6
2959
2,97
55,
027,
617
(4,5
58,6
68)
(385
,076
)11
,624
1,04
8,37
3N
et in
com
e82
0,47
082
0,47
0O
ther
com
preh
ensi
ve in
com
e21
8,50
921
8,50
9D
ivid
ends
:C
omm
on st
ock,
$1.
81 p
er sh
are
(294
,979
)(2
94,9
79)
Cla
ss B
com
mon
stoc
k, $
1.63
per
shar
e(9
8,82
2)(9
8,82
2 )C
onve
rsio
n of
Cla
ss B
com
mon
stoc
k in
to c
omm
on st
ock
9(9
)—
Stoc
k-ba
sed
com
pens
atio
n52
,465
52,4
65Ex
erci
se o
f sto
ck o
ptio
ns a
nd in
cent
ive-
base
d tra
nsac
tions
19,5
0415
6,50
217
6,00
6R
epur
chas
e of
com
mon
stoc
k(3
05,5
64)
(305
,564
)Ea
rnin
gs o
f and
con
tribu
tions
from
non
cont
rolli
ng in
tere
sts,
net
(406
)(4
06)
Bal
ance
, Dec
embe
r 31
, 201
3—
$29
9,28
1$
60,6
20$
664,
944
$5,4
54,2
86$
(4,7
07,7
30)
$(1
66,5
67)
$11
,218
$1,
616,
052
Net
inco
me
846,
912
846,
912
Oth
er c
ompr
ehen
sive
loss
(192
,006
)(1
92,0
06)
Div
iden
ds:
Com
mon
stoc
k, $
2.04
per
shar
e(3
28,7
52)
(328
,752
)C
lass
B c
omm
on st
ock,
$1.
842
per s
hare
(111
,662
)(1
11,6
62)
Stoc
k-ba
sed
com
pens
atio
n52
,870
52,8
70Ex
erci
se o
f sto
ck o
ptio
ns a
nd in
cent
ive-
base
d tra
nsac
tions
36,3
7212
3,24
915
9,62
1R
epur
chas
e of
com
mon
stoc
k(5
76,7
55)
(576
,755
)A
cqui
sitio
n of
Lot
te S
hang
hai F
ood
Com
pany
49,7
2449
,724
Earn
ings
of a
nd c
ontri
butio
ns fr
om n
onco
ntro
lling
inte
rest
s, ne
t3,
526
3,52
6B
alan
ce, D
ecem
ber
31, 2
014
$—
$29
9,28
1$
60,6
20$
754,
186
$5,8
60,7
84$
(5,1
61,2
36)
$(3
58,5
73)
$64
,468
$1,
519,
530
See
Not
es to
Con
solid
ated
Fin
anci
al S
tate
men
ts.
49
THE HERSHEY COMPANYNOTES TO CONSOLIDATED FINANCIAL STATEMENTS(amounts in thousands, except share data or if otherwise indicated)
1. SUMMARY OF SIGNIFICANT ACCOUNTING POLICIES
Description of Business
The Hershey Company together with its wholly-owned subsidiaries and entities in which it has a controlling interest,(the “Company,” “Hershey,” “we” or “us”) is a global confectionery leader known for its branded portfolio of chocolate, sweets, mints and other great-tasting snacks. The Company has more than 80 brands worldwide including such iconic brand names as Hershey’s, Reese’s, Hershey’s Kisses, Jolly Rancher and Ice Breakers, which are marketed, sold and distributed in approximately 70 countries worldwide. Hershey is focused on growing its presence in key international markets while continuing to build its competitive advantage in North America. The Company currently operates through two reportable segments that are aligned with its management structure and the key markets it serves: North America and International and Other. For additional information on our segment presentation, see Note 11.
Basis of Presentation
Our consolidated financial statements include the accounts of The Hershey Company and its majority-owned or controlled subsidiaries. Intercompany transactions and balances have been eliminated. We have a controlling financial interest if we own a majority of the outstanding voting common stock and minority shareholders do not have substantive participating rights, we have significant control through contractual or economic interests in which we are the primary beneficiary or we have the power to direct the activities that most significantly impact the entity's economic performance. Net income (loss) attributable to noncontrolling interests is not significant and is recorded within selling, marketing and administrative expense in the Consolidated Statements of Income. We use the equity method of accounting when we have a 20% to 50% interest in other companies and exercise significant influence. Net income (loss) from such investments is not significant and is also recorded in selling, marketing and administrative expense. As of December 31, 2013, equity investments included within other long-term assets in the Consolidated Balance Sheets totaled $39,872. We held no equity investments at December 31, 2014. See Note 12 for additional information on our noncontrolling interests.
Use of Estimates
The preparation of financial statements in conformity with accounting principles generally accepted in the United States of America (“U.S. GAAP”) requires management to make estimates and assumptions that affect the amounts reported in the consolidated financial statements and accompanying disclosures. Our significant estimates and assumptions include, among others, pension and other post-retirement benefit plan assumptions, valuation assumptions of goodwill and other intangible assets, useful lives of long-lived assets, marketing and trade promotion accruals and income taxes. These estimates and assumptions are based on management’s best judgment. Management evaluates its estimates and assumptions on an ongoing basis using historical experience and other factors, including the current economic environment, and the effects of any revisions are reflected in the consolidated financial statements in the period that they are determined. As future events and their effects cannot be determined with precision, actual results could differ significantly from these estimates.
Revenue Recognition
We record sales when all of the following criteria have been met:
A valid customer order with a fixed price has been received;The product has been delivered to the customer;There is no further significant obligation to assist in the resale of the product; andCollectability is reasonably assured.
Net sales include revenue from the sale of finished goods and royalty income, net of allowances for trade promotions, consumer coupon programs and other sales incentives, and allowances and discounts associated with aged or potentially unsaleable products. Trade promotions and sales incentives primarily include reduced price features, merchandising displays, sales growth incentives, new item allowances and cooperative advertising. Sales, use, value-added and other excise taxes are not recognized in revenue.
50
THE HERSHEY COMPANYNOTES TO CONSOLIDATED FINANCIAL STATEMENTS—(Continued)
(amounts in thousands, except share data or if otherwise indicated)
Cost of Sales
Cost of sales represents costs directly related to the manufacture and distribution of our products. Primary costs include raw materials, packaging, direct labor, overhead, shipping and handling, warehousing and the depreciation of manufacturing, warehousing and distribution facilities. Manufacturing overhead and related expenses include salaries, wages, employee benefits, utilities, maintenance and property taxes.
Selling, Marketing and Administrative Expense
Selling, marketing and administrative expense (“SM&A”) represents costs incurred in generating revenues and in managing our business. Such costs include advertising and other marketing expenses, selling expenses, research and development, administrative and other indirect overhead costs, amortization of capitalized software and depreciation of administrative facilities. Research and development costs, charged to expense as incurred, totaled $47,554 in 2014, $47,636 in 2013 and $38,959 in 2012. Advertising expense, also charged to expense as incurred, totaled $570,223 in 2014, $582,354 in 2013 and $480,016 in 2012. Prepaid advertising expense was $8,193 and $8,432 as of December 31, 2014 and 2013, respectively.
Cash Equivalents
Cash equivalents consist of highly liquid debt instruments, time deposits and money market funds with original maturities of three months or less. The fair value of cash and cash equivalents approximates the carrying amount.
Short-term Investments
Short-term investments consist of bank term deposits that have original maturity dates ranging from greater than three months to twelve months. Short-term investments are carried at cost, which approximates fair value.
Accounts Receivable—Trade
In the normal course of business, we extend credit to customers that satisfy pre-defined credit criteria, based upon the results of our recurring financial account reviews and our evaluation of current and projected economic conditions. Our primary concentrations of credit risk are associated with Wal-Mart Stores, Inc. and McLane Company, Inc., two customers served principally by our North America segment. McLane Company, Inc. is one of the largest wholesale distributors in the United States to convenience stores, drug stores, wholesale clubs and mass merchandisers. As of December 31, 2014, McLane Company, Inc. accounted for approximately 12.8% of our total accounts receivable. Wal-Mart Stores, Inc. accounted for approximately 12.3% of our total accounts receivable as of December 31, 2014. No other customer accounted for more than 10% of our year-end accounts receivable. We believe that we have little concentration of credit risk associated with the remainder of our customer base. Accounts receivable-trade in the Consolidated Balance Sheets is presented net of allowances and anticipated discounts of $15,885 and $14,329 at December 31, 2014 and 2013, respectively.
Inventories
Inventories are valued at the lower of cost or market value, adjusted for the value of inventory that is estimated to be excess, obsolete or otherwise unsaleable. As of December 31, 2014, approximately 54% of our inventories, representing the majority of our U.S. inventories, were valued under the last-in, first-out (“LIFO”) method. The remainder of our inventories in the U.S. and inventories for our international businesses are valued at the lower of first-in, first-out (“FIFO”) cost or market. LIFO cost of inventories valued using the LIFO method was $430,094 as of December 31, 2014 and $314,999 as of December 31, 2013. The net impact of LIFO acquisitions and liquidations was not material to 2014, 2013 or 2012.
Property, Plant and Equipment
Property, plant and equipment are stated at cost and depreciated on a straight-line basis over the estimated useful lives of the assets, as follows: 3 to 15 years for machinery and equipment; and 25 to 40 years for buildings and related improvements. Maintenance and repairs are expensed as incurred. We capitalize applicable interest charges incurred during the construction of new facilities and production lines and amortize these costs over the assets’ estimated useful lives.
51
THE HERSHEY COMPANYNOTES TO CONSOLIDATED FINANCIAL STATEMENTS—(Continued)
(amounts in thousands, except share data or if otherwise indicated)
We review long-lived assets for impairment whenever events or changes in circumstances indicate that the carrying amount of such assets may not be recoverable. We measure the recoverability of assets to be held and used by a comparison of the carrying amount of long-lived assets to future undiscounted net cash flows expected to be generated. If these assets are considered to be impaired, we measure impairment as the amount by which the carrying amount of the assets exceeds the fair value of the assets. We report assets held for sale or disposal at the lower of the carrying amount or fair value less cost to sell.
We assess asset retirement obligations on a periodic basis and recognize the fair value of a liability for an asset retirement obligation in the period in which it is incurred if a reasonable estimate of fair value can be made. We capitalize associated asset retirement costs as part of the carrying amount of the long-lived asset.
Computer Software
We capitalize costs associated with software developed or obtained for internal use when both the preliminary project stage is completed and it is probable the software being developed will be completed and placed in service. Capitalized costs include only (i) external direct costs of materials and services consumed in developing or obtaining internal-use software, (ii) payroll and other related costs for employees who are directly associated with and who devote time to the internal-use software project and (iii) interest costs incurred, when material, while developing internal-use software. We cease capitalization of such costs no later than the point at which the project is substantially complete and ready for its intended purpose.
The unamortized amount of capitalized software totaled $63,252 and $56,502 at December 31, 2014 and 2013, respectively. We amortize software costs using the straight-line method over the expected life of the software, generally 3 to 5 years. Accumulated amortization of capitalized software was $300,698 and $277,872 as of December 31, 2014 and 2013, respectively. Such amounts are recorded within other assets in the Consolidated Balance Sheets.
We review the carrying value of software and development costs for impairment in accordance with our policy pertaining to the impairment of long-lived assets. Generally, we measure impairment under the following circumstances:
When internal-use computer software is not expected to provide substantive service potential;When a significant change occurs in the extent or manner in which the software is used or is expected to beused;When a significant change is made or will be made to the software program; andWhen the costs of developing or modifying internal-use computer software significantly exceed theamount originally expected to develop or modify the software.
Goodwill and Other Intangible Assets
Goodwill and indefinite-lived intangible assets are not amortized, but are evaluated for impairment annually or more often if indicators of a potential impairment are present. Our annual impairment tests are conducted at the beginning of the fourth quarter. We use a two-step process to quantitatively evaluate goodwill for impairment. In the first step, we compare the fair value of each reporting unit with the carrying amount of the reporting unit, including goodwill. If the estimated fair value of the reporting unit is less than the carrying amount of the reporting unit, we complete a second step to determine the amount of the goodwill impairment that we should record. In the second step, we determine an implied fair value of the reporting unit’s goodwill by allocating the reporting unit’s fair value to all of its assets and liabilities other than goodwill (including any unrecognized intangible assets). We compare the resulting implied fair value of the goodwill to the carrying amount and record an impairment charge for the difference. We test individual indefinite-lived intangible assets by comparing the estimated fair value with the book values of each asset.
We determine the fair value of our reporting units and indefinite-lived intangible assets using an income approach. Under the income approach, we calculate the fair value of our reporting units and indefinite-lived intangible assets based on the present value of estimated future cash flows. Considerable management judgment is necessary to evaluate the impact of operating and macroeconomic changes and to estimate the future cash flows used to measure fair value. Our estimates of future cash flows consider past performance, current and anticipated market conditions
52
THE HERSHEY COMPANYNOTES TO CONSOLIDATED FINANCIAL STATEMENTS—(Continued)
(amounts in thousands, except share data or if otherwise indicated)
and internal projections and operating plans which incorporate estimates for sales growth and profitability, and cash flows associated with taxes and capital spending. Additional assumptions include forecasted growth rates, estimated discount rates, which may be risk-adjusted for the operating market of the reporting unit, and estimated royalty rates that would be charged for comparable branded licenses. We believe such assumptions also reflect current and anticipated market conditions and are consistent with those that would be used by other marketplace participants for similar valuation purposes. Such assumptions are subject to change due to changing economic and competitive conditions. See Note 3 for additional information regarding the results of our annual impairment test.
The cost of intangible assets with finite useful lives is amortized on a straight-line basis. Our finite-lived intangible assets consist primarily of certain trademarks, customer-related intangible assets and patents obtained through business acquisitions, which are amortized over estimated useful lives of approximately 25 years, 15 years, and 5 years, respectively. When certain events or changes in operating conditions indicate that the carrying value of these assets may not be recoverable, we perform an impairment assessment and may adjust the remaining useful lives.
Currency Translation
The financial statements of our foreign entities with functional currencies other than the U.S. dollar are translated into U.S. dollars, with the resulting translation adjustments recorded as a component of other comprehensive income (loss). Assets and liabilities are translated into U.S. dollars using the exchange rates in effect at the balance sheet date, while income and expense items are translated using the average exchange rates during the period.
Derivative Instruments
We use derivative instruments principally to offset exposure to market risks arising from changes in commodity prices, foreign currency exchange rates and interest rates. See Note 5 for additional information on our risk management strategy and the types of instruments we use.
Derivative instruments are recognized on the balance sheet at their fair values. When we become party to a derivative instrument and intend to apply hedge accounting, we designate the instrument for financial reporting purposes as a cash flow or fair value hedge. The accounting for changes in fair value (gains or losses) of a derivative instrument depends on whether we had designated it and it qualified as part of a hedging relationship, as noted below:
• Changes in the fair value of a derivative that is designated as a cash flow hedge are recorded in accumulated other comprehensive income (“AOCI”) to the extent effective and reclassified into earnings in the same period or periods during which the transaction hedged by that derivative also affects earnings.
• Changes in the fair value of a derivative that is designated as a fair value hedge, along with the offsetting loss or gain on the hedged asset or liability that is attributable to the risk being hedged, are recorded in earnings, thereby reflecting in earnings the net extent to which the hedge is not effective in achieving offsetting changes in fair value.
• Changes in the fair value of a derivative not designated as a hedging instrument are recognized in earnings in cost of sales or SM&A, consistent with the related exposure.
For derivatives designated as hedges, we assess, both at the hedge's inception and on an ongoing basis, whether they are highly effective in offsetting changes in fair values or cash flows of hedged items. The ineffective portion, if any, is recorded directly in earnings. In addition, if we determine that a derivative is not highly effective as a hedge or that it has ceased to be a highly effective hedge, we discontinue hedge accounting prospectively.
We do not hold or issue derivative instruments for trading or speculative purposes and are not a party to any instruments with leverage or prepayment features.
Cash flows related to the derivative instruments we use to manage interest, commodity or other currency exposures are classified as operating activities.
53
THE HERSHEY COMPANYNOTES TO CONSOLIDATED FINANCIAL STATEMENTS—(Continued)
(amounts in thousands, except share data or if otherwise indicated)
Recent Accounting Pronouncements
In May 2014, the Financial Accounting Standards Board issued Accounting Standards Update (“ASU”) No. 2014-09, Revenue from Contracts with Customers, which requires an entity to recognize the amount of revenue to which it expects to be entitled for the transfer of promised goods or services to customers. ASU No. 2014-09 will replace most existing revenue recognition guidance in U.S. GAAP when it becomes effective. The new standard is effective for us on January 1, 2017. Early application is not permitted. The standard permits the use of either the retrospective or cumulative effect transition method. We are currently evaluating the effect that ASU No. 2014-09 will have on our consolidated financial statements and related disclosures.
No other new accounting pronouncement issued or effective during the fiscal year had or is expected to have a material impact on our consolidated financial statements or disclosures.
2. BUSINESS ACQUISITIONS AND DIVESTITURES
Acquisitions
Acquisitions of businesses are accounted for as purchases and, accordingly, the results of operations of the businesses acquired have been included in the consolidated financial statements since the respective dates of the acquisitions. The purchase price for each of the acquisitions is allocated to the assets acquired and liabilities assumed.
Shanghai Golden Monkey
On September 26, 2014 (the “Initial Acquisition”), our wholly-owned subsidiary, Hershey Netherlands B.V., completed the acquisition of 80% of the total outstanding shares of Shanghai Golden Monkey Food Joint Stock Co., Ltd. (“SGM”), a privately held confectionery company based in Shanghai, China operating through six production facilities located in China. The Golden Monkey product line is primarily sold in China's traditional trade channels. The business complements our position in China, and we expect to take advantage of SGM's distribution and manufacturing capabilities to expand sales of our Hershey products in the China marketplace. Our consolidated net sales for the year ended December 31, 2014 included approximately $54 million generated by SGM since the date of acquisition.
The Initial Acquisition was funded by cash consideration of $394,470, subject to working capital and net debt adjustments. As of December 31, 2014, we have recorded a receivable of $37,860, reflecting our current best estimate of the amount due from the selling SGM shareholders for the working capital and net debt adjustments. Such amount is reflected within prepaid expenses and other in the Consolidated Balance Sheet at December 31, 2014.
Hershey Netherlands B.V. has contractually agreed to purchase the remaining 20% of the outstanding shares of SGM on the one-year anniversary of the Initial Acquisition, subject to the parties obtaining government and regulatory approvals and satisfaction of other closing conditions. As such, we have recorded a liability of $100,067, reflecting the fair value of the future payment to be made to the SGM shareholders. This liability is included within accrued liabilities in the Consolidated Balance Sheet at December 31, 2014.
The total purchase consideration, net of cash and cash equivalents acquired totaling $14,727, was allocated to the net assets acquired based on their respective fair values at September 26, 2014, as follows:
54
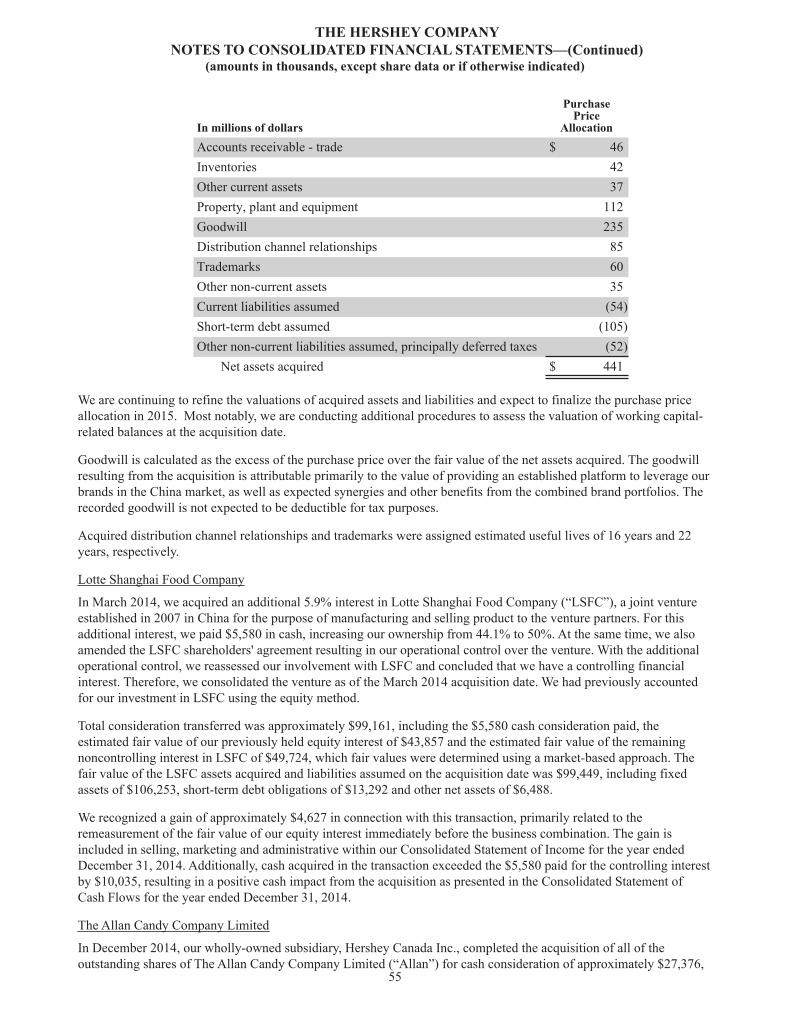
THE HERSHEY COMPANYNOTES TO CONSOLIDATED FINANCIAL STATEMENTS—(Continued)
(amounts in thousands, except share data or if otherwise indicated)
In millions of dollars
PurchasePrice
AllocationAccounts receivable - trade $ 46Inventories 42Other current assets 37Property, plant and equipment 112Goodwill 235Distribution channel relationships 85Trademarks 60Other non-current assets 35Current liabilities assumed (54)Short-term debt assumed (105)Other non-current liabilities assumed, principally deferred taxes (52)
Net assets acquired $ 441
We are continuing to refine the valuations of acquired assets and liabilities and expect to finalize the purchase price allocation in 2015. Most notably, we are conducting additional procedures to assess the valuation of working capital-related balances at the acquisition date.
Goodwill is calculated as the excess of the purchase price over the fair value of the net assets acquired. The goodwill resulting from the acquisition is attributable primarily to the value of providing an established platform to leverage our brands in the China market, as well as expected synergies and other benefits from the combined brand portfolios. The recorded goodwill is not expected to be deductible for tax purposes.
Acquired distribution channel relationships and trademarks were assigned estimated useful lives of 16 years and 22 years, respectively.
Lotte Shanghai Food Company
In March 2014, we acquired an additional 5.9% interest in Lotte Shanghai Food Company (“LSFC”), a joint venture established in 2007 in China for the purpose of manufacturing and selling product to the venture partners. For this additional interest, we paid $5,580 in cash, increasing our ownership from 44.1% to 50%. At the same time, we also amended the LSFC shareholders' agreement resulting in our operational control over the venture. With the additional operational control, we reassessed our involvement with LSFC and concluded that we have a controlling financial interest. Therefore, we consolidated the venture as of the March 2014 acquisition date. We had previously accounted for our investment in LSFC using the equity method.
Total consideration transferred was approximately $99,161, including the $5,580 cash consideration paid, the estimated fair value of our previously held equity interest of $43,857 and the estimated fair value of the remaining noncontrolling interest in LSFC of $49,724, which fair values were determined using a market-based approach. The fair value of the LSFC assets acquired and liabilities assumed on the acquisition date was $99,449, including fixed assets of $106,253, short-term debt obligations of $13,292 and other net assets of $6,488.
We recognized a gain of approximately $4,627 in connection with this transaction, primarily related to the remeasurement of the fair value of our equity interest immediately before the business combination. The gain is included in selling, marketing and administrative within our Consolidated Statement of Income for the year ended December 31, 2014. Additionally, cash acquired in the transaction exceeded the $5,580 paid for the controlling interest by $10,035, resulting in a positive cash impact from the acquisition as presented in the Consolidated Statement of Cash Flows for the year ended December 31, 2014.
The Allan Candy Company Limited
In December 2014, our wholly-owned subsidiary, Hershey Canada Inc., completed the acquisition of all of the outstanding shares of The Allan Candy Company Limited (“Allan”) for cash consideration of approximately $27,376,
55
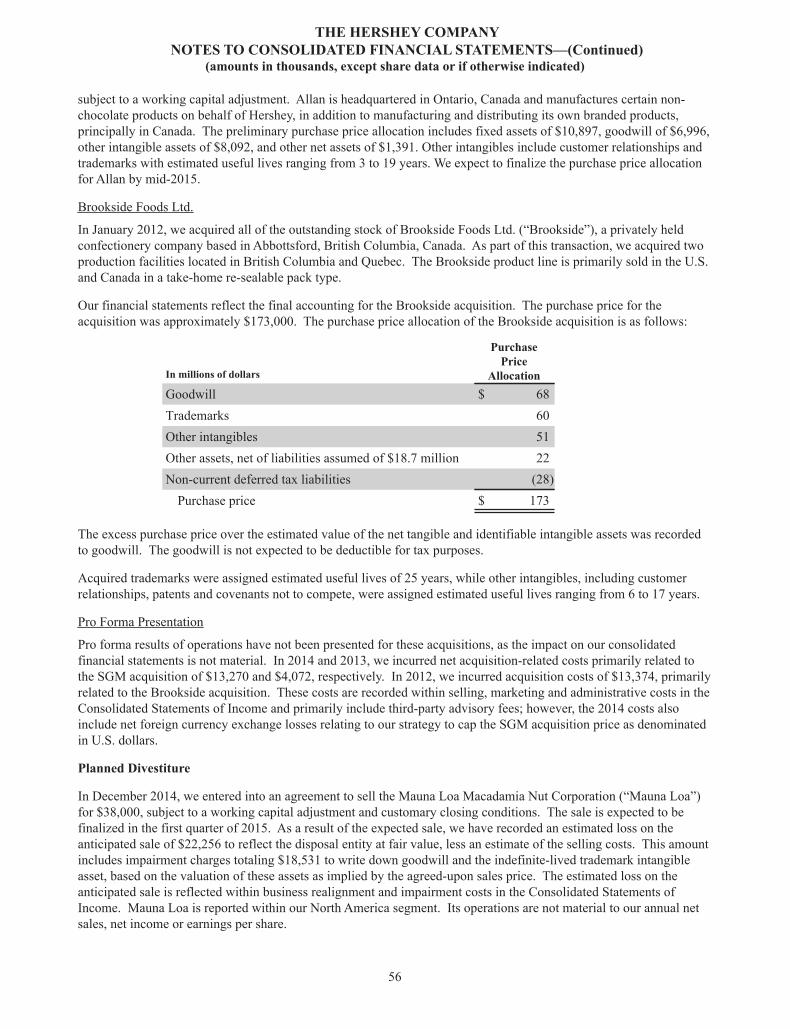
THE HERSHEY COMPANYNOTES TO CONSOLIDATED FINANCIAL STATEMENTS—(Continued)
(amounts in thousands, except share data or if otherwise indicated)
subject to a working capital adjustment. Allan is headquartered in Ontario, Canada and manufactures certain non-chocolate products on behalf of Hershey, in addition to manufacturing and distributing its own branded products, principally in Canada. The preliminary purchase price allocation includes fixed assets of $10,897, goodwill of $6,996, other intangible assets of $8,092, and other net assets of $1,391. Other intangibles include customer relationships and trademarks with estimated useful lives ranging from 3 to 19 years. We expect to finalize the purchase price allocation for Allan by mid-2015.
Brookside Foods Ltd.
In January 2012, we acquired all of the outstanding stock of Brookside Foods Ltd. (“Brookside”), a privately held confectionery company based in Abbottsford, British Columbia, Canada. As part of this transaction, we acquired two production facilities located in British Columbia and Quebec. The Brookside product line is primarily sold in the U.S. and Canada in a take-home re-sealable pack type.
Our financial statements reflect the final accounting for the Brookside acquisition. The purchase price for the acquisition was approximately $173,000. The purchase price allocation of the Brookside acquisition is as follows:
In millions of dollars
Purchase Price
Allocation Goodwill $ 68Trademarks 60Other intangibles 51Other assets, net of liabilities assumed of $18.7 million 22Non-current deferred tax liabilities (28)
Purchase price $ 173
The excess purchase price over the estimated value of the net tangible and identifiable intangible assets was recorded to goodwill. The goodwill is not expected to be deductible for tax purposes.
Acquired trademarks were assigned estimated useful lives of 25 years, while other intangibles, including customer relationships, patents and covenants not to compete, were assigned estimated useful lives ranging from 6 to 17 years.
Pro Forma Presentation
Pro forma results of operations have not been presented for these acquisitions, as the impact on our consolidated financial statements is not material. In 2014 and 2013, we incurred net acquisition-related costs primarily related to the SGM acquisition of $13,270 and $4,072, respectively. In 2012, we incurred acquisition costs of $13,374, primarily related to the Brookside acquisition. These costs are recorded within selling, marketing and administrative costs in the Consolidated Statements of Income and primarily include third-party advisory fees; however, the 2014 costs also include net foreign currency exchange losses relating to our strategy to cap the SGM acquisition price as denominated in U.S. dollars.
Planned Divestiture
In December 2014, we entered into an agreement to sell the Mauna Loa Macadamia Nut Corporation (“Mauna Loa”) for $38,000, subject to a working capital adjustment and customary closing conditions. The sale is expected to be finalized in the first quarter of 2015. As a result of the expected sale, we have recorded an estimated loss on the anticipated sale of $22,256 to reflect the disposal entity at fair value, less an estimate of the selling costs. This amount includes impairment charges totaling $18,531 to write down goodwill and the indefinite-lived trademark intangible asset, based on the valuation of these assets as implied by the agreed-upon sales price. The estimated loss on the anticipated sale is reflected within business realignment and impairment costs in the Consolidated Statements of Income. Mauna Loa is reported within our North America segment. Its operations are not material to our annual net sales, net income or earnings per share.
56
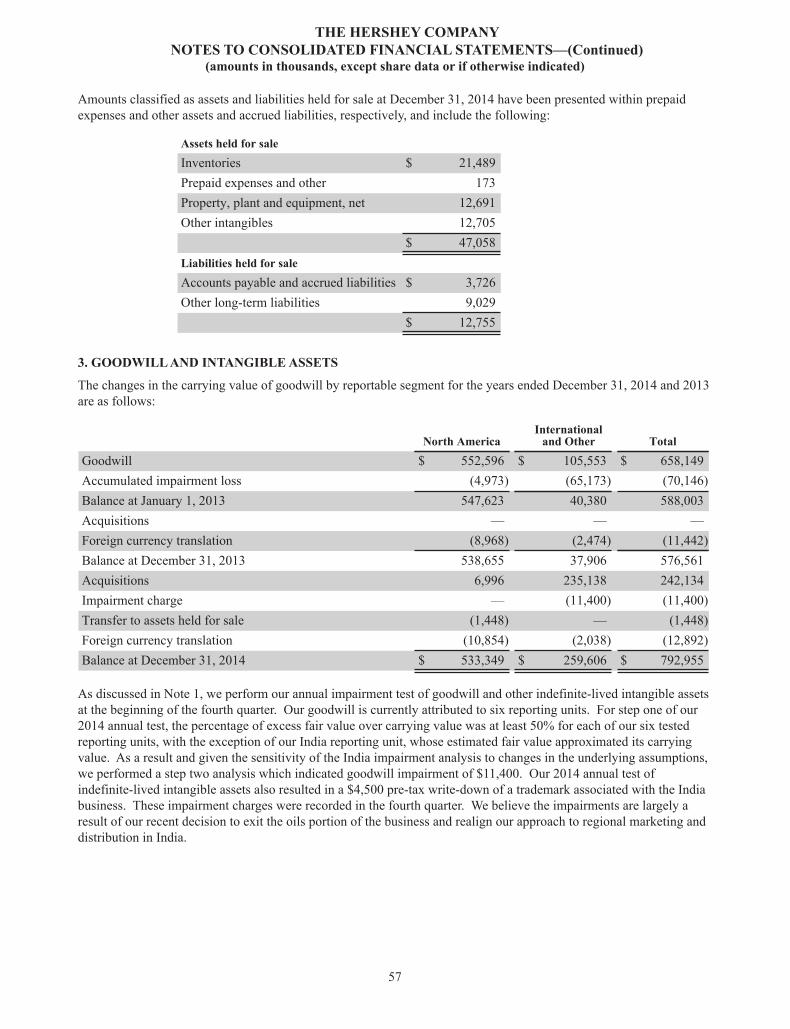
THE HERSHEY COMPANYNOTES TO CONSOLIDATED FINANCIAL STATEMENTS—(Continued)
(amounts in thousands, except share data or if otherwise indicated)
Amounts classified as assets and liabilities held for sale at December 31, 2014 have been presented within prepaid expenses and other assets and accrued liabilities, respectively, and include the following:
Assets held for saleInventories $ 21,489Prepaid expenses and other 173Property, plant and equipment, net 12,691Other intangibles 12,705
$ 47,058Liabilities held for saleAccounts payable and accrued liabilities $ 3,726Other long-term liabilities 9,029
$ 12,755
3. GOODWILL AND INTANGIBLE ASSETS
The changes in the carrying value of goodwill by reportable segment for the years ended December 31, 2014 and 2013 are as follows:
North America International
and Other TotalGoodwill $ 552,596 $ 105,553 $ 658,149Accumulated impairment loss (4,973) (65,173) (70,146)Balance at January 1, 2013 547,623 40,380 588,003Acquisitions — — —Foreign currency translation (8,968) (2,474) (11,442)Balance at December 31, 2013 538,655 37,906 576,561Acquisitions 6,996 235,138 242,134Impairment charge — (11,400) (11,400)Transfer to assets held for sale (1,448) — (1,448)Foreign currency translation (10,854) (2,038) (12,892)Balance at December 31, 2014 $ 533,349 $ 259,606 $ 792,955
As discussed in Note 1, we perform our annual impairment test of goodwill and other indefinite-lived intangible assets at the beginning of the fourth quarter. Our goodwill is currently attributed to six reporting units. For step one of our 2014 annual test, the percentage of excess fair value over carrying value was at least 50% for each of our six tested reporting units, with the exception of our India reporting unit, whose estimated fair value approximated its carrying value. As a result and given the sensitivity of the India impairment analysis to changes in the underlying assumptions, we performed a step two analysis which indicated goodwill impairment of $11,400. Our 2014 annual test of indefinite-lived intangible assets also resulted in a $4,500 pre-tax write-down of a trademark associated with the India business. These impairment charges were recorded in the fourth quarter. We believe the impairments are largely a result of our recent decision to exit the oils portion of the business and realign our approach to regional marketing and distribution in India.
57
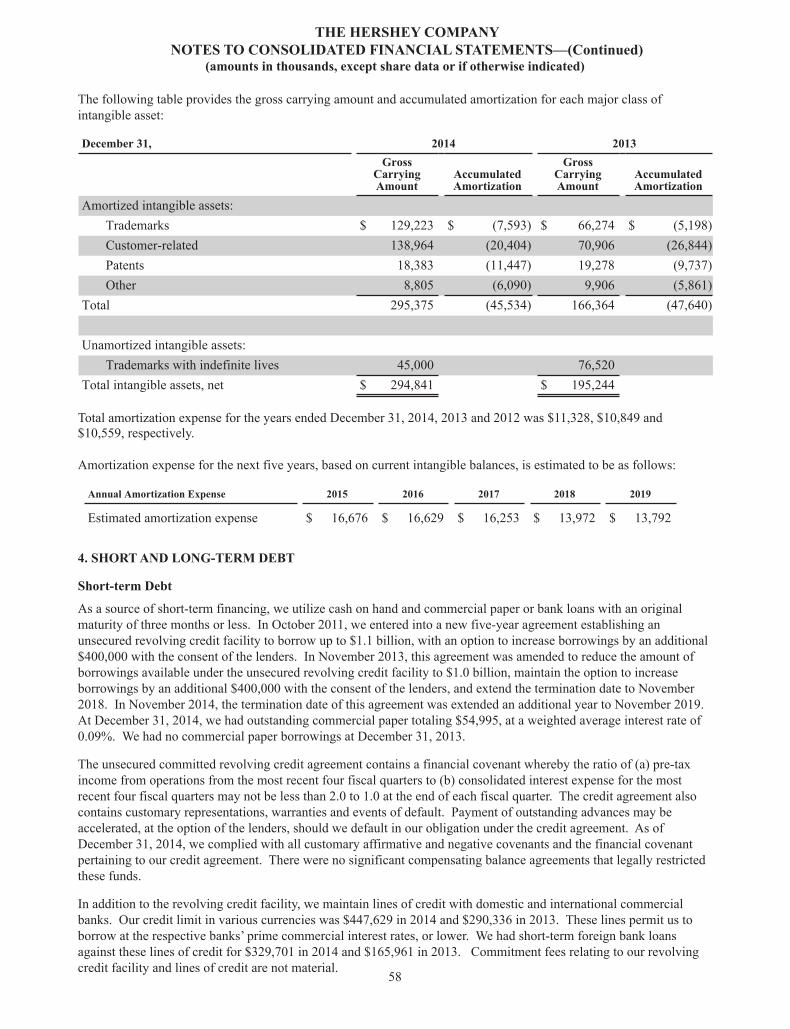
THE HERSHEY COMPANYNOTES TO CONSOLIDATED FINANCIAL STATEMENTS—(Continued)
(amounts in thousands, except share data or if otherwise indicated)
The following table provides the gross carrying amount and accumulated amortization for each major class of intangible asset:
December 31, 2014 2013Gross
CarryingAmount
AccumulatedAmortization
GrossCarryingAmount
AccumulatedAmortization
Amortized intangible assets:Trademarks $ 129,223 $ (7,593) $ 66,274 $ (5,198)Customer-related 138,964 (20,404) 70,906 (26,844)Patents 18,383 (11,447) 19,278 (9,737)Other 8,805 (6,090) 9,906 (5,861)
Total 295,375 (45,534) 166,364 (47,640)
Unamortized intangible assets:Trademarks with indefinite lives 45,000 76,520
Total intangible assets, net $ 294,841 $ 195,244
Total amortization expense for the years ended December 31, 2014, 2013 and 2012 was $11,328, $10,849 and $10,559, respectively.
Amortization expense for the next five years, based on current intangible balances, is estimated to be as follows:
Annual Amortization Expense 2015 2016 2017 2018 2019
Estimated amortization expense $ 16,676 $ 16,629 $ 16,253 $ 13,972 $ 13,792
4. SHORT AND LONG-TERM DEBT
Short-term Debt
As a source of short-term financing, we utilize cash on hand and commercial paper or bank loans with an original maturity of three months or less. In October 2011, we entered into a new five-year agreement establishing an unsecured revolving credit facility to borrow up to $1.1 billion, with an option to increase borrowings by an additional $400,000 with the consent of the lenders. In November 2013, this agreement was amended to reduce the amount of borrowings available under the unsecured revolving credit facility to $1.0 billion, maintain the option to increase borrowings by an additional $400,000 with the consent of the lenders, and extend the termination date to November 2018. In November 2014, the termination date of this agreement was extended an additional year to November 2019. At December 31, 2014, we had outstanding commercial paper totaling $54,995, at a weighted average interest rate of 0.09%. We had no commercial paper borrowings at December 31, 2013.
The unsecured committed revolving credit agreement contains a financial covenant whereby the ratio of (a) pre-tax income from operations from the most recent four fiscal quarters to (b) consolidated interest expense for the most recent four fiscal quarters may not be less than 2.0 to 1.0 at the end of each fiscal quarter. The credit agreement also contains customary representations, warranties and events of default. Payment of outstanding advances may be accelerated, at the option of the lenders, should we default in our obligation under the credit agreement. As of December 31, 2014, we complied with all customary affirmative and negative covenants and the financial covenant pertaining to our credit agreement. There were no significant compensating balance agreements that legally restricted these funds.
In addition to the revolving credit facility, we maintain lines of credit with domestic and international commercial banks. Our credit limit in various currencies was $447,629 in 2014 and $290,336 in 2013. These lines permit us to borrow at the respective banks’ prime commercial interest rates, or lower. We had short-term foreign bank loans against these lines of credit for $329,701 in 2014 and $165,961 in 2013. Commitment fees relating to our revolving credit facility and lines of credit are not material.
58
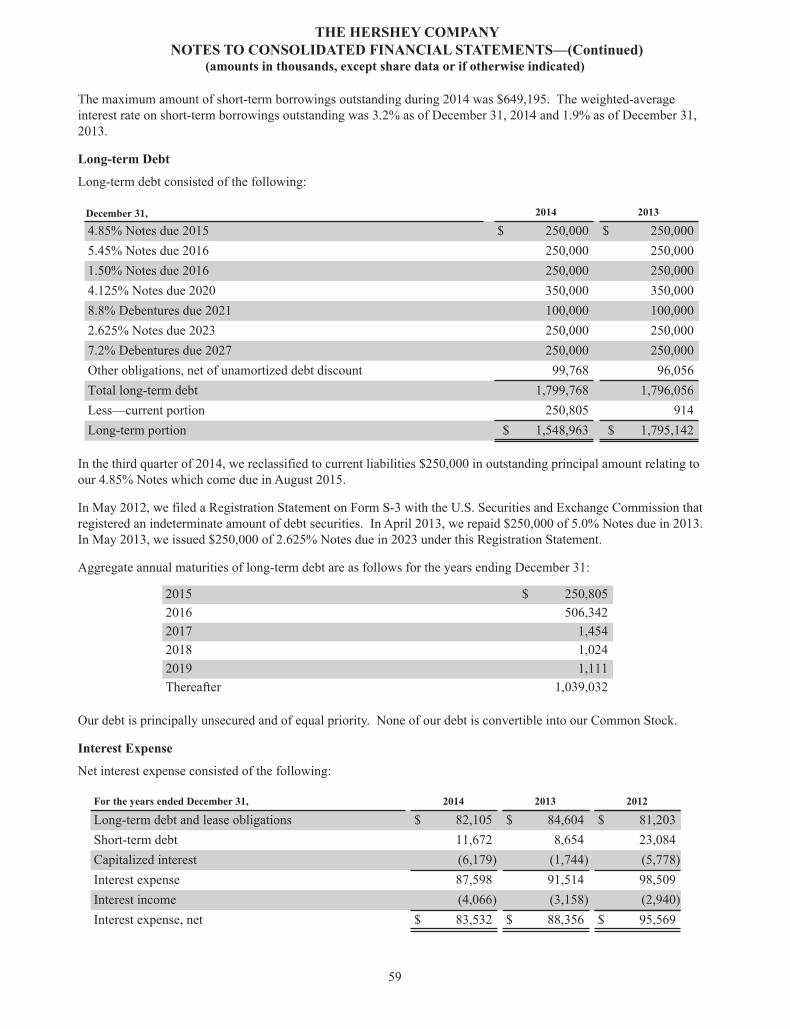
THE HERSHEY COMPANYNOTES TO CONSOLIDATED FINANCIAL STATEMENTS—(Continued)
(amounts in thousands, except share data or if otherwise indicated)
The maximum amount of short-term borrowings outstanding during 2014 was $649,195. The weighted-average interest rate on short-term borrowings outstanding was 3.2% as of December 31, 2014 and 1.9% as of December 31, 2013.
Long-term Debt
Long-term debt consisted of the following:
December 31, 2014 2013
4.85% Notes due 2015 $ 250,000 $ 250,0005.45% Notes due 2016 250,000 250,0001.50% Notes due 2016 250,000 250,0004.125% Notes due 2020 350,000 350,0008.8% Debentures due 2021 100,000 100,0002.625% Notes due 2023 250,000 250,0007.2% Debentures due 2027 250,000 250,000Other obligations, net of unamortized debt discount 99,768 96,056Total long-term debt 1,799,768 1,796,056Less—current portion 250,805 914Long-term portion $ 1,548,963 $ 1,795,142
In the third quarter of 2014, we reclassified to current liabilities $250,000 in outstanding principal amount relating to our 4.85% Notes which come due in August 2015.
In May 2012, we filed a Registration Statement on Form S-3 with the U.S. Securities and Exchange Commission that registered an indeterminate amount of debt securities. In April 2013, we repaid $250,000 of 5.0% Notes due in 2013. In May 2013, we issued $250,000 of 2.625% Notes due in 2023 under this Registration Statement.
Aggregate annual maturities of long-term debt are as follows for the years ending December 31:
2015 $ 250,8052016 506,3422017 1,4542018 1,0242019 1,111Thereafter 1,039,032
Our debt is principally unsecured and of equal priority. None of our debt is convertible into our Common Stock.
Interest Expense
Net interest expense consisted of the following:
For the years ended December 31, 2014 2013 2012
Long-term debt and lease obligations $ 82,105 $ 84,604 $ 81,203Short-term debt 11,672 8,654 23,084Capitalized interest (6,179) (1,744) (5,778)Interest expense 87,598 91,514 98,509Interest income (4,066) (3,158) (2,940)Interest expense, net $ 83,532 $ 88,356 $ 95,569
59
THE HERSHEY COMPANYNOTES TO CONSOLIDATED FINANCIAL STATEMENTS—(Continued)
(amounts in thousands, except share data or if otherwise indicated)
5. DERIVATIVE INSTRUMENTS AND FAIR VALUE MEASUREMENTS
We are exposed to market risks arising principally from changes in foreign currency exchange rates, interest rates and commodity prices. We use certain derivative instruments to manage these risks. These include interest rate swaps to manage interest rate risk, foreign currency forward exchange contracts and options to manage foreign currency exchange rate risk, and commodities futures and options contracts to manage commodity market price risk exposures.
We also use derivatives that do not qualify for hedge accounting treatment. We account for such derivatives at market value with the resulting gains and losses reflected in the income statement.
In entering into these contracts, we have assumed the risk that might arise from the possible inability of counterparties to meet the terms of their contracts. We mitigate this risk by entering into exchanged-traded contracts with collateral posting requirements and/or by performing financial assessments prior to contract execution, conducting periodic evaluations of counterparty performance and maintaining a diverse portfolio of qualified counterparties. We do not expect any significant losses from counterparty defaults.
Commodity Price Risk
We enter into commodities futures and options contracts and other commodity derivative instruments to reduce the effect of future price fluctuations associated with the purchase of raw materials, energy requirements and transportation services. We generally hedge commodity price risks for 3- to 24-month periods. The majority of our commodity derivative instruments meet hedge accounting requirements and are designated as cash flow hedges. We account for the effective portion of mark-to-market gains and losses on commodity derivative instruments in other comprehensive income, to be recognized in cost of sales in the same period that we record the hedged raw material requirements in cost of sales. The ineffective portion of gains and losses is recorded currently in cost of sales.
Foreign Exchange Price Risk
We are exposed to foreign currency exchange rate risk related to our international operations, including non-functional currency intercompany debt and other non-functional currency transactions of certain subsidiaries. Principal currencies hedged include the euro, Canadian dollar, Malaysian ringgit, Swiss franc, Chinese renminbi, Japanese yen, and Brazilian real. We typically utilize foreign currency forward exchange contracts and options to hedge these exposures for periods ranging from 3 to 24 months. The contracts are either designated as cash flow hedges or are undesignated. The net notional amount of foreign exchange contracts accounted for as cash flow hedges was $22,725 at December 31, 2014 and $158,375 at December 31, 2013. The effective portion of the changes in fair value on these contracts is recorded in other comprehensive income and reclassified into earnings in the same period in which the hedged transactions affect earnings. The net notional amount of foreign exchange contracts that are not designated as accounting hedges was $4,144 at December 31, 2014 and $2,823 at December 31, 2013. The change in fair value on these instruments is recorded directly in cost of sales or selling, marketing and administrative expense, depending on the nature of the underlying exposure.
Interest Rate Risk
In order to manage interest rate exposure, from time to time we enter into interest rate swap agreements that effectively convert variable rate debt to a fixed interest rate. These swaps are designated as cash flow hedges, with gains and losses deferred in other comprehensive income to be recognized as an adjustment to interest expense in the same period that the hedged interest payments affect earnings. The notional amount of interest rate derivative instruments in cash flow hedging relationships was $750,000 at December 31, 2014 and $250,000 at December 31, 2013.
We also manage our targeted mix of fixed and floating rate debt with debt issuances and by entering into fixed-to-floating interest rate swaps in order to mitigate fluctuations in earnings and cash flows that may result from interest rate volatility. These swaps are designated as fair value hedges, for which the gain or loss on the derivative and the offsetting loss or gain on the hedged item are recognized in current earnings as interest expense (income), net. The notional amount, interest payment and maturity date of these swaps generally match the principal, interest payment and maturity date of the related debt, and the swaps are valued using observable benchmark rates (Level 2 valuation). The notional amount of interest rate derivative instruments in fair value hedge relationships was $450,000 at December 31, 2014. We had no derivative instruments in fair value hedge relationships at December 31, 2013.
60
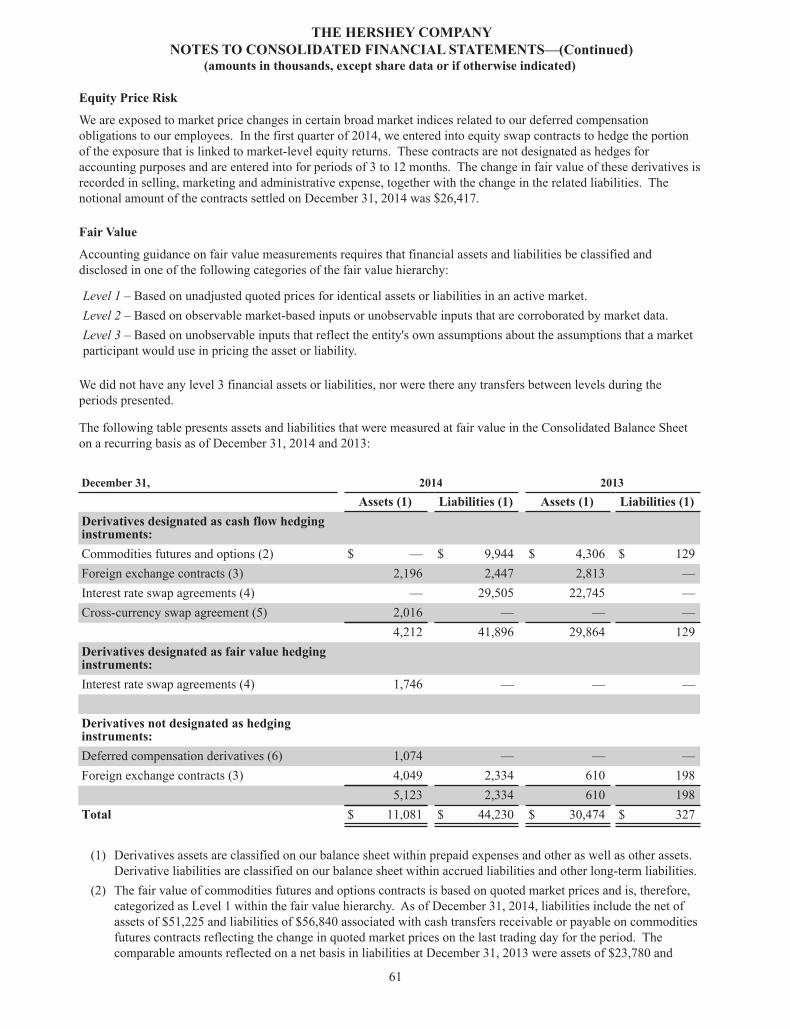
THE HERSHEY COMPANYNOTES TO CONSOLIDATED FINANCIAL STATEMENTS—(Continued)
(amounts in thousands, except share data or if otherwise indicated)
Equity Price Risk
We are exposed to market price changes in certain broad market indices related to our deferred compensation obligations to our employees. In the first quarter of 2014, we entered into equity swap contracts to hedge the portion of the exposure that is linked to market-level equity returns. These contracts are not designated as hedges for accounting purposes and are entered into for periods of 3 to 12 months. The change in fair value of these derivatives is recorded in selling, marketing and administrative expense, together with the change in the related liabilities. The notional amount of the contracts settled on December 31, 2014 was $26,417.
Fair Value
Accounting guidance on fair value measurements requires that financial assets and liabilities be classified and disclosed in one of the following categories of the fair value hierarchy:
Level 1 – Based on unadjusted quoted prices for identical assets or liabilities in an active market. Level 2 – Based on observable market-based inputs or unobservable inputs that are corroborated by market data.Level 3 – Based on unobservable inputs that reflect the entity's own assumptions about the assumptions that a market participant would use in pricing the asset or liability.
We did not have any level 3 financial assets or liabilities, nor were there any transfers between levels during the periods presented.
The following table presents assets and liabilities that were measured at fair value in the Consolidated Balance Sheet on a recurring basis as of December 31, 2014 and 2013:
December 31, 2014 2013Assets (1) Liabilities (1) Assets (1) Liabilities (1)
Derivatives designated as cash flow hedginginstruments:Commodities futures and options (2) $ — $ 9,944 $ 4,306 $ 129Foreign exchange contracts (3) 2,196 2,447 2,813 —Interest rate swap agreements (4) — 29,505 22,745 —Cross-currency swap agreement (5) 2,016 — — —
4,212 41,896 29,864 129Derivatives designated as fair value hedginginstruments:Interest rate swap agreements (4) 1,746 — — —
Derivatives not designated as hedginginstruments:Deferred compensation derivatives (6) 1,074 — — —Foreign exchange contracts (3) 4,049 2,334 610 198
5,123 2,334 610 198Total $ 11,081 $ 44,230 $ 30,474 $ 327
(1) Derivatives assets are classified on our balance sheet within prepaid expenses and other as well as other assets. Derivative liabilities are classified on our balance sheet within accrued liabilities and other long-term liabilities.
(2) The fair value of commodities futures and options contracts is based on quoted market prices and is, therefore, categorized as Level 1 within the fair value hierarchy. As of December 31, 2014, liabilities include the net of assets of $51,225 and liabilities of $56,840 associated with cash transfers receivable or payable on commodities futures contracts reflecting the change in quoted market prices on the last trading day for the period. The comparable amounts reflected on a net basis in liabilities at December 31, 2013 were assets of $23,780 and
61
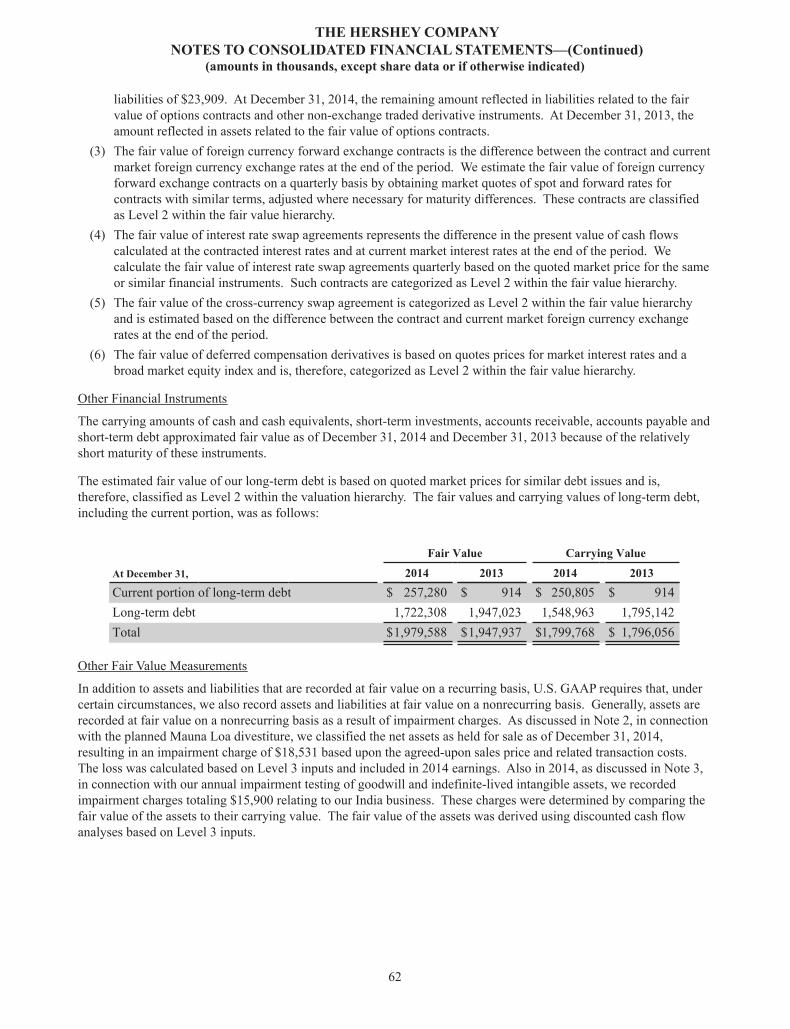
THE HERSHEY COMPANYNOTES TO CONSOLIDATED FINANCIAL STATEMENTS—(Continued)
(amounts in thousands, except share data or if otherwise indicated)
liabilities of $23,909. At December 31, 2014, the remaining amount reflected in liabilities related to the fair value of options contracts and other non-exchange traded derivative instruments. At December 31, 2013, the amount reflected in assets related to the fair value of options contracts.
(3) The fair value of foreign currency forward exchange contracts is the difference between the contract and current market foreign currency exchange rates at the end of the period. We estimate the fair value of foreign currency forward exchange contracts on a quarterly basis by obtaining market quotes of spot and forward rates for contracts with similar terms, adjusted where necessary for maturity differences. These contracts are classified as Level 2 within the fair value hierarchy.
(4) The fair value of interest rate swap agreements represents the difference in the present value of cash flows calculated at the contracted interest rates and at current market interest rates at the end of the period. We calculate the fair value of interest rate swap agreements quarterly based on the quoted market price for the same or similar financial instruments. Such contracts are categorized as Level 2 within the fair value hierarchy.
(5) The fair value of the cross-currency swap agreement is categorized as Level 2 within the fair value hierarchy and is estimated based on the difference between the contract and current market foreign currency exchange rates at the end of the period.
(6) The fair value of deferred compensation derivatives is based on quotes prices for market interest rates and a broad market equity index and is, therefore, categorized as Level 2 within the fair value hierarchy.
Other Financial Instruments
The carrying amounts of cash and cash equivalents, short-term investments, accounts receivable, accounts payable and short-term debt approximated fair value as of December 31, 2014 and December 31, 2013 because of the relatively short maturity of these instruments.
The estimated fair value of our long-term debt is based on quoted market prices for similar debt issues and is, therefore, classified as Level 2 within the valuation hierarchy. The fair values and carrying values of long-term debt, including the current portion, was as follows:
Fair Value Carrying Value
At December 31, 2014 2013 2014 2013Current portion of long-term debt $ 257,280 $ 914 $ 250,805 $ 914Long-term debt 1,722,308 1,947,023 1,548,963 1,795,142Total $1,979,588 $1,947,937 $1,799,768 $ 1,796,056
Other Fair Value Measurements
In addition to assets and liabilities that are recorded at fair value on a recurring basis, U.S. GAAP requires that, under certain circumstances, we also record assets and liabilities at fair value on a nonrecurring basis. Generally, assets are recorded at fair value on a nonrecurring basis as a result of impairment charges. As discussed in Note 2, in connection with the planned Mauna Loa divestiture, we classified the net assets as held for sale as of December 31, 2014, resulting in an impairment charge of $18,531 based upon the agreed-upon sales price and related transaction costs. The loss was calculated based on Level 3 inputs and included in 2014 earnings. Also in 2014, as discussed in Note 3, in connection with our annual impairment testing of goodwill and indefinite-lived intangible assets, we recorded impairment charges totaling $15,900 relating to our India business. These charges were determined by comparing the fair value of the assets to their carrying value. The fair value of the assets was derived using discounted cash flow analyses based on Level 3 inputs.
62
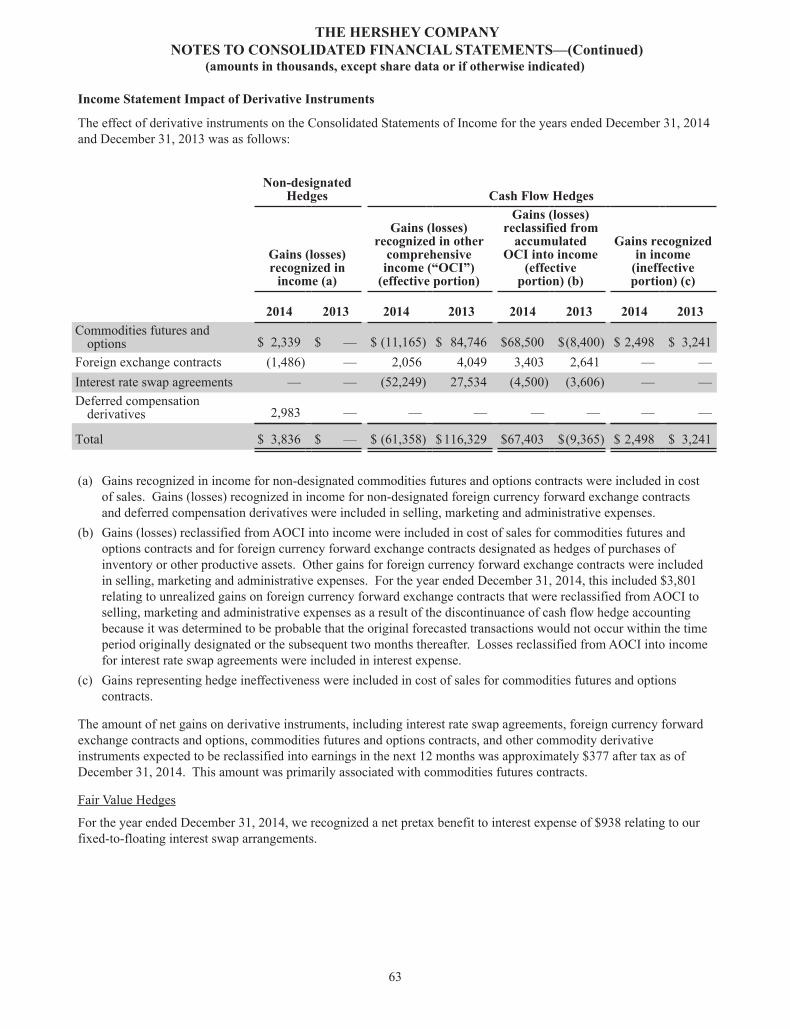
THE HERSHEY COMPANYNOTES TO CONSOLIDATED FINANCIAL STATEMENTS—(Continued)
(amounts in thousands, except share data or if otherwise indicated)
Income Statement Impact of Derivative Instruments
The effect of derivative instruments on the Consolidated Statements of Income for the years ended December 31, 2014 and December 31, 2013 was as follows:
Non-designatedHedges Cash Flow Hedges
Gains (losses)recognized in
income (a)
Gains (losses)recognized in other
comprehensiveincome (“OCI”)
(effective portion)
Gains (losses)reclassified from
accumulatedOCI into income
(effectiveportion) (b)
Gains recognizedin income
(ineffectiveportion) (c)
2014 2013 2014 2013 2014 2013 2014 2013Commodities futures and
options $ 2,339 $ — $ (11,165) $ 84,746 $68,500 $(8,400) $ 2,498 $ 3,241Foreign exchange contracts (1,486) — 2,056 4,049 3,403 2,641 — —Interest rate swap agreements — — (52,249) 27,534 (4,500) (3,606) — —Deferred compensation
derivatives 2,983 — — — — — — —
Total $ 3,836 $ — $ (61,358) $116,329 $67,403 $(9,365) $ 2,498 $ 3,241
(a) Gains recognized in income for non-designated commodities futures and options contracts were included in cost of sales. Gains (losses) recognized in income for non-designated foreign currency forward exchange contracts and deferred compensation derivatives were included in selling, marketing and administrative expenses.
(b) Gains (losses) reclassified from AOCI into income were included in cost of sales for commodities futures and options contracts and for foreign currency forward exchange contracts designated as hedges of purchases of inventory or other productive assets. Other gains for foreign currency forward exchange contracts were included in selling, marketing and administrative expenses. For the year ended December 31, 2014, this included $3,801 relating to unrealized gains on foreign currency forward exchange contracts that were reclassified from AOCI to selling, marketing and administrative expenses as a result of the discontinuance of cash flow hedge accounting because it was determined to be probable that the original forecasted transactions would not occur within the time period originally designated or the subsequent two months thereafter. Losses reclassified from AOCI into income for interest rate swap agreements were included in interest expense.
(c) Gains representing hedge ineffectiveness were included in cost of sales for commodities futures and options contracts.
The amount of net gains on derivative instruments, including interest rate swap agreements, foreign currency forward exchange contracts and options, commodities futures and options contracts, and other commodity derivative instruments expected to be reclassified into earnings in the next 12 months was approximately $377 after tax as of December 31, 2014. This amount was primarily associated with commodities futures contracts.
Fair Value Hedges
For the year ended December 31, 2014, we recognized a net pretax benefit to interest expense of $938 relating to our fixed-to-floating interest swap arrangements.
63
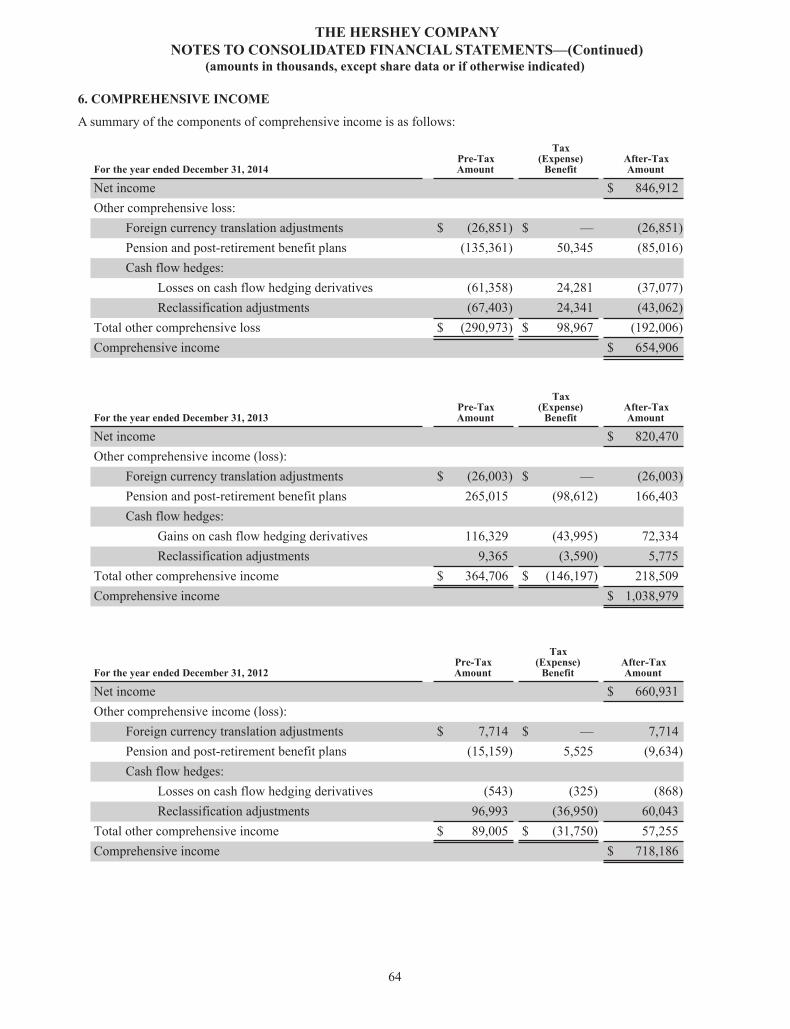
THE HERSHEY COMPANYNOTES TO CONSOLIDATED FINANCIAL STATEMENTS—(Continued)
(amounts in thousands, except share data or if otherwise indicated)
6. COMPREHENSIVE INCOME
A summary of the components of comprehensive income is as follows:
For the year ended December 31, 2014Pre-TaxAmount
Tax(Expense)
BenefitAfter-TaxAmount
Net income $ 846,912Other comprehensive loss:
Foreign currency translation adjustments $ (26,851) $ — (26,851)Pension and post-retirement benefit plans (135,361) 50,345 (85,016)Cash flow hedges:
Losses on cash flow hedging derivatives (61,358) 24,281 (37,077)Reclassification adjustments (67,403) 24,341 (43,062)
Total other comprehensive loss $ (290,973) $ 98,967 (192,006)Comprehensive income $ 654,906
For the year ended December 31, 2013Pre-TaxAmount
Tax(Expense)
BenefitAfter-TaxAmount
Net income $ 820,470Other comprehensive income (loss):
Foreign currency translation adjustments $ (26,003) $ — (26,003)Pension and post-retirement benefit plans 265,015 (98,612) 166,403Cash flow hedges:
Gains on cash flow hedging derivatives 116,329 (43,995) 72,334Reclassification adjustments 9,365 (3,590) 5,775
Total other comprehensive income $ 364,706 $ (146,197) 218,509Comprehensive income $ 1,038,979
For the year ended December 31, 2012Pre-TaxAmount
Tax(Expense)
BenefitAfter-TaxAmount
Net income $ 660,931Other comprehensive income (loss):
Foreign currency translation adjustments $ 7,714 $ — 7,714Pension and post-retirement benefit plans (15,159) 5,525 (9,634)Cash flow hedges:
Losses on cash flow hedging derivatives (543) (325) (868)Reclassification adjustments 96,993 (36,950) 60,043
Total other comprehensive income $ 89,005 $ (31,750) 57,255Comprehensive income $ 718,186
64
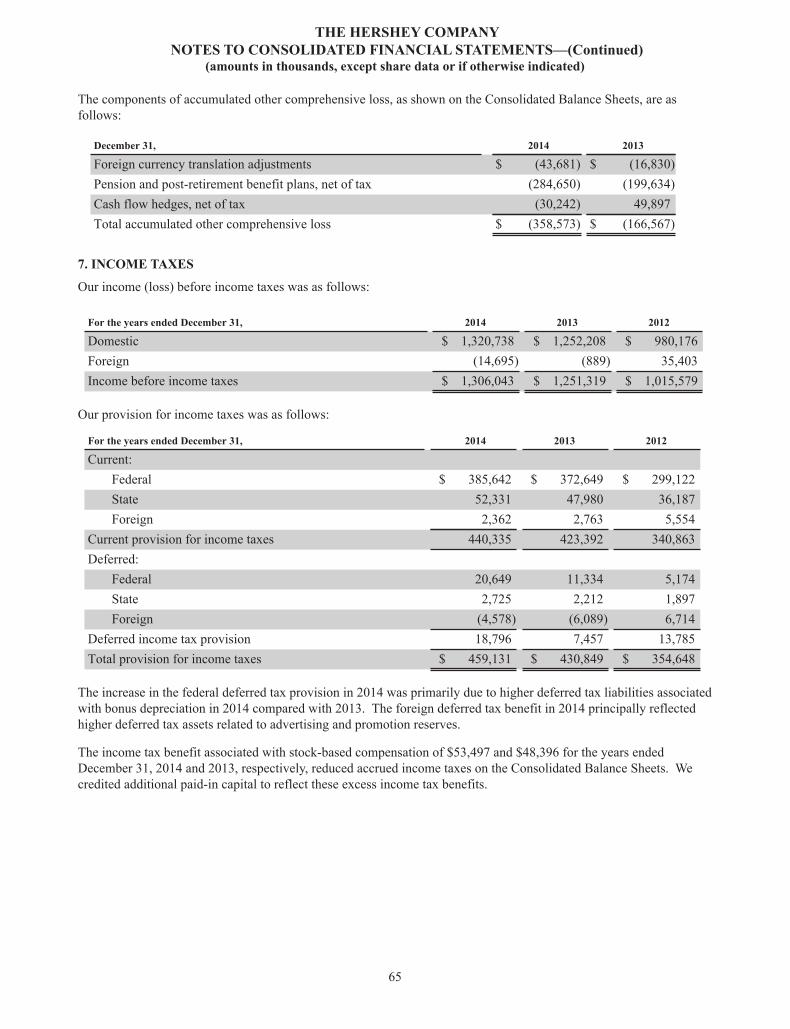
THE HERSHEY COMPANYNOTES TO CONSOLIDATED FINANCIAL STATEMENTS—(Continued)
(amounts in thousands, except share data or if otherwise indicated)
The components of accumulated other comprehensive loss, as shown on the Consolidated Balance Sheets, are as follows:
December 31, 2014 2013
Foreign currency translation adjustments $ (43,681) $ (16,830)Pension and post-retirement benefit plans, net of tax (284,650) (199,634)Cash flow hedges, net of tax (30,242) 49,897Total accumulated other comprehensive loss $ (358,573) $ (166,567)
7. INCOME TAXES
Our income (loss) before income taxes was as follows:
For the years ended December 31, 2014 2013 2012
Domestic $ 1,320,738 $ 1,252,208 $ 980,176Foreign (14,695) (889) 35,403Income before income taxes $ 1,306,043 $ 1,251,319 $ 1,015,579
Our provision for income taxes was as follows:
For the years ended December 31, 2014 2013 2012
Current:Federal $ 385,642 $ 372,649 $ 299,122State 52,331 47,980 36,187Foreign 2,362 2,763 5,554
Current provision for income taxes 440,335 423,392 340,863Deferred:
Federal 20,649 11,334 5,174State 2,725 2,212 1,897Foreign (4,578) (6,089) 6,714
Deferred income tax provision 18,796 7,457 13,785Total provision for income taxes $ 459,131 $ 430,849 $ 354,648
The increase in the federal deferred tax provision in 2014 was primarily due to higher deferred tax liabilities associated with bonus depreciation in 2014 compared with 2013. The foreign deferred tax benefit in 2014 principally reflected higher deferred tax assets related to advertising and promotion reserves.
The income tax benefit associated with stock-based compensation of $53,497 and $48,396 for the years ended December 31, 2014 and 2013, respectively, reduced accrued income taxes on the Consolidated Balance Sheets. We credited additional paid-in capital to reflect these excess income tax benefits.
65
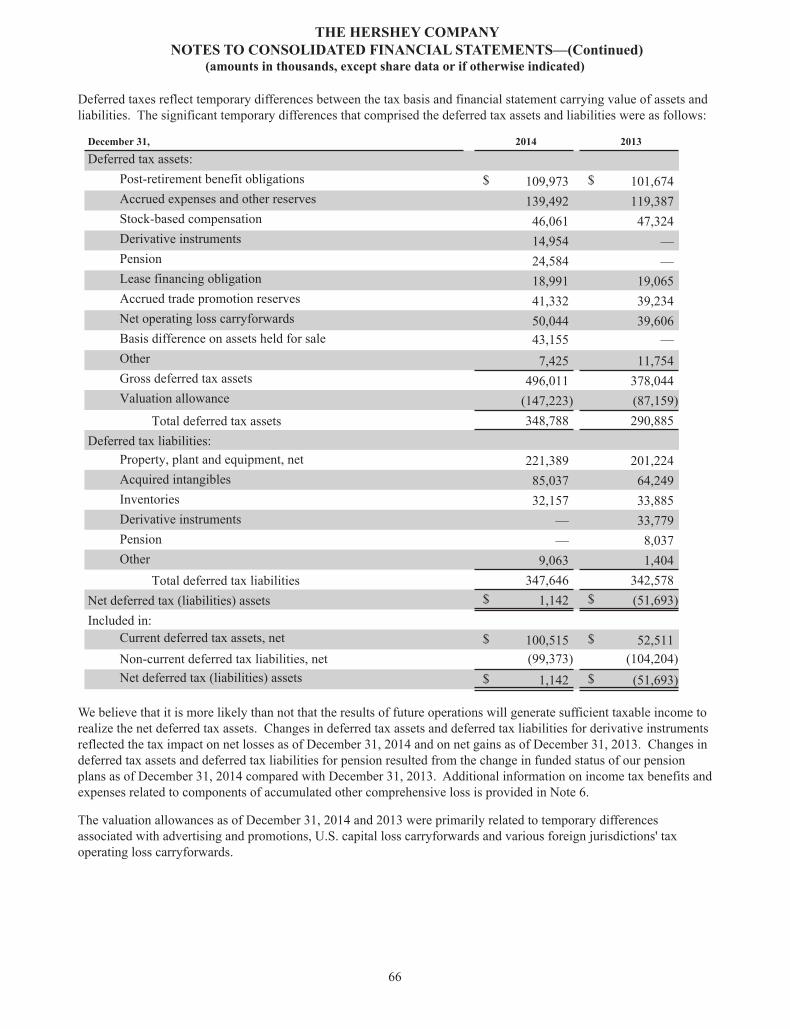
THE HERSHEY COMPANYNOTES TO CONSOLIDATED FINANCIAL STATEMENTS—(Continued)
(amounts in thousands, except share data or if otherwise indicated)
Deferred taxes reflect temporary differences between the tax basis and financial statement carrying value of assets and liabilities. The significant temporary differences that comprised the deferred tax assets and liabilities were as follows:
December 31, 2014 2013
Deferred tax assets:Post-retirement benefit obligations $ 109,973 $ 101,674Accrued expenses and other reserves 139,492 119,387Stock-based compensation 46,061 47,324Derivative instruments 14,954 —Pension 24,584 —Lease financing obligation 18,991 19,065Accrued trade promotion reserves 41,332 39,234Net operating loss carryforwards 50,044 39,606Basis difference on assets held for sale 43,155 —Other 7,425 11,754Gross deferred tax assets 496,011 378,044Valuation allowance (147,223) (87,159)
Total deferred tax assets 348,788 290,885Deferred tax liabilities:
Property, plant and equipment, net 221,389 201,224Acquired intangibles 85,037 64,249Inventories 32,157 33,885Derivative instruments — 33,779Pension — 8,037Other 9,063 1,404
Total deferred tax liabilities 347,646 342,578Net deferred tax (liabilities) assets $ 1,142 $ (51,693)Included in:
Current deferred tax assets, net $ 100,515 $ 52,511Non-current deferred tax liabilities, net (99,373) (104,204)Net deferred tax (liabilities) assets $ 1,142 $ (51,693)
We believe that it is more likely than not that the results of future operations will generate sufficient taxable income to realize the net deferred tax assets. Changes in deferred tax assets and deferred tax liabilities for derivative instruments reflected the tax impact on net losses as of December 31, 2014 and on net gains as of December 31, 2013. Changes in deferred tax assets and deferred tax liabilities for pension resulted from the change in funded status of our pension plans as of December 31, 2014 compared with December 31, 2013. Additional information on income tax benefits and expenses related to components of accumulated other comprehensive loss is provided in Note 6.
The valuation allowances as of December 31, 2014 and 2013 were primarily related to temporary differences associated with advertising and promotions, U.S. capital loss carryforwards and various foreign jurisdictions' tax operating loss carryforwards.
66
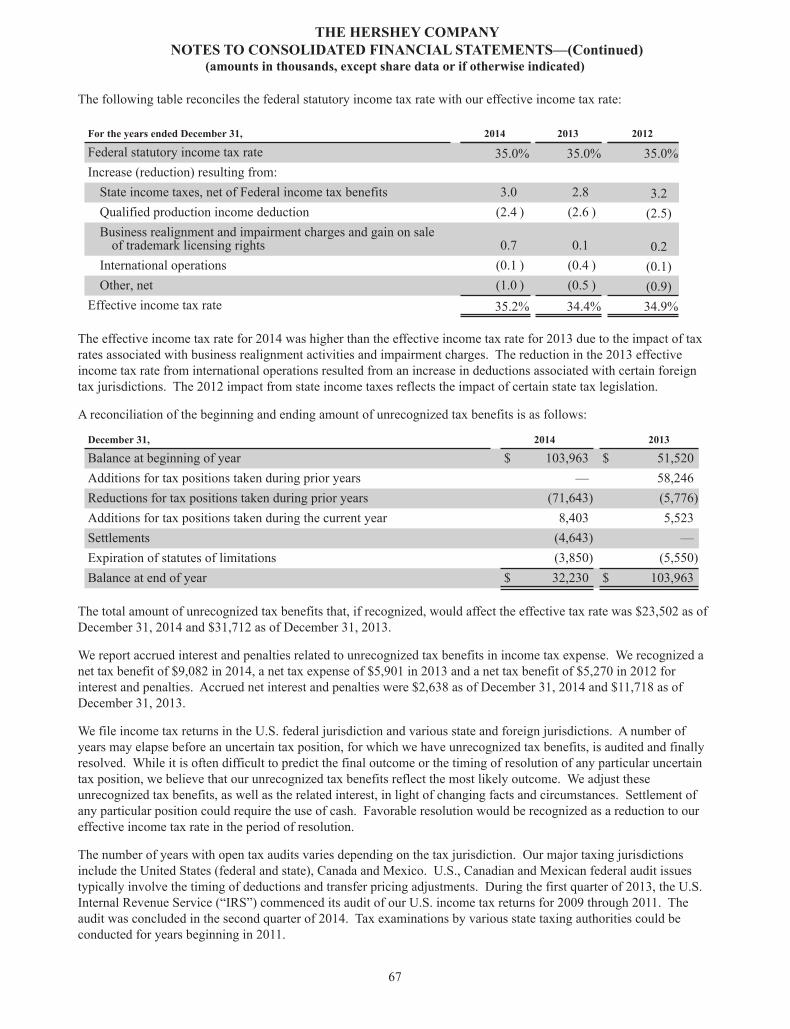
THE HERSHEY COMPANYNOTES TO CONSOLIDATED FINANCIAL STATEMENTS—(Continued)
(amounts in thousands, except share data or if otherwise indicated)
The following table reconciles the federal statutory income tax rate with our effective income tax rate:
For the years ended December 31, 2014 2013 2012
Federal statutory income tax rate 35.0% 35.0% 35.0%Increase (reduction) resulting from:
State income taxes, net of Federal income tax benefits 3.0 2.8 3.2Qualified production income deduction (2.4 ) (2.6 ) (2.5)Business realignment and impairment charges and gain on sale
of trademark licensing rights 0.7 0.1 0.2International operations (0.1 ) (0.4 ) (0.1)Other, net (1.0 ) (0.5 ) (0.9)
Effective income tax rate 35.2% 34.4% 34.9%
The effective income tax rate for 2014 was higher than the effective income tax rate for 2013 due to the impact of tax rates associated with business realignment activities and impairment charges. The reduction in the 2013 effective income tax rate from international operations resulted from an increase in deductions associated with certain foreign tax jurisdictions. The 2012 impact from state income taxes reflects the impact of certain state tax legislation.
A reconciliation of the beginning and ending amount of unrecognized tax benefits is as follows:
December 31, 2014 2013
Balance at beginning of year $ 103,963 $ 51,520Additions for tax positions taken during prior years — 58,246Reductions for tax positions taken during prior years (71,643) (5,776)Additions for tax positions taken during the current year 8,403 5,523Settlements (4,643) —Expiration of statutes of limitations (3,850) (5,550)Balance at end of year $ 32,230 $ 103,963
The total amount of unrecognized tax benefits that, if recognized, would affect the effective tax rate was $23,502 as of December 31, 2014 and $31,712 as of December 31, 2013.
We report accrued interest and penalties related to unrecognized tax benefits in income tax expense. We recognized a net tax benefit of $9,082 in 2014, a net tax expense of $5,901 in 2013 and a net tax benefit of $5,270 in 2012 for interest and penalties. Accrued net interest and penalties were $2,638 as of December 31, 2014 and $11,718 as of December 31, 2013.
We file income tax returns in the U.S. federal jurisdiction and various state and foreign jurisdictions. A number of years may elapse before an uncertain tax position, for which we have unrecognized tax benefits, is audited and finally resolved. While it is often difficult to predict the final outcome or the timing of resolution of any particular uncertain tax position, we believe that our unrecognized tax benefits reflect the most likely outcome. We adjust these unrecognized tax benefits, as well as the related interest, in light of changing facts and circumstances. Settlement of any particular position could require the use of cash. Favorable resolution would be recognized as a reduction to our effective income tax rate in the period of resolution.
The number of years with open tax audits varies depending on the tax jurisdiction. Our major taxing jurisdictions include the United States (federal and state), Canada and Mexico. U.S., Canadian and Mexican federal audit issues typically involve the timing of deductions and transfer pricing adjustments. During the first quarter of 2013, the U.S. Internal Revenue Service (“IRS”) commenced its audit of our U.S. income tax returns for 2009 through 2011. The audit was concluded in the second quarter of 2014. Tax examinations by various state taxing authorities could be conducted for years beginning in 2011.
67
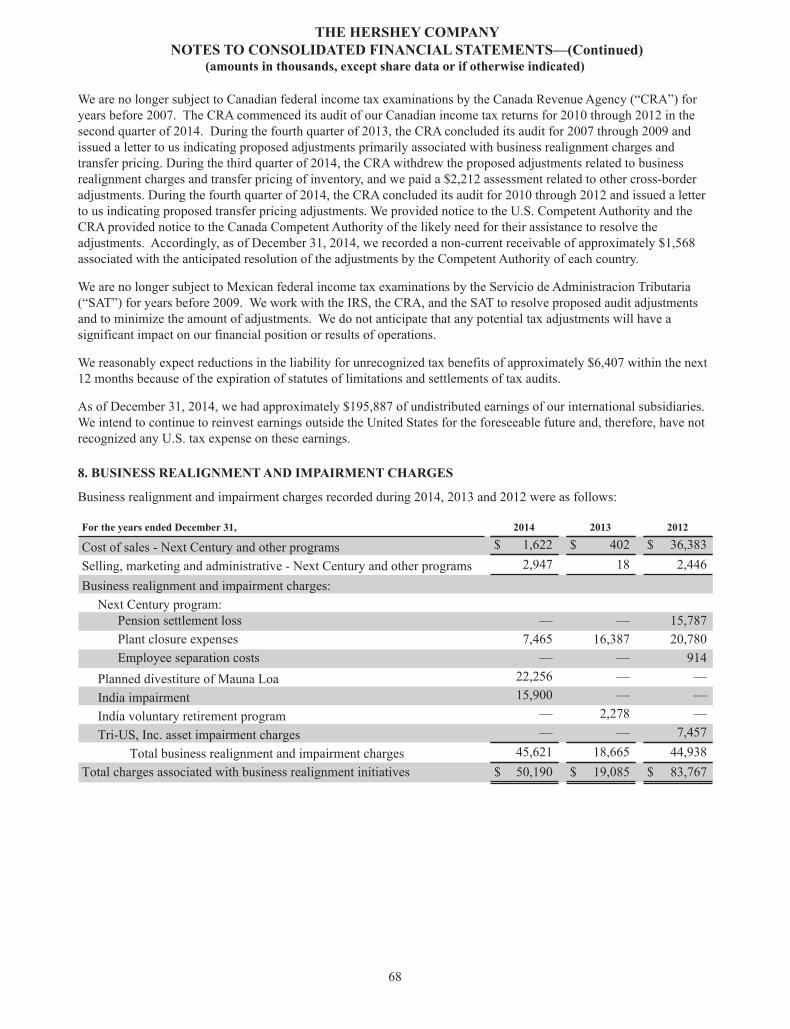
THE HERSHEY COMPANYNOTES TO CONSOLIDATED FINANCIAL STATEMENTS—(Continued)
(amounts in thousands, except share data or if otherwise indicated)
We are no longer subject to Canadian federal income tax examinations by the Canada Revenue Agency (“CRA”) for years before 2007. The CRA commenced its audit of our Canadian income tax returns for 2010 through 2012 in the second quarter of 2014. During the fourth quarter of 2013, the CRA concluded its audit for 2007 through 2009 and issued a letter to us indicating proposed adjustments primarily associated with business realignment charges and transfer pricing. During the third quarter of 2014, the CRA withdrew the proposed adjustments related to business realignment charges and transfer pricing of inventory, and we paid a $2,212 assessment related to other cross-border adjustments. During the fourth quarter of 2014, the CRA concluded its audit for 2010 through 2012 and issued a letter to us indicating proposed transfer pricing adjustments. We provided notice to the U.S. Competent Authority and the CRA provided notice to the Canada Competent Authority of the likely need for their assistance to resolve the adjustments. Accordingly, as of December 31, 2014, we recorded a non-current receivable of approximately $1,568 associated with the anticipated resolution of the adjustments by the Competent Authority of each country.
We are no longer subject to Mexican federal income tax examinations by the Servicio de Administracion Tributaria (“SAT”) for years before 2009. We work with the IRS, the CRA, and the SAT to resolve proposed audit adjustments and to minimize the amount of adjustments. We do not anticipate that any potential tax adjustments will have a significant impact on our financial position or results of operations.
We reasonably expect reductions in the liability for unrecognized tax benefits of approximately $6,407 within the next 12 months because of the expiration of statutes of limitations and settlements of tax audits.
As of December 31, 2014, we had approximately $195,887 of undistributed earnings of our international subsidiaries. We intend to continue to reinvest earnings outside the United States for the foreseeable future and, therefore, have not recognized any U.S. tax expense on these earnings.
8. BUSINESS REALIGNMENT AND IMPAIRMENT CHARGES
Business realignment and impairment charges recorded during 2014, 2013 and 2012 were as follows:
For the years ended December 31, 2014 2013 2012
Cost of sales - Next Century and other programs $ 1,622 $ 402 $ 36,383Selling, marketing and administrative - Next Century and other programs 2,947 18 2,446Business realignment and impairment charges:
Next Century program:Pension settlement loss — — 15,787Plant closure expenses 7,465 16,387 20,780Employee separation costs — — 914
Planned divestiture of Mauna Loa 22,256 — —India impairment 15,900 — —India voluntary retirement program — 2,278 —Tri-US, Inc. asset impairment charges — — 7,457
Total business realignment and impairment charges 45,621 18,665 44,938Total charges associated with business realignment initiatives $ 50,190 $ 19,085 $ 83,767
68
THE HERSHEY COMPANYNOTES TO CONSOLIDATED FINANCIAL STATEMENTS—(Continued)
(amounts in thousands, except share data or if otherwise indicated)
Next Century Program
In June 2010, we announced Project Next Century (the “Next Century program”) as part of our ongoing efforts to create an advantaged supply chain and competitive cost structure. As part of the program, production was transitioned from the Company's century-old facility at 19 East Chocolate Avenue in Hershey, Pennsylvania, to an expanded West Hershey facility, which was built in 1992. The Next Century program is substantially complete as of December 31, 2014. Project-to-date costs totaled $197.9 million through December 31, 2014, in line with our estimates of total pre-tax charges and non-recurring project implementation costs of $190 million to $200 million.
In 2014 and 2013, plant closure and other expenses were primarily related to costs associated with the demolition of the former manufacturing facility.
In 2012, charges relating to the Next Century program included the following: $36,383 recorded in cost of sales related primarily to start-up costs and accelerated depreciation of fixed assets over the reduced estimated remaining useful lives; $2,446 recorded in selling, marketing and administrative expense for project administration; business realignment charges of $15,787 relating to a non-cash pension settlement loss resulting from lump sum withdrawals by employees retiring or leaving the Company, primarily in connection with the Next Century program; and $20,780 primarily related to costs associated with the closure of the former manufacturing facility and the relocation of production lines.
Planned divestiture of Mauna Loa
In December 2014, we entered into an agreement to sell Mauna Loa. In connection with the anticipated sale, we have recorded an estimated loss of $22,256 to reflect the disposal entity at fair value, less an estimate of the selling costs. See Note 2 for additional information.
India impairment
In connection with our annual goodwill and other intangible asset impairment testing, in December 2014, we recorded a non-cash goodwill and other intangible asset impairment charge of $15,900 associated with our business in India. See Note 3 for additional information.
Other international restructuring programs
During 2014, we implemented restructuring programs at several non-U.S. entities to rationalize select manufacturing and distribution activities, resulting in severance and accelerated depreciation costs of $4,476. These costs were recorded within cost of sales and selling, marketing and administrative expenses. We expect to incur approximately $3,700 of additional accelerated depreciation in 2015; other remaining costs relating to these programs are not expected to be significant.
Tri-US, Inc. impairment charges
In December 2012, the board of directors of Tri-US, Inc., a company that manufactured, marketed and sold nutritional beverages in which we held a controlling ownership interest decided to cease operations as a result of operational difficulties, quality issues and competitive constraints. It was determined that investments necessary to continue the business would not generate a sufficient return. Accordingly, in December 2012, the Company recorded non-cash asset impairment charges of $7,457, primarily associated with the write off of goodwill and other intangible assets. These charges excluded the portion of the losses attributable to the noncontrolling interests.
9. PENSION AND OTHER POST-RETIREMENT BENEFIT PLANS
We sponsor a number of defined benefit pension plans. The primary plans are The Hershey Company Retirement Plan and The Hershey Company Retirement Plan for Hourly Employees. These are cash balance plans that provide pension benefits for most domestic employees hired prior to January 1, 2007. We also sponsor two post-retirement benefit plans: health care and life insurance. The health care plan is contributory, with participants’ contributions adjusted annually. The life insurance plan is non-contributory.
69
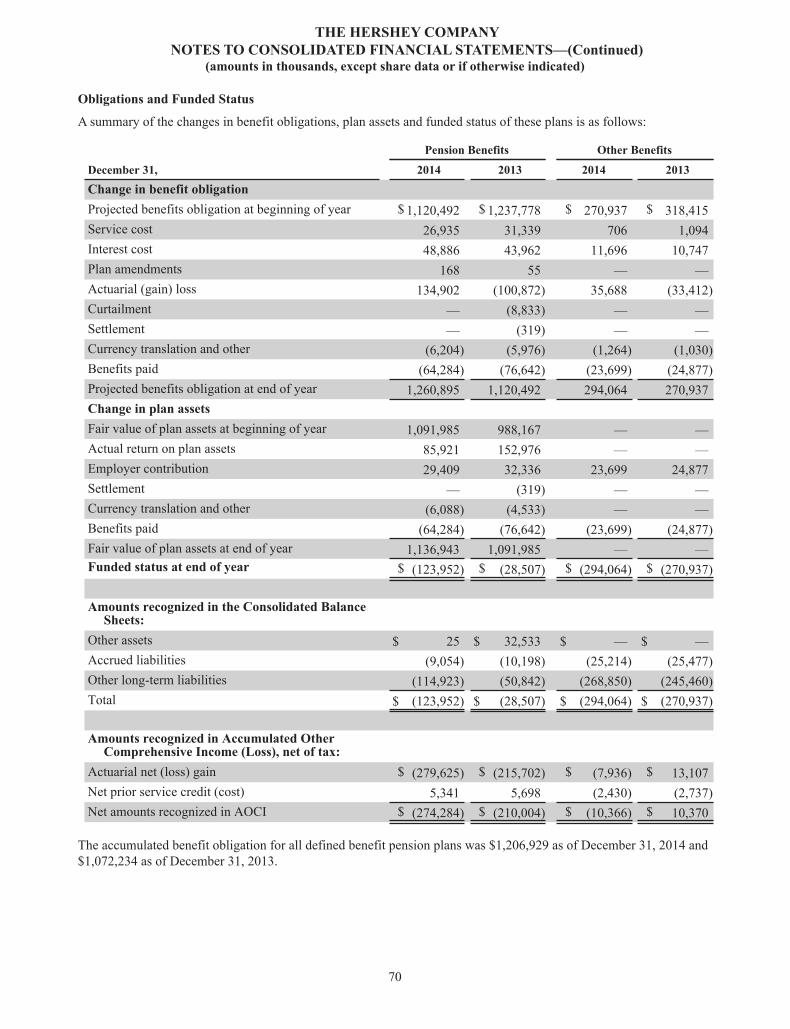
THE HERSHEY COMPANYNOTES TO CONSOLIDATED FINANCIAL STATEMENTS—(Continued)
(amounts in thousands, except share data or if otherwise indicated)
Obligations and Funded Status
A summary of the changes in benefit obligations, plan assets and funded status of these plans is as follows:
Pension Benefits Other Benefits
December 31, 2014 2013 2014 2013Change in benefit obligationProjected benefits obligation at beginning of year $ 1,120,492 $ 1,237,778 $ 270,937 $ 318,415Service cost 26,935 31,339 706 1,094Interest cost 48,886 43,962 11,696 10,747Plan amendments 168 55 — —Actuarial (gain) loss 134,902 (100,872) 35,688 (33,412)Curtailment — (8,833) — —Settlement — (319) — —Currency translation and other (6,204) (5,976) (1,264) (1,030)Benefits paid (64,284) (76,642) (23,699) (24,877)Projected benefits obligation at end of year 1,260,895 1,120,492 294,064 270,937Change in plan assetsFair value of plan assets at beginning of year 1,091,985 988,167 — —Actual return on plan assets 85,921 152,976 — —Employer contribution 29,409 32,336 23,699 24,877Settlement — (319) — —Currency translation and other (6,088) (4,533) — —Benefits paid (64,284) (76,642) (23,699) (24,877)Fair value of plan assets at end of year 1,136,943 1,091,985 — —Funded status at end of year $ (123,952) $ (28,507) $ (294,064) $ (270,937)
Amounts recognized in the Consolidated BalanceSheets:
Other assets $ 25 $ 32,533 $ — $ —Accrued liabilities (9,054) (10,198) (25,214) (25,477)Other long-term liabilities (114,923) (50,842) (268,850) (245,460)Total $ (123,952) $ (28,507) $ (294,064) $ (270,937)
Amounts recognized in Accumulated OtherComprehensive Income (Loss), net of tax:
Actuarial net (loss) gain $ (279,625) $ (215,702) $ (7,936) $ 13,107Net prior service credit (cost) 5,341 5,698 (2,430) (2,737)Net amounts recognized in AOCI $ (274,284) $ (210,004) $ (10,366) $ 10,370
The accumulated benefit obligation for all defined benefit pension plans was $1,206,929 as of December 31, 2014 and $1,072,234 as of December 31, 2013.
70
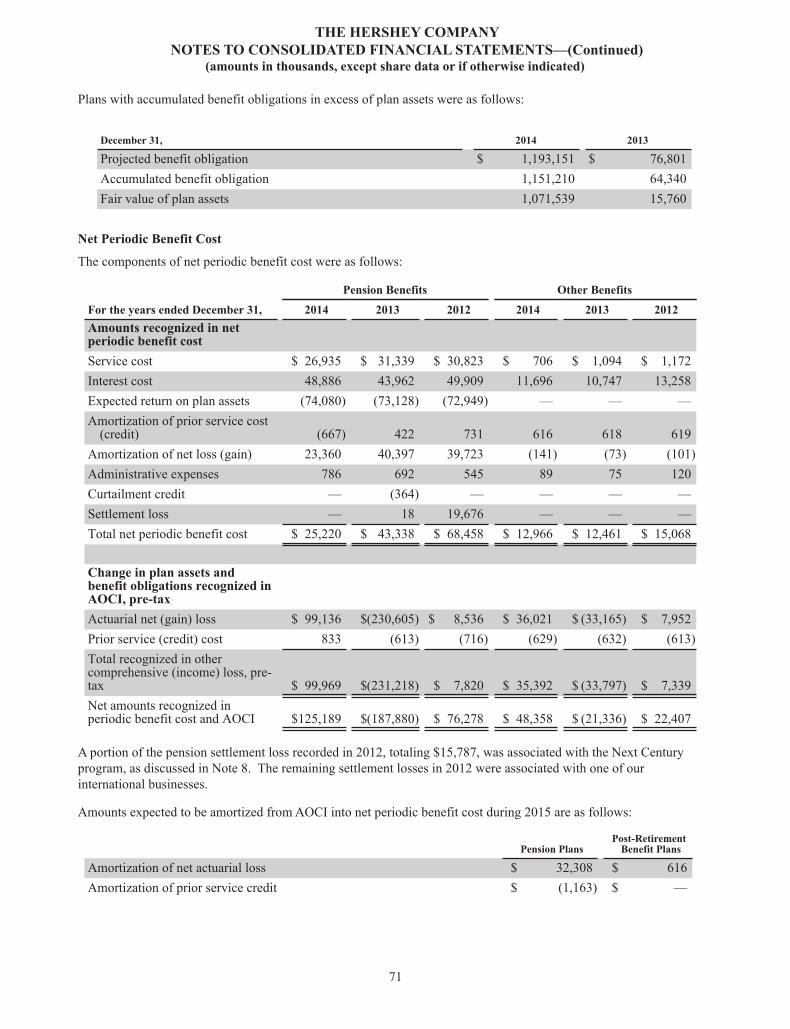
THE HERSHEY COMPANYNOTES TO CONSOLIDATED FINANCIAL STATEMENTS—(Continued)
(amounts in thousands, except share data or if otherwise indicated)
Plans with accumulated benefit obligations in excess of plan assets were as follows:
December 31, 2014 2013
Projected benefit obligation $ 1,193,151 $ 76,801Accumulated benefit obligation 1,151,210 64,340Fair value of plan assets 1,071,539 15,760
Net Periodic Benefit Cost
The components of net periodic benefit cost were as follows:
Pension Benefits Other Benefits
For the years ended December 31, 2014 2013 2012 2014 2013 2012Amounts recognized in netperiodic benefit costService cost $ 26,935 $ 31,339 $ 30,823 $ 706 $ 1,094 $ 1,172Interest cost 48,886 43,962 49,909 11,696 10,747 13,258Expected return on plan assets (74,080) (73,128) (72,949) — — —Amortization of prior service cost
(credit) (667) 422 731 616 618 619Amortization of net loss (gain) 23,360 40,397 39,723 (141) (73) (101)Administrative expenses 786 692 545 89 75 120Curtailment credit — (364) — — — —Settlement loss — 18 19,676 — — —Total net periodic benefit cost $ 25,220 $ 43,338 $ 68,458 $ 12,966 $ 12,461 $ 15,068
Change in plan assets andbenefit obligations recognized inAOCI, pre-taxActuarial net (gain) loss $ 99,136 $(230,605) $ 8,536 $ 36,021 $ (33,165) $ 7,952Prior service (credit) cost 833 (613) (716) (629) (632) (613)Total recognized in othercomprehensive (income) loss, pre-tax $ 99,969 $(231,218) $ 7,820 $ 35,392 $ (33,797) $ 7,339Net amounts recognized inperiodic benefit cost and AOCI $125,189 $(187,880) $ 76,278 $ 48,358 $ (21,336) $ 22,407
A portion of the pension settlement loss recorded in 2012, totaling $15,787, was associated with the Next Century program, as discussed in Note 8. The remaining settlement losses in 2012 were associated with one of our international businesses.
Amounts expected to be amortized from AOCI into net periodic benefit cost during 2015 are as follows:
Pension Plans Post-Retirement
Benefit Plans
Amortization of net actuarial loss $ 32,308 $ 616Amortization of prior service credit $ (1,163) $ —
71
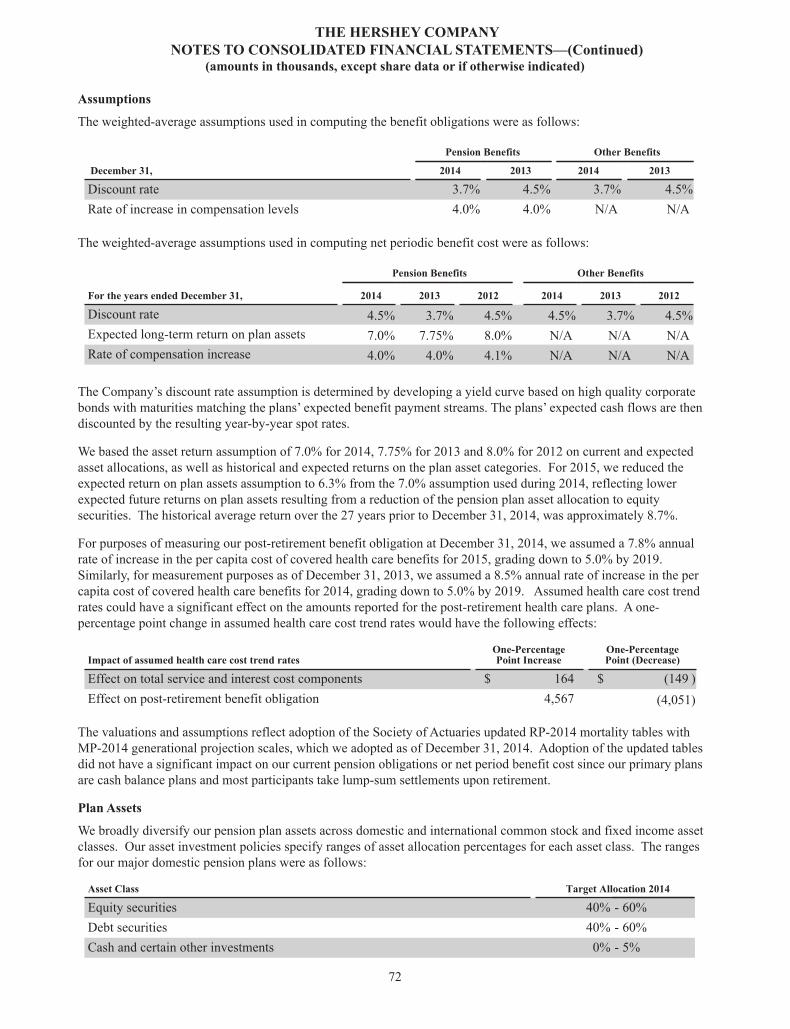
THE HERSHEY COMPANYNOTES TO CONSOLIDATED FINANCIAL STATEMENTS—(Continued)
(amounts in thousands, except share data or if otherwise indicated)
Assumptions
The weighted-average assumptions used in computing the benefit obligations were as follows:
Pension Benefits Other Benefits
December 31, 2014 2013 2014 2013
Discount rate 3.7% 4.5% 3.7% 4.5%Rate of increase in compensation levels 4.0% 4.0% N/A N/A
The weighted-average assumptions used in computing net periodic benefit cost were as follows:
Pension Benefits Other Benefits
For the years ended December 31, 2014 2013 2012 2014 2013 2012
Discount rate 4.5% 3.7% 4.5% 4.5% 3.7% 4.5%Expected long-term return on plan assets 7.0% 7.75% 8.0% N/A N/A N/ARate of compensation increase 4.0% 4.0% 4.1% N/A N/A N/A
The Company’s discount rate assumption is determined by developing a yield curve based on high quality corporate bonds with maturities matching the plans’ expected benefit payment streams. The plans’ expected cash flows are then discounted by the resulting year-by-year spot rates.
We based the asset return assumption of 7.0% for 2014, 7.75% for 2013 and 8.0% for 2012 on current and expected asset allocations, as well as historical and expected returns on the plan asset categories. For 2015, we reduced the expected return on plan assets assumption to 6.3% from the 7.0% assumption used during 2014, reflecting lower expected future returns on plan assets resulting from a reduction of the pension plan asset allocation to equity securities. The historical average return over the 27 years prior to December 31, 2014, was approximately 8.7%.
For purposes of measuring our post-retirement benefit obligation at December 31, 2014, we assumed a 7.8% annual rate of increase in the per capita cost of covered health care benefits for 2015, grading down to 5.0% by 2019. Similarly, for measurement purposes as of December 31, 2013, we assumed a 8.5% annual rate of increase in the per capita cost of covered health care benefits for 2014, grading down to 5.0% by 2019. Assumed health care cost trend rates could have a significant effect on the amounts reported for the post-retirement health care plans. A one-percentage point change in assumed health care cost trend rates would have the following effects:
Impact of assumed health care cost trend ratesOne-PercentagePoint Increase
One-PercentagePoint (Decrease)
Effect on total service and interest cost components $ 164 $ (149 )Effect on post-retirement benefit obligation 4,567 (4,051)
The valuations and assumptions reflect adoption of the Society of Actuaries updated RP-2014 mortality tables with MP-2014 generational projection scales, which we adopted as of December 31, 2014. Adoption of the updated tables did not have a significant impact on our current pension obligations or net period benefit cost since our primary plans are cash balance plans and most participants take lump-sum settlements upon retirement.
Plan Assets
We broadly diversify our pension plan assets across domestic and international common stock and fixed income asset classes. Our asset investment policies specify ranges of asset allocation percentages for each asset class. The ranges for our major domestic pension plans were as follows:
Asset Class Target Allocation 2014
Equity securities 40% - 60%Debt securities 40% - 60%Cash and certain other investments 0% - 5%
72
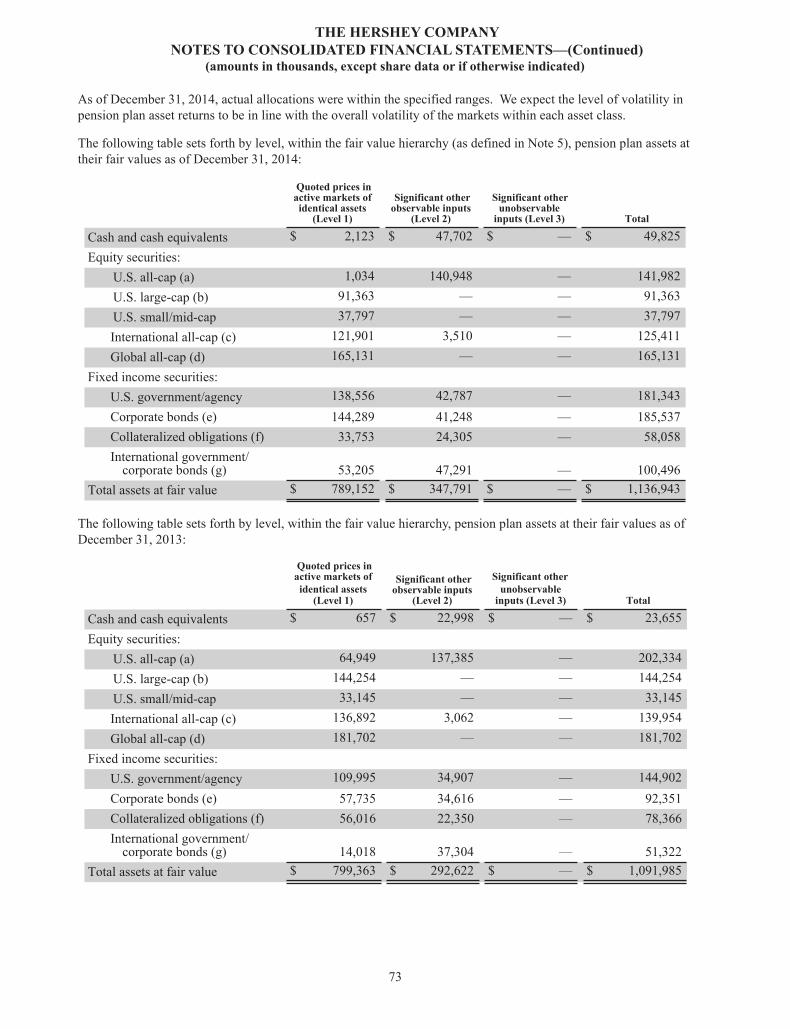
THE HERSHEY COMPANYNOTES TO CONSOLIDATED FINANCIAL STATEMENTS—(Continued)
(amounts in thousands, except share data or if otherwise indicated)
As of December 31, 2014, actual allocations were within the specified ranges. We expect the level of volatility in pension plan asset returns to be in line with the overall volatility of the markets within each asset class.
The following table sets forth by level, within the fair value hierarchy (as defined in Note 5), pension plan assets at their fair values as of December 31, 2014:
Quoted prices inactive markets ofidentical assets
(Level 1)
Significant otherobservable inputs
(Level 2)
Significant otherunobservable
inputs (Level 3) Total
Cash and cash equivalents $ 2,123 $ 47,702 $ — $ 49,825Equity securities:
U.S. all-cap (a) 1,034 140,948 — 141,982U.S. large-cap (b) 91,363 — — 91,363U.S. small/mid-cap 37,797 — — 37,797International all-cap (c) 121,901 3,510 — 125,411Global all-cap (d) 165,131 — — 165,131
Fixed income securities:U.S. government/agency 138,556 42,787 — 181,343Corporate bonds (e) 144,289 41,248 — 185,537Collateralized obligations (f) 33,753 24,305 — 58,058International government/
corporate bonds (g) 53,205 47,291 — 100,496Total assets at fair value $ 789,152 $ 347,791 $ — $ 1,136,943
The following table sets forth by level, within the fair value hierarchy, pension plan assets at their fair values as of December 31, 2013:
Quoted prices in active markets of identical assets
(Level 1)
Significant otherobservable inputs
(Level 2)
Significant other unobservable
inputs (Level 3) Total
Cash and cash equivalents $ 657 $ 22,998 $ — $ 23,655Equity securities:
U.S. all-cap (a) 64,949 137,385 — 202,334U.S. large-cap (b) 144,254 — — 144,254U.S. small/mid-cap 33,145 — — 33,145International all-cap (c) 136,892 3,062 — 139,954Global all-cap (d) 181,702 — — 181,702
Fixed income securities:U.S. government/agency 109,995 34,907 — 144,902Corporate bonds (e) 57,735 34,616 — 92,351Collateralized obligations (f) 56,016 22,350 — 78,366International government/
corporate bonds (g) 14,018 37,304 — 51,322Total assets at fair value $ 799,363 $ 292,622 $ — $ 1,091,985
73
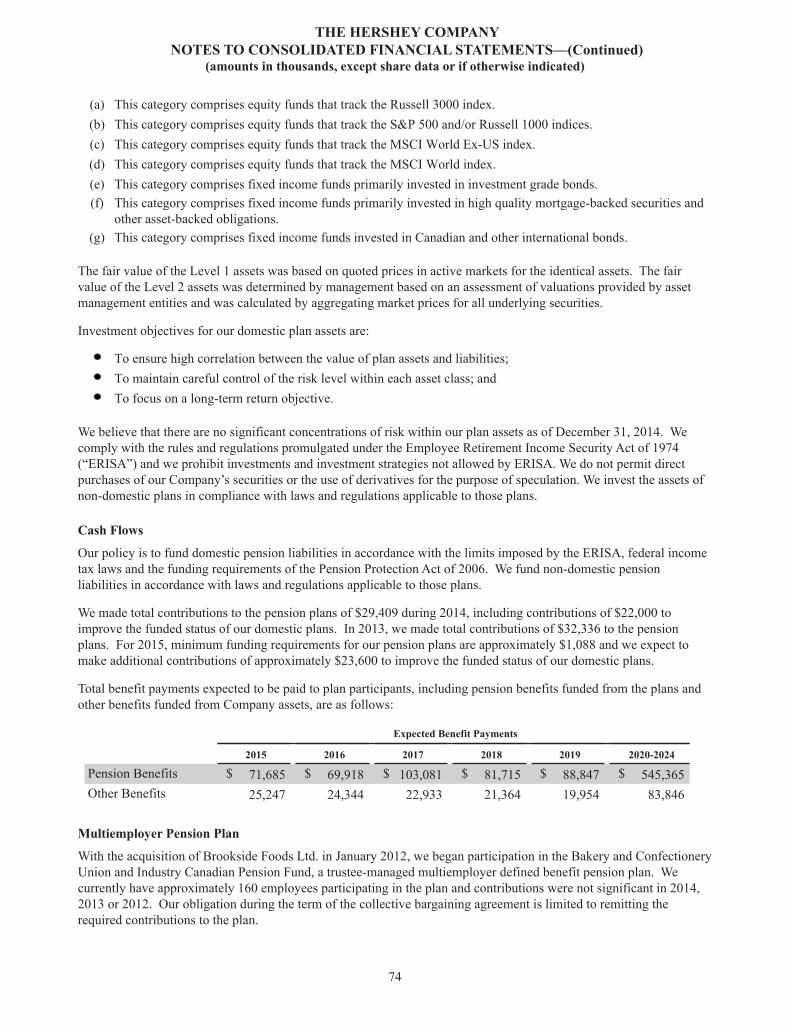
THE HERSHEY COMPANYNOTES TO CONSOLIDATED FINANCIAL STATEMENTS—(Continued)
(amounts in thousands, except share data or if otherwise indicated)
(a) This category comprises equity funds that track the Russell 3000 index.(b) This category comprises equity funds that track the S&P 500 and/or Russell 1000 indices.(c) This category comprises equity funds that track the MSCI World Ex-US index.(d) This category comprises equity funds that track the MSCI World index.(e) This category comprises fixed income funds primarily invested in investment grade bonds.(f) This category comprises fixed income funds primarily invested in high quality mortgage-backed securities and
other asset-backed obligations.(g) This category comprises fixed income funds invested in Canadian and other international bonds.
The fair value of the Level 1 assets was based on quoted prices in active markets for the identical assets. The fair value of the Level 2 assets was determined by management based on an assessment of valuations provided by asset management entities and was calculated by aggregating market prices for all underlying securities.
Investment objectives for our domestic plan assets are:
To ensure high correlation between the value of plan assets and liabilities;To maintain careful control of the risk level within each asset class; andTo focus on a long-term return objective.
We believe that there are no significant concentrations of risk within our plan assets as of December 31, 2014. We comply with the rules and regulations promulgated under the Employee Retirement Income Security Act of 1974 (“ERISA”) and we prohibit investments and investment strategies not allowed by ERISA. We do not permit direct purchases of our Company’s securities or the use of derivatives for the purpose of speculation. We invest the assets of non-domestic plans in compliance with laws and regulations applicable to those plans.
Cash Flows
Our policy is to fund domestic pension liabilities in accordance with the limits imposed by the ERISA, federal income tax laws and the funding requirements of the Pension Protection Act of 2006. We fund non-domestic pension liabilities in accordance with laws and regulations applicable to those plans.
We made total contributions to the pension plans of $29,409 during 2014, including contributions of $22,000 to improve the funded status of our domestic plans. In 2013, we made total contributions of $32,336 to the pension plans. For 2015, minimum funding requirements for our pension plans are approximately $1,088 and we expect to make additional contributions of approximately $23,600 to improve the funded status of our domestic plans.
Total benefit payments expected to be paid to plan participants, including pension benefits funded from the plans and other benefits funded from Company assets, are as follows:
Expected Benefit Payments 2015 2016 2017 2018 2019 2020-2024
Pension Benefits $ 71,685 $ 69,918 $ 103,081 $ 81,715 $ 88,847 $ 545,365Other Benefits 25,247 24,344 22,933 21,364 19,954 83,846
Multiemployer Pension Plan
With the acquisition of Brookside Foods Ltd. in January 2012, we began participation in the Bakery and Confectionery Union and Industry Canadian Pension Fund, a trustee-managed multiemployer defined benefit pension plan. We currently have approximately 160 employees participating in the plan and contributions were not significant in 2014, 2013 or 2012. Our obligation during the term of the collective bargaining agreement is limited to remitting the required contributions to the plan.
74
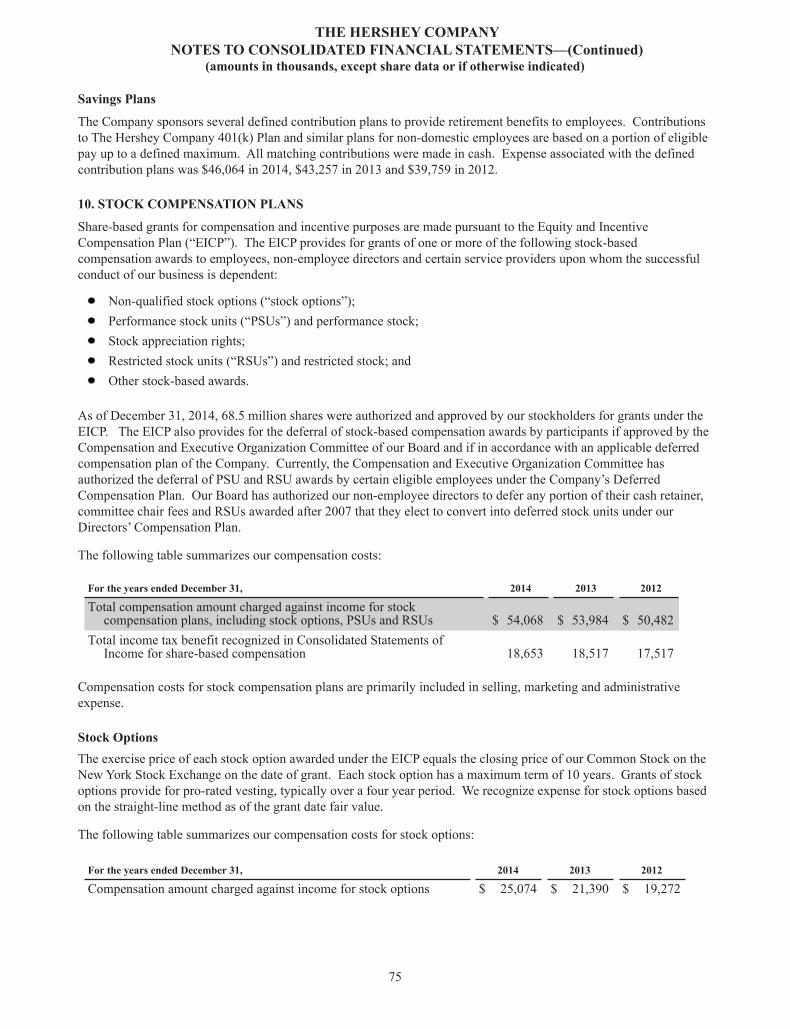
THE HERSHEY COMPANYNOTES TO CONSOLIDATED FINANCIAL STATEMENTS—(Continued)
(amounts in thousands, except share data or if otherwise indicated)
Savings Plans
The Company sponsors several defined contribution plans to provide retirement benefits to employees. Contributions to The Hershey Company 401(k) Plan and similar plans for non-domestic employees are based on a portion of eligible pay up to a defined maximum. All matching contributions were made in cash. Expense associated with the defined contribution plans was $46,064 in 2014, $43,257 in 2013 and $39,759 in 2012.
10. STOCK COMPENSATION PLANS
Share-based grants for compensation and incentive purposes are made pursuant to the Equity and Incentive Compensation Plan (“EICP”). The EICP provides for grants of one or more of the following stock-based compensation awards to employees, non-employee directors and certain service providers upon whom the successful conduct of our business is dependent:
Non-qualified stock options (“stock options”);Performance stock units (“PSUs”) and performance stock;Stock appreciation rights;Restricted stock units (“RSUs”) and restricted stock; andOther stock-based awards.
As of December 31, 2014, 68.5 million shares were authorized and approved by our stockholders for grants under the EICP. The EICP also provides for the deferral of stock-based compensation awards by participants if approved by the Compensation and Executive Organization Committee of our Board and if in accordance with an applicable deferred compensation plan of the Company. Currently, the Compensation and Executive Organization Committee has authorized the deferral of PSU and RSU awards by certain eligible employees under the Company’s Deferred Compensation Plan. Our Board has authorized our non-employee directors to defer any portion of their cash retainer, committee chair fees and RSUs awarded after 2007 that they elect to convert into deferred stock units under our Directors’ Compensation Plan.
The following table summarizes our compensation costs:
For the years ended December 31, 2014 2013 2012
Total compensation amount charged against income for stockcompensation plans, including stock options, PSUs and RSUs $ 54,068 $ 53,984 $ 50,482
Total income tax benefit recognized in Consolidated Statements ofIncome for share-based compensation 18,653 18,517 17,517
Compensation costs for stock compensation plans are primarily included in selling, marketing and administrative expense.
Stock Options The exercise price of each stock option awarded under the EICP equals the closing price of our Common Stock on the New York Stock Exchange on the date of grant. Each stock option has a maximum term of 10 years. Grants of stock options provide for pro-rated vesting, typically over a four year period. We recognize expense for stock options based on the straight-line method as of the grant date fair value.
The following table summarizes our compensation costs for stock options:
For the years ended December 31, 2014 2013 2012
Compensation amount charged against income for stock options $ 25,074 $ 21,390 $ 19,272
75
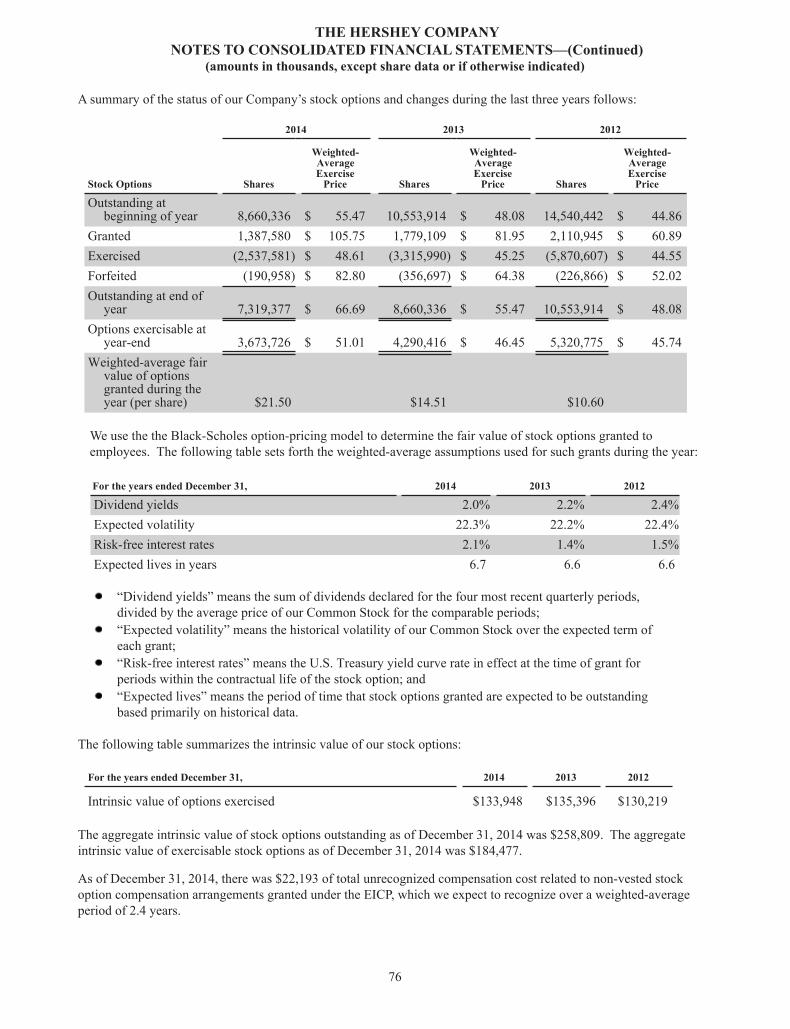
THE HERSHEY COMPANYNOTES TO CONSOLIDATED FINANCIAL STATEMENTS—(Continued)
(amounts in thousands, except share data or if otherwise indicated)
A summary of the status of our Company’s stock options and changes during the last three years follows:
2014 2013 2012
Stock Options Shares
Weighted-AverageExercise
Price Shares
Weighted-AverageExercise
Price Shares
Weighted-AverageExercise
Price
Outstanding atbeginning of year 8,660,336 $ 55.47 10,553,914 $ 48.08 14,540,442 $ 44.86
Granted 1,387,580 $ 105.75 1,779,109 $ 81.95 2,110,945 $ 60.89Exercised (2,537,581) $ 48.61 (3,315,990) $ 45.25 (5,870,607) $ 44.55Forfeited (190,958) $ 82.80 (356,697) $ 64.38 (226,866) $ 52.02Outstanding at end of
year 7,319,377 $ 66.69 8,660,336 $ 55.47 10,553,914 $ 48.08Options exercisable at
year-end 3,673,726 $ 51.01 4,290,416 $ 46.45 5,320,775 $ 45.74Weighted-average fair
value of optionsgranted during theyear (per share) $21.50 $14.51 $10.60
We use the the Black-Scholes option-pricing model to determine the fair value of stock options granted to employees. The following table sets forth the weighted-average assumptions used for such grants during the year:
For the years ended December 31, 2014 2013 2012
Dividend yields 2.0% 2.2% 2.4%Expected volatility 22.3% 22.2% 22.4%Risk-free interest rates 2.1% 1.4% 1.5%Expected lives in years 6.7 6.6 6.6
“Dividend yields” means the sum of dividends declared for the four most recent quarterly periods,divided by the average price of our Common Stock for the comparable periods;“Expected volatility” means the historical volatility of our Common Stock over the expected term ofeach grant;“Risk-free interest rates” means the U.S. Treasury yield curve rate in effect at the time of grant forperiods within the contractual life of the stock option; and“Expected lives” means the period of time that stock options granted are expected to be outstandingbased primarily on historical data.
The following table summarizes the intrinsic value of our stock options:
For the years ended December 31, 2014 2013 2012
Intrinsic value of options exercised $133,948 $135,396 $130,219
The aggregate intrinsic value of stock options outstanding as of December 31, 2014 was $258,809. The aggregate intrinsic value of exercisable stock options as of December 31, 2014 was $184,477.
As of December 31, 2014, there was $22,193 of total unrecognized compensation cost related to non-vested stock option compensation arrangements granted under the EICP, which we expect to recognize over a weighted-average period of 2.4 years.
76
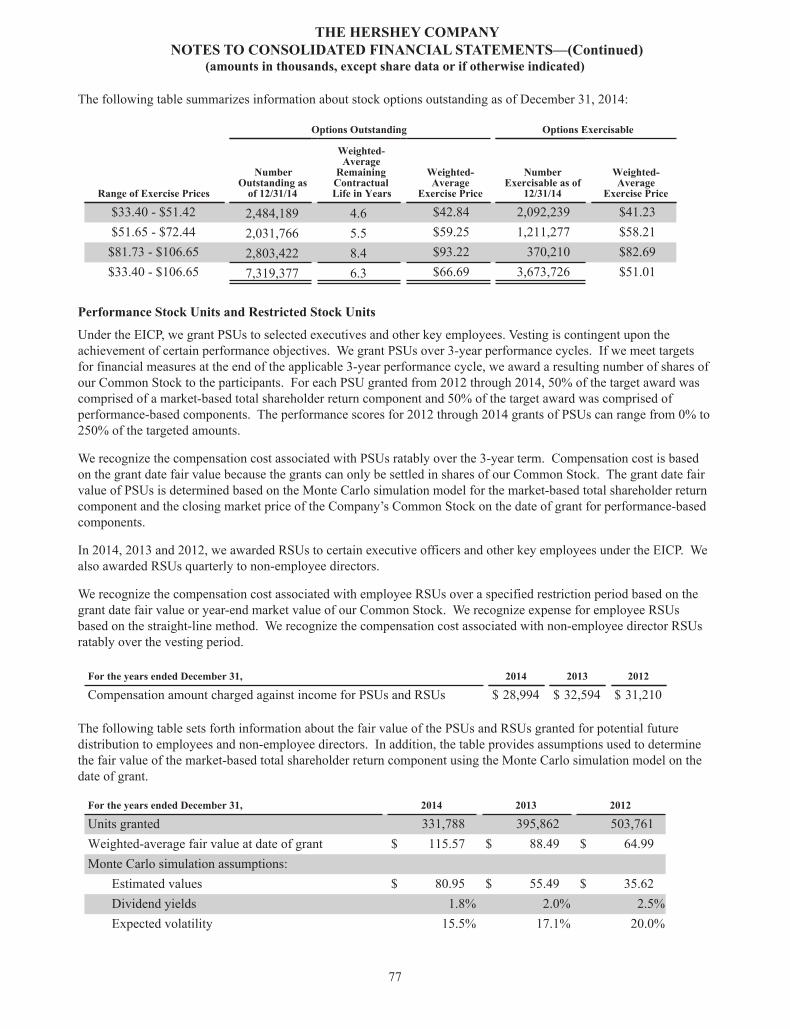
THE HERSHEY COMPANYNOTES TO CONSOLIDATED FINANCIAL STATEMENTS—(Continued)
(amounts in thousands, except share data or if otherwise indicated)
The following table summarizes information about stock options outstanding as of December 31, 2014:
Options Outstanding Options Exercisable
Range of Exercise Prices
NumberOutstanding as
of 12/31/14
Weighted-Average
RemainingContractualLife in Years
Weighted-Average
Exercise Price
NumberExercisable as of
12/31/14
Weighted-Average
Exercise Price
$33.40 - $51.42 2,484,189 4.6 $42.84 2,092,239 $41.23$51.65 - $72.44 2,031,766 5.5 $59.25 1,211,277 $58.21$81.73 - $106.65 2,803,422 8.4 $93.22 370,210 $82.69$33.40 - $106.65 7,319,377 6.3 $66.69 3,673,726 $51.01
Performance Stock Units and Restricted Stock Units
Under the EICP, we grant PSUs to selected executives and other key employees. Vesting is contingent upon the achievement of certain performance objectives. We grant PSUs over 3-year performance cycles. If we meet targets for financial measures at the end of the applicable 3-year performance cycle, we award a resulting number of shares of our Common Stock to the participants. For each PSU granted from 2012 through 2014, 50% of the target award was comprised of a market-based total shareholder return component and 50% of the target award was comprised of performance-based components. The performance scores for 2012 through 2014 grants of PSUs can range from 0% to 250% of the targeted amounts.
We recognize the compensation cost associated with PSUs ratably over the 3-year term. Compensation cost is based on the grant date fair value because the grants can only be settled in shares of our Common Stock. The grant date fair value of PSUs is determined based on the Monte Carlo simulation model for the market-based total shareholder return component and the closing market price of the Company’s Common Stock on the date of grant for performance-based components.
In 2014, 2013 and 2012, we awarded RSUs to certain executive officers and other key employees under the EICP. We also awarded RSUs quarterly to non-employee directors.
We recognize the compensation cost associated with employee RSUs over a specified restriction period based on the grant date fair value or year-end market value of our Common Stock. We recognize expense for employee RSUs based on the straight-line method. We recognize the compensation cost associated with non-employee director RSUs ratably over the vesting period.
For the years ended December 31, 2014 2013 2012
Compensation amount charged against income for PSUs and RSUs $ 28,994 $ 32,594 $ 31,210
The following table sets forth information about the fair value of the PSUs and RSUs granted for potential future distribution to employees and non-employee directors. In addition, the table provides assumptions used to determine the fair value of the market-based total shareholder return component using the Monte Carlo simulation model on the date of grant.
For the years ended December 31, 2014 2013 2012
Units granted 331,788 395,862 503,761Weighted-average fair value at date of grant $ 115.57 $ 88.49 $ 64.99Monte Carlo simulation assumptions:
Estimated values $ 80.95 $ 55.49 $ 35.62Dividend yields 1.8% 2.0% 2.5%Expected volatility 15.5% 17.1% 20.0%
77
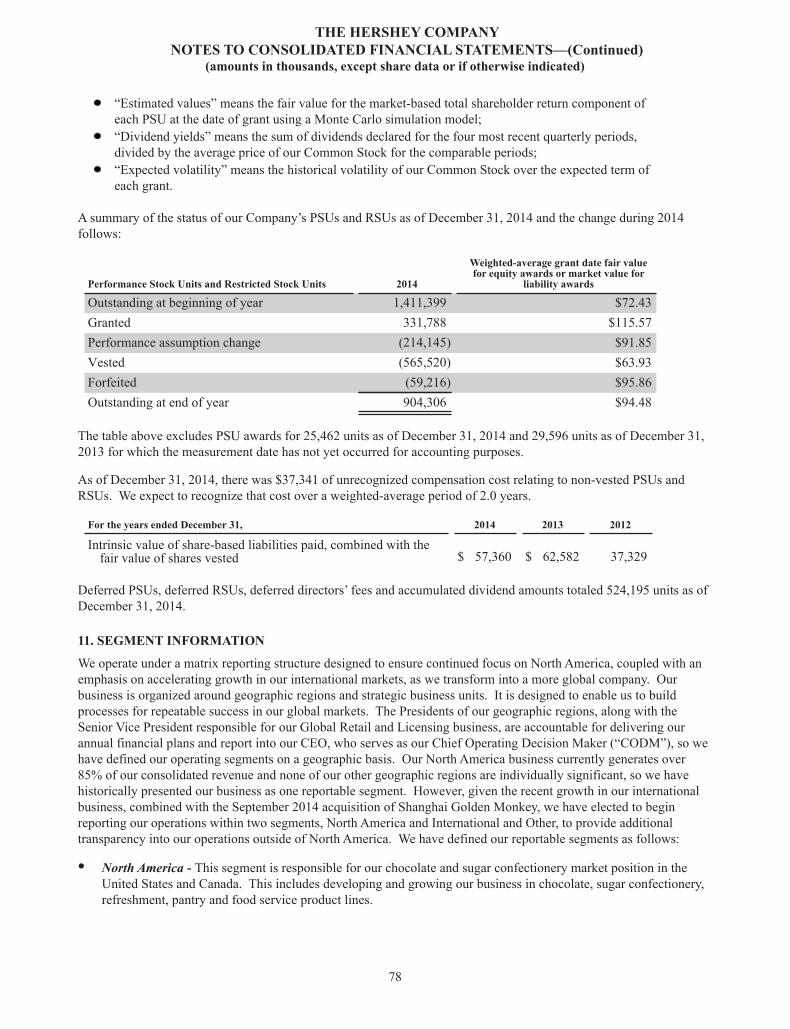
THE HERSHEY COMPANYNOTES TO CONSOLIDATED FINANCIAL STATEMENTS—(Continued)
(amounts in thousands, except share data or if otherwise indicated)
“Estimated values” means the fair value for the market-based total shareholder return component ofeach PSU at the date of grant using a Monte Carlo simulation model;“Dividend yields” means the sum of dividends declared for the four most recent quarterly periods,divided by the average price of our Common Stock for the comparable periods;“Expected volatility” means the historical volatility of our Common Stock over the expected term ofeach grant.
A summary of the status of our Company’s PSUs and RSUs as of December 31, 2014 and the change during 2014 follows:
Performance Stock Units and Restricted Stock Units 2014
Weighted-average grant date fair valuefor equity awards or market value for
liability awards
Outstanding at beginning of year 1,411,399 $72.43Granted 331,788 $115.57Performance assumption change (214,145) $91.85Vested (565,520) $63.93Forfeited (59,216) $95.86Outstanding at end of year 904,306 $94.48
The table above excludes PSU awards for 25,462 units as of December 31, 2014 and 29,596 units as of December 31, 2013 for which the measurement date has not yet occurred for accounting purposes.
As of December 31, 2014, there was $37,341 of unrecognized compensation cost relating to non-vested PSUs and RSUs. We expect to recognize that cost over a weighted-average period of 2.0 years.
For the years ended December 31, 2014 2013 2012
Intrinsic value of share-based liabilities paid, combined with thefair value of shares vested $ 57,360 $ 62,582 37,329
Deferred PSUs, deferred RSUs, deferred directors’ fees and accumulated dividend amounts totaled 524,195 units as of December 31, 2014.
11. SEGMENT INFORMATION
We operate under a matrix reporting structure designed to ensure continued focus on North America, coupled with an emphasis on accelerating growth in our international markets, as we transform into a more global company. Our business is organized around geographic regions and strategic business units. It is designed to enable us to build processes for repeatable success in our global markets. The Presidents of our geographic regions, along with the Senior Vice President responsible for our Global Retail and Licensing business, are accountable for delivering our annual financial plans and report into our CEO, who serves as our Chief Operating Decision Maker (“CODM”), so we have defined our operating segments on a geographic basis. Our North America business currently generates over 85% of our consolidated revenue and none of our other geographic regions are individually significant, so we have historically presented our business as one reportable segment. However, given the recent growth in our international business, combined with the September 2014 acquisition of Shanghai Golden Monkey, we have elected to begin reporting our operations within two segments, North America and International and Other, to provide additional transparency into our operations outside of North America. We have defined our reportable segments as follows:
• North America - This segment is responsible for our chocolate and sugar confectionery market position in the United States and Canada. This includes developing and growing our business in chocolate, sugar confectionery, refreshment, pantry and food service product lines.
78
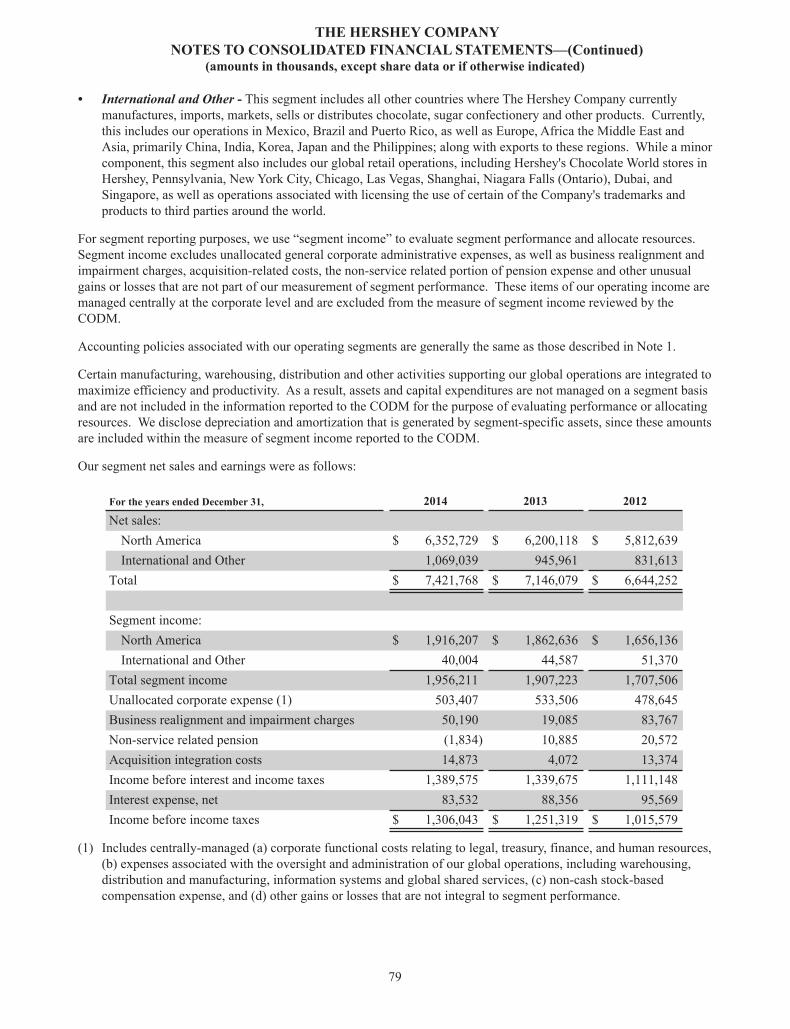
THE HERSHEY COMPANYNOTES TO CONSOLIDATED FINANCIAL STATEMENTS—(Continued)
(amounts in thousands, except share data or if otherwise indicated)
• International and Other - This segment includes all other countries where The Hershey Company currently manufactures, imports, markets, sells or distributes chocolate, sugar confectionery and other products. Currently, this includes our operations in Mexico, Brazil and Puerto Rico, as well as Europe, Africa the Middle East and Asia, primarily China, India, Korea, Japan and the Philippines; along with exports to these regions. While a minor component, this segment also includes our global retail operations, including Hershey's Chocolate World stores in Hershey, Pennsylvania, New York City, Chicago, Las Vegas, Shanghai, Niagara Falls (Ontario), Dubai, and Singapore, as well as operations associated with licensing the use of certain of the Company's trademarks and products to third parties around the world.
For segment reporting purposes, we use “segment income” to evaluate segment performance and allocate resources. Segment income excludes unallocated general corporate administrative expenses, as well as business realignment and impairment charges, acquisition-related costs, the non-service related portion of pension expense and other unusual gains or losses that are not part of our measurement of segment performance. These items of our operating income are managed centrally at the corporate level and are excluded from the measure of segment income reviewed by the CODM.
Accounting policies associated with our operating segments are generally the same as those described in Note 1.
Certain manufacturing, warehousing, distribution and other activities supporting our global operations are integrated to maximize efficiency and productivity. As a result, assets and capital expenditures are not managed on a segment basis and are not included in the information reported to the CODM for the purpose of evaluating performance or allocating resources. We disclose depreciation and amortization that is generated by segment-specific assets, since these amounts are included within the measure of segment income reported to the CODM.
Our segment net sales and earnings were as follows:
For the years ended December 31, 2014 2013 2012Net sales:
North America $ 6,352,729 $ 6,200,118 $ 5,812,639International and Other 1,069,039 945,961 831,613
Total $ 7,421,768 $ 7,146,079 $ 6,644,252
Segment income:North America $ 1,916,207 $ 1,862,636 $ 1,656,136International and Other 40,004 44,587 51,370
Total segment income 1,956,211 1,907,223 1,707,506Unallocated corporate expense (1) 503,407 533,506 478,645Business realignment and impairment charges 50,190 19,085 83,767Non-service related pension (1,834) 10,885 20,572Acquisition integration costs 14,873 4,072 13,374Income before interest and income taxes 1,389,575 1,339,675 1,111,148Interest expense, net 83,532 88,356 95,569Income before income taxes $ 1,306,043 $ 1,251,319 $ 1,015,579
(1) Includes centrally-managed (a) corporate functional costs relating to legal, treasury, finance, and human resources, (b) expenses associated with the oversight and administration of our global operations, including warehousing, distribution and manufacturing, information systems and global shared services, (c) non-cash stock-based compensation expense, and (d) other gains or losses that are not integral to segment performance.
79
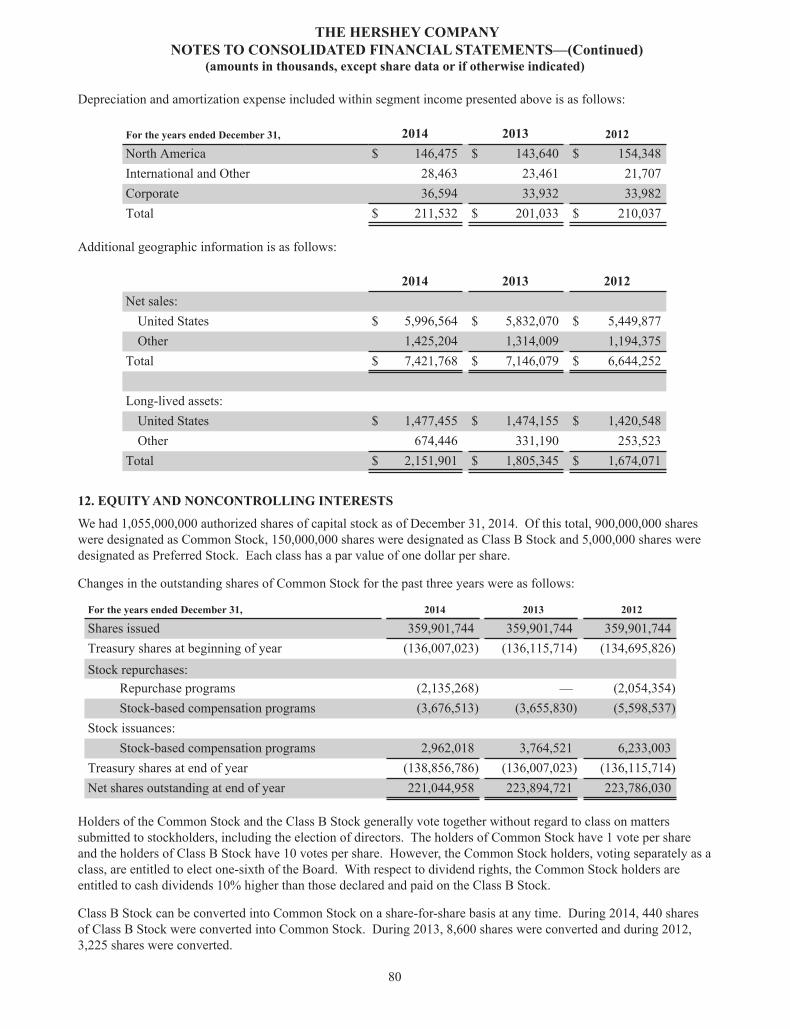
THE HERSHEY COMPANYNOTES TO CONSOLIDATED FINANCIAL STATEMENTS—(Continued)
(amounts in thousands, except share data or if otherwise indicated)
Depreciation and amortization expense included within segment income presented above is as follows:
For the years ended December 31, 2014 2013 2012North America $ 146,475 $ 143,640 $ 154,348International and Other 28,463 23,461 21,707Corporate 36,594 33,932 33,982Total $ 211,532 $ 201,033 $ 210,037
Additional geographic information is as follows:
2014 2013 2012Net sales:
United States $ 5,996,564 $ 5,832,070 $ 5,449,877Other 1,425,204 1,314,009 1,194,375
Total $ 7,421,768 $ 7,146,079 $ 6,644,252
Long-lived assets:United States $ 1,477,455 $ 1,474,155 $ 1,420,548Other 674,446 331,190 253,523
Total $ 2,151,901 $ 1,805,345 $ 1,674,071
12. EQUITY AND NONCONTROLLING INTERESTS
We had 1,055,000,000 authorized shares of capital stock as of December 31, 2014. Of this total, 900,000,000 shares were designated as Common Stock, 150,000,000 shares were designated as Class B Stock and 5,000,000 shares were designated as Preferred Stock. Each class has a par value of one dollar per share.
Changes in the outstanding shares of Common Stock for the past three years were as follows:
For the years ended December 31, 2014 2013 2012
Shares issued 359,901,744 359,901,744 359,901,744Treasury shares at beginning of year (136,007,023) (136,115,714) (134,695,826)Stock repurchases:
Repurchase programs (2,135,268) — (2,054,354)Stock-based compensation programs (3,676,513) (3,655,830) (5,598,537)
Stock issuances:Stock-based compensation programs 2,962,018 3,764,521 6,233,003
Treasury shares at end of year (138,856,786) (136,007,023) (136,115,714)Net shares outstanding at end of year 221,044,958 223,894,721 223,786,030
Holders of the Common Stock and the Class B Stock generally vote together without regard to class on matters submitted to stockholders, including the election of directors. The holders of Common Stock have 1 vote per share and the holders of Class B Stock have 10 votes per share. However, the Common Stock holders, voting separately as a class, are entitled to elect one-sixth of the Board. With respect to dividend rights, the Common Stock holders are entitled to cash dividends 10% higher than those declared and paid on the Class B Stock.
Class B Stock can be converted into Common Stock on a share-for-share basis at any time. During 2014, 440 shares of Class B Stock were converted into Common Stock. During 2013, 8,600 shares were converted and during 2012, 3,225 shares were converted.
80
THE HERSHEY COMPANYNOTES TO CONSOLIDATED FINANCIAL STATEMENTS—(Continued)
(amounts in thousands, except share data or if otherwise indicated)
Hershey Trust Company
Hershey Trust Company, as trustee for the benefit of Milton Hershey School and as direct owner of investment shares, held 12,902,821 shares of our Common Stock as of December 31, 2014. As trustee for the benefit of Milton Hershey School, Hershey Trust Company held 60,612,012 shares of the Class B Stock as of December 31, 2014, and was entitled to cast approximately 80% of all of the votes entitled to be cast on matters requiring the vote of both classes of our common stock voting together. Hershey Trust Company, as trustee for the benefit of Milton Hershey School, or any successor trustee, or Milton Hershey School, as appropriate, must approve any issuance of shares of Common Stock or other action that would result in it not continuing to have voting control of our Company.
Noncontrolling Interests in Subsidiaries
Noncontrolling interests in subsidiaries totaled $64,468 as of December 31, 2014 and $11,218 as of December 31, 2013, with the increase primarily reflecting the 50% noncontrolling interest resulting from our March 2014 acquisition of LSFC, as discussed in Note 2.
We also own a 51% controlling interest in Hershey do Brasil under a cooperative agreement with Pandurata Netherlands B.V. (“Bauducco”), a leading manufacturer of baked goods in Brazil whose primary brand is Bauducco. During 2014 and 2013, the Company contributed cash of $3,060 to Hershey do Brasil and Bauducco contributed $2,940 in each of these time periods.
The share of losses pertaining to the noncontrolling interests in subsidiaries was $227 and $1,682 for the years ended December 31, 2014 and December 31, 2013, respectively. These amounts are reflected in selling, marketing and administrative expenses.
13. COMMITMENTS AND CONTINGENCIES
We enter into certain obligations for the purchase of raw materials. These obligations are primarily in the form of forward contracts for the purchase of raw materials from third-party brokers and dealers. These contracts minimize the effect of future price fluctuations by fixing the price of part or all of these purchase obligations. Total obligations consisted of fixed price contracts for the purchase of commodities and unpriced contracts that were valued using market prices as of December 31, 2014.
The cost of commodities associated with the unpriced contracts is variable as market prices change over future periods. We mitigate the variability of these costs to the extent that we have entered into commodities futures contracts or other commodity derivative instruments to hedge our costs for those periods. Increases or decreases in market prices are offset by gains or losses on commodities futures contracts or other commodity derivative instruments. Taking delivery of and making payments for the specific commodities for use in the manufacture of finished goods satisfies our obligations under the forward purchase contracts. For each of the three years in the period ended December 31, 2014, we satisfied these obligations by taking delivery of and making payment for the specific commodities.
As of December 31, 2014, we had entered into purchase agreements with various suppliers. Subject to meeting our quality standards, the purchase obligations covered by these agreements were as follows as of December 31, 2014:
In millions of dollars 2015 2016 2017 2018
Purchase obligations $ 1,298.8 $ 618.1 $ 138.6 $ 66.8
We have commitments under various lease obligations. Future minimum payments under lease obligations with a remaining term in excess of one year were as follows as of December 31, 2014:
In millions of dollars 2015 2016 2017 2018 2019 Thereafter
Future minimum rental payments $ 28.2 $ 13.4 $ 9.6 $ 3.2 $ 0.9 $ 0.9
Future minimum rental payments reflect commitments under non-cancelable operating leases primarily for offices, retail stores, warehouse and distribution facilities, and certain equipment.
81
THE HERSHEY COMPANYNOTES TO CONSOLIDATED FINANCIAL STATEMENTS—(Continued)
(amounts in thousands, except share data or if otherwise indicated)
In December 2013, we entered into an agreement for the construction of a new confectionery manufacturing plant in Malaysia. We incurred approximately $115 million in capital expenditures for construction of the plant in 2014 and expect to incur costs of $90 million to $110 million in 2015. The total cost of construction is expected to be approximately $265 million to $275 million. The plant is expected to begin operations in the second half of 2015.
We have a number of facilities that contain varying amounts of asbestos in certain locations within the facilities. Our asbestos management program is compliant with current applicable regulations, which require that we handle or dispose of asbestos in a special manner if such facilities undergo major renovations or are demolished. Costs associated with the removal of asbestos related to the closure of a manufacturing facility under the Next Century program were recorded primarily in 2012 and included in business realignment and impairment charges. The costs associated with the removal of asbestos from the facility were not material. With regard to other facilities, we do not have sufficient information to estimate the fair value of any asset retirement obligations related to these facilities. We cannot specify the settlement date or range of potential settlement dates and, therefore, sufficient information is not available to apply an expected present value technique. We expect to maintain the facilities with repairs and maintenance activities that would not involve or require the removal of significant quantities of asbestos.
Legal contingencies
In 2007, the Competition Bureau of Canada began an inquiry into alleged violations of the Canadian Competition Act in the sale and supply of chocolate products sold in Canada between 2002 and 2008 by members of the confectionery industry, including Hershey Canada, Inc. The U.S. Department of Justice also notified the Company in 2007 that it had opened an inquiry, but has not requested any information or documents.
Subsequently, 13 civil lawsuits were filed in Canada and 91 civil lawsuits were filed in the United States against the Company. The lawsuits were instituted on behalf of direct purchasers of our products as well as indirect purchasers that purchase our products for use or for resale. Several other chocolate and confectionery companies were named as defendants in these lawsuits as they also were the subject of investigations and/or inquiries by the government entities referenced above. The cases seek recovery for losses suffered as a result of alleged conspiracies in restraint of trade in connection with the pricing practices of the defendants.
The Canadian civil cases were settled in 2012. Hershey Canada, Inc. reached a settlement agreement with the Competition Bureau of Canada through their Leniency Program with regard to an inquiry into alleged violations of the Canadian Competition Act in the sale and supply of chocolate products sold in Canada by members of the confectionery industry. On June 21, 2013, Hershey Canada, Inc. pleaded guilty to one count of price fixing related to communications with competitors in Canada in 2007 and paid a fine of approximately $4.0 million. Hershey Canada, Inc. had promptly reported the conduct to the Competition Bureau, cooperated fully with its investigation and did not implement the planned price increase that was the subject of the 2007 communications.
With regard to the U.S. lawsuits, the Judicial Panel on Multidistrict Litigation assigned the cases to the U.S. District Court for the Middle District of Pennsylvania. Plaintiffs are seeking actual and treble damages against the Company and other defendants based on an alleged overcharge for certain, or in some cases all, chocolate products sold in the U.S. between December 2002 and December 2007 and certain plaintiff groups have alleged damages that extend beyond the alleged conspiracy period. The lawsuits have been proceeding on different scheduling tracks for different groups of plaintiffs.
On February 26, 2014, the District Court granted summary judgment to the Company in the cases brought by the direct purchaser plaintiffs that had not sought class certification as well as those that had been certified as a class. The direct purchaser plaintiffs appealed the District Court's decision to the United States Court of Appeals for the Third Circuit (“Third Circuit”) in May 2014. The appeal remains pending before the Third Circuit.
The remaining plaintiff groups - the putative class plaintiffs that purchased product indirectly for resale, the putative class plaintiffs that purchased product indirectly for use, and direct purchaser Associated Wholesale Grocers, Inc. - dismissed their cases with prejudice, subject to reinstatement if the Third Circuit were to reverse the District Court's summary judgment decision. The District Court entered judgment closing the case on April 17, 2014.
82
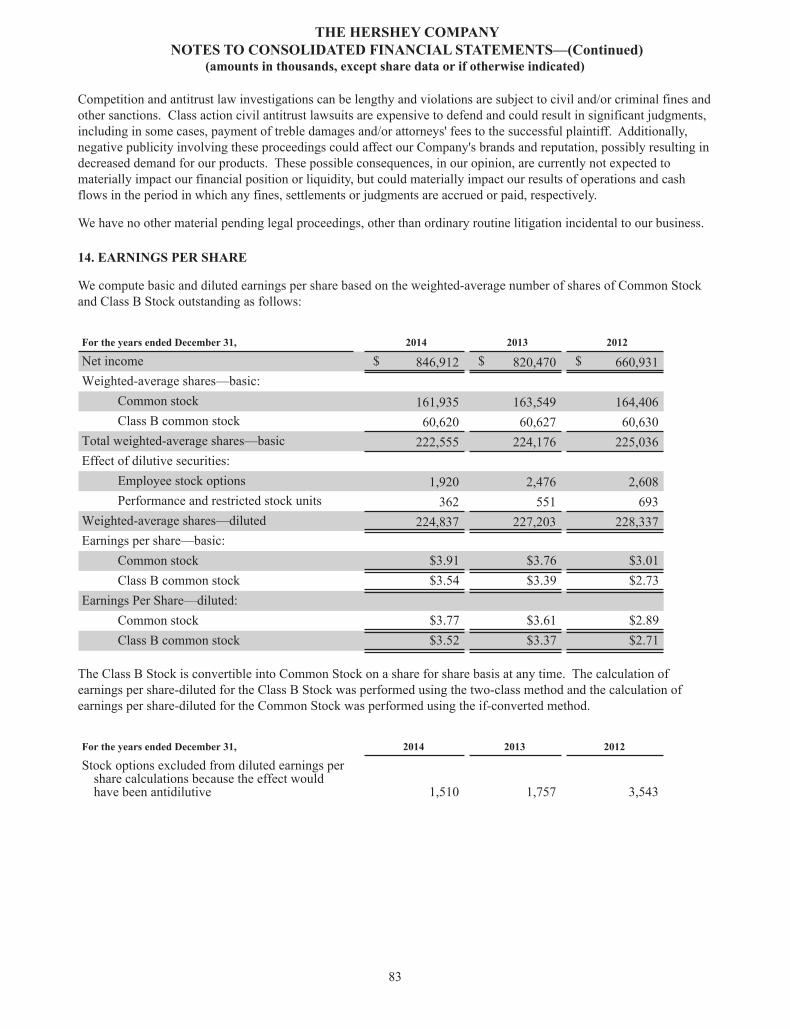
THE HERSHEY COMPANYNOTES TO CONSOLIDATED FINANCIAL STATEMENTS—(Continued)
(amounts in thousands, except share data or if otherwise indicated)
Competition and antitrust law investigations can be lengthy and violations are subject to civil and/or criminal fines and other sanctions. Class action civil antitrust lawsuits are expensive to defend and could result in significant judgments, including in some cases, payment of treble damages and/or attorneys' fees to the successful plaintiff. Additionally, negative publicity involving these proceedings could affect our Company's brands and reputation, possibly resulting in decreased demand for our products. These possible consequences, in our opinion, are currently not expected to materially impact our financial position or liquidity, but could materially impact our results of operations and cash flows in the period in which any fines, settlements or judgments are accrued or paid, respectively.
We have no other material pending legal proceedings, other than ordinary routine litigation incidental to our business.
14. EARNINGS PER SHARE
We compute basic and diluted earnings per share based on the weighted-average number of shares of Common Stock and Class B Stock outstanding as follows:
For the years ended December 31, 2014 2013 2012
Net income $ 846,912 $ 820,470 $ 660,931Weighted-average shares—basic:
Common stock 161,935 163,549 164,406Class B common stock 60,620 60,627 60,630
Total weighted-average shares—basic 222,555 224,176 225,036Effect of dilutive securities:
Employee stock options 1,920 2,476 2,608Performance and restricted stock units 362 551 693
Weighted-average shares—diluted 224,837 227,203 228,337Earnings per share—basic:
Common stock $3.91 $3.76 $3.01Class B common stock $3.54 $3.39 $2.73
Earnings Per Share—diluted:Common stock $3.77 $3.61 $2.89Class B common stock $3.52 $3.37 $2.71
The Class B Stock is convertible into Common Stock on a share for share basis at any time. The calculation of earnings per share-diluted for the Class B Stock was performed using the two-class method and the calculation of earnings per share-diluted for the Common Stock was performed using the if-converted method.
For the years ended December 31, 2014 2013 2012
Stock options excluded from diluted earnings pershare calculations because the effect wouldhave been antidilutive 1,510 1,757 3,543
83
THE HERSHEY COMPANYNOTES TO CONSOLIDATED FINANCIAL STATEMENTS—(Continued)
(amounts in thousands, except share data or if otherwise indicated)
15. SUPPLEMENTAL BALANCE SHEET INFORMATION
The components of certain Consolidated Balance Sheet accounts are as follows:
December 31, 2014 2013
Inventories:Raw materials $ 377,620 $ 226,978Goods in process 63,916 79,861Finished goods 531,608 517,968Inventories at FIFO 973,144 824,807Adjustment to LIFO (172,108) (165,266)
Total inventories $ 801,036 $ 659,541
Property, plant and equipment:Land $ 95,913 $ 96,334Buildings 1,031,050 882,508Machinery and equipment 2,863,559 2,527,420Construction in progress 338,085 273,132Property, plant and equipment, gross 4,328,607 3,779,394Accumulated depreciation (2,176,706) (1,974,049)
Property, plant and equipment, net $ 2,151,901 $ 1,805,345
Other assets:Pension $ 25 $ 32,804Capitalized software, net 63,252 56,502Income tax receivable 1,568 63,863Other non-current assets 77,927 139,835
Total other assets $ 142,772 $ 293,004
Accrued liabilities:Payroll, compensation and benefits $ 225,439 $ 245,641Advertising and promotion 326,647 348,966Due to SGM shareholders 98,884 —Other 162,543 105,115
Total accrued liabilities $ 813,513 $ 699,722
Other long-term liabilities:Post-retirement benefits liabilities $ 268,850 $ 245,460Pension benefits liabilities 114,923 50,842Other 142,230 137,766
Total other long-term liabilities $ 526,003 $ 434,068
84
THE HERSHEY COMPANYNOTES TO CONSOLIDATED FINANCIAL STATEMENTS—(Continued)
(amounts in thousands, except share data or if otherwise indicated)
16. QUARTERLY DATA (Unaudited)
Summary quarterly results were as follows:
Year 2014 First Second Third Fourth
Net sales $ 1,871,813 $ 1,578,350 $ 1,961,578 $ 2,010,027Gross profit 871,490 717,474 860,137 887,065Net income 252,495 168,168 223,741 202,508Common stock:
Net income per share—Basic 1.16 0.78 1.03 0.94Net income per share—Diluted 1.11 0.75 1.00 0.91Dividends paid per share 0.485 0.485 0.535 0.535
Class B common stock:Net income per share—Basic 1.04 0.70 0.94 0.85Net income per share—Diluted(a) 1.03 0.70 0.94 0.85Dividends paid per share 0.435 0.435 0.486 0.486
Market price—common stock:High 108.07 104.11 96.93 106.64Low 95.54 96.02 88.15 91.09
Year 2013 First Second Third Fourth
Net sales $ 1,827,426 $ 1,508,514 $ 1,853,886 $ 1,956,253Gross profit 849,337 718,574 855,551 857,386Net income 241,906 159,504 232,985 186,075Common stock:
Net income per share—Basic(a) 1.11 0.73 1.07 0.85Net income per share—Diluted 1.06 0.70 1.03 0.82Dividends paid per share 0.42 0.42 0.485 0.485
Class B common stock:Net income per share—Basic 1.00 0.66 0.96 0.77Net income per share—Diluted 0.99 0.66 0.95 0.76Dividends paid per share 0.38 0.38 0.435 0.435
Market price—common stock:High 87.53 91.25 97.69 100.90Low 73.51 85.25 89.17 91.04
(a) Quarterly income per share amounts do not total to the annual amount due to changes in weighted-average shares outstanding during the year.
85
Item 9. CHANGES IN AND DISAGREEMENTS WITH ACCOUNTANTS ON ACCOUNTING AND FINANCIAL DISCLOSURE
None.
Item 9A. CONTROLS AND PROCEDURES
As required by Rule 13a-15 under the Securities Exchange Act of 1934 (the “Exchange Act”), the Company conducted an evaluation of the effectiveness of the design and operation of the Company’s disclosure controls and procedures as of December 31, 2014. This evaluation was carried out under the supervision and with the participation of the Company’s management, including the Company’s Chief Executive Officer and Interim Principal Financial Officer. Based upon that evaluation, the Chief Executive Officer and Interim Principal Financial Officer concluded that the Company’s disclosure controls and procedures are effective.
Disclosure controls and procedures are controls and other procedures that are designed to ensure that information required to be disclosed in the Company’s reports filed or submitted under the Exchange Act is recorded, processed, summarized and reported within the time periods specified in the Securities and Exchange Commission’s rules and forms. Disclosure controls and procedures include, without limitation, controls and procedures designed to ensure that information required to be disclosed in the Company’s reports filed under the Exchange Act is accumulated and communicated to management, including the Company’s Chief Executive Officer and Interim Principal Financial Officer, as appropriate, to allow timely decisions regarding required disclosure.
Management's report on the Company's internal control over financial reporting appears on the following page. There has been no change during the most recent fiscal quarter in the Company’s internal control over financial reporting identified in connection with its evaluation that has materially affected, or is reasonably likely to materially affect, the Company’s internal control over financial reporting.
86
MANAGEMENT REPORT ON INTERNAL CONTROL OVER FINANCIAL REPORTING
The management of The Hershey Company is responsible for establishing and maintaining adequate internal control over financial reporting, as such term is defined in Exchange Act Rule 13a-15(f). The Company’s internal control system was designed to provide reasonable assurance to the Company’s management and Board of Directors regarding the preparation and fair presentation of published financial statements.
All internal control systems, no matter how well designed, have inherent limitations. Therefore, even those systems determined to be effective can provide only reasonable assurance with respect to financial statement preparation and presentation.
The Company’s management, including the Company’s Chief Executive Officer and Interim Principal Financial Officer, assessed the effectiveness of the Company’s internal control over financial reporting as of December 31, 2014. In making this assessment, the Company’s management used the criteria set forth by the Committee of Sponsoring Organizations of the Treadway Commission (COSO) in Internal Control–Integrated Framework (2013 edition). Based on this assessment, management concluded that, as of December 31, 2014, the Company’s internal control over financial reporting was effective based on those criteria.
Management’s assessment of, and conclusion on, the effectiveness of internal control over financial reporting did not include the internal controls of Shanghai Golden Monkey Food Joint Stock Co., Ltd., a company acquired September 26, 2014 and included in the Company’s 2014 consolidated financial statements. This entity’s net sales and assets excluded from management's assessment of internal control represented 0.7% and 4.7% of the Company’s total net sales and total assets, respectively, for the year ended December 31, 2014.
John P. BilbreyChief Executive Officer
Richard M. McConvilleInterim Principal Financial Officer
87

Item 9B. OTHER INFORMATION
None.
88
PART III
Item 10. DIRECTORS, EXECUTIVE OFFICERS AND CORPORATE GOVERNANCE
The information regarding executive officers of the Company required by Item 401 of SEC Regulation S-K is incorporated herein by reference from the disclosure included under the caption “SUPPLEMENTAL ITEM. EXECUTIVE OFFICERS OF THE REGISTRANT” at the end of Part I of this Annual Report on Form 10-K.
The information required by Item 401 of SEC Regulation S-K concerning the directors and nominees for director of the Company, together with a discussion of the specific experience, qualifications, attributes and skills that led the Board to conclude that the director or nominee should serve as a director at this time, will be located in the Proxy Statement in the section entitled “PROPOSAL NO. 1 – ELECTION OF DIRECTORS,” which information is incorporated herein by reference.
Information regarding the identification of the Audit Committee as a separately-designated standing committee of the Board and information regarding the status of one or more members of the Audit Committee as an “audit committee financial expert” will be located in the Proxy Statement in the section entitled “MEETINGS AND COMMITTEES OF THE BOARD – Committees of the Board,” which information is incorporated herein by reference.
Reporting of any inadvertent late filings under Section 16(a) of the Securities Exchange Act of 1934, as amended, will be located in the Proxy Statement in the section entitled “SECTION 16(a) BENEFICIAL OWNERSHIP REPORTING COMPLIANCE,” which information is incorporated herein by reference.
Information regarding our Code of Ethical Business Conduct applicable to our directors, officers and employees is located in Part I of this Annual Report on Form 10-K, under the heading “Available Information.”
Item 11. EXECUTIVE COMPENSATION
Information regarding the compensation of each of our named executive officers, including our Chief Executive Officer, will be located in the Proxy Statement in the section entitled “COMPENSATION DISCUSSION & ANALYSIS,” which information is incorporated herein by reference. Information regarding the compensation of our directors will be located in the Proxy Statement in the section entitled “NON-EMPLOYEE DIRECTOR COMPENSATION,” which information is incorporated herein by reference.
The information required by Item 407(e)(4) of SEC Regulation S-K will be located in the Proxy Statement in the section entitled “COMPENSATION COMMITTEE INTERLOCKS AND INSIDER PARTICIPATION,” which information is incorporated herein by reference.
The information required by Item 407(e)(5) of SEC Regulation S-K will be located in the Proxy Statement in the section entitled “Compensation Committee Report,” which information is incorporated herein by reference.
Item 12. SECURITY OWNERSHIP OF CERTAIN BENEFICIAL OWNERS AND MANAGEMENT AND RELATED STOCKHOLDER MATTERS
Information concerning ownership of our voting securities by certain beneficial owners, individual nominees for director, the named executive officers, including persons serving as our Chief Executive Officer and Interim Principal Financial Officer, and directors and executive officers as a group, will be located in the Proxy Statement in the section entitled “SHARE OWNERSHIP OF DIRECTORS, MANAGEMENT AND CERTAIN BENEFICIAL OWNERS,” which information is incorporated herein by reference.
89
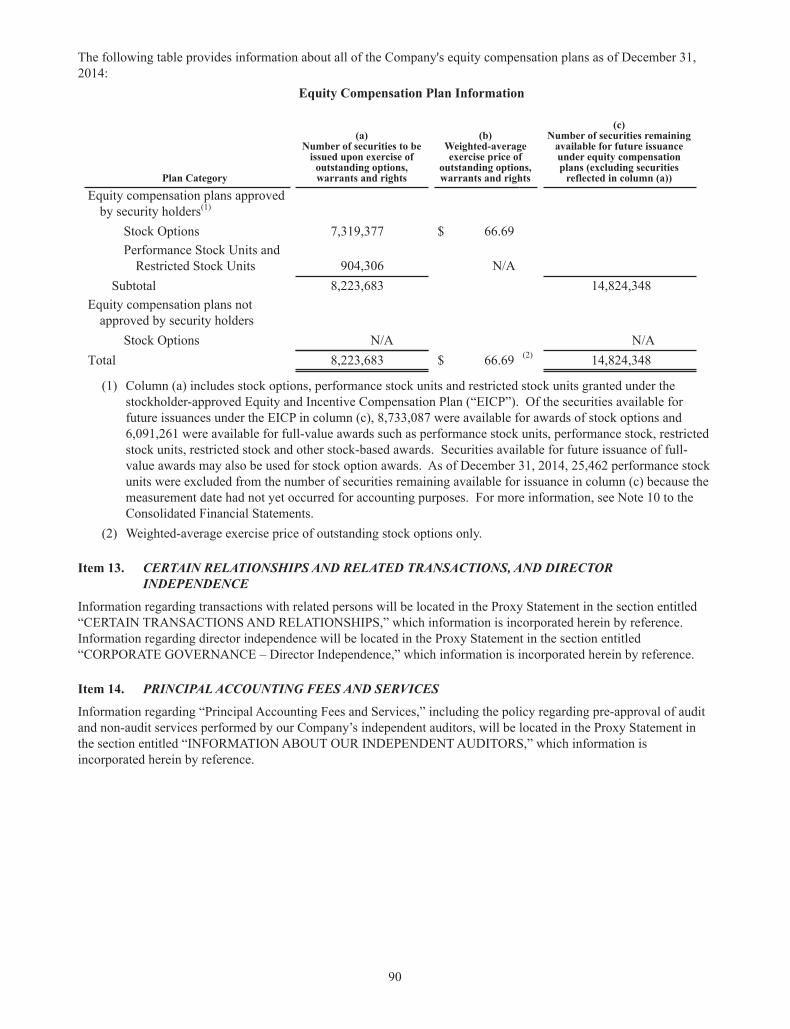
The following table provides information about all of the Company's equity compensation plans as of December 31, 2014:
Equity Compensation Plan Information
Plan Category
(a)Number of securities to be
issued upon exercise of outstanding options, warrants and rights
(b)Weighted-average exercise price of
outstanding options, warrants and rights
(c)Number of securities remaining
available for future issuance under equity compensation plans (excluding securities
reflected in column (a))
Equity compensation plans approved by security holders(1)
Stock Options 7,319,377 $ 66.69Performance Stock Units and
Restricted Stock Units 904,306 N/ASubtotal 8,223,683 14,824,348
Equity compensation plans notapproved by security holders
Stock Options N/A N/ATotal 8,223,683 $ 66.69 (2) 14,824,348
(1) Column (a) includes stock options, performance stock units and restricted stock units granted under the stockholder-approved Equity and Incentive Compensation Plan (“EICP”). Of the securities available for future issuances under the EICP in column (c), 8,733,087 were available for awards of stock options and 6,091,261 were available for full-value awards such as performance stock units, performance stock, restricted stock units, restricted stock and other stock-based awards. Securities available for future issuance of full-value awards may also be used for stock option awards. As of December 31, 2014, 25,462 performance stock units were excluded from the number of securities remaining available for issuance in column (c) because the measurement date had not yet occurred for accounting purposes. For more information, see Note 10 to the Consolidated Financial Statements.
(2) Weighted-average exercise price of outstanding stock options only.
Item 13. CERTAIN RELATIONSHIPS AND RELATED TRANSACTIONS, AND DIRECTOR INDEPENDENCE
Information regarding transactions with related persons will be located in the Proxy Statement in the section entitled “CERTAIN TRANSACTIONS AND RELATIONSHIPS,” which information is incorporated herein by reference. Information regarding director independence will be located in the Proxy Statement in the section entitled “CORPORATE GOVERNANCE – Director Independence,” which information is incorporated herein by reference.
Item 14. PRINCIPAL ACCOUNTING FEES AND SERVICES
Information regarding “Principal Accounting Fees and Services,” including the policy regarding pre-approval of audit and non-audit services performed by our Company’s independent auditors, will be located in the Proxy Statement in the section entitled “INFORMATION ABOUT OUR INDEPENDENT AUDITORS,” which information is incorporated herein by reference.
90
PART IV
Item 15. EXHIBITS, FINANCIAL STATEMENT SCHEDULES
Item 15(a)(1): Financial Statements
The audited consolidated financial statements of The Hershey Company and its subsidiaries and the Report of Independent Registered Public Accounting Firm thereon, as required to be filed, are located under Item 8 of this Annual Report on Form 10-K.
Item 15(a)(2): Financial Statement Schedule
Schedule II—Valuation and Qualifying Accounts (see page 93) for The Hershey Company and its subsidiaries for the years ended December 31, 2014, 2013 and 2012 is filed as required by Item 15(c).
We omitted other schedules because they are not applicable or the required information is set forth in the consolidated financial statements or notes thereto.
Item 15(a)(3): Exhibits
The information called for by this Item is incorporated by reference from the Exhibit Index included in this Annual Report on Form 10-K, beginning on page 94.
91
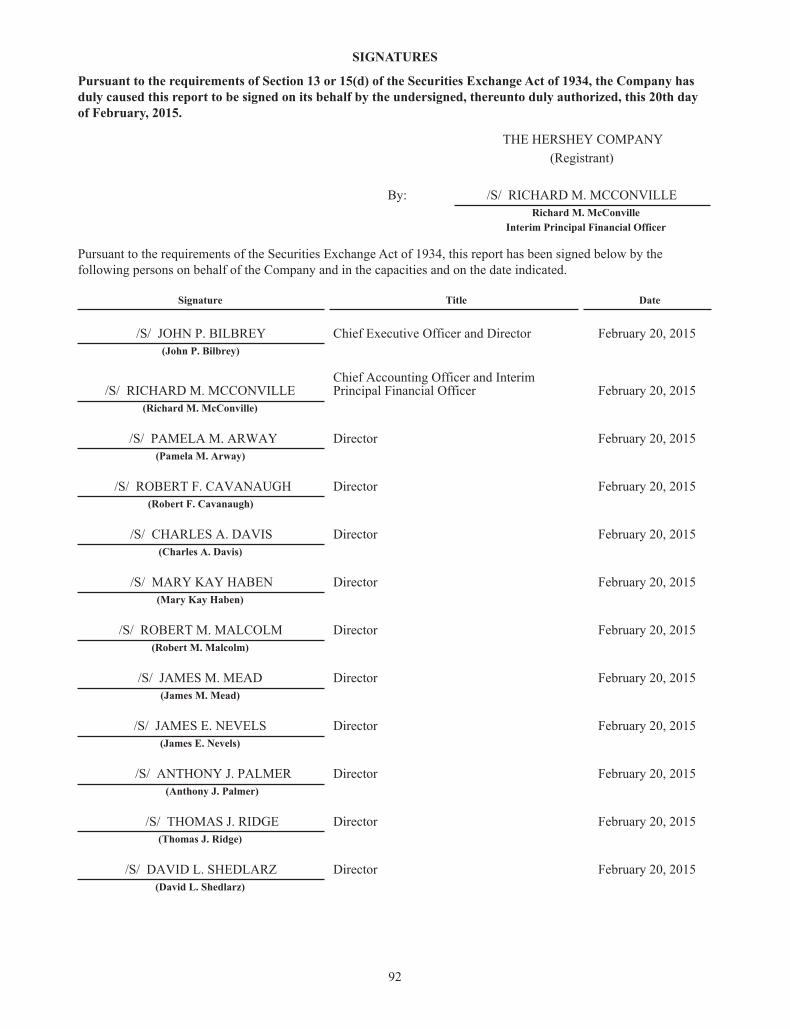
SIGNATURES
Pursuant to the requirements of Section 13 or 15(d) of the Securities Exchange Act of 1934, the Company has duly caused this report to be signed on its behalf by the undersigned, thereunto duly authorized, this 20th day of February, 2015.
THE HERSHEY COMPANY(Registrant)
By: /S/ RICHARD M. MCCONVILLERichard M. McConville
Interim Principal Financial Officer
Pursuant to the requirements of the Securities Exchange Act of 1934, this report has been signed below by the following persons on behalf of the Company and in the capacities and on the date indicated.
Signature Title Date
/S/ JOHN P. BILBREY Chief Executive Officer and Director February 20, 2015(John P. Bilbrey)
/S/ RICHARD M. MCCONVILLEChief Accounting Officer and InterimPrincipal Financial Officer February 20, 2015
(Richard M. McConville)
/S/ PAMELA M. ARWAY Director February 20, 2015(Pamela M. Arway)
/S/ ROBERT F. CAVANAUGH Director February 20, 2015(Robert F. Cavanaugh)
/S/ CHARLES A. DAVIS Director February 20, 2015(Charles A. Davis)
/S/ MARY KAY HABEN Director February 20, 2015(Mary Kay Haben)
/S/ ROBERT M. MALCOLM Director February 20, 2015(Robert M. Malcolm)
/S/ JAMES M. MEAD Director February 20, 2015(James M. Mead)
/S/ JAMES E. NEVELS Director February 20, 2015(James E. Nevels)
/S/ ANTHONY J. PALMER Director February 20, 2015(Anthony J. Palmer)
/S/ THOMAS J. RIDGE Director February 20, 2015(Thomas J. Ridge)
/S/ DAVID L. SHEDLARZ Director February 20, 2015(David L. Shedlarz)
92
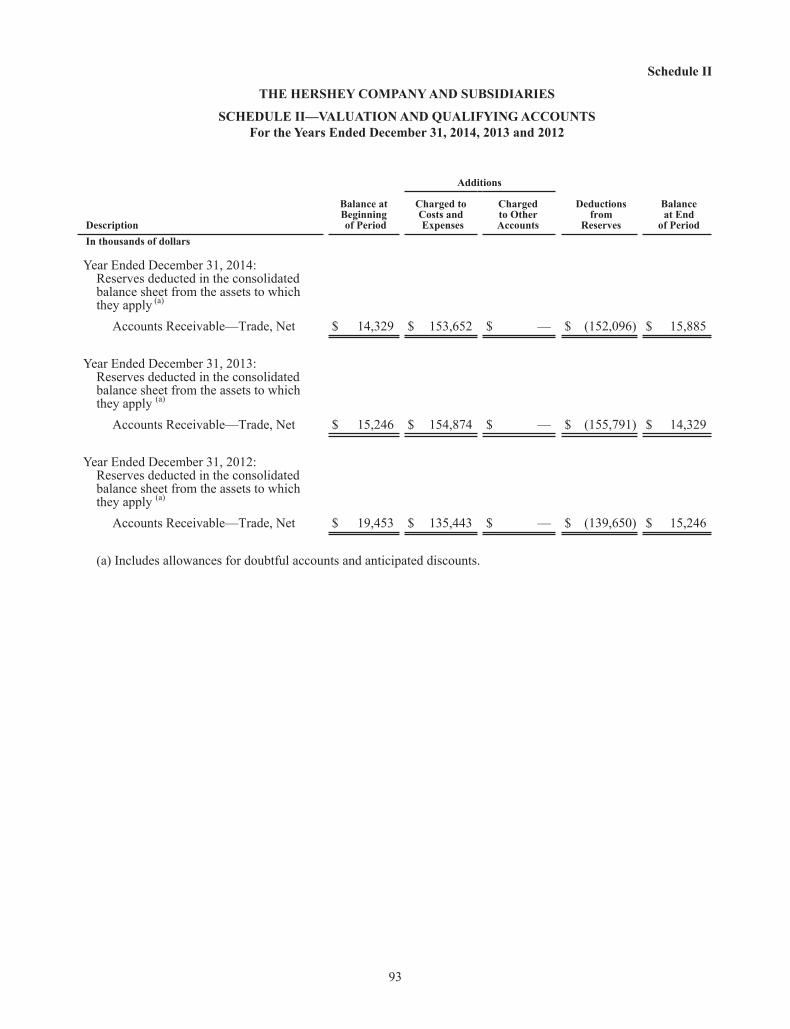
Schedule II
THE HERSHEY COMPANY AND SUBSIDIARIES
SCHEDULE II—VALUATION AND QUALIFYING ACCOUNTS For the Years Ended December 31, 2014, 2013 and 2012
Additions
Description
Balance atBeginningof Period
Charged toCosts andExpenses
Chargedto OtherAccounts
Deductionsfrom
Reserves
Balanceat End
of Period In thousands of dollars
Year Ended December 31, 2014: Reserves deducted in the consolidated balance sheet from the assets to which they apply (a)
Accounts Receivable—Trade, Net $ 14,329 $ 153,652 $ — $ (152,096) $ 15,885
Year Ended December 31, 2013: Reserves deducted in the consolidated balance sheet from the assets to which they apply (a)
Accounts Receivable—Trade, Net $ 15,246 $ 154,874 $ — $ (155,791) $ 14,329
Year Ended December 31, 2012: Reserves deducted in the consolidated balance sheet from the assets to which they apply (a)
Accounts Receivable—Trade, Net $ 19,453 $ 135,443 $ — $ (139,650) $ 15,246
(a) Includes allowances for doubtful accounts and anticipated discounts.
93
EXHIBIT INDEX
Exhibit Description2.1 Share Purchase Agreement by and among Shanghai Golden Monkey Food Joint Stock Co., LTD.
and Hershey Netherlands B.V., a wholly-owned subsidiary of the Company, as of December 18,2013, incorporated by reference from Exhibit 2.1 to the Company’s Annual Report on Form 10-Kfor the fiscal year ended December 31, 2013.
3.1 The Company’s Restated Certificate of Incorporation, as amended, is incorporated by referencefrom Exhibit 3 to the Company’s Quarterly Report on Form 10-Q for the quarter ended April 3,2005. The By-laws, as amended and restated as of February 21, 2012, are incorporated byreference from Exhibit 3.1 to the Company’s Current Report on Form 8-K filed February 24,2012.
4.1 The Company has issued certain long-term debt instruments, no one class of which createsindebtedness exceeding 10% of the total assets of the Company and its subsidiaries on aconsolidated basis. These classes consist of the following:
1) 4.850% Notes due 2015
2) 5.450% Notes due 2016
3) 1.500% Notes due 2016
4) 4.125% Notes due 2020
5) 8.8% Debentures due 2021
6) 2.625% Notes due 2023
7) 7.2% Debentures due 2027
8) Other ObligationsThe Company undertakes to furnish copies of the agreements governing these debt instruments tothe Securities and Exchange Commission upon its request.
10.1 Kit Kat and Rolo License Agreement (the “License Agreement”) between the Company andRowntree Mackintosh Confectionery Limited is incorporated by reference from Exhibit 10(a) tothe Company’s Annual Report on Form 10-K for the fiscal year ended December 31, 1980. TheLicense Agreement was amended in 1988 and the Amendment Agreement is incorporated byreference from Exhibit 19 to the Company’s Quarterly Report on Form 10-Q for the quarterended July 3, 1988. The License Agreement was assigned by Rowntree MackintoshConfectionery Limited to Société des Produits Nestlé SA as of January 1, 1990. The AssignmentAgreement is incorporated by reference from Exhibit 19 to the Company’s Annual Report onForm 10-K for the fiscal year ended December 31, 1990.
10.2 Peter Paul/York Domestic Trademark & Technology License Agreement between the Companyand Cadbury Schweppes Inc. (now Kraft Foods Ireland Intellectual Property Limited) datedAugust 25, 1988, is incorporated by reference from Exhibit 2(a) to the Company’s Current Reporton Form 8-K dated September 8, 1988. This agreement was assigned by the Company to itswholly-owned subsidiary, Hershey Chocolate & Confectionery Corporation.
10.3 Cadbury Trademark & Technology License Agreement between the Company and CadburyLimited (now Cadbury UK Limited) dated August 25, 1988, is incorporated by reference fromExhibit 2(a) to the Company’s Current Report on Form 8-K dated September 8, 1988. Thisagreement was assigned by the Company to its wholly-owned subsidiary, Hershey Chocolate &Confectionery Corporation.
94
10.4 Trademark and Technology License Agreement between Huhtamäki and the Company datedDecember 30, 1996, is incorporated by reference from Exhibit 10 to the Company’s CurrentReport on Form 8-K filed February 26, 1997. This agreement was assigned by the Company to itswholly-owned subsidiary, Hershey Chocolate & Confectionery Corporation. The agreement wasamended and restated in 1999 and the Amended and Restated Trademark and Technology LicenseAgreement is incorporated by reference from Exhibit 10.2 to the Company’s Annual Report onForm 10-K for the fiscal year ended December 31, 1999.
10.5 Five Year Credit Agreement dated as of October 14, 2011, among the Company and the banks,financial institutions and other institutional lenders listed on the respective signature pagesthereof (“Lenders”), Bank of America, N.A., as administrative agent for the Lenders, JPMorganChase Bank, N.A., as syndication agent, Citibank, N.A. and PNC Bank, National Association, asdocumentation agents, and Bank of America Merrill Lynch, J.P. Morgan Securities LLC,Citigroup Global Markets, Inc. and PNC Capital Markets LLC, as joint lead arrangers and jointbook managers is incorporated by reference from Exhibit 10.1 to the Company's current Reporton Form 8-K filed October 20, 2011.
10.6 Amendment No. 1 to Credit Agreement dated as of November 12, 2013, among the Company, thebanks, financial institutions and other institutional lenders who are parties to the Five Year CreditAgreement and Bank of America, N.A., as agent, is incorporated by reference from Exhibit 10.6to the Company’s Annual Report on Form 10-K for the fiscal year ended December 31, 2013.
10.7 Master Innovation and Supply Agreement between the Company and Barry Callebaut, AG, datedJuly 13, 2007, is incorporated by reference from Exhibit 10.1 to the Company’s Current Reporton Form 8-K filed July 19, 2007.
10.8 First Amendment to Master Innovation and Supply Agreement between the Company and BarryCallebaut, AG, dated April 14, 2011, is incorporated by reference from Exhibit 10.4 to theCompany’s Quarterly Report on Form 10-Q for the quarter ended July 3, 2011.
10.9 Supply Agreement for Monterrey, Mexico, between the Company and Barry Callebaut, AG, datedJuly 13, 2007, is incorporated by reference from Exhibit 10.2 to the Company’s Current Reporton Form 8-K filed July 19, 2007.
10.10 The Company’s Equity and Incentive Compensation Plan, amended and restated February 22, 2011, and approved by our stockholders on April 28, 2011, is incorporated by reference from Appendix B to the Company’s proxy statement filed March 15, 2011.+
10.11 Terms and Conditions of Nonqualified Stock Option Awards under the Equity and Incentive Compensation Plan is incorporated by reference from Exhibit 10.2 to the Company’s Current Report on Form 8-K filed February 24, 2012.+
10.12 The Company’s Executive Benefits Protection Plan (Group 3A), Amended and Restated as of June 27, 2012, is incorporated by reference from Exhibit 10.2 to the Company’s Quarterly Report on Form 10-Q for the quarter ended July 1, 2012.+
10.13 The Company’s Deferred Compensation Plan, Amended and Restated as of June 27, 2012, is incorporated by reference from Exhibit 10.3 to the Company’s Quarterly Report on Form 10-Q for the quarter ended July 1, 2012.+
10.14 Executive Confidentiality and Restrictive Covenant Agreement, adopted as of February 16, 2009, is incorporated by reference from Exhibit 10.4 to the Company’s Annual Report on Form 10-K for the fiscal year ended December 31, 2008.+
10.15 Employee Confidentiality and Restrictive Covenant Agreement, amended as of February 18, 2013, is incorporated by reference from Exhibit 10.1 to the Company's Quarterly Report on Form 10-Q for the quarter ended March 31, 2013.+
10.16 The Company’s Supplemental Executive Retirement Plan, Amended and Restated as of October 2, 2007, is incorporated by reference from Exhibit 10.6 to the Company’s Annual Report on Form 10-K for the fiscal year ended December 31, 2007.+
95
10.17 First Amendment to the Company’s Supplemental Executive Retirement Plan, Amended and Restated as of October 2, 2007, is incorporated by reference from Exhibit 10.5 to the Company’s Annual Report on Form 10-K for the fiscal year ended December 31, 2008.+
10.18 The Company’s Compensation Limit Replacement Plan, Amended and Restated as of January 1, 2009, is incorporated by reference from Exhibit 10.6 to the Company’s Annual Report on Form 10-K for the fiscal year ended December 31, 2008.+
10.19 The Company’s Directors’ Compensation Plan, Amended and Restated as of December 2, 2008,is incorporated by reference from Exhibit 10.8 to the Company’s Annual Report on Form 10-Kfor the fiscal year ended December 31, 2008.
10.20 Form of Notice of Special Award of Restricted Stock Units is incorporated by reference from Exhibit 10.2 to the Company’s Current Report on Form 8-K filed June 16, 2011.+
10.21 Executive Employment Agreement with John P. Bilbrey, dated as of August 7, 2012, is incorporated by reference from Exhibit 10.1 to the Company's Quarterly Report on Form 10-Q for the quarter ended July 1, 2012.+
10.22 Form of Notice of Award of Performance Stock Units is incorporated by reference from Exhibit 10.1 to the Company's Current Report on Form 8-K filed February 24, 2012.+
10.23 The Long-Term Incentive Program Participation Agreement is incorporated by reference from Exhibit 10.2 to the Company's Current Report on Form 8-K filed February 18, 2005.+
10.24 The Company’s Broad Based Stock Option Plan, as amended, is incorporated by reference from Exhibit 10.4 to the Company’s Annual Report on Form 10-K for the fiscal year ended December 31, 2002.+
12.1 Computation of ratio of earnings to fixed charges statement.*
21.1 Subsidiaries of the Registrant.*
23.1 Consent of Independent Registered Public Accounting Firm.*
31.1 Certification of John P. Bilbrey, Chief Executive Officer, pursuant to Section 302 of the Sarbanes-Oxley Act of 2002.*
31.2 Certification of Richard M. McConville, Interim Principal Financial Officer, pursuant to Section302 of the Sarbanes-Oxley Act of 2002.*
32.1 Certification of John P. Bilbrey, Chief Executive Officer, and Richard M. McConville, InterimPrincipal Financial Officer, pursuant to Section 906 of the Sarbanes-Oxley Act of 2002.**
101.INS XBRL Instance Document
101.SCH XBRL Taxonomy Extension Schema
101.CAL XBRL Taxonomy Extension Calculation Linkbase
101.LAB XBRL Taxonomy Extension Label Linkbase
101.PRE XBRL Taxonomy Extension Presentation Linkbase
101.DEF XBRL Taxonomy Extension Definition Linkbase
* Filed herewith
** Furnished herewith
+ Management contract, compensatory plan or arrangement
96
CERTIFICATION
I, John P. Bilbrey, certify that:
1. I have reviewed this Annual Report on Form 10-K of The Hershey Company;
2. Based on my knowledge, this report does not contain any untrue statement of a material fact or omit to state a material fact necessary to make the statements made, in light of the circumstances under which such statements were made, not misleading with respect to the period covered by this report;
3. Based on my knowledge, the financial statements, and other financial information included in this report, fairly present in all material respects the financial condition, results of operations and cash flows of the registrant as of, and for, the periods presented in this report;
4. The registrant’s other certifying officer(s) and I are responsible for establishing and maintaining disclosure controls and procedures (as defined in Exchange Act Rules 13a-15(e) and 15d-15(e)) and internal control over financial reporting (as defined in Exchange Act Rules 13a-15(f) and 15d-15(f)) for the registrant and have:
(a) Designed such disclosure controls and procedures, or caused such disclosure controls and procedures to be designed under our supervision, to ensure that material information relating to the registrant, including its consolidated subsidiaries, is made known to us by others within those entities, particularly during the period in which this report is being prepared;
(b) Designed such internal control over financial reporting, or caused such internal control over financial reporting to be designed under our supervision, to provide reasonable assurance regarding the reliability of financial reporting and the preparation of financial statements for external purposes in accordance with generally accepted accounting principles;
(c) Evaluated the effectiveness of the registrant’s disclosure controls and procedures and presented in this report our conclusions about the effectiveness of the disclosure controls and procedures, as of the end of the period covered by this report based on such evaluation; and
(d) Disclosed in this report any change in the registrant’s internal control over financial reporting that occurred during the registrant’s most recent fiscal quarter (the registrant’s fourth fiscal quarter in the case of an annual report) that has materially affected, or is reasonably likely to materially affect, the registrant’s internal control over financial reporting; and
5. The registrant’s other certifying officer(s) and I have disclosed, based on our most recent evaluation of internal control over financial reporting, to the registrant’s auditors and the audit committee of the registrant’s board of directors (or persons performing the equivalent functions):
(a) All significant deficiencies and material weaknesses in the design or operation of internal control over financial reporting which are reasonably likely to adversely affect the registrant’s ability to record, process, summarize and report financial information; and
(b) Any fraud, whether or not material, that involves management or other employees who have a significant role in the registrant’s internal control over financial reporting.
/s/ JOHN P. BILBREYJohn P. Bilbrey
Chief Executive OfficerFebruary 20, 2015
97
CERTIFICATION
I, Richard M. McConville, certify that:
1. I have reviewed this Annual Report on Form 10-K of The Hershey Company;
2. Based on my knowledge, this report does not contain any untrue statement of a material fact or omit to state a material fact necessary to make the statements made, in light of the circumstances under which such statements were made, not misleading with respect to the period covered by this report;
3. Based on my knowledge, the financial statements, and other financial information included in this report, fairly present in all material respects the financial condition, results of operations and cash flows of the registrant as of, and for, the periods presented in this report;
4. The registrant’s other certifying officer(s) and I are responsible for establishing and maintaining disclosure controls and procedures (as defined in Exchange Act Rules 13a-15(e) and 15d-15(e)) and internal control over financial reporting (as defined in Exchange Act Rules 13a-15(f) and 15d-15(f)) for the registrant and have:
(a) Designed such disclosure controls and procedures, or caused such disclosure controls and procedures to be designed under our supervision, to ensure that material information relating to the registrant, including its consolidated subsidiaries, is made known to us by others within those entities, particularly during the period in which this report is being prepared;
(b) Designed such internal control over financial reporting, or caused such internal control over financial reporting to be designed under our supervision, to provide reasonable assurance regarding the reliability of financial reporting and the preparation of financial statements for external purposes in accordance with generally accepted accounting principles;
(c) Evaluated the effectiveness of the registrant’s disclosure controls and procedures and presented in this report our conclusions about the effectiveness of the disclosure controls and procedures, as of the end of the period covered by this report based on such evaluation; and
(d) Disclosed in this report any change in the registrant’s internal control over financial reporting that occurred during the registrant’s most recent fiscal quarter (the registrant’s fourth fiscal quarter in the case of an annual report) that has materially affected, or is reasonably likely to materially affect, the registrant’s internal control over financial reporting; and
5. The registrant’s other certifying officer(s) and I have disclosed, based on our most recent evaluation of internal control over financial reporting, to the registrant’s auditors and the audit committee of the registrant’s board of directors (or persons performing the equivalent functions):
(a) All significant deficiencies and material weaknesses in the design or operation of internal control over financial reporting which are reasonably likely to adversely affect the registrant’s ability to record, process, summarize and report financial information; and
(b) Any fraud, whether or not material, that involves management or other employees who have a significant role in the registrant’s internal control over financial reporting.
/s/ RICHARD M. MCCONVILLERichard M. McConville
Interim Principal Financial OfficerFebruary 20, 2015
98
CERTIFICATION
Pursuant to Section 906 of the Sarbanes-Oxley Act of 2002, the undersigned officers of The Hershey Company (the “Company”) hereby certify that the Company’s Annual Report on Form 10-K for the year ended December 31, 2014 (the “Report”) fully complies with the requirements of Section 13(a) or 15(d), as applicable, of the Securities Exchange Act of 1934 and that the information contained in the Report fairly presents, in all material respects, the financial condition and results of operations of the Company.
Date: February 20, 2015 /s/ JOHN P. BILBREY
John P. BilbreyChief Executive Officer
Date: February 20, 2015 /s/ RICHARD M. MCCONVILLE
Richard M. McConvilleInterim Principal Financial Officer
A signed original of this written statement required by Section 906, or other document authenticating, acknowledging, or otherwise adopting the signature that appears in typed form within the electronic version of this written statement required by Section 906, has been provided to the Company and will be retained by the Company and furnished to the Securities and Exchange Commission or its staff upon request.
99