Embed Size (px)
Citation preview
The authors are solely responsible for the content of this technical presentation. The technical presentation does not necessarily reflect the official position of the American Society of Agricultural and Biological Engineers (ASABE), and its printing and distribution does not constitute an endorsement of views which may be expressed. Technical presentations are not subject to the formal peer review process by ASABE editorial committees; therefore, they are not to be presented as refereed publications. Citation of this work should state that it is from an ASABE meeting paper. EXAMPLE: Author's Last Name, Initials. 2008. Title of Presentation. ASABE Paper No. 08----. St. Joseph, Mich.: ASABE. For information about securing permission to reprint or reproduce a technical presentation, please contact ASABE at [email protected] or 269-429-0300 (2950 Niles Road, St. Joseph, MI 49085-9659 USA).
An ASABE Meeting Presentation Paper Number: 083785
Comminution Properties of Biomass in Hammer Mill and its Particle Size Characterization
Venkata S. P. Bitra, Post Doctoral Research Associate The University of Tennessee, Dept. of Biosystems Engineering and Soil Science, 2506 E.J. Chapman Drive, Knoxville, TN 37996, USA
Alvin R. Womac, Professor The University of Tennessee, Dept. of Biosystems Engineering and Soil Science, 2506 E.J. Chapman Drive, Knoxville, TN 37996, USA
Nehru Chevanan, Post Doctoral Research Associate The University of Tennessee, Dept. of Biosystems Engineering and Soil Science, 2506 E.J. Chapman Drive, Knoxville, TN 37996, USA
Shahab Sokhansanj, Research Leader Oak Ridge National Laboratory, Environmental Sciences Division, P.O.Box 2008, Oak Ridge,
TN 37831, USA
Written for presentation at the 2008 ASABE Annual International Meeting
Sponsored by ASABE Rhode Island Convention Center
Providence, Rhode Island June 29 – July 2, 2008
Abstract. Biomass particle size impacts handling, storage, conversion, and dust control systems. Size reduction mechanical energy was directly measured for switchgrass (Panicum virgatum L.), wheat straw (Triticum aestivum L.), and corn stover (Zea mays L.) in an instrumented hammer mill. Direct power inputs were determined for different operating speeds from 2000 to 3600 rpm for 3.175 mm integral classifying screen and mass input rate of 2.5 kg/min with 90º and 30º edges on hammers. Overall accuracy of power measurement was calculated to be ±0.003 kW. Particle sizes were examined for hammer mill operating factors using ISO sieve sizes from 4.75 to 0.02 mm in conjunction with Ro-tap sieve analyzer. A total specific energy (kWh/Mg) was defined as size reduction energy expended for a particular mill design. Effective specific energy was defined as the energy that can be assumed to reach the biomass. The difference is parasitic or idle energy. Total specific energy for switchgrass, wheat straw, and corn stover grinding increased with hammer mill speed for both 90º and 30º hammers. Effective specific energy decreased marginally for switchgrass
The authors are solely responsible for the content of this technical presentation. The technical presentation does not necessarily reflect the official position of the American Society of Agricultural and Biological Engineers (ASABE), and its printing and distribution does not constitute an endorsement of views which may be expressed. Technical presentations are not subject to the formal peer review process by ASABE editorial committees; therefore, they are not to be presented as refereed publications. Citation of this work should state that it is from an ASABE meeting paper. EXAMPLE: Author's Last Name, Initials. 2008. Title of Presentation. ASABE Paper No. 08----. St. Joseph, Mich.: ASABE. For information about securing permission to reprint or reproduce a technical presentation, please contact ASABE at [email protected] or 269-429-0300 (2950 Niles Road, St. Joseph, MI 49085-9659 USA).
and considerably for wheat straw and it increased for corn stover with 90º hammers. However, effective specific energy increased with speed to certain extent and then decreased for 30º hammers. Rosin-Rammler equation fitted the switchgrass, wheat straw, and corn stover grind size distribution data with R2 > 0.995. Mass relative span was greater than 1, which indicated a wide distribution of particle sizes. Uniformity coefficient was less than 4.0 for wheat straw, which indicated uniform mix of particles, and it was about 4.0 for switchgrass and corn stover, which indicated a large assortment of particles and also represented a well graded particle size distribution. Geometric mean diameter had strong correlations with Rosin-Rammler size parameter, median diameter, and effective size. Distribution related parameters, namely, mass relative span, Rosin-Rammler distribution parameter, inclusive graphic skewness, graphic kurtosis, uniformity index, uniformity coefficient, coefficient of gradation and distribution geometric standard deviation had strong correlation among themselves and a weak correlation with mill speed. Results of this extensive analysis of specific energy and particle sizes can be applied to selection of hammer mill operating parameters to produce a particular size of switchgrass, wheat straw, and corn stover grind.
Keywords. Switchgrass; wheat straw, corn stover, hammer mill; mill speed; size reduction; total specific energy; effective specific energy; particle size distribution; Rosin-Rammler equation; mean separation
2
Introduction Bio-based power, fuels, and products may contribute to worldwide energy supplies and economic development. Switchgrass is widely recognized as a leading crop for energy production (Greene, 2004) apart from wheat straw and corn stover. For efficient conversion of biomass to bioenergy, an optimized supply chain ensures timely supply of biomass with minimum costs (Kumar and Sokhansanj, 2007). Conversion of naturally occurring lignocellulosic materials to ethanol currently requires pretreatment to enhance the accessibility of reactive agents and to improve conversion rates and yields. According to one patent, agricultural biomass was prepared to approximately 1 to 6 mm by a disc refiner for ethanol production (US Patent 5 677 154, 1997). Such reduced particle sizes can be achieved by fine grinders (e.g. hammer mill, disc refiner, pin mill, chain mill). Long pieces of straw/stalk of biomass may not flow easily into grinders such as hammer and disc refiners. Hence, biomass needs to be preprocessed or chopped with a knife mill to accommodate bulk flow, densification, and uniformity of feed rate. Size reduction is an important energy intensive unit operation essential for bioenergy conversion process and densification to reduce transportation costs. Biomass size reduction process changes the particle size and shape, increases bulk density, improves flow properties, increases porosity, and generates new surface area (Drzymala, 1993). Higher surface area increases number of contact points for chemical reactions (Schell and Harwood, 1994), which may require grinding to a nominal particle size of about 1 mm (US Department of Energy, 1993). Size reduction alone can account for one-third of the power requirements of the entire bioconversion to ethanol (US Department of Energy, 1993). Particle size analyses characterize the input and output materials of size reduction operations that usually produce a range of particle sizes or distribution, within a given sample.
Current research is driven by the need to reduce the cost of biomass ethanol production. Pretreatment research is focused on developing processes that would result in reduced bioconversion time, reduced enzyme usage and/or increased ethanol yields. Efficient size reduction emphasizes delivery of suitable particle size distributions, though information to predict particle size distributions is lacking for most of the newly considered biomass sources such as switchgrass, wheat straw, and corn stover.
The National Renewable Energy Laboratory indicated that size reduction required one-third of total energy inputs for biomass to ethanol conversion (Aden et al., 2002). Hence, size reduction of biomass is an energy-intensive process that warrants improvement to raise the energy efficiency of bio-fuels. Energy consumption for grinding depends on its initial particle size, moisture content, material properties, mass feed rate, and machine variables (Mani et al., 2004a). Performance of a grinding device is often measured in terms of energy consumption, geometric mean diameter, and resulting particle size distribution. Mani et al. (2002) observed that power requirement increased rapidly with decreasing particle size. About 6.2 to 12.5% of the total energy content of hardwood chips was required to grind them to 50 to 100 mesh size (Datta, 1981).
According to Scholten and McEllhiney (1985), hammer mills have achieved merit because of their ability to finely grind a greater variety of materials than any other machine. Himmel et al. (1985) observed that specific milling energy for size reduction of wheat straw using 1.59 mm hammer mill screen was double than 3.18 mm screen. They adopted indirect method of measuring electric power with watt meter and corrected with power factor. Austin and Klimpel (1964) noted that strain energy stored in the material before breaking was converted to energy, other than new surface development energy, such as propagated stress wave energy, kinetic energy of fragments, and plastic deformation energy. Fraction of total energy converted to
3
surface energy will be extremely variable, depending on the operating conditions of mill. It should be noted that the theoretical analyses of size reduction primarily pertains to brittle failure of homogeneous materials, which is not representative of lignocellulosic biomass.
Balk (1964) related hammer mill specific energy to moisture content and feed rate of coastal bermudagrass. Moisture content and grind size influenced the specific energy of it. Datta (1981) reported that size reduction of hardwood chips to 0.2-0.6 mm required 20-40 kWh/Mg, whereas size reduction of particles to 0.15-0.3 mm required five times higher energy (100-200 kWh/Mg). Arthur et al. (1982) found that specific energy consumption of a tub grinder decreased from 749 to 328 kWh/Mg with an increase in screen size from 12.70 to 50.80 mm for rectangular wheat straw bales. They reported wheat straw grinding rate increased from 8.2 to 16.0 Mg/h with an increase in screen size from 12.7 to 50.8 mm. Their indirect measurement of overall energy input rate was based on engine fuel consumption rate and did not take into account energy conversion by an internal combustion engine. Chopped green wood size reduction energy was 80 kWh/Mg using hammer mill using 2500 rpm (Schell and Harwood, 1994). Their energy estimation was based on electric energy measurement. Samson et al. (2000) reported that specific energy consumption of switchgrass hammer milling with 5.6 mm screen was 44.9 kWh/Mg. Jannasch et al. (2001) reported a specific electric energy of 55.9 kWh/Mg for both 5.6 and 2.8 mm screen sizes for hammer mill grinding of switchgrass. Mani et al. (2002, 2004a) found that switchgrass had the highest specific energy requirement (27.6 kWh/Mg) to grind using a laboratory hammer mill, whereas corn stover required less energy (11.0 kWh/Mg) for 3.2 mm screen using the same grinder. They indirectly estimated mechanical power using a wattmeter to monitor an electric motor. Esteban and Carrasco (2006) estimated energy requirements of 85.4, 118.5, and 19.7 kWh/Mg for poplar chips, pine chips, and pine bark, respectively, in a hammer mill using 1.5 mm screen. They also estimated mechanical input energy into the mill from electric voltage and current input to a motor, which included vacuum pressure energy of grinding chamber. Thus, most of the published energy values were based on indirect estimation of fuel or electric energy.
Cadoche and López (1989) tested knife and hammer mills on hardwood chips, agricultural straw and corn stover. Energy consumption to reduce hardwood chips to a particle size of 1.6 mm was 130 kWh/Mg for both hammer and knife mills. The hammer mill required more energy (115 kWh/Mg) than a knife mill (50 kWh/Mg) for 3.2 mm particle size. They observed that agricultural straw and corn stover required 6 to 36% of the energy required for wood. Vigneault et al. (1992) observed a 13.6% saving in specific energy consumption and an increase of 11.1% in grinding rate by using thin hammers (3.18 mm) over thick hammers (6.35 mm) without affecting geometric mean diameter and geometric standard deviation of corn grind. They measured indirect energy using kWh meter. Specific energy of hammer mill grinding of corn increased from 4.6 to 12.9 kWh/Mg for an increase in hammer tip speed from 54 to 86 m/s for 6.35 mm thick hammer (Agriculture Canada, 1971). High speed hammer mills with smaller diameter rotors are good for fine or hard to grind material. At high tip speeds material moves around the mill parallel to the screen surface making the openings only partially effective. At slower speeds material impinges on the screen at a greater angle causing greater amounts of coarser feed to pass through (Bargen et al., 1990).
Nominal biomass particle sizes produced by hammer mill grinding depend on operating factors of the mill. Himmel et al. (1985) observed ground wheat straw retention on 60 mesh screen decreased when hammer mill screen size decreased from 3.18 to 1.59 mm, which indicated skewing of particle size distribution curve to finer sizes. They observed shift of distribution curve toward large sizes of aspen wood when negative pressure was applied to the collection side of mill screen. Negative pressure of 25 mm water increased wheat straw feed rate by 50% without significant increase in power consumption.
4
Particle size distribution of alfalfa forage grinds from hammer mill were fitted with a log-normal distribution equation (Yang et al., 1996). They found that median size and standard deviation were 238µm and 166, respectively. Mani et al. (2004a) determined sieve-based particle size distribution of hammer milled wheat and barley straws, corn stover, and switchgrass and established relationships for bulk density with geometric mean particle size. Particle size distribution of corn stover grind from different hammer mill screens depicted positive skewness in distribution (Mani et al., 2004b). In actual practice, measured geometric mean diameter of biomass particles using sieve analysis is less than the actual size of the particles (Womac et al., 2007). They reported that geometric mean dimensions of actual biomass particles varied from 5x for particle length to 0.3x for particle width for knife milled switchgrass, wheat straw, and corn stover when compared to geometric mean length computed from American Society of Agricultural and Biological Engineers (ASABE) sieve results. Geometric mean dimensions of switchgrass were accurately measured using an image analysis technique as verified with micrometer measurements (Yang et al., 2006). However, sieves have a long history and acceptance in various industries and provide a standardized format for measuring particle sizes, even with published values of offset.
Finding acceptable mathematical functions to describe particle size distribution data may extend the application of empirical data. Rosin and Rammler (1933) stated their equation as a universal law of size distribution valid for all powders, irrespective of the nature of material and the method of grinding. Among at least three common size distribution functions (log-normal, Rosin-Rammler and Gaudin-Schuhmann) tested on different fertilizers, the Rosin-Rammler function was the best function based on an analysis of variance (Perfect and Xu, 1998; Allaire and Parent, 2003). Also, particle size distributions of alginate-pectin microspheres were well fit with the Rosin-Rammler model (Jaya and Durance, 2007).
Little published data provides information on hammer mill specific energy consumption and particle size distribution of switchgrass, wheat straw, and corn stover due to various hammer mill operating factors. Also, size reduction studies on hammer mills equipped with direct measurement of mechanical input energy are scarce in the literature. Hence, the objectives of this research were to determine the direct mechanical input energy for hammer mill size reduction of switchgrass, wheat straw, and corn stover over a range of operating speeds with 90º and 30º hammers, and to evaluate Rosin-Rammler particle size distribution mathematical function for sieve results obtained for ground materials.
Materials and Methods
Biomass Test Material
Switchgrass (Panicum virgatum L.), wheat straw (Triticum aestivum L.), and corn stover (Zea mays L.) were size reduced in a hammer mill. Switchgrass and wheat straw were manually removed from bales (1.00 × 0.45 × 0.35 m) for sample mass determinations. Corn stover was cut into about 150 mm long pieces with arborist pruners. Moisture contents of switchgrass, wheat straw, and corn stover were determined as about 9.0±0.5% wet basis following ASABE Standards for forages (ASABE Standards, 2006a) by oven drying the samples at 103±2ºC for 24 h. Switchgrass and wheat straw had been harvested as hay allowed to dry in a swath prior to baling and then bales were stored indoors for three months. Corn stover was also allowed to field dry after ear harvest and the stover was stored in indoors for three months before experiments. Switchgrass, wheat straw, and corn stover were initially chopped in knife mill with 25.40 mm screen using optimum speed of 250 rpm and optimum feed rates of 7.6, 5.8, and 4.5 kg/min, respectively.
5
Hammer Mill and Operating Variables
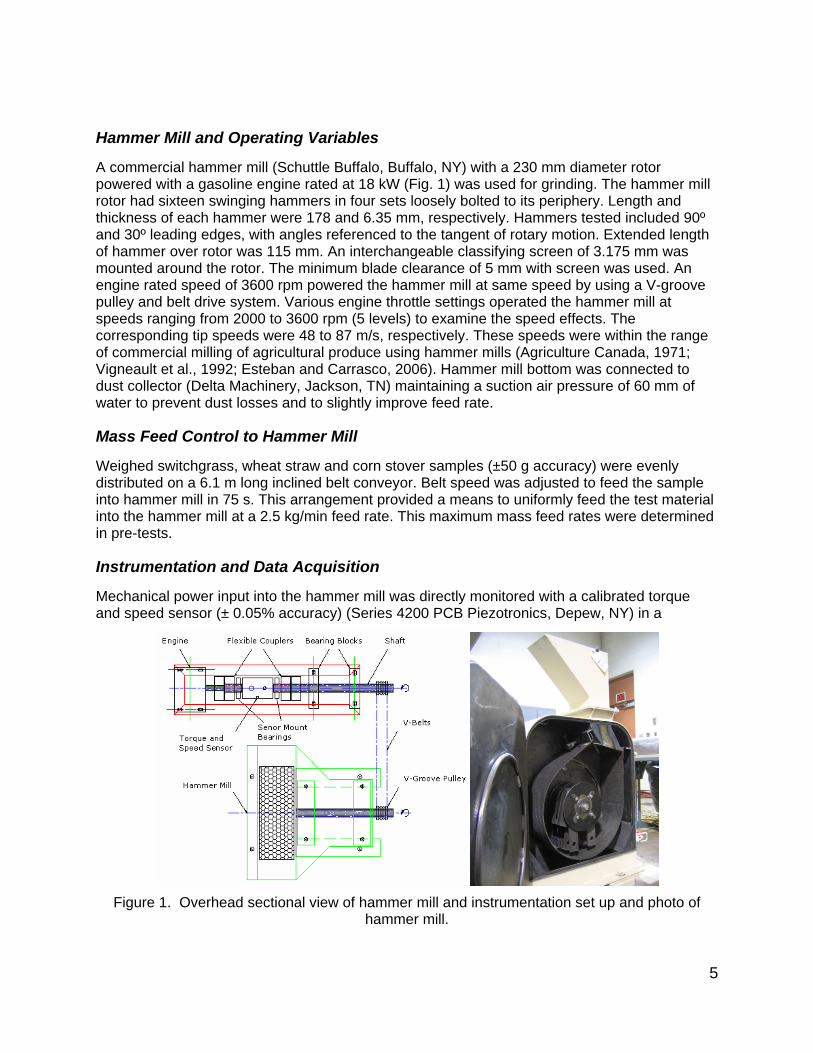
A commercial hammer mill (Schuttle Buffalo, Buffalo, NY) with a 230 mm diameter rotor powered with a gasoline engine rated at 18 kW (Fig. 1) was used for grinding. The hammer mill rotor had sixteen swinging hammers in four sets loosely bolted to its periphery. Length and thickness of each hammer were 178 and 6.35 mm, respectively. Hammers tested included 90º and 30º leading edges, with angles referenced to the tangent of rotary motion. Extended length of hammer over rotor was 115 mm. An interchangeable classifying screen of 3.175 mm was mounted around the rotor. The minimum blade clearance of 5 mm with screen was used. An engine rated speed of 3600 rpm powered the hammer mill at same speed by using a V-groove pulley and belt drive system. Various engine throttle settings operated the hammer mill at speeds ranging from 2000 to 3600 rpm (5 levels) to examine the speed effects. The corresponding tip speeds were 48 to 87 m/s, respectively. These speeds were within the range of commercial milling of agricultural produce using hammer mills (Agriculture Canada, 1971; Vigneault et al., 1992; Esteban and Carrasco, 2006). Hammer mill bottom was connected to dust collector (Delta Machinery, Jackson, TN) maintaining a suction air pressure of 60 mm of water to prevent dust losses and to slightly improve feed rate.
Mass Feed Control to Hammer Mill
Weighed switchgrass, wheat straw and corn stover samples (±50 g accuracy) were evenly distributed on a 6.1 m long inclined belt conveyor. Belt speed was adjusted to feed the sample into hammer mill in 75 s. This arrangement provided a means to uniformly feed the test material into the hammer mill at a 2.5 kg/min feed rate. This maximum mass feed rates were determined in pre-tests.
Instrumentation and Data Acquisition
Mechanical power input into the hammer mill was directly monitored with a calibrated torque and speed sensor (± 0.05% accuracy) (Series 4200 PCB Piezotronics, Depew, NY) in a
Figure 1. Overhead sectional view of hammer mill and instrumentation set up and photo of
hammer mill.
6
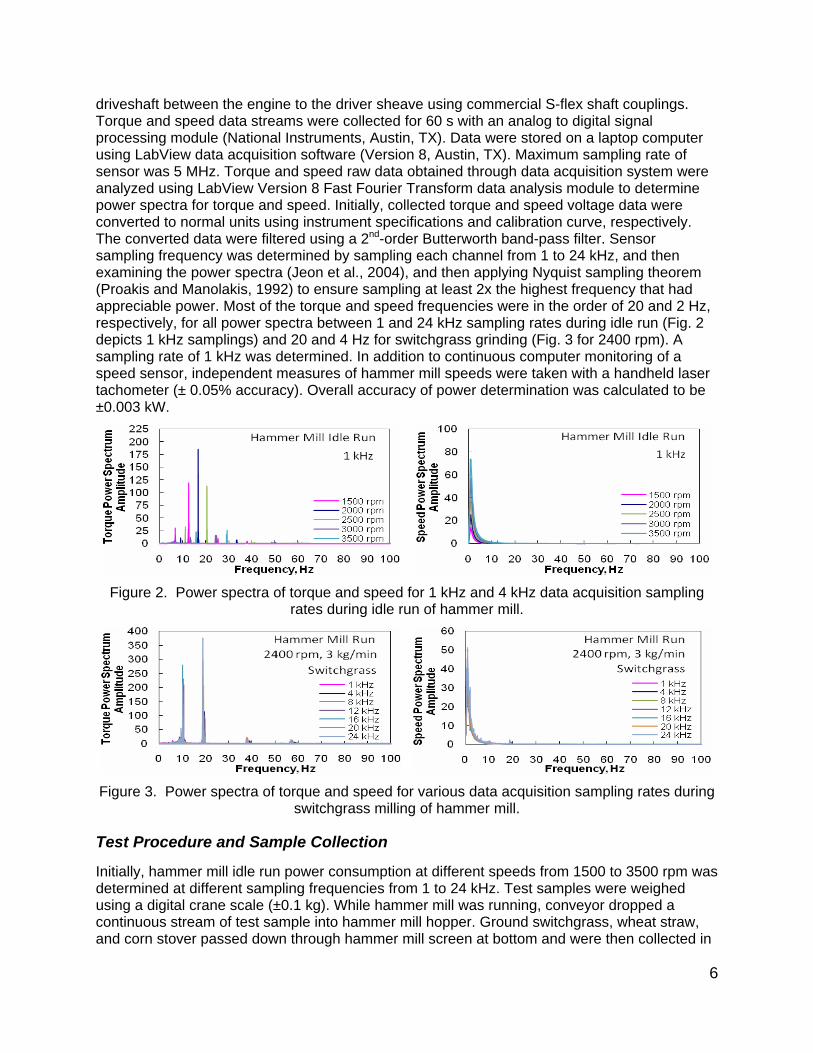
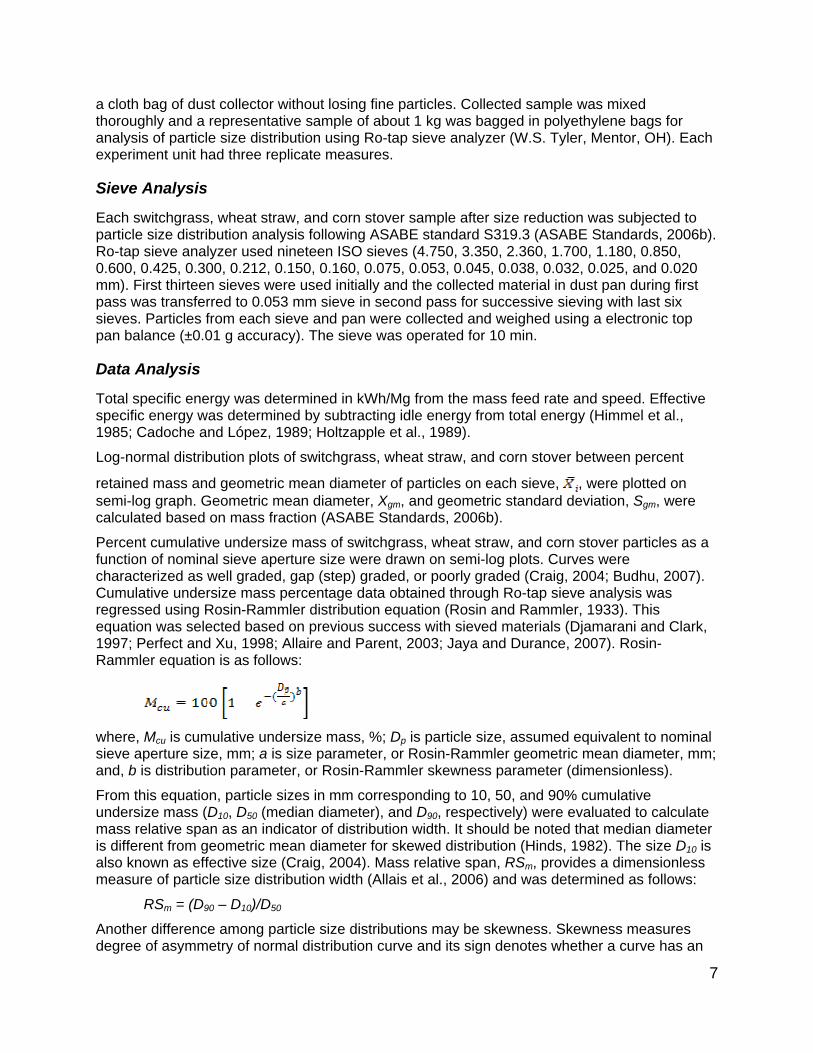
driveshaft between the engine to the driver sheave using commercial S-flex shaft couplings. Torque and speed data streams were collected for 60 s with an analog to digital signal processing module (National Instruments, Austin, TX). Data were stored on a laptop computer using LabView data acquisition software (Version 8, Austin, TX). Maximum sampling rate of sensor was 5 MHz. Torque and speed raw data obtained through data acquisition system were analyzed using LabView Version 8 Fast Fourier Transform data analysis module to determine power spectra for torque and speed. Initially, collected torque and speed voltage data were converted to normal units using instrument specifications and calibration curve, respectively. The converted data were filtered using a 2nd-order Butterworth band-pass filter. Sensor sampling frequency was determined by sampling each channel from 1 to 24 kHz, and then examining the power spectra (Jeon et al., 2004), and then applying Nyquist sampling theorem (Proakis and Manolakis, 1992) to ensure sampling at least 2x the highest frequency that had appreciable power. Most of the torque and speed frequencies were in the order of 20 and 2 Hz, respectively, for all power spectra between 1 and 24 kHz sampling rates during idle run (Fig. 2 depicts 1 kHz samplings) and 20 and 4 Hz for switchgrass grinding (Fig. 3 for 2400 rpm). A sampling rate of 1 kHz was determined. In addition to continuous computer monitoring of a speed sensor, independent measures of hammer mill speeds were taken with a handheld laser tachometer (± 0.05% accuracy). Overall accuracy of power determination was calculated to be ±0.003 kW.
Figure 2. Power spectra of torque and speed for 1 kHz and 4 kHz data acquisition sampling
rates during idle run of hammer mill.
Figure 3. Power spectra of torque and speed for various data acquisition sampling rates during
switchgrass milling of hammer mill.
Test Procedure and Sample Collection
Initially, hammer mill idle run power consumption at different speeds from 1500 to 3500 rpm was determined at different sampling frequencies from 1 to 24 kHz. Test samples were weighed using a digital crane scale (±0.1 kg). While hammer mill was running, conveyor dropped a continuous stream of test sample into hammer mill hopper. Ground switchgrass, wheat straw, and corn stover passed down through hammer mill screen at bottom and were then collected in
7
a cloth bag of dust collector without losing fine particles. Collected sample was mixed thoroughly and a representative sample of about 1 kg was bagged in polyethylene bags for analysis of particle size distribution using Ro-tap sieve analyzer (W.S. Tyler, Mentor, OH). Each experiment unit had three replicate measures.
Sieve Analysis
Each switchgrass, wheat straw, and corn stover sample after size reduction was subjected to particle size distribution analysis following ASABE standard S319.3 (ASABE Standards, 2006b). Ro-tap sieve analyzer used nineteen ISO sieves (4.750, 3.350, 2.360, 1.700, 1.180, 0.850, 0.600, 0.425, 0.300, 0.212, 0.150, 0.160, 0.075, 0.053, 0.045, 0.038, 0.032, 0.025, and 0.020 mm). First thirteen sieves were used initially and the collected material in dust pan during first pass was transferred to 0.053 mm sieve in second pass for successive sieving with last six sieves. Particles from each sieve and pan were collected and weighed using a electronic top pan balance (±0.01 g accuracy). The sieve was operated for 10 min.
Data Analysis
Total specific energy was determined in kWh/Mg from the mass feed rate and speed. Effective specific energy was determined by subtracting idle energy from total energy (Himmel et al., 1985; Cadoche and López, 1989; Holtzapple et al., 1989).
Log-normal distribution plots of switchgrass, wheat straw, and corn stover between percent
retained mass and geometric mean diameter of particles on each sieve, , were plotted on semi-log graph. Geometric mean diameter, Xgm, and geometric standard deviation, Sgm, were calculated based on mass fraction (ASABE Standards, 2006b).
Percent cumulative undersize mass of switchgrass, wheat straw, and corn stover particles as a function of nominal sieve aperture size were drawn on semi-log plots. Curves were characterized as well graded, gap (step) graded, or poorly graded (Craig, 2004; Budhu, 2007). Cumulative undersize mass percentage data obtained through Ro-tap sieve analysis was regressed using Rosin-Rammler distribution equation (Rosin and Rammler, 1933). This equation was selected based on previous success with sieved materials (Djamarani and Clark, 1997; Perfect and Xu, 1998; Allaire and Parent, 2003; Jaya and Durance, 2007). Rosin-Rammler equation is as follows:
where, Mcu is cumulative undersize mass, %; Dp is particle size, assumed equivalent to nominal sieve aperture size, mm; a is size parameter, or Rosin-Rammler geometric mean diameter, mm; and, b is distribution parameter, or Rosin-Rammler skewness parameter (dimensionless).
From this equation, particle sizes in mm corresponding to 10, 50, and 90% cumulative undersize mass (D10, D50 (median diameter), and D90, respectively) were evaluated to calculate mass relative span as an indicator of distribution width. It should be noted that median diameter is different from geometric mean diameter for skewed distribution (Hinds, 1982). The size D10 is also known as effective size (Craig, 2004). Mass relative span, RSm, provides a dimensionless measure of particle size distribution width (Allais et al., 2006) and was determined as follows:
RSm = (D90 – D10)/D50
Another difference among particle size distributions may be skewness. Skewness measures degree of asymmetry of normal distribution curve and its sign denotes whether a curve has an
8
asymmetrical tail on its left or right when distribution is plotted versus particle size. Inclusive graphic skewness and graphic kurtosis were calculated from procedure stated by Folk (1974).
Generally, uniformity index and size guide number of particle size distribution are determined using the procedure of Canadian Fertilizer Institute (CFI, 1982). Uniformity index is the ratio of particle sizes ‘small’ (D5) to ‘large’ (D95) in the product, expressed in percentage. Size guide number is the median dimension expressed in mm to the second decimal and then multiplied by 100 (CFI, 1982). These calculations are prone to positive and negative errors due to linear interpolation (Perfect and Xu, 1998). Due to this limitation, uniformity index was assessed from equation of Perfect and Xu (1998) from Rosin-Rammler equation. Median diameter of Rosin-Rammler equation multiplied by 100 gave size guide number. Coefficient of uniformity and coefficient of gradation of particle size distribution were evaluated as stayed by Craig (2004). Distribution geometric standard deviation of higher region (between D84 and D50), geometric standard deviation of lower region (between D16 and D50), and geometric standard deviation of the total region (between D84 and D16) were determined as per Hinds (1982).
SAS ANOVA procedure (SAS, 2004) was used for mean separation. Pearson correlation coefficients among hammer type, mill speed, total and effective energy, geometric mean diameter, geometric standard deviation, Rosin-Rammler parameters, median diameter, effective size, mass relative span, inclusive graphic skewness, graphic kurtosis, uniformity index, uniformity coefficient, and distribution geometric standard deviation were determined using PROC CORR procedure in SAS (SAS, 2004).
Results and Discussion
Hammer Mill Idle Power Consumption
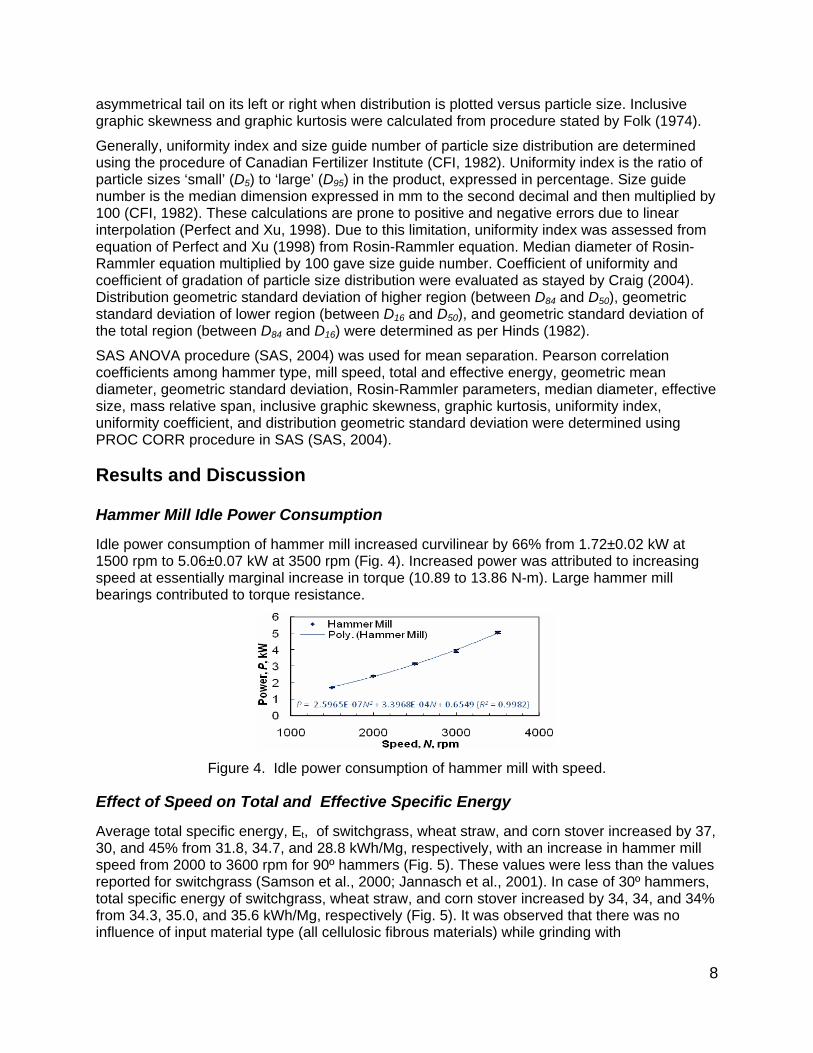
Idle power consumption of hammer mill increased curvilinear by 66% from 1.72±0.02 kW at 1500 rpm to 5.06±0.07 kW at 3500 rpm (Fig. 4). Increased power was attributed to increasing speed at essentially marginal increase in torque (10.89 to 13.86 N-m). Large hammer mill bearings contributed to torque resistance.
Figure 4. Idle power consumption of hammer mill with speed.
Effect of Speed on Total and Effective Specific Energy
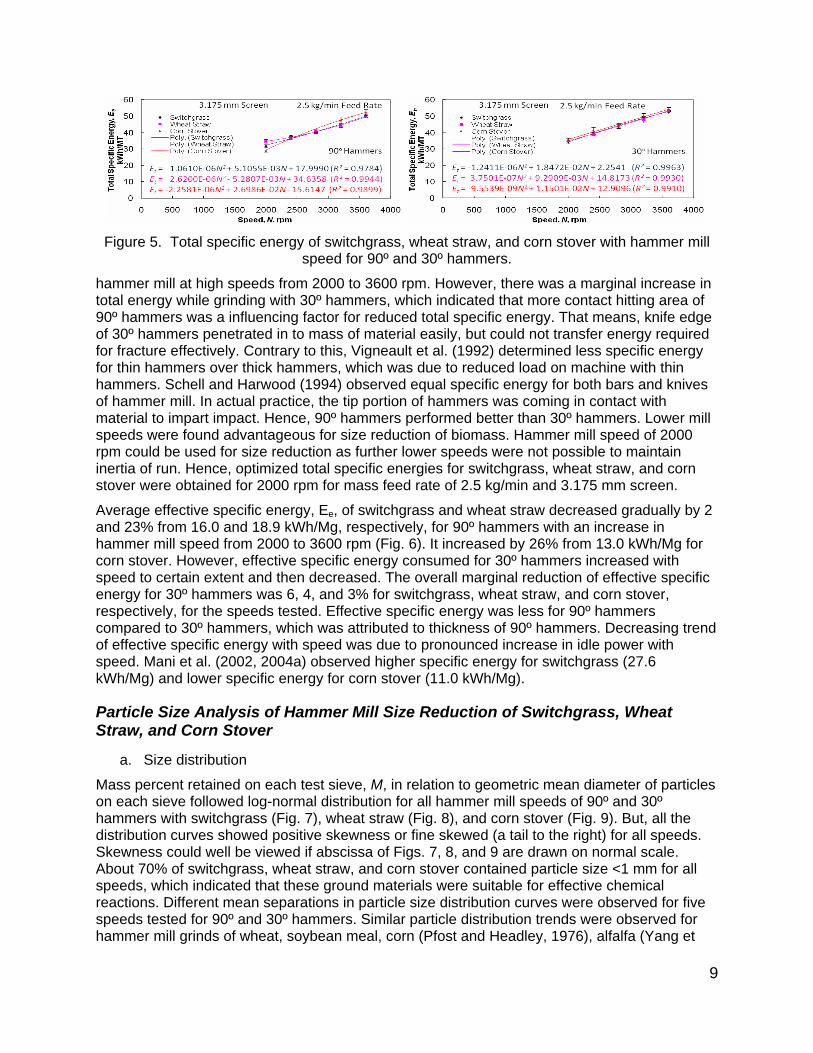
Average total specific energy, Et, of switchgrass, wheat straw, and corn stover increased by 37, 30, and 45% from 31.8, 34.7, and 28.8 kWh/Mg, respectively, with an increase in hammer mill speed from 2000 to 3600 rpm for 90º hammers (Fig. 5). These values were less than the values reported for switchgrass (Samson et al., 2000; Jannasch et al., 2001). In case of 30º hammers, total specific energy of switchgrass, wheat straw, and corn stover increased by 34, 34, and 34% from 34.3, 35.0, and 35.6 kWh/Mg, respectively (Fig. 5). It was observed that there was no influence of input material type (all cellulosic fibrous materials) while grinding with
9
Figure 5. Total specific energy of switchgrass, wheat straw, and corn stover with hammer mill
speed for 90º and 30º hammers.
hammer mill at high speeds from 2000 to 3600 rpm. However, there was a marginal increase in total energy while grinding with 30º hammers, which indicated that more contact hitting area of 90º hammers was a influencing factor for reduced total specific energy. That means, knife edge of 30º hammers penetrated in to mass of material easily, but could not transfer energy required for fracture effectively. Contrary to this, Vigneault et al. (1992) determined less specific energy for thin hammers over thick hammers, which was due to reduced load on machine with thin hammers. Schell and Harwood (1994) observed equal specific energy for both bars and knives of hammer mill. In actual practice, the tip portion of hammers was coming in contact with material to impart impact. Hence, 90º hammers performed better than 30º hammers. Lower mill speeds were found advantageous for size reduction of biomass. Hammer mill speed of 2000 rpm could be used for size reduction as further lower speeds were not possible to maintain inertia of run. Hence, optimized total specific energies for switchgrass, wheat straw, and corn stover were obtained for 2000 rpm for mass feed rate of 2.5 kg/min and 3.175 mm screen.
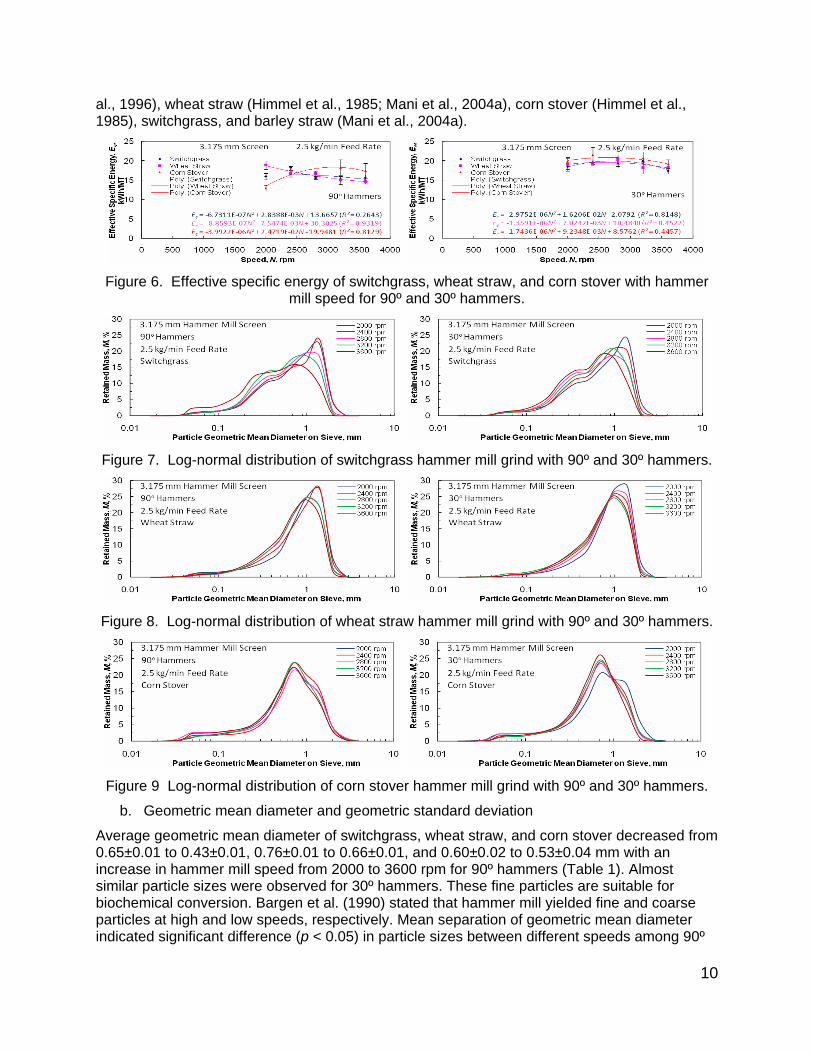
Average effective specific energy, Ee, of switchgrass and wheat straw decreased gradually by 2 and 23% from 16.0 and 18.9 kWh/Mg, respectively, for 90º hammers with an increase in hammer mill speed from 2000 to 3600 rpm (Fig. 6). It increased by 26% from 13.0 kWh/Mg for corn stover. However, effective specific energy consumed for 30º hammers increased with speed to certain extent and then decreased. The overall marginal reduction of effective specific energy for 30º hammers was 6, 4, and 3% for switchgrass, wheat straw, and corn stover, respectively, for the speeds tested. Effective specific energy was less for 90º hammers compared to 30º hammers, which was attributed to thickness of 90º hammers. Decreasing trend of effective specific energy with speed was due to pronounced increase in idle power with speed. Mani et al. (2002, 2004a) observed higher specific energy for switchgrass (27.6 kWh/Mg) and lower specific energy for corn stover (11.0 kWh/Mg).
Particle Size Analysis of Hammer Mill Size Reduction of Switchgrass, Wheat Straw, and Corn Stover
a. Size distribution
Mass percent retained on each test sieve, M, in relation to geometric mean diameter of particles on each sieve followed log-normal distribution for all hammer mill speeds of 90º and 30º hammers with switchgrass (Fig. 7), wheat straw (Fig. 8), and corn stover (Fig. 9). But, all the distribution curves showed positive skewness or fine skewed (a tail to the right) for all speeds. Skewness could well be viewed if abscissa of Figs. 7, 8, and 9 are drawn on normal scale. About 70% of switchgrass, wheat straw, and corn stover contained particle size <1 mm for all speeds, which indicated that these ground materials were suitable for effective chemical reactions. Different mean separations in particle size distribution curves were observed for five speeds tested for 90º and 30º hammers. Similar particle distribution trends were observed for hammer mill grinds of wheat, soybean meal, corn (Pfost and Headley, 1976), alfalfa (Yang et
10
al., 1996), wheat straw (Himmel et al., 1985; Mani et al., 2004a), corn stover (Himmel et al., 1985), switchgrass, and barley straw (Mani et al., 2004a).
Figure 6. Effective specific energy of switchgrass, wheat straw, and corn stover with hammer
mill speed for 90º and 30º hammers.
Figure 7. Log-normal distribution of switchgrass hammer mill grind with 90º and 30º hammers.
Figure 8. Log-normal distribution of wheat straw hammer mill grind with 90º and 30º hammers.
Figure 9 Log-normal distribution of corn stover hammer mill grind with 90º and 30º hammers.
b. Geometric mean diameter and geometric standard deviation
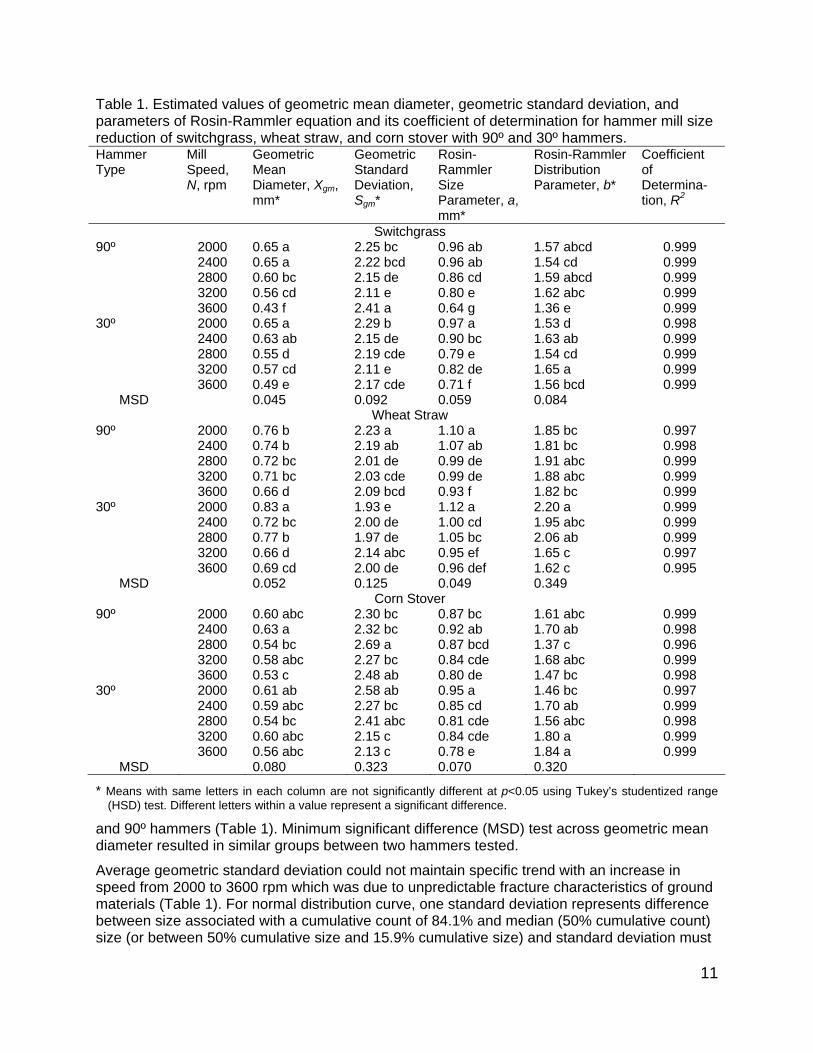
Average geometric mean diameter of switchgrass, wheat straw, and corn stover decreased from 0.65±0.01 to 0.43±0.01, 0.76±0.01 to 0.66±0.01, and 0.60±0.02 to 0.53±0.04 mm with an increase in hammer mill speed from 2000 to 3600 rpm for 90º hammers (Table 1). Almost similar particle sizes were observed for 30º hammers. These fine particles are suitable for biochemical conversion. Bargen et al. (1990) stated that hammer mill yielded fine and coarse particles at high and low speeds, respectively. Mean separation of geometric mean diameter indicated significant difference (p < 0.05) in particle sizes between different speeds among 90º
11
Table 1. Estimated values of geometric mean diameter, geometric standard deviation, and parameters of Rosin-Rammler equation and its coefficient of determination for hammer mill size reduction of switchgrass, wheat straw, and corn stover with 90º and 30º hammers. Hammer Type
Mill Speed, N, rpm
Geometric Mean Diameter, Xgm, mm*
Geometric Standard Deviation, Sgm*
Rosin-Rammler Size Parameter, a, mm*
Rosin-Rammler Distribution Parameter, b*
Coefficient of Determina-tion, R2
Switchgrass 90º 2000 0.65 a 2.25 bc 0.96 ab 1.57 abcd 0.999
2400 0.65 a 2.22 bcd 0.96 ab 1.54 cd 0.999 2800 0.60 bc 2.15 de 0.86 cd 1.59 abcd 0.999 3200 0.56 cd 2.11 e 0.80 e 1.62 abc 0.999 3600 0.43 f 2.41 a 0.64 g 1.36 e 0.999
30º 2000 0.65 a 2.29 b 0.97 a 1.53 d 0.998 2400 0.63 ab 2.15 de 0.90 bc 1.63 ab 0.999 2800 0.55 d 2.19 cde 0.79 e 1.54 cd 0.999 3200 0.57 cd 2.11 e 0.82 de 1.65 a 0.999 3600 0.49 e 2.17 cde 0.71 f 1.56 bcd 0.999
MSD 0.045 0.092 0.059 0.084 Wheat Straw
90º 2000 0.76 b 2.23 a 1.10 a 1.85 bc 0.997 2400 0.74 b 2.19 ab 1.07 ab 1.81 bc 0.998 2800 0.72 bc 2.01 de 0.99 de 1.91 abc 0.999 3200 0.71 bc 2.03 cde 0.99 de 1.88 abc 0.999 3600 0.66 d 2.09 bcd 0.93 f 1.82 bc 0.999
30º 2000 0.83 a 1.93 e 1.12 a 2.20 a 0.999 2400 0.72 bc 2.00 de 1.00 cd 1.95 abc 0.999 2800 0.77 b 1.97 de 1.05 bc 2.06 ab 0.999 3200 0.66 d 2.14 abc 0.95 ef 1.65 c 0.997 3600 0.69 cd 2.00 de 0.96 def 1.62 c 0.995
MSD 0.052 0.125 0.049 0.349 Corn Stover
90º 2000 0.60 abc 2.30 bc 0.87 bc 1.61 abc 0.999 2400 0.63 a 2.32 bc 0.92 ab 1.70 ab 0.998 2800 0.54 bc 2.69 a 0.87 bcd 1.37 c 0.996 3200 0.58 abc 2.27 bc 0.84 cde 1.68 abc 0.999 3600 0.53 c 2.48 ab 0.80 de 1.47 bc 0.998
30º 2000 0.61 ab 2.58 ab 0.95 a 1.46 bc 0.997 2400 0.59 abc 2.27 bc 0.85 cd 1.70 ab 0.999 2800 0.54 bc 2.41 abc 0.81 cde 1.56 abc 0.998 3200 0.60 abc 2.15 c 0.84 cde 1.80 a 0.999 3600 0.56 abc 2.13 c 0.78 e 1.84 a 0.999
MSD 0.080 0.323 0.070 0.320
* Means with same letters in each column are not significantly different at p<0.05 using Tukey’s studentized range (HSD) test. Different letters within a value represent a significant difference.
and 90º hammers (Table 1). Minimum significant difference (MSD) test across geometric mean diameter resulted in similar groups between two hammers tested.
Average geometric standard deviation could not maintain specific trend with an increase in speed from 2000 to 3600 rpm which was due to unpredictable fracture characteristics of ground materials (Table 1). For normal distribution curve, one standard deviation represents difference between size associated with a cumulative count of 84.1% and median (50% cumulative count) size (or between 50% cumulative size and 15.9% cumulative size) and standard deviation must
12
always be greater than or equal to 1.0 (Hinds, 1982) (Table 1). Higher standard deviation than 1.0 represented wider distribution of particles. Mean separation of geometric standard deviation indicated similar and coherent groups (Table 1).
c. Cumulative size distribution
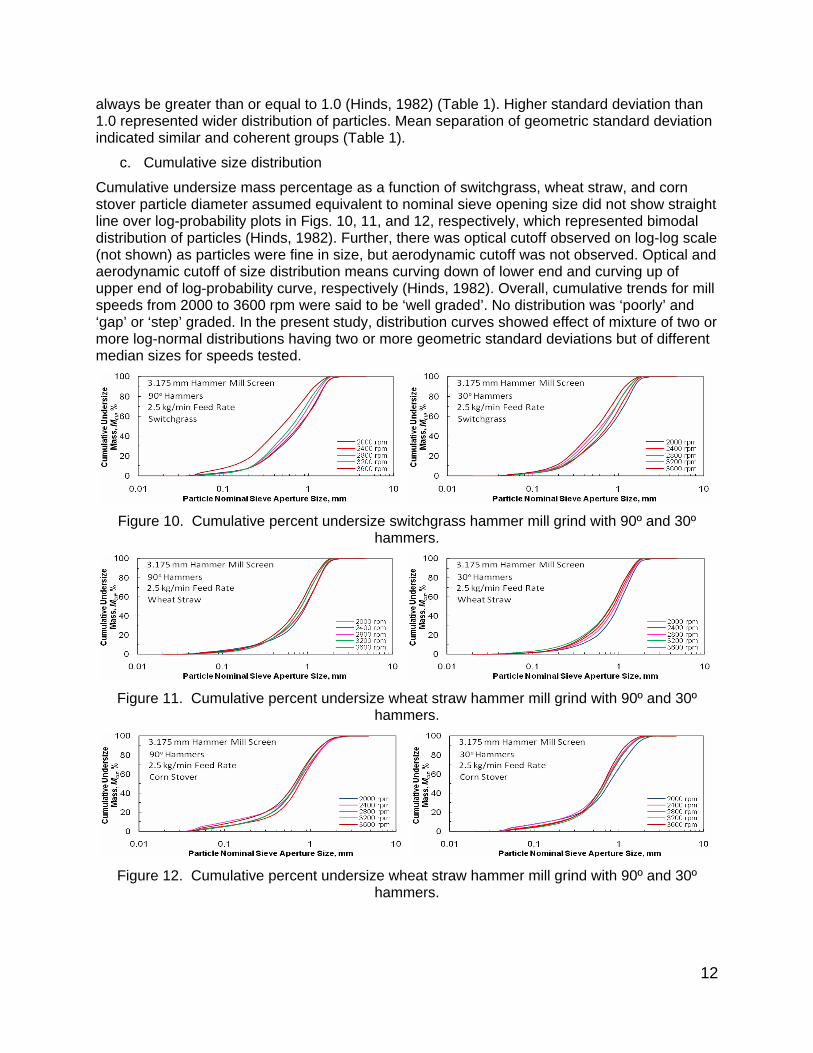
Cumulative undersize mass percentage as a function of switchgrass, wheat straw, and corn stover particle diameter assumed equivalent to nominal sieve opening size did not show straight line over log-probability plots in Figs. 10, 11, and 12, respectively, which represented bimodal distribution of particles (Hinds, 1982). Further, there was optical cutoff observed on log-log scale (not shown) as particles were fine in size, but aerodynamic cutoff was not observed. Optical and aerodynamic cutoff of size distribution means curving down of lower end and curving up of upper end of log-probability curve, respectively (Hinds, 1982). Overall, cumulative trends for mill speeds from 2000 to 3600 rpm were said to be ‘well graded’. No distribution was ‘poorly’ and ‘gap’ or ‘step’ graded. In the present study, distribution curves showed effect of mixture of two or more log-normal distributions having two or more geometric standard deviations but of different median sizes for speeds tested.
Figure 10. Cumulative percent undersize switchgrass hammer mill grind with 90º and 30º
hammers.
Figure 11. Cumulative percent undersize wheat straw hammer mill grind with 90º and 30º
hammers.
Figure 12. Cumulative percent undersize wheat straw hammer mill grind with 90º and 30º
hammers.
13
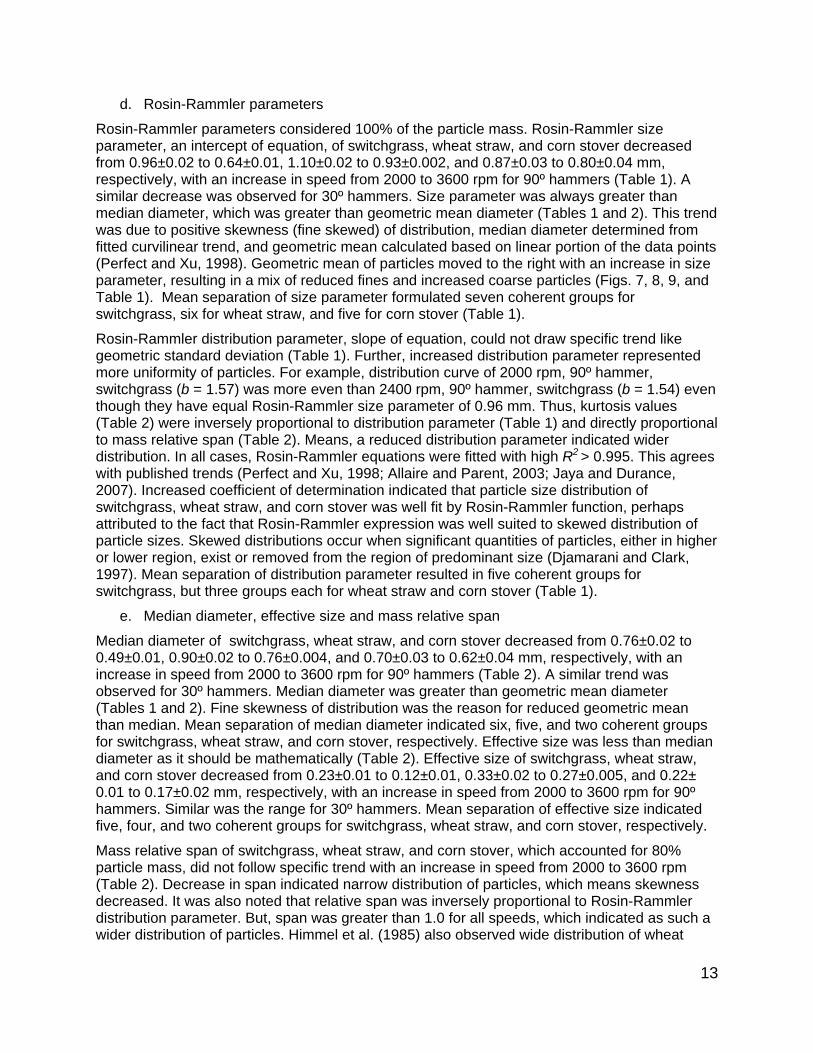
d. Rosin-Rammler parameters
Rosin-Rammler parameters considered 100% of the particle mass. Rosin-Rammler size parameter, an intercept of equation, of switchgrass, wheat straw, and corn stover decreased from 0.96±0.02 to 0.64±0.01, 1.10±0.02 to 0.93±0.002, and 0.87±0.03 to 0.80±0.04 mm, respectively, with an increase in speed from 2000 to 3600 rpm for 90º hammers (Table 1). A similar decrease was observed for 30º hammers. Size parameter was always greater than median diameter, which was greater than geometric mean diameter (Tables 1 and 2). This trend was due to positive skewness (fine skewed) of distribution, median diameter determined from fitted curvilinear trend, and geometric mean calculated based on linear portion of the data points (Perfect and Xu, 1998). Geometric mean of particles moved to the right with an increase in size parameter, resulting in a mix of reduced fines and increased coarse particles (Figs. 7, 8, 9, and Table 1). Mean separation of size parameter formulated seven coherent groups for switchgrass, six for wheat straw, and five for corn stover (Table 1).
Rosin-Rammler distribution parameter, slope of equation, could not draw specific trend like geometric standard deviation (Table 1). Further, increased distribution parameter represented more uniformity of particles. For example, distribution curve of 2000 rpm, 90º hammer, switchgrass (b = 1.57) was more even than 2400 rpm, 90º hammer, switchgrass (b = 1.54) even though they have equal Rosin-Rammler size parameter of 0.96 mm. Thus, kurtosis values (Table 2) were inversely proportional to distribution parameter (Table 1) and directly proportional to mass relative span (Table 2). Means, a reduced distribution parameter indicated wider distribution. In all cases, Rosin-Rammler equations were fitted with high R2 > 0.995. This agrees with published trends (Perfect and Xu, 1998; Allaire and Parent, 2003; Jaya and Durance, 2007). Increased coefficient of determination indicated that particle size distribution of switchgrass, wheat straw, and corn stover was well fit by Rosin-Rammler function, perhaps attributed to the fact that Rosin-Rammler expression was well suited to skewed distribution of particle sizes. Skewed distributions occur when significant quantities of particles, either in higher or lower region, exist or removed from the region of predominant size (Djamarani and Clark, 1997). Mean separation of distribution parameter resulted in five coherent groups for switchgrass, but three groups each for wheat straw and corn stover (Table 1).
e. Median diameter, effective size and mass relative span
Median diameter of switchgrass, wheat straw, and corn stover decreased from 0.76±0.02 to 0.49±0.01, 0.90±0.02 to 0.76±0.004, and 0.70±0.03 to 0.62±0.04 mm, respectively, with an increase in speed from 2000 to 3600 rpm for 90º hammers (Table 2). A similar trend was observed for 30º hammers. Median diameter was greater than geometric mean diameter (Tables 1 and 2). Fine skewness of distribution was the reason for reduced geometric mean than median. Mean separation of median diameter indicated six, five, and two coherent groups for switchgrass, wheat straw, and corn stover, respectively. Effective size was less than median diameter as it should be mathematically (Table 2). Effective size of switchgrass, wheat straw, and corn stover decreased from 0.23±0.01 to 0.12±0.01, 0.33±0.02 to 0.27±0.005, and 0.22± 0.01 to 0.17±0.02 mm, respectively, with an increase in speed from 2000 to 3600 rpm for 90º hammers. Similar was the range for 30º hammers. Mean separation of effective size indicated five, four, and two coherent groups for switchgrass, wheat straw, and corn stover, respectively.
Mass relative span of switchgrass, wheat straw, and corn stover, which accounted for 80% particle mass, did not follow specific trend with an increase in speed from 2000 to 3600 rpm (Table 2). Decrease in span indicated narrow distribution of particles, which means skewness decreased. It was also noted that relative span was inversely proportional to Rosin-Rammler distribution parameter. But, span was greater than 1.0 for all speeds, which indicated as such a wider distribution of particles. Himmel et al. (1985) also observed wide distribution of wheat

14
straw grind and aspen chips prepared with small size screens. Mean separation of span indicated uniformly size distributed particles which were differently sized with more or less similar weight fractions retained on each sieve. It formed four, two, and three coherent groups for switchgrass, wheat straw, and corn stover, respectively.
Table 2. Median diameter, effective size, mass relative span, inclusive graphic skewness, and graphic kurtosis for hammer mill size reduction of switchgrass, wheat straw, and corn stover with 90º and 30º hammers. Hammer Type
Mill Speed, N, rpm
Median Diameter, D50, mm*
Effective Size, D10, mm*
Mass Relative Span, RSm*
Inclusive Graphic Skewness, GSi*
Graphic Kurtosis, Kg*
Switchgrass 90º 2000 0.76 a 0.23 a 1.85 bcd 0.25 bcd 0.98 bcd
2400 0.75 a 0.22 ab 1.89 bc 0.26 bc 0.98 bc 2800 0.69 bc 0.21 abc 1.82 bcd 0.24 bcd 0.98 bcd 3200 0.64 cd 0.20 bc 1.79 cd 0.24 cd 0.98 bcd 3600 0.49 f 0.12 e 2.17 a 0.32 a 1.00 a
30º 2000 0.76 a 0.22 ab 1.90 b 0.26 b 0.98 b 2400 0.72 ab 0.23 a 1.78 d 0.23 d 0.97 cd 2800 0.63 d 0.18 dc 1.89 bc 0.26 bc 0.98 bc 3200 0.65 cd 0.21 abc 1.76 d 0.23 d 0.97 d 3600 0.56 e 0.17 d 1.86 bcd 0.25 bcd 0.98 bcd
MSD 0.053 0.028 0.110 0.023 0.007 Wheat Straw
90º 2000 0.90 ab 0.33 bc 1.56 ab 0.18 ab 0.97 ab 2400 0.88 bc 0.31 bcd 1.59 ab 0.19 ab 0.97 ab 2800 0.82 d 0.31 bcd 1.50 ab 0.17 ab 0.96 ab 3200 0.82 d 0.30 bcd 1.52 ab 0.18 ab 0.96 ab 3600 0.76 e 0.27 cd 1.58 ab 0.19 ab 0.97 ab
30º 2000 0.95 a 0.40 a 1.30 b 0.12 b 0.96 b 2400 0.83 cd 0.32 bc 1.47 ab 0.16 ab 0.96 ab 2800 0.88 bc 0.35 ab 1.39 b 0.14 b 0.96 b 3200 0.76 e 0.24 d 1.77 a 0.23 a 0.98 ab 3600 0.76 e 0.24 d 1.83 a 0.24 a 0.98 a
MSD 0.055 0.074 0.371 0.083 0.019 Corn Stover
90º 2000 0.70 ab 0.22 ab 1.80 abc 0.24 abc 0.98 bc 2400 0.74 a 0.25 a 1.70 bc 0.22 bc 0.97 bc 2800 0.66 b 0.17 b 2.17 a 0.31 a 1.00 a 3200 0.67 ab 0.22 ab 1.72 bc 0.22 bc 0.97 bc 3600 0.62 b 0.17 b 1.99 ab 0.28 ab 0.99 abc
30º 2000 0.74 a 0.20 ab 2.01 ab 0.28 ab 0.99 ab 2400 0.68 ab 0.23 ab 1.70 bc 0.22 bc 0.97 bc 2800 0.64 b 0.19 ab 1.86 abc 0.25 abc 0.98 abc 3200 0.69 ab 0.24 a 1.61 c 0.20 c 0.97 bc 3600 0.64 b 0.23 ab 1.57 c 0.19 c 0.97 c
MSD 0.074 0.066 0.377 0.081 0.022 * Means with same letters in each column are not significantly different at p<0.05 using Tukey’s studentized range
(HSD) test. Different letters within a value represent a significant difference.
f. Skewness and kurtosis
Of particular interest, hammer mill speeds determined characteristic shapes in particle spectra curves (Figs. 7, 8, 9). Inclusive graphic skewness values of switchgrass, wheat straw, and corn stover could not show specific trend with an increase in speed from 2000 to 3600 rpm (Table 2).
15
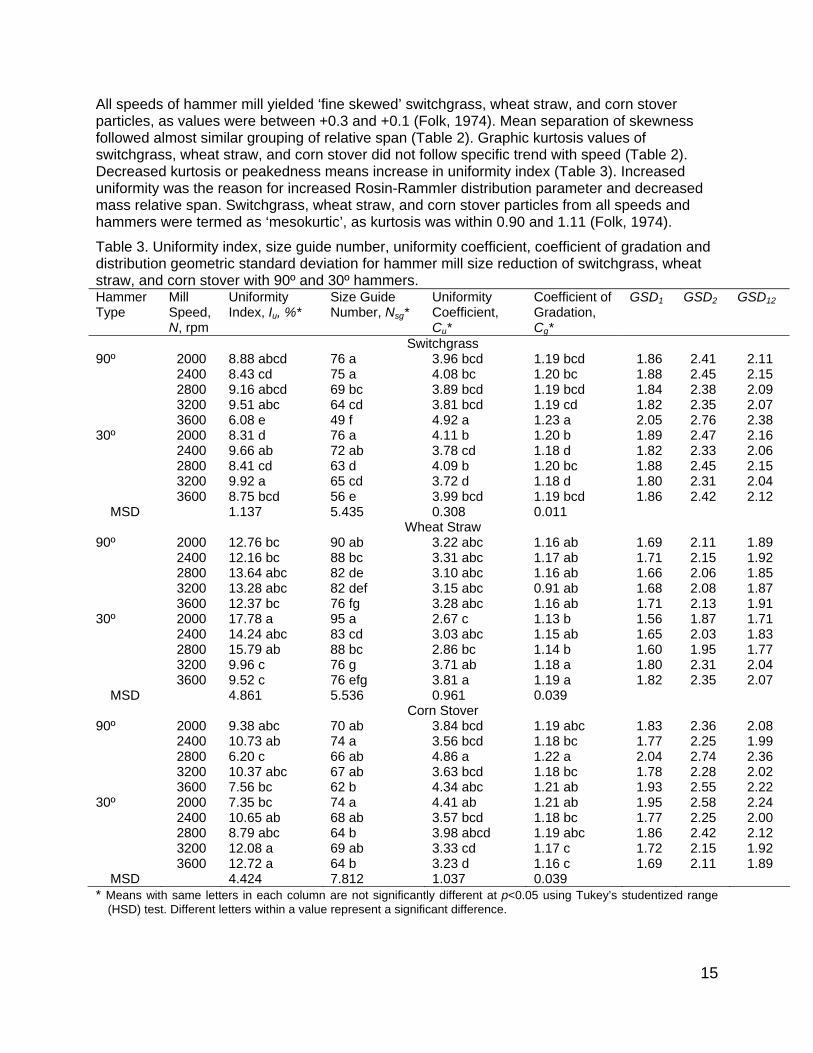
All speeds of hammer mill yielded ‘fine skewed’ switchgrass, wheat straw, and corn stover particles, as values were between +0.3 and +0.1 (Folk, 1974). Mean separation of skewness followed almost similar grouping of relative span (Table 2). Graphic kurtosis values of switchgrass, wheat straw, and corn stover did not follow specific trend with speed (Table 2). Decreased kurtosis or peakedness means increase in uniformity index (Table 3). Increased uniformity was the reason for increased Rosin-Rammler distribution parameter and decreased mass relative span. Switchgrass, wheat straw, and corn stover particles from all speeds and hammers were termed as ‘mesokurtic’, as kurtosis was within 0.90 and 1.11 (Folk, 1974).
Table 3. Uniformity index, size guide number, uniformity coefficient, coefficient of gradation and distribution geometric standard deviation for hammer mill size reduction of switchgrass, wheat straw, and corn stover with 90º and 30º hammers. Hammer Type
Mill Speed, N, rpm
Uniformity Index, Iu, %*
Size Guide Number, Nsg*
Uniformity Coefficient, Cu*
Coefficient of Gradation, Cg*
GSD1 GSD2 GSD12
Switchgrass 90º 2000 8.88 abcd 76 a 3.96 bcd 1.19 bcd 1.86 2.41 2.11
2400 8.43 cd 75 a 4.08 bc 1.20 bc 1.88 2.45 2.15 2800 9.16 abcd 69 bc 3.89 bcd 1.19 bcd 1.84 2.38 2.09 3200 9.51 abc 64 cd 3.81 bcd 1.19 cd 1.82 2.35 2.07 3600 6.08 e 49 f 4.92 a 1.23 a 2.05 2.76 2.38
30º 2000 8.31 d 76 a 4.11 b 1.20 b 1.89 2.47 2.16 2400 9.66 ab 72 ab 3.78 cd 1.18 d 1.82 2.33 2.06 2800 8.41 cd 63 d 4.09 b 1.20 bc 1.88 2.45 2.15 3200 9.92 a 65 cd 3.72 d 1.18 d 1.80 2.31 2.04 3600 8.75 bcd 56 e 3.99 bcd 1.19 bcd 1.86 2.42 2.12
MSD 1.137 5.435 0.308 0.011 Wheat Straw
90º 2000 12.76 bc 90 ab 3.22 abc 1.16 ab 1.69 2.11 1.89 2400 12.16 bc 88 bc 3.31 abc 1.17 ab 1.71 2.15 1.92 2800 13.64 abc 82 de 3.10 abc 1.16 ab 1.66 2.06 1.85 3200 13.28 abc 82 def 3.15 abc 0.91 ab 1.68 2.08 1.87 3600 12.37 bc 76 fg 3.28 abc 1.16 ab 1.71 2.13 1.91
30º 2000 17.78 a 95 a 2.67 c 1.13 b 1.56 1.87 1.71 2400 14.24 abc 83 cd 3.03 abc 1.15 ab 1.65 2.03 1.83 2800 15.79 ab 88 bc 2.86 bc 1.14 b 1.60 1.95 1.77 3200 9.96 c 76 g 3.71 ab 1.18 a 1.80 2.31 2.04 3600 9.52 c 76 efg 3.81 a 1.19 a 1.82 2.35 2.07
MSD 4.861 5.536 0.961 0.039 Corn Stover
90º 2000 9.38 abc 70 ab 3.84 bcd 1.19 abc 1.83 2.36 2.08 2400 10.73 ab 74 a 3.56 bcd 1.18 bc 1.77 2.25 1.99 2800 6.20 c 66 ab 4.86 a 1.22 a 2.04 2.74 2.36 3200 10.37 abc 67 ab 3.63 bcd 1.18 bc 1.78 2.28 2.02 3600 7.56 bc 62 b 4.34 abc 1.21 ab 1.93 2.55 2.22
30º 2000 7.35 bc 74 a 4.41 ab 1.21 ab 1.95 2.58 2.24 2400 10.65 ab 68 ab 3.57 bcd 1.18 bc 1.77 2.25 2.00 2800 8.79 abc 64 b 3.98 abcd 1.19 abc 1.86 2.42 2.12 3200 12.08 a 69 ab 3.33 cd 1.17 c 1.72 2.15 1.92 3600 12.72 a 64 b 3.23 d 1.16 c 1.69 2.11 1.89
MSD 4.424 7.812 1.037 0.039 * Means with same letters in each column are not significantly different at p<0.05 using Tukey’s studentized range
(HSD) test. Different letters within a value represent a significant difference.
16
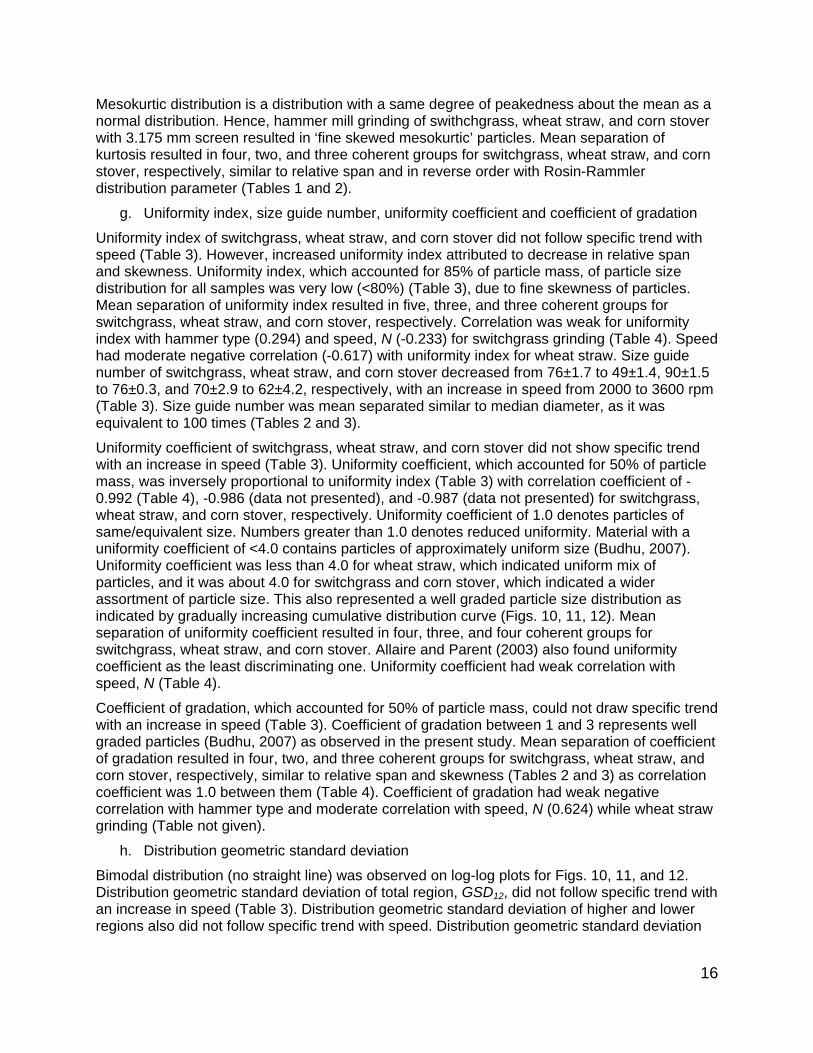
Mesokurtic distribution is a distribution with a same degree of peakedness about the mean as a normal distribution. Hence, hammer mill grinding of swithchgrass, wheat straw, and corn stover with 3.175 mm screen resulted in ‘fine skewed mesokurtic’ particles. Mean separation of kurtosis resulted in four, two, and three coherent groups for switchgrass, wheat straw, and corn stover, respectively, similar to relative span and in reverse order with Rosin-Rammler distribution parameter (Tables 1 and 2).
g. Uniformity index, size guide number, uniformity coefficient and coefficient of gradation
Uniformity index of switchgrass, wheat straw, and corn stover did not follow specific trend with speed (Table 3). However, increased uniformity index attributed to decrease in relative span and skewness. Uniformity index, which accounted for 85% of particle mass, of particle size distribution for all samples was very low (<80%) (Table 3), due to fine skewness of particles. Mean separation of uniformity index resulted in five, three, and three coherent groups for switchgrass, wheat straw, and corn stover, respectively. Correlation was weak for uniformity index with hammer type (0.294) and speed, N (-0.233) for switchgrass grinding (Table 4). Speed had moderate negative correlation (-0.617) with uniformity index for wheat straw. Size guide number of switchgrass, wheat straw, and corn stover decreased from 76±1.7 to 49±1.4, 90±1.5 to 76±0.3, and 70±2.9 to 62±4.2, respectively, with an increase in speed from 2000 to 3600 rpm (Table 3). Size guide number was mean separated similar to median diameter, as it was equivalent to 100 times (Tables 2 and 3).
Uniformity coefficient of switchgrass, wheat straw, and corn stover did not show specific trend with an increase in speed (Table 3). Uniformity coefficient, which accounted for 50% of particle mass, was inversely proportional to uniformity index (Table 3) with correlation coefficient of -0.992 (Table 4), -0.986 (data not presented), and -0.987 (data not presented) for switchgrass, wheat straw, and corn stover, respectively. Uniformity coefficient of 1.0 denotes particles of same/equivalent size. Numbers greater than 1.0 denotes reduced uniformity. Material with a uniformity coefficient of <4.0 contains particles of approximately uniform size (Budhu, 2007). Uniformity coefficient was less than 4.0 for wheat straw, which indicated uniform mix of particles, and it was about 4.0 for switchgrass and corn stover, which indicated a wider assortment of particle size. This also represented a well graded particle size distribution as indicated by gradually increasing cumulative distribution curve (Figs. 10, 11, 12). Mean separation of uniformity coefficient resulted in four, three, and four coherent groups for switchgrass, wheat straw, and corn stover. Allaire and Parent (2003) also found uniformity coefficient as the least discriminating one. Uniformity coefficient had weak correlation with speed, N (Table 4).
Coefficient of gradation, which accounted for 50% of particle mass, could not draw specific trend with an increase in speed (Table 3). Coefficient of gradation between 1 and 3 represents well graded particles (Budhu, 2007) as observed in the present study. Mean separation of coefficient of gradation resulted in four, two, and three coherent groups for switchgrass, wheat straw, and corn stover, respectively, similar to relative span and skewness (Tables 2 and 3) as correlation coefficient was 1.0 between them (Table 4). Coefficient of gradation had weak negative correlation with hammer type and moderate correlation with speed, N (0.624) while wheat straw grinding (Table not given).
h. Distribution geometric standard deviation
Bimodal distribution (no straight line) was observed on log-log plots for Figs. 10, 11, and 12. Distribution geometric standard deviation of total region, GSD12, did not follow specific trend with an increase in speed (Table 3). Distribution geometric standard deviation of higher and lower regions also did not follow specific trend with speed. Distribution geometric standard deviation
17
Table 4. Pearson correlation coefficients for hammer mill size reduction of switchgrass with 90º and 30º hammers. Parameter
Hammer Type
Speed, N, rpm
Total Specific Energy, Et, kWh/Mg
Effective Specific Energy, Ee, kWh/Mg
Geometric Mean Diameter, Xgm, mm
Geometric Standard Deviation, Sgm
Rosin-Rammler Size Parameter, a, mm
Rosin-Rammler Distribution Parameter, b
Median Diameter, D50, mm
Effective Size, D10, mm
Mass Relative Span, RSm
Inclusive Graphic Skewness, GSi
Graphic Kurtosis, Kg
Uniformity Index, Iu, %
Uniformity Coefficient, Cu
Coefficient of Gradation, Cg
Distribution Standard Deviation (Total), GSD12
Hammer
1.000
N 0.000 (1.000)
1.000
Et 0.220 (0.542)
0.968 (<10-4)
1.000
Ee 0.821 (0.004)
-0.222 (0.011)
0.020 (0.957)
1.000
Xgm 0.000 (1.000)
-0.914 (2E-4)
-0.883 (7E-4)
0.272 (0.446)
1.000
Sgm -0.262 (0.465)
-0.056 (0.877)
-0.085 (0.815)
-0.276 (0.440)
-0.291 (0.414)
1.000
a -0.025 (0.945)
-0.945 (<10-4)
-0.914 (2E-4)
0.247 (0.491)
0.991 (<10-4)
-0.167 (0.644)
1.000
b 0.295 (0.408)
-0.242 (0.500)
-0.195 (0.589)
0.333 (0.348)
0.552 (0.098)
-0.928 (1E-4)
0.447 (0.195)
1.000
D50 -0.002 (0.997)
-0.929 (1E-4))
-0.895 (5E-4)
0.264 (0.461)
0.997 (<10-4)
-0.236 (0.512)
0.997 (<10-4)
0.511 (0.131)
1.000
D10 0.087 (0.811)
-0.817 (0.004)
-0.776 (0.008)
0.314 (0.377)
0.971 (<10-4)
-0.486 (0.154)
0.936 (<10-4)
0.731 (0.016)
0.959 (<10-4)
1.000
RSm -0.302 (0.396)
0.281 (0.431)
0.233 (0.517)
-0.339 (0.339)
-0.584 (0.077)
0.922 (2E-4)
-0.482 (0.158)
-0.997 (<10-4)
-0.544 (0.104)
-0.755 (0.012)
1.000
GSi -0.299 (0.401)
0.268 (0.454)
0.220 (0.540)
-0.336 (0.343)
-0.573 (0.083)
0.925 (1E-4)
-0.470 (0.170)
-0.999 (<10-4)
-0.533 (0.113)
-0.747 (0.013)
0.999 (<10-4)
1.000
Kg -0.304 (0.393)
0.313 (0.379)
0.264 (0.460)
-0.342 (0.334)
-0.608 (0.062)
0.913 (2E-4)
-0.510 (0.132)
-0.989 (<10-4)
-0.570 (0.085)
-0.771 (0.009)
0.998 (<10-4)
0.996 (<10-4)
1.000
Iu 0.294 (0.410)
-0.233 (0.517)
-0.187 (0.606)
0.331 (0.350)
0.544 (0.104)
-0.929 (1E-4)
0.439 (0.205)
1.000 (<10-4)
0.503 (0.139)
0.725 (0.018)
-0.995 (<10-4)
-0.998 (<10-4)
-0.987 (<10-4)
1.000
Cu -0.303 (0.395)
0.295 (0.407)
0.247 (0.491)
-0.340 (0.337)
-0.595 (0.070)
0.918 (2E-4)
-0.495 (0.146)
-0.994 (<10-4)
-0.556 (<10-4)
-0.762 (0.010)
1.000 (<10-4)
0.998 (<10-4)
0.999 (<10-4)
-0.992 (<10-4)
1.000
Cg -0.301 (0.398)
0.277 (0.439)
0.229 (0.525)
-0.337 (0.341)
-0.580 (0.079)
0.923 (1E-4)
-0.479 (0.162)
-0.998 (<10-4)
-0.541 (0.107)
-0.752 (0.012)
1.000 (<10-4)
1.000 (<10-4)
0.997 (<10-4)
-0.996 (<10-4)
0.999 (<10-4)
1.000
GSD12 -0.302 (0.397)
0.286 (0.423)
0.238 (0.508)
-0.338 (0.339)
-0.587 (0.074)
0.921 (2E-4)
-0.486 (0.154)
-0.996 (<10-4)
-0.548 (0.101)
-0.757 (0.011)
1.000 (<10-4)
0.999 (<10-4)
0.998 (<10-4)
-0.994 (<10-4)
1.000 (<10-4)
1.000 (<10-4)
1.000
18
had moderate correlation with speed while wheat straw grinding (Table not given). Hence, approach of distribution geometric standard deviation improved the relation with mill speed over geometric standard deviation.
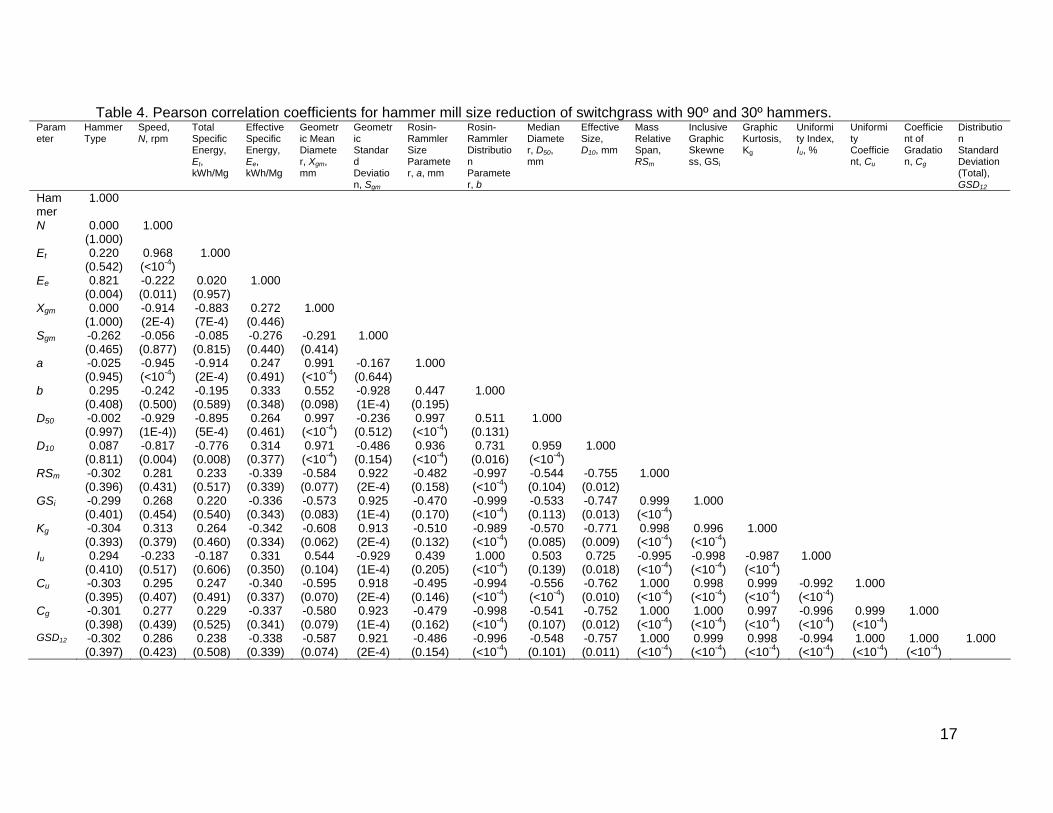
Correlations
A positive strong correlation was established between hammer mill speed and total specific energy (>0.960), however, a good correlation was established between hammer type and effective specific energy (0.821, 0.742, and 0.768 for switchgrass, wheat straw, and corn stover, respectively) (Table 4). A negative strong correlation (-0.914, -0.815, and -0.615 for switchgrass, wheat straw, and corn stover, respectively) was established between geometric mean diameter, Xgm, and hammer mill speed, N (Table 4). Geometric standard deviation, Sgm, could not establish any correlation with hammer mill operating factors. Rosin-Rammler size parameter, a (-0.945, -0.902, -0.814), median diameter, D50 (-0.929, -0.897, -0.761), and effective size, D10 (-0.817, -0.787, - ) had strong negative correlation with speed, N. These parameters had weak correlation with hammer type. Xgm had very strong correlation with parameters a, D50, and D10 with Pearson coefficients of (0.991, 0.934, 0.732), (0.997, 0.968, 0.922), (0.971, 0.943, 0.772), respectively. Obviously, same was the magnitude for size parameter, a, with D50, and D10, and also positive relation among them. Distribution related parameters considered were Sgm, RSm, b, Iu, Cu, Cg, and GSD12. A strong correlation was established among themselves and a weak correlation with mill speed (Tables 4, 5, 6). Inclusive graphic skewness, GSi, maintained strong positive correlation with Sgm, RSm, Cu, Cg, and GSD12 and negative correlation with b and Iu. Same was the case with graphic kurtosis, Kg. Both GSi and Kg observed moderate negative correlation with Xgm, a, D50, and D10.
Conclusions Idle power consumption of hammer mill increased curvilinear by 66% from 1.72±0.02 kW at 1500 rpm to 5.06±0.07 kW at 3500 rpm. Total specific energy of switchgrass, wheat straw, and corn stover increased by 37, 30, and 45%, respectively, with an increase in hammer mill speed from 2000 to 3600 rpm for 90º hammers. There was a marginal increase in total specific energy while grinding with 30º hammers. Effective specific energy was less for 30º hammers compared to 30º hammers. Optimum total specific energies of 31.8, 34.7, and 28.8 kWh/Mg for switchgrass, wheat straw, and corn stover, respectively, were obtained for 2000 rpm for mass feed rate of 2.5 kg/min and 3.175 mm screen with 90º hammers (6.35 mm). Hammer milling of swithchgrass, wheat straw, and corn stover with 3.175 mm screen resulted in ‘well graded fine skewed mesokurtic’ particles for all speeds. Rosin-Rammler equations were fitted the size distribution data with high R2 > 0.995. Uniformity coefficient was less than 4.0 for wheat straw, which indicated uniform mix of particles, and it was about 4.0 for switchgrass and corn stover, which indicated a wider assortment of particle size. A positive strong correlation was established between hammer mill speed and total specific energy, however, a good correlation was established between hammer type and effective specific energy. Rosin-Rammler size parameter, median diameter, and effective size, had strong negative correlation with speed. Distribution related parameters Sgm, RSm, b, Iu, Cu, Cg, and GSD12 had strong correlation among themselves and a weak correlation with mill speed. Inclusive graphic skewness and graphic kurtosis had strong correlation with Sgm, b, RSm, Iu, Cu, and Cg.
Acknowledgements This research was supported in part by USDA-DOE Biomass Research and Development
Initiative DE-PA36-04GO94002 and DOE funding through the Southeastern Regional Sun Grant Center.
19
References Aden, A., M. Ruth, K. Ibsen, J. Jechura, K. Neeves, J. Sheehan, and B. Wallance. 2002.
Lignocellulosic Biomass to Ethanol Process Design and Economics Utilizing Co-Current Dilute Acid Prehydrolysis and Enzymatic Hydrolysis for Corn Stover. NREL/TP-510-32438. National Renewable Energy Laboratory, USA.
Agriculture Canada, 1971. Size reduction. In Agricultural Materials Handling Manual. Agriculture Canada, Ottawa, ON.
Allaire, S. E., and L. E. Parent. 2003. Size guide and Rosin-Rammler approaches to describe particle size distribution of granular organic-based fertilizers. Biosystems Engineering 86: 503-509.
Allais, I., R. Edoura-Gaena, J. Gros, and G. Trystram. 2006. Influence of egg type, pressure and mode of incorporation on density and bubble distribution of a lady finger batter. Journal of Food Engineering 74: 198-210.
Arthur, J. F., R. A. Kepner, J. B. Dobie, G. E. Miller, and P. S. Parsons. 1982. Tub grinder performance with crop and forest residues. Trans. ASAE 25: 1488-1494.
ASABE Standards. 2006a. S358.2: Moisture measurement – Forages. St. Joseph, Mich.: ASABE.
ASABE Standards. 2006b. S319.3: Method of determining and expressing fineness of feed materials by sieving St. Joseph, Mich.: ASABE.
Austin, L. G., and R. R. Klimpel. 1964. The theory of grinding. Industrial and Engineering Chemistry 56(11): 18-29.
Balk, W. A. 1964. Energy requirements for dehydrating and pelletizing coastal Bermudagrass. Trans. ASAE 4: 349-351, 355.
Bargen, V., M. Lamb, and D. E. Neals. 1990. Energy requirements for particle size reduction of crop residues. ASAE Paper No. 81-4062. St. Joseph, Mich.: ASAE.
Budhu, M. 2007. Soil Mechanics and Foundations. 2nd ed. John Wiley & Sons, Inc., Danvers, MA.
Cadoche, L., and G. D. López. 1989. Assessment of size reduction as a preliminary step in the production of ethanol for lignocellulosic wastes. Biological Wastes 30: 153-157.
CFI. 1982. The CFI Guide of Material Selection for the Production of Quality Blends. Canadian Fertilizer Institute, Ottawa, Ontario, Canada.
Craig, R. F. 2004. Craig’s Soil Mechanics. Spon Press, London. Datta, R. 1981. Energy requirement for lignocellulose pretreatment processes. Process
Biochemistry 16(June/July): 16-19, 42. Djamarani, K. M., and I. M. Clark. 1997. Characterization of particle size based on fine and
coarse fractions. Powder Technology 93: 101-108. Drzymala, Z. 1993. Industrial briquetting – Fundamentals and methods. In Studies in
Mechanical Engineering, Vol. 13. PWN-Polish Scientific Publishers, Warszawa. Esteban, L. S., and J. E. Carrasco. 2006. Evaluation of different strategies for pulverization of
forest biomasses. Powder Technology 166: 139-151. Folk, R. L. 1974. Petrology of Sedimentary Rocks. Hemphill Publishing Co., Austin, Texas. Greene, N. 2004. Growing Energy – How Biofuels Can Help End America’s Oil Dependence.
National Resources Defense Council, NY.
20
Himmel, M., M. Tucker, J. Baker, C. Rivard, K. Oh, and K. Grohmann. 1985. Comminution of biomass: hammer and knife mills. In Biotechnology and Bioengineering Symposium, No. 15: 39-58.
Hinds, W. C., 1982. Aerosol Technology – Properties, Behaviour, and Measurement of Airborne Particles. John Wiley & Sons, NY.
Holtzapple, M. T., A. E. Humphrey, and J. D. Taylor. 1989. Energy requirements for the size reduction of poplar and aspen wood. Biotechnology and Bioengineering 33: 207-210.
Jannasch, R., Y. Quan, and R. Samson. 2001. A Process and Energy Analysis of Pelletizing Switchgrass. Final Report. Natural Resources Canada.
Jaya, S., and T. D. Durance. 2007. Particle size distribution of alginate-pectin microspheres: effect of composition and methods of production. ASABE Paper No. 076022. St. Joseph, Mich.: ASABE.
Jeon, H. Y. A. R. Womac, J. B. Wilkerson, and W. E. Hart. 2004. Sprayer boom instrumentation for field use. Trans. ASAE 47: 659-666.
Kumar, A., and S. Sokhansanj. 2007. Switchgrass (Panicum vigratum L.) delivery to a biorefinery using integrated biomass supply analysis and logistics (IBSAL) model. Bioresource Technology 98: 1033-1044.
Mani, S., L. G. Tabil, and S. Sokhansanj. 2002. Grinding performance and physical properties of selected biomass. ASAE Paper No. 02-6175, St. Joseph, Mich.: ASAE.
Mani, S., L. G. Tabil, and S. Sokhansanj. 2004a. Grinding performance and physical properties of wheat and barley straws, corn stover and switchgrass. Biomass and Bioenergy 27: 339-352.
Mani, S., L. G. Tabil, and S. Sokhansanj. 2004b. Mechanical properties of corn stover grind. Trans. ASAE 47: 1983-1990.
Perfect, E., and Q. Xu. 1998. Improved parameterization of fertilizer particle size distribution. Journal of AOAC International 81: 935-942.
Pfost, H., and V. Headley. 1976. Methods of determining and expressing particle size. In Feed Manufacturing Technology, 512-517. Pfost, H.B. ans D. Pickering, Eds. Arlington, Virginia: American Feed Manufacturers Association, Inc.
Proakis, J., and D. Manolakis. 1992. Digital Signal Processing: Principles, Algorithms, and Applications. Macmillan Publishing Co., NY.
Rosin, P., and E. Rammler. 1933. Laws governing the fineness of powdered coal. Journal of Instrument Fuel 7: 29-36.
Samson, P., P. Duxbury, M. Drisdelle, and C. Lapointe. 2000. Assessment of Pelletized Biofuels. PERD Program, National Resources Canada, Contract 23348-8-3145/001/SQ.
SAS. 2004. SAS/Stat User’s Guide: Statistics, Ver. 9.1. Cary, N.C.: SAS Institute, Inc. Schell, D. J., and C. Harwood. 1994. Milling of lignocellulosic biomass: results of pilot scale
testing. Applied Biochemistry and Biotechnology 45/46: 68-159. Scholten, R. L., and R.R. McEllhiney. 1985. The effects of prebreaking in hammer mill particle
size reduction. ASAE Paper No. 85-3542. St. Joseph, Mich.: ASAE. US Department of Energy. 1993. Assessment of costs and benefits of flexible and alternative
fuel use in the US transportation sector. In Evaluation of a Wood-to-Ethanol Process. Technical Report No. 11, DOE/EP-0004, US Department of Energy, Washington, DC.
U.S. Patent 5 677 154. 1997. Production of ethanol from biomass. USA. Vigneault, C., T. M. Rothwell, and G. Bourgeois. 1992. Hammer mill grinding rate and energy
requirements for thin and conventional hammers. Canadian Agric. Eng. 34: 203-206.
21
Womac, A. R., C. Igathinathane, P. Bitra, P. Miu, T. Yang, S. Sokhansanj, and S. Narayan. 2007. Biomass Pre-processing size reduction with instrumented mills. ASABE Paper No. 076046. St. Joseph, Mich.: ASABE.
Yang, W., S. Sokhansanj, W. J. Crerer, and S. Rohani. 1996. Size and shape related characteristics of alfalfa grind. Canadian Agric. Eng. 38, 201-205.
Yang, Y., A. R. Womac, and P. I. Miu. 2006. High-specific separation of biomass materials by sieving. ASABE Paper No. 066172. St. Joseph, Mich.: ASABE.