Embed Size (px)
DESCRIPTION
Commercialization & Food Security Outcomes: chi-square Test. Source: Babu and Sanyal (2009). Commercialization. - PowerPoint PPT Presentation
Citation preview
Commercialization & Food Security Outcomes:chi-square Test
Source: Babu and Sanyal (2009)
Commercialization
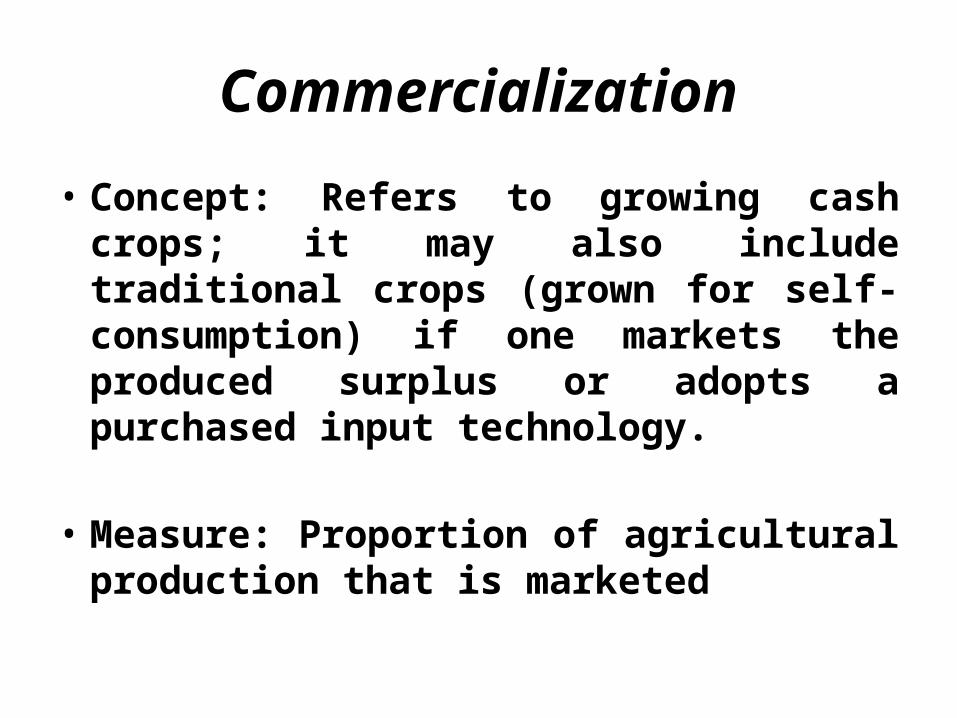
• Concept: Refers to growing cash crops; it may also include traditional crops (grown for self-consumption) if one markets the produced surplus or adopts a purchased input technology.
• Measure: Proportion of agricultural production that is marketed
Commercialization
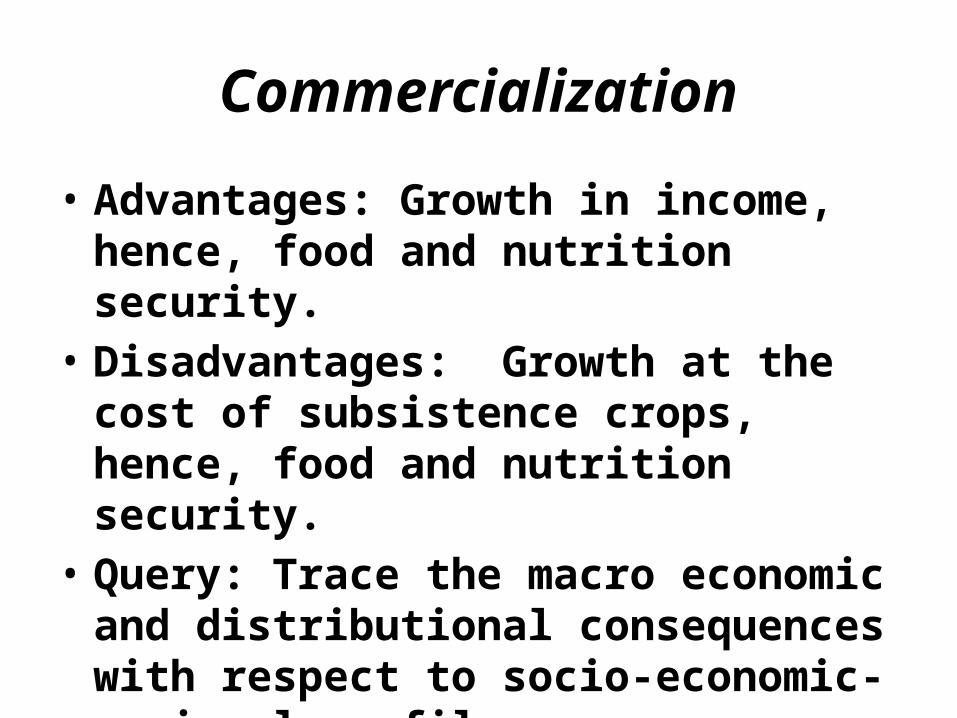
• Advantages: Growth in income, hence, food and nutrition security.
• Disadvantages: Growth at the cost of subsistence crops, hence, food and nutrition security.
• Query: Trace the macro economic and distributional consequences with respect to socio-economic-regional profiles.
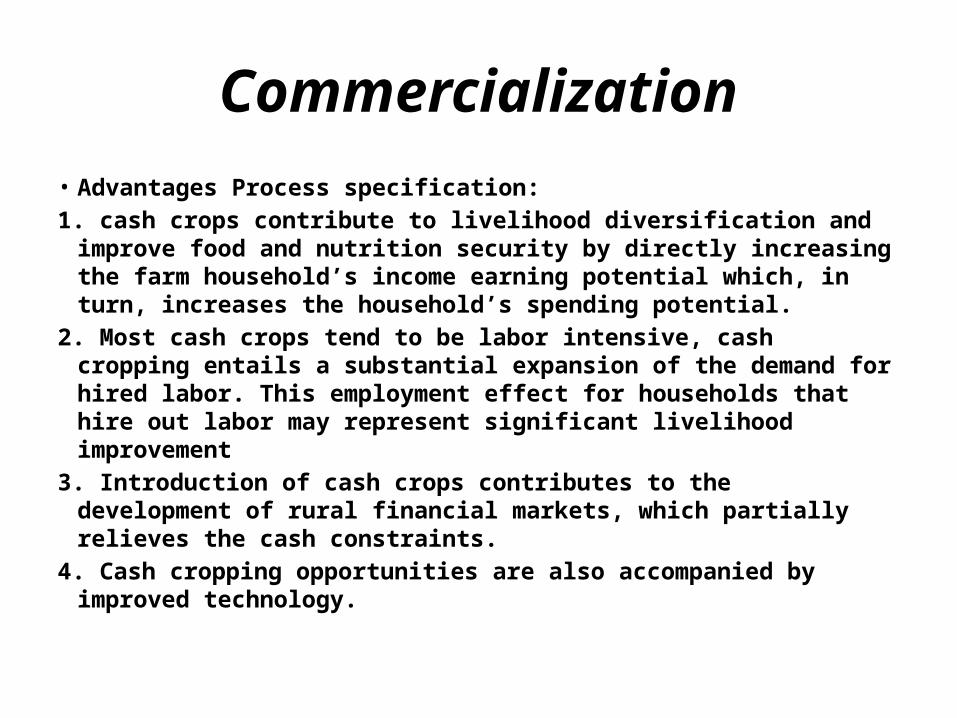
Commercialization• Advantages Process specification:1. cash crops contribute to livelihood diversification and improve food
and nutrition security by directly increasing the farm household’s income earning potential which, in turn, increases the household’s spending potential.
2. Most cash crops tend to be labor intensive, cash cropping entails a substantial expansion of the demand for hired labor. This employment effect for households that hire out labor may represent significant livelihood improvement
3. Introduction of cash crops contributes to the development of rural financial markets, which partially relieves the cash constraints.
4. Cash cropping opportunities are also accompanied by improved technology.
Commercialization
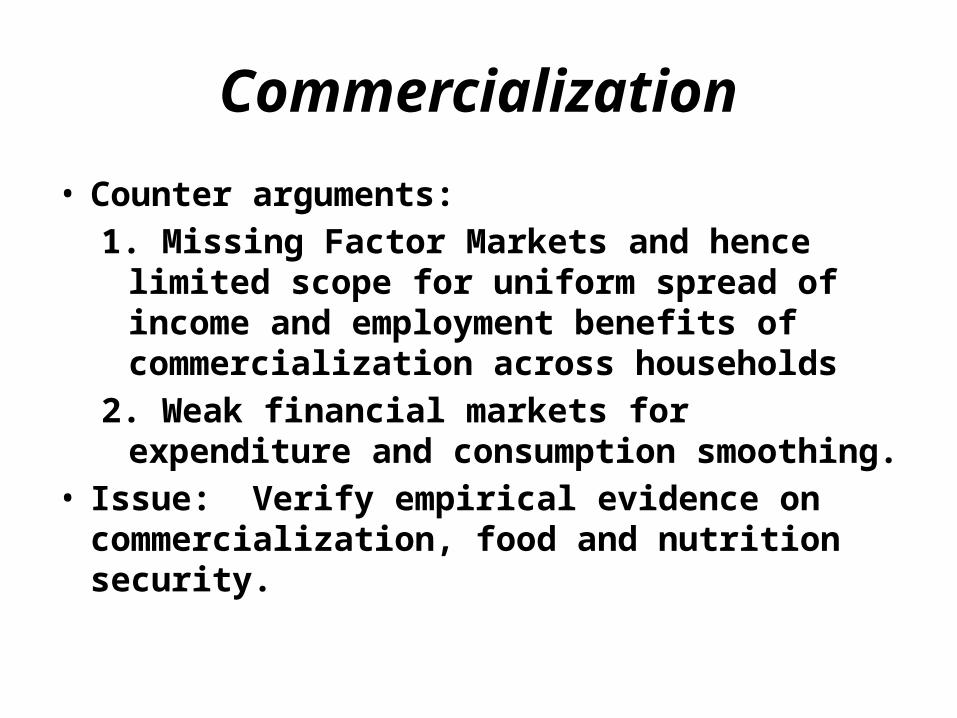
• Counter arguments:1. Missing Factor Markets and hence limited scope
for uniform spread of income and employment benefits of commercialization across households
2. Weak financial markets for expenditure and consumption smoothing.
• Issue: Verify empirical evidence on commercialization, food and nutrition security.
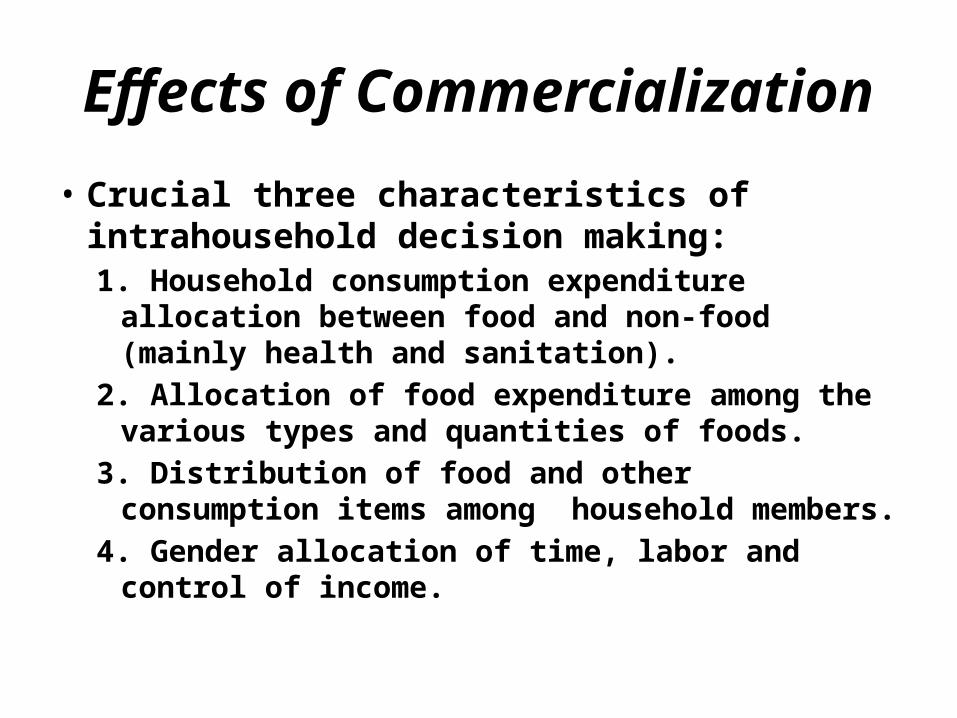
Effects of Commercialization
• Crucial three characteristics of intrahousehold decision making: 1. Household consumption expenditure allocation
between food and non-food (mainly health and sanitation).
2. Allocation of food expenditure among the various types and quantities of foods.
3. Distribution of food and other consumption items among household members.
4. Gender allocation of time, labor and control of income.
Issues
• Is it more likely for a cash crop growing household than a traditional crop growing household to be food secure?
• Is it more likely for a cash crop growing household than a traditional crop growing household to have children with adequate nutrition, i.e. absence of malnutrition?
Verification Requirements
• Information on household characteristics such as incomes by family members, expenditure on food and non-food items, demographic characteristics of the members and food intake by family members.
• Measures of the children’s nutritional status. • Test procedure: Pearson’s chi-square test to
determine if the observed relationship between the nominal or categorical variable is statistically significant or is due to random variability.
Empirical Analysis
• Evidence from Malawi• CASHCROP: tobacco, groundnuts, cotton and
plantain (major cash crops in Malawi).• Dummy variable CASHCROP = 1 if the
household grows at least one of these four major cash crops and 0 otherwise.
• CASHCROP a measure of commercialization of agriculture at the household level.
Empirical Analysis
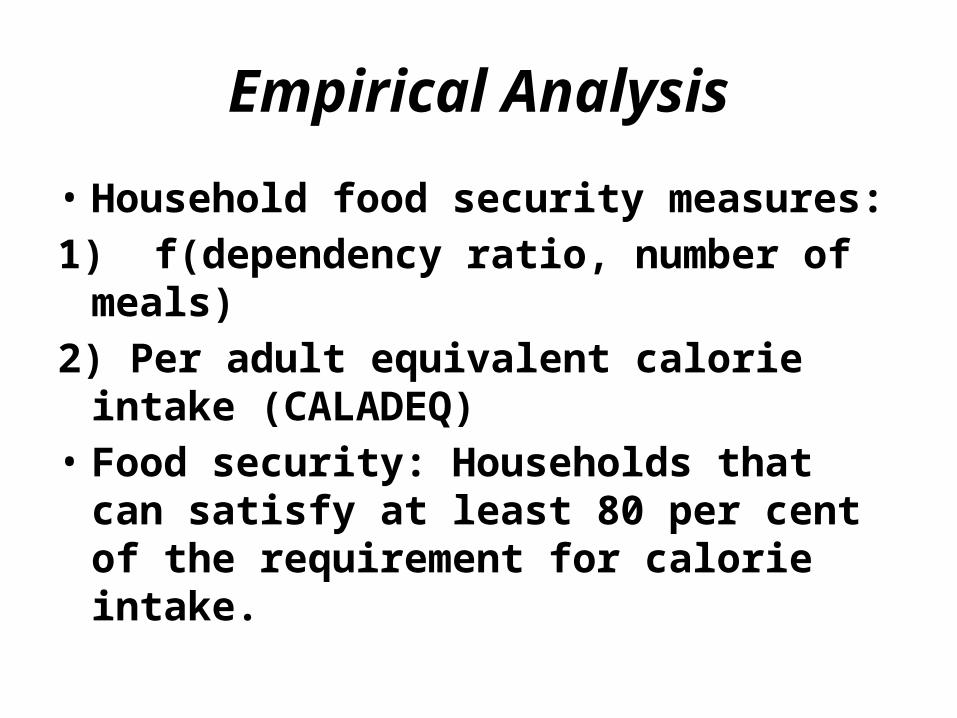
• Household food security measures:1) f(dependency ratio, number of meals)2) Per adult equivalent calorie intake
(CALADEQ)• Food security: Households that can satisfy at
least 80 per cent of the requirement for calorie intake.
Nutrition Measures
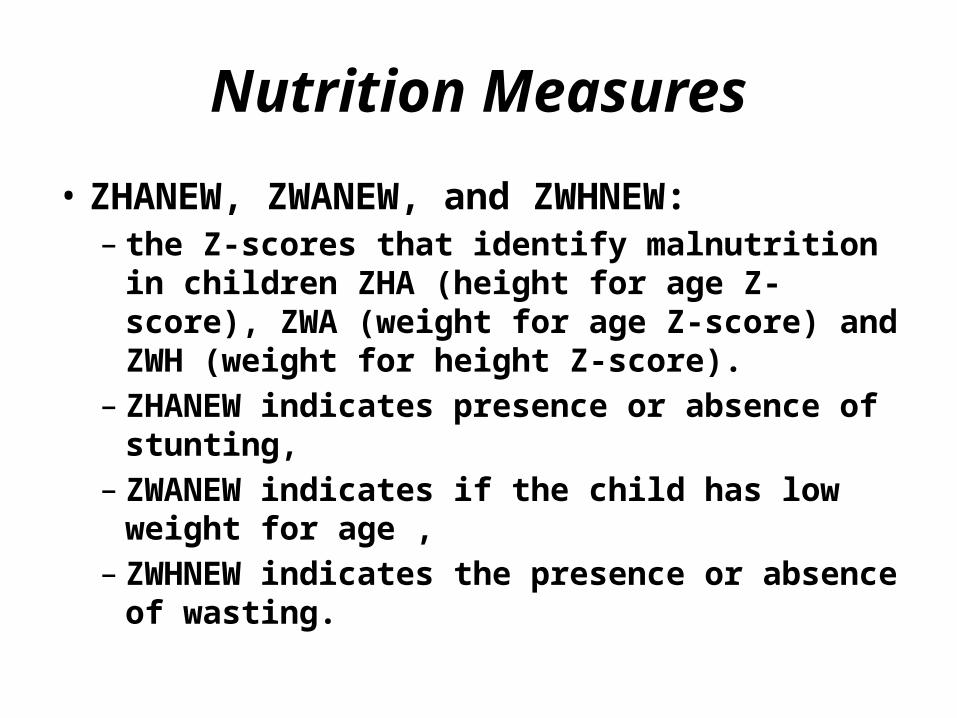
• ZHANEW, ZWANEW, and ZWHNEW: – the Z-scores that identify malnutrition in children
ZHA (height for age Z-score), ZWA (weight for age Z-score) and ZWH (weight for height Z-score).
– ZHANEW indicates presence or absence of stunting,
– ZWANEW indicates if the child has low weight for age ,
– ZWHNEW indicates the presence or absence of wasting.
Nutrition Measures
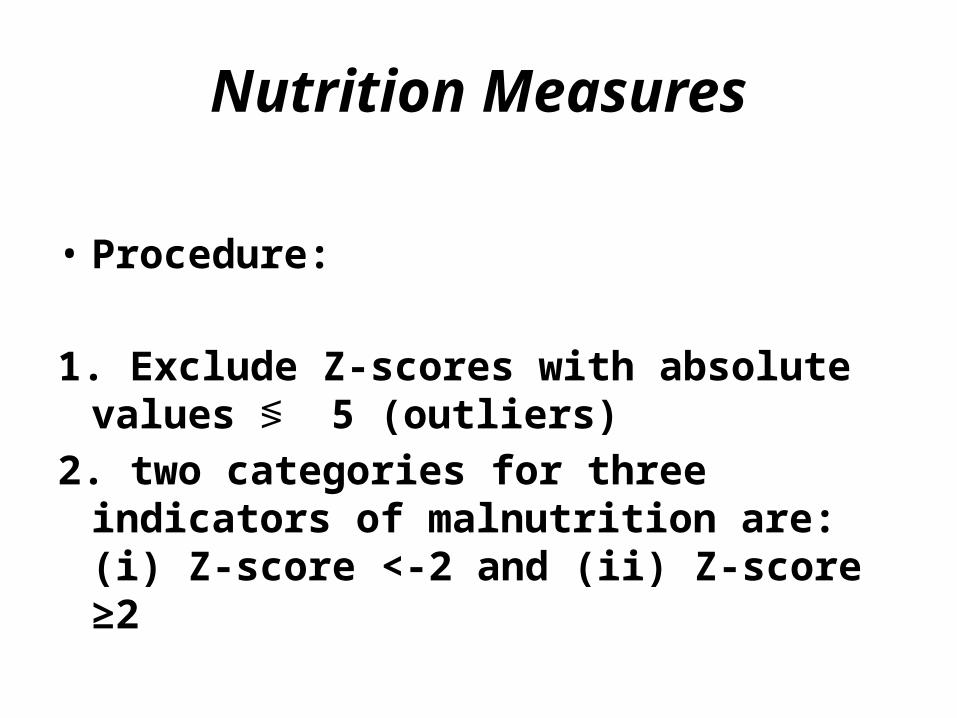
• Procedure:
1. Exclude Z-scores with absolute values ≶ 5 (outliers)
2. two categories for three indicators of malnutrition are: (i) Z-score <-2 and (ii) Z-score ≥2
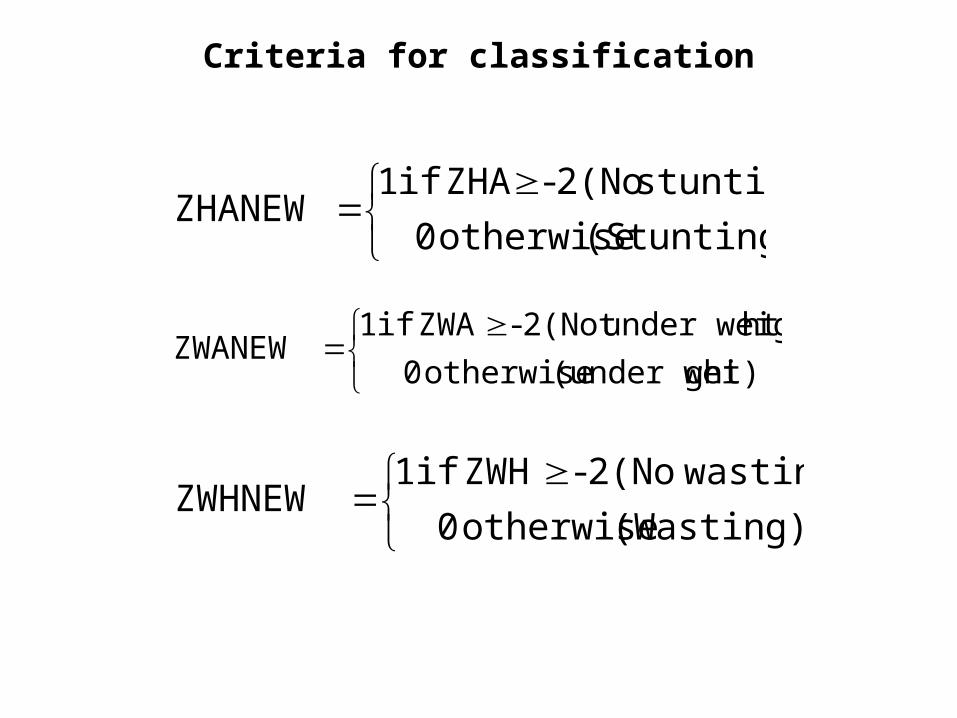
Criteria for classification
(Stunting) otherwise 0
stunting) 2(No- ZHAif 1ZHANEW
ght)(under wei otherwise 0
ht)under weig2(Not - ZWAif 1ZWANEW
(Wasting) otherwise 0
wasting)2(No- ZWHif 1ZWHNEW
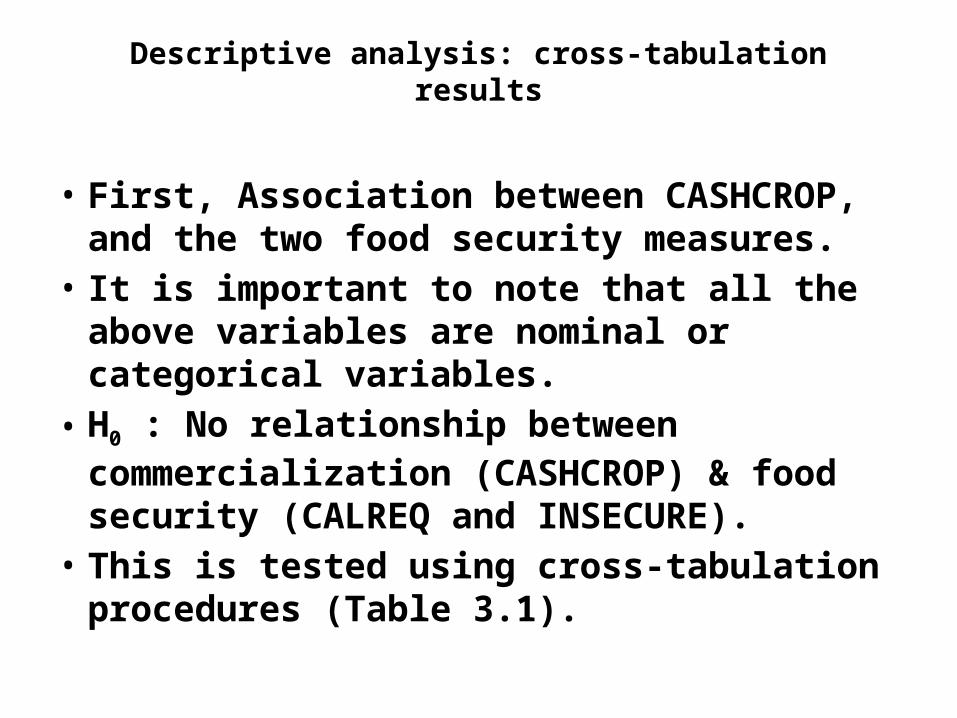
Descriptive analysis: cross-tabulation results
• First, Association between CASHCROP, and the two food security measures.
• It is important to note that all the above variables are nominal or categorical variables.
• H0 : No relationship between commercialization (CASHCROP) & food security (CALREQ and INSECURE).
• This is tested using cross-tabulation procedures (Table 3.1).
Test of Independence between Commercialization and Nutrition
Food Security Measure: Calorie adequacy
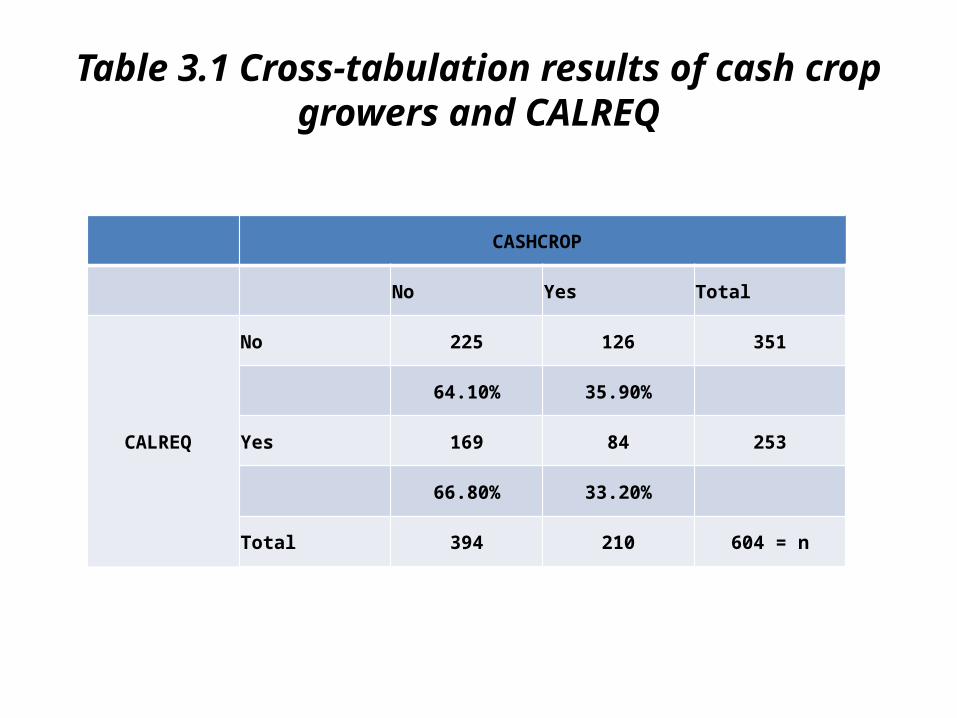
Table 3.1 Cross-tabulation results of cash crop growers and CALREQ
CASHCROP
No Yes Total
CALREQ
No 225 126 351
64.10% 35.90%
Yes 169 84 253
66.80% 33.20%
Total 394 210 604 = n
Commercialization and Nutrition
• Cross-tabulation results: 35.9 per cent of the cash crop growing households are food insecure (as measured by CALREQ) compared to 64.1 per cent of the non-cash crop growing households.
• Cash crop generates additional income for the household to purchase more food.
Test of Independence betweenCommercialization and Nutrition
Food Security Measure: Dependency ratio & number of meals
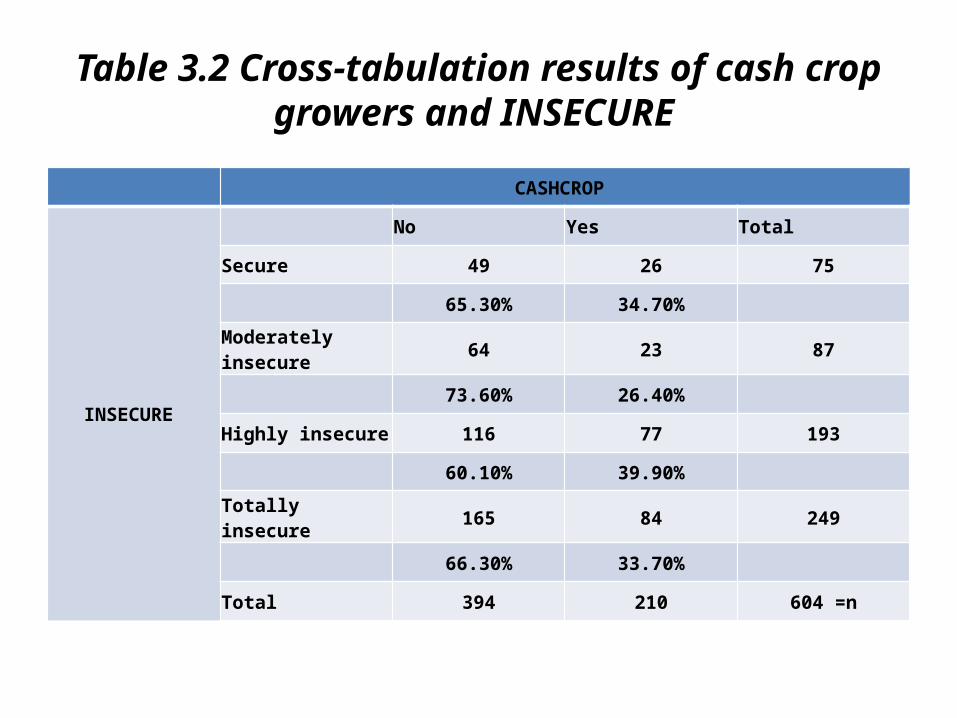
Table 3.2 Cross-tabulation results of cash crop growers and INSECURE
CASHCROP
INSECURE
No Yes Total
Secure 49 26 75
65.30% 34.70%
Moderately insecure 64 23 87
73.60% 26.40%
Highly insecure 116 77 193
60.10% 39.90%
Totally insecure 165 84 249
66.30% 33.70%
Total 394 210 604 =n
Commercialization and Nutrition
• Cash crop growers are relatively more food secure compared to non-cash crop growers.
• This could be due to household’s participation in a commercialized crop scheme enables it to acquire resources that otherwise would not be available.
Commercialization and Child Nutrition
Nutrition Measures: Anthropometric Indicators
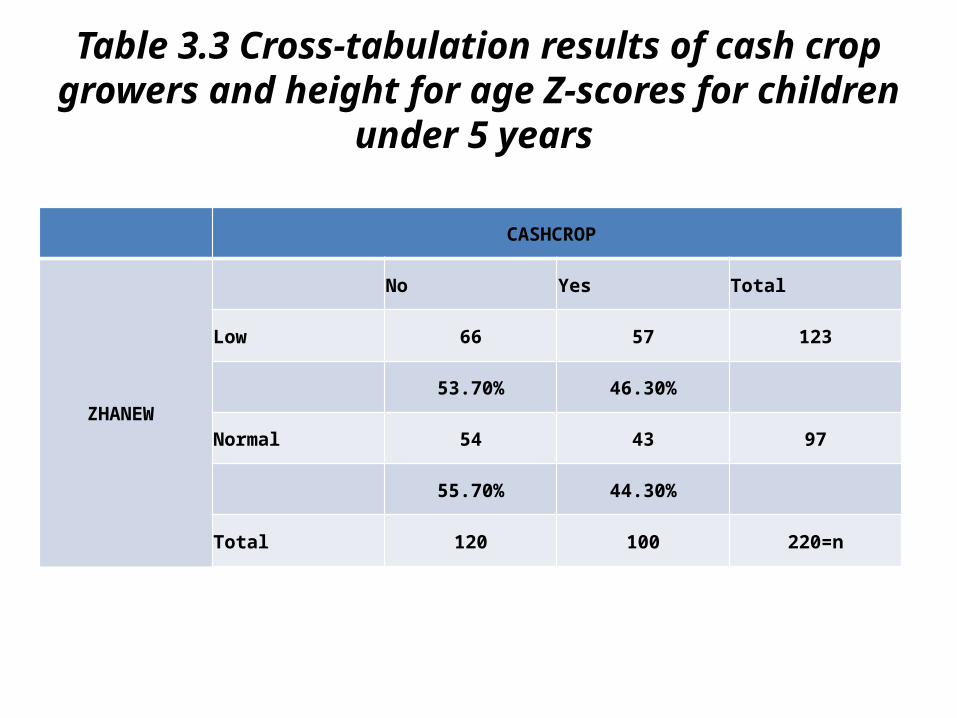
Table 3.3 Cross-tabulation results of cash crop growers and height for age Z-scores for children under 5 years
CASHCROP
ZHANEW
No Yes Total
Low 66 57 123
53.70% 46.30%
Normal 54 43 97
55.70% 44.30%
Total 120 100 220=n
Commercialization and Child Nutrition - Stunting
• Cross-tabulation: 53.7 per cent of preschoolers of the households not growing cash crops are stunted, while 46.3 per cent of preschoolers for households growing cash crops are stunted.
• Extra income generated through sale of cash crops achieves greater income, which helps in moderating food insecurity of the household.
• Household members can obtain higher energy intake as well as greater dietary diversity. The higher energy intake results in better child nutritional status.
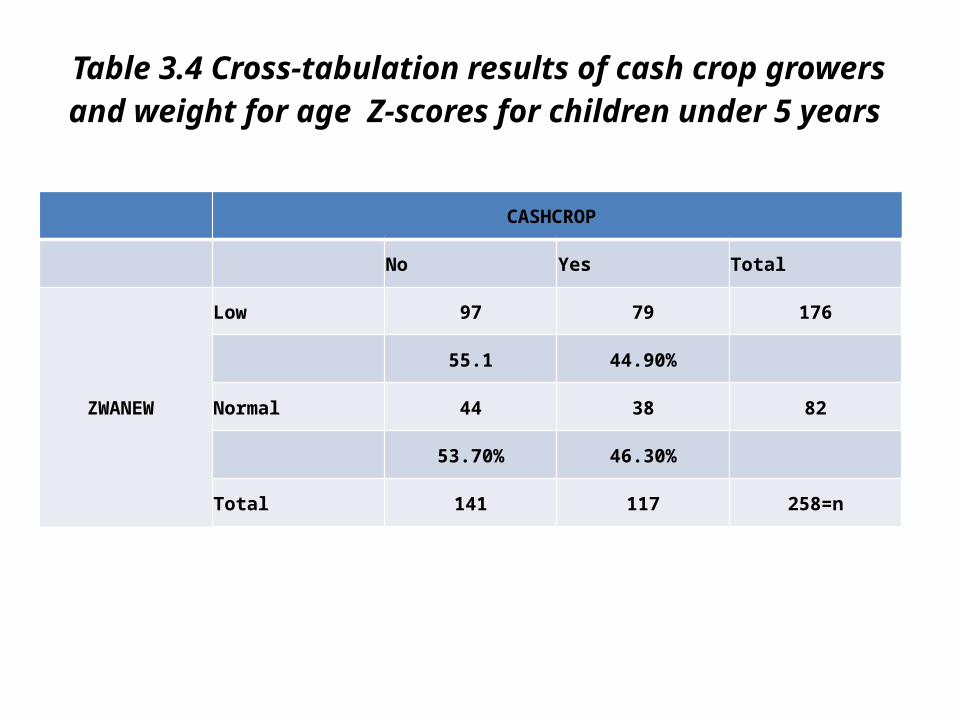
Table 3.4 Cross-tabulation results of cash crop growers and weight for age Z-scores for children under 5 years
CASHCROP
No Yes Total
ZWANEW
Low 97 79 176
55.1 44.90%
Normal 44 38 82
53.70% 46.30%
Total 141 117 258=n
Commercialization and Child Nutrition -Underweight
• The incidence of underweight preschoolers was 55.1 per cent for households who did not grow cash crops, and 44.9 per cent for households who grew cash crops.
• Underweight children are less likely to occur in cash crop growing households relative to non-cash crop growing households.
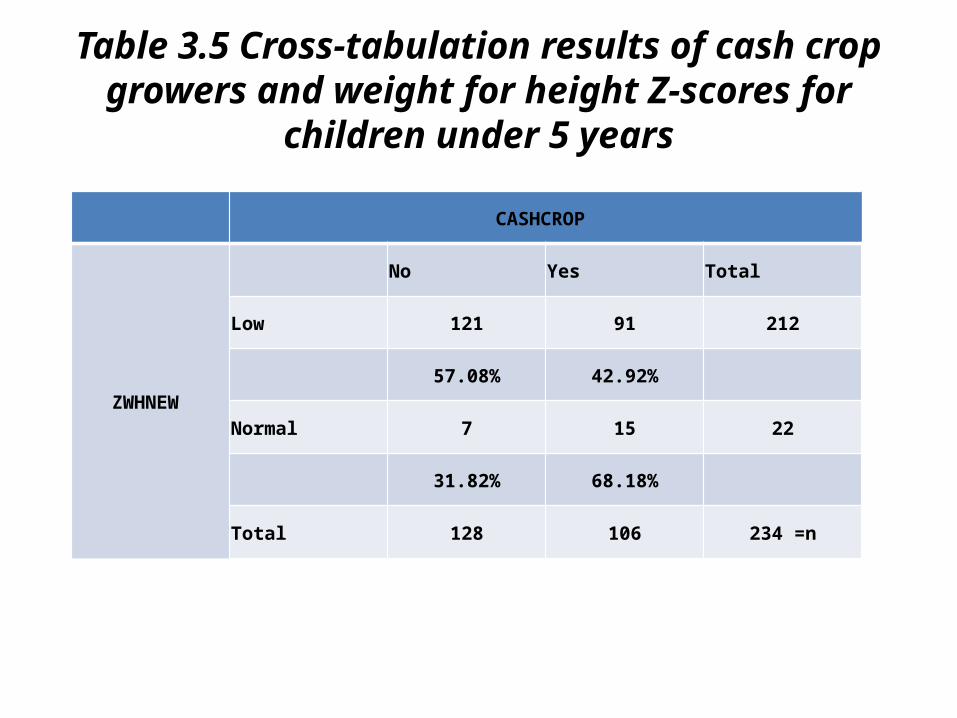
Table 3.5 Cross-tabulation results of cash crop growers and weight for height Z-scores for children under 5
years
CASHCROP
ZWHNEW
No Yes Total
Low 121 91 212
57.08% 42.92%
Normal 7 15 22
31.82% 68.18%
Total 128 106 234 =n
Commercialization and Child Nutrition - Wasting
• Incidence of wasting (42.9 per cent) among commercial crops grower is less compared to households who did not grow the crops (57.1 per cent).
• Statistical verification calls for test: chi-square test.
Chi-square test
• Issue under review: Relationship between cash crop growing and household food security and nutrition situation.
• Test: Chi-square test• Purpose: Compare two characteristics and
verify if they are linked or related to each other.• Task: Compare the observed frequencies with
the expected frequencies derived under the hypothesis of independence.
Chi-square test
• The square of a standard normal variable follows chi-square distribution
• Chi-square test: – often used with contingency tables (cross tabulations),
say, gender and smoking.– Test of independence: To verify if the columns are
contingent on the rows in the table.– Null hypothesis: No relationship between row and
column frequencies.• H0: The 2 variables are independent
Assumptions
• Random sample
• Data are in the form of frequencies
• Variables are independent
• Categories for each variable are mutually exclusive and exhaustive
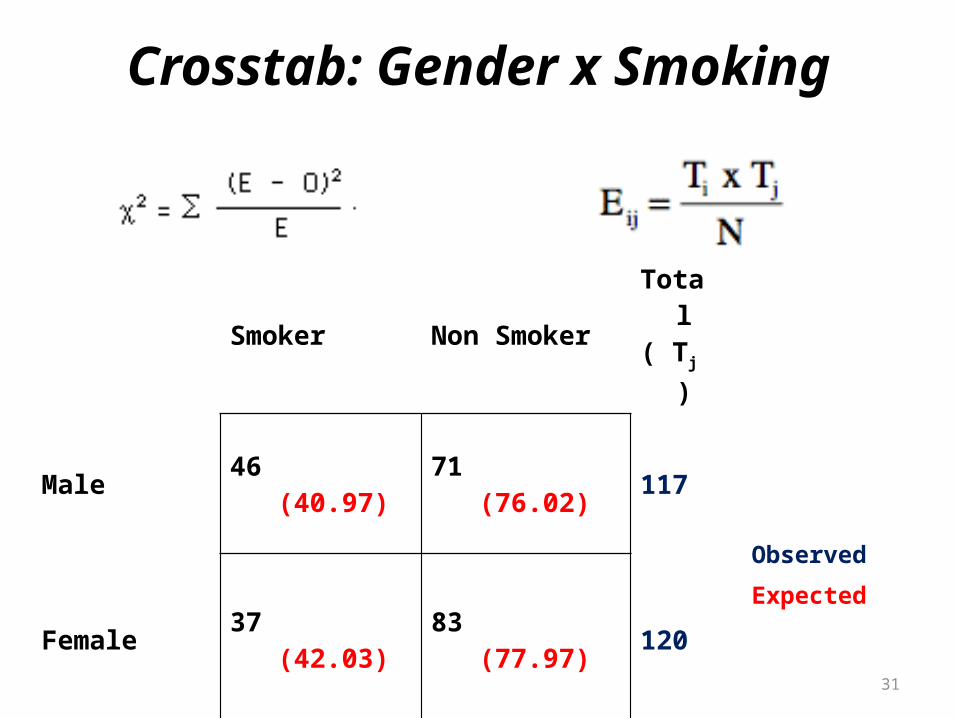
Crosstab: Gender x Smoking
31
Smoker Non SmokerTotal( Tj )
Male 46 (40.97)
71 (76.02)
117
Female37 (42.03)
83 (77.97) 120
Total ( Ti ) 83 154 237
Observed
Expected
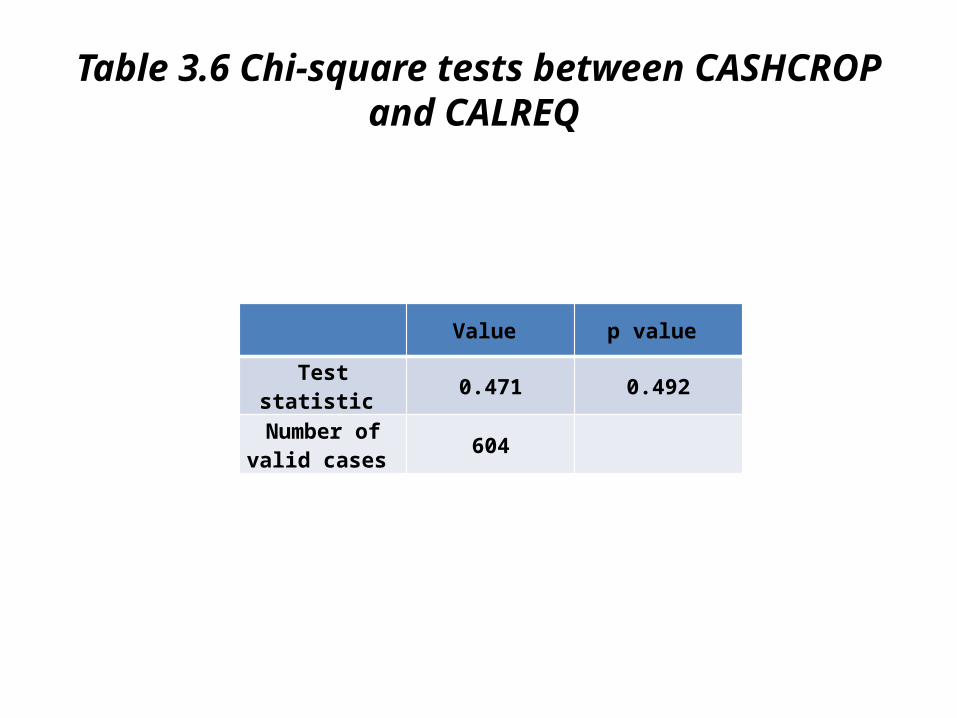
Table 3.6 Chi-square tests between CASHCROP and CALREQ
Value p value
Test statistic 0.471 0.492
Number of valid cases 604
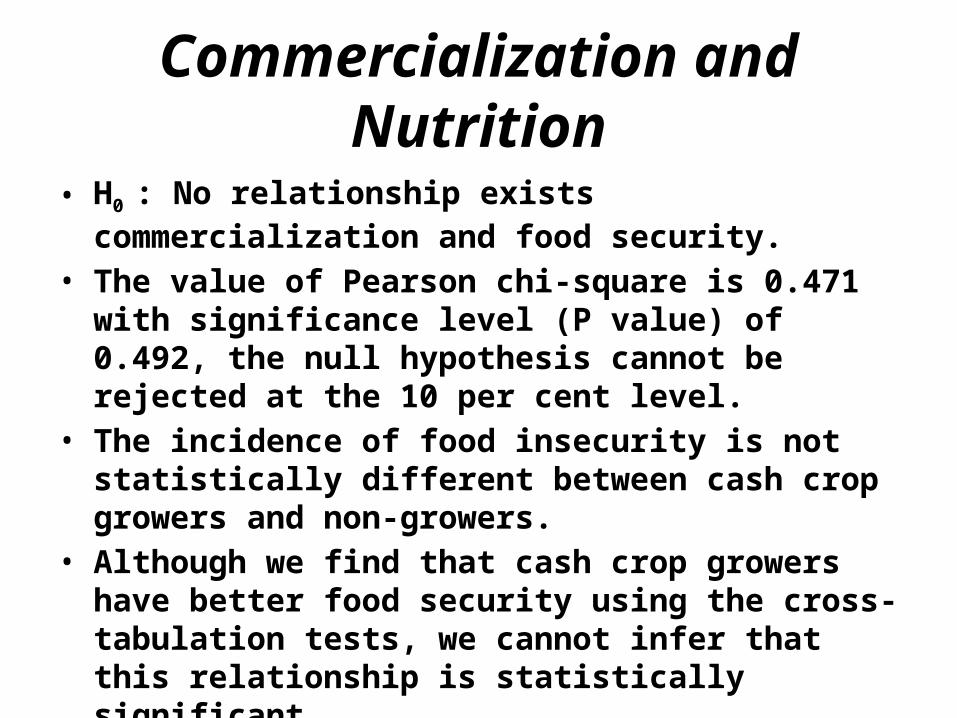
Commercialization and Nutrition
• H0 : No relationship exists commercialization and food security.
• The value of Pearson chi-square is 0.471 with significance level (P value) of 0.492, the null hypothesis cannot be rejected at the 10 per cent level.
• The incidence of food insecurity is not statistically different between cash crop growers and non-growers.
• Although we find that cash crop growers have better food security using the cross-tabulation tests, we cannot infer that this relationship is statistically significant.
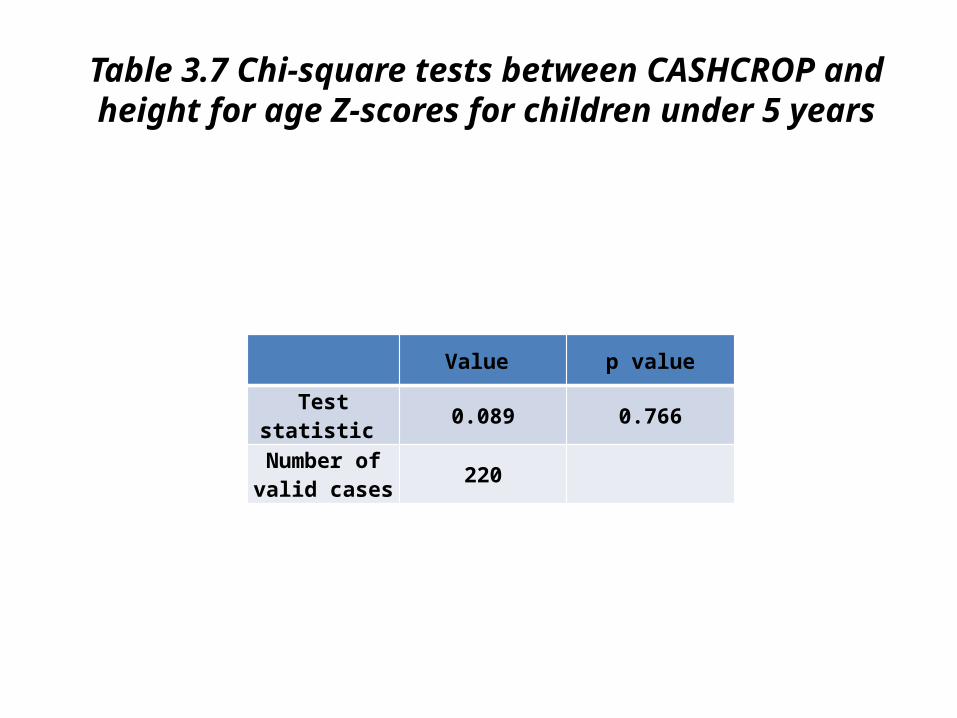
Table 3.7 Chi-square tests between CASHCROP and height for age Z-scores for children under 5 years
Value p value
Test statistic 0.089 0.766
Number of valid cases 220
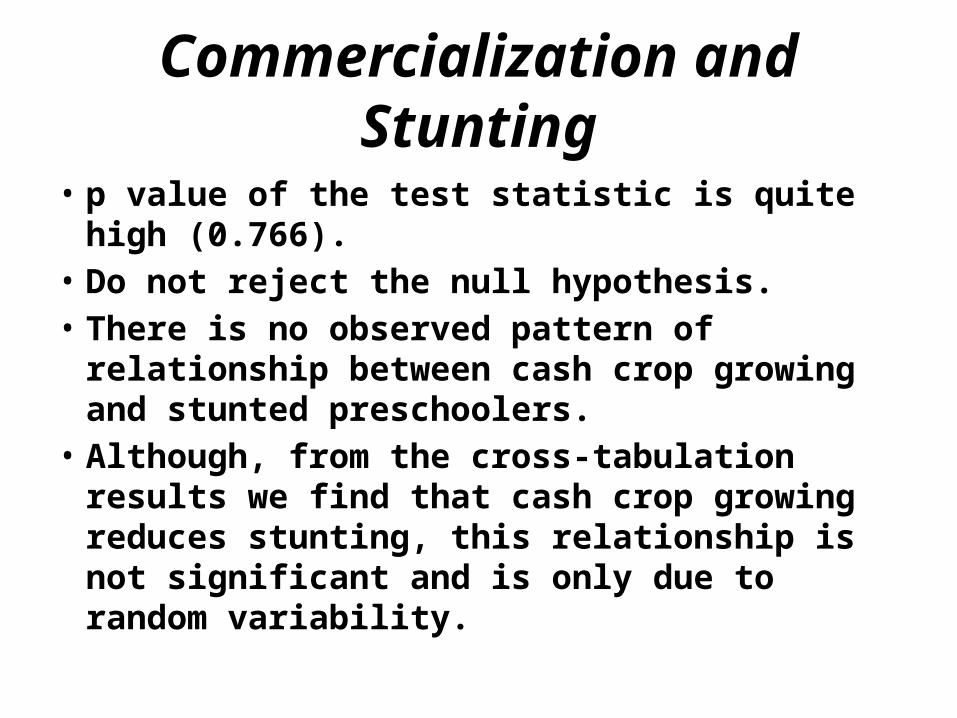
Commercialization and Stunting
• p value of the test statistic is quite high (0.766). • Do not reject the null hypothesis. • There is no observed pattern of relationship
between cash crop growing and stunted preschoolers.
• Although, from the cross-tabulation results we find that cash crop growing reduces stunting, this relationship is not significant and is only due to random variability.
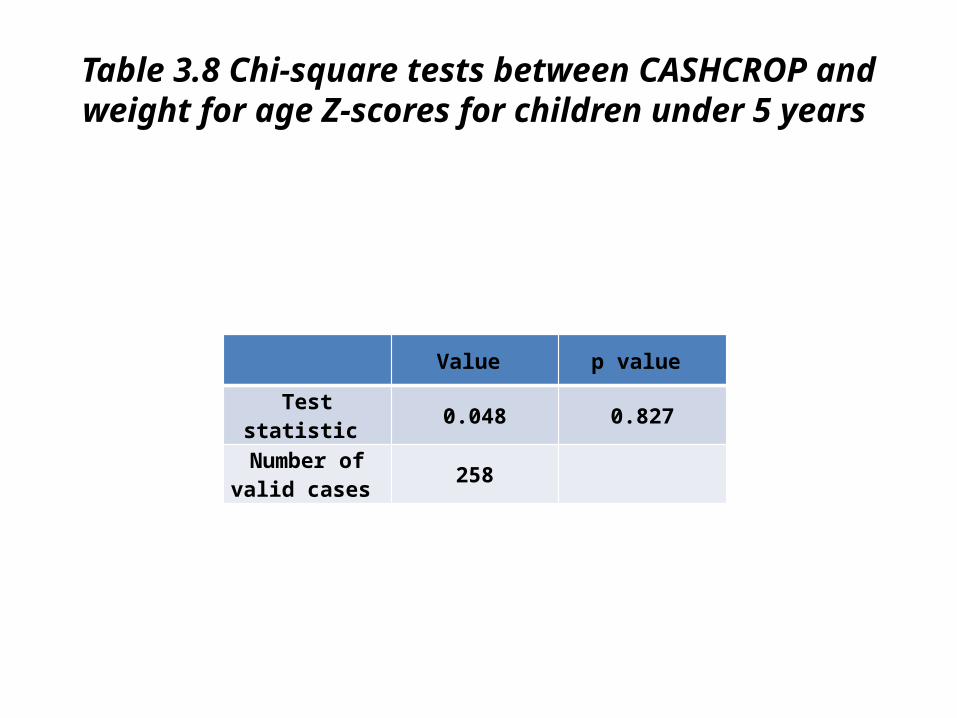
Table 3.8 Chi-square tests between CASHCROP and weight for age Z-scores for children under 5 years
Value p value
Test statistic 0.048 0.827
Number of valid cases 258
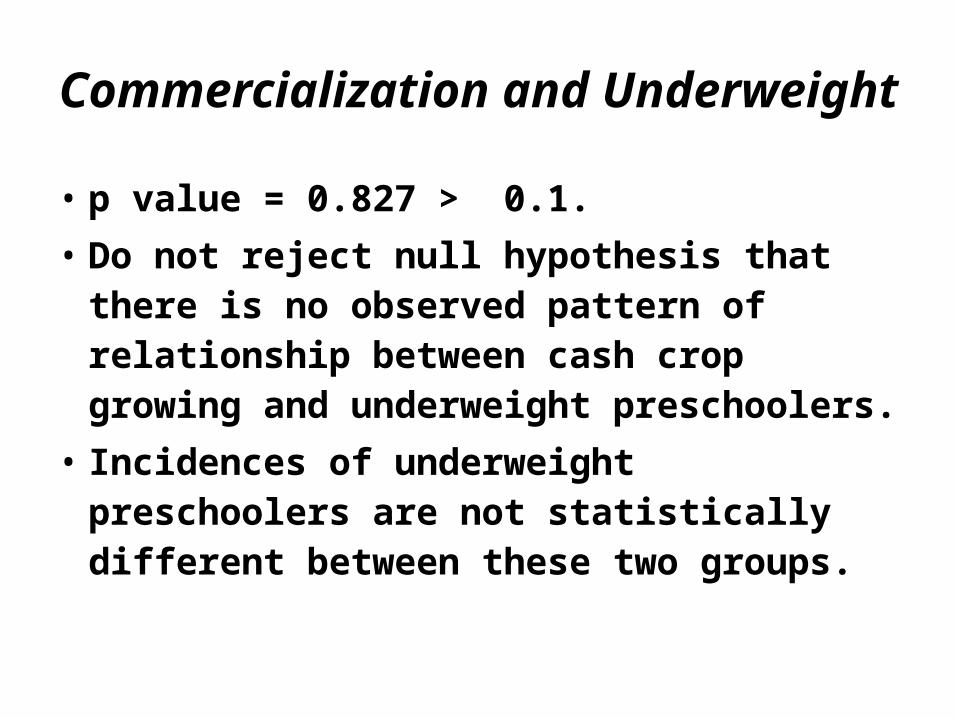
Commercialization and Underweight
• p value = 0.827 > 0.1. • Do not reject null hypothesis that there is no
observed pattern of relationship between cash crop growing and underweight preschoolers.
• Incidences of underweight preschoolers are not statistically different between these two groups.
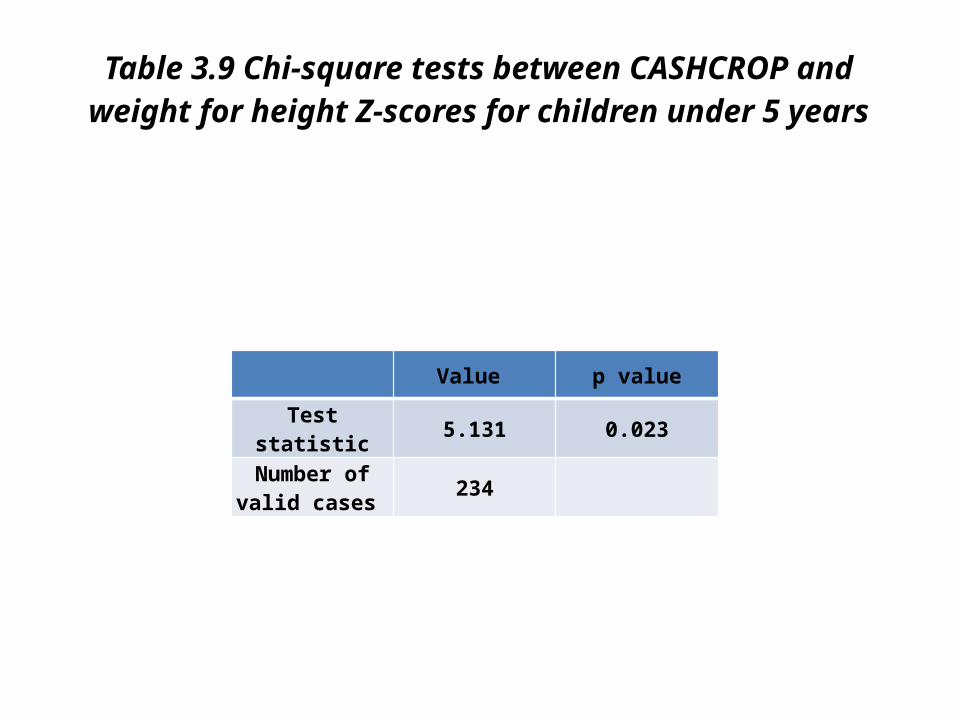
Table 3.9 Chi-square tests between CASHCROP and weight for height Z-scores for children under 5 years
Value p value
Test statistic 5.131 0.023
Number of valid cases 234
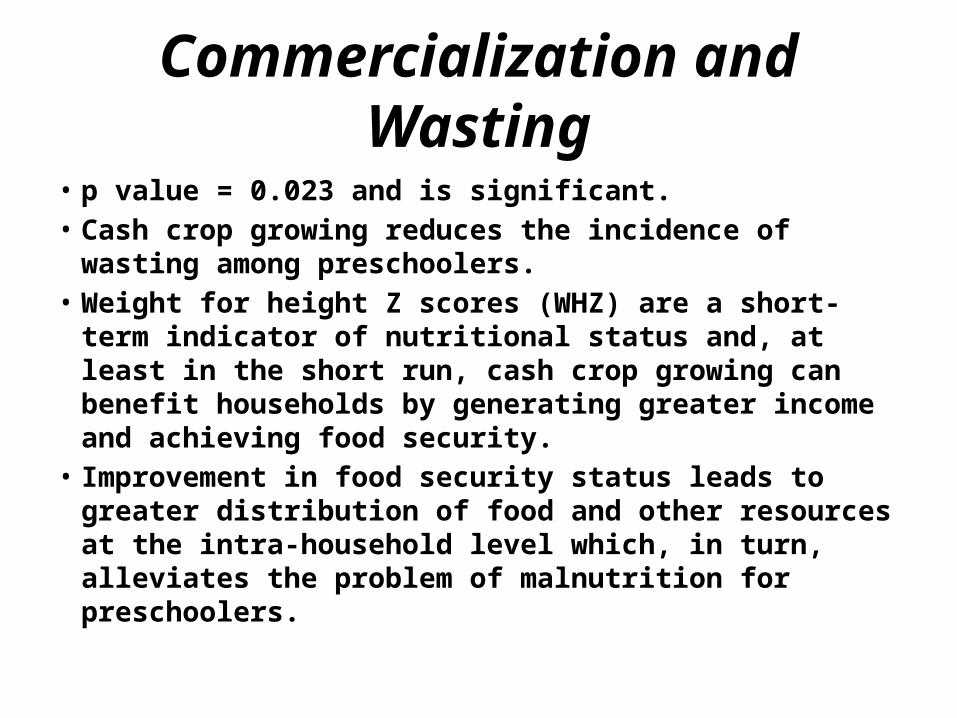
Commercialization and Wasting
• p value = 0.023 and is significant. • Cash crop growing reduces the incidence of wasting
among preschoolers. • Weight for height Z scores (WHZ) are a short-term
indicator of nutritional status and, at least in the short run, cash crop growing can benefit households by generating greater income and achieving food security.
• Improvement in food security status leads to greater distribution of food and other resources at the intra-household level which, in turn, alleviates the problem of malnutrition for preschoolers.