Embed Size (px)
Citation preview
Andy Solomon / Doug CordsCommercial Retail Associates, Inc.680 West Shaw Avenue, Suite 202
Fresno, CA 93704(559) 650-1300
This statement with the information it contains is given with the understanding that all negotiations relating to the purchase, renting or leasing of the property described above shallbe conducted through this office. The above information, while not guaranteed, has been secured from sources we believe to be reliable.
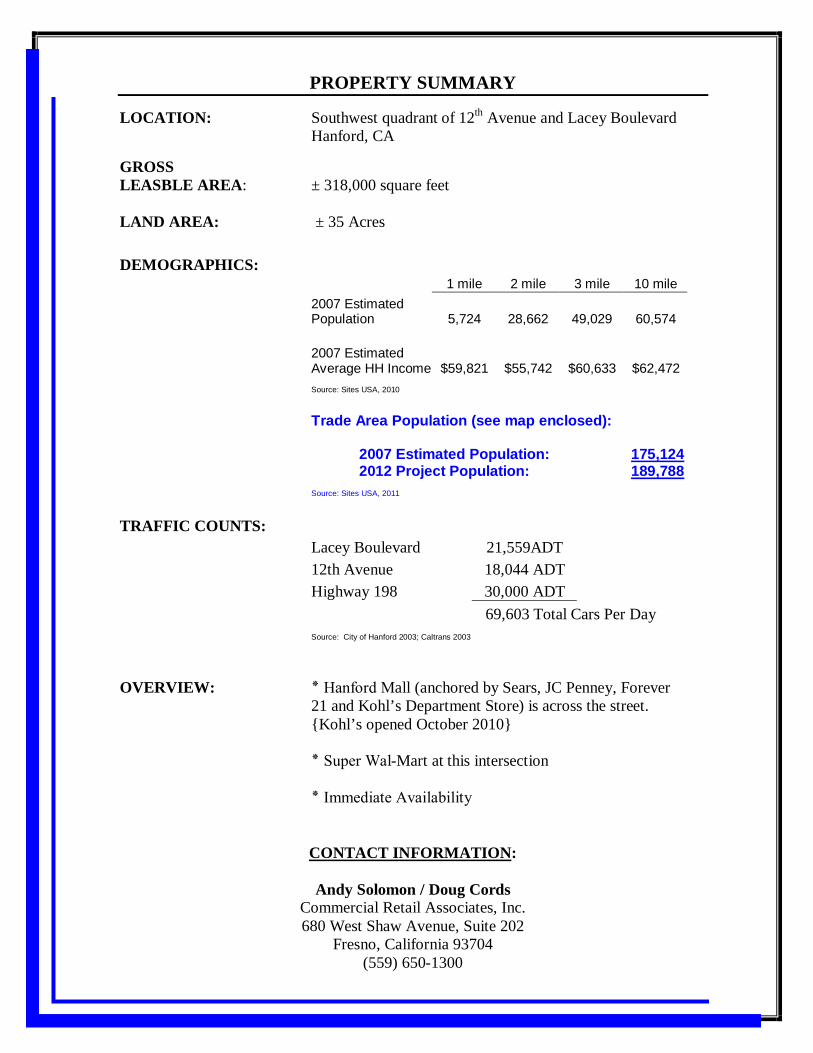
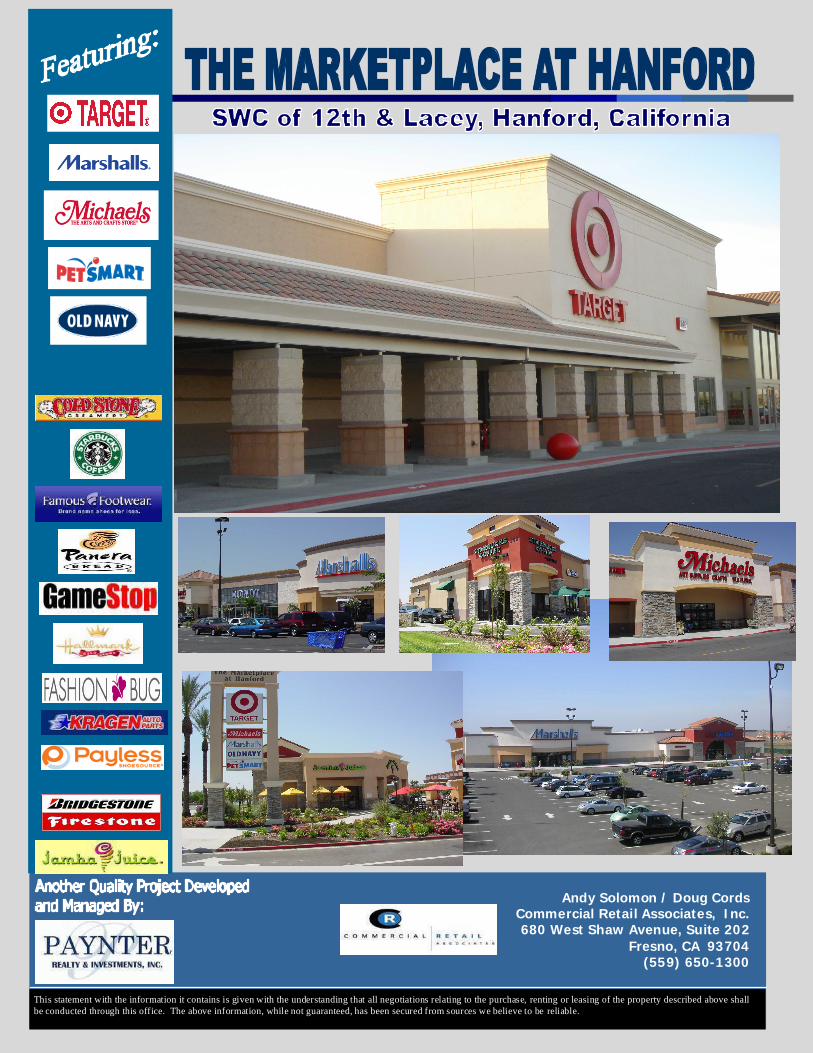
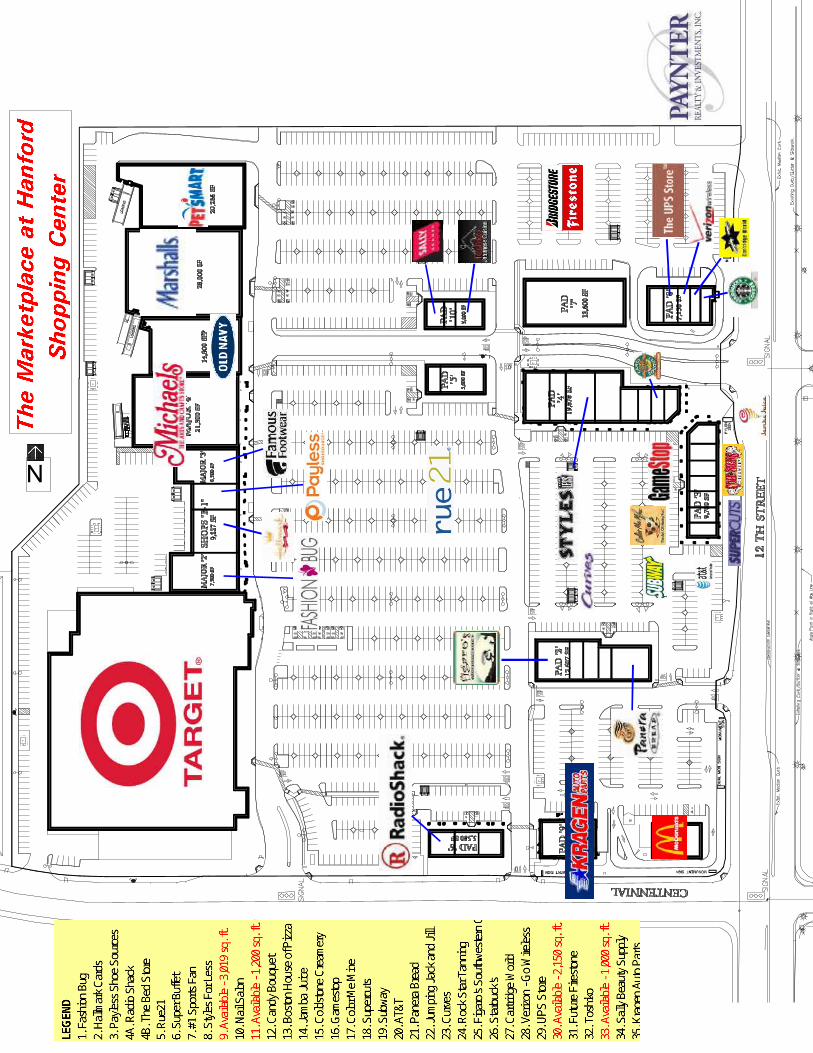
PROPERTY SUMMARY
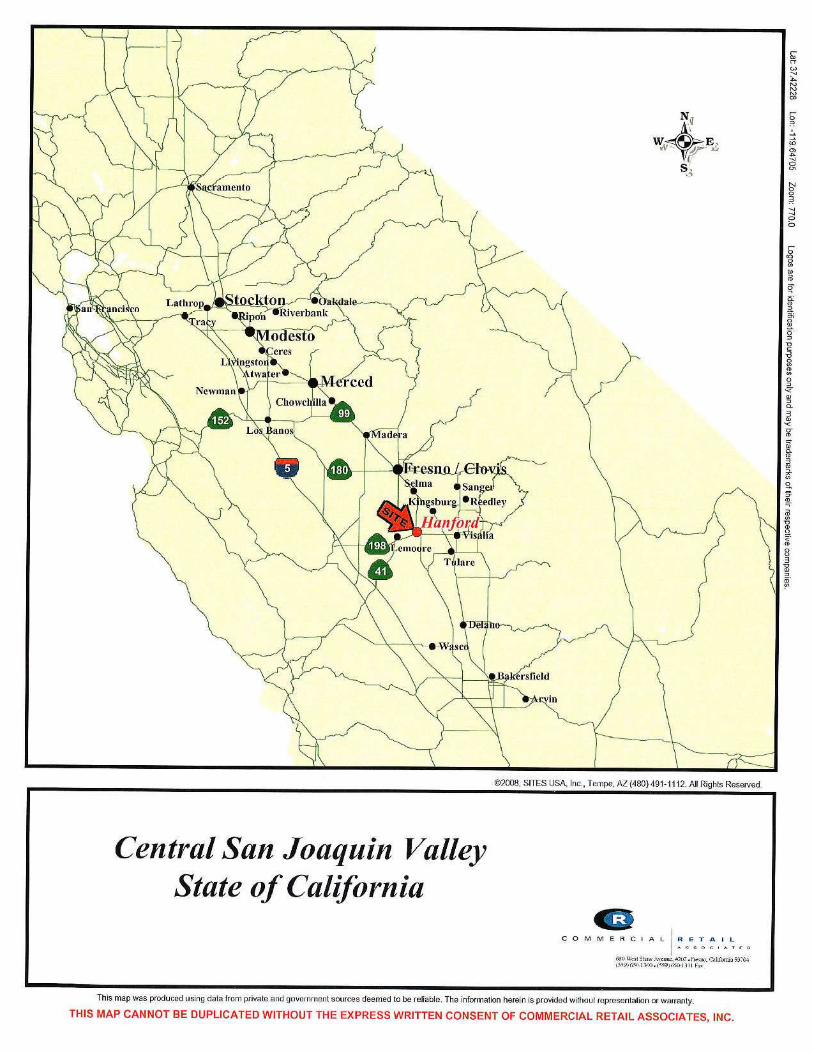
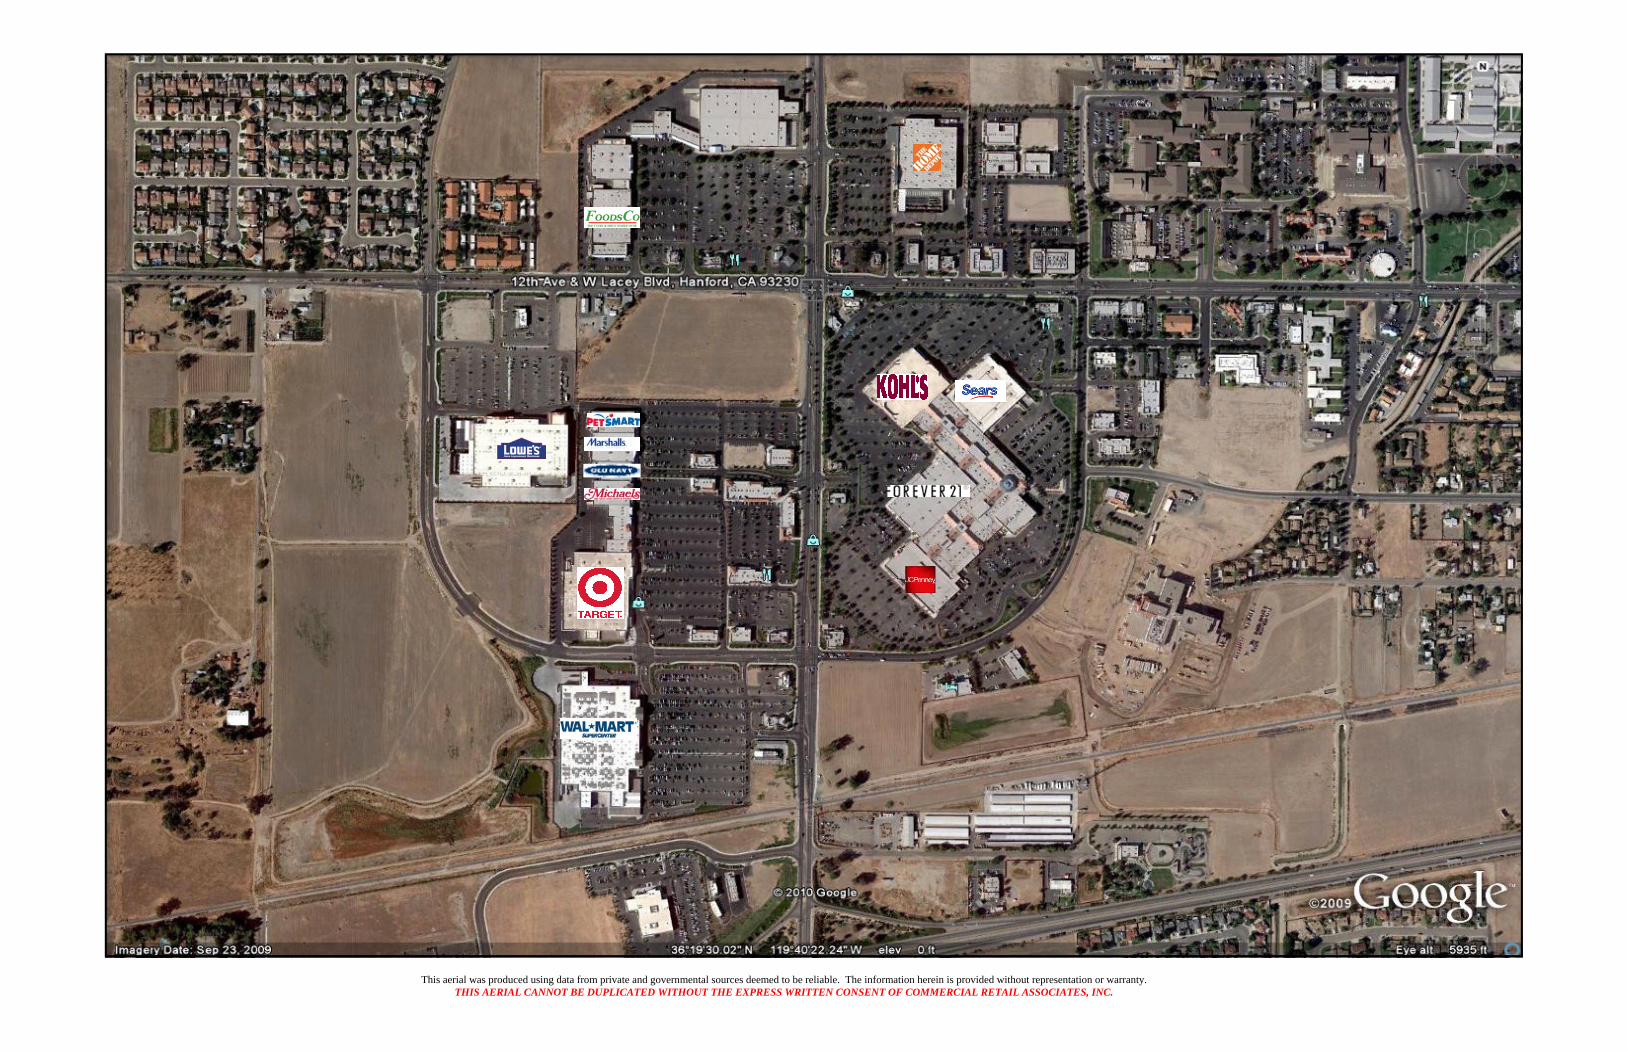
LOCATION: Southwest quadrant of 12th Avenue and Lacey BoulevardHanford, CA
GROSSLEASBLE AREA: ± 318,000 square feet
LAND AREA: ± 35 Acres
DEMOGRAPHICS:1 mile 2 mile 3 mile 10 mile
2007 EstimatedPopulation 5,724 28,662 49,029 60,574
2007 EstimatedAverage HH Income $59,821 $55,742 $60,633 $62,472
Source: Sites USA, 2010
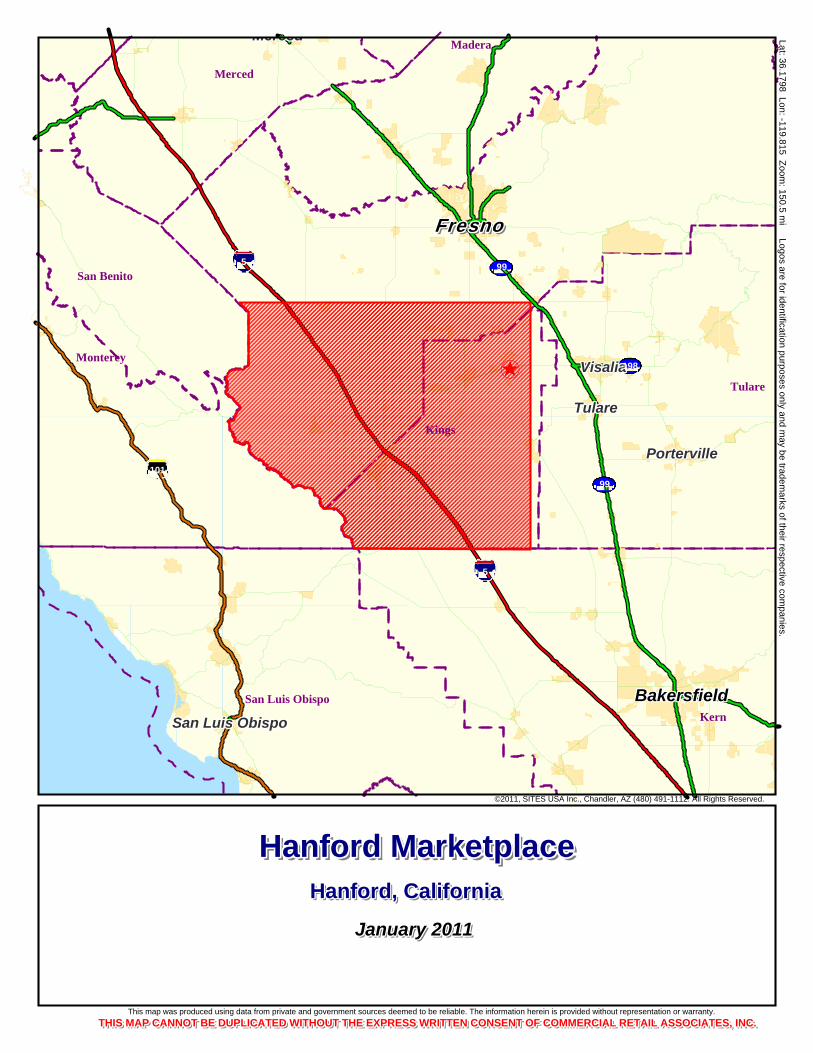
Trade Area Population (see map enclosed):
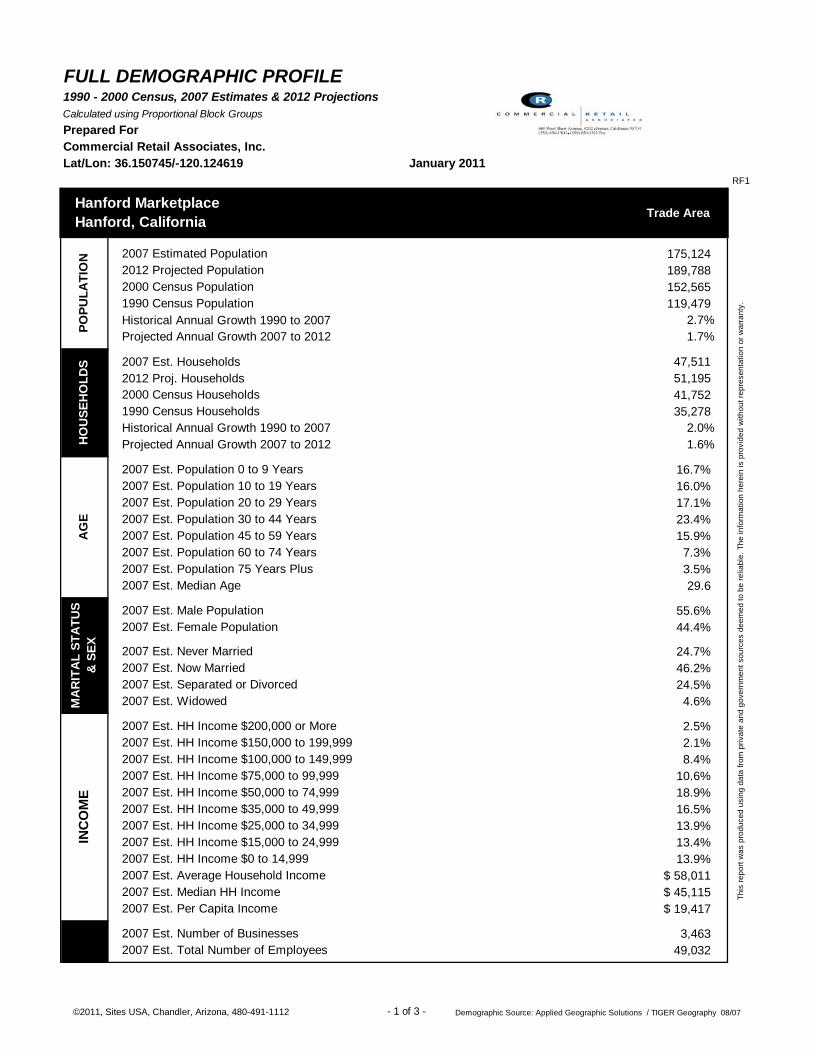
2007 Estimated Population: 175,1242012 Project Population: 189,788
Source: Sites USA, 2011
TRAFFIC COUNTS:
Lacey Boulevard 21,559ADT
12th Avenue 18,044 ADT
Highway 198 30,000 ADT
69,603 Total Cars Per Day
Source: City of Hanford 2003; Caltrans 2003
OVERVIEW: Hanford Mall ٭ (anchored by Sears, JC Penney, Forever21 and Kohl’s Department Store) is across the street.{Kohl’s opened October 2010}
Super Wal-Mart ٭ at this intersection
Immediate Availability ٭
CONTACT INFORMATION:
Andy Solomon / Doug CordsCommercial Retail Associates, Inc.680 West Shaw Avenue, Suite 202
Fresno, California 93704(559) 650-1300
N
nnnnnnnnnnnnnnnnnnnnnnnnnnnnnnnnnnnnnnnnnnnnnnnnn
FresnoFresnoFresnoFresnoFresnoFresnoFresnoFresnoFresnoFresno
BakersfieldBakersfieldBakersfieldBakersfieldBakersfieldBakersfieldBakersfieldBakersfieldBakersfield
VisaliaVisaliaVisaliaVisaliaVisaliaVisaliaVisaliaVisaliaVisalia
TulareTulareTulareTulareTulareTulareTulareTulareTulare
PortervillePortervillePortervillePortervillePortervillePortervillePortervillePortervillePorterville
MercedMercedMercedMercedMercedMercedMercedMercedMerced
San Luis ObispoSan Luis ObispoSan Luis ObispoSan Luis ObispoSan Luis ObispoSan Luis ObispoSan Luis ObispoSan Luis ObispoSan Luis Obispo
Tulare
Merced
Monterey
San Benito
San Luis Obispo
Madera
Kern
Kings
995
5
99
198
101
Hanford MarketplaceHanford MarketplaceHanford MarketplaceHanford MarketplaceHanford MarketplaceHanford MarketplaceHanford MarketplaceHanford MarketplaceHanford MarketplaceHanford MarketplaceHanford, CaliforniaHanford, CaliforniaHanford, CaliforniaHanford, CaliforniaHanford, CaliforniaHanford, CaliforniaHanford, CaliforniaHanford, CaliforniaHanford, CaliforniaHanford, California
January 2011January 2011January 2011January 2011January 2011January 2011January 2011January 2011January 2011January 2011
Lat: 36.1798 Lon: -119.815 Zoom: 150.5 m
i Logos are for identification purposes only and may be tradem
arks of their respective companies.
©2011, SITES USA Inc., Chandler, AZ (480) 491-1112. All Rights Reserved.
This map was produced using data from private and government sources deemed to be reliable. The information herein is provided without representation or warranty.
THIS MAP CANNOT BE DUPLICATED WITHOUT THE EXPRESS WRITTEN CONSENT OF COMMERCIAL RETAIL ASSOCIATES, INC.THIS MAP CANNOT BE DUPLICATED WITHOUT THE EXPRESS WRITTEN CONSENT OF COMMERCIAL RETAIL ASSOCIATES, INC.THIS MAP CANNOT BE DUPLICATED WITHOUT THE EXPRESS WRITTEN CONSENT OF COMMERCIAL RETAIL ASSOCIATES, INC.THIS MAP CANNOT BE DUPLICATED WITHOUT THE EXPRESS WRITTEN CONSENT OF COMMERCIAL RETAIL ASSOCIATES, INC.THIS MAP CANNOT BE DUPLICATED WITHOUT THE EXPRESS WRITTEN CONSENT OF COMMERCIAL RETAIL ASSOCIATES, INC.THIS MAP CANNOT BE DUPLICATED WITHOUT THE EXPRESS WRITTEN CONSENT OF COMMERCIAL RETAIL ASSOCIATES, INC.THIS MAP CANNOT BE DUPLICATED WITHOUT THE EXPRESS WRITTEN CONSENT OF COMMERCIAL RETAIL ASSOCIATES, INC.THIS MAP CANNOT BE DUPLICATED WITHOUT THE EXPRESS WRITTEN CONSENT OF COMMERCIAL RETAIL ASSOCIATES, INC.THIS MAP CANNOT BE DUPLICATED WITHOUT THE EXPRESS WRITTEN CONSENT OF COMMERCIAL RETAIL ASSOCIATES, INC.THIS MAP CANNOT BE DUPLICATED WITHOUT THE EXPRESS WRITTEN CONSENT OF COMMERCIAL RETAIL ASSOCIATES, INC.
This aerial was produced using data from private and governmental sources deemed to be reliable. The information herein is provided without representation or warranty. THIS AERIAL CANNOT BE DUPLICATED WITHOUT THE EXPRESS WRITTEN CONSENT OF COMMERCIAL RETAIL ASSOCIATES, INC.
FULL DEMOGRAPHIC PROFILE1990 - 2000 Census, 2007 Estimates & 2012 ProjectionsCalculated using Proportional Block GroupsPrepared ForCommercial Retail Associates, Inc.Lat/Lon: 36.150745/-120.124619
RF1
Trade Area
2007 Estimated Population 175,124 2012 Projected Population 189,788 2000 Census Population 152,565 1990 Census Population 119,479 Historical Annual Growth 1990 to 2007 2.7% Projected Annual Growth 2007 to 2012 1.7%
2007 Est. Households 47,511 2012 Proj. Households 51,195 2000 Census Households 41,752 1990 Census Households 35,278 Historical Annual Growth 1990 to 2007 2.0% Projected Annual Growth 2007 to 2012 1.6%
2007 Est. Population 0 to 9 Years 16.7% 2007 Est. Population 10 to 19 Years 16.0% 2007 Est. Population 20 to 29 Years 17.1% 2007 Est. Population 30 to 44 Years 23.4% 2007 Est. Population 45 to 59 Years 15.9% 2007 Est. Population 60 to 74 Years 7.3% 2007 Est. Population 75 Years Plus 3.5% 2007 Est. Median Age 29.6
2007 Est. Male Population 55.6% 2007 Est. Female Population 44.4%
2007 Est. Never Married 24.7% 2007 Est. Now Married 46.2% 2007 Est. Separated or Divorced 24.5% 2007 Est. Widowed 4.6%
2007 Est. HH Income $200,000 or More 2.5% 2007 Est. HH Income $150,000 to 199,999 2.1% 2007 Est. HH Income $100,000 to 149,999 8.4% 2007 Est. HH Income $75,000 to 99,999 10.6% 2007 Est. HH Income $50,000 to 74,999 18.9% 2007 Est. HH Income $35,000 to 49,999 16.5% 2007 Est. HH Income $25,000 to 34,999 13.9% 2007 Est. HH Income $15,000 to 24,999 13.4% 2007 Est. HH Income $0 to 14,999 13.9% 2007 Est. Average Household Income $ 58,011 2007 Est. Median HH Income $ 45,115 2007 Est. Per Capita Income $ 19,417
2007 Est. Number of Businesses 3,463 2007 Est. Total Number of Employees 49,032
January 2011
This
repo
rt w
as p
rodu
ced
usin
g da
ta fr
om p
rivat
e an
d go
vern
men
t sou
rces
dee
med
to b
e re
liabl
e. T
he in
form
atio
n he
rein
is p
rovi
ded
with
out r
epre
sent
atio
n or
war
rant
y.
Hanford Marketplace Hanford, California
INC
OM
EH
OU
SEH
OLD
SA
GE
MA
RIT
AL
STA
TUS
&
SEX
POPU
LATI
ON
- 1 of 3 -©2011, Sites USA, Chandler, Arizona, 480-491-1112 Demographic Source: Applied Geographic Solutions / TIGER Geography 08/07
FULL DEMOGRAPHIC PROFILE1990 - 2000 Census, 2007 Estimates & 2012 ProjectionsCalculated using Proportional Block GroupsPrepared ForCommercial Retail Associates, Inc.Lat/Lon: 36.150745/-120.124619
RF1
Trade Area
January 2011
Hanford Marketplace Hanford, California
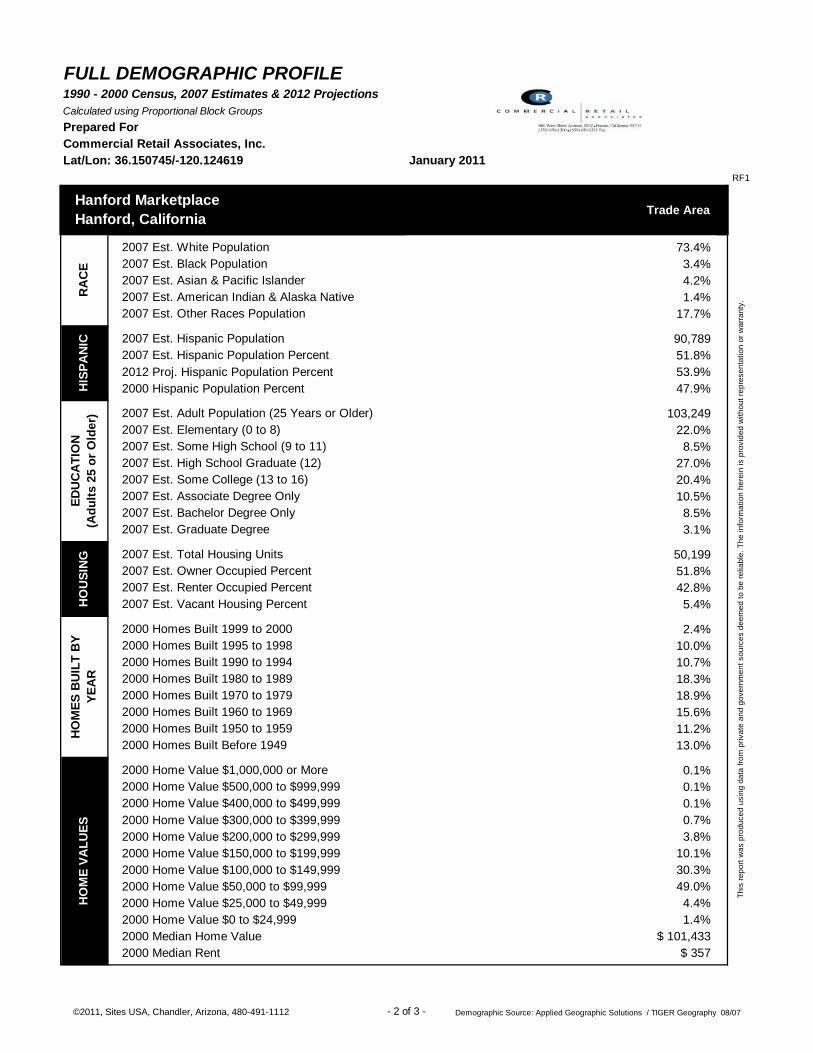
2007 Est. White Population 73.4% 2007 Est. Black Population 3.4% 2007 Est. Asian & Pacific Islander 4.2% 2007 Est. American Indian & Alaska Native 1.4% 2007 Est. Other Races Population 17.7%
2007 Est. Hispanic Population 90,789 2007 Est. Hispanic Population Percent 51.8% 2012 Proj. Hispanic Population Percent 53.9% 2000 Hispanic Population Percent 47.9%
2007 Est. Adult Population (25 Years or Older) 103,249 2007 Est. Elementary (0 to 8) 22.0% 2007 Est. Some High School (9 to 11) 8.5% 2007 Est. High School Graduate (12) 27.0% 2007 Est. Some College (13 to 16) 20.4% 2007 Est. Associate Degree Only 10.5% 2007 Est. Bachelor Degree Only 8.5% 2007 Est. Graduate Degree 3.1%
2007 Est. Total Housing Units 50,199 2007 Est. Owner Occupied Percent 51.8% 2007 Est. Renter Occupied Percent 42.8% 2007 Est. Vacant Housing Percent 5.4%
2000 Homes Built 1999 to 2000 2.4% 2000 Homes Built 1995 to 1998 10.0% 2000 Homes Built 1990 to 1994 10.7% 2000 Homes Built 1980 to 1989 18.3% 2000 Homes Built 1970 to 1979 18.9% 2000 Homes Built 1960 to 1969 15.6% 2000 Homes Built 1950 to 1959 11.2% 2000 Homes Built Before 1949 13.0%
2000 Home Value $1,000,000 or More 0.1% 2000 Home Value $500,000 to $999,999 0.1% 2000 Home Value $400,000 to $499,999 0.1% 2000 Home Value $300,000 to $399,999 0.7% 2000 Home Value $200,000 to $299,999 3.8% 2000 Home Value $150,000 to $199,999 10.1% 2000 Home Value $100,000 to $149,999 30.3% 2000 Home Value $50,000 to $99,999 49.0% 2000 Home Value $25,000 to $49,999 4.4% 2000 Home Value $0 to $24,999 1.4% 2000 Median Home Value $ 101,433 2000 Median Rent $ 357
This
repo
rt w
as p
rodu
ced
usin
g da
ta fr
om p
rivat
e an
d go
vern
men
t sou
rces
dee
med
to b
e re
liabl
e. T
he in
form
atio
n he
rein
is p
rovi
ded
with
out r
epre
sent
atio
n or
war
rant
y.
HIS
PAN
ICH
OM
E VA
LUES
HO
USI
NG
EDU
CA
TIO
N
(A
dults
25
or O
lder
)R
AC
EH
OM
ES B
UIL
T B
Y YE
AR
- 2 of 3 -©2011, Sites USA, Chandler, Arizona, 480-491-1112 Demographic Source: Applied Geographic Solutions / TIGER Geography 08/07
FULL DEMOGRAPHIC PROFILE1990 - 2000 Census, 2007 Estimates & 2012 ProjectionsCalculated using Proportional Block GroupsPrepared ForCommercial Retail Associates, Inc.Lat/Lon: 36.150745/-120.124619
RF1
Trade Area
January 2011
Hanford Marketplace Hanford, California
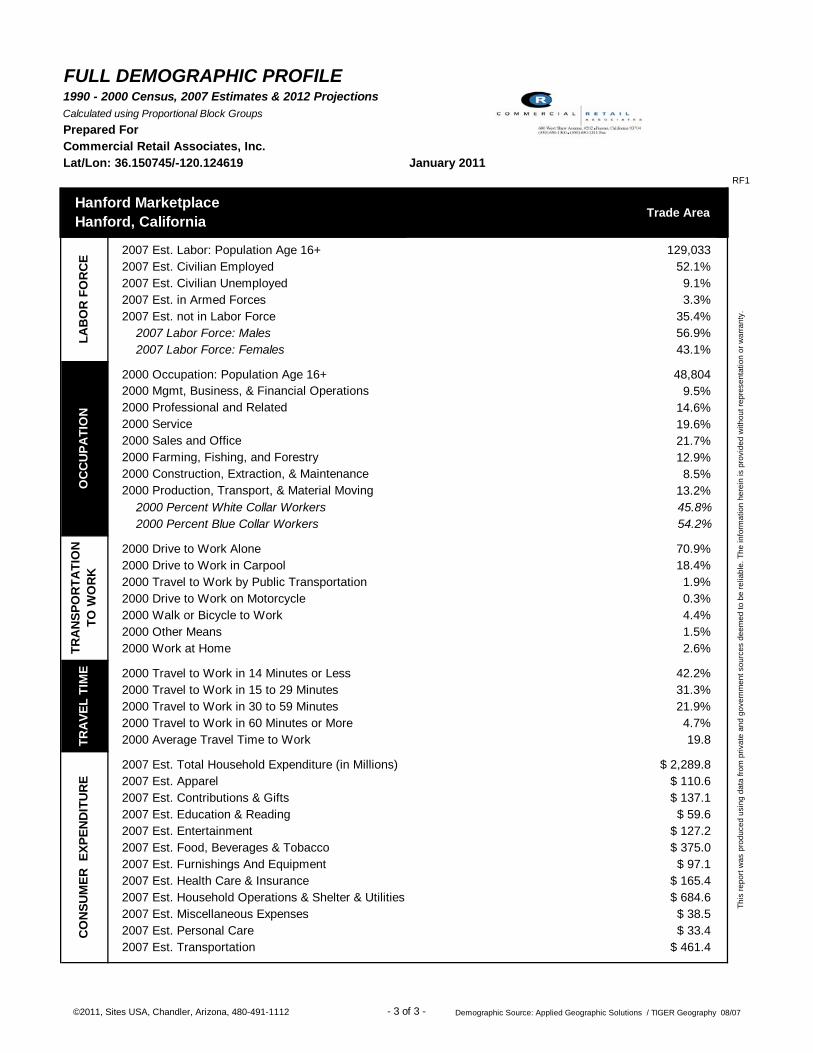
2007 Est. Labor: Population Age 16+ 129,033 2007 Est. Civilian Employed 52.1% 2007 Est. Civilian Unemployed 9.1% 2007 Est. in Armed Forces 3.3% 2007 Est. not in Labor Force 35.4% 2007 Labor Force: Males 56.9% 2007 Labor Force: Females 43.1%
2000 Occupation: Population Age 16+ 48,804 2000 Mgmt, Business, & Financial Operations 9.5% 2000 Professional and Related 14.6% 2000 Service 19.6% 2000 Sales and Office 21.7% 2000 Farming, Fishing, and Forestry 12.9% 2000 Construction, Extraction, & Maintenance 8.5% 2000 Production, Transport, & Material Moving 13.2% 2000 Percent White Collar Workers 45.8% 2000 Percent Blue Collar Workers 54.2%
2000 Drive to Work Alone 70.9% 2000 Drive to Work in Carpool 18.4% 2000 Travel to Work by Public Transportation 1.9% 2000 Drive to Work on Motorcycle 0.3% 2000 Walk or Bicycle to Work 4.4% 2000 Other Means 1.5% 2000 Work at Home 2.6%
2000 Travel to Work in 14 Minutes or Less 42.2% 2000 Travel to Work in 15 to 29 Minutes 31.3% 2000 Travel to Work in 30 to 59 Minutes 21.9% 2000 Travel to Work in 60 Minutes or More 4.7% 2000 Average Travel Time to Work 19.8
2007 Est. Total Household Expenditure (in Millions) $ 2,289.8 2007 Est. Apparel $ 110.6 2007 Est. Contributions & Gifts $ 137.1 2007 Est. Education & Reading $ 59.6 2007 Est. Entertainment $ 127.2 2007 Est. Food, Beverages & Tobacco $ 375.0 2007 Est. Furnishings And Equipment $ 97.1 2007 Est. Health Care & Insurance $ 165.4 2007 Est. Household Operations & Shelter & Utilities $ 684.6 2007 Est. Miscellaneous Expenses $ 38.5 2007 Est. Personal Care $ 33.4 2007 Est. Transportation $ 461.4
This
repo
rt w
as p
rodu
ced
usin
g da
ta fr
om p
rivat
e an
d go
vern
men
t sou
rces
dee
med
to b
e re
liabl
e. T
he in
form
atio
n he
rein
is p
rovi
ded
with
out r
epre
sent
atio
n or
war
rant
y.
CO
NSU
MER
EXP
END
ITU
RE
TRA
NSP
OR
TATI
ON
TO
WO
RK
TRA
VEL
TIM
EO
CC
UPA
TIO
NLA
BO
R F
OR
CE
- 3 of 3 -©2011, Sites USA, Chandler, Arizona, 480-491-1112 Demographic Source: Applied Geographic Solutions / TIGER Geography 08/07
FULL DEMOGRAPHIC PROFILE1990 - 2000 Census, 2007 Estimates & 2012 ProjectionsCalculated using Proportional Block GroupsPrepared ForCommercial Retail Associates, Inc.Lat/Lon: 36.328006/-119.672968
RF1
1.00 mi radius
2.00 mi radius
3.00 mi radius
5.00 mi radius
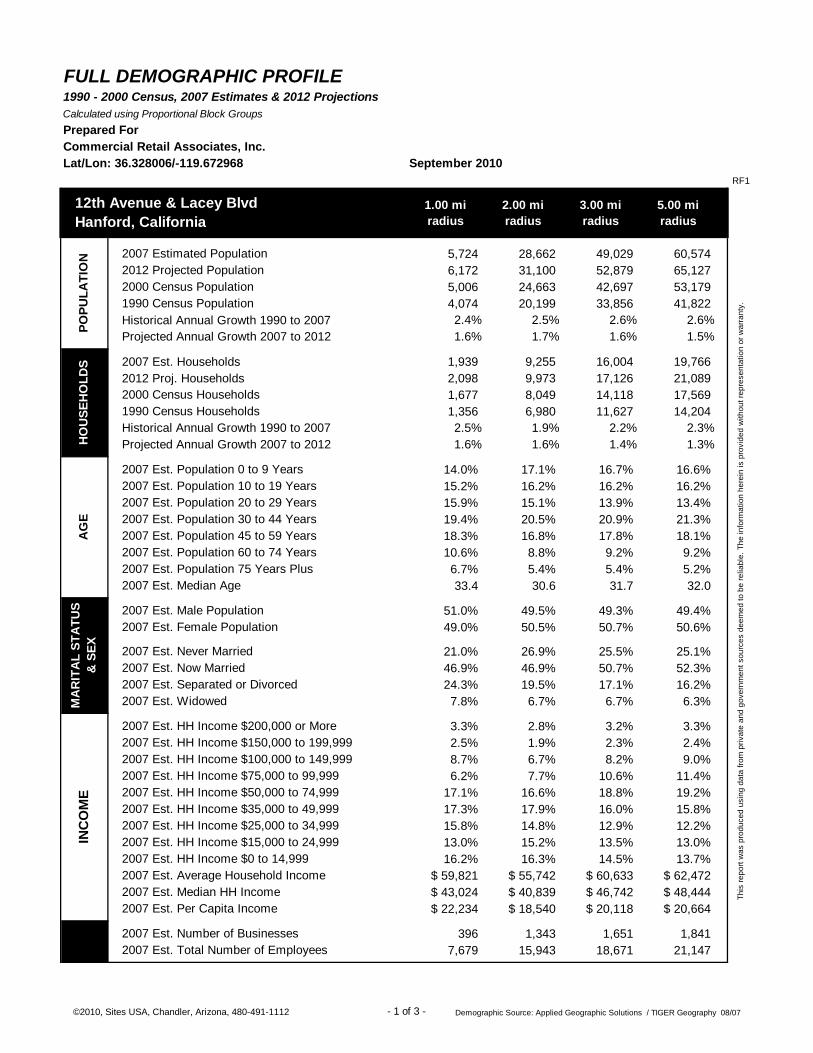
2007 Estimated Population 5,724 28,662 49,029 60,574 2012 Projected Population 6,172 31,100 52,879 65,127 2000 Census Population 5,006 24,663 42,697 53,179 1990 Census Population 4,074 20,199 33,856 41,822 Historical Annual Growth 1990 to 2007 2.4% 2.5% 2.6% 2.6% Projected Annual Growth 2007 to 2012 1.6% 1.7% 1.6% 1.5%
2007 Est. Households 1,939 9,255 16,004 19,766 2012 Proj. Households 2,098 9,973 17,126 21,089 2000 Census Households 1,677 8,049 14,118 17,569 1990 Census Households 1,356 6,980 11,627 14,204 Historical Annual Growth 1990 to 2007 2.5% 1.9% 2.2% 2.3% Projected Annual Growth 2007 to 2012 1.6% 1.6% 1.4% 1.3%
2007 Est. Population 0 to 9 Years 14.0% 17.1% 16.7% 16.6% 2007 Est. Population 10 to 19 Years 15.2% 16.2% 16.2% 16.2% 2007 Est. Population 20 to 29 Years 15.9% 15.1% 13.9% 13.4% 2007 Est. Population 30 to 44 Years 19.4% 20.5% 20.9% 21.3% 2007 Est. Population 45 to 59 Years 18.3% 16.8% 17.8% 18.1% 2007 Est. Population 60 to 74 Years 10.6% 8.8% 9.2% 9.2% 2007 Est. Population 75 Years Plus 6.7% 5.4% 5.4% 5.2% 2007 Est. Median Age 33.4 30.6 31.7 32.0
2007 Est. Male Population 51.0% 49.5% 49.3% 49.4% 2007 Est. Female Population 49.0% 50.5% 50.7% 50.6%
2007 Est. Never Married 21.0% 26.9% 25.5% 25.1% 2007 Est. Now Married 46.9% 46.9% 50.7% 52.3% 2007 Est. Separated or Divorced 24.3% 19.5% 17.1% 16.2% 2007 Est. Widowed 7.8% 6.7% 6.7% 6.3%
2007 Est. HH Income $200,000 or More 3.3% 2.8% 3.2% 3.3% 2007 Est. HH Income $150,000 to 199,999 2.5% 1.9% 2.3% 2.4% 2007 Est. HH Income $100,000 to 149,999 8.7% 6.7% 8.2% 9.0% 2007 Est. HH Income $75,000 to 99,999 6.2% 7.7% 10.6% 11.4% 2007 Est. HH Income $50,000 to 74,999 17.1% 16.6% 18.8% 19.2% 2007 Est. HH Income $35,000 to 49,999 17.3% 17.9% 16.0% 15.8% 2007 Est. HH Income $25,000 to 34,999 15.8% 14.8% 12.9% 12.2% 2007 Est. HH Income $15,000 to 24,999 13.0% 15.2% 13.5% 13.0% 2007 Est. HH Income $0 to 14,999 16.2% 16.3% 14.5% 13.7% 2007 Est. Average Household Income $ 59,821 $ 55,742 $ 60,633 $ 62,472 2007 Est. Median HH Income $ 43,024 $ 40,839 $ 46,742 $ 48,444 2007 Est. Per Capita Income $ 22,234 $ 18,540 $ 20,118 $ 20,664
2007 Est. Number of Businesses 396 1,343 1,651 1,841 2007 Est. Total Number of Employees 7,679 15,943 18,671 21,147
AG
EM
AR
ITA
L ST
ATU
S
& S
EXPO
PULA
TIO
N
12th Avenue & Lacey Blvd Hanford, California
INC
OM
EH
OU
SEH
OLD
S
September 2010
This
repo
rt w
as p
rodu
ced
usin
g da
ta fr
om p
rivat
e an
d go
vern
men
t sou
rces
dee
med
to b
e re
liabl
e. T
he in
form
atio
n he
rein
is p
rovi
ded
with
out r
epre
sent
atio
n or
war
rant
y.
- 1 of 3 -©2010, Sites USA, Chandler, Arizona, 480-491-1112 Demographic Source: Applied Geographic Solutions / TIGER Geography 08/07
FULL DEMOGRAPHIC PROFILE1990 - 2000 Census, 2007 Estimates & 2012 ProjectionsCalculated using Proportional Block GroupsPrepared ForCommercial Retail Associates, Inc.Lat/Lon: 36.328006/-119.672968
RF1
1.00 mi radius
2.00 mi radius
3.00 mi radius
5.00 mi radius
12th Avenue & Lacey Blvd Hanford, California
September 2010
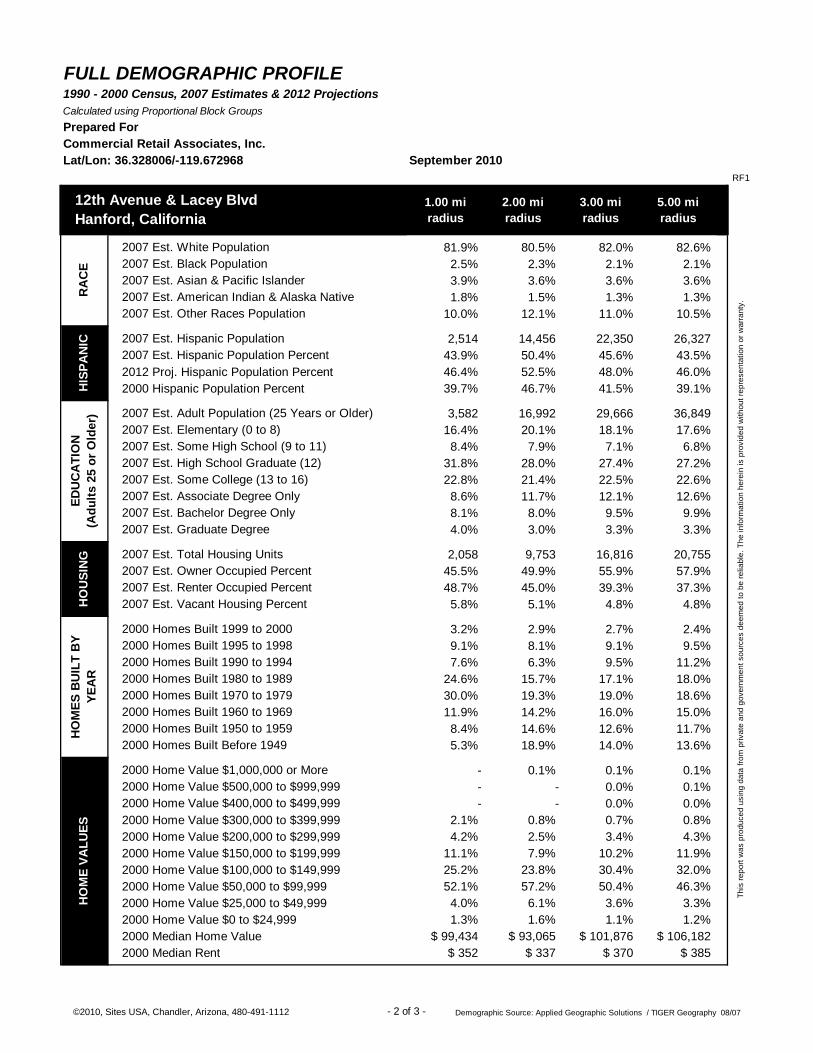
2007 Est. White Population 81.9% 80.5% 82.0% 82.6% 2007 Est. Black Population 2.5% 2.3% 2.1% 2.1% 2007 Est. Asian & Pacific Islander 3.9% 3.6% 3.6% 3.6% 2007 Est. American Indian & Alaska Native 1.8% 1.5% 1.3% 1.3% 2007 Est. Other Races Population 10.0% 12.1% 11.0% 10.5%
2007 Est. Hispanic Population 2,514 14,456 22,350 26,327 2007 Est. Hispanic Population Percent 43.9% 50.4% 45.6% 43.5% 2012 Proj. Hispanic Population Percent 46.4% 52.5% 48.0% 46.0% 2000 Hispanic Population Percent 39.7% 46.7% 41.5% 39.1%
2007 Est. Adult Population (25 Years or Older) 3,582 16,992 29,666 36,849 2007 Est. Elementary (0 to 8) 16.4% 20.1% 18.1% 17.6% 2007 Est. Some High School (9 to 11) 8.4% 7.9% 7.1% 6.8% 2007 Est. High School Graduate (12) 31.8% 28.0% 27.4% 27.2% 2007 Est. Some College (13 to 16) 22.8% 21.4% 22.5% 22.6% 2007 Est. Associate Degree Only 8.6% 11.7% 12.1% 12.6% 2007 Est. Bachelor Degree Only 8.1% 8.0% 9.5% 9.9% 2007 Est. Graduate Degree 4.0% 3.0% 3.3% 3.3%
2007 Est. Total Housing Units 2,058 9,753 16,816 20,755 2007 Est. Owner Occupied Percent 45.5% 49.9% 55.9% 57.9% 2007 Est. Renter Occupied Percent 48.7% 45.0% 39.3% 37.3% 2007 Est. Vacant Housing Percent 5.8% 5.1% 4.8% 4.8%
2000 Homes Built 1999 to 2000 3.2% 2.9% 2.7% 2.4% 2000 Homes Built 1995 to 1998 9.1% 8.1% 9.1% 9.5% 2000 Homes Built 1990 to 1994 7.6% 6.3% 9.5% 11.2% 2000 Homes Built 1980 to 1989 24.6% 15.7% 17.1% 18.0% 2000 Homes Built 1970 to 1979 30.0% 19.3% 19.0% 18.6% 2000 Homes Built 1960 to 1969 11.9% 14.2% 16.0% 15.0% 2000 Homes Built 1950 to 1959 8.4% 14.6% 12.6% 11.7% 2000 Homes Built Before 1949 5.3% 18.9% 14.0% 13.6%
2000 Home Value $1,000,000 or More - 0.1% 0.1% 0.1% 2000 Home Value $500,000 to $999,999 - - 0.0% 0.1% 2000 Home Value $400,000 to $499,999 - - 0.0% 0.0% 2000 Home Value $300,000 to $399,999 2.1% 0.8% 0.7% 0.8% 2000 Home Value $200,000 to $299,999 4.2% 2.5% 3.4% 4.3% 2000 Home Value $150,000 to $199,999 11.1% 7.9% 10.2% 11.9% 2000 Home Value $100,000 to $149,999 25.2% 23.8% 30.4% 32.0% 2000 Home Value $50,000 to $99,999 52.1% 57.2% 50.4% 46.3% 2000 Home Value $25,000 to $49,999 4.0% 6.1% 3.6% 3.3% 2000 Home Value $0 to $24,999 1.3% 1.6% 1.1% 1.2% 2000 Median Home Value $ 99,434 $ 93,065 $ 101,876 $ 106,182 2000 Median Rent $ 352 $ 337 $ 370 $ 385
HO
MES
BU
ILT
BY
YEA
RH
OU
SIN
GED
UC
ATI
ON
(Adu
lts 2
5 or
Old
er)
RA
CE
This
repo
rt w
as p
rodu
ced
usin
g da
ta fr
om p
rivat
e an
d go
vern
men
t sou
rces
dee
med
to b
e re
liabl
e. T
he in
form
atio
n he
rein
is p
rovi
ded
with
out r
epre
sent
atio
n or
war
rant
y.
HIS
PAN
ICH
OM
E VA
LUES
- 2 of 3 -©2010, Sites USA, Chandler, Arizona, 480-491-1112 Demographic Source: Applied Geographic Solutions / TIGER Geography 08/07
FULL DEMOGRAPHIC PROFILE1990 - 2000 Census, 2007 Estimates & 2012 ProjectionsCalculated using Proportional Block GroupsPrepared ForCommercial Retail Associates, Inc.Lat/Lon: 36.328006/-119.672968
RF1
1.00 mi radius
2.00 mi radius
3.00 mi radius
5.00 mi radius
12th Avenue & Lacey Blvd Hanford, California
September 2010
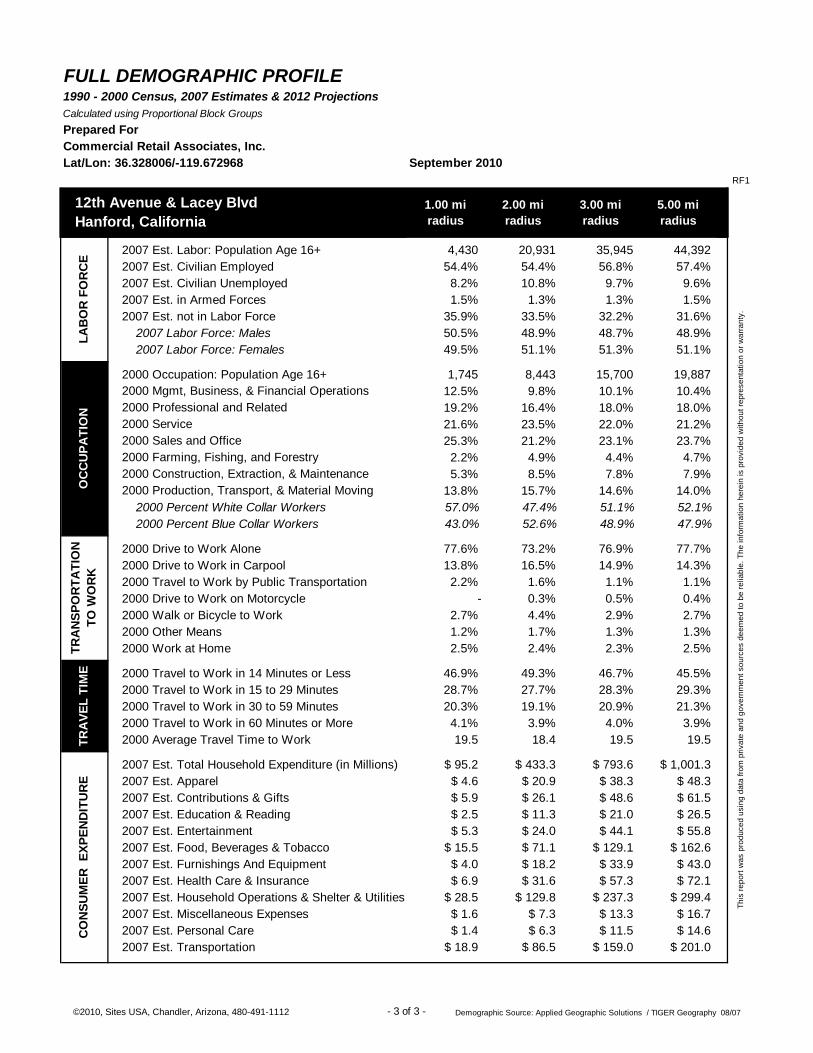
2007 Est. Labor: Population Age 16+ 4,430 20,931 35,945 44,392 2007 Est. Civilian Employed 54.4% 54.4% 56.8% 57.4% 2007 Est. Civilian Unemployed 8.2% 10.8% 9.7% 9.6% 2007 Est. in Armed Forces 1.5% 1.3% 1.3% 1.5% 2007 Est. not in Labor Force 35.9% 33.5% 32.2% 31.6% 2007 Labor Force: Males 50.5% 48.9% 48.7% 48.9% 2007 Labor Force: Females 49.5% 51.1% 51.3% 51.1%
2000 Occupation: Population Age 16+ 1,745 8,443 15,700 19,887 2000 Mgmt, Business, & Financial Operations 12.5% 9.8% 10.1% 10.4% 2000 Professional and Related 19.2% 16.4% 18.0% 18.0% 2000 Service 21.6% 23.5% 22.0% 21.2% 2000 Sales and Office 25.3% 21.2% 23.1% 23.7% 2000 Farming, Fishing, and Forestry 2.2% 4.9% 4.4% 4.7% 2000 Construction, Extraction, & Maintenance 5.3% 8.5% 7.8% 7.9% 2000 Production, Transport, & Material Moving 13.8% 15.7% 14.6% 14.0% 2000 Percent White Collar Workers 57.0% 47.4% 51.1% 52.1% 2000 Percent Blue Collar Workers 43.0% 52.6% 48.9% 47.9%
2000 Drive to Work Alone 77.6% 73.2% 76.9% 77.7% 2000 Drive to Work in Carpool 13.8% 16.5% 14.9% 14.3% 2000 Travel to Work by Public Transportation 2.2% 1.6% 1.1% 1.1% 2000 Drive to Work on Motorcycle - 0.3% 0.5% 0.4% 2000 Walk or Bicycle to Work 2.7% 4.4% 2.9% 2.7% 2000 Other Means 1.2% 1.7% 1.3% 1.3% 2000 Work at Home 2.5% 2.4% 2.3% 2.5%
2000 Travel to Work in 14 Minutes or Less 46.9% 49.3% 46.7% 45.5% 2000 Travel to Work in 15 to 29 Minutes 28.7% 27.7% 28.3% 29.3% 2000 Travel to Work in 30 to 59 Minutes 20.3% 19.1% 20.9% 21.3% 2000 Travel to Work in 60 Minutes or More 4.1% 3.9% 4.0% 3.9% 2000 Average Travel Time to Work 19.5 18.4 19.5 19.5
2007 Est. Total Household Expenditure (in Millions) $ 95.2 $ 433.3 $ 793.6 $ 1,001.3 2007 Est. Apparel $ 4.6 $ 20.9 $ 38.3 $ 48.3 2007 Est. Contributions & Gifts $ 5.9 $ 26.1 $ 48.6 $ 61.5 2007 Est. Education & Reading $ 2.5 $ 11.3 $ 21.0 $ 26.5 2007 Est. Entertainment $ 5.3 $ 24.0 $ 44.1 $ 55.8 2007 Est. Food, Beverages & Tobacco $ 15.5 $ 71.1 $ 129.1 $ 162.6 2007 Est. Furnishings And Equipment $ 4.0 $ 18.2 $ 33.9 $ 43.0 2007 Est. Health Care & Insurance $ 6.9 $ 31.6 $ 57.3 $ 72.1 2007 Est. Household Operations & Shelter & Utilities $ 28.5 $ 129.8 $ 237.3 $ 299.4 2007 Est. Miscellaneous Expenses $ 1.6 $ 7.3 $ 13.3 $ 16.7 2007 Est. Personal Care $ 1.4 $ 6.3 $ 11.5 $ 14.6 2007 Est. Transportation $ 18.9 $ 86.5 $ 159.0 $ 201.0
OC
CU
PATI
ON
LAB
OR
FO
RC
E
This
repo
rt w
as p
rodu
ced
usin
g da
ta fr
om p
rivat
e an
d go
vern
men
t sou
rces
dee
med
to b
e re
liabl
e. T
he in
form
atio
n he
rein
is p
rovi
ded
with
out r
epre
sent
atio
n or
war
rant
y.
CO
NSU
MER
EXP
END
ITU
RE
TRA
NSP
OR
TATI
ON
TO
WO
RK
TRA
VEL
TIM
E
- 3 of 3 -©2010, Sites USA, Chandler, Arizona, 480-491-1112 Demographic Source: Applied Geographic Solutions / TIGER Geography 08/07