Embed Size (px)
Citation preview
Commercial fisheries in the northwestern Gulf of Mexico:possible implications for conservation managementat the Flower Garden Banks National Marine Sanctuary
Juan C. LevesqueCSA International, Inc., Science Division, 8502 SW Kansas Avenue, Stuart, FL 34997, USA; formerly Geo-Marine Inc., Environmental ResourcesDivision, Marine Science Department, 2201 Avenue K, Suite A2, Plano, TX 75074, USA; tel: +1 772 2193000; fax: +1 772 2193010;e-mail: [email protected]
Levesque, J. C. 2011. Commercial fisheries in the northwestern Gulf of Mexico: possible implications for conservation management at theFlower Garden Banks National Marine Sanctuary. – ICES Journal of Marine Science, 68: 2175–2190.
Received 16 January 2011; accepted 18 August 2011; advance access publication 27 September 2011.
Marine resource managers designate marine protected areas (MPAs) to conserve, protect, and enhance fragile marine resources. Aform of MPAs sometimes used by resource managers in the United States is a national marine sanctuary (NMS), and for allMPAs, managers need to use updated information during sanctuary management plan reviews (MPRs). In 2006, the FlowerGarden Banks NMS (FGBNMS) began its first MPR by conducting public hearings and soliciting comments. Some 66% of commentswere about the potential impacts fisheries posed to the sanctuary, so a description of commercial fishery activity in the NW Gulf ofMexico can help guide resource managers make sound, informed decisions. Despite limitations on data and knowledge of fishing effortspatially for the FGBNMS, commercial landings vary by Gulf state, area, and fishing gear, with most landings from the Louisiana andTexas coasts taken with trawls and nets. The main species landed from the NW Gulf of Mexico are shrimp, yellowfin tuna, and redsnapper. Some conservation measures proposed for the FGBNMS will likely impact some commercial fisheries (hook and line, bottomlongline), but not others (otter trawl, pelagic longline).
Keywords: conservation, management plan review, marine policy, marine protected area.
IntroductionMany fish stocks are overfished, already collapsed, or at risk ofextinction (Musick et al., 2000). However, the demand for andexploitation of marine resources throughout the world continuesto increase, at unsustainable rates for some species (Rosenberg,2003). In the United States, fishery managers have implementedmany conservation measures (e.g. size limits, bag limits, gearrestrictions, and closures) to protect and manage their fishstocks, but such conservation efforts have often failed to recoverthe stocks for reasons such as international bycatch (Soykanet al., 2008) or marine policy limitations (Moore et al., 2009).Given this, US resource managers and others around the worldare designating marine protected areas (MPAs) to conserve,protect, and enhance fragile marine resources such as coralswithin their jurisdictions (Selig and Bruno, 2010). In fact, thereare some 1700 MPAs in the United States managed by federal,state, tribal, and local authorities under many statutory mandates(NOAA, 2008). A form of MPA sometimes used by managers toprotect and conserve designated areas is a national marine sanctu-ary (NMS; Gittings, 2006). The US NMS programme consists of 14MPAs encompassing .241 500 km2 of the nation’s ocean andGreat Lakes waters. One of the US’s most remotely located sanctu-aries is the Flower Garden Banks NMS (FGBNMS) in the NW Gulfof Mexico (NOAA, 2010). The FGBNMS encompasses three separ-ate reef systems (East Flower Garden Bank, West Flower Garden
Bank, and Stetson Bank) that provide habitat and support varioustypes of marine resources, such as corals, fish, and algae(Pattengill-Semmens et al., 2000). Similar to other NMSs, theFGBNMS is managed through methods that include education,science, resource protection, and regulatory programmes (NOAA,1991, 2010). To ensure that recent scientific discoveries, advance-ments in managing marine resources, and new marine managementissues are addressed adequately by the current sanctuary manage-ment plans (SMPs), management plan reviews (MPRs) are meantto be conducted every 5 years (USC, 1974; NOAA, 1991, 2010).
In 2006, FGBNMS staff initiated the MPR process by sponsoringseveral public scoping meetings to discuss proposed managementalternatives and to solicit public comment on the future of the sanc-tuary (NMS, 2007, 2008b; NOAA, 2010). Based on the commentsreceived, most (66%) public concerns related to the potentialthreat that fisheries (commercial and recreational) posed to thesanctuary (NOAA, 2006a). To address the public’s concerns, theNational Oceanographic Atmospheric Administration (NOAA)hosted a special meeting of the Sanctuary Advisory Council(SAC). After reviewing the public comments and deliberating, theSAC fisheries subcommittee identified two main fishery issuesthey proposed for further investigation: (i) targeted fishing effortson snapper (Lutjanidae), grouper (Serranidae), and wahoo(Acanthocybium solandri) populations, and (ii) focused fishingeffort during spawning aggregations (NOAA, 2006a, b).
# 2011 International Council for the Exploration of the Sea. Published by Oxford University Press. All rights reserved.For Permissions, please email: [email protected]
ICES Journal of Marine Science (2011), 68(10), 2175–2190. doi:10.1093/icesjms/fsr155
Dow
nloaded from https://academ
ic.oup.com/icesjm
s/article/68/10/2175/614895 by guest on 07 Decem
ber 2021
The FGBNMS is located within the most productive fishinggrounds in the Gulf of Mexico. Besides supporting a productiverecreational fishery (Levesque and Richardson, 2011), the regionsupports some of the US’s most valuable commercial fisheries(Coleman et al., 2004). In 2009, commercial fishery landings forthe five Gulf states [Florida (west coast), Alabama, Mississippi,Louisiana, and Texas] were estimated to be 648 613 t, valued at$629 276 230. Overall, commercial fishery landings in the Gulf ofMexico during 2009 accounted for �16% of the US total[National Marine Fisheries Service (NMFS), 2011]. In fact, threeGulf states (Louisiana, Texas, and Florida west coast) rankedamong the top ten in commercial landings value, and the commer-cial fishing port of Empire–Venice (Louisiana) ranked seventh ineconomic value and second in overall commercial landings.Further, three other commercial fishing ports in the Gulf[Intracoastal City (LA), Pascagoula–Moss Point (MS), andCameron (LA)] ranked fifth, sixth, and seventh in overall commer-cial landings for the United States, respectively (NMFS, 2011).
The FGBNMS is situated near some of the most productivecommercial and recreational fishing grounds in the Gulf ofMexico (Coleman et al., 2004; Levesque and Richardson, 2011),so resource managers need to consider any potential changes tosanctuary regulations (e.g. expansion) with both the NMFS andthe Gulf of Mexico Fishery Management Council to ensure thatrevisions do not unnecessarily impact commercial fishing oper-ations (NMS, 2008b). As such, it is essential that sanctuaryresource staff have adequate commercial fisheries information tomake recommendations or to propose changes to regulationsthat could affect commercial fishing near the sanctuary, such asclosing additional reefs by expanding the sanctuary. Althoughfishing activities may impact and perhaps threaten the naturalliving resources of the FGBNMS, fishing activities within the sanc-tuary are not well documented (NOAA, 2010). The latter statesthat direct impacts of fishing can result in reduced fish biomassand that indirect impacts include secondary effects on speciesinteractions, habitat alteration/damage, reduced marine biodiver-sity, and economic impacts. Given these concerns, an assessmentof the commercial fisheries operating in the NW Gulf of Mexicois needed not only to evaluate the potential impact of managementdecisions on stakeholders, but also on commercial fishery oper-ations in the region, which could ultimately influence (negativelyor positively) local fish stocks associated with the sanctuary. Tofacilitate objective informed decision-making, the goal of thepresent investigation was to provide a baseline (benchmark) andprofile of commercial fishing activities in the NW Gulf ofMexico. The specific objectives were to compile existing commer-cial fishery data and identify trends (or a lack thereof) in commer-cial fishing landings, fishing gear, and catch composition for theNW Gulf of Mexico.
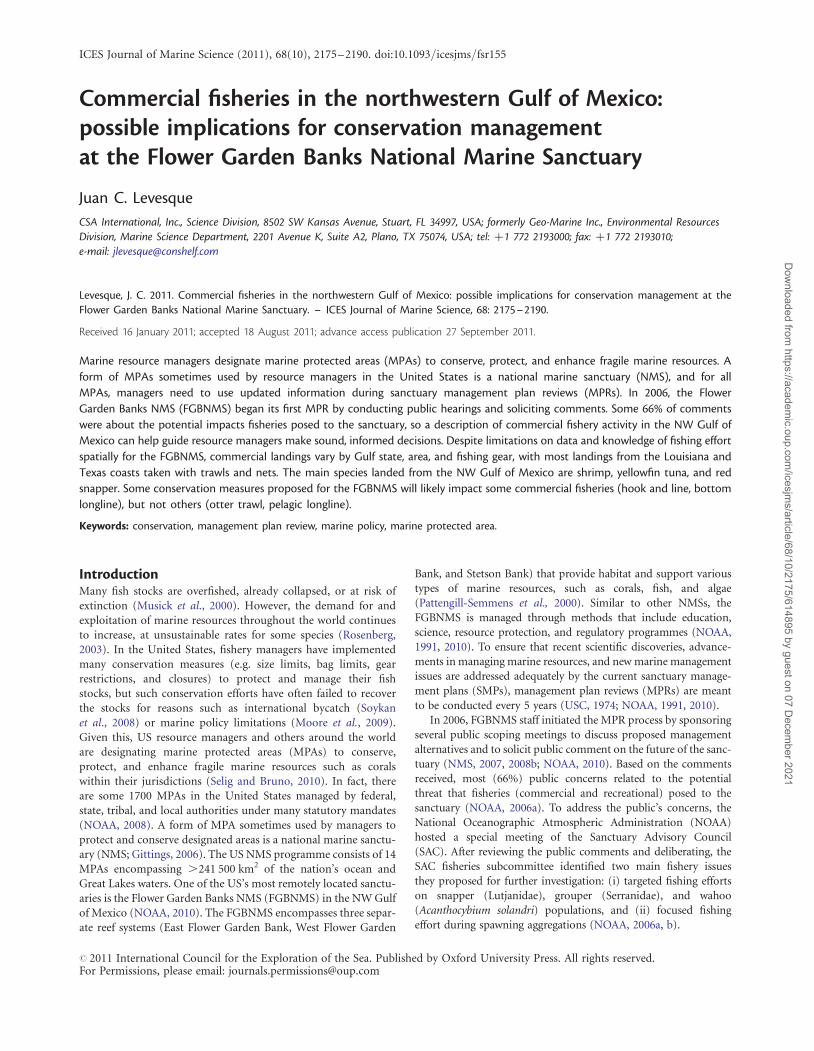
Material and methodsTo examine and assess commercial fishery activities in the Gulf ofMexico, the NMFS subdivides the region into statistical grids of111.1 × 111.1 km, encompassing 12 321 km2 in all. TheFGBNMS is located along the continental shelf break in the NWGulf of Mexico off the coasts of Texas and Louisiana.Encompassing a series of topographic features, the FGBNMS(143.02 km2) consists of three reef systems: East Flower GardenBank (27.98N 93.68W), West Flower Garden Bank (27.838N93.838W), and Stetson Bank (28.158N 94.288W; Figure 1).Although the larger reefs (East and West Flower Garden Banks)
are outside the NMFS statistical grid system, they are next tofour grids: NMFS statistical grid 15 [eastern boundary 288N908W (southeast grid intersection)] through 18 [western bound-ary 288N 958W (southwest grid intersection)]. The Stetson Bankis within statistical grid 18.
DataCommercial fishing characteristics of the NW Gulf of Mexico wereevaluated using a multidata approach that consisted of compilingthree federal (NMFS) datasets: General Canvass LandingsReporting System (GCLRS), Trip Interview Programme (TIP),and Historical Landings Programme (HLP). Each time-seriesvaried in duration: GCLRS (1960–2007), TIP (2003–2007), andHLP (1950–2006).
The GCLRS consists of monthly commercial fishing infor-mation collected from seafood dealers in the Gulf states on thequantity (landings) and values ($US) of seafood products har-vested by commercial fishers in the Gulf of Mexico. Note thatthe data have two limitations: (i) fish dealers do not alwaysrecord to species level the catch (e.g. sharks) offloaded, and (ii)fish or shellfish are not always purchased (landed) from thesame location as harvested; species are sometimes shipped fromone location to another (J. Bennett, NMFS, pers. comm.).Although this adds some uncertainty to the spatial information,the data can still be used because they provide overall commercialfishery landings information for this region of the Gulf. Note toothe 10-year data gap (1990–1999) for Louisiana commercial land-ings information. The TIP dataset consists of catch compositionand size frequency (i.e. length and weight) data collected byNMFS port agents during the offloading of commercial fishingvessels at coastal fishing ports in each Gulf state. The programmealso collects biological samples, e.g. otoliths and spines, and softorgans, and information on fishing effort, economics, andvarious social aspects. The HLP dataset is an automated online his-torical commercial data summary programme consisting of fish-eries information dating back to the 1950s. It was established tocollect information on landings, species, fishing gear, and econ-omic value by state and year.
Data analysisTo test for normality and homoscedacity, each dataset was evalu-ated using Kolmogorov–Smirnov’s (Zar, 1999) and Bartlett’s(Bartlett, 1937a, b) tests. To ensure robustness, normality wasalso checked by constructing a normal probability plot of theresiduals. As part of the assessment process, all outlier obser-vations were investigated before being rejected or retained. If thedatasets passed the normality test, parametric procedures wereemployed; otherwise, data were transformed using an appropriatetransformation process (e.g. log, square root, or arcsin squareroot) to meet the underlying assumptions of normality (Zar,1999). However, if the data still failed to meet the assumptionsof normality after transformation, non-parametric tests wereapplied. For all analyses, statistical significance was defined asp , 0.05. In the presence of significance at the 95% confidencelevel for the omnibus analysis of variance (ANOVA) or theKruskal–Wallis non-parametric multisample test, a post hocTukey multiple comparison test was used to perform pairwisecomparisons in order to differentiate the differences among thepopulation means (parametric) or medians (non-parametric).All analyses were conducted using Microsoft Excelw andSYSTATw version 12.
2176 J. C. Levesque
Dow
nloaded from https://academ
ic.oup.com/icesjm
s/article/68/10/2175/614895 by guest on 07 Decem
ber 2021
For each dataset, commercial fishery data (i.e. commercialfishery landings, fishing gear, and species composition) were sum-marized, depicted graphically, and evaluated statistically. Ingeneral, commercial fishery data (GCLRS and HLP) were assessedusing two time-series: historical (1950–2006) and recent(1996–2006). However, depending on the dataset and the resultsof the preliminary analysis, a third, more recent, time-series(2003–2007) was applied to reveal which period best reflectedthe current fishing activities in the NW Gulf of Mexico.
Annual commercial fishery landings in the NW Gulf of Mexicowere summarized and analysed by individual Gulf state to revealhistorical or recent trends. Although commercial fishery landingsin Florida (west coast) accounted for �70% of the total landingsin the Gulf (1950–2006), these data were excluded from the ana-lyses because it was improbable that many, if any, Florida fishingvessels would travel to the FGBNMS for reasons of distance(.483 km). A one-way ANOVA or a Kruskal–Wallis test wasused to test the null hypothesis that the annual total number offish harvested by individual state was equal. Separate Student’st-tests or the Mann–Whitney two-sample tests were used to testthe null hypothesis that historical and recent landings forLouisiana and Texas were equal. A one-way ANOVA or aKruskal–Wallis test was also used to test the null hypothesis thatlandings [top ten species (cumulative)] by area (NMFS statisticalgrid) were equal.
The landings by gear type were subjected to a three-stepprocess. First, separate two-way ANOVA or Kruskal–Wallistests were used to test the null hypothesis that historical and
recent landings (2003–2007) by area (NMFS statistical grids15–18), fishing gear, or the interaction (area and fishing gear)were equal. Second, a one-way ANOVA or a Kruskal–Wallistest was used to test that historical and recent landings byarea (NMFS statistical grids 17 and 18; closest areas to theFGBNMS) and fishing gear (top four cumulative) were equal.Third, a Student’s t-test or a Mann–Whitney two-sample testwas used to test the null hypothesis that historical and recentlandings were equal.
The landings were also analysed to reveal any historical orrecent trends by species. Separate one-way ANOVA or Kruskal–Wallis tests were used to test the null hypothesis that historicaland recent landings by individual fish group, e.g. Carangidaeand Scombridae (jacks, mackerel, and tuna), Serranidae (group-ers), and Lutjanidae (snappers), were equal. A Student’s t-test ora Mann–Whitney two-sample test was used to test the nullhypothesis that historical and recent landings by individual fishgroup (family) were equal, and separate two-way ANOVA orKruskal–Wallis tests were used to test the null hypothesis that his-torical and recent landings by individual fish group, Gulf state, orthe interaction (fish group and Gulf state) were equal. Separateone-way ANOVA or Kruskal–Wallis tests were used to test thenull hypothesis that landings by individual species rankings (topten) for NMFS statistical grids 17 and 18 (2003–2007) wereequal. Finally, a two-way ANOVA or a Kruskal–Wallis test wasused to test the null hypothesis that landings by area (NMFS stat-istical grids 15–18), individual species rankings (top ten), or theinteraction (area and species) were equal.
Figure 1. The study area. NMFS statistical sampling grids for the NW Gulf of Mexico.
Commercial fisheries in the NW Gulf of Mexico 2177
Dow
nloaded from https://academ
ic.oup.com/icesjm
s/article/68/10/2175/614895 by guest on 07 Decem
ber 2021
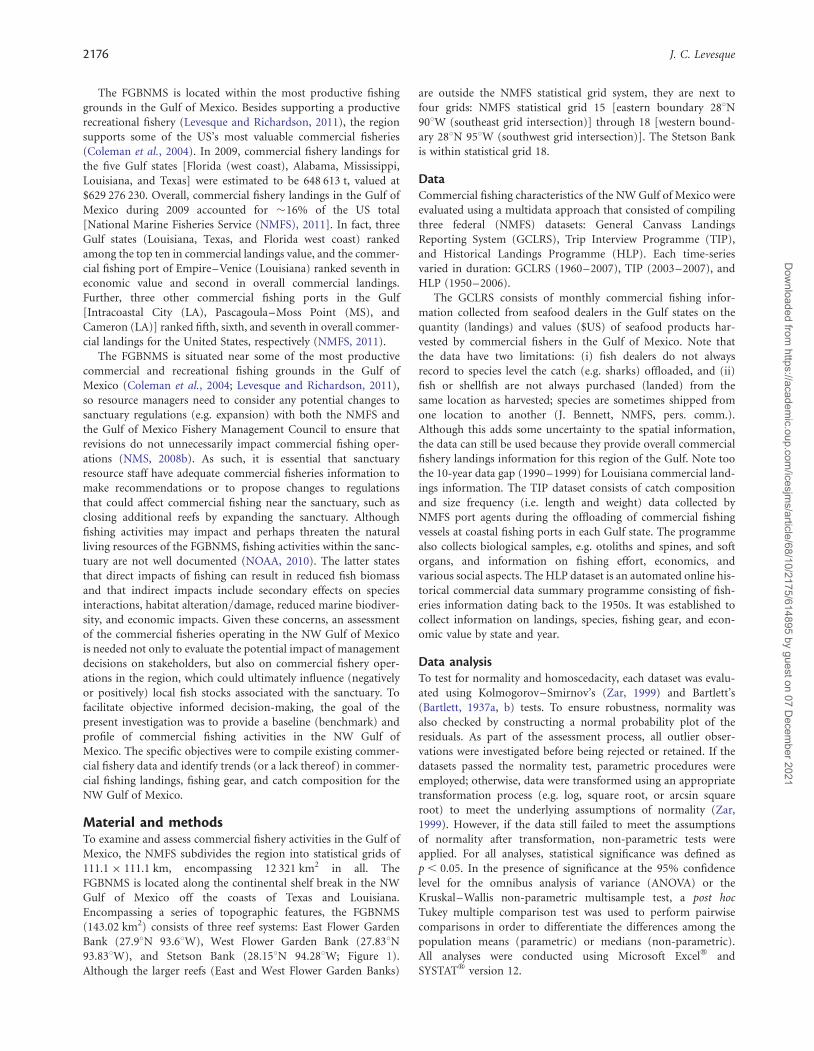
ResultsCommercial fish landingsFrom 1950 to 2006, annual commercial fishery landings in the NWGulf of Mexico (Louisiana, Texas, Alabama, and Mississippi)ranged from 1 408 439 kg in 1950 to 13 773 176 kg in 1988(Figure 2) with a mean of 4 065 952 kg (s.e. +360 329 kg). Totallandings by Gulf state varied significantly, with more commercialfish catches taken off the coasts of Louisiana (49%, or114 395 680 kg) and Texas (21%, or 49 084 712 kg) than anyother state (Kruskal–Wallis, p ¼ 0.0075). A post hoc Tukey mul-tiple comparison test revealed that commercial fishery landingsin Texas were significantly different from those in Louisiana,Mississippi, and Alabama. In addition, landings in Louisianawere significantly different from those in Mississippi. Likewise,recent landings (2003–2007) also varied by Gulf state (Kruskal–Wallis, p ¼ 0.0035). A post hoc Tukey test showed that landingsin Louisiana were significantly different from those inMississippi. Overall, cumulative commercial fishery landingswere similar among NMFS statistical grids (Kruskal–Wallis, p ¼0.9313, 0.3003, 0.8223, and 0.9154, respectively).
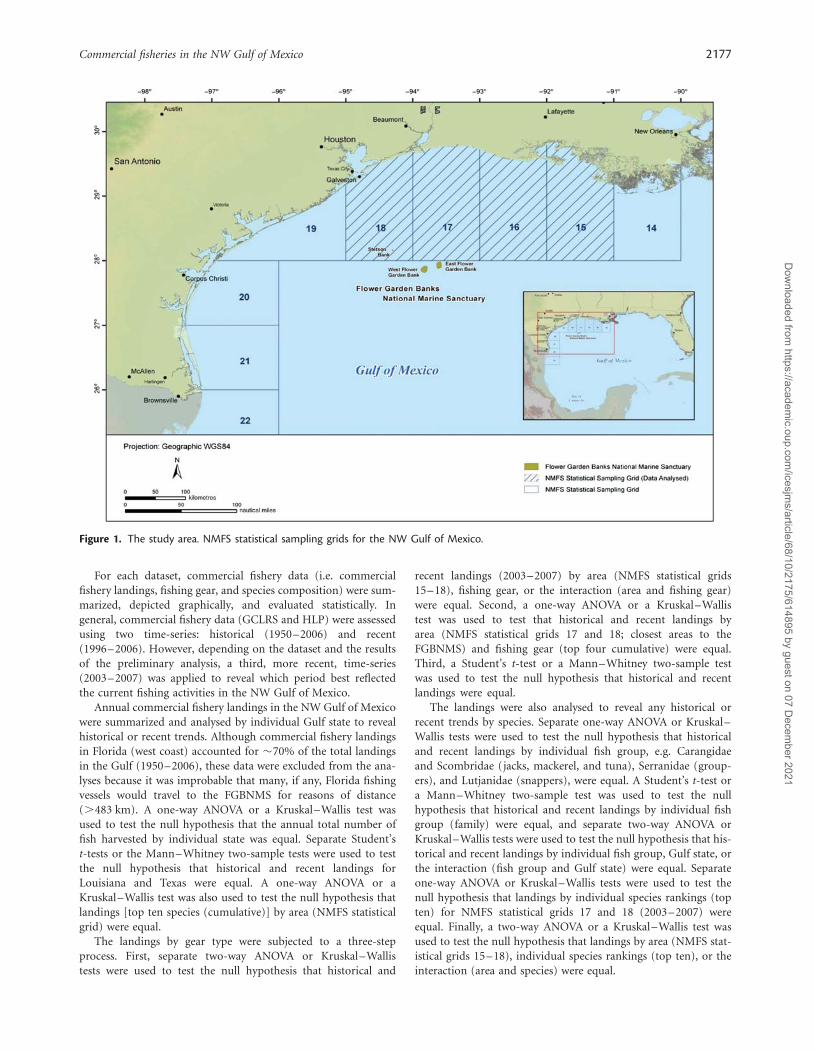
Fishing gearCommercial fisheries in the NW Gulf of Mexico from 1950 to 2006were harvested with 11 different fishing gears (Figure 3); most usedotter trawl–shrimp (72%, or 478.5 million kg), combined (18%,or 117.6 million kg), and handlines–other (4%, or 24.5 mil-lion kg). Although a two-way ANOVA test demonstrated a signifi-cant difference in historical landings by gear (p , 0.05), landingsamong NMFS statistical grids (p ¼ 0.8827) and the interactionbetween NMFS statistical grid and gear were similar (p ¼0.9872). A post hoc Tukey test showed that landings with ottertrawl–shrimp gear (NMFS statistical grid 15) were significantlydifferent from those with longline–shark (NMFS statistical grids15–18), trawls–unspecified, longline–set, combined, and long-line–reef (NMFS statistical grids 15–18). The test also showedthat landings with otter trawl–shrimp (NMFS statistical grid 18)were significantly different from those with longline–shark,trawls–unspecified, longline–set (NMFS statistical grids 15–18),longline–set (NMFS statistical grids 15–17), and longline–reef(NMFS statistical grids 15–18).
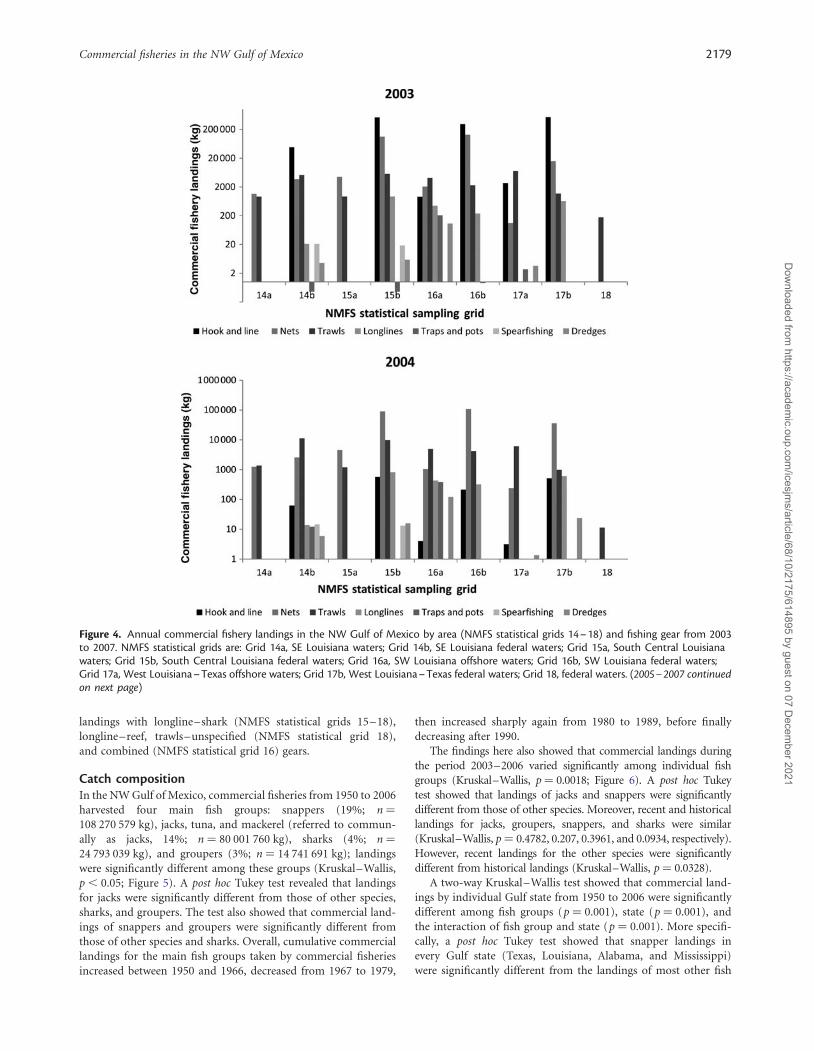
In contrast to historical landings, most landings during theyears 2003–2006 were harvested mainly with nets and trawls(Figure 4). In 2003, commercial fisheries used mainly hook-and-line gear and trawls (NMFS statistical grid 15b), but in 2007,most commercial fish were taken with nets and trawls (NMFSstatistical grid 15a). The main commercial fishing gears used inNMFS statistical grids 17b and 18 were nets and trawls, butthere were no commercial landings reported for nets in eitherarea in 2007. Further analysis using a two-way ANOVA testrevealed significant differences in recent annual commercial land-ings by gear (p , 0.05), but no significant difference in landingsamong NMFS statistical grids (p ¼ 0.6099) or the interactionbetween NMFS statistical grid and gear (p ¼ 0.0620). A post hocTukey test showed a significant difference in landings harvestedwith otter trawl–shrimp (NMFS statistical grids 17 and 18) and
Figure 2. Annual commercial fishery landings in the NW Gulf of Mexico (Louisiana, Texas, Alabama, and Mississippi) from 1950 to 2006.
Figure 3. Cumulative commercial fishery landings (million kg) in theNW Gulf of Mexico (NMFS statistical grids 14–18) by fishing gearfrom 1963 to 2007. NMFS statistical grids are: Grid 14a, SE Louisianawaters; Grid 14b, SE Louisiana federal waters; Grid 15a, South CentralLouisiana waters; Grid 15b, South Central Louisiana federal waters;Grid 16a, SW Louisiana offshore waters; Grid 16b, SW Louisianafederal waters; Grid 17a, West Louisiana–Texas offshore waters; Grid17b, West Louisiana–Texas federal waters; Grid 18, federal waters.
2178 J. C. Levesque
Dow
nloaded from https://academ
ic.oup.com/icesjm
s/article/68/10/2175/614895 by guest on 07 Decem
ber 2021
landings with longline–shark (NMFS statistical grids 15–18),longline–reef, trawls–unspecified (NMFS statistical grid 18),and combined (NMFS statistical grid 16) gears.
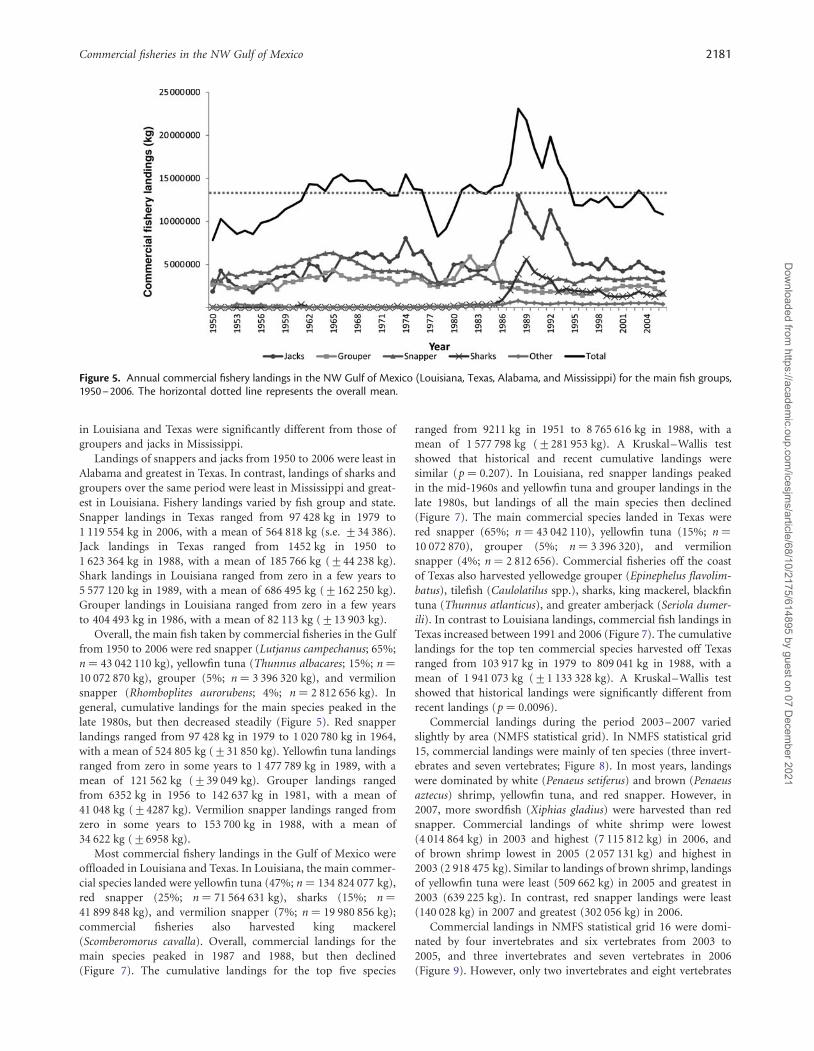
Catch compositionIn the NW Gulf of Mexico, commercial fisheries from 1950 to 2006harvested four main fish groups: snappers (19%; n ¼108 270 579 kg), jacks, tuna, and mackerel (referred to commun-ally as jacks, 14%; n ¼ 80 001 760 kg), sharks (4%; n ¼24 793 039 kg), and groupers (3%; n ¼ 14 741 691 kg); landingswere significantly different among these groups (Kruskal–Wallis,p , 0.05; Figure 5). A post hoc Tukey test revealed that landingsfor jacks were significantly different from those of other species,sharks, and groupers. The test also showed that commercial land-ings of snappers and groupers were significantly different fromthose of other species and sharks. Overall, cumulative commerciallandings for the main fish groups taken by commercial fisheriesincreased between 1950 and 1966, decreased from 1967 to 1979,
then increased sharply again from 1980 to 1989, before finallydecreasing after 1990.
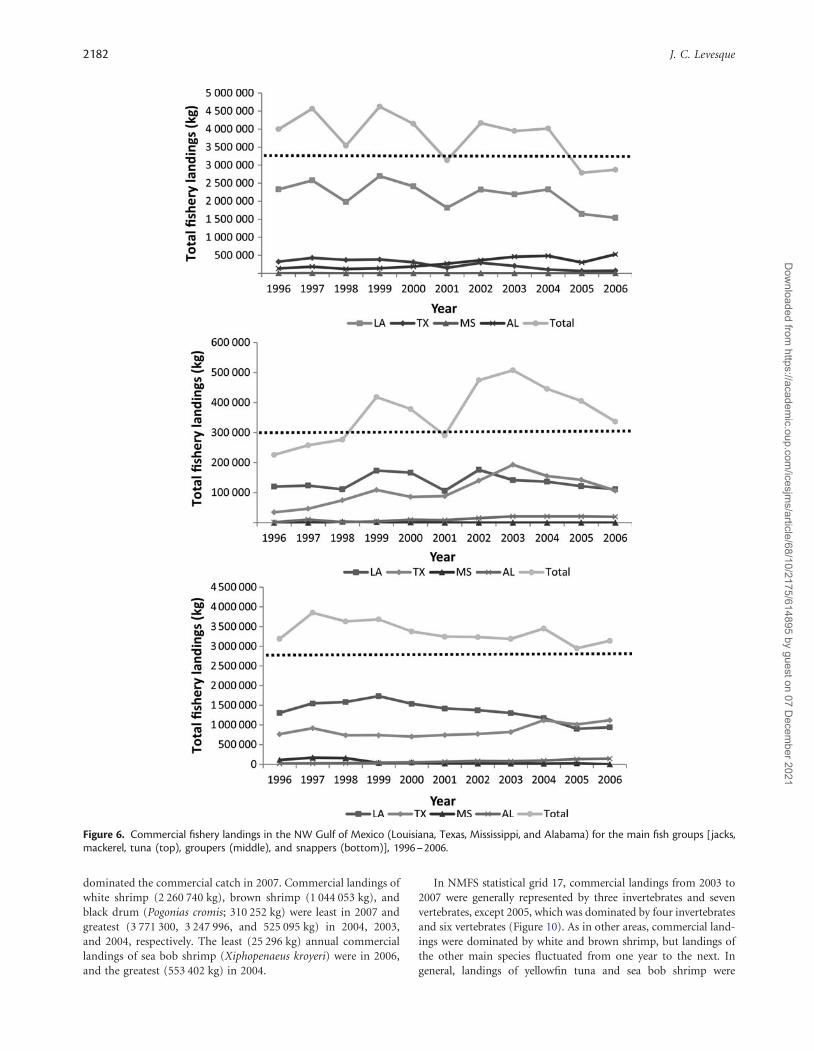
The findings here also showed that commercial landings duringthe period 2003–2006 varied significantly among individual fishgroups (Kruskal–Wallis, p¼ 0.0018; Figure 6). A post hoc Tukeytest showed that landings of jacks and snappers were significantlydifferent from those of other species. Moreover, recent and historicallandings for jacks, groupers, snappers, and sharks were similar(Kruskal–Wallis, p¼ 0.4782, 0.207, 0.3961, and 0.0934, respectively).However, recent landings for the other species were significantlydifferent from historical landings (Kruskal–Wallis, p¼ 0.0328).
A two-way Kruskal–Wallis test showed that commercial land-ings by individual Gulf state from 1950 to 2006 were significantlydifferent among fish groups (p ¼ 0.001), state (p ¼ 0.001), andthe interaction of fish group and state (p ¼ 0.001). More specifi-cally, a post hoc Tukey test showed that snapper landings inevery Gulf state (Texas, Louisiana, Alabama, and Mississippi)were significantly different from the landings of most other fish
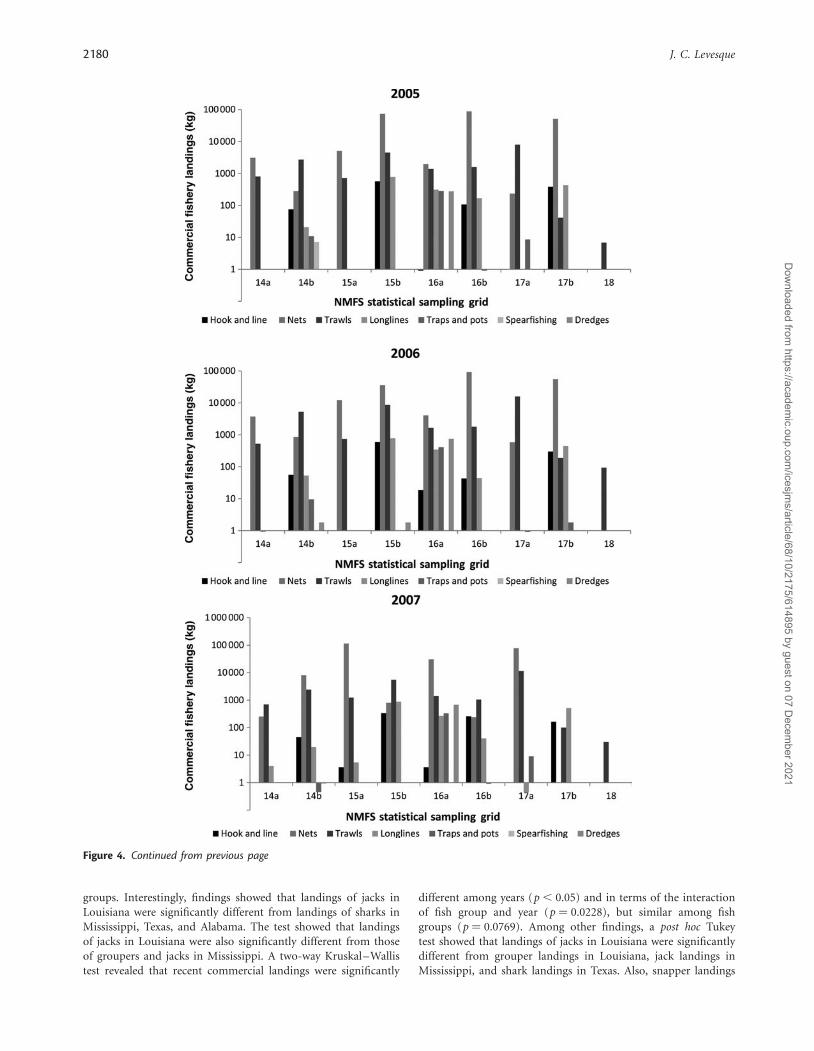
Figure 4. Annual commercial fishery landings in the NW Gulf of Mexico by area (NMFS statistical grids 14–18) and fishing gear from 2003to 2007. NMFS statistical grids are: Grid 14a, SE Louisiana waters; Grid 14b, SE Louisiana federal waters; Grid 15a, South Central Louisianawaters; Grid 15b, South Central Louisiana federal waters; Grid 16a, SW Louisiana offshore waters; Grid 16b, SW Louisiana federal waters;Grid 17a, West Louisiana–Texas offshore waters; Grid 17b, West Louisiana–Texas federal waters; Grid 18, federal waters. (2005–2007 continuedon next page)
Commercial fisheries in the NW Gulf of Mexico 2179
Dow
nloaded from https://academ
ic.oup.com/icesjm
s/article/68/10/2175/614895 by guest on 07 Decem
ber 2021
groups. Interestingly, findings showed that landings of jacks inLouisiana were significantly different from landings of sharks inMississippi, Texas, and Alabama. The test showed that landingsof jacks in Louisiana were also significantly different from thoseof groupers and jacks in Mississippi. A two-way Kruskal–Wallistest revealed that recent commercial landings were significantly
different among years (p , 0.05) and in terms of the interactionof fish group and year (p ¼ 0.0228), but similar among fishgroups (p ¼ 0.0769). Among other findings, a post hoc Tukeytest showed that landings of jacks in Louisiana were significantlydifferent from grouper landings in Louisiana, jack landings inMississippi, and shark landings in Texas. Also, snapper landings
Figure 4. Continued from previous page
2180 J. C. Levesque
Dow
nloaded from https://academ
ic.oup.com/icesjm
s/article/68/10/2175/614895 by guest on 07 Decem
ber 2021
in Louisiana and Texas were significantly different from those ofgroupers and jacks in Mississippi.
Landings of snappers and jacks from 1950 to 2006 were least inAlabama and greatest in Texas. In contrast, landings of sharks andgroupers over the same period were least in Mississippi and great-est in Louisiana. Fishery landings varied by fish group and state.Snapper landings in Texas ranged from 97 428 kg in 1979 to1 119 554 kg in 2006, with a mean of 564 818 kg (s.e. +34 386).Jack landings in Texas ranged from 1452 kg in 1950 to1 623 364 kg in 1988, with a mean of 185 766 kg (+44 238 kg).Shark landings in Louisiana ranged from zero in a few years to5 577 120 kg in 1989, with a mean of 686 495 kg (+162 250 kg).Grouper landings in Louisiana ranged from zero in a few yearsto 404 493 kg in 1986, with a mean of 82 113 kg (+13 903 kg).
Overall, the main fish taken by commercial fisheries in the Gulffrom 1950 to 2006 were red snapper (Lutjanus campechanus; 65%;n ¼ 43 042 110 kg), yellowfin tuna (Thunnus albacares; 15%; n ¼10 072 870 kg), grouper (5%; n ¼ 3 396 320 kg), and vermilionsnapper (Rhomboplites aurorubens; 4%; n ¼ 2 812 656 kg). Ingeneral, cumulative landings for the main species peaked in thelate 1980s, but then decreased steadily (Figure 5). Red snapperlandings ranged from 97 428 kg in 1979 to 1 020 780 kg in 1964,with a mean of 524 805 kg (+31 850 kg). Yellowfin tuna landingsranged from zero in some years to 1 477 789 kg in 1989, with amean of 121 562 kg (+39 049 kg). Grouper landings rangedfrom 6352 kg in 1956 to 142 637 kg in 1981, with a mean of41 048 kg (+4287 kg). Vermilion snapper landings ranged fromzero in some years to 153 700 kg in 1988, with a mean of34 622 kg (+6958 kg).
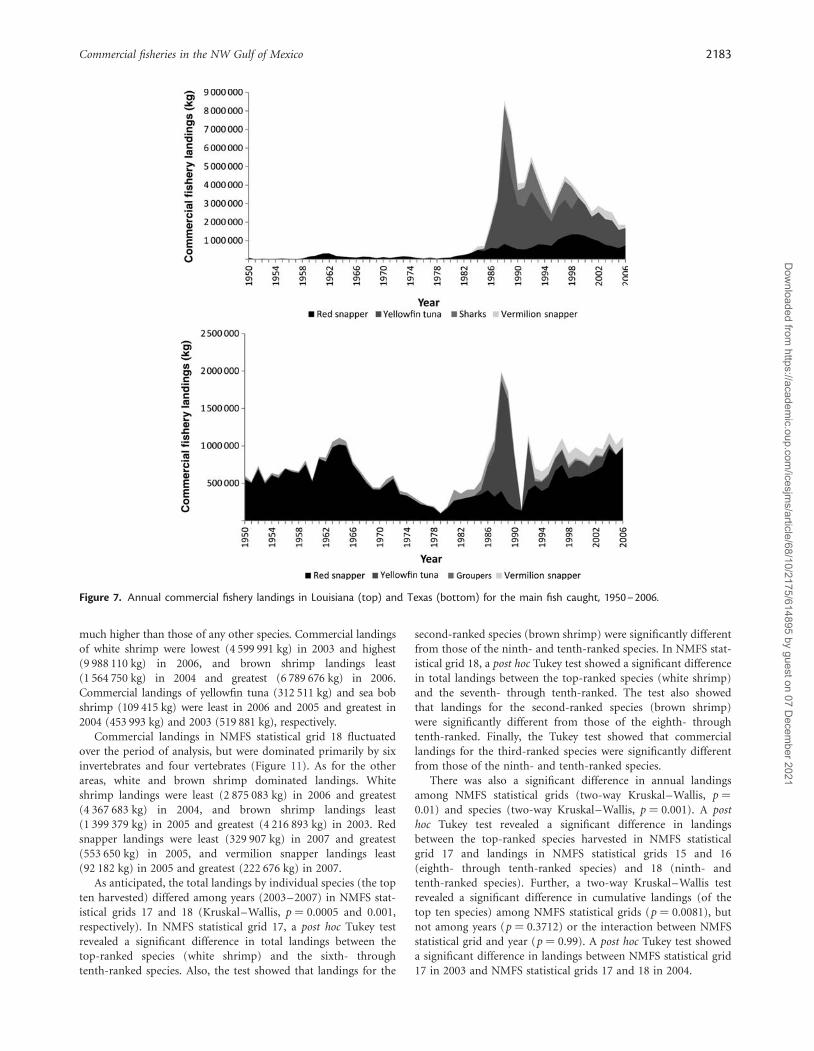
Most commercial fishery landings in the Gulf of Mexico wereoffloaded in Louisiana and Texas. In Louisiana, the main commer-cial species landed were yellowfin tuna (47%; n ¼ 134 824 077 kg),red snapper (25%; n ¼ 71 564 631 kg), sharks (15%; n ¼41 899 848 kg), and vermilion snapper (7%; n ¼ 19 980 856 kg);commercial fisheries also harvested king mackerel(Scomberomorus cavalla). Overall, commercial landings for themain species peaked in 1987 and 1988, but then declined(Figure 7). The cumulative landings for the top five species
ranged from 9211 kg in 1951 to 8 765 616 kg in 1988, with amean of 1 577 798 kg (+281 953 kg). A Kruskal–Wallis testshowed that historical and recent cumulative landings weresimilar (p ¼ 0.207). In Louisiana, red snapper landings peakedin the mid-1960s and yellowfin tuna and grouper landings in thelate 1980s, but landings of all the main species then declined(Figure 7). The main commercial species landed in Texas werered snapper (65%; n ¼ 43 042 110), yellowfin tuna (15%; n ¼10 072 870), grouper (5%; n ¼ 3 396 320), and vermilionsnapper (4%; n ¼ 2 812 656). Commercial fisheries off the coastof Texas also harvested yellowedge grouper (Epinephelus flavolim-batus), tilefish (Caulolatilus spp.), sharks, king mackerel, blackfintuna (Thunnus atlanticus), and greater amberjack (Seriola dumer-ili). In contrast to Louisiana landings, commercial fish landings inTexas increased between 1991 and 2006 (Figure 7). The cumulativelandings for the top ten commercial species harvested off Texasranged from 103 917 kg in 1979 to 809 041 kg in 1988, with amean of 1 941 073 kg (+1 133 328 kg). A Kruskal–Wallis testshowed that historical landings were significantly different fromrecent landings (p ¼ 0.0096).
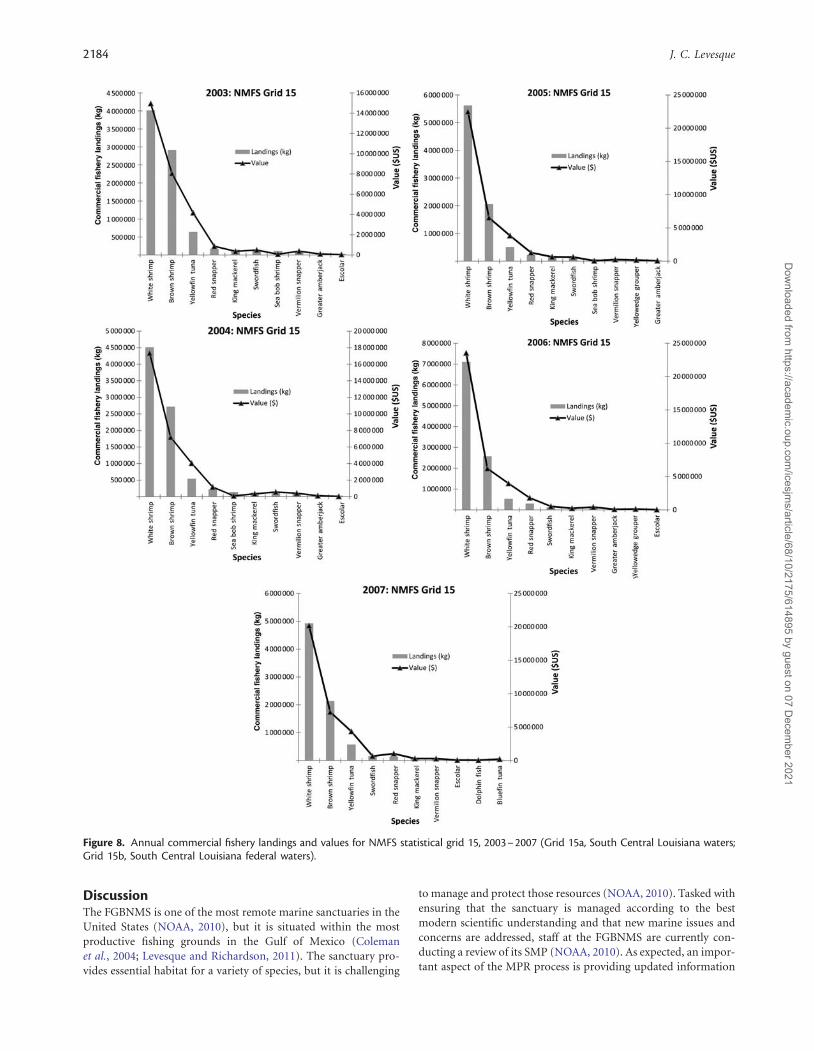
Commercial landings during the period 2003–2007 variedslightly by area (NMFS statistical grid). In NMFS statistical grid15, commercial landings were mainly of ten species (three invert-ebrates and seven vertebrates; Figure 8). In most years, landingswere dominated by white (Penaeus setiferus) and brown (Penaeusaztecus) shrimp, yellowfin tuna, and red snapper. However, in2007, more swordfish (Xiphias gladius) were harvested than redsnapper. Commercial landings of white shrimp were lowest(4 014 864 kg) in 2003 and highest (7 115 812 kg) in 2006, andof brown shrimp lowest in 2005 (2 057 131 kg) and highest in2003 (2 918 475 kg). Similar to landings of brown shrimp, landingsof yellowfin tuna were least (509 662 kg) in 2005 and greatest in2003 (639 225 kg). In contrast, red snapper landings were least(140 028 kg) in 2007 and greatest (302 056 kg) in 2006.
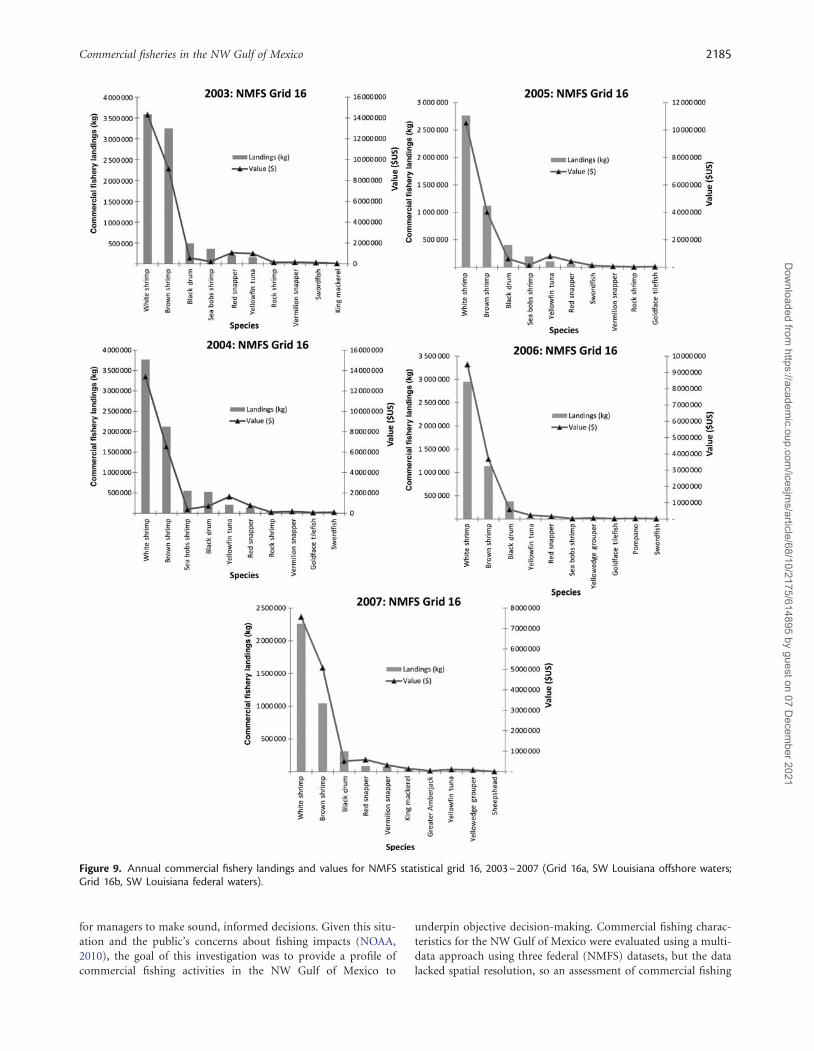
Commercial landings in NMFS statistical grid 16 were domi-nated by four invertebrates and six vertebrates from 2003 to2005, and three invertebrates and seven vertebrates in 2006(Figure 9). However, only two invertebrates and eight vertebrates
Figure 5. Annual commercial fishery landings in the NW Gulf of Mexico (Louisiana, Texas, Alabama, and Mississippi) for the main fish groups,1950–2006. The horizontal dotted line represents the overall mean.
Commercial fisheries in the NW Gulf of Mexico 2181
Dow
nloaded from https://academ
ic.oup.com/icesjm
s/article/68/10/2175/614895 by guest on 07 Decem
ber 2021
dominated the commercial catch in 2007. Commercial landings ofwhite shrimp (2 260 740 kg), brown shrimp (1 044 053 kg), andblack drum (Pogonias cromis; 310 252 kg) were least in 2007 andgreatest (3 771 300, 3 247 996, and 525 095 kg) in 2004, 2003,and 2004, respectively. The least (25 296 kg) annual commerciallandings of sea bob shrimp (Xiphopenaeus kroyeri) were in 2006,and the greatest (553 402 kg) in 2004.
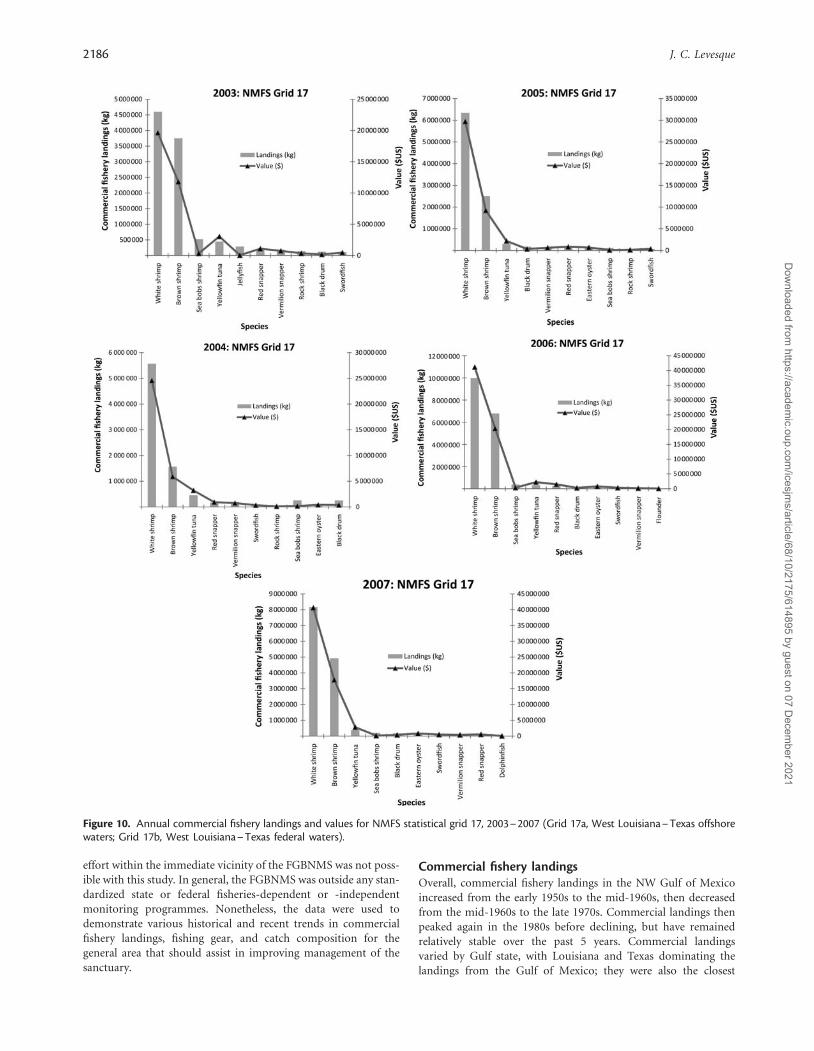
In NMFS statistical grid 17, commercial landings from 2003 to2007 were generally represented by three invertebrates and sevenvertebrates, except 2005, which was dominated by four invertebratesand six vertebrates (Figure 10). As in other areas, commercial land-ings were dominated by white and brown shrimp, but landings ofthe other main species fluctuated from one year to the next. Ingeneral, landings of yellowfin tuna and sea bob shrimp were
Figure 6. Commercial fishery landings in the NW Gulf of Mexico (Louisiana, Texas, Mississippi, and Alabama) for the main fish groups [jacks,mackerel, tuna (top), groupers (middle), and snappers (bottom)], 1996–2006.
2182 J. C. Levesque
Dow
nloaded from https://academ
ic.oup.com/icesjm
s/article/68/10/2175/614895 by guest on 07 Decem
ber 2021
much higher than those of any other species. Commercial landingsof white shrimp were lowest (4 599 991 kg) in 2003 and highest(9 988 110 kg) in 2006, and brown shrimp landings least(1 564 750 kg) in 2004 and greatest (6 789 676 kg) in 2006.Commercial landings of yellowfin tuna (312 511 kg) and sea bobshrimp (109 415 kg) were least in 2006 and 2005 and greatest in2004 (453 993 kg) and 2003 (519 881 kg), respectively.
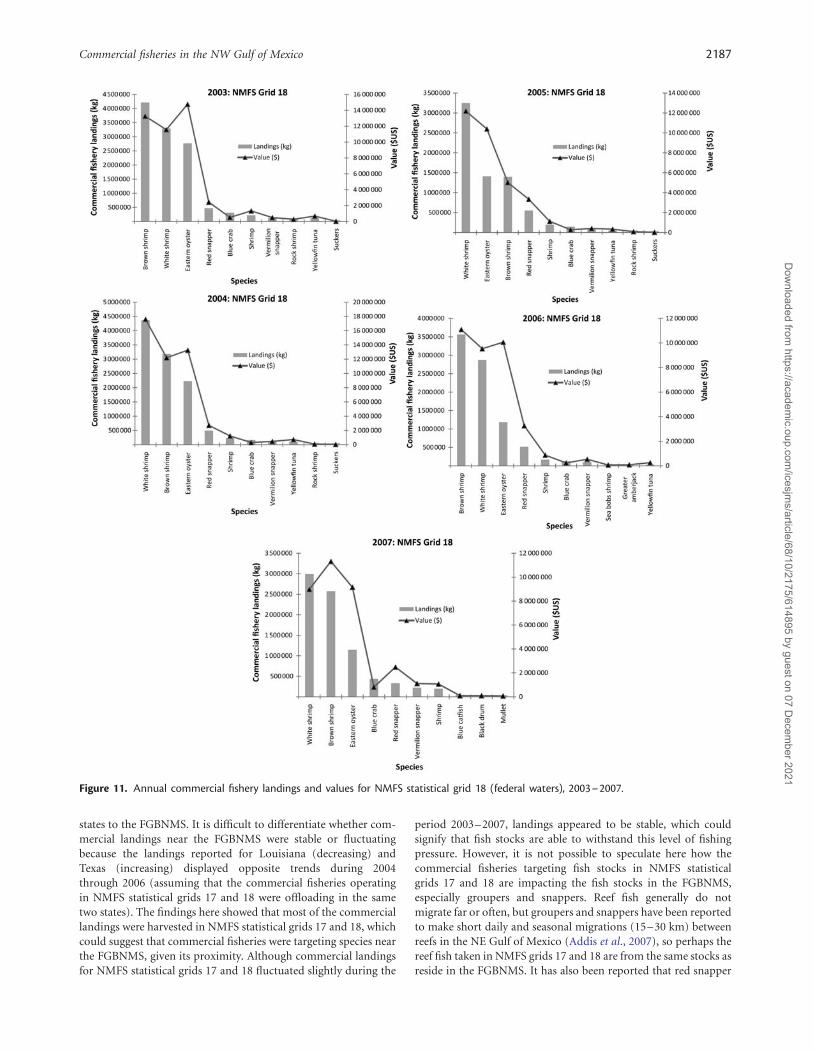
Commercial landings in NMFS statistical grid 18 fluctuatedover the period of analysis, but were dominated primarily by sixinvertebrates and four vertebrates (Figure 11). As for the otherareas, white and brown shrimp dominated landings. Whiteshrimp landings were least (2 875 083 kg) in 2006 and greatest(4 367 683 kg) in 2004, and brown shrimp landings least(1 399 379 kg) in 2005 and greatest (4 216 893 kg) in 2003. Redsnapper landings were least (329 907 kg) in 2007 and greatest(553 650 kg) in 2005, and vermilion snapper landings least(92 182 kg) in 2005 and greatest (222 676 kg) in 2007.
As anticipated, the total landings by individual species (the topten harvested) differed among years (2003–2007) in NMFS stat-istical grids 17 and 18 (Kruskal–Wallis, p ¼ 0.0005 and 0.001,respectively). In NMFS statistical grid 17, a post hoc Tukey testrevealed a significant difference in total landings between thetop-ranked species (white shrimp) and the sixth- throughtenth-ranked species. Also, the test showed that landings for the
second-ranked species (brown shrimp) were significantly differentfrom those of the ninth- and tenth-ranked species. In NMFS stat-istical grid 18, a post hoc Tukey test showed a significant differencein total landings between the top-ranked species (white shrimp)and the seventh- through tenth-ranked. The test also showedthat landings for the second-ranked species (brown shrimp)were significantly different from those of the eighth- throughtenth-ranked. Finally, the Tukey test showed that commerciallandings for the third-ranked species were significantly differentfrom those of the ninth- and tenth-ranked species.
There was also a significant difference in annual landingsamong NMFS statistical grids (two-way Kruskal–Wallis, p ¼0.01) and species (two-way Kruskal–Wallis, p ¼ 0.001). A posthoc Tukey test revealed a significant difference in landingsbetween the top-ranked species harvested in NMFS statisticalgrid 17 and landings in NMFS statistical grids 15 and 16(eighth- through tenth-ranked species) and 18 (ninth- andtenth-ranked species). Further, a two-way Kruskal–Wallis testrevealed a significant difference in cumulative landings (of thetop ten species) among NMFS statistical grids (p ¼ 0.0081), butnot among years (p ¼ 0.3712) or the interaction between NMFSstatistical grid and year (p ¼ 0.99). A post hoc Tukey test showeda significant difference in landings between NMFS statistical grid17 in 2003 and NMFS statistical grids 17 and 18 in 2004.
Figure 7. Annual commercial fishery landings in Louisiana (top) and Texas (bottom) for the main fish caught, 1950–2006.
Commercial fisheries in the NW Gulf of Mexico 2183
Dow
nloaded from https://academ
ic.oup.com/icesjm
s/article/68/10/2175/614895 by guest on 07 Decem
ber 2021
DiscussionThe FGBNMS is one of the most remote marine sanctuaries in theUnited States (NOAA, 2010), but it is situated within the mostproductive fishing grounds in the Gulf of Mexico (Colemanet al., 2004; Levesque and Richardson, 2011). The sanctuary pro-vides essential habitat for a variety of species, but it is challenging
to manage and protect those resources (NOAA, 2010). Tasked withensuring that the sanctuary is managed according to the bestmodern scientific understanding and that new marine issues andconcerns are addressed, staff at the FGBNMS are currently con-ducting a review of its SMP (NOAA, 2010). As expected, an impor-tant aspect of the MPR process is providing updated information
Figure 8. Annual commercial fishery landings and values for NMFS statistical grid 15, 2003–2007 (Grid 15a, South Central Louisiana waters;Grid 15b, South Central Louisiana federal waters).
2184 J. C. Levesque
Dow
nloaded from https://academ
ic.oup.com/icesjm
s/article/68/10/2175/614895 by guest on 07 Decem
ber 2021
for managers to make sound, informed decisions. Given this situ-ation and the public’s concerns about fishing impacts (NOAA,2010), the goal of this investigation was to provide a profile ofcommercial fishing activities in the NW Gulf of Mexico to
underpin objective decision-making. Commercial fishing charac-teristics for the NW Gulf of Mexico were evaluated using a multi-data approach using three federal (NMFS) datasets, but the datalacked spatial resolution, so an assessment of commercial fishing
Figure 9. Annual commercial fishery landings and values for NMFS statistical grid 16, 2003–2007 (Grid 16a, SW Louisiana offshore waters;Grid 16b, SW Louisiana federal waters).
Commercial fisheries in the NW Gulf of Mexico 2185
Dow
nloaded from https://academ
ic.oup.com/icesjm
s/article/68/10/2175/614895 by guest on 07 Decem
ber 2021
effort within the immediate vicinity of the FGBNMS was not poss-ible with this study. In general, the FGBNMS was outside any stan-dardized state or federal fisheries-dependent or -independentmonitoring programmes. Nonetheless, the data were used todemonstrate various historical and recent trends in commercialfishery landings, fishing gear, and catch composition for thegeneral area that should assist in improving management of thesanctuary.
Commercial fishery landingsOverall, commercial fishery landings in the NW Gulf of Mexicoincreased from the early 1950s to the mid-1960s, then decreasedfrom the mid-1960s to the late 1970s. Commercial landings thenpeaked again in the 1980s before declining, but have remainedrelatively stable over the past 5 years. Commercial landingsvaried by Gulf state, with Louisiana and Texas dominating thelandings from the Gulf of Mexico; they were also the closest
Figure 10. Annual commercial fishery landings and values for NMFS statistical grid 17, 2003–2007 (Grid 17a, West Louisiana–Texas offshorewaters; Grid 17b, West Louisiana–Texas federal waters).
2186 J. C. Levesque
Dow
nloaded from https://academ
ic.oup.com/icesjm
s/article/68/10/2175/614895 by guest on 07 Decem
ber 2021
states to the FGBNMS. It is difficult to differentiate whether com-mercial landings near the FGBNMS were stable or fluctuatingbecause the landings reported for Louisiana (decreasing) andTexas (increasing) displayed opposite trends during 2004through 2006 (assuming that the commercial fisheries operatingin NMFS statistical grids 17 and 18 were offloading in the sametwo states). The findings here showed that most of the commerciallandings were harvested in NMFS statistical grids 17 and 18, whichcould suggest that commercial fisheries were targeting species nearthe FGBNMS, given its proximity. Although commercial landingsfor NMFS statistical grids 17 and 18 fluctuated slightly during the
period 2003–2007, landings appeared to be stable, which couldsignify that fish stocks are able to withstand this level of fishingpressure. However, it is not possible to speculate here how thecommercial fisheries targeting fish stocks in NMFS statisticalgrids 17 and 18 are impacting the fish stocks in the FGBNMS,especially groupers and snappers. Reef fish generally do notmigrate far or often, but groupers and snappers have been reportedto make short daily and seasonal migrations (15–30 km) betweenreefs in the NE Gulf of Mexico (Addis et al., 2007), so perhaps thereef fish taken in NMFS grids 17 and 18 are from the same stocks asreside in the FGBNMS. It has also been reported that red snapper
Figure 11. Annual commercial fishery landings and values for NMFS statistical grid 18 (federal waters), 2003–2007.
Commercial fisheries in the NW Gulf of Mexico 2187
Dow
nloaded from https://academ
ic.oup.com/icesjm
s/article/68/10/2175/614895 by guest on 07 Decem
ber 2021
can make far longer movements, on the scale of hundreds ofkilometres (Patterson et al., 2001). Given this, it is likely that thecommercial fisheries targeting reef fish near the sanctuary couldbe specifically impacting the stocks in the FGBNMS.
Fishing gearCommercial fisheries in the NW Gulf of Mexico from 1950 to 2006were harvested with 11 different fishing gears, but most of thecatch was taken with otter trawls–shrimp, combined, andhandlines–other gears. In NMFS statistical grids 17 and 18, themain commercial fishing gear used was nets and otter trawls.Commercial landings data from 2003 to 2006 showed that land-ings were stable, but that landings with combined gear and hand-line–other gear have increased and decreased, respectively,suggesting that fisheries with nets and trawls do not necessarilyinfluence the fish stocks at the FGBNMS because such gear isusually used to target shrimp and schooling fish close to shoreand away from hard substrata (such as the reefs in or nearFGBNMS); shrimp prefer mud sediment.
It is highly probable that handlines (e.g. hook and line) are usedto target reef fish near the FGBNMS. Therefore, if policy-makersdecide in future to expand the sanctuary by incorporatingadditional reef systems, then this management action couldreduce commercial fishing effort for fishers using such gear inthe area. In fact, expansion of the sanctuary could discouragesome fishers from searching for other suitable fishing groundsbecause hard-bottom features are rare in this region of the Gulf.One of the main reasons fisheries are so productive in thisregion of the Gulf is because the reefs associated with and nearthe FGBNMS provide suitable benthic habitat for many reefspecies; the FGB is the most northern coral reef system in theGulf. Nevertheless, high-resolution spatial data were unavailablefor these analyses, so without such data it would be inopportunefor resource managers to propose expanding the sanctuary.
The data revealed that longlines were a popular gear in NMFSgrids 17 and 18. Depending on how longline gear is set, it can beused to target either bottom or pelagic species. Again, similar tohandlines, any changes in the management of the FGBNMScould impact bottom longline fisheries that target reef fish nearthe sanctuary. Although that statement is speculative, perhapscommercial fisheries using bottom longlines are already impactingthe stocks of snappers and groupers in the FGBNMS.Unfortunately, high-resolution data are not available, althoughtagging is a method that fishery scientists could well use to evaluatewhether bottom commercial fisheries in the NW Gulf of Mexicoare impacting the fish stocks in the FGBNMS. For example, it ispossible to tag (conventional tag, radio tag, or radio transmitters)reef fish to evaluate daily and seasonal movement patterns betweenthe reefs associated with the FGBNMS and commercial fishinggrounds.
Catch compositionCommercial fisheries data reveal that landings in the two areasclosest to the FGBNMS (NMFS statistical grids 17 and 18) wererepresented primarily by catches of white and brown shrimp,agreeing with the fishing gear data (i.e. otter trawl) for the area.As such, it is unlikely that any prohibition or expansion of thesanctuary would impact shrimp landings significantly, given thatmost fishing effort with this type of gear is away from the sanctuaryin much shallower waters of the Gulf. It is also unlikely that anynew commercial fishing restrictions or regulations for the
FGBNMS would impact small and large coastal shark landings,because fishing effort for such sharks is also closer to shore andaway from the sanctuary. In addition, it is unlikely that jack land-ings would be impacted by new sanctuary regulations, becausemost species in the jack group are highly migratory and targetedelsewhere too. Nonetheless, commercial landings of the mainreef fish (groupers and snappers) taken within the vicinity of theFGBNMS could be affected by additional closures or restrictionsaround the FGBNMS because there are limited fishing sites avail-able for commercial fishers to target reef-dwelling species in theNW Gulf of Mexico.
Commercial fisheries data show that yellowfin tuna (jackgroup) were the main fish taken in NMFS statistical grid 17.However, because fishing effort for pelagic longline gear was notspecifically examined, it is difficult to speculate whether any man-agement changes to the FGBNMS would significantly impact thatfishery. Yellowfin tuna are highly migratory and typically do notaggregate on bottom features (like reef fish do), so it is unlikelythat any modifications to sanctuary regulations would affectyellowfin catches, which tend to be more closely correlated withSST and ocean current than specific bottom features in the Gulf(De Anda-Montane et al., 2004; Teo and Block, 2010). It is alsoimprobable that the yellowfin tuna fishery in the NW Gulf ofMexico would be impacted heavily because pelagic longline fish-eries could still target tuna and other highly migratory species(e.g. swordfish and pelagic sharks) outside the FGBNMS.Overall, pelagic longline vessels usually make extensive long-rangefishing trips throughout the Gulf of Mexico in pursuit of tuna andswordfish, so modifying the extent of the FGBNMS would almostcertainly have no effect on the pelagic longline fishery. Also, unlikeother types of commercial fishing gear, pelagic longline gear is reg-ularly set along the continental slope in the north central Gulf ofMexico to target tuna and swordfish where water temperatureand current velocity are ideal for the species, rather than aroundbottom features such as reefs and rock ledges (Teo and Block,2010). In NMFS statistical grid 18, red snapper and vermilionsnapper were the main fish taken, and fishing for both thesespecies would be impacted to an unknown extent by any expan-sion of the FGBNMS by prohibiting some of the fishing activitythat currently takes place near the sanctuary.
In general, the datasets used for these analyses were not suitablefor evaluating the potential impacts of new management measureson commercial fishery operations near the FGBNMS.Notwithstanding, there are a few alternative methods that couldbe used to acquire a better understanding of spatial fishing effortwithin the vicinity of the sanctuary. For instance, subdividingNMFS statistical grids 17 and 18 into smaller ones (e.g. 1.6 ×1.6 km2) and plotting monthly and annual fishing effort usingGIS could be revealing. With this type of approach, decision-makers could be made aware of the percentage (annual ormonthly) of fishing sets made near the FGBNMS. Proposals forexpansion of the sanctuary could then be plotted and the potentialimpacts compared and assessed. For example, if analysis of bottomand handline fishing effort showed that 50% of sets were con-ducted in the two statistical grids 17 and 18 closest to theFGBNMS boundary, then even a small expansion (e.g. 10% ofthe current area) could impact the fisheries, given that suitablebottom topography for targeting reef fish in the area is likelylimited. As with any management decision, of course, resourcemanagers should be able to consider the potential displacementof current commercial fisheries effort before making a decision
2188 J. C. Levesque
Dow
nloaded from https://academ
ic.oup.com/icesjm
s/article/68/10/2175/614895 by guest on 07 Decem
ber 2021
on expanding the FGBNMS, because any expansion could impactother fisheries or fish stocks that are already economically orbiologically stressed. In reality, commercial fisheries often switchto targeting other species when time–area closures prevent themfrom targeting specific species or habitats.
ConclusionsPolicy-makers are designating more MPAs to conserve biodiversity(Agardy et al., 2003). In the Gulf of Mexico, the FGBNMS is animportant MPA given its biological uniqueness (most northernreef system in the Gulf of Mexico), providing habitat for avariety of commercial and recreational fisheries (NMS, 2008a;Levesque and Richardson, 2011), many of which are stressedand overfished (NMFS, 2009). This investigation of commercialfisheries in the NW Gulf of Mexico found that the available datadid not allow, nor were designed to evaluate specifically, commer-cial fishery operations near the FGBNMS. As such, future manage-ment decisions for the sanctuary will require the use of othermethods to understand the implications of management decisionson stakeholders, such as evaluating confidential spatial fisheriesdata (e.g. VMS data for the Gulf of Mexico commercial reef fishfishery). Using such data would allow commercial fishing effortnext to the sanctuary to be presented graphically. Anotherapproach that could be used to obtain additional fisheries infor-mation is by implementing a new fishery-independent or-dependent information collection programme, such as requiringmandatory interviews for licensed fishing vessels (commercial andrecreational) operating near the sanctuary. Yet another approachcould be to acquire spatial fisheries data by accessing advancedtechnology, such as satellite imagery or satellite remote sensingdata. This type of technology and approach has already beenused for environmental monitoring and assessing fishery impactsin other regions (Chassot et al., 2011).
As is evident from the results presented here, the available dataare inadequate for managing the FGBNMS to its full potentialgiven that the fishing activities (commercial and recreational)next to the sanctuary could be impacting its fish stocks. Further,the data are also limited in their ability to evaluate potentialimpacts of management actions on fisheries. According toWahle et al. (2003), there are five phases in the life cycle of aMPA: planning, implementation, management, evaluation, andbaseline and monitoring. Currently, the FGBNMS is being sub-jected to an evaluation process leading towards the baseline andmonitoring stage. To ensure that sanctuary goals and objectivesare met, it is crucial that the FGBNMS receive sufficient supportfor implementing and establishing appropriate new programmes(e.g. collection of spatial fishery data, social science, and enforce-ment). Implementing and establishing new programmes wouldsupport informed regulatory decisions and ensure that conserva-tion management actions do not unnecessarily impact biological,conservation, societal, or industry interests. Wahle et al. (2003)identified several cross-cutting information needs and issues forestablishing a social science research strategy for MPAs. Oneneed was the collection of suitable baseline data (qualitative andquantitative), Wahle et al. (2003) indicating that baseline analysisof the patterns of fishery use need to integrate quantitative land-ings data with ethnographic data on the qualitative dynamicsand variability in the observed landings patterns over time.Taking this proposal further, all sanctuary managers would needto work cooperatively before establishing and implementing stan-dardized fishery and social science programmes; the two sciences
are interrelated. MPAs are an effective management tool for con-serving, enhancing, and managing fragile marine resources, butMPRs need to be conducted regularly, and difficult and challen-ging stakeholder issues and concerns have to be addressed, evenif that entails proposing new programmes and research strategiesto senior management that would require additional funding. Intoday’s marine policy climate, the management of MPAs is contro-versial, political, and complex. However, the future of marineresources depends on the decisions made today.
AcknowledgementsI thank FGBNMS staff (J. DeBose, E. Hickerson, J. Morgan, andG. P. Schmahl) for input, support, and guidance, J. Bennett,K. Brennan, G. Davenport, L. Green, B. Leeworthy, andM. Nuttall for help in gathering and compiling data, P. Steele,J. Laliberte, J. See, and S. Leathem for reviewing and makingsuggestions that greatly improved the manuscript, C. Gomezand T. Conner for producing the graphics, A. Richardson for con-ducting data analyses, and K. Deslarzes for securing the contractfor the study. Finally, I am indebted to the editor and an anon-ymous reviewer for their critical editorial review and scientificsuggestions that improved the manuscript. The views, opinions,conclusions, or proposals expressed are mine and do not necess-arily reflect the views of Geo-Marine Inc., CSA InternationalInc., or the National Ocean Service, Office of National MarineSanctuaries. The study was supported by the NationalOceanographic Atmospheric Administration, National OceanService, Office of National Marine Sanctuaries, under contractGS10F0207J.
ReferencesAddis, D. T., Patterson, W. F., and Dance, M. A. 2007. Site fidelity and
movement of reef fishes tagged at unreported artificial reef sites offNW Florida. In Proceedings of the 60th Gulf and CaribbeanFisheries Institute Workshop, 5–9 November 2007, Punta Cana,Dominican Republic, pp. 297–304. Gulf and Caribbean FisheriesInstitute, Florida Fish and Wildlife Conservation Commission,Marathon, FL.
Agardy, T., Bridgewater, P., Crosby, M. P., Day, J., Dayton, P. K.,Kenchington, R., Laffoley, D., et al. 2003. Dangerous targets?Unresolved issues and ideological clashes around marine protectedareas. Aquatic Conservation: Marine and Freshwater Ecosystems, 4:353–367.
Bartlett, M. S. 1937a. Properties of sufficiency and statistical tests.Proceedings of the Royal Society of London, Series A, 160:268–282.
Bartlett, M. S. 1937b. Some examples of statistical methods of researchin agriculture and applied biology. Journal of the Royal StatisticalSociety, 4: 137–170.
Chassot, E., Bonhommeau, S., Reygondeau, G., Nieto, K., Polovina,J. J., Huret, M., Dulvy, N. K., et al. 2011. Satellite remote sensingfor an ecosystem approach to fisheries management. ICESJournal of Marine Science, 68: 651–666.
Coleman, F., Figueira, W. F., Ueland, J. S., and Crowder, L. B. 2004.The impact of United States recreational fisheries on marine fishpopulations. Science, 305: 1958–1959.
De Anda-Montane, A., Amador-Buenrostro, A., Martınez-Aguilar, S.,and Muhlia-Almazan, A. 2004. Spatial analysis of yellowfin tuna(Thunnus albacares) catch rate and its relation to El Nino and LaNina events in the eastern tropical Pacific. Deep Sea Research, II:Topical Studies in Oceanography, 6: 575–586.
Gittings, S. R. 2006. Conservation science in NOAA’s national marinesanctuaries: description and recent accomplishments. MarineSanctuaries Conservation Series, ONMS-06-04. US Department
Commercial fisheries in the NW Gulf of Mexico 2189
Dow
nloaded from https://academ
ic.oup.com/icesjm
s/article/68/10/2175/614895 by guest on 07 Decem
ber 2021
of Commerce, National Oceanic and Atmospheric Administration,Office of National Marine Sanctuaries, Silver Spring, MD. 30 pp.
Levesque, J. C., and Richardson, A. 2011. Characterization of the rec-reational fisheries associated with the Flower Garden BanksNational Marine Sanctuary (USA). Wildlife Biology in Practice,7: 90–115.
Moore, J. E., Wallace, B., Lewison, R., Zydelis, R., Cox, T., andCrowder, L. 2009. A review of marine mammal, sea turtle andseabird bycatch in USA fisheries and the role of policy in shapingmanagement. Marine Policy, 33: 435–451.
Musick, J. A., Harbin, M. M., Berkeley, S. A., Burgess, G. H., Eklund,A. M., Findley, L., Gilmore, R. G., et al. 2000. Marine, estuarine,and diadromous fish stocks at risk of extinction in NorthAmerica (exclusive of Pacific salmonids). Fisheries, 25: 6–30.
NMFS (National Marine Fisheries Service). 2009. 2008 Status of USFisheries. Office of Sustainable Fisheries, Silver Spring, MD. 28 pp.
NMFS (National Marine Fisheries Service). 2011. Annual CommercialFisheries Landings. Office of Science and Technology, SustainableFisheries, Silver Spring, MD. http://www.st.nmfs.noaa.gov/st1/commercial/index.html (last accessed 20 July 2011).
NMS (National Marine Sanctuaries). 2007. Flower Garden BanksNational Marine Sanctuary Boundary Expansion Workshop,Galveston, TX. 22 pp.
NMS (National Marine Sanctuaries). 2008a. Flower Garden BanksNational Marine Sanctuary Condition Report 2008. USDepartment of Commerce, National Oceanic and AtmosphericAdministration, Office of National Marine Sanctuaries, SilverSpring, MD. 49 pp.
NMS (National Marine Sanctuaries). 2008b. Flower Garden BanksNational Marine Sanctuary. Draft Options Document for theFGBNMS Management Plan. Office of Marine Sanctuaries,Galveston, TX. 21 pp.
NOAA (National Oceanic and Atmospheric Administration). 1991.Flower Garden Banks National Marine Sanctuary. FinalEnvironmental Impact Statement Management Plan for theProposed Flower Garden Banks National Marine Sanctuary,Washington, DC. 283 pp.
NOAA (National Oceanic and Atmospheric Administration). 2006a.National Marine Sanctuaries (NMS). Flower Garden Banks. Stateof the Sanctuary Report. Flower Garden Banks National MarineSanctuary, Galveston, TX. 28 pp.
NOAA (National Oceanic and Atmospheric Administration). 2006b.National Marine Sanctuaries (NMS). Flower Garden Banks.
Summary of Public Scoping Comments Received 26 September–23 November 2006. Flower Garden Banks National MarineSanctuary, Galveston, TX. 11 pp.
NOAA (National Oceanic and Atmospheric Administration). 2008.Framework for the National System of Marine Protected Areas ofthe United States of America. National Marine Protected AreasCenter, NOAA Office of Ocean and Coastal ResourceManagement, Silver Spring, MD. 92 pp.
NOAA (National Oceanic and Atmospheric Administration). 2010.Flower Garden Banks National Marine Sanctuary DraftManagement Plan. Office of National Marine Sanctuaries, SilverSpring, MD. 116 pp.
Pattengill-Semmens, C., Gittings, S. R., and Shyka, T. 2000. FlowerGarden Banks National Marine Sanctuary: a rapid assessment ofcoral, fish, and algae using the AGRRA Protocol. MarineSanctuaries Conservation Series, MSD-00-3. US Department ofCommerce, National Oceanic and Atmospheric Administration,Marine Sanctuaries Division, Silver Spring, MD. 15 pp.
Patterson, W. F., Watterson, J. C., Shipp, R. L., and Cowan, J. H. 2001.Movement of tagged red snapper in the northern Gulf of Mexico.Transactions of the American Fisheries Society, 130: 533–545.
Rosenberg, A. A. 2003. Managing to the margins: the overexploitationof fisheries. Frontiers in Ecology and the Environment, 1: 102–106.
Selig, E. R., and Bruno, J. F. 2010. A global analysis of the effectivenessof marine protected areas in preventing coral loss. PLoS One, 5:e9278. doi:10.1371/journal.pone.0009278.
Soykan, C. U., Moore, J. E., Zydelis, R., Lewison, R. L., Crowder, L. B.,and Safina, C. 2008. Why study bycatch? An introduction to thetheme section on fisheries bycatch. Endangered Species Research,5: 91–102.
Teo, S. L. H., and Block, B. A. 2010. Comparative influence of oceanconditions on yellowfin and Atlantic bluefin tuna catch from long-lines in the Gulf of Mexico. PLoS One, 5: e10756. doi:10.1371/journal.pone.0010756.
USC (United States Code). 1974. National Marine Sanctuary ProgramRegulations. US Government Printing Office, Washington, DC.Code of Federal Regulations, 922: 1401–1445.
Wahle, C., Lyons, S., Barba, K., Bunce, L., Fricke, P., Nicholson, E.,Orbach, M., et al. 2003. Social science research strategy formarine protected areas. National Marine Protected Areas Center,MPA Science Institute, Santa Cruz, CA. 52 pp.
Zar, J. H. 1999. Biostatistical Analysis, 4th edn. Prentice-Hall, UpperSaddle River, NJ. 718 pp.
2190 J. C. Levesque
Dow
nloaded from https://academ
ic.oup.com/icesjm
s/article/68/10/2175/614895 by guest on 07 Decem
ber 2021