Embed Size (px)
Citation preview

page i
waGGa RSLDobbs Street, Wagga Wagga
Commercial ClubGurwood Street, Wagga Wagga

page ii

page 1
page 2 Notice of AGM
page 6 Reports President’s Report × Director’s Report
page 9 2016-17 Snapshot
page 11 Financial Statements
page 16 2016-17 Club Grants
page 17 Notes to Financial Statements
page 42 Directors Declaration
page 43 Auditor’s Report
contents

page 2
Notice is hereby given that the Annual General Meeting of Wagga RSL Club Ltd will be held on Wednesday, 18th October 2017 at 5.30pm at the Wagga RSL Club premises, Dobbs St, Wagga Wagga.
Business1. To receive and consider the Ordinary Resolutions
2. To receive and consider the report of the Directors
3. To receive and consider the Financial Statements:
a. Consolidated Statement of Profit or Loss and Other Comprehensive Income
b. Consolidated Statement of Financial Position
c. Consolidated Statement of Changes in Equity
d. Consolidated Statement of Cash Flows
e. Notes to Financial Accounts
4. To receive and consider the Auditors Report
5. To declare the election of Directors for the ensuing period
6. To confirm the appointment of Auditors
7. Any other relevant business of which due notice has been given.
By order of the Board of Directors.
Andrew Bell
General Manager
notice of annual general meeting
page 3
ordinary resolution 1““That pursuant to the Registered Clubs Act 1976, as amended, the members hereby approve and agree to the members of the Board and Senior Management during the period preceding the next Annual General Meeting receiving the following benefits and the members further acknowledge that the benefits outlined in sub-paragraphs (a) to (i) are not available to members generally, but, only to those members who are elected to the Board of Directors of the Club, or Senior Managers;
a. Reasonable meals and refreshments for each Director in conjunction with each Board or Committee Meeting;
b. Reasonable costs or expenses in relation to the professional development and education of Directors and Managers including:-
i. Attending meetings of associations of which the Club is a member or Managers or Directors of the Club are members;
ii. Attending seminars, lectures, trade displays, organised study tours, fact finding tours and other similar events as may be determined by the Board from time to time;
iii. Attending other registered clubs or gaming premises for the purpose of observing their facilities and methods of operation;
iv. Attending conferences and training sessions in relation to their roles and responsibilities under the Registered Clubs Act, the Corporation Act 2001 and any other relevant legislation.
c. Reasonable costs or expenses of attending functions whilst representing the Club with partners where appropriate;
d. Reasonable costs or expenses of traveling by either private or public transport to and from Directors or other duly constituted meetings held within the Club or elsewhere;
ordinary resolutions

page 4
e. Reasonable costs or expenses in relation to such other duties including entertainment of special guests of the Club and other promotional activities approved by the Board;
f. Reasonable costs or expenses in relation to the provision of uniforms and associated apparel for the use of each Director or Senior Manager when representing the Club;
g. The provision of a specially reserved parking space at the Club for the use of the President when attending the Club to carry out his duties;
h. Reasonable costs or expenses in relation to presentations to members (other than in the form of money) or to other persons to acknowledge services, which in the opinion of the Directors, were of benefit to the Club;
i. Reasonable costs or expenses relating to the sponsorship by payment of money or provision of benefits to such sporting events, sports or community organisations, which, in the opinion of the Directors will be beneficial to the Club or the community over and above such expenditure required under the Club Grants Scheme.”
Explanatory Message
Pursuant to the requirements of the Registered Clubs Act 1976, the Club is required at each Annual General Meeting to have approved by Ordinary Resolution, the benefits to be provided to the Directors of the Club. The benefits, which are provided, are the standard benefits to have been provided to Directors of the Club over a number of years. The purpose of this Resolution is to comply with the requirements of the Registered Clubs Act.
Notes to Members Regarding Ordinary Resolution 1
To be passed, Ordinary Resolution 1 must receive a simple majority of votes in its favor from those persons present at the Meeting who are eligible to vote. Proxy voting is not permitted under the Registered Clubs Act.
Ordinary resolution 2Approval of Honoraria for Directors for the year 2017/2018.
“That pursuant to the Registered Clubs Act 1976, as amended, the members hereby approve and agree to the members of the Board, during the period preceding the next Annual General Meeting receiving Honoraria for the positions named, and the sums referred to below, in respect of services rendered to the Club and the members further acknowledge that the Honoraria are not available to members generally, but only those members who are elected to the Board of Directors of the Club:
i. $13,954 to the President
ii. $7,814 to the Vice President
iii. $3,350 to each other Director”
Explanatory Message
Pursuant to the requirements of the Registered Clubs Act 1976, the Club is required to have the Honoraria for Directors approved by the members at the Annual General Meeting. The Honoraria has been adjusted by 2% to reflect the increase in the Consumer Price Index (CPI) and will continue to be adjusted on an annual basis as approved at the 2011 Annual General Meeting. The purpose of this Resolution is to comply with the requirements of the Registered Clubs Act.
Notes to Members Regarding Ordinary Resolution 2
To be passed, Ordinary Resolution 2 must receive a simple majority of votes in its favor from those members present at the Meeting who are eligible to vote. Proxy voting is not permitted under the Registered Clubs Act. The Board recommends Ordinary Resolution 2 to the Meeting.
page 4

page 5
board of directors Peter Thomas
President
adam drummondDirector
Andrew CrakanthorpeDirector
Tim GumbletonDirector
Andrew BellGeneral Manager
Phillip mcintoshvice President
John GrayDirector
Phillip ElliotDirector

page 6
Our members and visitors have again contributed to a successful result for the Wagga RSL and Commercial clubs. Without your continued patronage, we could not provide what we believe is a well-appointed, safe venue for your enjoyment. As a non for profit organisation, we continue to improve the clubs amenities for everyone’s benefit, which can now be seen with the completed renovations of the casino bars and lounge areas at the RSL Club. This renovation has really lightened up the club and has created a relaxing, inviting area to sit and enjoy great company. We are very proud of the result and have had fantastic feedback from members and visitors. The gaming lounge renovations are well under way at the RSL and will be completed by the time you read my report. Everyone is very excited about the new décor and layout of our new gaming floor and we look forward to sharing these most recent renovations with you all.
Thank you to our many sporting clubs for their valued support again this year, especially our bowlers. They work hard to run high quality competitions and events throughout the year and take great pride in ensuring their success. Our RSL Bowling club is a welcoming group of energetic people who welcome new players at any time regardless of their bowling ability.
This year the Wagga RSL Sub-Branch elected a new president in Harry Edmonds. We wish Harry all the best for his term and know he will be committed in his position. We must also thank Kevin Kerr for his tireless work with the RSL Sub-Branch over the years and know that he will still assist and support this wonderful group of people where necessary. We thank all those at the RSL Sub-Branch who work hard behind the scenes to ensure that the RSL traditions are never forgotten.
Yet again, Mat and Lauren from CNL Catering have had another great year as the caterers at both of our clubs. They continually strive to provide a changing food offering for the benefit of our members and visitors. Congratulations on the birth of their new son, Thomas, another addition to your family and ours. As always, a special thanks to Alan, Ivy and their team for
the consistent offering at Pearl, you always offer a wonderful meal and dining experience. If you are keen to dine it is highly recommended to book to avoid missing out.
Our financial results are a true reflection of the work of our CEO, Andrew Bell, his committed management team, dedicated staff across both clubs and all those involved at the motel. Without their efforts, I am sure things would not flow as well. We welcome to our management team, Emma Curran, HR Manager and Adrian Hume IT and Maintenance Manager. Their expertise will be sure to complement Andrew and his team well.
Our clubs continued to support a number of community organisations and charities over the last twelve months. Some of thankful recipients have included The Forrest Centre, Kurrajong Waratah, Riverina Bluebell, Cancer Council and Wagga Wagga Cycling Club.
The Wagga RSL board welcomed Tim Gumbleton to our board team this year. Tim brings with him a wealth of experience and skills to our group. I would like to thank all the board members for their time and effort they put in working with Andrew and his team - my position as President is a truly rewarding job.
Thankyou
Peter Thomas
President
president’s report

page 7
director’s report
The Directors of Wagga RSL Club Ltd (the ‘Club or Company’) have pleasure in presenting their report together with the financial statements for the year ended 30 June 2017 and the auditor’s report thereon.
Directors
The Directors of the Club at any time during or since the financial year are:
All directors are considered to be independent non-executive directors and have been in office since the start of the financial year to the date of this report unless otherwise stated.
Directors Meetings
The number of Directors’ meetings attended by each of the Directors of the Club during the year are:
name meetingsattended
meetingsheld*
Peter Thomas 10 11
Phillip McIntosh 8 11
John Gray 10 11
Phillip Elliott 10 11
Tim Rose 8 8
Adam Drummond 8 11
Andrew Crakanthorp 8 11
Tim Gumbleton 4 4
* reflects the number of meetings held during the time the Director held office during the year.
Peter Thomas President
Years of Service: 9 Occupation: Manager
Phillip McIntosh Vice President
Years of Service: 10 Occupation: General Manager
John Gray Years of Service: 13 Occupation: Retired
Phillip Elliott Years of Service: 10 Occupation: Manager
Tim Rose Years of Service: 3 Occupation: Managing Director, resigned 6/12/16
Adam Drummond Years of Service: 3 Occupation: Online Media Executive
Andrew Crakanthorp Years of Service: 3 Occupation: Director Planning and Regulatory Services
Tim Gumbleton Years of service: 4 months Occupation: Principal, appointed 2/3/17
Operating Profit
The profit of the consolidated group for the financial year
after providing for income tax amounted to $1,332,224
(2016: $2,169,016).
Significant Changes
No significant changes in the nature of the Company’s activities
occurred during the year.

page 8
Principal Activities
The principal activities of the Company during the financial year
were the operation of a licensed club.
No matters or circumstances have arisen since the end of the
financial year which significantly affected or may significantly
affect the operations of the company, the results of those
operations, or the state of affairs of the Company in future
financial years.
Future Developments
Likely developments in the operations of the Company and the
expected results of those operations in future financial years
have not been included in this report as the inclusion of such
information is likely to result in unreasonable prejudice to the
Company.
Environmental Issues
The Company’s operations are not regulated by any significant
environmental regulation under a law of the Commonwealth or
of a state or territory.
Short term objectives of the Company
The Company has identified the following short term objectives:
× To trade profitably to guarantee future growth.
× To provide a safe environment for Members and their guests; and
× To continue to give Members and their guests the best service possible.
Long term objectives of the Company
The Company has identified the following long term objectives:
× To continue to remain financially secure;
× To grow the Company operations in accordance with Members interests and to show genuine concern for the comfort and satisfaction of Members and their guests; and
× To continue to promote sport in the Community by providing sporting facilities for use by the Members and to be recognised for contribution to sport.
Membership
The Club is a company limited by guarantee and without a share
capital. The number of members as at 30 June 2017 was 22,844
(2016: 20,999). In the event of winding up every member
undertakes to contribute $2 during the time of membership or
within one year thereafter.
Dividends
In accordance with the Articles of Association, the Parent
Company is a company limited by guarantee to the extent of $2
per member and accordingly no shares or debentures have been
issued and no dividends have been recommended or paid, since
the start of the financial year.
Indemnifying Officer or Auditor
During or since the end of the financial year the company has
given an indemnity or entered an agreement to indemnify, or
paid or agreed to pay insurance premiums as follows:
The company has paid premiums to insure each of the following
Directors against liabilities for costs and expenses incurred
by them in defending any legal proceedings arising out of their
conduct while acting in the capacity of Director of the company,
other than conduct involving a wilful breach of duty in relation
to the company.
Mr Peter Thomas
Mr Phillip McIntosh
Mr John Gray
Mr Phillip Elliott
Mr Tim Rose
Mr Adam Drummond
Mr Andrew Crakanthorp
Mr Tim Gumbleton
Lead Auditor’s Independence Declaration
The lead auditor’s independence declaration as required under
section 307C of the Corporations Act is on page 10 and forms
part of the Directors’ report for the financial year ended
30 June 2017.
Dated at Albury this 29th day of August 2017.
Signed in accordance with a resolution of Directors.
Peter Thomas
President
Phillip McIntosh
Director

page 9
636free roomhires given
2016-2017 snapshot
138community groups supported
ninefunction
rooms
twocafes
fivebars
threerestaurants
105staff
employed
8,909facebook likers
9.3/10booking.com rating
four + half starmotel + apartments
22,844members
356,865visits to our club

page 10
lead auditor’sindependencedeclarationunder section 307C of the corporations act 2001
To: the Directors of Wagga RSL Club Ltd and its controlled entity
I declare that, to the best of my knowledge and belief, in relation to the audit for the financial year ended 30 June 2017 there have been:
i. no contraventions of the auditor independence requirements as set out in the Corporations Act 2001 in relation to the audit; and
ii. no contraventions of any applicable code of professional conduct in relation to the audit.
Crowe Horwath Albury
Bradley D Bohun Partner
Dated at Albury this 29th day of August 2017

page 11for the year ended 30 june 2017
consolidated statement of profit or loss + other comprehensive income
Note 2017 $
2016 $
Revenue 3 17,357,859 17,734,286
Cost of goods sold (1,477,067) (1,475,849)
Buildings & maintenance expenses (2,557,036) (2,316,487)
Depreciation and amortisation expenses (1,637,174) (1,497,754)
Employee benefits expenses 4 (4,689,874) (4,416,408)
Members expenses and donations 5 (2,360,805) (2,253,126)
Interest expense (262,619) (290,449)
Motel operating expenses (204,460) (183,866)
Poker machine duty (2,152,474) (2,258,839)
Other expenses (644,914) (835,055)
Profit (Loss) before income tax 1,371,436 2,206,453
Income tax expense (39,212) (37,437)
Profit for the year 1,332,224 2,169,016
Other comprehensive income - 885,767
Total comprehensive income for the period 1,332,224 3,054,783
The consolidated statement of profit or loss and other comprehensive income is to be read in conjunction with the notes to and forming part of the financial statements set
out on pages 17 to 40.

page 12 for the year ended 30 june 2017
consolidated statement of financial position
Note 2017 $
2016 $
CURRENT aSSETS
Cash and cash equivalents 7 526,596 844,016
Trade and other receivables 8 182,900 152,985
Inventories 9 198,757 139,851
Other assets 10 25,182 14,923
Total Current Assets 933,435 1,151,775
non-Current assets
Financial assets 11 718,144 620,131
Property, plant and equipment 12 30,430,717 27,970,103
Investment property 13 4,600,978 4,598,000
Intangible assets 14 1,624,611 1,624,611
Total Non-Current Assets 37,374,450 34,812,845
Total Assets 38,307,885 35,964,620
The consolidated statement of financial position is to be read in conjunction with the notes to and forming part of the financial statements set out on pages 17 to 40.

page 13for the year ended 30 june 2017
continued...
The consolidated statement of financial position is to be read in conjunction with the notes to and forming part of the financial statements set out on pages 17 to 40.
Note 2017 $
2016 $
Current Liabilities
Trade and other payables 15 1,390,392 937,734
Borrowings 16 5,538,723 4,834,119
Provisions 17 520,973 629,301
Total Current Liabilities 7,450,088 6,401,153
Non-Current Liabilities
Borrowings 16 1,423,682 1,452,436
Deferred tax liabilities 18 1,437,676 1,446,815
Total Non-Current Liabilities 2,861,358 2,899,251
Total Liabilities 10,311,446 9,300,404
Net Assets 27,996,439 26,664,216
Equity
Reserves 7,178,435 7,178,435
Retained earnings 20,818,004 19,485,780
Total Equity 27,996,439 26,664,215

page 14 for the year ended 30 june 2017
note
Retained earnings
$
Asset Revaluation
reserves $
non Controlling
interest $
total equity
$
Balance at 1 July 2015 19,486,777 5,722,180 117,157 25,326,114
Adjustment for prior period errors 2 (504,882) - - (504,882)
Adjusted balance at 1 July 2015 18,981,895 5,722,180 117,157 24,821,232
Profit attributable to equity 2,169,016 - - 2,169,016
Revaluations - 885,767 - 885,767
Dividends paid - - (11,800) (11,800)
Share Buy Back (1,665,131) 570,488 (105,357) (1,200,000)
Balance at 30 June 2016 19,485,780 7,178,435 - 26,664,215
Profit attributable to equity 1,332,224 - - 1,332,224
Revaluations - - - -
Balance at 30 June 2017 20,818,004 7,178,435 - 27,996,439
consolidated statement of changes in equity
page 14
The consolidated statement of changes in equity is to be read in conjunction with the notes to and forming part of the financial statements set out on pages 17 to 40.
for the year ended 30 june 2017

page 15for the year ended 30 june 2017
Note 2017 $
2016 $
Cash flows from operating activities
Receipts from customers 18,915,488 15,304,529
Payments to suppliers and employees (15,689,615) (11,555,282)
Dividends received 4,209 3,759
Interest received 123 196
Income taxes (paid)/refunded (39,212) (37,437)
Finance costs (262,619) (290,449)
Net cash provided by operating activities 22 2,928,374 3,425,316
Cash flows from investing activities
Proceeds from sale of intangibles - 305,682
Proceeds from sale of property, plant and equipment 238,224 144,963
Payments for property, plant and equipment (4,156,890) (2,209,368)
Payments for investment property (2,978) (3,000)
Payments for other investments - (12,000)
Net Cash Used in Investing Activities (3,921,644) (1,773,723)
Cash flows from financing activities
Proceeds from borrowings 1,103,544 401,966
Repayments for borrowings (680,000) (917,832)
Dividends paid - (11,800)
Share buyback - (950,000)
Net Cash Used in Financing Activities 423,544 (1,477,666)
Net increase/(decrease) in cash held (569,726) 173,927
Cash at beginning of financial year 685,581 511,654
Cash at End of Financial Year 7 115,855 685,581
consolidated statement of cash flows
The consolidated statement of cashflows is to be read in conjunction with the notes to and forming part of the financial statements set out on pages 17 to 40.

page 16 for the year ended 30 june 2017
community
south wagga rotary
kurrajong waratah
wagga lake run and ride
wagga rsl sub branch
wagga wagga food and wine festival
wagga community blitz
riverina conservatorium of music
wagga wagga cycling club
sturt public school
wagga school of arts
apex south wagga
kokoda youth leadership challenge
australian war memorial
clubgrants
community welfare +
social services
war widows guild of australia nsw ltd
cancer council nsw: wagga relay for life
the forest centre
royal far west: caring for country kids
health
wagga biggest blokes luncheon
wagga base hospital
Prostate Cancer foundation
riverina bluebell
special medical research
white ribbon ball
sport
men of league foundation
nsw australian clay target association
country club pro am
wagga wagga basketball association
collingullie glenfield park football/netball club
southern sports academy
east wagga kooringal football/netball club
club facilities
wagga rsl bowling club
wagga rsl courtesy bus
wagga rsl children’s creche
free room hire for many community
organisations
just some of our recipients

page 17for the year ended 30 june 2017
note 1
a. Statement of Significant Accounting Policies
The financial report is a general purpose financial report that has been prepared in accordance with the Corporations Act 2001 and Australian Accounting Standards – Reduced Disclosure Regime, and complies with other requirements of the law.
The consolidated financial statements and notes represent those of Wagga RSL Club Limited and its controlled entity (“the consolidated group”). Wagga RSL Club Limited is a company limited by guarantee.
i. Reporting Basis and Conventions
The financial report has been prepared on an accruals basis and is based on historical costs. It does not take into account changing money values or, except where stated, current valuations of non-current assets. Cost is based on the fair values of the consideration given in exchange for assets.
The following is a summary of the material accounting policies adopted by the economic entity in the preparation of the financial report. The accounting policies have been consistently applied, unless otherwise stated.
b. Accounting Policies Principles of Consolidation
The consolidated financial statements incorporate the assets, liabilities and results of entities controlled by Wagga RSL Club Limited at the end of the reporting period. A controlled entity is any entity over which Wagga RSL Club Limited has the power to govern the financial and operating policies so as to obtain benefits from its activities.
In preparing the consolidated financial statements, all intragroup balances and transactions between entities in the consolidated group have been eliminated in full on consolidation.
Non-Controlling interests, being the equity in a subsidiary not attributable, directly or indirectly, to a parent are shown separately within the equity section of the consolidated statement of financial position and statement of profit or loss and other comprehensive income. The non-controlling interests’ interests in the net assets comprise their interests at the date of the original business combination and their share of changes in equity since that date.
c. Inventories
Inventories are measured at the lower of cost and net realisable value.
d. Cash and Cash Equivalents
Cash and cash equivalents include cash on hand, deposits held at call with banks, other short-term highly liquid investments with original maturities of three months or less, and bank overdrafts. Bank overdrafts are shown within short-term borrowings in current liabilities in the statement of financial position.
e. Property, Plant and Equipment
Each class of property, plant and equipment is carried either at cost or fair value as indicated less, where applicable, any accumulated depreciation and impairment losses.
i. Property
Freehold land and buildings are shown at their fair value (being the amount for which an asset could be exchanged between knowledgeable willing parties in an arm’s length transaction), based on periodic valuations by external independent valuers, less subsequent depreciation.
Increases in the carrying amount arising on revaluation of property, plant & equipment are credited to a revaluation reserve in equity. Decreases that offset previous increases of
notes to and forming part of the financial report

page 18 for the year ended 30 june 2017
i. Property (continued) the same asset are charged against fair value reserves directly in equity; all other decreases are charged to the statement of profit or loss and other comprehensive income.
Any accumulated depreciation at the date of revaluation is eliminated against the gross carrying amount of the asset and the net amount is restated to the revalued amount of the asset.
ii. Plant & Equipment
Plant & equipment is measured on the cost basis less any depreciation and impairment losses.
iii. Depreciation
The depreciable amount of all fixed assets including buildings and capitalised leased assets, but excluding freehold land, is depreciated on a straight line basis over the assets useful life.
The depreciation rates used for each class of depreciable assets are:
Class of Fixed Asset Depreciation Rate
Buildings 2.5%
Plant & Equipment 10 - 40%
The assets’ residual values and useful lives are reviewed, and adjusted if appropriate, at each balance date.
An asset’s carrying amount is written down immediately to its recoverable amount if the asset’s carrying amount is greater than its estimated recoverable amount.
Gains and losses on disposals are determined by comparing proceeds with the carrying amount. These gains or losses are included in the statement of profit or loss and other comprehensive Income. When revalued assets are sold, amounts included in the revaluation reserve relating to that asset are transferred to retained earnings.
f. Financial Instruments
i. Initial Recognition and Measurement
Financial assets and financial liabilities are recognised when the entity becomes a party to the contractual provisions to the instrument. For financial assets, this is equivalent to the date that the Group commits itself to either purchase or sell the asset (ie trade date accounting adopted).
Financial instruments are initially measured at fair value plus transactions costs except where the instrument is classified ‘at fair value through profit or loss’ in which case transaction costs are expense to profit or loss immediately.
ii. Classification and Subsequent Measurement
Financial assets classified as “fair value through profit or loss” are subsequently measured at fair value with changes in carrying amounts being included in profit or loss.
g. Impairment of Assets
At each reporting date, the Group reviews the carrying values of its tangible and intangible assets to determine whether there is any indication that those assets have been impaired. If such an indication exists, the recoverable amount of the asset, being the higher of the asset’s fair value less costs to sell and value in use, is compared to the asset’s carrying value. Any excess of the asset’s carrying value over its recoverable amount is expensed to the statement of profit or loss and other comprehensive income.
Impairment testing is performed annually for intangible assets with indefinite lives. Where it is not possible to estimate the recoverable amount of an individual asset, the Group estimates the recoverable amount of the cash-generating unit to which the asset belongs.
h. Intangibles
Poker machine licences and water licences are recorded at either cost or deemed cost and have an infinite life. Licences are assessed annually for impairment.
i. Employee Benefits
Provisions are made for the Group’s liability for employee benefits arising from services rendered by employees to balance date. Employee benefits that are expected to be settled within one year have been measured at the amounts expected to be paid when the liability is settled, plus related on-costs.
Employee benefits payable later than one year have been measured at the present value of the estimated future cash outflows to be made for those benefits. Those cashflows are discounted using market yields on national government bonds with terms to maturity that match the expected timing of cashflows.
notes to and forming part of the financial report
page 19for the year ended 30 june 2017
j. Provisions
Provisions are recognised when the Group has a legal or constructive obligation, as a result of past events, for which it is probable that an outflow of economic benefits will result and that outflow can be reliably measured.
Provisions recognised represent the best estimate of the amounts required to settle the obligation at reporting date.
k. Investment Property
Investment property, comprising of freehold residential properties, is held to generate long-term rental yields. Investment property is initially measured at cost and subsequently measured at fair value.
Fair value of investment properties is determined annually based on a valuation by an independent valuer who has recognised and appropriate professional qualifications. Fair values are determined by the valuer using market information, including prices for similar properties in comparable locations.
Changes to fair values of investment properties are recognised in profit or loss in the period in which they occur.
l. Revenue and Other Income
Revenue is measured at the fair value of the consideration received or receivable after taking into account any trade discounts and volume rebates.
Revenue from the sale of goods is recognised at the point of delivery as this corresponds to the transfer of significant risks and rewards of ownership of the goods and cessation of all involvement in those goods.
Poker machine revenue is shown net of Gaming Machine Tax that was paid to the Office of State Revenue.
Interest revenue is recognised using the effective interest rate method, which for floating rate financial assets is the rate inherent in the instrument.
Dividend revenue is recognised when the right to receive a dividend has been established.
m. Goods and Services Tax
Revenues, expenses and assets are recognised net of the amount of GST, except where the amount of GST incurred is not recoverable from the Australian Tax Office. In these circumstances, the GST is recognised as part of the cost of acquisition of the asset or as part of an item of the expense. Receivables and payables in the statement of financial position are shown inclusive of GST.
n. Comparative Figures
When required by Accounting Standards, comparative figures have been adjusted to conform to changes in presentation for the current financial year.
o. Leases
Leases of fixed assets, where substantially all the risks and benefits incidental to the ownership of the asset, but not the legal ownership, are transferred to the entity are classified as finance leases.
Finance leases are capitalised, recorded in an asset and a liability equal to present value of the minimum lease payments, including any guaranteed residual values.
Leased assets are depreciated on a straight-line basis over their estimated useful lives where it is likely that the entity will obtain ownership of the asset.
Lease payments are allocated between the reduction of the lease liability and the lease interest expense for the period. Lease payments for operating leases, where substantially all the risks and benefits remain with the lessor, are charged as expenses on a straight-line basis over the lease term.
p. Income Tax
The mutuality principle has been applied to the calculation of the parent company’s income tax. The club has estimated that the assessable proportion of mutual income represented by results of trading attributable to non-members of the Group is to be 18.21% (2016:14%).
The income tax expense for the year comprises current income tax expense and deferred tax expense.
Deferred income tax expense reflects the movements in deferred tax assets and deferred tax liability balances during the year.
notes to and forming part of the financial report

page 20 for the year ended 30 june 2017
Movement in Deferred tax liability (restated)
Movements in the deferred tax liability between the beginning and the end of the current financial year relate to a restatement as a result of deferred tax liability not recognised in the 2016 year financial statements.
q. Trade and Other Payables
Trade and other payables represent the liability outstanding at the end of the reporting period for goods and services received by the group during the reporting period which remain unpaid. The balance is recognised as a current liability with the amounts normally paid within 30 days of recognition of the liability.
r. Fair Value of Assets and Liabilities
The Group measures some of its assets and liabilities at fair value on either a recurring or non-occurring basis, depending on the requirements of the applicable accounting standards.
“Fair Value” is the price the Group would receive to sell an asset or would have to pay to transfer a liability in an orderly (i.e. unforced) transaction between independent, knowledgeable and willing market participants at the measurement date.
As fair value is a market-based measure, the closest equivalent observable market pricing information is used to determine fair value. Adjustments to market values may be made having regard to the characteristics of the specific asset or liability. The fair values of assets and liabilities that are not traded in an active market are determined using one or more valuation techniques. These valuation techniques maximise, to the extent possible, the use of observable market data.
To the extent possible, market information is extracted from the principal market for the asset or liability (i.e. the market with the greatest volume and level of activity for the asset or liability). In the absence of such a market, market information is extracted from the most advantageous market available to the entity at the end of the reporting period (i.e. the market data that maximises the receipts from the sale of the assets or minimize the payments made to transfer the liability, after taking into account transaction costs).
For non-financial assets, the fair value measurement also takes into account a market participant’s ability to use the assets in its highest and best use or to sell it to another market participant that would use the assets in its highest and best use.
s. Critical Accounting Estimates and Judgements
The Directors evaluate estimates and judgements incorporated into the financial statements based on historical knowledge and best available current information. Estimates assume a reasonable expectation of future events and are based on current trends and economic data, obtained both externally and within the Group
t. Land & Buildings (owner occupied & investment property)
The freehold land and buildings of core property were independently valued at 30 June 2015 by Preston Rowe Paterson. The valuation was based on fair value in use for financial reporting purposes assuming part of a viable going concern. The critical assumptions adopted in determining the valuation included the location of the land and building, the demand for land and building in the area and recent sales data for similar properties. Where the investment income capitalisation approach was used the value was determined using a capitalisation rate of 13% and 14%.
The investment properties were independently valued at 30 June 2015 by Preston Rowe Patterson. The valuation was based on fair market value. The critical assumptions adopted in determining the valuation include the location of the land and buildings, the demand for land and building in the area and recent sales data for similar properties.
The freehold land and buildings of other property were independently valued at 31 August 2015 by Opteon Property Group. The valuation was based on fair value in use for financial reporting purposes assuming part of a viable going concern. The critical assumptions adopted in determining the valuation included the location of the land and building, the demand for land and building in the area and recent sales data for similar properties. Where the investment income capitalisation approach was used the value was determined using a capitalisation rate of 14%.
u. Taxation
The mutuality methodology applied is the result of door counts which are considered to be reasonably representative of members vs non-members accessing the Club and generating profits.
Capital gains tax calculations are performed with land and building valuation data referred to above and historical tax base data as retained by the Club.
notes to and forming part of the financial report

page 21for the year ended 30 june 2017
note 2 correctionof errors
balance sheet (extract)1 july 2015
$
increase/(decrease)
$
1 july 2015 restated
$
Deferred tax liability 941,932 504,882 1,446,814
Net assets 25,326,114 (504,882) 24,821,232
Retained earnings 19,486,777 (504,882) 18,981,895
Total equity 25,326,114 (504,882) 24,821,232
page 21
In 2017, a deferred tax reconciliation revealed that the 2016 DTL was understated due to differences in numerous post CGT assets tax bases and carrying values not being recognised by the Club. This has resulted in a prior period adjustment to retained earnings as noted below.
This error has been corrected by restating each of the affected financial statement line items for the prior periods as follows:
notes to and forming part of the financial report for the year ended 30 june 2017

page 22 for the year ended 30 june 2017
note 3 revenue + other income
2017 $
2016 $
Revenue
Sale of goods 3,068,461 2,968,410
Accommodation income 1,629,227 1,544,239
Poker machine income 10,538,102 11,060,992
Commissions 383,826 384,297
Membership subscriptions 103,229 125,436
Dividends received 4,209 3,759
Interest income 123 196
Sundry income 1,047,426 1,242,508
Rental income 322,196 320,026
Revaluation of investments 81,938 (24,996)
Profit/(loss) on sale of assets 179,122 109,419
17,357,859 17,734,286
notes to and forming part of the financial reportpage 22 for the year ended 30 june 2017

page 23for the year ended 30 june 2017
note 4 employeeexpenses
members expenses + donations
2017 $
2016 $
Salaries and wages 3,854,289 3,565,290
Superannuation 386,163 370,434
Movement in employee leave entitlements (62,696) 20,509
Other employee related costs 512,118 501,193
4,689,874 4,416,408
2017 $
2016 $
Raffles and trophies 530,504 499,326
Members amenities 407,564 302,644
Bingo prizes 302,566 309,115
Promotions 271,855 277,649
Sponsorship and donations 468,283 360,321
Club points redeemed 252,236 302,876
Other member expenses 127,797 201,195
2,360,805 2,253,126
note 5
notes to and forming part of the financial report

page 24 for the year ended 30 june 2017
note 6 income tax expense
2017 $
2016 $
The components of the tax expense comprise:
Total income tax payable for this year 48,351 49,911
Movements in deferred tax liability (9,139) (12,474)
Income tax expense 39,212 37,437
The prima facie tax on profit
Sales revenue
Mutual income 12,999,703 12,087,253
Fully taxable 3,107,781 2,817,821
Non taxable (exempt income) 383,638 533,083
16,491,122 15,438,157
Taxable Income
Non member’s income (18.21%) 2,366,789 1,692,215
Fully taxable income 3,107,781 2,817,821
5,474,570 4,510,037
notes to and forming part of the financial report

page 25for the year ended 30 june 2017
2017 $
2016 $
Allowable expenses
Non members expenses (18.21%) 2,031,741 1,351,955
Fully deductible expenses 3,074,613 2,832,021
Prior years tax losses utilised 201,032 159,690
5,307,386 4,343,666
Taxable income 167,184 166,370
Tax at 30% 50,155 49,911
Less tax effect of franking credits (1,804) -
Movements in deferred tax liability (9,139) (12,474)
Income tax attributed to the group 39,213 37,437
note 6 continued...
page 25notes to and forming part of the financial report for the year ended 30 june 2017

page 26 for the year ended 30 june 2017
note 7 cash + cash equivalents
2017 $
2016 $
Cash on Hand 431,302 553,768
Cash at Bank 95,294 290,248
526,596 844,016
Reconciliation of cash
Cash at the end of the financial year as shown in the consolidated statement of financial position as follows:
Cash & Cash Equivalents 526,596 844,016
Bank Overdraft (Note 16) (410,741) (158,435)
Cash & Cash Equivalents per statement of cash flow 115,855 685,581
page 26 notes to and forming part of the financial reportfor the year ended 30 june 2017

page 27for the year ended 30 june 2017
note 8 trade + other receivables
2017 $
2016 $
Current
Trade Debtors 182,900 152,985
182,900 152,985
2017 $
2016 $
Current
At cost: 198,757 139,851
Stock on Hand 198,757 139,851
note 9 inventories
notes to and forming part of the financial report
page 28 for the year ended 30 june 2017
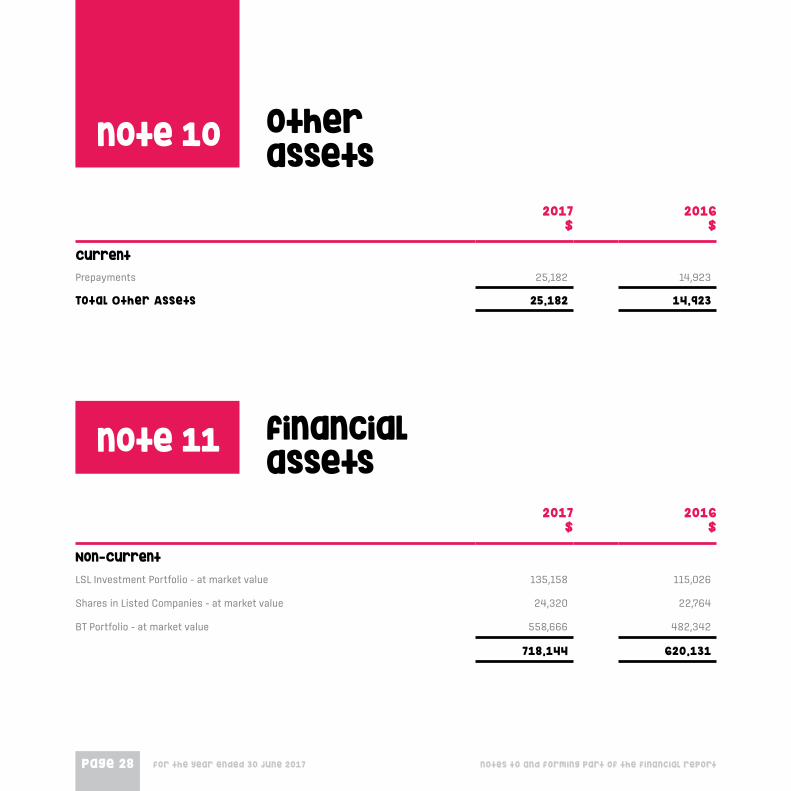
note 10 other assets
2017 $
2016 $
Non-Current
LSL Investment Portfolio – at market value 135,158 115,026
Shares in Listed Companies – at market value 24,320 22,764
BT Portfolio – at market value 558,666 482,342
718,144 620,131
2017 $
2016 $
Current
Prepayments 25,182 14,923
Total Other Assets 25,182 14,923
note 11 financial assets
notes to and forming part of the financial report

page 29for the year ended 30 june 2017
note 12 property, plant + equipment
2017 $
2016 $
Land and Buildings
Freehold land at fair value
Land – Core Property 3,375,000 3,375,000
Land - Other 1,070,000 1,070,000
4,445,000 4,445,000
Buildings at fair value
Buildings (core property) – at fair value 15,290,000 15,290,000
Building (other) at fair value 4,860,000 4,860,000
Building additions – at cost 2,917,952 910,351
Less: accumulated depreciation (1,213,461) (583,527)
21,854,491 20,476,824
Plant and Equipment
At Cost 11,660,822 12,778,221
Less: accumulated depreciation (8,536,881) (9,729,942)
Total Plant and Equipment 3,123,941 3,048,279
Capital work in progress 1,007,285 356,887
Total Property, Plant and Equipment 30,430,717 27,970,103
notes to and forming part of the financial report

page 30 for the year ended 30 june 2017
note 12 continued...
a. Movements in Carrying Amounts
Movement in the carrying amounts for each class of property, plant and equipment between the beginning and the end of the current financial year.
Freehold land
$buildings
$
Plant & equipment
$
work in progress
$Total
$
Balance at 1 July 2015 4,415,000 19,034,375 2,661,577 - 26,110,952
Reallocations 30,000 1,222,524 - (1,252,524) -
Additions - 910,351 943,130 1,609,411 3,461,892
Disposals - (81,875) (23,112) - (104,987)
Depreciation expense - (608,551) (889,203) - (1,497,754)
Balance at 30 June 2016 4,445,000 20,476,824 3,048,279 356,887 27,970,103
Reallocations - 2,007,601 - (2,007,601) -
Additions - - 1,498,891 2,657,999 4,156,890
Disposals - - (59,102) - (59,102)
Depreciation expense - (629,934) (1,007,240) - (1,637,174)
Balance at 30 June 2017 4,445,000 21,854,491 3,123,941 1,007,285 30,430,717
b. Asset revaluations
The freehold land and buildings (core property) were independently valued at 30 June 2015 by Preston Rowe Paterson. The movement in valuation has been recorded through the asset revaluation reserve.
c. Asset revaluations – Other
The freehold land and buildings (other) were independently valued at 31 August 2015 by Opteon Property Group. The movement in valuation has been recorded through the asset revaluation reserve.
notes to and forming part of the financial report

page 31for the year ended 30 june 2017
note 13 investment property
2017 $
2016 $
Investment Property - at market value 4,600,978 4,598,000
Movements in Carrying Amounts
Movement in the carrying amounts for investment property between the beginning and the end of the current financial year is as follows:
Balance at 30 June 2016 4,598,000 4,598,000
Additions 2,978 -
Revaluations – to profit and loss - -
Carrying Amount at 30 June 2017 4,600,978 4,598,000
note 14 intangible assets
2017 $
2016 $
Poker Machine Entitlements - at cost 1,621,986 1,621,985
Water Licenses – at cost 2,625 2,625
Less: accumulated impairment expense - -
Total 1,624,611 1,624,611
notes to and forming part of the financial report
page 32 for the year ended 30 june 2017
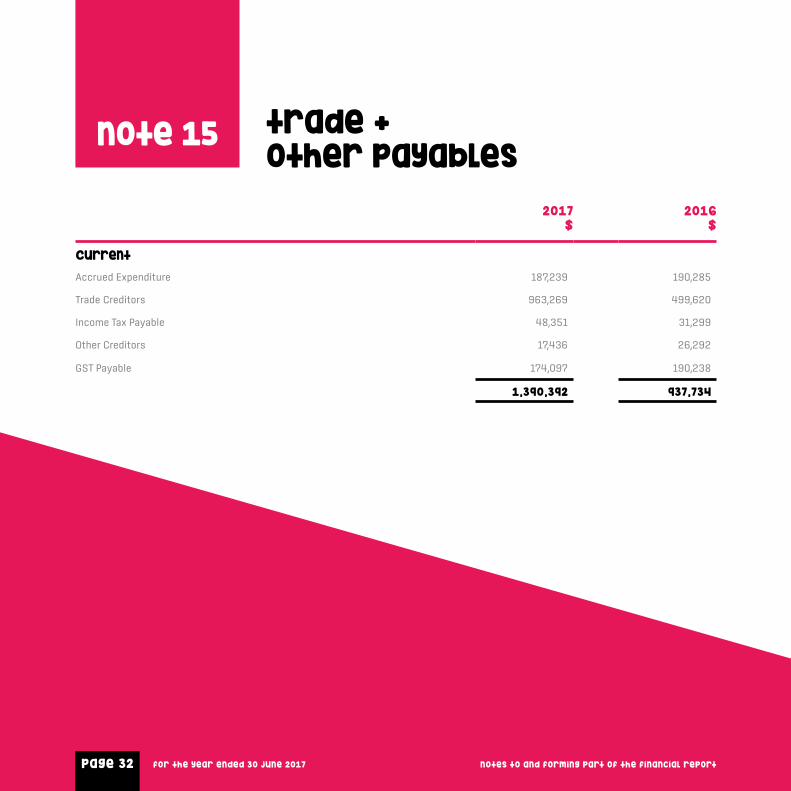
note 15 trade + other payables
2017 $
2016 $
Current
Accrued Expenditure 187,239 190,285
Trade Creditors 963,269 499,620
Income Tax Payable 48,351 31,299
Other Creditors 17,436 26,292
GST Payable 174,097 190,238
1,390,392 937,734
page 32 notes to and forming part of the financial reportfor the year ended 30 june 2017page 32

page 33for the year ended 30 june 2017
note 16 borrowings
2017 $
2016 $
Current
Bank Overdraft 410,741 158,434
Bank Bills 4,003,313 4,150,000
Other Bank Loans 1,124,669 525,684
Total Current Borrowings 5,538,723 4,834,119
Non-Current
Other Bank Loans 1,423,682 1,452,436
Total Non-Current Borrowings 1,423,682 1,452,436
Total Borrowings 6,962,405 6,286,555
The borrowings are secured by:
a. Registered mortgage over the Commercial Club premises located at 77 Gurwood Street Wagga;
b. Registered mortgage over the Wagga RSL Club premises located at Dobbs Street Wagga;
c. Registered mortgage over Wagga RSL Motel premises located at 156 Kincaid Street Wagga;
d. Registered mortgage over property located at 149 Gurwood Street Wagga;
e. Registered mortgage over properties located at 18, 20, 22 Goonigul Avenue Wagga;
f. Registered mortgage over property located at 158 Kincaid Street Wagga;
g. Deed of covenant over the club including charge over liquor licence;
h. Fixed and floating charge over all existing and future assets and undertakings.
notes to and forming part of the financial report

page 34 for the year ended 30 june 2017
note 17 provisions
2017 $
2016 $
Provision for employee entitlements 432,389 495,085
Club points 88,584 134,216
Total provisions 520,973 629,301
2017 $
2016 $
Deferred Tax Liabilities 1,437,676 1,446,815
note 18 deferred tax liabilities
notes to and forming part of the financial report

page 35for the year ended 30 june 2017
note 19 companydetails
note 20
note 21
key management personnael compensation
related party transactions
The Registered Office and Principle place of business is Dobbs Street, Wagga Wagga NSW 2650.
Transactions between related parties are on normal commercial terms and conditions. These terms and conditions are no more favourable than those available to other parties unless otherwise stated.
2017 $
2016 $
Total Compensation 856,792 571,317
notes to and forming part of the financial report

page 36 for the year ended 30 june 2017
2017 $
2016 $
Reconciliation of Cash Flow from Operations with Profit after Income Tax
Profit (Loss) after income tax 1,332,224 2,169,016
Non-cash flows in profit
(Profit)/loss on disposal of non-current assets (179,122) (109,419)
Change in net market value of investments (98,013) 24,996
Depreciation 1,637,174 1,497,754
Changes in assets and liabilities, net of the effects of purchase and disposals of subsidiaries
(Increase) Decrease in inventories (58,906) (871)
(Increase) Decrease in receivables (29,915) (45,250)
(Increase) Decrease in other assets (10,259) 45,741
Increase (Decrease) in trade creditors 502,569 (161,669)
Increase (Decrease) in provisions (158,239) 20,509
Increase (Decrease) in deferred tax liability (9,139) (15,491)
2,928,374 3,425,316
note 22 cash flow information
notes to and forming part of the financial report

page 37for the year ended 30 june 2017
note 23 parent information
The following information has been extracted from the books and records of the parent and has been prepared in accordance with Australian Accounting Standards.
2017 $
2016 $
Financial Position
Assets
Current assets 2,106,512 2,344,049
Non-current assets 32,640,733 29,807,575
Total Assets 34,747,245 32,151,624
Liabilities
Current liabilities 3,803,726 2,588,157
Non-current liabilities 1,519,532 1,452,436
Total Liabilities 5,323,258 4,040,593
Net Assets 29,423,987 28,111,031
Equity
Retained earnings 25,413,271 24,100,315
Reserves 4,010,716 4,010,716
Total Equity 29,423,987 28,111,031
Comprehensive Income
Total profit 1,312,956 2,461,337
Total Comprehensive Income 1,312,956 2,461,337
Guarantees
Wagga RSL Club Limited has provided a debt and interest guarantee over the borrowings of its subsidiary.
Carried forward tax losses
Balance Attributable to the Parent Entity 1,559,148 1,760,180
notes to and forming part of the financial report

page 38 for the year ended 30 june 2017
The following represent commitments that are contracted but not capitalised in the financial statements. Commitments include operating leases for plant & equipment and capital projects currently in progress.
2017 $
2016 $
Not later than 12 months (inc GST) 58,175 844,050
Between 12 months and 5 years (inc GST) 172,688 42,000
Greater than 5 years - -
230,863 886,050
note 24 capital + leasing opportunities
notes to and forming part of the financial report

page 39for the year ended 30 june 2017
The parent entity is incorporated under the Corporations Act 2001 and is an entity limited by guarantee. If the entity is wound up, the constitution states that each member is required to contribute a maximum of $2 each towards meeting any outstanding and obligations of the entity. At 30 June the number of members was 20,999.
note 25 members guarantee
note 26 fair valuemeasurements
AASB 13 Fair Value Measurement requires all assets and liabilities measured at fair value to be assigned to a level in the fair value hierarchy as follows:
Level 1 Unadjusted quoted prices in active markets for identical assets or liabilities that the entity can access at the measurement date.
Level 2 Inputs other than quoted prices included within Level 1 that are observable for the asset or liability, either directly or indirectly.
Level 3 Unobservable inputs for the asset or liability.
The fair values of assets and liabilities that are not traded in an active market are determined using one or more valuation techniques. These valuation techniques maximise, to the extent possible, the use of observable market data. If all significant inputs required to measure fair value are observable, the asset or liability is included in Level 2. If one or more significant inputs are not based on observable market data, the asset or liability is included in Level 3.
Valuation techniques
The group selects a valuation technique that is appropriate in the circumstances and for which sufficient date is available to measure fair value. The availability of sufficient and relevant data primarily depends on the specific characteristics of the asset or liability being measured. The valuation techniques selected by the company are consistent with one or more of the following valuation approaches:
× Market approach: valuation techniques that use prices and other relevant information generated by market transactions for identical or similar assets or liabilities.
× Income approach: valuation techniques that convert estimated future cash flows or income and expenses into a single discounted present value.
× Cost approach: valuation techniques that reflect the current replacement cost of an asset at its current service capacity.
notes to and forming part of the financial report

page 40 for the year ended 30 june 2017
Fair Value Measurement
Each valuation technique requires inputs that reflect the assumptions that buyers and sellers would use when pricing the asset or liability, including assumptions about risks. When selecting a valuation technique, the Group gives priority to those techniques that maximise the use of observable inputs and minimise the use of unobservable inputs. Inputs that are developed using market data (such as publicly available information on actual transactions) and reflect the assumptions that buyers and sellers would generally use when pricing the asset or liability are considered observable, whereas inputs for
which market data is not available and therefore are developed using the best information available about such assumptions are considered unobservable.
The following table provides the fair values reported in the financial statements that are measured and recognised on a recurring basis after initial recognition and their categorisation within the fair value hierarchy.
note 26 continued...
Recurring fair value measurements Note
Level 1 $
Level 2 $
Level 3 $
Total $
30 June 2017
Financial Assets 11 718,144 - - 718,144
Land & Buildings 12 - 26,299,491 - 26,299,491
Investment property 13 - 4,600,978 - 4,600,978
notes to and forming part of the financial reportfor the year ended 30 june 2017page 40

page 41for the year ended 30 june 2017

page 42 for the year ended 30 june 2017
director’sdeclarationThe Directors of Wagga RSL Club Ltd (the ‘Club’) declare that:
a. The financial statements and notes as set out on pages 11 to 40 are in accordance with the Corporations Act 2001, including:
× giving a true and fair view of the financial position of the Club and its controlled entities as at 30 June 2017 and of their performance, as represented by the results of their operations and cash flows, for the year ended on that date; and
× complying with Accounting Standards in Australia - Reduced Disclosure Requirements and the Corporations Regulations 2001; and
b. in the Directors opinion there are reasonable grounds to believe that the Club will be able to pay its debts as and when they fall due.
This declaration is made in accordance with a resolution of the Board of Directors and is signed for and on behalf of the Directors by:
Mr Peter Thomas Director
Mr Phillip McIntosh Director
Dated at Albury this 29th day of August 2017

page 43
Report on the financial statements
Opinion
We have audited the financial report of Wagga RSL Club Ltd and its controlled entity (the Company), which comprises the consolidated statement of financial position as at 30 June 2017, the consolidated statement of profit or loss and other comprehensive income, the consolidated statement of changes in equity and the consolidated statement of cash flows for the year then ended, and notes to the financial statements, including a summary of significant accounting policies, and the directors’ declaration.
In our opinion, the accompanying financial report of the Company is in accordance with the Corporations Act 2001, including:
a. giving a true and fair view of the Company’s financial position as at 30 June 2017 and of its financial performance for the year then ended; and
b. complying with Australian Accounting Standards – Reduced Disclosure Requirements and the Corporations Regulations 2001.
Basis for Opinion
We conducted our audit in accordance with Australian Auditing Standards. Our responsibilities under those standards are further described in the Auditor’s Responsibilities for the Audit of the Financial Report section of our report. We are independent of the Company in accordance with the
auditor independence requirements of the Corporations Act 2001 and the ethical requirements of the Accounting Professional and Ethical Standards Board’s APES 110 Code of Ethics for Professional Accountants (the Code) that are relevant to our audit of the financial report in Australia. We have also fulfilled our other ethical responsibilities in accordance with the Code.
We believe that the audit evidence we have obtained is sufficient and appropriate to provide a basis for our opinion.
Responsibilities of the Directors for the Financial Report
The directors of the Company are responsible for the preparation of the financial report that gives a true and fair view in accordance with Australian Accounting Standards – Reduced Disclosure Requirements and the Corporations Act 2001 and for such internal control as the directors determine is necessary to enable the preparation of the financial report that gives a true and fair view and is free from material misstatement, whether due to fraud or error.
In preparing the financial report, the directors are responsible for assessing the ability of the Company to continue as a going concern, disclosing, as applicable, matters related to going concern and using the going concern basis of accounting unless the directors either intend to liquidate the Company or to cease operations, or have no realistic alternative but to do so.
Auditor’s Responsibilities for the Audit of the Financial Report
Our objectives are to obtain reasonable assurance about whether the financial report as a whole is free from material misstatement, whether due to fraud or error, and to issue an auditor’s report that includes our opinion. Reasonable assurance is a high level of assurance, but is not a guarantee that an audit conducted in accordance with the Australian Auditing Standards will always detect a material misstatement when it exists. Misstatements can arise from fraud or error and are considered material if, individually or in the aggregate, they could reasonably be expected to influence the economic decisions of users taken on the basis of this financial report.
A further description of our responsibilities for the audit of the financial report is located at the Auditing and Assurance Standards Board website at: http://www.auasb.gov.au/auditors_files/ar3.pdf. This description forms part of our auditor’s report.
Crowe Horwath Albury
Bradley D Bohun Partner
Dated at Albury this 29th day of August 2017
independent auditor’s report to the members of wagga rsl club ltd

page 44

page 45for the year ended 30 june 2017

page 46
waGGa RSLDobbs Street, Wagga Wagga
Commercial ClubGurwood Street, Wagga Wagga
waGGa RSLDobbs Street, Wagga Wagga
Commercial ClubGurwood Street, Wagga Wagga