Embed Size (px)
Citation preview

May 2012
Comments on Your Government
A SPECIAL PUBLICATION OF THE RHODE ISLAND PUBLIC EXPENDITURE COUNCIL
Impact of the Expansion of Gaming on State Finances in Rhode Island
This RIPEC report examines the impact the proposed Constitutional Amendments to casino
gaming at Twin River and Newport Grand will have on the state’s finances, including potential
revenue losses as a result of casinos opening in Massachusetts. Additionally, the analysis will
discuss the potential terms and conditions of any agreement between the state and the two Rhode
Island facilities authorizing the expansion of table games.
Introduction
Since Rhode Island introduced video lottery terminals (VLTs) in 1993, the state has become
increasingly reliant on gaming revenues to support state operations. Currently, lottery revenues
(including games, Keno, and VLTs) account for roughly 12 percent of the state’s general revenue
budget. However, out-year budget projections assume decreasing lottery receipts, based on the
estimated impact of a racino and three destination casinos in Massachusetts, starting in FY 2015.
In response, the Rhode Island General Assembly voted to add two referendums to the November
ballot regarding the authorization of table gaming at the state’s two casinos: Twin River and
Newport Grand.
On November 6, 2012, voters will be asked to weigh in on the expansion of gaming in the state.
The host communities, Lincoln and Newport, along with the general electorate, must approve the
ballot questions in order for Twin River and Newport Grand to allow casino gaming, in addition
to operating VLTs. Article 25 of the FY 2012 enacted budget defines casino gaming as "games
played with cards, dice or equipment, for money, credit or any representative of value including,
but not limited to roulette, blackjack, big six, craps, poker, baccarat, pai gow, any banking or
percentage game.'' The result of the referendum, and, specifically, the terms and conditions of
the expansion will have far-reaching impacts on the state’s revenues and economy.
Gaming in Rhode Island
The Rhode Island Division of Lottery oversees a number of lottery activities including, but not
limited to: instant games/scratch tickets (e.g. “Lucky Loot”, “Cash Bonus”, and “Money Bags”),
traditional lottery games such as PowerBall and The Numbers, Keno, and the state’s Video
Lottery game. A portion of the sales from these games is transferred into the state’s general
revenue fund to support state general operations. Certain portions of these revenues are
dedicated to property tax relief and, for one year, additional revenue from 24-hour gaming at
Twin River was used to support education through the “Permanent Education Fund”. Together,
these games contributed, on average, $309.6 million in state general revenue between FY 2001
and FY 2013 (estimated). Lottery as a share of total general revenues increased from 7.0 percent
of all general revenues in FY 2001 to an estimated 11.8 percent in FY 2013.

2
Video Lottery Terminals
The majority of the
state’s revenue from
gaming comes from
VLTs at Twin River
(formerly Lincoln
Greyhound Park) in
Lincoln, RI and
Newport Grand in
Newport, RI. Video
lottery terminals are
similar to slot machines
in that they are stand-
alone games with minor
differences. Rhode
Island introduced VLTs
in 1993, and, as the
games have become
increasingly popular,
VLT contributions to the state have increased. The following section discusses VLT in Rhode
Island, as well as the structure of the games’ contribution to Rhode Island general revenues.
Twin River
Located in Lincoln, RI, Twin River
Casino is a 500,000 square foot gaming
facility that currently operates 4,750
VLTs, including slot machines, virtual
blackjack and roulette, and simulcasting.
The facility operates 24 hours a day as of
July 2009. Table 1 shows net terminal
income (NTI), defined as gross income
minus prizes, at Twin River between FY
2001 and FY 2013 (estimated). In FY
2001, Twin River (then Lincoln
Greyhound Park) generated $182.1
million in NTI. The May 2012 Revenue
Estimating Conference (REC) projected
Twin River will generate $478.0 million
in net terminal income in FY 2012 and
$498.2 million in FY 2013. Over the 12-
year time period, NTI has increased by
173.6 percent, or at an average annual
rate of 8.7 percent. Although NTI
growth has slowed over the past decade,
FY 2009 was the only year in which NTI
declined year-over-year.
$0.0
$50.0
$100.0
$150.0
$200.0
$250.0
$300.0
$350.0
$400.0
$450.0
2001 2002 2003 2004 2005 2006 2007 2008 2009 2010 2011 2012 2013
0.0%
2.0%
4.0%
6.0%
8.0%
10.0%
12.0%
14.0%
Chart 1
Total Lottery Revenues and Lottery as a Share of General
Revenue, FY 2001-FY 2013 Est. ($ millions)
Lottery % of General Revenue Lottery Revenues
2001 $182.1 $47.0 $229.1 $34.4 17.6%
2002 221.3 59.7 281.0 51.9 22.7%
2003 248.6 66.1 314.7 33.7 12.0%
2004 283.3 75.6 358.9 44.2 14.0%
2005 319.8 79.4 399.2 40.3 11.2%
2006 338.9 77.6 416.5 17.3 4.3%
2007 342.0 74.6 416.6 0.1 0.0%
2008 406.5 71.2 477.7 61.1 14.7%
2009 396.6 64.2 460.8 (16.9) -3.5%
2010 410.5 57.3 467.8 7.0 1.5%
2011 442.4 50.2 492.6 24.8 5.3%
2012 478.0 51.0 529.0 36.4 7.4%
2013 498.2 51.0 549.2 20.2 3.8%
Total Change 173.6% 8.5% 139.7%
Ave Annual Change 8.7% 0.7% 7.6%
Table 1
VLT Net Terminal Income
FY 2001-FY 2013 Est. ($ millions)
SOURCE: Christensen Capital Advisors; RI Division of Lottery; May 2012
Revenue Estimating Conference; RIPEC calculations
Percent
Change
Annual
ChangeTotal
Newport
Grand
Twin
RiverFY

3
Newport Grand
Like Twin River, Newport Grand operates slot machines, virtual blackjack and poker, and Keno
games. Originally, the facility was known as Newport Jai Alai and Newport Grand Jai Alai. In
2003, the state ended Jai Alai licensing, as the game had largely been subsidized by VLT
income. The facility currently operates approximately 1,100 VLTs. In contrast to Twin River,
NTI at Newport Grand decreased steadily between FY 2006 and FY 2012 (estimated).
However, as shown on table 1, the May 2012 REC projected no growth in NTI between FY 2012
and FY 2013– estimates for both years were $51.0 million.
Net terminal income, and, therefore, revenue growth from FY 2001 through FY 2013 was
generated by increasing the number of VLT positions as well as increased activities at both
facilities. In FY 2001, Rhode Island had just under 2,500 VLT positions, of which roughly 30
percent were located at Newport Grand and the remaining 70 percent were located at Twin
River. Currently, there are approximately 5,850 VLTs, the majority of which, just over 80
percent, are located at Twin River, while the remaining machines are located in Newport.
Distribution of NTI
The state’s share of VLT revenues is based on a percentage of NTI. Table 2 shows the changes
since FY 1993 in the distribution of the net terminal income to the facilities, providers and the
state. In FY 1993, 33.0 percent of the net terminal income was allocated to the two gaming
facilities, 15.0 percent to technology providers (e.g., GTECH), 3.0 percent to the central
communication provider, 10.0 percent to the dog kennel owners (at Lincoln Greyhound
Park/Twin River only), and 1.0 percent to the host municipalities. The 38.0 percent balance was
transferred to the state.
Over the years, the allocation of NTI has
become more complicated. Currently,
both facilities receive 27.76 percent of
NTI. Technology and communication
providers receive 7.0 percent and 2.5
percent, respectively. However, these
rates are variable: the technology provider
share decreases if a per VLT NTI per day
threshold is met, while the communication
provider share is set at 2.5 percent for the
first $500.0 million, and 1.0 percent
thereafter. The town of Lincoln has seen
its share of NTI increase over the years,
from 1.0 percent to 1.26 percent, with a
0.19 percentage point increase for 24/7
gaming that must be reauthorized by the
General Assembly every year. In 2004,
the General Assembly eliminated the NTI
share for dog kennel owners, which
increased the share of NTI to the facility
1993
Both Twin River Newport
Gaming Facility 33.00% 27.76% 27.76%
Technology Providers 15.00% 7.00% 7.00%
Communication Providers* 3.00% 2.50% 2.50%
Host Municipality** 1.00% 1.45% 1.01%
Dog Kennel Owners 10.00% 0.00% 0.00%
Narragansett Indian Tribe 0.00% 0.17% 0.00%
Transfer to State 38.00% 61.12% 61.73%
Total 100.00% 100.00% 100.00%
RecipientCurrent
Table 2
Distribution of Net Terminal Income
SOURCE: RI Division of Lottery; House Fiscal Staff; Senate Fiscal Staff;
RIPEC calculations
* Communication providers receive 2.5% on the first $500 million of
NTI, and 1% thereafter. Based on May 2012 revenue estimates,
communication providers will receive 2.42% of NTI.
** The town of Lincoln receives 1.26% per statute, and 1.45% for 24/7
gaming. The 1.45% sunsets every year and must be renewed.

4
and the town of Lincoln. The city of Newport currently receives 1.01 percent of NTI, although
the city would be eligible for an additional 0.19 percentage point increase if the facility were to
move to 24/7 gaming. As part of the 2005 expansion agreement, the Narragansett tribe receives
0.17 percent of Twin River NTI, up to $10.0 million. The state’s share is the balance of NTI, or
61.12 percent from Twin River and 61.73 percent from Newport Grand, an increase of 23.12 and
23.73 percentage points, respectively, compared to 1993.
Gaming Revenue Forecasts
As VLT revenues have increased over the past two decades, the state has grown increasingly
reliant on gaming to support state operations. However, in November 2011, the Massachusetts
legislature voted to allow the development and operation of three casinos and one racino in the
commonwealth. In recognition of the potential loss of an important revenue source, the state of
Rhode Island retained Christiansen Capital Advisors, LLC (CCA) to analyze the potential impact
of gaming in the Bay State. The study evaluated both the fiscal impact to the state, as well as
“broader statewide economic impacts.” This section provides an overview of the Christiansen
findings with a focus on the projected effect casinos in Massachusetts will have on Rhode Island
general revenues.
Current Rhode Island Revenues
The state’s general revenue budgets have increasingly relied on gaming revenues, which now
constitute the third largest source of revenue to the state (behind income and sales taxes). In FY
2001, the state received approximately $121.6 million in revenues from the state’s two gaming
facilities. This represented 4.7 percent of the state’s total general revenue ($2,564.4 million). In
FY 2011, the state received $301.1 million in revenue from the two gaming facilities. The
revenue from Twin River and Newport Grand represented 9.8 percent of FY 2011 revenues
($3,083.7 million). Based on the most recent REC, the state’s share of VLT revenue is projected
to contribute $321.9 million and $335.5 million to general revenues in FY 2012 and FY 2013,
respectively. This accounts for 9.9 percent of total FY 2012 general revenues and 10.2 percent
of projected FY 2013 general revenues.
0%
2%
4%
6%
8%
10%
12%
$0
$50
$100
$150
$200
$250
$300
$350
$400
FY
2001
FY
2002
FY
2003
FY
2004
FY
2005
FY
2006
FY
2007
FY
2008
FY
2009
FY
2010
FY
2011
FY
2012
FY
2013
FY
2014
FY
2015
FY
2016
FY
2017
Chart 2
VLT and State General Revenues, FY 2001 - FY 2017 (Est.), $ millions
State VLT Revenues VLT as a % of State Budget
Source: RI Division of Lottery; State Budget Office; Christiansen Capital Advisors LLC; RIPEC calculations
5
Chart 2 shows the VLT contribution to general revenues through FY 2013 and the share of the
state budget accounted for by VLT revenues, as well as a baseline forecast through FY 2017.
The baseline forecast uses data from CCA, adjusted for the May 2012 revenue estimating
conference changes to NTI, and assumes no change to state law in Rhode Island or neighboring
states. Based on adjusted CCA estimates, VLT revenues are projected to increase to $374.3
million in FY 2017. All else held constant, including no casino gaming in Massachusetts, VLT
revenues would account for 10.0 percent of projected FY 2017 general revenues.
In addition to the “baseline” forecast shown above in chart 2, CCA estimated the effect on state
revenues if table games were added at Twin River. These two scenarios are outlined on table 3
on page 6. Based on their estimates, adding table games at Twin River would increase general
revenues, on average, by $33.8 million per year between FY 2014 and FY 2017. Christiansen
Capital Advisors did not estimate the impact if Newport Grand added table games as, at the time
of the study, Newport Grand did not indicate a willingness to provide table games at the facility.
Subsequent to the study, Newport Grand indicated a willingness to provide table games and, as
noted, the General Assembly voted to put the referendum question on the November ballot.
Table gaming at Newport Grand is estimated to generate approximately $5 million per year,
increasing general revenues by roughly $2 million per year.
Massachusetts Casino Impact
In order to evaluate the potential impact of gaming in Massachusetts, CCA, in conjunction with
the Rhode Island Department of Revenue, developed three potential scenarios. The three
scenarios represent the most likely locations for the three casinos and the racino, and the nature
of the potential facilities. Because there appeared to be little difference in the revenue impact
from the possible casino locations in western Massachusetts (Region B), CCA combined the
results into one scenario. In all scenarios, CCA assumed the racino would open in the beginning
of FY 2015, and the other three casinos would open one year later. The three scenarios are:
Best Case: A casino at Suffolk Downs in East Boston; a casino in New Bedford and a
racino at Raynham Park in Raynham; and one of the three potential facilities in western
Massachusetts.
Worst Case: A casino at Foxboro; a casino in New Bedford and a racino at Plainridge
Racecourse in Plainville; and one of the three potential facilities in western
Massachusetts.
Likely Case: A casino at Suffolk Downs in East Boston; a casino in Middleboro and a
racino at Plainridge Racecourse in Plainville; and one of the three potential facilities in
western Massachusetts.
The assessment considered a number of variables in order to project the revenue impact of
casinos located in the above communities, such as: the amount of people residing in different
population centers, driving distance to the casinos, customer behavior and preferences, estimated
gaming penetration in the market, and the appeal of each facility. Christiansen Capital Advisors
assumed a lower state share for table games when compared to VLT due to the labor intensive
nature of table gaming (35.0 percent, compared to the current ratio of 61.44 percent for Twin
River and 61.69 percent for Newport).1
1 Based on RIPEC calculations, it appears that CCA used an assumed state share value of 61.8 percent for Twin
River NTI and 61.2 percent for Newport Grand NTI.

6
As shown on table 3, there are six possible revenue scenarios outlined by CCA, in addition to
their baseline forecast (current conditions with no gaming in Massachusetts), and their baseline
forecast plus the addition of table games at Twin River. Under the best case scenario, Rhode
Island VLT revenues are projected to decline starting in FY 2015, when the racino is assumed to
be in operation (CCA estimates the remaining three casinos will open in FY 2016). In FY 2015,
the projected revenue loss ranges from $5.2 million in the “best case” scenario in which Rhode
Island operates table games (1B), to $51.3 million in the “likely case” scenario with no table
gaming (3B). By FY 2017, CCA estimated revenue losses of a minimum of $91.9 million
(scenario 1B) to a maximum of $155.3 million (scenario 2A).
Chart 3 shows the projected impact of Massachusetts casinos on Rhode Island revenue between
FY 2015 and FY 2017, comparing the CCA “current baseline” to the “most likely” case if the
state were not to allow table gaming at Twin River (scenario 3A as shown on table 3). The error
bars on the chart represent the range in projected state revenues under the “best case” and “worst
case” scenarios (1A and 2A on table 3). Chart 4 shows the impact of Massachusetts casinos if
the state were to adopt table gaming (the “B” scenarios on table 3), compared to the current
baseline. As shown in both charts, although there is no scenario that does not result in a loss of
revenue for the state, the addition of table games mitigates the loss under scenario 3B by an
estimated $21.8 million per year.
FY 2013 FY 2014 FY 2015 FY 2016 FY 2017
Current Baseline $335.5 $347.6 $356.3 $364.5 $374.3
Current + RI Table Games 335.5 379.4 390.1 401.1 407.3
Massachusetts Gaming
Best Case
RI Baseline (1A) $335.5 $352.3 $327.8 $277.6 $262.7
RI Games (1B) 335.5 372.5 350.2 299.9 279.5
Worst Case
RI Baseline (2A) $335.5 $352.3 $304.5 $243.8 $215.3
RI Games (2B) 335.5 372.5 326.8 249.3 219.0
Likely Case
RI Baseline (3A) $335.5 $352.3 $303.8 $251.5 $231.4
RI Games (3B) 335.5 372.5 326.8 273.2 247.3
Table 3
Projected State Revenue Impact of Casinos in Massachusetts
NOTES: Revenues have been rebased from the original CCA estimates using revised NTI from
the May 2012 Revenue Estimating Conference; figures use CCA state shares, which are 61.80%
for Twin River and 61.19% for Newport Grand
Source: Christiansen Capital Advisors LLC, "Gaming Study and Economic Impact Analysis:
Final Report, January 17, 2012"; State Budget Office documents; RIPEC calculations
($ millions)

7
Rhode Island Table Gaming
In recognition of the negative impact of Massachusetts casinos on both operations at Twin River
and on state revenues, the General Assembly included Article 25 – Relating to Authorizing State-
operated Casino Gaming at Twin River, Subject to Statewide and Local Voter Approval in the
FY 2012 appropriations act (H5894 Sub A). The Article authorized the Secretary of State and
the local board of canvassers to submit a question authorizing table gaming at Twin River on the
statewide and town of Lincoln November ballots, respectively. The Article also required the
$356.3 $364.5 $374.3
$303.8
$251.5 $231.4
$150.0
$200.0
$250.0
$300.0
$350.0
$400.0
FY 2015 FY 2016 FY 2017
Chart 3
Impact of MA Casinos on RI Revenue
with No RI Table Games
Current Baseline Likely Case Baseline
$356.3 $364.5 $374.3
$326.8
$273.2 $247.3
$150.0
$200.0
$250.0
$300.0
$350.0
$400.0
FY 2015 FY 2016 FY 2017
Chart 4
Impact of MA Casinos on RI Revenue
with RI Table Games
Current Baseline Likely Case w/Games

8
General Assembly to enact “comprehensive legislation during the 2012 legislative session to
determine the terms and conditions pursuant to which casino gaming would be operated in the
state”.
At the time, the city of Newport and
Newport Grand had not expressed
interest in allowing table gaming;
however, the General Assembly
passed SB 2695 Sub A/HB 7543
Sub A in the 2012 legislative
session. As with Article 25, the
bills authorized the Secretary of
State and local board of canvassers
to submit a question on the
November ballot authorizing table
gaming at Newport Grand.
On May 24, 2012, Senators Goodwin, Bates and Felag submitted SB 3001, while
Representatives Melo, San Bento, Jackson, Petrarca and Mattiello submitted the companion bill
HB 8213. The bills outline the terms and conditions under which table gaming would operate in
Rhode Island, including, but not limited to, the state’s share of table gaming revenues and the
allocation of NTI to the respective communities and casinos. Table 4 outlines the current and
proposed distribution of NTI and table gaming revenue. Under the proposed legislation, the
town of Lincoln’s share of NTI would be permanently set at 1.45 percent, reducing the state
share of NTI to 61.25 percent. Newport Grand’s share of NTI would increase by 1.5 percentage
points, and the distribution of NTI to the city of Newport would increase to 1.45 percent. As a
result, the state’s share
decreases from 61.86
percent of NTI to 59.92
percent.
The legislation provides
for an 18.0 percent
transfer to the state of net
table game revenue from
Newport Grand, with the
balance going to the
casino. For Twin River,
the state’s share is set at
16.0 percent of net table
game revenue. However,
the legislation requires an
additional 2.0 percent
revenue transfer from the
start of table gaming until
such time that net
revenues for a full fiscal
year are lower than the
Twin River Ballot Question
“Shall an act be approved which would authorize the facility known as
“Twin River” in the town of Lincoln to add state-operated casino
gaming, such as table games, to the types of gambling it offers?”
Newport Grand Ballot Question
“Shall an act be approved which would authorize the facility known
as “Newport Grand” in the city of Newport to add state-operated
casino gaming, such as table games, to the types of gambling it
offers?”
Twin River Newport Twin River Newport
NTI Distribution
Gaming Facility 27.76% 27.76% 27.76% 29.26%
Technology Providers 7.00% 7.00% 7.00% 7.00%
Communication Providers* 2.37% 2.37% 2.37% 2.37%
Host Municipality 1.26% 1.01% 1.45% 1.45%
Narragansett Indian Tribe 0.17% 0.00% 0.17% 0.00%
Transfer to State 61.44% 61.86% 61.25% 59.92%
Table Games
Gaming Facility** - - 82.0-84.0% 82.00%
Transfer to State** - - 16.0-18.0% 18.00%
* Based on FY 2013 projected NTI
SOURCE: RI Division of Lottery; House and Senate Fiscal Staffs; SB 3001/HB 8213;
RIPEC calculations
** The allocation is 16.0% with an additional 2.0% until such time that NTI for a full
fiscal year is less than in the fiscal year prior.
Table 4
Distribution of Casino Net Revenues
ProposedCurrentRecipient

9
fiscal year prior. As with Newport Grand, the balance of the revenues – ranging between 82.0
and 84.0 percent – are allocated to the casino.
Estimated Budgetary Impact of Legislation
Table 5 shows the projected state revenues under the CCA assumptions compared to projected
state revenues per the proposed legislation (NOTE: VLT revenue projections have been updated
to reflect revised NTI from the May 2012 REC). Based on RIPEC calculations, it appears that
the CCA analysis assumed a VLT transfer to the state of 61.8 percent from Twin River and a
61.2 percent transfer from Newport Grand. The state’s share of table gaming revenues was
assumed to be 35.0 percent in the CCA analysis. The study did not include any revenues from
table games at Newport Grand; however, the calculations on table 5 assume FY 2014 table
gaming revenues at Newport
Grand of $5.0 million, that
these revenues change at the
same rate as revenues at Twin
River, and that the state share
would also be 35.0 percent
per CCA assumptions.
Using the CCA assumptions
under the “most likely”
scenario and including table
games at Newport Grand, the
state would see a total transfer
from the two facilities of
$374.2 million in FY 2014.
This share is projected to
decrease by 33.5 percent to
$248.9 million by FY 2017.
Based on the proposed
legislation, the state’s share of
revenues in FY 2014 is
projected to be $356.3
million, or $17.9 million
lower than in the CCA
scenario. By FY 2017, the
state’s share, per the legislation, is projected to decrease by $121.9 million (34.2 percent) to
$234.4 million. The state’s projected share of revenues in FY 2017 is $14.5 million lower under
the proposed legislation compared to the CCA estimates.
Table games revenue assumptions by CCA are based on an assumption of 65 tables at Twin
River, with revenues of $3,500-$3,700 per table per day. The House and Senate Fiscal Staffs,
and Twin River, note that these projections appear to be high and project lower revenues based
on 65 tables with revenues of $2,500-$2,700 per table per day. Based on these assumptions, total
revenue at Twin River is projected to be $60.0 million in FY 2014, decreasing to $45.8 million in
FY 2014 FY 2015 FY 2016 FY 2017
Most Likely State Share: CCA
Twin River VLT $312.5 $268.5 $224.8 $207.2
Twin River Tables 28.0 29.8 27.5 21.4
Newport Grand VLT 32.0 28.6 21.1 19.0
Newport Grand Tables 1.8 1.9 1.7 1.3
Total $374.2 $328.7 $275.1 $248.9
Most Likely State Share: SB 3001/HB 8213
Twin River VLT $309.7 $266.1 $222.8 $205.4
Twin River Tables 14.4 15.3 12.6 9.8
Newport Grand VLT 31.3 28.0 20.7 18.6
Newport Grand Tables 0.9 1.0 0.9 0.7
Total $356.3 $310.4 $256.9 $234.4
Difference ($17.9) ($18.3) ($18.2) ($14.5)
SOURCE: Christiansen Capital Advisors LLC; SB 3001/HB 8213; RIPEC calculations
Table 5
Difference in Projected State Revenues ($ millions)
NOTE: Revenues have been rebased from the original CCA estimates using revised NTI
from the May 2012 Revenue Estimating Conference

10
FY 2017. As a result, the state’s share of revenues would decrease relative to the projections on
table 5, on average, by $3.2 million per year.
Chart 5 shows total projected general revenues under three scenarios:2
The “most likely” case, with no table gaming, used in the state’s original budget
projections;
The “most likely” case, with table gaming, modified to include estimated revenues from
Newport Grand; and
Projected revenues under the “most likely” case based on SB 3001/HB 8213.
The State Budget Office (SBO) out-year general revenue estimates in the FY 2013 budget as
proposed increase from $3,470.5 million in FY 2014 to $3,614.6 million in FY 2017. As per the
state budget, these estimates were based on the “most likely” scenario with no table games in the
CCA analysis. Using revenue estimates provided by CCA in the “most likely” with table games
scenario, and including casino games at Newport Grand, general revenues would increase from
$3,492.4 million in FY 2014 to $3,632.1 million in FY 2017. On average, revenue estimates
under this scenario are $22.0 million higher than the rebased SBO projections. General revenue
estimates based on the proposed legislation in SB 3001/HB 8213 range from $3,474.5 million in
FY 2014 to $3,617.6 million in FY 2017. When compared to the original SBO projections,
general revenues are, on average, $4.8 million higher per year under the proposed legislation.
2 All revenues have been rebased to reflect changes to NTI in the May 2012 Revenue Estimating Conference.
$3,470.5
$3,522.3
$3,564.5
$3,614.6
$3,492.4
$3,547.2
$3,588.1
$3,632.1
$3,474.5
$3,528.9
$3,569.9
$3,617.6
$3,350
$3,400
$3,450
$3,500
$3,550
$3,600
$3,650
FY 2014 FY 2015 FY 2016 FY 2017
Chart 5
Projected General Revenues , FY 2014 - FY 2017 ($ millions)
GR - No Table Games GR - CCA Games GR - Legislation Games
11
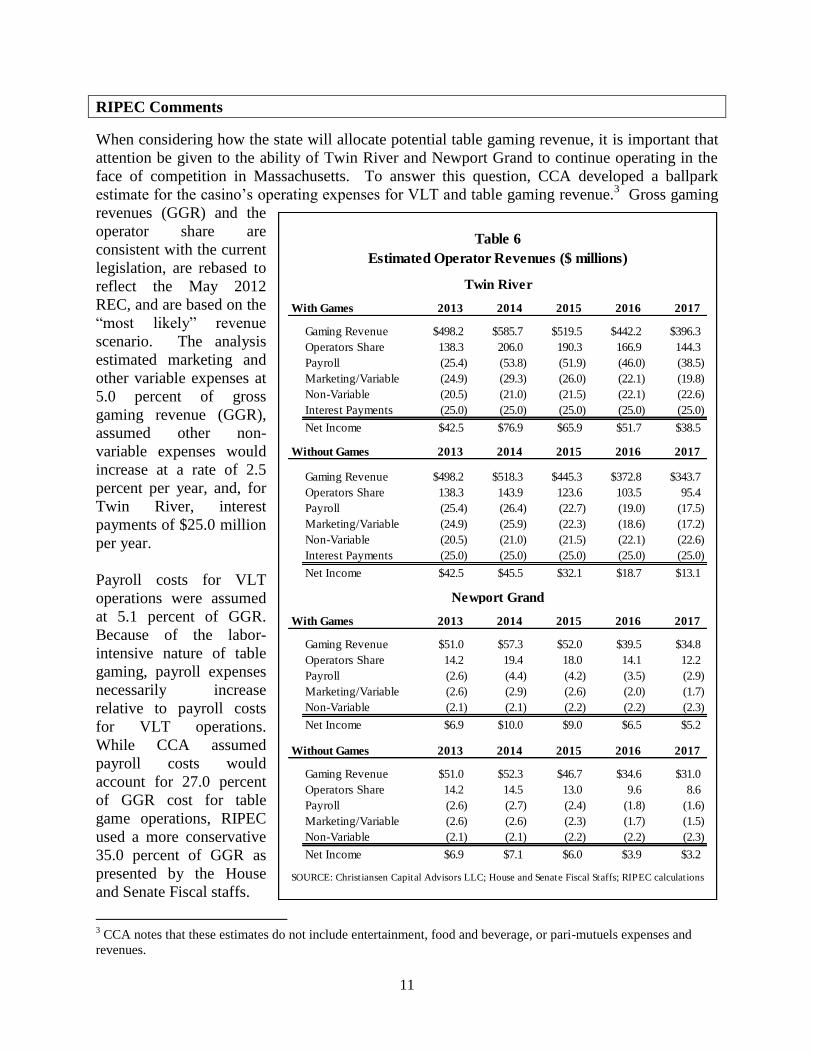
RIPEC Comments
When considering how the state will allocate potential table gaming revenue, it is important that
attention be given to the ability of Twin River and Newport Grand to continue operating in the
face of competition in Massachusetts. To answer this question, CCA developed a ballpark
estimate for the casino’s operating expenses for VLT and table gaming revenue.3 Gross gaming
revenues (GGR) and the
operator share are
consistent with the current
legislation, are rebased to
reflect the May 2012
REC, and are based on the
“most likely” revenue
scenario. The analysis
estimated marketing and
other variable expenses at
5.0 percent of gross
gaming revenue (GGR),
assumed other non-
variable expenses would
increase at a rate of 2.5
percent per year, and, for
Twin River, interest
payments of $25.0 million
per year.
Payroll costs for VLT
operations were assumed
at 5.1 percent of GGR.
Because of the labor-
intensive nature of table
gaming, payroll expenses
necessarily increase
relative to payroll costs
for VLT operations.
While CCA assumed
payroll costs would
account for 27.0 percent
of GGR cost for table
game operations, RIPEC
used a more conservative
35.0 percent of GGR as
presented by the House
and Senate Fiscal staffs.
3 CCA notes that these estimates do not include entertainment, food and beverage, or pari-mutuels expenses and
revenues.
With Games 2013 2014 2015 2016 2017
Gaming Revenue $498.2 $585.7 $519.5 $442.2 $396.3
Operators Share 138.3 206.0 190.3 166.9 144.3
Payroll (25.4) (53.8) (51.9) (46.0) (38.5)
Marketing/Variable (24.9) (29.3) (26.0) (22.1) (19.8)
Non-Variable (20.5) (21.0) (21.5) (22.1) (22.6)
Interest Payments (25.0) (25.0) (25.0) (25.0) (25.0)
Net Income $42.5 $76.9 $65.9 $51.7 $38.5
Without Games 2013 2014 2015 2016 2017
Gaming Revenue $498.2 $518.3 $445.3 $372.8 $343.7
Operators Share 138.3 143.9 123.6 103.5 95.4
Payroll (25.4) (26.4) (22.7) (19.0) (17.5)
Marketing/Variable (24.9) (25.9) (22.3) (18.6) (17.2)
Non-Variable (20.5) (21.0) (21.5) (22.1) (22.6)
Interest Payments (25.0) (25.0) (25.0) (25.0) (25.0)
Net Income $42.5 $45.5 $32.1 $18.7 $13.1
With Games 2013 2014 2015 2016 2017
Gaming Revenue $51.0 $57.3 $52.0 $39.5 $34.8
Operators Share 14.2 19.4 18.0 14.1 12.2
Payroll (2.6) (4.4) (4.2) (3.5) (2.9)
Marketing/Variable (2.6) (2.9) (2.6) (2.0) (1.7)
Non-Variable (2.1) (2.1) (2.2) (2.2) (2.3)
Net Income $6.9 $10.0 $9.0 $6.5 $5.2
Without Games 2013 2014 2015 2016 2017
Gaming Revenue $51.0 $52.3 $46.7 $34.6 $31.0
Operators Share 14.2 14.5 13.0 9.6 8.6
Payroll (2.6) (2.7) (2.4) (1.8) (1.6)
Marketing/Variable (2.6) (2.6) (2.3) (1.7) (1.5)
Non-Variable (2.1) (2.1) (2.2) (2.2) (2.3)
Net Income $6.9 $7.1 $6.0 $3.9 $3.2
SOURCE: Christiansen Capital Advisors LLC; House and Senate Fiscal Staffs; RIPEC calculations
Twin River
Newport Grand
Estimated Operator Revenues ($ millions)
Table 6

12
As shown on table 6, estimated net income for Twin River without table games is projected to be
lower than revenues at the facility with table games (under the current legislation). Although
revenues for the facility are projected to continue to decrease in the out-years, Twin River
revenues without table games decrease approximately 70 percent between FY 2014 (when table
gaming was projected to commence) and FY 2017, compared to a 50.0 percent decrease in
facility revenues with gaming. The picture is similar at Newport Grand; facility revenues without
table gaming are projected to be roughly 40 percent of facility revenues with table gaming, and
the rate at which the casino’s revenues are projected to decrease is slower when table games are
included.
The American Gaming Association (AGA) publishes an annual survey of casinos, which
provides information on the economic impact of casinos along with other key metrics, including
gross gaming revenue, gaming tax revenues, and the type of casino operated, by state.4 The
report also includes information on tax rates, in the case of privately-owned casinos, or the share
retained by operators, for states that own gaming machines and make distributions to
stakeholders. The AGA notes that there are five states – Delaware, Maryland, New York, Rhode
Island and West Virginia – that operate in this manner.
When considering how to set distributions to stakeholders: specifically, the state’s share and the
casino’s bottom line must be taken into account. If the casino operator’s share is set too low,
particularly given the forecasted drop in revenues due to competition across the border, the
4 “State of the States: The AGA Survey of Casino Entertainment, 2011”, The American Gaming Association.
State Number Type of CasinoOperator
Share
Gross Gaming
RevenueTax Revenue
Est. Effective
Tax Rate
Delaware 3Racetrack casino with
VLT and table games 43.89% $552.4 $230.2 41.7%
Maryland 2Land-based, slots-only
casinos with VLT 33.00% $155.7 $89.5 57.5%
New York 9Racetrack casino with
VLT 32.86% $1,259.0 $593.4 47.1%
Rhode Island --
Curent*2 VLT casinos 27.76% $492.6 $301.1 61.1%
Rhode Island --
Proposed*2
VLT casinos with
table games35.05% $642.9 $356.3 55.4%
West Virginia 5Racetrack casino with
VLT and table games 46.99% $958.7 $406.5 42.4%
* Current is based on FY 2011 data; Proposed uses FY 2014 revenues and rates per the proposed legislation
Source: American Gaming Association, "State of the States: The AGA Survey of Casino Entertainment, 2011"; House and Senate
Fiscal Staff data; RI Division of the Lottery; RIPEC calculations
($ millions)
Table 7
State-Run Gaming Facilities and Revenue Share Retained by Operator

13
casinos may find themselves unable to continue operating, and the state may be in the position of
losing a significantly greater share of revenues. As shown on table 7, of the five states with
publicly-owned casinos, Rhode Island operators retain the lowest share of total revenues. Based
on RIPEC calculations per the proposed legislation, if table gaming were allowed at the two
casinos, Twin River’s combined share of GGR would increase from the current 27.76 percent to
36.5 percent. At Newport Grand, the operator share would increase from 27.76 percent to 33.4
percent. With this increase, the casinos would retain a higher share of revenue compared to both
Maryland and New York, but lower than Delaware and West Virginia.
When the estimated effective tax rate, that is, the share of GGR retained by the state is
considered, the state’s share of 61.1 percent is the highest among peer states. If table games
were added, Rhode Island’s share of 55.4 percent would be the second-highest, only behind
Maryland. It is worth noting that the tax rate in Massachusetts is set at 25.0-40.0 percent of slot
revenue, and 25.0 percent of table game revenue, with a $25.0-$85.0 million initial license fee
and a $600 per slot per year annual fee. Under an agreement with the state of Connecticut,
Mohegan Sun and Foxwoods make payments of 25.0 percent of slot revenue as long as there is
no expansion of legal casino gaming in the state.
The external effects of
gaming – specifically the
economic impact of casinos
– must also be considered.
Table 8 shows CCA’s
estimates of the economic
impact of gaming at Twin
River, currently, with
Massachusetts casinos and
no table games, and with
Massachusetts casinos and
table games. While the table
makes it clear that the
outlook is improved with the
addition of table games, it is
also clear that gaming itself has a net positive economic impact. If the casino(s) were to go out
of business, there would be a clear – and significant – negative impact to the state’s economy and
general fund.
The advent of casino gaming in the commonwealth of Massachusetts – under any scenario – will
likely negatively impact both revenues for the casino operators in Rhode Island, and the state of
Rhode Island itself. While it appears that the opening of casinos in Massachusetts may occur
later than originally anticipated, they will open in the next few years, and that Twin River,
Newport Grand and the state will all see revenues decline. Allowing Twin River and Newport
Grand to operate table games will offset some of these projected revenue losses; however, it is
also clear that the state can no longer rely on gaming revenues to support the same share of
government services once casinos open in Massachusetts.
Employment Labor Income Total Output
Current Impact (Baseline) 1,249 $57.4 $568.3
MA Casino Impact (no Games) 930 42.8 422.7
MA Casino Impact (w/ Games) 1,450 66.0 507.3
SOURCE: Christiansen Capital Advisors LLC
Economic Impact of Twin River on RI Economy
($ millions)
Table 8
NOTE: Totals are estimated direct, indirect and induced effects; "likely case" scenario

14
Deliberation of the proposed legislation should examine whether the bills provide the operators
of Twin River and Newport Grand the opportunity to meet the challenges of increased cross-
border competition. In a whitepaper for the AGA, Christiansen Capital Advisors note that
“[l]awmakers in every gaming state face a policy choice: maximum tax revenues today, or jobs
tomorrow? High gaming tax rates, or full-employment economy?”5 Specifically, how the state
sets its tax rate and the share retained by the casinos has an effect beyond gaming’s contribution
to general revenues. The structure of the agreement will also determine the viability of Twin
River and Newport Grand, and whether the two institutions will continue to fully contribute to
the Rhode Island economy.
Rhode Island must take a proactive approach with regard to its economic future. The state can
ill-afford to jeopardize the survival of the two institutions by imposing an unsustainable effective
tax rate that simply boosts revenues in the short-term, while ignoring long-term implications.
The state must also take the projected revenue losses into account when evaluating budgetary
actions that would increase expenditures without a sustainable revenue source to support them in
the out-years. Thoughtful actions taken by the state today will allow Rhode Island to direct its
own future instead of reacting to events beyond its control.
5 “The Impacts of Gaming Taxation in the United States”, Christiansen Capital Advisors LLC.