Embed Size (px)
Citation preview
Prepared by the Office of the New York City Comptroller - Bureau of Fiscal and Budget Studies www.comptroller.nyc.gov or call (212) 669-2507.
Comments on New York City’s Fiscal Year 2013 Executive Budget
June 6, 2012

JOHN C. LIU Comptroller
First Deputy Comptroller Deputy Comptroller of Accountancy & Budget Ricardo E. Morales Simcha Felder Executive Director Budget Bureau Chief Jonathan Rosenberg Eng-Kai Tan Chief Economist Project Coordinator Frank Braconi Manny Kwan Bureau Chief Principal Economist Kirk Parks Farid Heydarpour Staff Kettly Bastien Dahong Huang Amitabha Basu Irina Livshits Rosa Charles Marcia Murphy Carmen Cruz Albert Ng Peter E. Flynn Andrew Rosenthal Michele Griffin Orlando Vasquez Michael Hecht

This page intentionally left blank.

TABLE OF CONTENTS
I. EXECUTIVE SUMMARY ....................................................................................................... v
II. THE FY 2012 BUDGET .......................................................................................................... 5
Budget Surplus ........................................................................................................................ 6
III. THE CITY’S ECONOMIC OUTLOOK .............................................................................. 9
A. COMPTROLLER’S ECONOMIC FORECAST FOR NYC, 2012- 2016 ............................................. 9 B. UNDERLYING FACTORS AFFECTING THE FORECAST .............................................................. 10
IV. BALANCING THE FY 2013 BUDGET ............................................................................... 15
RISKS AND OFFSETS .................................................................................................................... 16
V. REVENUE ASSUMPTIONS .................................................................................................. 19
Revenue Outlook ................................................................................................................... 19 Tax Revenues ........................................................................................................................ 19 Miscellaneous Revenues ....................................................................................................... 23 Federal and State Aid ........................................................................................................... 25
VI. EXPENDITURE ANALYSIS ............................................................................................... 27
Overtime ............................................................................................................................... 27 Headcount ............................................................................................................................. 29 Health Insurance .................................................................................................................. 31 Pensions ................................................................................................................................ 32 Labor .................................................................................................................................... 33 Public Assistance .................................................................................................................. 34 Department of Education ...................................................................................................... 34 Health and Hospitals Corporation ....................................................................................... 35 Debt Service .......................................................................................................................... 36 Capital Plan .......................................................................................................................... 40 Programmatic Review of Capital Plan ................................................................................. 41
VII. APPENDIX ─ REVENUE AND EXPENDITURE DETAILS ......................................... 47
GLOSSARY OF ACRONYMS ................................................................................................... 51

ii
This page intentionally left blank.
iii
LIST OF TABLES TABLE 1. MAY 2012 MODIFICATION AND FYS 2013 – 2016 FINANCIAL PLAN ............................................ 1 TABLE 2. PLAN-TO-PLAN CHANGES MAY 2012 MODIFICATION VS. JUNE 2011 PLAN ................................. 2 TABLE 3. RISKS AND OFFSETS TO THE MAY 2012 FINANCIAL PLAN ............................................................ 3 TABLE 4. CHANGES TO FY 2012 CITY-FUNDS ESTIMATES........................................................................... 5 TABLE 5. ACCUMULATION OF YEAR-END SURPLUSES ................................................................................. 7 TABLE 6. SELECTED NYC AND THE U.S. ECONOMIC INDICATORS, ANNUAL AVERAGES, COMPTROLLER
AND MAYOR’S FORECASTS, 2012-2016 .......................................................................................10 TABLE 7. CHANGES TO CITY-FUNDS ESTIMATES FY 2013 EXECUTIVE BUDGET ........................................15 TABLE 8. RISKS AND OFFSETS TO THE MAY 2012 FINANCIAL PLAN ...........................................................16 TABLE 9. CHANGES TO THE CITY’S TAX REVENUE ASSUMPTIONS JUNE 2011 VS. MAY 2012 .....................20 TABLE 10. CITY’S TAX REVENUE FORECAST, GROWTH FROM PRIOR YEAR, FYS 2012 – 2016 ...................21 TABLE 11. RISKS AND OFFSETS TO THE CITY’S REVENUE PROJECTIONS ......................................................23 TABLE 12. CHANGES IN FY 2013 ESTIMATES MAY 2012 VS. JUNE 2011 ......................................................24 TABLE 13. FYS 2013 – 2016 ADJUSTED EXPENDITURE GROWTH .................................................................27 TABLE 14. PROJECTED OVERTIME SPENDING, FY 2013 ................................................................................28 TABLE 15. CHANGES TO FY 2013 CITY-FUNDED FULL-TIME HEADCOUNT EXECUTIVE BUDGET VS. JUNE
2011 FINANCIAL PLAN ................................................................................................................29 TABLE 16. CITY-FUNDED FULL-TIME YEAR-END HEADCOUNT PROJECTIONS .............................................30 TABLE 17. CITY-FUNDED FTE YEAR-END HEADCOUNT PROJECTIONS FYS 2013-2016 ..............................31 TABLE 18. PAY-AS-YOU-GO HEALTH EXPENDITURES .................................................................................31 TABLE 19. DEBT SERVICE FYS 2012 – 2016 .................................................................................................37 TABLE 20. FYS 2012 – 2016 FINANCING PROGRAM .....................................................................................40 TABLE 21. FYS 2012 – 2016 CAPITAL COMMITMENTS, ALL-FUNDS ............................................................40 TABLE 22. FYS 2012 – 2016 CAPITAL COMMITMENT, CITY-FUNDS .............................................................41
TABLE A1. FY 2013 EXECUTIVE BUDGET REVENUE DETAIL ........................................................................47 TABLE A2. FY 2013 EXECUTIVE BUDGET EXPENDITURE DETAIL .................................................................49
LIST OF CHARTS CHART 1. CHANGES IN SINGLE FAMILY HOME COMPLETIONS AND REAL GDP, 1969-2011 ........................12 CHART 2. DEBT SERVICE AS A PERCENTAGE OF TAX REVENUES, FYS 1990 – 2022, FY 2013
EXECUTIVE BUDGET ....................................................................................................................39 CHART 3. MAY 2012 CAPITAL PLAN TOTAL FUNDS, FYS 2012– 2016, SHARES OF $39.518 BILLION ........43

iv
This page intentionally left blank.

v
I. Executive Summary
The City’s FY 2013 Executive Budget and Financial Plan for FYs 2013 – 2016 further illustrate the irregular pattern of the local economic recovery that the City has experienced over the last two years. While in 2011 there were some promising signs that could presage an economic recovery taking hold, in general New York City’s economy over the last year has been erratic and somewhat disappointing. Unlike with the recovery at the national level, the City’s unemployment rate has been persistently high over the last twelve months. While the local unemployment picture has been gloomy there has been some reason for optimism as recent private-sector job creation has been robust especially in the relatively high-paying Professional and Business Services sector.
As was highlighted in the Comptroller’s comments on the FY 2013 Preliminary Budget, next year’s budget provides evidence that the City may not be able to rely on the materialization of unanticipated revenues to fill budgetary gaps for some time. While previous financial plans have relied on a certain amount of one-time or unanticipated revenues to close budgetary gaps, the current Plan includes a disproportionate amount of such gap-closing actions. The Comptroller estimates that including funds rolled from FY 2012, the FY 2013 budget is balanced with over $3.5 billion in non-recurring revenue sources. With little hope for a marked increase in tax revenues in the foreseeable future and outyear gaps exceeding $3 billion annually, the City will be left with the unenviable task of choosing between further reductions in services or increases in taxation.
The Comptroller’s Office continues to point to the uncertainty resulting from the European debt crisis as a primary threat to both the U.S. and local economies. In addition, the political uncertainty surrounding this year’s Presidential and Congressional elections adds further instability to the economy. The likelihood of further partisan stalemates in Washington threatens to impede agreement upon many pieces of critical economic policy. Gridlock or failure to act on legislation regarding the expiration of the Bush-era Tax Cuts, the expiration of the 2.0 percent payroll tax deduction and extended unemployment benefits, the raising of the debt ceiling and the implementation of budget cuts resulting from the failed agreement of the Joint Select Committee on Deficit Reduction would be calamitous, likely stalling any national economic recovery that has taken hold. Nearly any possible scenario for events in Europe and Washington will bring about adverse consequences for both the U.S. and New York City economies in the coming year.
The May Financial Plan and the Executive FY 2013 Budget is balanced for the coming fiscal year. The $68.72 billion budget is $2.95 billion less than the expenditures projected in the June 2011 Financial Plan. Changes to the FY 2013 Plan since February increased the budget gap by $307 million. The FY 2013 gap, resulting primarily from a lowering of estimated tax revenues and additional agency expenditures, was closed nearly entirely through the realization of additional FY 2012 revenue in the form of a $466 million settlement with SAIC (Science Applications International Corporation), the developer of the City’s CityTime automated payroll system. The settlement money allows the City to increase the total surplus roll from FY 2012 to $1.73 billion. These

vi
funds, placed in the Budget Stabilization Account (BSA), enable the City to balance the FY 2013 budget without the need for additional reductions in services or increases in taxes and fees.
While the May Financial Plan includes additional funding for the FY 2012 BSA, it further highlights the structural imbalance that has beset the budget in recent years. In every fiscal year from 2003 until 2008, the city ended the year taking in more revenues than needed for that year’s expenditures. These funds were rolled over to the next fiscal year as part of the BSA. Since FY 2008, when $4.7 billion was rolled into the following fiscal year, the BSA has declined precipitously. Between FY 2011 and FY 2012 alone the BSA’s value declined by over $2.0 billion. This fact is made all the more troublesome because of the Plan’s aforementioned reliance on one-time revenue sources in FY 2013. The reliance on such one-shots as the realization of $1 billion in revenue from the sale of 2,000 taxi medallions and the use of $1 billion of funds set aside in the Retiree Health Benefits Trust (RHBT) to fund current year health care costs for retirees, further conceals the budget’s structural imbalance.
The Comptroller’s review of the May Plan finds certain risks to budgetary assumptions that could create large budget gaps in the current and future fiscal years. The realization of all of the risks to the current Plan would leave the City with an additional gap of $3.68 billion in FY 2013.
The primary risks to the FY 2013 budget include: $2.6 billion for the lack of funding for the previous round of collective bargaining, including retroactive pay, for City employees represented by the United Federation of Teachers (UFT) and the Council of School Supervisors and Administrators (CSA), $143 million for the City’s underestimation of overtime expenses, $100 million for the Department of Education’s overestimation of potential Medicaid reimbursement, and $400 million from the sale of 2,000 taxi medallions.
The May Financial Plan does not include any funding for wage increases corresponding to the 2008 – 2010 round of collective bargaining for the UFT and CSA, reflecting the Mayor’s decision that any wage increases in these years be funded with offsetting productivity savings. Since other municipal employee unions have settled for two annual wage increases of 4.0 percent over comparable period, excluding funding for these increases represents a significant risk to the Plan. A settlement that mirrors the agreement of the other city unions would cost the City $1.698 billion in retroactive pay and would cost $900 million annually going forward.
The May Financial Plan assumes $1 billion of revenues in FY 2013 from the sale of 2,000 taxi medallions. However as a result of a recent temporary restraining order placed on the City by a State Supreme Court decision, the sale of the medallions is on hold indefinitely. As a result of the temporary restraining order, the Comptroller’s Office believes that it is unlikely that the City will be able to auction off any taxi medallions in FY 2013 and thus the entire $1 billion is at risk.

vii
Offsetting these risks in FY 2013, the Comptroller estimates that tax revenues will come in slightly higher than planned adding $100 million to the City’s revenue stream while judgments and claims (J&C) against the City will conform to historical averages resulting in $60 million of savings for the City.
In the outyears of the Plan, the Comptroller estimates risks to continue in the aforementioned categories while offsets, particularly in tax revenues will increase. The consequence of which is that the Comptroller estimates offsets to minimally exceed risks by $44 million in FY 2014 and $361 million in FY 2016, while risks outpace offsets in FY 2015 by $92 million.

viii
This page intentionally left blank.

1
Table 1. May 2012 Modification and FYs 2013 – 2016 Financial Plan ($ in millions) Changes FYs 2012 – 2016 FY 2012 FY 2013 FY 2014 FY 2015 FY 2016 Dollar Percent Revenues Taxes:
General Property Tax $18,114 $18,568 $19,170 $19,831 $20,473 $2,359 13.0% Other Taxes $23,274 $24,289 $25,231 $26,585 $27,808 $4,534 19.5% Tax Audit Revenues $700 $724 $706 $706 $706 $6 0.9% Subtotal: Taxes $42,088 $43,581 $45,107 $47,122 $48,987 $6,899 16.4%
Miscellaneous Revenues $6,747 $7,278 $6,221 $6,206 $6,309 ($438) (6.5%) Unrestricted Intergovernmental Aid $25 $0 $0 $0 $0 ($25) (100.0%) Less: Intra-City Revenues ($1,790) ($1,596) ($1,595) ($1,598) ($1,603) $187 (10.4%)
Disallowances Against Categorical Grants ($15) ($15) ($15) ($15) ($15) $0 0.0% Subtotal: City-Funds $47,055 $49,248 $49,718 $51,715 $53,678 $6,623 14.1%
Other Categorical Grants $1,036 $923 $919 $916 $902 ($134) (12.9%) Inter-Fund Revenues $555 $538 $510 $509 $509 ($46) (8.3%) Federal Categorical Grants $7,666 $6,595 $6,473 $6,373 $6,372 ($1,294) (16.9%) State Categorical Grants $11,312 $11,413 $11,713 $12,119 $12,628 $1,316 11.6%
Total Revenues $67,624 $68,717 $69,333 $71,632 $74,089 $6,465 9.6% Expenditures Personal Service
Salaries and Wages $21,940 $21,735 $21,959 $22,192 $22,554 $614 2.8% Pensions $7,999 $8,145 $8,181 $8,084 $8,166 $167 2.1% Fringe Benefits $8,014 $8,452 $9,043 $9,647 $10,323 $2,309 28.8% Retiree Health Benefits Trust ($672) ($1,000) ($1,000) $0 $0 $672 (100.0%) Subtotal-PS $37,281 $37,332 $38,183 $39,923 $41,043 $3,762 10.1%
Other Than Personal Service Medical Assistance $6,248 $6,283 $6,366 $6,447 $6,416 $168 2.7% Public Assistance $1,327 $1,274 $1,279 $1,279 $1,279 ($48) (3.6%) All Other $20,909 $20,599 $21,169 $21,789 $22,355 $1,446 6.9% Subtotal-OTPS $28,484 $28,156 $28,814 $29,515 $30,050 $1,566 5.5%
Debt Service Principal $1,971 $2,052 $2,221 $2,302 $2,298 $327 16.6% Interest & Offsets $2,130 $2,345 $2,551 $2,630 $2,727 $597 28.0% Subtotal Debt Service $4,101 $4,397 $4,772 $4,932 $5,025 $924 22.5%
FY 2011 BSA and Discretionary Transfersa ($3,742) $0 $0 $0 $0 $3,742 (100.0%) FY 2012 BSA and Discretionary Transfersb $1,728 ($1,728) $0 $0 $0 ($1,728) (100.0%) FY 2013 BSA $0 $124 ($124) $0 $0 $0 N/A NYCTFA
Principal $606 $803 $771 $851 $886 $280 46.2% Interest & Offsets $916 $929 $1,256 $1,389 $1,539 $623 68.0% Subtotal NYCTFA $1,522 $1,732 $2,027 $2,240 $2,425 $903 59.3%
General Reserve $40 $300 $300 $300 $300 $260 650.0% $69,414 $70,313 $73,972 $76,910 $78,843 $9,429 13.6% Less: Intra-City Expenses ($1,790) ($1,596) ($1,595) ($1,598) ($1,603) $187 (10.4%)
Total Expenditures $67,624 $68,717 $72,377 $75,312 $77,240 $9,616 14.2% Gap To Be Closed $0 $0 ($3,044) ($3,680) ($3,151) ($3,151) N/A a FY 2011 BSA and Discretionary Transfers include prepayments of $2.784 billion of G.O. debt service, $790 million of NYCTFA debt service, $164 million of subsidies and net equity contribution in bond refunding of $4 million. b FY 2012 BSA and Discretionary Transfers include prepayments of $1.664 billion of G.O. debt service and $64 million of subsidies.

2
Table 2. Plan-to-Plan Changes May 2012 Modification vs. June 2011 Plan
($ in millions) FY 2012 FY 2013 FY 2014 FY 2015 Revenues Taxes:
General Property Tax $275 $151 $326 $557 Other Taxes ($264) ($82) $124 $133 Tax Audit Revenues $40 $65 $40 $40 Subtotal: Taxes $51 $134 $490 $730
Miscellaneous Revenues $792 $1,298 $181 $146 Unrestricted Intergovernmental Aid ($12) ($12) ($12) ($12) Less: Intra-City Revenues ($241) ($70) ($72) ($75)
Disallowances Against Categorical Grants $0 $0 $0 $0 Subtotal: City-Funds $590 $1,350 $587 $789
Other Categorical Grants ($157) ($235) ($237) ($237) Inter-Fund Revenues $6 $37 $9 $8 Federal Categorical Grants $992 $206 $158 $135 State Categorical Grants $282 $323 $550 $939
Total Revenues $1,713 $1,681 $1,067 $1,634 Expenditures Personal Service
Salaries and Wages $438 $456 $575 $815 Pensions ($425) ($425) ($267) ($610) Fringe Benefits $29 $76 $141 $192 Retiree Health Benefits Trust $0 ($1,000) ($1,000) $0 Subtotal-PS $42 ($893) ($551) $397
Other Than Personal Service Medical Assistance $31 ($44) ($97) ($196) Public Assistance ($58) ($91) ($86) ($86) All Other $665 $275 $306 $445 Subtotal-OTPS $638 $140 $123 $163
Debt Service Principal ($19) ($137) $60 $59 Interest & Offsets ($128) ($248) ($146) ($157) Subtotal Debt Service ($147) ($385) ($86) ($98)
FY 2011 BSA and Discretionary Transfers ($4) $0 $0 $0 FY 2012 BSA and Discretionary Transfers $1,728 ($1,728) $0 $0 FY 2013 BSA $0 $124 ($124) $0 NYCTFA Debt Service
Principal $15 $10 ($22) $35 Interest & Offsets ($58) ($149) ($1) ($30) Subtotal NYCTFA ($43) ($139) ($23) $5
General Reserve ($260) $0 $0 $0 $1,954 ($2,881) ($661) $467 Less: Intra-City Expenses ($241) ($70) ($72) ($75)
Total Expenditures $1,713 ($2,951) ($733) $392 Gap To Be Closed $0 $4,632 $1,800 $1,242

3
Table 3. Risks and Offsets to the May 2012 Financial Plan ($ in millions)
FY 2013 FY 2014 FY 2015 FY 2016 City Stated Gap $0 ($3,044) ($3,680) ($3,151) Tax Revenues
Property Tax ($13) $352 $576 $889 Personal Income Tax $36 $299 $129 $221 Business Taxes ($12) ($126) ($68) ($76) Sales Tax $10 $85 $205 $321 Real-Estate-Related Taxes $79 $41 $37 ($59) Subtotal $100 $651 $879 $1,296
Taxi Medallion Sale ($1,000) $0 $0 $0 Expenditures
UFT/CSA Collective Bargaining ($2,595)* ($900) ($900) ($900) Overtime ($143) ($100) ($100) ($100) DOE Medicaid Reimbursement ($100) ($100) ($100) ($100) Judgments and Claims $60 $93 $129 $165
Subtotal ($2,778) ($1,007) ($971) ($935)
Total Risk/Offsets ($3,678) ($356) ($92) $361 Restated (Gap)/Surplus ($3,678) ($3,400) ($3,772) ($2,970)
*$1.698 billion of the risks is due to the cost of retroactive wage increases. It is unlikely that any contract agreement will be reached in FY 2012.

4
This page intentionally left blank.

5
II. The FY 2012 Budget
Since budget adoption in June 2011, the FY 2012 Budget has grown by $1.713 billion. The May Modification, which was released with the FY 2013 Executive Budget and May 2012 Financial Plan for FYs 2013 through 2016, totals $67.624 billion. Increases to the Federal and State funds portion of the budget account for $1.274 billion of the growth, $992 million of which are increases to Federal categorical grants. The majority of the revisions to Federal categorical grant estimates are the result of the roll-over of unspent FY 2011 funds in the November Modification. Increases in State categorical grants reflect mainly additional grants in the areas of health and social services above the Adopted Budget estimates.
As shown in Table 4, the City-funds portion of the FY 2012 budget has increased by $590 million. Restitution from the CityTime settlement accounts for $466 million of the revenue increase.1
Table 4. Changes to FY 2012 City-Funds Estimates
Revenue enhancing initiatives in the City’s programs to eliminate the gap (PEGs), comprising $12 million in tax revenues and $57 million in miscellaneous revenue initiatives, account for another $69 million of the increase. Revisions to tax revenues result in a net increase of $39 million from the Adopted Budget forecast. Most of the tax revenue forecasts, with the exception of business tax and PIT revenues, were revised upwards with real property and real-estate-related tax revenues leading the way. The continuing recovery in the real estate market accounts for most of the increase in the real property tax estimates. The increase in real-estate-related tax revenues reflects a rebound in real property transaction tax revenues and to a lesser degree a rebound in mortgage recording tax revenues as a result of improved credit conditions in the commercial market and refinancing activities in the residential market. Downward revisions to business tax and PIT revenues reflect lower than expected Wall Street profits.
($ in millions) REVENUES EXPENDITURES Real Property Tax Revenues $275 Agency Expenditures $267 Real-Estate-Related Tax 152 Reversal of Previous PEGs 217 Sales Tax 38 Judgments and Claims 10 Tax Audit Revenue 30 Prior-Year-Payable (500) Business Tax (351) Pensions (417) PIT (205) General Reserve (260) Other Taxes 100 Debt Service (58) Subtotal Tax Revenues $39 HIP Rate Savings (2) Subtotal ($743) CityTime Settlement $466 Other Non-Tax Revenues $16 Expenditure PEGs ($395) Revenue PEGs $69 2012 BSA $1,728 Total $590 Total $590
1 As part of the deferred prosecution agreement between Science Applications International
Corporation (SAIC) and Federal prosecutors in the CityTime fraud case, SAIC agreed to pay the City restitution of $370 million and a penalty of $130 million to the Federal government of which the Federal government will transfer $96 million to the City.

6
The increase in City-fund expenditures results from the funding of a FY 2012 Budget Stabilization Account (BSA) and discretionary transfers to prepay certain FY 2013 expenditures offset by a net reduction in baseline expenditure estimates and spending reduction PEGs.2
Budget Surplus
The net reduction in baseline expenditure estimates stems mainly from the routine reduction in General Reserve and recognition of prior-year-payable savings which occurs in the latter half of the fiscal year as well as a reduction in pension contributions. The City had budgeted $1 billion annually beginning in FY 2012 to fund potential changes in actuarial assumptions and methods. The additional pension cost of the Chief Actuary’s recommended changes were below the budgeted $1 billion thus allowing the City to reduce its pension budget. The impact of the Chief Actuary’s recommendations is discussed in greater detail in “Pensions” beginning on page 32. Partially offsetting these reductions are increases to agency spending, judgments and claims expenditures, and the reversal of prior PEGs.
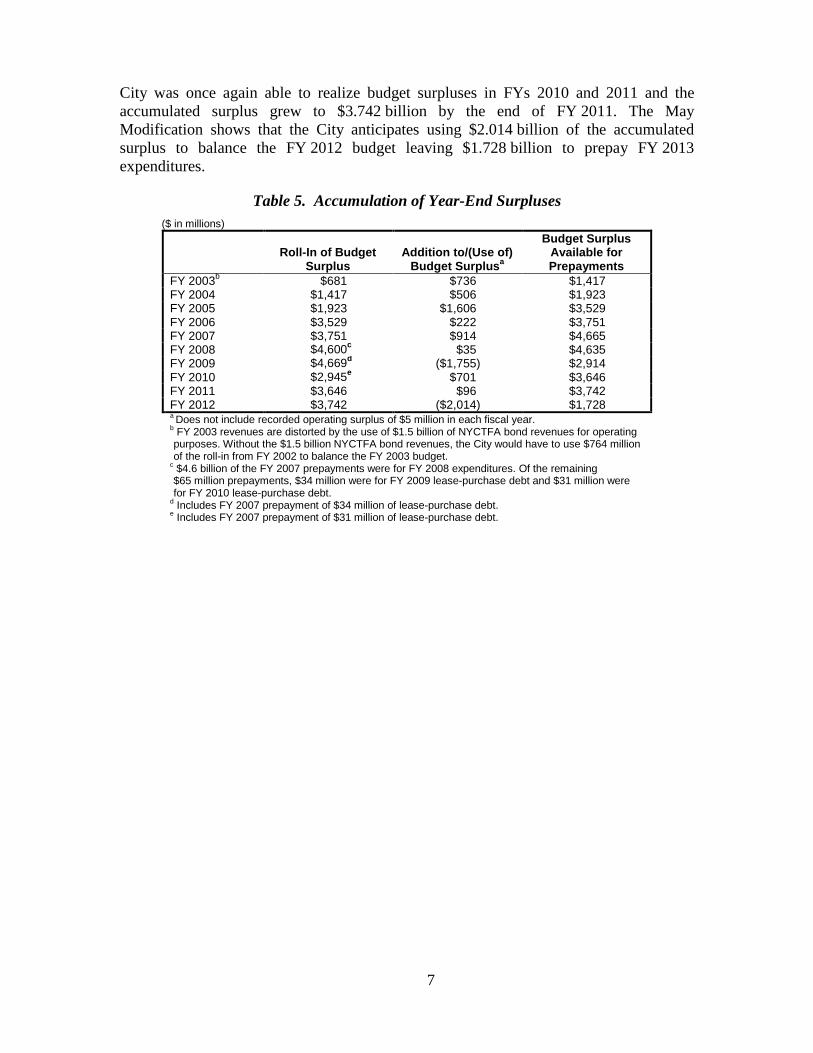
The FY 2012 BSA and discretionary transfer is the result of a budget surplus for the fiscal year. However, the $1.728 billion budget surplus is a product of the net accumulation of prior-year budget surpluses available for prepayments rather than the excess of FY 2012 revenues over expenditures. The existence of the FY 2012 surplus is primarily due to the fact that FY 2012 expenditures were reduced by prepayments and discretionary transfers from FY 2011 totaling $3.742 billion. Without the prepayments and discretionary transfers, FY 2012 expenditures would have exceeded revenues by approximately $2 billion.
Table 5 on page 7 shows the accumulation of the year-end budget surplus in the last ten years. At the close of FY 2003, the City prepaid $1.417 billion of FY 2004 expenditures with the FY 2003 budget surplus.3
In each of FYs 2003 through 2008, operating revenues exceeded operating expenditures and as such, the budget surpluses that were rolled into the following fiscal years grew from $1.417 billion to $4.635 billion. However, in the wake of the financial crisis that erupted in the fall of 2008, City revenues plummeted in FY 2009 and the City had to use $1.755 billion of the surplus that was rolled into the fiscal year to balance the FY 2009 Budget, leaving $2.914 billion available to prepay FY 2010 expenditures. The
As the table shows, the prepayments effectively rolled the FY 2003 budget surplus into FY 2004. In FY 2004, operating revenues exceeded operating expenditures by $511 million thus the $1.417 billion that was rolled into FY 2004 was not needed for budget balance. In fact after recording an operating budget surplus of $5 million, the City added the remaining $506 million to the $1.417 billion rolled into FY 2004 to prepay $1.923 billion of FY 2005 expenditures.
2 The FY 2012 BSA and discretionary transfers are earmarked to prepay $1.664 billion of General
Obligations (G.O.) debt service and $64 million of library subsidies.
3 The effective FY 2003 budget surplus was $1.422 billion of which $1.417 billion was used to prepay certain FY 2004 expenditures and $5 million was recorded as an operating surplus. The budget surplus discussed in this section refers only to the surplus available for prepayments and does not include the recorded surplus.
7
City was once again able to realize budget surpluses in FYs 2010 and 2011 and the accumulated surplus grew to $3.742 billion by the end of FY 2011. The May Modification shows that the City anticipates using $2.014 billion of the accumulated surplus to balance the FY 2012 budget leaving $1.728 billion to prepay FY 2013 expenditures.
Table 5. Accumulation of Year-End Surpluses ($ in millions)
Roll-In of Budget
Surplus Addition to/(Use of)
Budget Surplusa
Budget Surplus Available for Prepayments
FY 2003b $681 $736 $1,417 FY 2004 $1,417 $506 $1,923 FY 2005 $1,923 $1,606 $3,529 FY 2006 $3,529 $222 $3,751 FY 2007 $3,751 $914 $4,665 FY 2008 $4,600c $35 $4,635 FY 2009 $4,669d ($1,755) $2,914 FY 2010 $2,945e $701 $3,646 FY 2011 $3,646 $96 $3,742 FY 2012 $3,742 ($2,014) $1,728 a Does not include recorded operating surplus of $5 million in each fiscal year. b FY 2003 revenues are distorted by the use of $1.5 billion of NYCTFA bond revenues for operating purposes. Without the $1.5 billion NYCTFA bond revenues, the City would have to use $764 million of the roll-in from FY 2002 to balance the FY 2003 budget.
c $4.6 billion of the FY 2007 prepayments were for FY 2008 expenditures. Of the remaining $65 million prepayments, $34 million were for FY 2009 lease-purchase debt and $31 million were for FY 2010 lease-purchase debt.
d Includes FY 2007 prepayment of $34 million of lease-purchase debt. e Includes FY 2007 prepayment of $31 million of lease-purchase debt.

8
This page intentionally left blank.
.
9
III. The City’s Economic Outlook
A. COMPTROLLER’S ECONOMIC FORECAST FOR NYC, 2012- 2016
The Comptroller’s forecasts since the end of the 2008 – 2009 recession have anticipated slow and tenuous growth in the U.S. economy, and that is essentially what the economy has delivered. During the past two years, real gross domestic product has not expanded at faster than a 3.0 percent annual rate or slower than a 0.4 percent annual rate in any single quarter. Although some improvement in the underlying factors suppressing domestic economic growth has occurred, significant obstacles to a return to the historical growth rate remain. Consequently, 2012 promises a continuation of the mediocre growth of the recent past.
The U.S. economy managed to make some progress in 2011 despite the uncertainty caused by the European debt crisis. Consumer spending rose moderately despite a weak labor market, a severe loss of household wealth, and the absence of real wage growth. Corporate profits improved and businesses continued to stockpile cash. The deleveraging of both the business and household sectors continued. The housing market continued to absorb the inventory of distressed properties, assisted by a moribund residential construction industry that has added little new supply to the market. Most importantly, the economy has begun creating jobs again, bringing the unemployment rate down nearly two percentage points since its peak in late 2009.
Despite those improvements, the Comptroller’s Office believes that national economic growth will continue to be sub-par for the next several years. Even as the economy continues to struggle with its hangover from the credit bubble of the past decade, the European debt crisis will create a climate of unease and uncertainty for households and businesses alike. Moreover, the Presidential and Congressional elections later this year are likely to deliver more divided government and partisan stalemate to Washington at a time when critical economic policy decisions will need to be made. With such downside risks to the country’s fragile economy far outweighing the possible upside surprises, continuation of slow and steady growth can be considered a favorable outcome. We expect the U.S. economy to grow 2.2 percent in 2012, slightly slower than the Blue Chip consensus forecast of 2.3 percent but higher than the Mayor’s forecast of 2.1 percent.
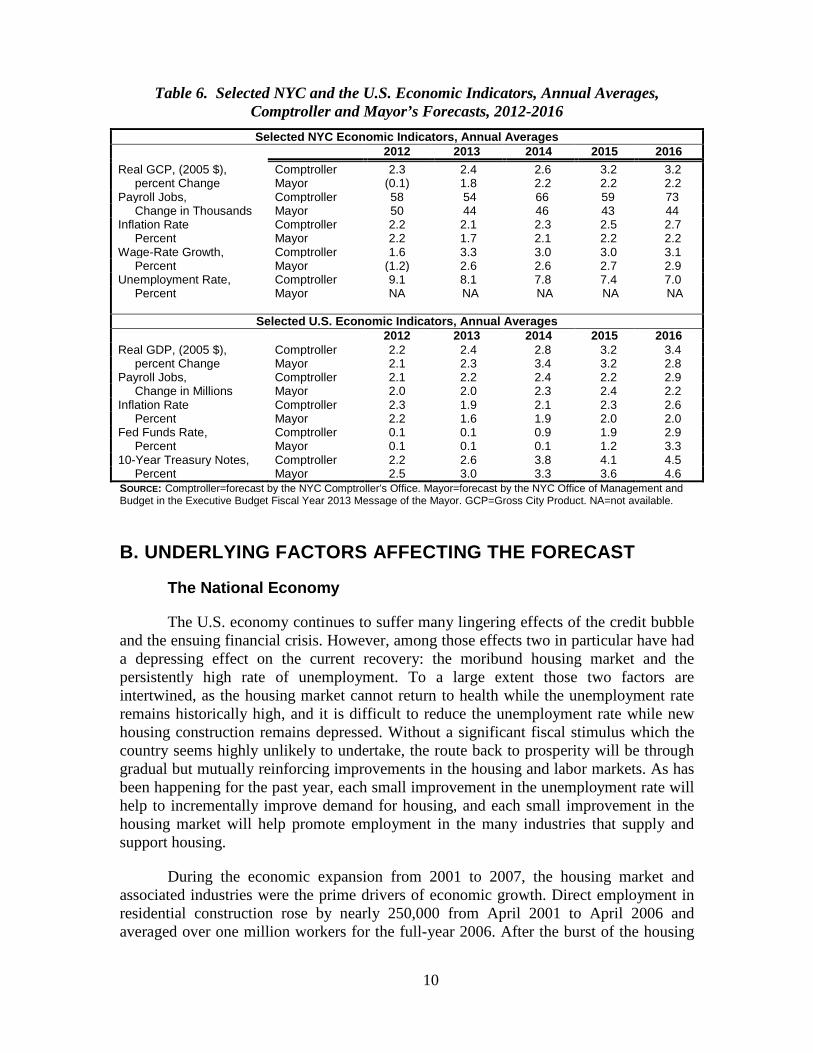
New York City’s economic performance has also been mixed, but overall the city’s economy has performed as well or better than the national economy. Early in the recovery job creation in the city was more rapid, stalled in the second half of 2011, and picked up steam again early in 2012. On an annualized basis, the number of private payroll jobs in the city increased by 2.7 percent in 2011 over the previous year, compared to just a 1.7 percent gain for the nation as a whole. The Comptroller’s estimate of Gross City Product (GCP) in 2011 reflects a similar premium over the rate of national economic growth. In 2012, the Comptroller expects the national and city economies to grow at approximately the same rate. Table 6 compares the Comptroller’s and Mayor’s forecasts for key national and local economic.
10
Table 6. Selected NYC and the U.S. Economic Indicators, Annual Averages, Comptroller and Mayor’s Forecasts, 2012-2016 Selected NYC Economic Indicators, Annual Averages
2012 2013 2014 2015 2016 Real GCP, (2005 $), Comptroller 2.3 2.4 2.6 3.2 3.2 percent Change Mayor (0.1) 1.8 2.2 2.2 2.2 Payroll Jobs, Comptroller 58 54 66 59 73 Change in Thousands Mayor 50 44 46 43 44 Inflation Rate Comptroller 2.2 2.1 2.3 2.5 2.7 Percent Mayor 2.2 1.7 2.1 2.2 2.2 Wage-Rate Growth, Comptroller 1.6 3.3 3.0 3.0 3.1 Percent Mayor (1.2) 2.6 2.6 2.7 2.9 Unemployment Rate, Comptroller 9.1 8.1 7.8 7.4 7.0 Percent Mayor NA NA NA NA NA
Selected U.S. Economic Indicators, Annual Averages
2012 2013 2014 2015 2016 Real GDP, (2005 $), Comptroller 2.2 2.4 2.8 3.2 3.4 percent Change Mayor 2.1 2.3 3.4 3.2 2.8 Payroll Jobs, Comptroller 2.1 2.2 2.4 2.2 2.9 Change in Millions Mayor 2.0 2.0 2.3 2.4 2.2 Inflation Rate Comptroller 2.3 1.9 2.1 2.3 2.6 Percent Mayor 2.2 1.6 1.9 2.0 2.0 Fed Funds Rate, Comptroller 0.1 0.1 0.9 1.9 2.9 Percent Mayor 0.1 0.1 0.1 1.2 3.3 10-Year Treasury Notes, Comptroller 2.2 2.6 3.8 4.1 4.5 Percent Mayor 2.5 3.0 3.3 3.6 4.6 SOURCE: Comptroller=forecast by the NYC Comptroller’s Office. Mayor=forecast by the NYC Office of Management and Budget in the Executive Budget Fiscal Year 2013 Message of the Mayor. GCP=Gross City Product. NA=not available.
B. UNDERLYING FACTORS AFFECTING THE FORECAST
The National Economy
The U.S. economy continues to suffer many lingering effects of the credit bubble and the ensuing financial crisis. However, among those effects two in particular have had a depressing effect on the current recovery: the moribund housing market and the persistently high rate of unemployment. To a large extent those two factors are intertwined, as the housing market cannot return to health while the unemployment rate remains historically high, and it is difficult to reduce the unemployment rate while new housing construction remains depressed. Without a significant fiscal stimulus which the country seems highly unlikely to undertake, the route back to prosperity will be through gradual but mutually reinforcing improvements in the housing and labor markets. As has been happening for the past year, each small improvement in the unemployment rate will help to incrementally improve demand for housing, and each small improvement in the housing market will help promote employment in the many industries that supply and support housing.
During the economic expansion from 2001 to 2007, the housing market and associated industries were the prime drivers of economic growth. Direct employment in residential construction rose by nearly 250,000 from April 2001 to April 2006 and averaged over one million workers for the full-year 2006. After the burst of the housing

11
bubble, employment in the housing construction industry plummeted to a low of 559,000 in August 2011, and it remains barely above that level. In addition, employment fell in a host of related industries, including building materials and equipment, home furnishings, real estate, and especially, housing finance. The slump in those industries helped to push the national unemployment rate up to 10 percent by October 2009.
Neither the housing nor labor markets have improved enough to substantially help the other or to provide a boost to the overall economy. Nevertheless, the economy has generated an average of 169,000 new private jobs per month over the past year, sufficiently above the demographic growth rate to bring the unemployment rate down to 8.1 percent in April, from 9.0 percent in April 2011. If that rate of job creation continues, it will take approximately three more years for the unemployment rate to fall to its post-War average of 5.7 percent.
The housing market has also shown signs of gradual improvement. According to the National Association of Realtors, sales of existing homes rose 2.1 percent in 2011 and for the first four months of 2012 were up about 7.2 percent from the sales rate of the previous year. Nevertheless, the year-to-date rate of 4.58 million is still about 18 percent below the level predicted by the long-term trend rate of sales. At the current rate of improvement, it will take another four to five years for existing home sales to return to trend. Moreover, new home sales during the first four months of 2012 were made at an annual rate of 343,000, about 15 percent higher than the same period of the previous year but still less than half of their annual average for the past 20 years.
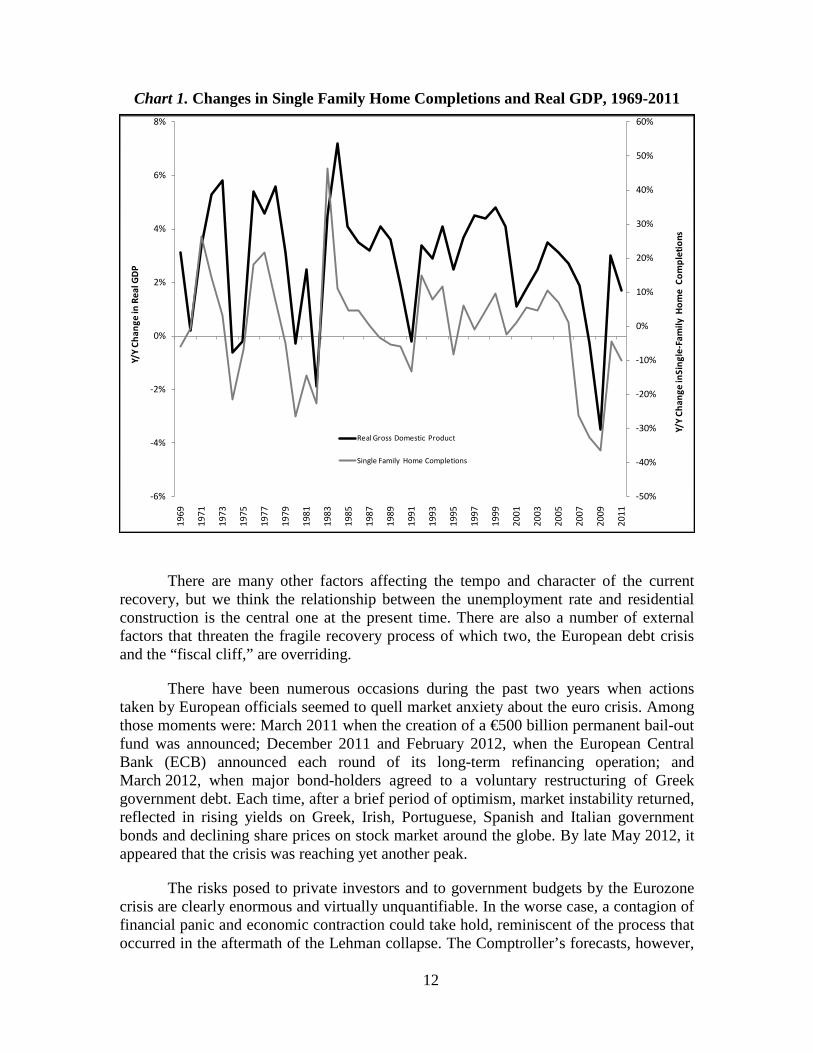
Since existing homes are usually more favorably situated than new housing subdivisions and often have a price advantage as well, new housing construction usually does not take off until the market for existing homes tightens. However, it is construction of new homes that provides the biggest economic boost. With unemployment still high and the existing home market still struggling to absorb the flood of distress sales, a meaningful rise in new residential construction still appears to be several years off. That suggests that a significant acceleration in overall economic growth is not imminent. Chart 1 shows the close historical relationship between increases in new single-family home construction and rises in real GDP.
12
-50%
-40%
-30%
-20%
-10%
0%
10%
20%
30%
40%
50%
60%
-6%
-4%
-2%
0%
2%
4%
6%
8%
1969
1971
1973
1975
1977
1979
1981
1983
1985
1987
1989
1991
1993
1995
1997
1999
2001
2003
2005
2007
2009
2011
Y/Y
Chan
ge in
Sing
le-F
amily
Hom
e C
ompl
etio
ns
Y/Y
Chan
ge in
Rea
l GD
P
Real Gross Domestic Product
Single Family Home Completions
Chart 1. Changes in Single Family Home Completions and Real GDP, 1969-2011
There are many other factors affecting the tempo and character of the current recovery, but we think the relationship between the unemployment rate and residential construction is the central one at the present time. There are also a number of external factors that threaten the fragile recovery process of which two, the European debt crisis and the “fiscal cliff,” are overriding.
There have been numerous occasions during the past two years when actions taken by European officials seemed to quell market anxiety about the euro crisis. Among those moments were: March 2011 when the creation of a €500 billion permanent bail-out fund was announced; December 2011 and February 2012, when the European Central Bank (ECB) announced each round of its long-term refinancing operation; and March 2012, when major bond-holders agreed to a voluntary restructuring of Greek government debt. Each time, after a brief period of optimism, market instability returned, reflected in rising yields on Greek, Irish, Portuguese, Spanish and Italian government bonds and declining share prices on stock market around the globe. By late May 2012, it appeared that the crisis was reaching yet another peak.
The risks posed to private investors and to government budgets by the Eurozone crisis are clearly enormous and virtually unquantifiable. In the worse case, a contagion of financial panic and economic contraction could take hold, reminiscent of the process that occurred in the aftermath of the Lehman collapse. The Comptroller’s forecasts, however,

13
assume a somewhat less calamitous scenario, in which the Eurozone is held together by a further series of emergency responses and the deeper involvement of the ECB. Moreover, voters in Greece, France the Netherlands and even Germany have recently rejected decisively the austerity policies that have exacerbated the debt crisis by choking off economic growth, and there is some hope that a more balanced approach to resolving the crisis can be fashioned. Unfortunately, even a scenario that envisions the survival and continued viability of the current Eurozone implies continued uncertainty and volatility that will undermine economic growth in the United States.
The other major threat to the U.S. recovery emanates from Washington. Shortly after the Presidential and Congressional elections later this year, the U.S. government will confront a number of critical economic policy decisions. Among these are the expiration of the so-called Bush Tax Cuts, the expiration of the 2.0 percent payroll tax deduction and extended unemployment benefits, the necessary raising of the Federal debt ceiling, and the automatic implementation of deep budget cuts pursuant to the debt ceiling agreement of August 2011. If all of these deadlines are passed without agreement, the country will face a “fiscal cliff” that could halt the recovery in its tracks.
The Congressional Budget Office recently estimated that if all the tax and spending policies scheduled under current law actually take effect, the Federal budget deficit will narrow by an amount equal to 5.1 percent of GDP in 2013, and that real GDP will contract at an annual rate of 1.3 percent during the first half of the year. In effect, the United States will replicate the austerity policies of the Eurozone and induce a recession. While we do not expect that all of the fiscal policies embodied in current law will actually be allowed to take effect, recent experience suggests that if President Obama is reelected and Republicans control one or both houses of Congress, the budget, tax and debt negotiations will be bitter and harmful to both household and business confidence. Alternatively, if Republicans regain the White House and retain control of at least one house of Congress, counter-productive fiscal policies are likely to be adopted with much less rancor.
The New York City Economy
There were both disturbing and encouraging aspects to New York City’s economic performance in 2011. Most troubling was the stubbornly high unemployment rate, which actually bottomed in March but then rose gradually through the rest of the year and into early 2012. That was counter to the national trend and counter to other important indicators of the city’s economic health.
Generally, the local unemployment rate correlates closely with local job creation, but recently that relationship has not been as reliable as it has been in the past. Strong local job creation in the first half of 2011 produced only a modest decline in the city’s unemployment rate. Then, following a lull in job creation in the year’s second half, the city experienced very rapid private-sector job creation in the early months of 2012. The unemployment rate, however, actually rose until April, when it ticked down to 9.5 percent.

14
A rising unemployment rate can be consistent with strong job creation if, for example, a large number of previously-discouraged workers rejoin the labor force because the economy is picking up. The size of the city’s labor force has not, however, increased over the past 18 months so the divergence in payroll employment and the unemployment rate is somewhat puzzling. Most likely, several factors are at play, including an increase in the number of city jobs held by commuters, an increase in free-lance and contract employees being brought onto company payrolls, and statistical noise.
Nevertheless, the strong private-sector job creation the city has seen recently augers well for its economic performance in 2012 and beyond. Especially promising is the soaring employment in the Professional and Business Services sector. The sector pays average wages about 21 percent higher than the city’s private-sector average and is comprised of industries such as Legal Services, Accounting, Consulting, Engineering, Architecture and Advertising, in which New York should retain competitive advantages. Between April 2010 and April 2012 the sector has increased its payroll employment by an impressive 54,000 workers.
The strength of Professional and Business Services in the city may help to cushion some of the weaknesses in the Financial Services sector. The surprisingly quick recovery of the city’s Financial Services sector from the crisis of 2008-2009 has stalled since mid-2011, as the uncertainty and volatility of the European situation has hampered many bread-and-butter financial activities, suppressed stock values, and reduced trading volume. NYSE member firms collectively registered pre-tax losses in the final two quarters of 2011 and several incidents, such as the large trading loss JPMorgan Chase reported in May 2012, indicate that the business environment remains challenging. Considering the risks to the national economy already identified, a significant improvement in Wall Street business conditions seems unlikely during 2012.

15
IV. Balancing the FY 2013 Budget
The FY 2013 Executive Budget totals $68.717 billion and closes a budget gap of $4.632 billion that was projected in the June 2011 Financial Plan. As Table 2 on page 2 shows, total revenues in the FY 2013 Executive Budget are $1.681 billion higher than the June 2011 projection while expenditures are $2.951 billion lower. Federal, State and other categorical and inter-fund agreement funded portion of the budget account for $331 million of the increase in revenues and corresponding increase in expenditures.
The City-funded portion of the FY 2013 Executive Budget totals $49.248 billion. City-funded revenues are $1.35 billion above the June 2011 projection. Most of the increase is due to an expected increase of $1 billion in revenues from the sale of taxi medallions and $137 million in revenue enhancement PEGs. As Table 7 shows, baseline revenues are only $212 million higher, $129 million of which is from upward revisions to non-tax revenue estimates and the remaining $83 million from revisions to tax revenue forecast.
Table 7. Changes to City-Funds Estimates FY 2013 Executive Budget
($ in millions, positve numbers reduce the gap and negative numbers increase the gap)
June 2011 Gap ($4,632) Revenue Changes Tax Revenues $83 Non-Tax Revenues 129 Subtotal Revenue Changes $212 Expenditure Changes Agency Expenditure Changes ($638) PEG Reversal (219) Retiree Health Benefits Trust Fund 1,000 Pension 417 Debt Service 252 HIP Rate Savings 42 Judgments and Claims (50) Subtotal Expenditure Changes $804 Gap-Closing Actions Agency Gap-Closing Program $1,012 Taxi Medallion Sale 1,000 Subtotal Gap-Closing Actions $2,012 FY 2012 BSA $1,728 FY 2013 BSA ($124) May 2012 Gap $0
City-funded baseline expenditures are $804 million below the June 2011 estimate mainly as a result of the use of $1 billion of Retiree Health Benefits Trust (RHBT) funds to pay a portion of FY 2013 retiree pay-as-you-go health insurance expenditures. The remaining adjustments result in a net increase of $190 million with increases in agency spending and judgments and claims, and reversal of previously proposed PEGs exceeding

16
reductions in pension contributions and debt service, and savings from health insurance rate reduction.
Revisions to baseline revenues and expenditures reduce the $4.632 billion June 2011 gap to $3.61 billion. FY 2013 agency PEGs of $1.012 billion, anticipated revenues of $1 billion from the sale of taxi medallions and expected FY 2012 prepayments of $1.728 billion of FY 2013 expenditures enable the City to close the remaining gap with a modest surplus of $124 million to fund an FY 2013 BSA to prepay a portion of FY 2014 G.O. debt service.
RISKS AND OFFSETS
The Comptroller’s Office’s analysis of the May 2012 Financial Plan for FYs 2013 – 2016 has identified net risks of $3.678 billion in FY 2013, $356 million in FY 2014, $92 million in FY 2015, and offsets to projected gap of $361 million in FY 2016. As Table 8 shows, the single largest risk to the May Financial Plan projections is the potential cost of settling the FYs 2010 – 2012 labor contracts with the United Federation of Teachers (UFT) and Council of School Supervisors and Administrators (CSA). The May Financial Plan contains no funding for wage increases for the 2008 – 2010 round of collective bargaining for UFT and CSA.4
Table 8. Risks and Offsets to the May 2012 Financial Plan
However, all other municipal unions settled for two annual wage increases of 4.0 percent for the corresponding round of collective bargaining. A settlement mirroring that of the other municipal unions would cost the City $2.595 billion in FY 2013, including retroactive increases, and $900 million annually thereafter.
($ in millions) FY 2013 FY 2014 FY 2015 FY 2016
City Stated Gap $0 ($3,044) ($3,680) ($3,151) Tax Revenues
Property Tax ($13) $352 $576 $889 Personal Income Tax $36 $299 $129 $221 Business Taxes ($12) ($126) ($68) ($76) Sales Tax $10 $85 $205 $321 Real-Estate-Related Taxes $79 $41 $37 ($59) Subtotal $100 $651 $879 $1,296
Taxi Medallion Sale ($1,000) $0 $0 $0 Expenditures
UFT/CSA Collective Bargaining ($2,595)* ($900) ($900) ($900) Overtime ($143) ($100) ($100) ($100) DOE Medicaid Reimbursement ($100) ($100) ($100) ($100) Judgments and Claims $60 $93 $129 $165
Subtotal ($2,778) ($1,007) ($971) ($935)
Total Risk/Offsets ($3,678) ($356) ($92) $361 Restated (Gap)/Surplus ($3,678) ($3,400) ($3,772) ($2,970)
*$1.698 billion of the risks is due to the cost of retroactive wage increases. It is unlikely that any contract agreement will be reached in FY 2012.
4 The 2008-2010 round of collective bargaining for UFT and CSA is effective FYs 2010-2012.

17
The May Financial Plan assumes $1 billion of revenues in FY 2013 from the sale
of 2,000 taxi medallions. However, on June 1, 2012, State Supreme Court Justice Arthur Engoron, issued a temporary restraining order on the State legislation authorizing the issuance of street hail licenses for livery cabs as discussed in “Miscellaneous Revenues” beginning on page 23. Because the sale of the 2,000 taxi medallions is contingent upon the availability for purchase of livery cab street hail licenses, the temporary restraining order and subsequent hearings and potential appeals will likely delay, if not jeopardize the current Plan to issue the additional taxi medallions. The Comptroller’s Office believes that it is unlikely that the City will realize the anticipated $1 billion from medallion sales in FY 2013. While the City may be able to realize this revenue after FY 2013, there is too much uncertainty at this point to reasonably estimate when that might be.
Other risks to the City’s projections include risks to overtime and Department of Education (DOE) Medicaid reimbursement estimates as shown in Table 8. However, the Comptroller’s Office expects total tax revenues to be higher than the City’s forecast as discussed in “Risks and Offset to Tax Revenues” beginning on page 22. The higher tax revenue forecasts and estimates of lower judgments and claims costs provide some offset to the Comptroller’s risks.

18
This page intentionally left blank.

19
V. Revenue Assumptions
Revenue Outlook
The City’s total revenues are forecast to grow at an average annual rate of 2.3 percent from FY 2012 through FY 2016. This projection is based on the City’s assumption of gradual expansion in the local and national economies. Total revenues are projected to increase from $67.6 billion in FY 2012 to $74.1 billion in FY 2016. Tax revenues are expected to comprise 62 percent of total revenues in FY 2012, increasing to 66 percent of total revenues by FY 2016. Property tax revenues are projected to grow from $18.1 billion in FY 2012 to $20.5 billion in FY 2016, while non-property tax revenues are expected to grow from $24 billion in FY 2012 to $28.5 billion in FY 2016.
Miscellaneous revenues, excluding intra-City revenues are expected to decline from $5 billion in FY 2012 to $4.7 billion in FY 2016. With the exception of FY 2013, when a one-time revenue infusion of $1 billion increases the miscellaneous revenue forecast to $5.7 billion, growth in miscellaneous revenue is expected to be nearly flat over the Financial Plan period.
The City’s revenue projections include $19 billion of Federal and State aid in FY 2012. In FY 2013, the Federal and State aid is projected to decrease by nearly $1 billion. The decline is the result of an anticipated reduction in Federal aid in FY 2013, and reflects the City’s more conservative stance with regards to realization of Federal aid. In FYs 2014-2016, Federal and State aid are expected to grow steadily and reach $19 billion by FY 2016, mainly due to increases in State education aid.
Tax Revenues
In the FY 2013 Executive Budget, the City projects total tax revenues of $43.58 billion. This forecast reflects a year-over-year increase of 3.5 percent, consistent with the City’s assumption of modest economic growth constrained by limited Wall Street profits and bonus payments. The current FY 2013 tax revenue forecast is $133 million higher than the forecast included in the June 2011 Financial Plan. The small net increase results from revisions in all major tax revenues categories.5
Changes to the FY 2013 Tax Revenue Forecast
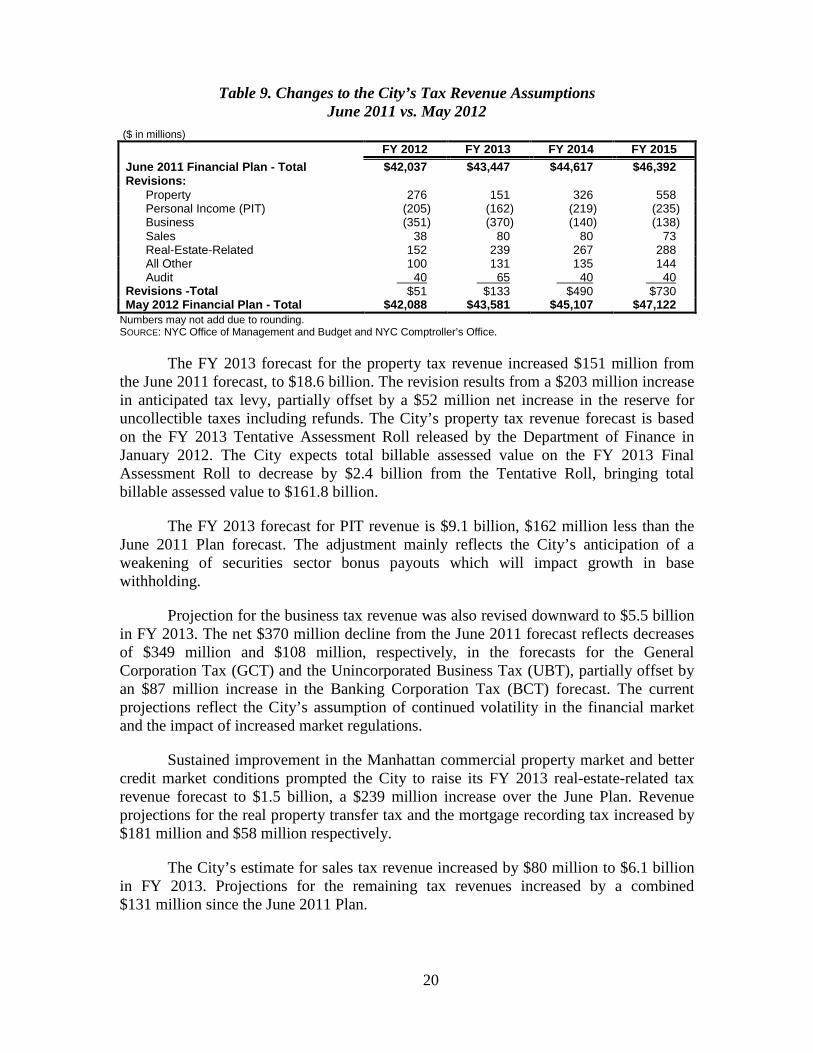
As Table 9 shows, total tax revenue projections for FY 2013 have increased by $133 million since the June 2011 Plan. The largest tax revenue forecast increases are in the property tax and the real-estate-related taxes. The City’s downward revisions to the business taxes and the Personal Income Tax (PIT) revenue forecasts partially offset these increases.
5 If not indicated specifically, tax revenues include PEGs and tax programs. Personal Income Tax
(PIT) and property tax revenues include School Tax Relief (STAR) reimbursement.
20
Table 9. Changes to the City’s Tax Revenue Assumptions June 2011 vs. May 2012
($ in millions) FY 2012 FY 2013 FY 2014 FY 2015 June 2011 Financial Plan - Total $42,037 $43,447 $44,617 $46,392 Revisions: Property 276 151 326 558 Personal Income (PIT) (205) (162) (219) (235) Business (351) (370) (140) (138) Sales 38 80 80 73 Real-Estate-Related 152 239 267 288 All Other 100 131 135 144 Audit 40 65 40 40 Revisions -Total $51 $133 $490 $730 May 2012 Financial Plan - Total $42,088 $43,581 $45,107 $47,122
Numbers may not add due to rounding. SOURCE: NYC Office of Management and Budget and NYC Comptroller’s Office.
The FY 2013 forecast for the property tax revenue increased $151 million from the June 2011 forecast, to $18.6 billion. The revision results from a $203 million increase in anticipated tax levy, partially offset by a $52 million net increase in the reserve for uncollectible taxes including refunds. The City’s property tax revenue forecast is based on the FY 2013 Tentative Assessment Roll released by the Department of Finance in January 2012. The City expects total billable assessed value on the FY 2013 Final Assessment Roll to decrease by $2.4 billion from the Tentative Roll, bringing total billable assessed value to $161.8 billion.
The FY 2013 forecast for PIT revenue is $9.1 billion, $162 million less than the June 2011 Plan forecast. The adjustment mainly reflects the City’s anticipation of a weakening of securities sector bonus payouts which will impact growth in base withholding.
Projection for the business tax revenue was also revised downward to $5.5 billion in FY 2013. The net $370 million decline from the June 2011 forecast reflects decreases of $349 million and $108 million, respectively, in the forecasts for the General Corporation Tax (GCT) and the Unincorporated Business Tax (UBT), partially offset by an $87 million increase in the Banking Corporation Tax (BCT) forecast. The current projections reflect the City’s assumption of continued volatility in the financial market and the impact of increased market regulations.
Sustained improvement in the Manhattan commercial property market and better credit market conditions prompted the City to raise its FY 2013 real-estate-related tax revenue forecast to $1.5 billion, a $239 million increase over the June Plan. Revenue projections for the real property transfer tax and the mortgage recording tax increased by $181 million and $58 million respectively.
The City’s estimate for sales tax revenue increased by $80 million to $6.1 billion in FY 2013. Projections for the remaining tax revenues increased by a combined $131 million since the June 2011 Plan.
21
Projected Tax Revenue Growth, FYs 2012-2016
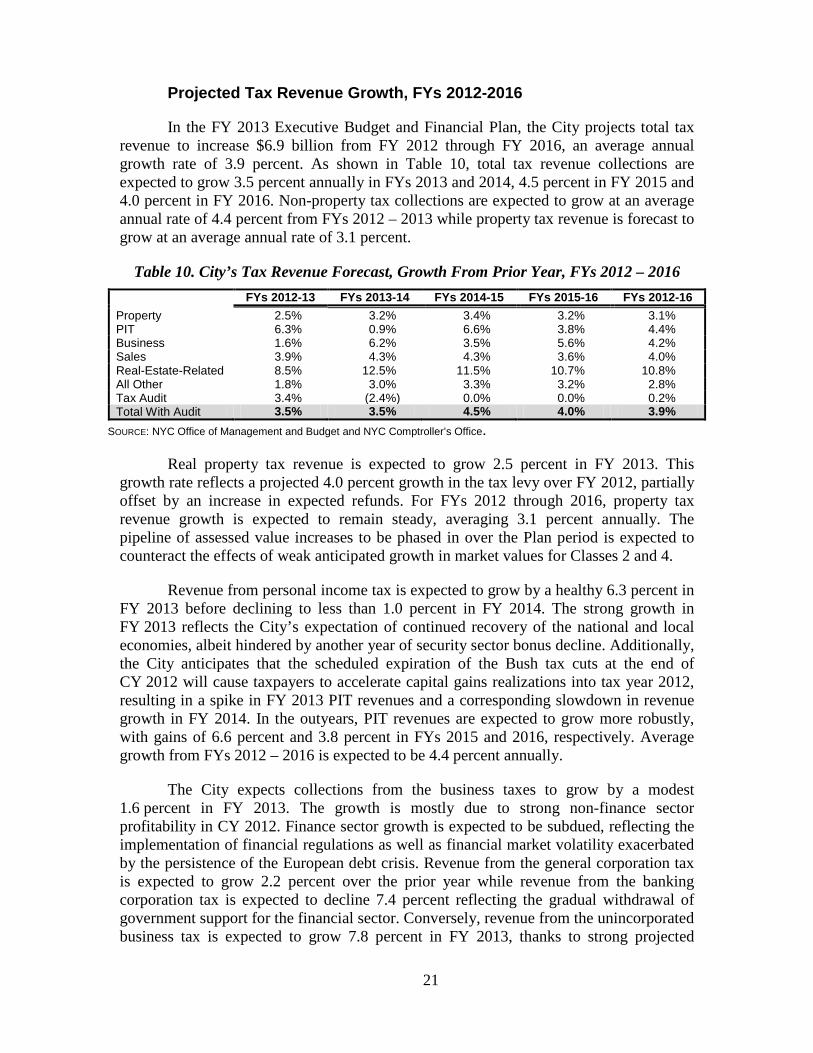
In the FY 2013 Executive Budget and Financial Plan, the City projects total tax revenue to increase $6.9 billion from FY 2012 through FY 2016, an average annual growth rate of 3.9 percent. As shown in Table 10, total tax revenue collections are expected to grow 3.5 percent annually in FYs 2013 and 2014, 4.5 percent in FY 2015 and 4.0 percent in FY 2016. Non-property tax collections are expected to grow at an average annual rate of 4.4 percent from FYs 2012 – 2013 while property tax revenue is forecast to grow at an average annual rate of 3.1 percent.
Table 10. City’s Tax Revenue Forecast, Growth From Prior Year, FYs 2012 – 2016 FYs 2012-13 FYs 2013-14 FYs 2014-15 FYs 2015-16 FYs 2012-16 Property 2.5% 3.2% 3.4% 3.2% 3.1% PIT 6.3% 0.9% 6.6% 3.8% 4.4% Business 1.6% 6.2% 3.5% 5.6% 4.2% Sales 3.9% 4.3% 4.3% 3.6% 4.0% Real-Estate-Related 8.5% 12.5% 11.5% 10.7% 10.8% All Other 1.8% 3.0% 3.3% 3.2% 2.8% Tax Audit 3.4% (2.4%) 0.0% 0.0% 0.2% Total With Audit 3.5% 3.5% 4.5% 4.0% 3.9%
SOURCE: NYC Office of Management and Budget and NYC Comptroller’s Office.
Real property tax revenue is expected to grow 2.5 percent in FY 2013. This growth rate reflects a projected 4.0 percent growth in the tax levy over FY 2012, partially offset by an increase in expected refunds. For FYs 2012 through 2016, property tax revenue growth is expected to remain steady, averaging 3.1 percent annually. The pipeline of assessed value increases to be phased in over the Plan period is expected to counteract the effects of weak anticipated growth in market values for Classes 2 and 4.
Revenue from personal income tax is expected to grow by a healthy 6.3 percent in FY 2013 before declining to less than 1.0 percent in FY 2014. The strong growth in FY 2013 reflects the City’s expectation of continued recovery of the national and local economies, albeit hindered by another year of security sector bonus decline. Additionally, the City anticipates that the scheduled expiration of the Bush tax cuts at the end of CY 2012 will cause taxpayers to accelerate capital gains realizations into tax year 2012, resulting in a spike in FY 2013 PIT revenues and a corresponding slowdown in revenue growth in FY 2014. In the outyears, PIT revenues are expected to grow more robustly, with gains of 6.6 percent and 3.8 percent in FYs 2015 and 2016, respectively. Average growth from FYs 2012 – 2016 is expected to be 4.4 percent annually.
The City expects collections from the business taxes to grow by a modest 1.6 percent in FY 2013. The growth is mostly due to strong non-finance sector profitability in CY 2012. Finance sector growth is expected to be subdued, reflecting the implementation of financial regulations as well as financial market volatility exacerbated by the persistence of the European debt crisis. Revenue from the general corporation tax is expected to grow 2.2 percent over the prior year while revenue from the banking corporation tax is expected to decline 7.4 percent reflecting the gradual withdrawal of government support for the financial sector. Conversely, revenue from the unincorporated business tax is expected to grow 7.8 percent in FY 2013, thanks to strong projected

22
growth in finance sector payments led by an expected rebound in the hedge fund/private equity industry. Overall, business tax collections are expected to grow at an average rate of 4.2 percent annually over FYs 2012 – 2016.
Revenues from the sales tax are projected to grow 3.9 percent in FY 2013 and average 4.0 percent annual growth from FYs 2012 – 2016, the result of gradual growth of income and employment in the City. The tourism industry continues to contribute significantly to the city’s economy, creating jobs and boosting tax revenues. Visitor spending reached an estimated $32 billion in CY 2011. The City expects the flow of international visitors to remain strong thanks in part to a growing share of tourists from emerging markets.
Growth in real-estate-related tax revenues is expected to be robust throughout FYs 2012-16 averaging 10.8 percent annually. In FY 2013, real-estate-related tax revenues are expected to grow 8.5 percent. Mortgage recording tax revenue is expected to grow 16.1 percent, reflecting continued improvement in credit market conditions and refinancing opportunities. The City expects a less exceptional growth of 4.2 percent in collections from the real property transfer tax in FY 2013 as revenues from commercial transactions continue to rebound and the housing market stabilizes. Despite the robust growth anticipated for FY 2013 and beyond, collections from the real-estate-related taxes are expected to remain well below their peak level of $3.3 billion in FY 2007.
Risks and Offsets to the City’s Tax Revenue Assumptions
The Comptroller’s Office estimates of risks and offsets to the City’s tax revenue assumptions are based on current year collections as well as its economic projections. As illustrated in Table 11, for FY 2012, the Comptroller’s Office does not anticipate any significant risks or offsets to the City’s overall tax revenue forecast. For the remainder of the Financial Plan period, the Comptroller’s Office’s projections for the business tax revenues are slightly lower than the City’s, while its estimates for the remaining tax revenues are somewhat higher.
For FY 2013, the Comptroller’s Office estimates that overall tax collections will be above the City’s forecast by $100 million. The offset is mostly due to higher revenue estimates for the real-estate-related tax and PIT. Although the City lowered its projections for the business taxes over the course of the current fiscal year, the Comptroller’s Office’s forecast for the business tax revenues are still slightly lower than the City’s for FYs 2013 through 2016. The Comptroller’s Office anticipates that continued financial volatility stemming from the European debt crisis will adversely affect financial industry profits. The Comptroller’s Office’s economic and tax forecasts reflect a “best case” scenario for the European debt crisis, which is that the monetary union is kept intact through a series of ad hoc measures implemented in response to evolving conditions. There are significant downside risks to the forecasts should those measures prove ineffective and an unraveling of the monetary union occurs.
The Comptroller’s Office projects tax revenue offsets to grow from $651 million in FY 2014 to $1.3 billion in FY 2016. The higher forecast for most major revenue categories stems from the Comptroller’s Office’s expectation that growth in the local

23
economy in the outyears of the Plan period will be more robust than the City anticipates. The Comptroller’s Office believes that the European debt crisis will either be on a path toward resolution, or its spillover effects fully absorbed and discounted, by FY 2014, thereby removing it as a constraint on economic growth and financial industry profits. The Comptroller’s Office also anticipates a meaningful improvement in the national housing market by that time, further contributing to financial industry stability.
Table 11. Risks and Offsets to the City’s Revenue Projections ($ in millions)
FY 2013 FY 2014 FY 2015 FY 2016 Property ($13) $352 $576 $889 PIT 36 299 129 221 Business (12) (126) (68) (76) Sales 10 85 205 321 Real-Estate-Related 79 41 37 (59) Total $100 $651 $879 $1,296
SOURCE: NYC Office of Management and Budget and NYC Comptroller’s Office.
Miscellaneous Revenues
Miscellaneous revenues are non-tax revenues such as fees charged for licenses and franchises, charges for municipal services, fines, rental income, water and sewer revenues, interest income and non-recurring revenues deriving from asset sales, cash recoveries from litigation and audits and other one-time resources. In the FY 2013 Executive Budget, the City projects miscellaneous revenues will increase by $725 million to $5.68 billion (exclusive of private grants and intra-City revenues), a 14.6 percent increase over estimated FY 2012 collections. The net increase results primarily from an expected $1 billion in one-time revenues in FY 2013 generated from the sale of taxi medallions, first reflected in the November Plan.
The legislation which authorizes the City to issue up to 18,000 street hail licenses for livery cabs to service upper Manhattan and the outer boroughs also authorizes the City to issue 2,000 new wheelchair accessible taxi medallions. The legislation requires the Taxi and Limousine Commission (TLC) to develop a Disabled Accessibility Plan (DAP) which must be approved by the State Department of Transportation (DOT). In addition, the City must prepare and submit a hail market analysis to the City Council and to the State DOT for comments.
Although the City expects to realize the full $1 billion from the sale of the 2,000 additional medallions in FY 2013, a recent temporary restraining order on the State legislation authorizing the issuance of street hail livery cab licenses has placed the realization of this revenue in jeopardy. As discussed in “Risks and Offset” beginning on page 16, the temporary restraining order and subsequent hearings and potential appeals will likely delay any sale of livery cab street hail licenses beyond FY 2013. Because the issuance of the 2,000 taxi medallions is contingent upon the availability for purchase of livery cab street hail licenses, any delay in issuing street hail licenses will invariably delay the issuance of these medallions.

24
Table 12 presents all of the changes in the FY 2013 miscellaneous revenue estimates since the June 2011 Financial Plan. In June 2011, the City’s miscellaneous revenues projection for FY 2013 was $4.45 billion, or $1.2 billion below the current forecast. The expected proceeds from the sale of taxi medallions included in the “other miscellaneous” category account for almost all of the increase.
Table 12. Changes in FY 2013 Estimates May 2012 vs. June 2011
($ in millions) May
2012 June 2011 Change
Licenses, Franchises, Etc. $551 $529 $22 Interest Income 19 107 (88) Charges for Services 887 812 75 Water and Sewer Charges 1,514 1,419 95 Rental Income 280 256 24 Fines and Forfeitures 805 812 (7) Other Miscellaneous 1,626 519 1,107 Total $5,682 $4,454 $1,228
SOURCE: NYC Office of Management and Budget.
The City’s FY 2013 forecast for water and sewer charges increased by $95 million. However, the bulk of these revenues are reimbursements for expenses related to the provision of water and sewer services, and therefore, are not available for general operating purposes.
The current FY 2013 estimates for licenses and franchises, charges for services, and rental income also increased over the June 2011 Plan. The FY 2013 forecast for licenses and franchises increased by a net $22 million. The revision includes an expected $7.8 million in additional revenues from livery cab licenses, $4 million in additional cable franchise revenues and $3.5 million in revenues from building permits. Estimated revenues from charges for services increased by $75 million since the June 2011 Plan. The increase includes $42.9 million in additional revenues associated with tuition increases at CUNY, an additional $8.4 million in building inspection safety protocol revenues and $11 million in additional parking meter revenues. Projected rental income for FY 2013 increased by a net $24 million to reflect the City’s re-estimate of airport revenues.
Partially offsetting the above revisions is an $88 million decline in projected interest income for FY 2013. Interest income, which the City earns by investing funds from its cash balances, sales tax, and debt service accounts, is expected to total just $19 million in FY 2013. This forecast reflects the assumption that the federal funds rate will remain near zero until at least late CY 2014.
Projected FY 2013 revenues from fines and forfeitures declined by a net $7 million since the June 2011 Plan. Although the City increased projected revenues from civil penalties and other fines throughout the Plan period, the City’s projection for parking violation fine revenues decreased by nearly $30 million in FY 2013 and beyond, more than offsetting the upward revisions to other fine revenues. The decrease in

25
anticipated parking fine revenues is due to both the projected number as well as type of parking tickets expected to be issued in the next fiscal year.
Federal and State Aid
The FY 2013 Executive Budget includes $18 billion of Federal and State aid, supporting about 26 percent of the City’s expenditure budget. In comparison, in the current fiscal year Federal and State grants support about 28 percent of total spending. This decline is attributable both to the growth in the City’s expenditures as well as its more conservative assumptions of certain Federal aid in future years. Overall, about 83 percent of the City’s Federal and State aid receipts are in support of education and social services expenditures.
Since the June 2011 Plan, the City has recognized $529 million in additional intergovernmental aid–$206 million in additional Federal funds and $323 million in State aid. The majority of the increase in Federal grants was incorporated in the November Plan as re-categorized Medicaid reimbursement for early intervention and school health programs. Nearly half of the additional grants are reflected in education, attributable mainly to school aid appropriations enacted in the State budget for FY 2013. Foundation Aid for general school operations represents the single largest increase rising by $202 million since the June 2011 Plan. However, the full receipt of additional school aid could be jeopardized if the City and the teachers union cannot come to an agreement on a teacher evaluation system by January 2013, as ordered by the Governor. If the impasse persists, the Governor has threatened to withhold the State education aid increase and certain Federal aid to the City, which could pose a risk of about $300 million to the Department of Education budget in the 2012-13 school year.
The adopted State budget includes a measure to phase in a takeover of local Medicaid spending growth over a three-year period beginning in State FY 2014. Under the law, local Medicaid costs have been capped at a growth rate of 3.0 percent annually, with any additional costs above the cap assumed by the State. Beginning in April 2013, the State would incrementally reduce the cap by one percent each year over the phase-in period until it reaches zero. This action will have no impact on the City’s Federal and State aid assumptions since it would only reduce the City’s Medicaid payments to the State on the spending side. The savings would be a modest $11 million in FY 2013 but would grow significantly in the outyears of the Plan. The May Plan currently reflects baseline Medicaid savings ranging from $65 million in FY 2014 to $293 million in FY 2016, matching the State’s estimates for this action.
Over the outyears of the Plan, Federal and State aid are expected to grow moderately from $18 billion in FY 2013 to $19 billion in FY 2016, representing an average increase of about 1.8 percent annually. The growth stems primarily from the recognition of additional State education aid, given the more stable outlook in the State budget. However, even with this growth, the level of Federal and State support is projected to decline in the outyears as a percentage of the City’s expense budget. The May Plan projects Federal and State support would fall to 25.1 percent of overall spending in FY 2014, declining to 24.6 percent by FY 2016.

26
This page intentionally left blank
.

27
VI. Expenditure Analysis
All-funds expenditures in the FY 2013 Executive Budget total $68.717 billion, an increase of $1.093 billion from the revised FY 2012 level. However, as discussed in “The FY 2012 Budget,” the City expects to end FY 2012 with a budget surplus of $1.728 billion, of which all but $124 million will be used to provide budget relief in FY 2013 through the prepayment of debt service and advance subsidies to the libraries. The remaining $124 million will be used to provide budget relief for FY 2014. After adjusting for these actions, FY 2013 expenditures total $70.321 billion, an increase of $683 million, or 0.98 percent, from the adjusted FY 2012 estimate of $69.638 billion.
Over the Plan period, expenditures adjusted for prepayments and prior-year actions are projected to grow 9.6 percent, an annual average growth rate of 3.1 percent. However, the FYs 2013 and 2014 expenditures are reduced primarily through the utilization of one-time expenditure offsets such as the utilization of funds from the Retiree Health Benefits Trust. Adjusting for these one-time expenditure offsets, the growth of expenditures within the Plan period is actually 8.3 percent or 2.7 percent per year. As shown in Table 13, expenditure increases are driven by growth in spending on health insurance, debt service, and judgments and claims (J&C). The combined growth in these areas over the Financial Plan period is projected to be 23.8 percent, or 7.4 percent annually, more than three times the projected average annual inflation rate for this period. Spending in all other areas is projected to grow 4.8 percent over the Financial Plan period, an annual growth rate of 1.6 percent.
Table 13. FYs 2013 – 2016 Adjusted Expenditure Growth ($ in millions)
FY 2013 FY 2014 FY 2015 FY 2016 Growth
FYs 13─16 Annual Growth
Debt Service $6,130 $6,799 $7,172 $7,450 21.5% 6.7% Health Insurance 5,170 5,638 6,196 6,792 31.4% 9.5% Judgments and Claims 735 768 779 815 10.8% 3.5% Subtotal $12,035 $13,204 $14,147 $15,057 25.1% 7.8% Salaries and Wages $21,453 $21,677 $21,912 $22,274 3.8% 1.3% Pensions 8,020 8,056 7,960 8,040 0.3% 0.1% Other Fringe Benefits 3,207 3,325 3,367 3,443 7.3% 2.4% Medical Assistance 6,315 6,366 6,447 6,416 1.6% 0.5% Public Assistance 1,274 1,279 1,279 1,279 0.4% 0.1% Other OTPS 19,049 19,593 20,201 20,731 8.8% 2.9% Subtotal $59,318 $60,297 $61,165 $62,183 4.8% 1.6% MA FMAP Increase ($32) $0 $0 $0 (100.0%) (100.0%) Retiree Health Benefits Trust ($1,000) ($1,000) $0 $0 (100.0%) (100.0%) Total Expenditure $70,321 $72,501 $75,312 $77,240 9.8% 3.2%
Overtime
The City projects FY 2013 overtime expenditures of $1.045 billion, approximately $8 million higher than was estimated in the Preliminary Budget. The
28
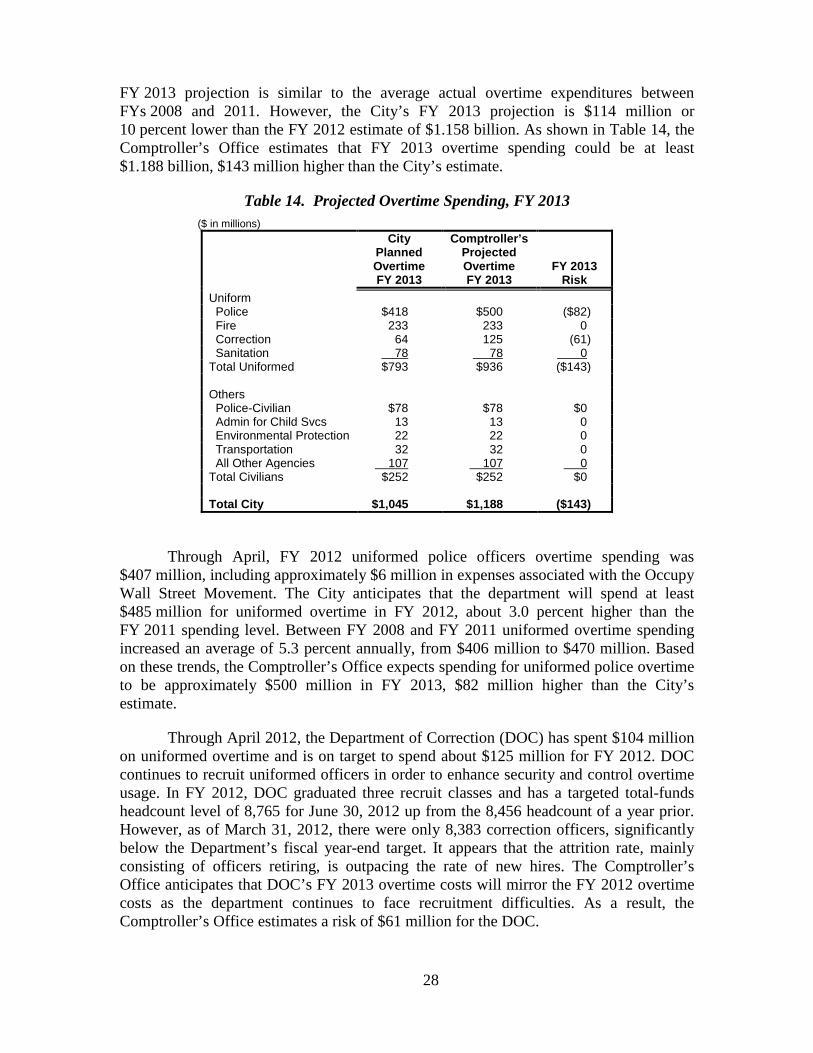
FY 2013 projection is similar to the average actual overtime expenditures between FYs 2008 and 2011. However, the City’s FY 2013 projection is $114 million or 10 percent lower than the FY 2012 estimate of $1.158 billion. As shown in Table 14, the Comptroller’s Office estimates that FY 2013 overtime spending could be at least $1.188 billion, $143 million higher than the City’s estimate.
Table 14. Projected Overtime Spending, FY 2013 ($ in millions)
City
Planned Overtime FY 2013
Comptroller’s Projected Overtime FY 2013
FY 2013 Risk
Uniform Police $418 $500 ($82) Fire 233 233 0 Correction 64 125 (61) Sanitation 78 78 0 Total Uniformed $793 $936 ($143) Others Police-Civilian $78 $78 $0 Admin for Child Svcs 13 13 0 Environmental Protection 22 22 0 Transportation 32 32 0 All Other Agencies 107 107 0 Total Civilians $252 $252 $0 Total City $1,045 $1,188 ($143)
Through April, FY 2012 uniformed police officers overtime spending was $407 million, including approximately $6 million in expenses associated with the Occupy Wall Street Movement. The City anticipates that the department will spend at least $485 million for uniformed overtime in FY 2012, about 3.0 percent higher than the FY 2011 spending level. Between FY 2008 and FY 2011 uniformed overtime spending increased an average of 5.3 percent annually, from $406 million to $470 million. Based on these trends, the Comptroller’s Office expects spending for uniformed police overtime to be approximately $500 million in FY 2013, $82 million higher than the City’s estimate.
Through April 2012, the Department of Correction (DOC) has spent $104 million on uniformed overtime and is on target to spend about $125 million for FY 2012. DOC continues to recruit uniformed officers in order to enhance security and control overtime usage. In FY 2012, DOC graduated three recruit classes and has a targeted total-funds headcount level of 8,765 for June 30, 2012 up from the 8,456 headcount of a year prior. However, as of March 31, 2012, there were only 8,383 correction officers, significantly below the Department’s fiscal year-end target. It appears that the attrition rate, mainly consisting of officers retiring, is outpacing the rate of new hires. The Comptroller’s Office anticipates that DOC’s FY 2013 overtime costs will mirror the FY 2012 overtime costs as the department continues to face recruitment difficulties. As a result, the Comptroller’s Office estimates a risk of $61 million for the DOC.
29
Headcount
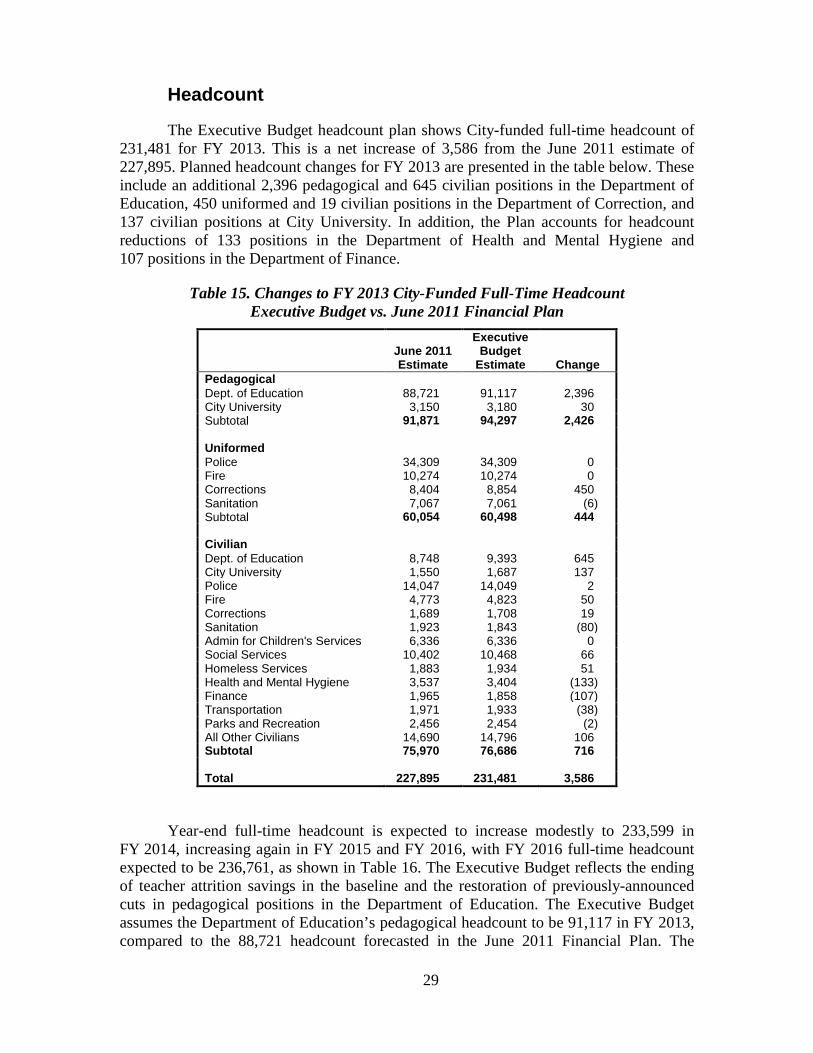
The Executive Budget headcount plan shows City-funded full-time headcount of 231,481 for FY 2013. This is a net increase of 3,586 from the June 2011 estimate of 227,895. Planned headcount changes for FY 2013 are presented in the table below. These include an additional 2,396 pedagogical and 645 civilian positions in the Department of Education, 450 uniformed and 19 civilian positions in the Department of Correction, and 137 civilian positions at City University. In addition, the Plan accounts for headcount reductions of 133 positions in the Department of Health and Mental Hygiene and 107 positions in the Department of Finance.
Table 15. Changes to FY 2013 City-Funded Full-Time Headcount Executive Budget vs. June 2011 Financial Plan
June 2011 Estimate
Executive Budget
Estimate Change Pedagogical Dept. of Education 88,721 91,117 2,396 City University 3,150 3,180 30 Subtotal 91,871 94,297 2,426 Uniformed Police 34,309 34,309 0 Fire 10,274 10,274 0 Corrections 8,404 8,854 450 Sanitation 7,067 7,061 (6) Subtotal 60,054 60,498 444 Civilian Dept. of Education 8,748 9,393 645 City University 1,550 1,687 137 Police 14,047 14,049 2 Fire 4,773 4,823 50 Corrections 1,689 1,708 19 Sanitation 1,923 1,843 (80) Admin for Children's Services 6,336 6,336 0 Social Services 10,402 10,468 66 Homeless Services 1,883 1,934 51 Health and Mental Hygiene 3,537 3,404 (133) Finance 1,965 1,858 (107) Transportation 1,971 1,933 (38) Parks and Recreation 2,456 2,454 (2) All Other Civilians 14,690 14,796 106 Subtotal 75,970 76,686 716 Total 227,895 231,481 3,586
Year-end full-time headcount is expected to increase modestly to 233,599 in FY 2014, increasing again in FY 2015 and FY 2016, with FY 2016 full-time headcount expected to be 236,761, as shown in Table 16. The Executive Budget reflects the ending of teacher attrition savings in the baseline and the restoration of previously-announced cuts in pedagogical positions in the Department of Education. The Executive Budget assumes the Department of Education’s pedagogical headcount to be 91,117 in FY 2013, compared to the 88,721 headcount forecasted in the June 2011 Financial Plan. The

30
Department’s pedagogical headcount is expected to rise to 92,809 in FY 2014, 94,530 in FY 2015 and 96,330 in FY 2016.
Table 16. City-Funded Full-Time Year-End Headcount Projections
FY 2013 FY 2014 FY 2015 FY 2016 Pedagogical Dept. of Education 91,117 92,809 94,530 96,330 City University 3,180 3,180 3,180 3,140 Subtotal 94,297 95,989 97,710 99,470 Uniformed Police 34,309 34,309 34,309 34,309 Fire 10,274 10,274 10,274 10,274 Corrections 8,854 8,854 8,646 8,646 Sanitation 7,061 7,243 7,235 7,235 Subtotal 60,498 60,680 60,464 60,464 Civilian Dept. of Education 9,393 9,387 9,389 9,390 City University 1,687 1,647 1,647 1,597 Police 14,049 14,047 14,047 14,047 Fire 4,823 4,808 4,796 4,796 Corrections 1,708 1,696 1,670 1,670 Sanitation 1,843 1,960 1,960 1,953 Admin for Children's Services 6,336 6,401 6,401 6,401 Social Services 10,468 10,407 10,404 10,404 Homeless Services 1,934 1,934 1,934 1,934 Health and Mental Hygiene 3,404 3,398 3,392 3,392 Finance 1,858 1,858 1,855 1,855 Transportation 1,933 2,065 2,065 2,065 Parks and Recreation 2,454 2,593 2,596 2,596 All Other Civilians 14,796 14,729 14,727 14,727 Subtotal 76,686 76,930 76,883 76,827 Total 231,481 233,599 235,057 236,761
As a result of current agency PEGs, the FY 2013 City-funded headcount is reduced by 1,182 in FY 2013 and 693 in FYs 2014 and 2015 from the June 2011 projections.6
As shown in Table 17, City-funded full-time equivalent (FTE) headcount is expected to total 22,570 in FY 2013. FTE headcount is projected to increase by 104 in FY 2014 and then remain relatively flat for the remainder of the Plan period.
The largest PEG-related headcount reduction for FY 2013 is in the Department of Sanitation, where PEG-related headcount changes for FY 2013 result in reductions of 357. Of this total, the reduction of 302 heads is attributable to the delay in opening four marine transfer stations with the remaining 49 due to the elimination of unfunded vacancies. However, 290 of the reductions attributable to the marine transfer stations privatizations are restored in each of the outyears, lowering the net headcount reductions for the Department of Sanitation to 12 for each of FYs 2014 and 2015; these reductions are due to labor concessions that were made in lieu of the privatization.
6 The June 2011 projections did not include an FY 2016 forecast.
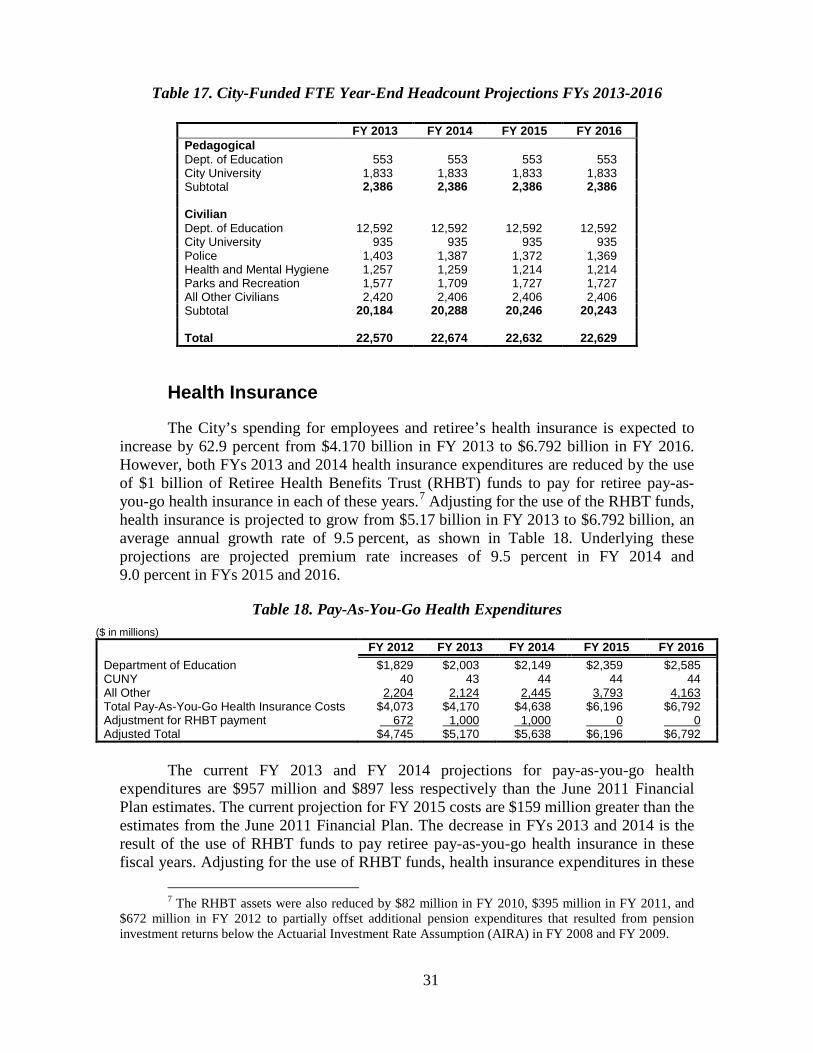
31
Table 17. City-Funded FTE Year-End Headcount Projections FYs 2013-2016
FY 2013 FY 2014 FY 2015 FY 2016 Pedagogical Dept. of Education 553 553 553 553 City University 1,833 1,833 1,833 1,833 Subtotal 2,386 2,386 2,386 2,386 Civilian Dept. of Education 12,592 12,592 12,592 12,592 City University 935 935 935 935 Police 1,403 1,387 1,372 1,369 Health and Mental Hygiene 1,257 1,259 1,214 1,214 Parks and Recreation 1,577 1,709 1,727 1,727 All Other Civilians 2,420 2,406 2,406 2,406 Subtotal 20,184 20,288 20,246 20,243 Total 22,570 22,674 22,632 22,629
Health Insurance
The City’s spending for employees and retiree’s health insurance is expected to increase by 62.9 percent from $4.170 billion in FY 2013 to $6.792 billion in FY 2016. However, both FYs 2013 and 2014 health insurance expenditures are reduced by the use of $1 billion of Retiree Health Benefits Trust (RHBT) funds to pay for retiree pay-as-you-go health insurance in each of these years.7
Table 18. Pay-As-You-Go Health Expenditures
Adjusting for the use of the RHBT funds, health insurance is projected to grow from $5.17 billion in FY 2013 to $6.792 billion, an average annual growth rate of 9.5 percent, as shown in Table 18. Underlying these projections are projected premium rate increases of 9.5 percent in FY 2014 and 9.0 percent in FYs 2015 and 2016.
($ in millions) FY 2012 FY 2013 FY 2014 FY 2015 FY 2016 Department of Education $1,829 $2,003 $2,149 $2,359 $2,585 CUNY 40 43 44 44 44 All Other 2,204 2,124 2,445 3,793 4,163 Total Pay-As-You-Go Health Insurance Costs $4,073 $4,170 $4,638 $6,196 $6,792 Adjustment for RHBT payment 672 1,000 1,000 0 0 Adjusted Total $4,745 $5,170 $5,638 $6,196 $6,792
The current FY 2013 and FY 2014 projections for pay-as-you-go health
expenditures are $957 million and $897 less respectively than the June 2011 Financial Plan estimates. The current projection for FY 2015 costs are $159 million greater than the estimates from the June 2011 Financial Plan. The decrease in FYs 2013 and 2014 is the result of the use of RHBT funds to pay retiree pay-as-you-go health insurance in these fiscal years. Adjusting for the use of RHBT funds, health insurance expenditures in these
7 The RHBT assets were also reduced by $82 million in FY 2010, $395 million in FY 2011, and
$672 million in FY 2012 to partially offset additional pension expenditures that resulted from pension investment returns below the Actuarial Investment Rate Assumption (AIRA) in FY 2008 and FY 2009.
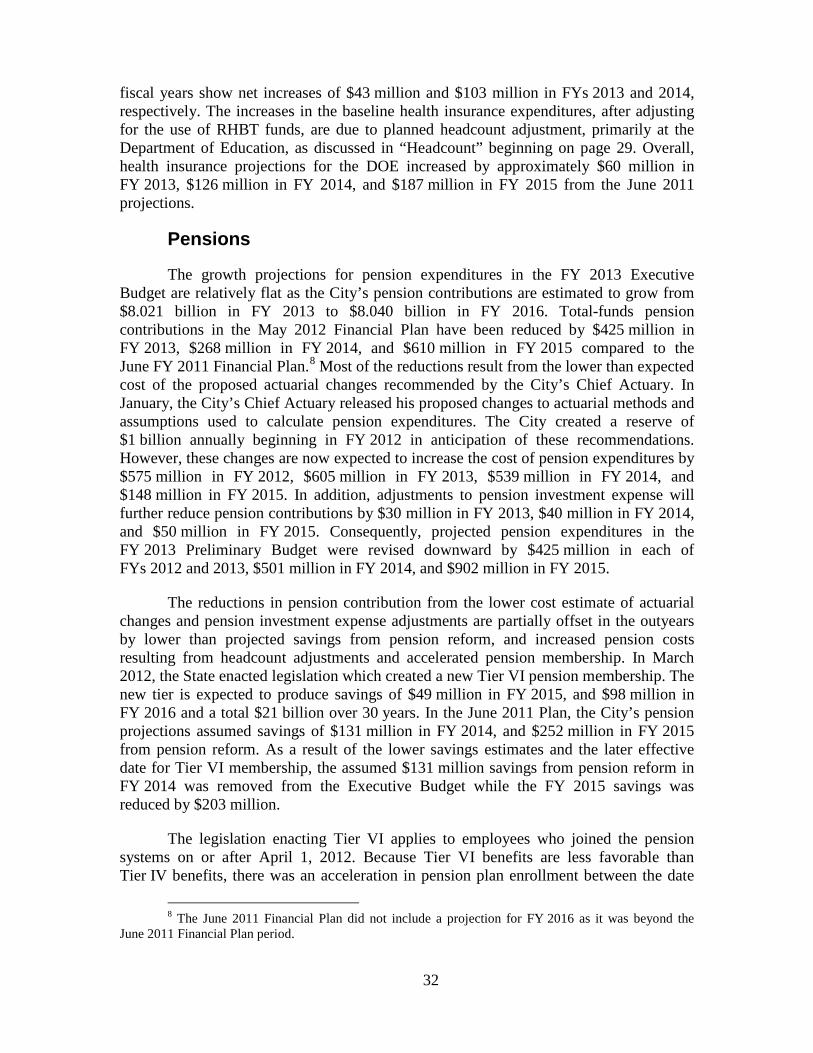
32
fiscal years show net increases of $43 million and $103 million in FYs 2013 and 2014, respectively. The increases in the baseline health insurance expenditures, after adjusting for the use of RHBT funds, are due to planned headcount adjustment, primarily at the Department of Education, as discussed in “Headcount” beginning on page 29. Overall, health insurance projections for the DOE increased by approximately $60 million in FY 2013, $126 million in FY 2014, and $187 million in FY 2015 from the June 2011 projections.
Pensions
The growth projections for pension expenditures in the FY 2013 Executive Budget are relatively flat as the City’s pension contributions are estimated to grow from $8.021 billion in FY 2013 to $8.040 billion in FY 2016. Total-funds pension contributions in the May 2012 Financial Plan have been reduced by $425 million in FY 2013, $268 million in FY 2014, and $610 million in FY 2015 compared to the June FY 2011 Financial Plan.8
The reductions in pension contribution from the lower cost estimate of actuarial changes and pension investment expense adjustments are partially offset in the outyears by lower than projected savings from pension reform, and increased pension costs resulting from headcount adjustments and accelerated pension membership. In March 2012, the State enacted legislation which created a new Tier VI pension membership. The new tier is expected to produce savings of $49 million in FY 2015, and $98 million in FY 2016 and a total $21 billion over 30 years. In the June 2011 Plan, the City’s pension projections assumed savings of $131 million in FY 2014, and $252 million in FY 2015 from pension reform. As a result of the lower savings estimates and the later effective date for Tier VI membership, the assumed $131 million savings from pension reform in FY 2014 was removed from the Executive Budget while the FY 2015 savings was reduced by $203 million.
Most of the reductions result from the lower than expected cost of the proposed actuarial changes recommended by the City’s Chief Actuary. In January, the City’s Chief Actuary released his proposed changes to actuarial methods and assumptions used to calculate pension expenditures. The City created a reserve of $1 billion annually beginning in FY 2012 in anticipation of these recommendations. However, these changes are now expected to increase the cost of pension expenditures by $575 million in FY 2012, $605 million in FY 2013, $539 million in FY 2014, and $148 million in FY 2015. In addition, adjustments to pension investment expense will further reduce pension contributions by $30 million in FY 2013, $40 million in FY 2014, and $50 million in FY 2015. Consequently, projected pension expenditures in the FY 2013 Preliminary Budget were revised downward by $425 million in each of FYs 2012 and 2013, $501 million in FY 2014, and $902 million in FY 2015.
The legislation enacting Tier VI applies to employees who joined the pension systems on or after April 1, 2012. Because Tier VI benefits are less favorable than Tier IV benefits, there was an acceleration in pension plan enrollment between the date
8 The June 2011 Financial Plan did not include a projection for FY 2016 as it was beyond the
June 2011 Financial Plan period.

33
the legislation was enacted and the April 1, 2012 effective date. The May 2012 Financial Plan includes an additional $48 million annually, beginning in FY 2014, to fund the expected increase in pension contributions from the acceleration in pension membership.
The pension contribution projections also reflect increases of $54 million in FY 2014 and $41 million in FY 2015 as a result of changes in planned headcount levels. As discussed in “Headcount” beginning on page 29, the increased headcount forecast results mainly from the reversal of planned headcount reductions at the DOE in the outyears.
Labor
Contract agreements from the last round of collective bargaining have expired for all but approximately 1.0 percent of municipal employees. By July 2012, if no new agreements are reached, all employees will be working without a contract. While there have been some discussions between the City and the major municipal unions little progress has been made in reaching a consensus. The City has proposed a five-year contract with wages freezes for the first three years and increases of 2.0 percent in each of the fourth and fifth years. This proposal mirrors the 2011 agreement between New York State and the Civil Service Employees Association.
Consistent with the City’s collective bargaining position, there are no funds in the May 2012 Financial Plan to provide wage increases for the first three-years of the new round of collective bargaining agreements. The Financial Plan includes funding in the labor reserve for annual wage increases of only 1.25 percent beginning in the fourth year and beyond for the new round of collective bargaining. Should the City settle contracts with the major municipal unions according to the proposed offer, it will cost an additional $16 million in FY 2013growing to $320 million by FY 2016. A full year 1.0 percent wage increase for all employees, including pensions, would cost approximately $300 million.
The New York State Public Employment Relations Board (PERB) has yet to appoint a fact-panel team to conduct hearings and make recommendations on wage increases for UFT members for the last round of collective bargaining agreements. The City continues to take the position that UFT and CSA members will receive zero wage increase for FYs 2010 – 2012. This is a departure from the agreements between the City and the other municipal unions which provided for two annual wage increases of 4.0 percent over the comparable periods of their contracts. PERB recommendations will not be binding. However, if wage increases granted to UFT and CSA members are similar to that gained by the other unions, it will cost the City approximately $2.595 billion in FY 2013, which includes $272 million, $626 million, and $800 million retroactive to FY 2010, FY 2011, and FY 2012, respectively, and $900 million annually beginning in FY 2014.9
9 The UFT and CSA contracts are one round behind settlements for the other unions.
34
Public Assistance
Through April 2012, the City’s public assistance caseload has averaged 351,120 recipients per month in the current fiscal year. The average monthly public assistance caseload in FY 2012 has increased only marginally over the same period in FY 2011. While the monthly caseload average reflects only a modest uptick, FY 2012 monthly public assistance expenditures have been on the decline, averaging approximately $104 million, almost 2.0 percent lower than the $106 million monthly average in the previous year. This expenditure trend is the continuation of a general decline that began in the latter half of FY 2011. From a historical perspective, the City’s public assistance caseload and spending are both ranging well below the peak experienced in 1995, prior to the implementation of Federal welfare reform.
The City’s public assistance caseload and grant projections have been revised in the Executive Budget to reflect recent trends. The Executive Budget now projects monthly caseloads will average 351,475 in the current fiscal year. Over the remainder of the May Plan period, the City maintains a constant average caseload projection of 352,956. Total baseline grants expenditures are projected at nearly $1.23 billion for FY 2012, rising to $1.26 billion in FY 2013 and $1.27 billion annually in FYs 2014 – 2016. To date, both caseload and grant projections appear to be in line with FY 2012 actuals and likewise the outyear projections are within reasonable range given recent trends.
Department of Education
The FY 2013 Executive Budget includes $19.71 billion of funding for the Department of Education (DOE), representing an increase of $387 million from the Fiscal 2012 estimate of $19.32 billion. City support constitutes nearly 47 percent, or $9.23 billion, of the Department’s FY 2013 operating budget, with the State contributing an additional 43 percent of the total. The remaining 10 percent of the DOE funding is comprised of Federal and other categorical grants. .
Compared with the June 2011 Plan, projected FY 2013 funding for the DOE has increased by $93 million. The net change consists of a decline of $219 million in City-funds, offset by increases of $250 million in State aid and $62 million in Federal and other categorical funding.
The decline in City-funds is attributable mainly to the gap-closing program reflected in the November Plan. The DOE’s PEG resulted in a reduction of $201 million in City spending primarily in relation to special education and non-personal services. The bulk of the planned PEG savings is the result of slower growth assumptions for special education pre-kindergarten and related services expenditures, enhanced State reimbursement for special education pre-kindergarten program and improved Medicaid collections. In addition, the Department also expects to achieve various efficiencies in facilities operations and leases. Unlike in previous years, the current round of gap-closing actions will not require layoffs of teachers and administrative personnel.

35
The $249 million increase in State aid for the DOE budget is consistent with projections in the enacted State Budget. Of this total, the Department has incorporated an additional $202 million in Foundation Aid for general school operations into its FY 2013 baseline assumptions. Other school aid increases include special education private excess cost/high cost aids, employment preparation aid and bilingual education aid. As detailed in the Executive Budget, the additional Foundation Aid has enabled the DOE to scale back its teacher attrition targets embedded in the FY 2013 baseline assumptions, restoring about 2,570 pedagogical positions, as well as rescinding cuts to per session programs. In addition, the Department has also identified about $60 million in administrative efficiencies and non-teacher excess attrition that would free up additional Foundation Aid for other areas of the budget.
The Department could face significant risks in its FY 2013 Medicaid revenue assumptions. After extensive delays in obtaining State approval to restart Medicaid reimbursement claims for special education services, the DOE resumed the projection of significant Medicaid revenue with an assumption of $117 million for FY 2012. DOE’s Medicaid revenue stream had been brought to a virtual halt after Federal audits found the Department had improperly billed for services dating back to 1993. For FY 2010 and FY 2011, the DOE reported Medicaid revenues of only $8.5 million and $17 million, respectively.
As of March 2012, only $28 million in claims had been submitted for Medicaid reimbursement, prompting the City to reduce the FY 2012 estimate by $80 million in the Executive Budget. However, Medicaid revenue projections for FY 2013 and beyond remain unchanged at $167 million annually. Given the claiming process has progressed much slower than anticipated in the current year, the Department could face shortfalls of up to $100 million in its Medicaid revenue assumptions beginning in FY 2013.
In a departure from recent financial plans, which held State education aid projections flat in future years, the May Plan shows yearly growth of between $265 million and $397 million in FYs 2014-2016. The majority of this increase is the result of assumed growth in Foundation Aid. Over the Plan period, Foundation Aid is projected to grow an average of 3.9 percent annually from $5.53 billion in FY 2013 to $6.19 billion in FY 2016. By the end of the Plan period, State support would comprise almost 44 percent of the overall DOE operating budget, compared to 43 percent in FY 2013. At the same time, City-funds would continue to support about 47 percent of DOE spending. The Department’s budget is expected to increase to $20.37 billion in FY 2014 and $20.96 billion in FY 2015, before reaching $21.60 billion in FY 2016. While recent developments support the steadier outlook on school aid, history shows that the State’s fiscal health will be the sole determining factor regardless of its commitment to boost future education funding to localities.
Health and Hospitals Corporation
On an accrual basis, the Health and Hospitals Corporation’s (HHC) projected deficit for FY 2013 in the May Plan, has increased by $414 million from the June 2011 estimate. The growing HHC deficit in FY 2013 is mainly attributable to a $314 million increase in non-cash other post-employment benefits (OPEB) costs recognized since the

36
June 2011 Plan. The balance of the increased deficit is attributable mainly to growth in other non-personal services costs, augmented by lower expectations of Federal and State support in the HHC gap-closing program. However, because a significant portion of the changes only affect HHC on an accrual basis, the Corporation’s projected FY 2013 closing cash balance has declined by only about $144 million since the June Plan to $331 million.
The Executive Budget projects that HHC’s deficit will be partly reduced by a $294 million gap-closing program, including $155 million in savings from the continuation of restructuring actions initiated in FY 2011. The restructuring plan mainly aims to reduce construction and maintenance personnel, outsource laboratory services, and streamline long term care services. The other initiatives in the gap-closing program include $125 million of unspecified Federal and State assistance and cost containment actions of $14 million.
The City projects HHC’s operating deficits rising from $1.23 billion in FY 2013 to $1.42 billion in FY 2014 before gap-closing actions. The Corporation is expected to face budget deficits of $1.56 billion and $1.69 billion in FY 2015 and FY 2016, respectively. Beginning in FY 2014 HHC’s gap-closing program to address these deficits will increase to $570 million and then to $879 million in FY 2015 and $983 million in FY 2016.
The larger gap-closing programs outlined for FYs 2014-2016 contain greater uncertainty as a result of their increasing reliance on Federal and State support. Between FY 2013 and FY 2016, Federal and State actions are scheduled to grow an average of $200 million annually from $125 million to $725 million. By FY 2016, Federal and State actions would constitute approximately 74 percent of HHC’s gap-closing program, compared to 43 percent in FY 2013. Consistent with these projections, the Corporation’s year-end cash balance is forecast to decline throughout the Plan, falling to $115 million in FY 2014 and $88 million in FY 2015 reaching $41 million by the end of the Plan period.
Debt Service
The City’s debt service projections adjusted for prepayments presented in the May 2012 Financial Plan remain relatively unchanged from the February Plan. Projections in all-funds debt service for FYs 2012, 2014 and 2015 have been increased by $9 million, $2 million, and $9 million, respectively, while projected debt service for FY 2013 has been decreased by $149 million. Compared with the June 2011 Financial Plan, projected debt service in the May 2012 Plan has decreased by $192 million in FY 2012, $524 million in FY 2013, $110 million in FY 2014, and $94 million in FY 2015.10
As shown in Table 19 on page 37, debt service, after adjusting for prepayments, is projected to grow by $1.83 billion, or 32 percent from $5.69 billion in FY 2012 to
10 Debt service projections in the June 2011 Financial Plan did not extend beyond FY 2015.

37
$7.53 billion in FY 2016. General Obligation (GO) debt service is forecast to increase by $847 million, or 22 percent from FY 2012 to FY 2016. The Plan assumes an increase of $903 million for servicing NYCTFA PIT bond debt over the same period, an increase of 59 percent.
Table 19. Debt Service FYs 2012 – 2016 ($ in millions)
Debt Service Category
FY 2012
FY 2013
FY 2014
FY 2015
FY 2016
Change FYs 2012 –
2016 G.O.a $3,860 $4,081 $4,451 $4,619 $4,707 $847 NYCTFAb 1,522 1,732 2,027 2,240 2,425 903 Lease- Purchase Debt
241
316
321
313
319
78
TSASC,Inc. 71 74 74 74 74 3 Total $5,694 $6,203 $6,873 $7,246 $7,525 $1,831 SOURCE: FY 2013 Executive Budget, May 2012, Office of Management & Budget. NOTE: Debt service is adjusted for prepayments. a – Includes long-term GO debt service and interest on short-term notes. b – Amounts do not include NYCTFA Building Aid Revenue Bonds (BARBs).
The $192 million decrease in the FY 2012 debt service estimate since
the June 2011 Plan is the result of a $147 million decrease in GO and lease-purchase debt service, a $43 million decrease in NYCTFA debt service, and a $3 million decrease in projected TSASC debt service. The projected $147 million of GO savings is derived from: 1) $60 million of savings from interest rate swap agreements; 2) $54 million in variable rate interest savings; and 3) $39 million of Dormitory Authority Courts and Hudson Yards Infrastructure (HYIC) debt service savings.11
The decrease of $524 million in FY 2013 debt service estimate from the June 2011 Plan is comprised of $386 million of GO and lease-purchase debt savings and approximately $138 million of NYCTFA savings. Estimated GO savings result from: 1) $147 million of refunding savings transacted in FY 2012; 2) $74 million in lower interest rate projections for VRDB debt in FY 2013; 3) Approximately $60 million from lower rates on borrowings in FY 2012; 4) $57 million in lower short-term note interest rate assumptions; and 5) $23 million in lease-purchase debt service savings.
NYCTFA savings in FY 2012 of $43 million are primarily from year-to-date variable rate demand bond (VRDB) savings.
Estimated NYCTFA savings of $138 million in FY 2013 are derived primarily from: 1) $50 million from refunding transactions; 2) $50 million in changed VRDB rate assumptions; and 3) approximately $27 million in savings from lowered borrowing rates in FY 2012 and sundry baseline changes since the June 2011 Financial Plan.
Reductions in GO debt service estimates of $74 million and $86 million for FYs 2014 and FY 2015, respectively, are the result of favorable GO borrowings in the
11 The $60 million forecast decrease is on the expense side of the budget. Swap receipts are also
forecast to decline by $76 million from the June 2011 Plan. The two elements combined result in a Swap expense estimate of $47 million and receipt forecast of $44.9 million in FY 2012.

38
first-half of FY 2012 and from the lowering of long-term interest rates in the February Plan.12 In addition, the May Plan reduced GO borrowing by $800 million in FY 2013 resulting in savings in these years as well. These estimated savings are offset by the conformance of Qualified School Construction Bonds (QSCBs) to current Federal legislative authorization.13
Projected NYCTFA debt service savings of $23 million in FY 2014, and debt service increase of $5 million in FY 2015 are primarily the result of savings from better than expected interest rates from FY 2012 borrowings to date along with lowered assumed interest rates in FYs 2012 and 2013 offset significantly by the May Plan’s increase of the NYCTFA borrowing amount by an additional $900 million in FY 2013.
Debt Affordability
Debt burden and affordability are issues a municipality must evaluate as part of its long-term planning. One accepted measure of affordability is debt service as a percentage of local tax revenues.14 As shown in Chart 2, adjusted for prepayments, the City’s debt service as a percentage of tax revenues is projected to be 13.5 percent in FY 2012, increasing to 14.2 percent in FY 2013, 15.2 percent in FY 2014, 15.3 percent in FY 2015, and 15.4 percent by FY 2016.15
12 In the February Plan long-term interests rates were reduced from 7.0 percent to 5.0 percent in
FY 2012 and from 7.0 percent to 6.25 percent in FY 2013.
Debt service is projected to grow at an average rate of 7.2 percent per year from FY 2012 to FY 2016, outpacing projected tax revenue growth of 3.9 percent per year over the same period. Over the longer term, debt service growth is expected to slow during FYs 2015 – 2021, reflecting the decline in the City’s capital cash need forecast. The slower growth helps stabilize the ratio at about 14 percent by FY 2022. Outyear forecasts, however, are subject to change and factors such as scope changes, capital project delays, and cost overruns can oftentimes lead to higher estimates.
13 Qualified School Construction Bonds (QSCB) are authorized by the federal government through the American Recovery and Reinvestment Act (ARRA) of 2009. The bonds provide an interest subsidy to issuers in order to significantly reduce the cost of borrowing for public school through the issuance of Qualified School Construction Bonds.
14 Debt service in this analysis is all funds debt service and is comprised of GO, lease-purchase, PIT-supported NYCTFA, and TSASC debt service.
15 Debt service is adjusted for prepayments. Prior-year prepayments are added back to the total and current year planned prepayments are subtracted from the total.
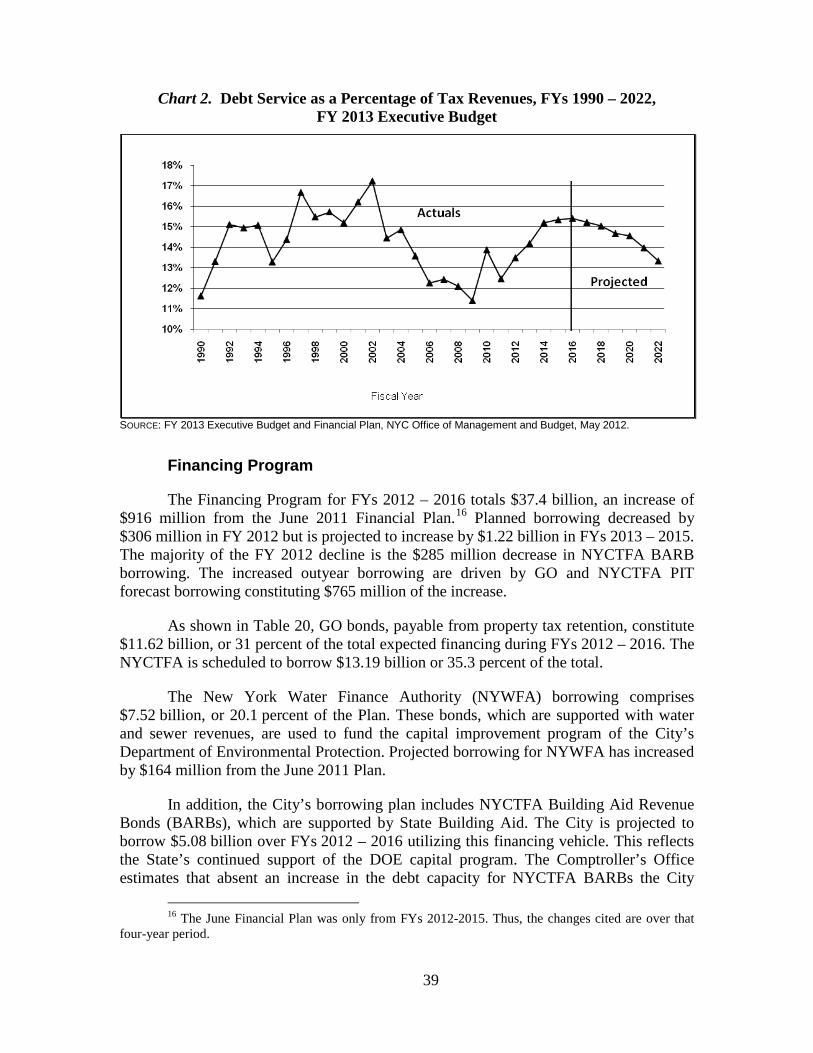
39
Chart 2. Debt Service as a Percentage of Tax Revenues, FYs 1990 – 2022, FY 2013 Executive Budget
SOURCE: FY 2013 Executive Budget and Financial Plan, NYC Office of Management and Budget, May 2012.
Financing Program
The Financing Program for FYs 2012 – 2016 totals $37.4 billion, an increase of $916 million from the June 2011 Financial Plan.16
As shown in Table 20, GO bonds, payable from property tax retention, constitute $11.62 billion, or 31 percent of the total expected financing during FYs 2012 – 2016. The NYCTFA is scheduled to borrow $13.19 billion or 35.3 percent of the total.
Planned borrowing decreased by $306 million in FY 2012 but is projected to increase by $1.22 billion in FYs 2013 – 2015. The majority of the FY 2012 decline is the $285 million decrease in NYCTFA BARB borrowing. The increased outyear borrowing are driven by GO and NYCTFA PIT forecast borrowing constituting $765 million of the increase.
The New York Water Finance Authority (NYWFA) borrowing comprises $7.52 billion, or 20.1 percent of the Plan. These bonds, which are supported with water and sewer revenues, are used to fund the capital improvement program of the City’s Department of Environmental Protection. Projected borrowing for NYWFA has increased by $164 million from the June 2011 Plan.
In addition, the City’s borrowing plan includes NYCTFA Building Aid Revenue Bonds (BARBs), which are supported by State Building Aid. The City is projected to borrow $5.08 billion over FYs 2012 – 2016 utilizing this financing vehicle. This reflects the State’s continued support of the DOE capital program. The Comptroller’s Office estimates that absent an increase in the debt capacity for NYCTFA BARBs the City
16 The June Financial Plan was only from FYs 2012-2015. Thus, the changes cited are over that
four-year period.

40
would no longer be able to issue such debt by the end of FY 2016. Current estimates suggest that the City would reach the State-legislated limit of $9.4 billion near the close of FY 2016.
Table 20. FYs 2012 – 2016 Financing Program ($ in millions)
Type of Debt FY 2012 FY 2013 FY 2014 FY 2015 FY 2016 Total GO $2,725 $1,700 $2,600 $2,430 $2,160 $11,615 NYCTFA PIT Bonds 2,600 3,400 2,600 2,430 2,160 13,190 Water Authority Bonds 2,041 1,710 1,446 1,176 1,148 7,521 NYCTFA BARBs 650 1,350 1,104 1,033 939 5,076 Total $8,016 $8,160 $7,750 $7,069 $6,407 $37,402 SOURCE: FY 2013 Executive Budget, May 2012, Office of Management and Budget. Note: NYCTFA BARBs are supported by State Building Aid and its debt service is not included in the debt service budget but supports the Non-city funded capital plan.
Capital Plan
The May 2012 Executive Capital Commitment Plan for FYs 2012 – 2016 totals $39.52 billion of which $31.45 billion is City-funded.17
Table 21. FYs 2012 – 2016 Capital Commitments, All-Funds
After accounting for the $1.92 billion reserve for unattained commitments, total planned commitments are $37.6 billion while City-funds commitments are estimated to be $29.54 billion. The Plan continues to be front-loaded with just over 54 percent of both total and City commitments for FYs 2012 – 2016 planned for FYs 2012 and 2013.
($ in millions)
Project Category
May 2012-2016 Commitment
Plan Percent of
Total Education & CUNY $10,733 27.2% Environmental Protection 8,749 22.1 Dept. of Transportation & Mass Transit* 5,413 13.7 Housing and Economic Development 3,549 9.0 Administration of Justice 1,865 4.7 Technology and Citywide Equipment 2,057 5.2 Department of Parks and Recreation 1,643 4.2 Hospitals 757 1.9 Other City Operations and Facilities 4,752 12.0 Total $39,518 100.0% Reserve for Unattained Commitments ($1,916) N/A Adjusted Total *- Includes all DOT project types
$37,602 N/A
SOURCE: Office of Management and Budget, Capital Commitment Plan Executive Budget FY 2013, May 2012.
Consistent with prior plans, capital commitments in DOE and the City University of New York (CUNY), the Department of Environmental Protection (DEP), Department
17 City-funds, for capital commitment purposes include DEP capital commitments which are
financed by the Water Finance Authority.
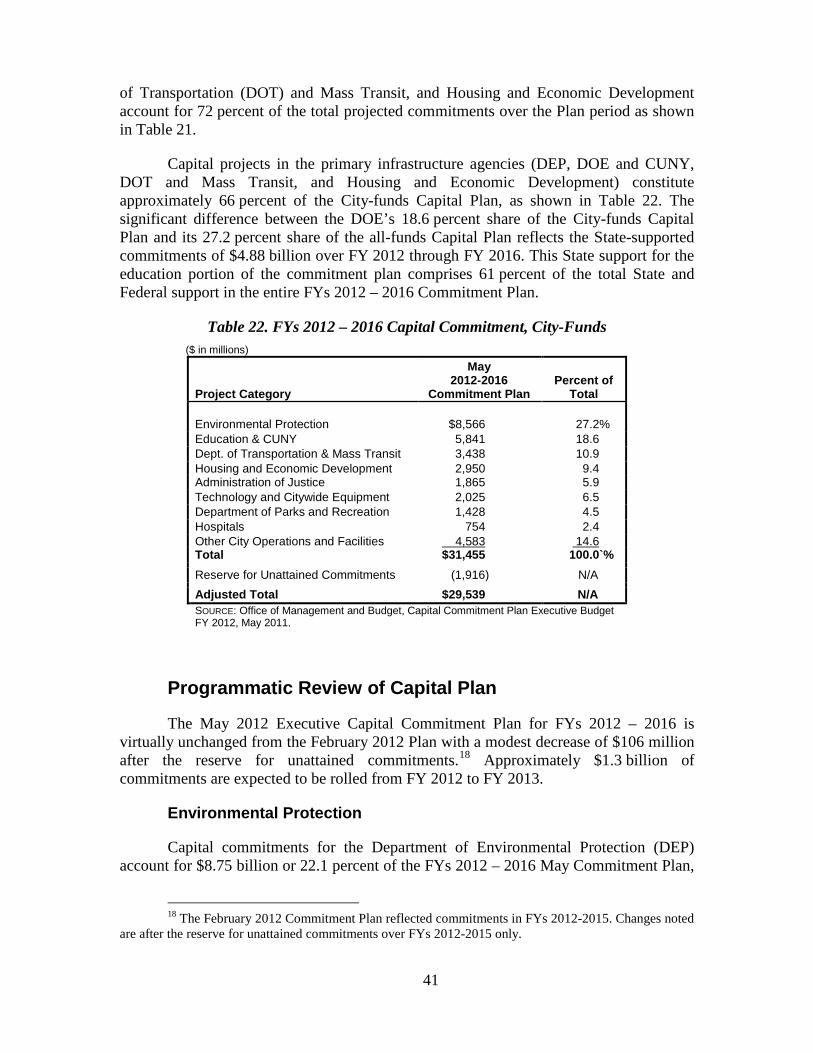
41
of Transportation (DOT) and Mass Transit, and Housing and Economic Development account for 72 percent of the total projected commitments over the Plan period as shown in Table 21.
Capital projects in the primary infrastructure agencies (DEP, DOE and CUNY, DOT and Mass Transit, and Housing and Economic Development) constitute approximately 66 percent of the City-funds Capital Plan, as shown in Table 22. The significant difference between the DOE’s 18.6 percent share of the City-funds Capital Plan and its 27.2 percent share of the all-funds Capital Plan reflects the State-supported commitments of $4.88 billion over FY 2012 through FY 2016. This State support for the education portion of the commitment plan comprises 61 percent of the total State and Federal support in the entire FYs 2012 – 2016 Commitment Plan.
Table 22. FYs 2012 – 2016 Capital Commitment, City-Funds ($ in millions)
Project Category
May 2012-2016
Commitment Plan Percent of
Total Environmental Protection $8,566 27.2% Education & CUNY 5,841 18.6 Dept. of Transportation & Mass Transit 3,438 10.9 Housing and Economic Development 2,950 9.4 Administration of Justice 1,865 5.9 Technology and Citywide Equipment 2,025 6.5 Department of Parks and Recreation 1,428 4.5 Hospitals 754 2.4 Other City Operations and Facilities 4,583 14.6 Total $31,455 100.0`% Reserve for Unattained Commitments (1,916) N/A Adjusted Total $29,539 N/A SOURCE: Office of Management and Budget, Capital Commitment Plan Executive Budget FY 2012, May 2011.
Programmatic Review of Capital Plan
The May 2012 Executive Capital Commitment Plan for FYs 2012 – 2016 is virtually unchanged from the February 2012 Plan with a modest decrease of $106 million after the reserve for unattained commitments.18
Environmental Protection
Approximately $1.3 billion of commitments are expected to be rolled from FY 2012 to FY 2013.
Capital commitments for the Department of Environmental Protection (DEP) account for $8.75 billion or 22.1 percent of the FYs 2012 – 2016 May Commitment Plan,
18 The February 2012 Commitment Plan reflected commitments in FYs 2012-2015. Changes noted
are after the reserve for unattained commitments over FYs 2012-2015 only.
42
as shown in Chart 3 on page 43. Some of the major planned commitments include $1.2 billion for the construction of a bypass for the Rondout-West Branch tunnel to address a leakage problem from the Delaware Aqueduct, $1.2 billion for the continuation of the operational integrity of the existing wastewater treatment facilities, $1 billion for the extension and reconstruction of 170 miles of sewers citywide, $810 million for the replacement and extension of about 254 miles of trunk and distribution of water mains citywide, $71 million for the Staten Island Bluebelt program, and $166 million for Green Infrastructure initiatives to address combined sewer overflow issues. In addition, $479 million is budgeted for traditional grey infrastructure to meet Combined Sewer Overflow (CSO) challenges, $358 million for the reconstruction of roads, dams and bridges (including $161 million for the reconstruction of the Gilboa Dam in the Catskill watershed region), and $378 million for the continuation of the City Water Tunnel No. 3 project.
Education
The May Capital Commitment Plan includes $10.73 billion in FYs 2012 – 2016 for capital projects related to education. This represents 27.2 percent of the total citywide planned commitments, as depicted in Chart 3. The current Plan includes $10.42 billion of commitments for the DOE, and $309 million for the City University of New York (CUNY). Highlights of the current DOE capital plan include planned contract registrations of $4.5 billion for the construction of approximately 34,000 seats across 71 buildings in a combination of new facilities, expansions or leases. In addition, $2.6 billion is dedicated for the Capital Improvement Program which includes exterior and interior building upgrades and other needed capital repairs. The May Plan also includes $2 billion for mandated programs such as building remediation and building code compliance projects and $1.6 billion for Children First Initiatives to improve existing facilities to optimize the physical plant to better serve instructional needs.
The CUNY capital plan of $309 million is primarily dedicated to the upgrade and maintenance of the community college physical facilities. This includes such projects as the rehabilitation and replacement of electrical systems at Queensborough Community College, mechanical systems at the Hunter Campus schools and Kingborough community college, and a green roof initiative at the Borough of Manhattan Community College.
Transportation
The transportation portion of the Capital Plan is composed of two types of projects: projects for mass transit administered by the Metropolitan Transportation Authority (MTA) on behalf of New York City Transit; and the Highways and Bridges program, which is administered by the Department of Transportation (DOT).
The May Plan for FYs 2012 – 2016 contains $4.82 billion for the DOT capital program and $594 million in capital commitments for mass transit projects. As illustrated in Chart 3, this program area makes up 13.7 percent of the May Commitment Plan.
Over 12 percent, or $4.82 billion, of the May Capital Plan for FYs 2012 – 2016 is allocated for street resurfacing, highway reconstruction, and bridge rehabilitation projects

43
managed by the City’s DOT. Highlights of the DOT plan include over $1.1 billion for the rehabilitation and reconstruction of 24 bridge structures rated “Poor” and “Fair”, $540 million for street and arterial resurfacing projects, and $309 million of ferry boat replacements or reconstructions.
Planned Commitments of $354 million for mass transit in FYs 2012 and 2013 account for 60 percent of the five-year total. City support to the MTA for capital work at New York City Transit (NYCT) constitutes a small portion of the NYCT’s overall capital program, which exceeds $11.6 billion. MTA bonds and other federal grants support a significant portion of its capital needs. Although the current Plan reverses a period of decreased support for NYCT during the period of FYs 2006-2010, it still remains below the nearly $280 million per year average seen in FYs 1989 – 2005.
Chart 3. May 2012 Capital Plan Total Funds, FYs 2012– 2016, Shares of $39.518 Billion
SOURCE: Capital Commitment Plan Executive Budget FY 2013, NYC Office of Management and Budget, May 2012.
Housing and Economic Development
Housing and economic development projects account for $3.55 billion, or 9.0 percent, of all planned capital commitments from FY 2012 to FY 2016. Of this total, $2.07 billion, or 5.2 percent, are commitments for housing related projects.19
19 Housing capital commitments are comprised of Commitments for HPD and NYCHA projects.
The primary objective of the City’s capital housing program is the preservation of existing affordable housing through assistance to private owners to avoid abandonment. Other program areas in housing are low-income rental programs and supportive housing, and a variety of loan

44
programs which allow owners of private properties to renovate buildings through the use of low-interest loan programs. Through various new construction initiatives, the Department of Housing, Preservation and Development (HPD) plans to produce in excess of 15,000 units over the Plan period in a broad array of housing options. In addition, $154 million is dedicated to the capital maintenance of existing New York City Housing Authority (NYCHA) housing.
Capital commitments for economic development total $1.48 billion, or 3.7 percent of total capital commitments over the Plan period. Major elements of the Plan include $154 million for acquisition and infrastructure improvements at Willets Point, $258 million at Governor’s Island for the rehabilitation of existing structures, and upgrades to basic infrastructure to facilitate future development on the island, $111 million for development and infrastructure improvements at the Brooklyn Navy Yard industrial park, and $100 million for the development of the new Applied Sciences campus on Roosevelt Island.
Administration of Justice
Commitments under the category of administration of justice include capital projects in the Department of Correction, the Police Department, and Courts administration. In the May 2012 Commitment Plan, $1.86 billion, or 4.7 percent of the total Five-Year Plan are allocated for projects in these agencies.
Estimated commitments in the Police Department total $529 million. Major projects for the Police Department include $133 million for the construction, rehabilitation, maintenance, relocation, and security of police facilities citywide, $229 million for a variety of police communication systems and computer equipment, and $36 million for the design and construction of the first phase of a new police academy.
Capital commitments in the Department of Correction total $1.05 billion over FYs 2012 – 2016. Major projects undertaken by DOC are capacity replacement initiatives including $593 million for a new detention center on Rikers Island, $34 million for the re-construction of the Brooklyn Detention Center, and $52 million for heating, ventilation systems at various facilities.
Court facilities projects total $281 million over FYs 2012 – 2016. Highlights of the Plan include $27 million for the continuation of a new court facility on Staten Island, $51 million for improvements to the court facility at 60 Centre Street in Manhattan, and $27 million for improvements to 100 Centre Street in Manhattan.
Other City Operations and Facilities
Capital projects designated as City Operations include projects for the Department of Sanitation, the Fire Department, the Department of Parks, public buildings, the Department of Information Technology and Telecommunications (DOITT), public libraries and cultural institutions, and hospitals. Over 23 percent, or $9.21 billion of the May Commitment Plan, is allocated for City Operations.
45
The Department of Parks and Recreation capital plan totals $1.64 billion for FYs 2012 – 2016. The Parks’ capital plan is heavily front-loaded with $1.05 billion, or 64 percent of the total commitments, scheduled for FY 2012. Major projects over FYs 2013 – 2016 include $55 million for acquisition and development of open space at Greenpoint and Williamsburg waterfronts, $15 million for the continuation of a project for a new park in Fresh Kills Landfill on Staten Island, $113 million for tree plantings on streets and parks citywide and $67 million for the Brooklyn Bridge Park Master Plan.
About $905 million, or 2.3 percent, of the FYs 2012 – 2016 Plan is allocated for computer equipment purchases and installation related to DOITT. The single largest project of this type in the Plan is the approximately $608 million planned for the emergency communications transformation program (ECTP) and facilities.
The capital program for the Department of Sanitation comprises 3.3 percent of total commitments and amounts to a projected $1.3 billion over FYs 2012 – 2016. Major components of the Sanitation plan over FYs 2013 – 2016 include $476 million for the reconstruction of marine transfer stations citywide and other facilities in accordance with the City’s Solid Waste Management Plan, and $404 million for vehicle replacements.
The May 2012 commitment plan contains $488 million for public libraries. Highlights of the capital program for libraries include $268 million in funding for the New York Public Library, $134 million for the Queens Public Library, $67 million for the Brooklyn Public Library, and $19 million for the Research Libraries over FYs 2012 – 2016.
The Department of Cultural Affairs (DCA) capital plan totals $690 million for FYs 2012 – 2016, or 1.7 percent of total commitments. Projects include $33 million for renovations at Carnegie Hall, $12 million for renovations to the Cooper Hewitt Museum in Manhattan, $9.6 million for renovations and improvements at the Staten Island Historical Society, and $3.5 million for the Caribbean Cultural Center in Manhattan.
For the FYs 2012 – 2016 Plan period, over $1.15 billion is allocated for citywide equipment purchases, administered by DCAS. This includes $368 million for energy efficiency projects and building retrofits.
Public works projects, also administered primarily by DCAS, typically involve the rehabilitation of City-owned office space, the renovation of leased space, compliance with legal mandates and correction of unsafe conditions. The May Plan contains $986 million for this work; including $319 million in improvements to public buildings citywide, $161 million for the improvement, reconstruction, or modernization of long-term leased facilities citywide, and $53 million for other legal mandates in public buildings, including fire alarm and sprinkler systems.

46
The May Commitment Plan for HHC totals $757 million, or 1.9 percent of total estimated capital commitments. Major projects include $264 million for the consolidation and relocation of the long-term acute care beds and nursing facility beds from the Coler & Goldwater Campus to North General Hospital in Harlem and $36 million for the modernization and rehabilitation of Harlem Hospital.
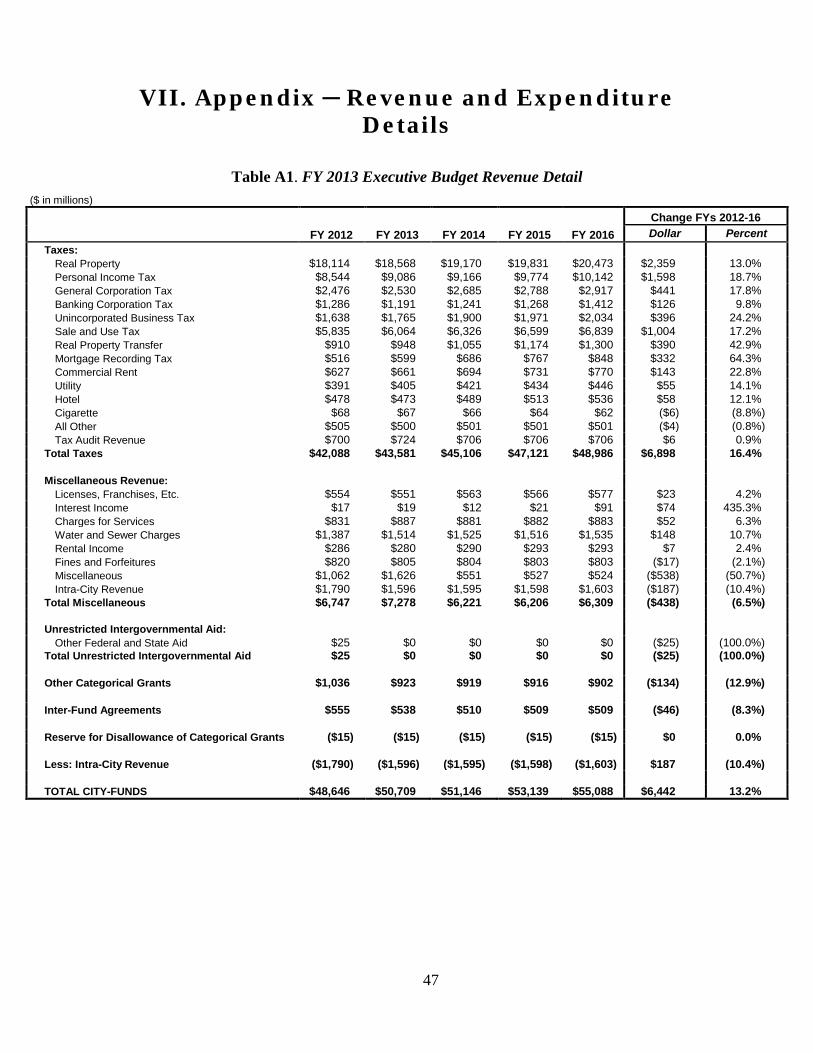
47
VII. Appendix ─ Revenue and Expenditure Details
Table A1. FY 2013 Executive Budget Revenue Detail ($ in millions)
FY 2012 FY 2013 FY 2014 FY 2015 FY 2016 Change FYs 2012-16 Dollar Percent
Taxes:
Real Property $18,114 $18,568 $19,170 $19,831 $20,473 $2,359 13.0%
Personal Income Tax $8,544 $9,086 $9,166 $9,774 $10,142 $1,598 18.7% General Corporation Tax $2,476 $2,530 $2,685 $2,788 $2,917 $441 17.8% Banking Corporation Tax $1,286 $1,191 $1,241 $1,268 $1,412 $126 9.8% Unincorporated Business Tax $1,638 $1,765 $1,900 $1,971 $2,034 $396 24.2% Sale and Use Tax $5,835 $6,064 $6,326 $6,599 $6,839 $1,004 17.2% Real Property Transfer $910 $948 $1,055 $1,174 $1,300 $390 42.9% Mortgage Recording Tax $516 $599 $686 $767 $848 $332 64.3% Commercial Rent $627 $661 $694 $731 $770 $143 22.8% Utility $391 $405 $421 $434 $446 $55 14.1% Hotel $478 $473 $489 $513 $536 $58 12.1% Cigarette $68 $67 $66 $64 $62 ($6) (8.8%) All Other $505 $500 $501 $501 $501 ($4) (0.8%) Tax Audit Revenue $700 $724 $706 $706 $706 $6 0.9%
Total Taxes $42,088 $43,581 $45,106 $47,121 $48,986 $6,898 16.4%
Miscellaneous Revenue:
Licenses, Franchises, Etc. $554 $551 $563 $566 $577 $23 4.2%
Interest Income $17 $19 $12 $21 $91 $74 435.3% Charges for Services $831 $887 $881 $882 $883 $52 6.3% Water and Sewer Charges $1,387 $1,514 $1,525 $1,516 $1,535 $148 10.7% Rental Income $286 $280 $290 $293 $293 $7 2.4% Fines and Forfeitures $820 $805 $804 $803 $803 ($17) (2.1%) Miscellaneous $1,062 $1,626 $551 $527 $524 ($538) (50.7%) Intra-City Revenue $1,790 $1,596 $1,595 $1,598 $1,603 ($187) (10.4%)
Total Miscellaneous $6,747 $7,278 $6,221 $6,206 $6,309 ($438) (6.5%)
Unrestricted Intergovernmental Aid:
Other Federal and State Aid $25 $0 $0 $0 $0 ($25) (100.0%)
Total Unrestricted Intergovernmental Aid $25 $0 $0 $0 $0 ($25) (100.0%)
Other Categorical Grants $1,036 $923 $919 $916 $902 ($134) (12.9%)
Inter-Fund Agreements $555 $538 $510 $509 $509 ($46) (8.3%)
Reserve for Disallowance of Categorical Grants ($15) ($15) ($15) ($15) ($15) $0 0.0%
Less: Intra-City Revenue ($1,790) ($1,596) ($1,595) ($1,598) ($1,603) $187 (10.4%)
TOTAL CITY-FUNDS $48,646 $50,709 $51,146 $53,139 $55,088 $6,442 13.2%

48
Table A1 (Con’t). FY 2013 Executive Budget Revenue Detail
($ in millions)
FY 2016 Changes FYs 2012-16
FY 2012 FY 2013 FY 2014 FY 2015 Dollar Percent Federal Categorical Grants: Community Development $255 $226 $219 $219 $219 ($36) (14.1%) Welfare $3,279 $3,074 $3,063 $3,063 $3,063 ($216) (6.6%) Education $1,928 $1,942 $1,932 $1,857 $1,856 ($72) (3.7%) Other $2,204 $1,353 $1,259 $1,234 $1,234 ($970) (44.0%) Total Federal Grants $7,666 $6,595 $6,473 $6,373 $6,372 ($1,294) (16.9%) State Categorical Grants Social Services $1,540 $1,413 $1,412 $1,412 $1,412 ($128) (8.3%) Education $8,120 $8,436 $8,701 $9,033 $9,429 $1,309 16.1% Higher Education $214 $235 $235 $235 $235 $21 9.8% Department of Health and Mental Hygiene $571 $531 $529 $529 $529 ($42) (7.4%) Other $867 $798 $836 $910 $1,023 $156 18.0% Total State Grants $11,312 $11,413 $11,713 $12,119 $12,628 $1,316 11.6% TOTAL REVENUES $67,624 $68,717 $69,332 $71,631 $74,088 $6,464 9.6%
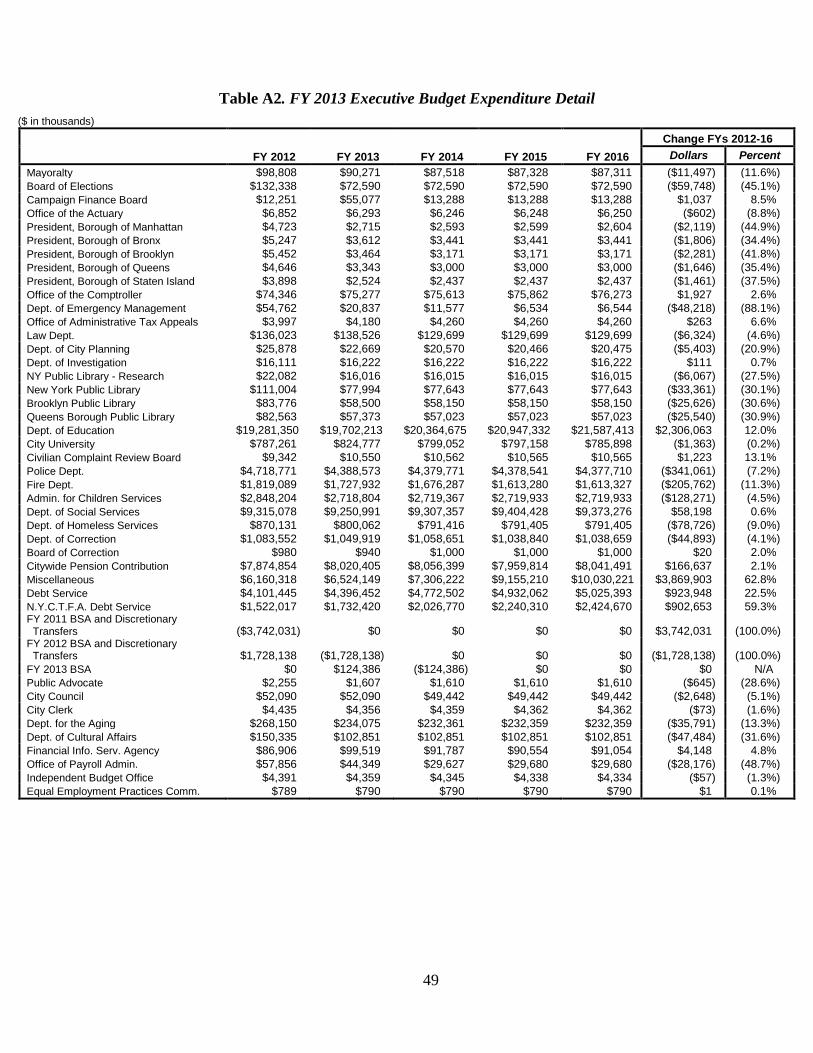
49
Table A2. FY 2013 Executive Budget Expenditure Detail ($ in thousands)
FY 2012 FY 2013 FY 2014 FY 2015 FY 2016
Change FYs 2012-16 Dollars Percent
Mayoralty $98,808 $90,271 $87,518 $87,328 $87,311 ($11,497) (11.6%) Board of Elections $132,338 $72,590 $72,590 $72,590 $72,590 ($59,748) (45.1%) Campaign Finance Board $12,251 $55,077 $13,288 $13,288 $13,288 $1,037 8.5% Office of the Actuary $6,852 $6,293 $6,246 $6,248 $6,250 ($602) (8.8%) President, Borough of Manhattan $4,723 $2,715 $2,593 $2,599 $2,604 ($2,119) (44.9%) President, Borough of Bronx $5,247 $3,612 $3,441 $3,441 $3,441 ($1,806) (34.4%) President, Borough of Brooklyn $5,452 $3,464 $3,171 $3,171 $3,171 ($2,281) (41.8%) President, Borough of Queens $4,646 $3,343 $3,000 $3,000 $3,000 ($1,646) (35.4%) President, Borough of Staten Island $3,898 $2,524 $2,437 $2,437 $2,437 ($1,461) (37.5%) Office of the Comptroller $74,346 $75,277 $75,613 $75,862 $76,273 $1,927 2.6% Dept. of Emergency Management $54,762 $20,837 $11,577 $6,534 $6,544 ($48,218) (88.1%) Office of Administrative Tax Appeals $3,997 $4,180 $4,260 $4,260 $4,260 $263 6.6% Law Dept. $136,023 $138,526 $129,699 $129,699 $129,699 ($6,324) (4.6%) Dept. of City Planning $25,878 $22,669 $20,570 $20,466 $20,475 ($5,403) (20.9%) Dept. of Investigation $16,111 $16,222 $16,222 $16,222 $16,222 $111 0.7% NY Public Library - Research $22,082 $16,016 $16,015 $16,015 $16,015 ($6,067) (27.5%) New York Public Library $111,004 $77,994 $77,643 $77,643 $77,643 ($33,361) (30.1%) Brooklyn Public Library $83,776 $58,500 $58,150 $58,150 $58,150 ($25,626) (30.6%) Queens Borough Public Library $82,563 $57,373 $57,023 $57,023 $57,023 ($25,540) (30.9%) Dept. of Education $19,281,350 $19,702,213 $20,364,675 $20,947,332 $21,587,413 $2,306,063 12.0% City University $787,261 $824,777 $799,052 $797,158 $785,898 ($1,363) (0.2%) Civilian Complaint Review Board $9,342 $10,550 $10,562 $10,565 $10,565 $1,223 13.1% Police Dept. $4,718,771 $4,388,573 $4,379,771 $4,378,541 $4,377,710 ($341,061) (7.2%) Fire Dept. $1,819,089 $1,727,932 $1,676,287 $1,613,280 $1,613,327 ($205,762) (11.3%) Admin. for Children Services $2,848,204 $2,718,804 $2,719,367 $2,719,933 $2,719,933 ($128,271) (4.5%) Dept. of Social Services $9,315,078 $9,250,991 $9,307,357 $9,404,428 $9,373,276 $58,198 0.6% Dept. of Homeless Services $870,131 $800,062 $791,416 $791,405 $791,405 ($78,726) (9.0%) Dept. of Correction $1,083,552 $1,049,919 $1,058,651 $1,038,840 $1,038,659 ($44,893) (4.1%) Board of Correction $980 $940 $1,000 $1,000 $1,000 $20 2.0% Citywide Pension Contribution $7,874,854 $8,020,405 $8,056,399 $7,959,814 $8,041,491 $166,637 2.1% Miscellaneous $6,160,318 $6,524,149 $7,306,222 $9,155,210 $10,030,221 $3,869,903 62.8% Debt Service $4,101,445 $4,396,452 $4,772,502 $4,932,062 $5,025,393 $923,948 22.5% N.Y.C.T.F.A. Debt Service $1,522,017 $1,732,420 $2,026,770 $2,240,310 $2,424,670 $902,653 59.3% FY 2011 BSA and Discretionary Transfers ($3,742,031) $0 $0 $0 $0 $3,742,031 (100.0%) FY 2012 BSA and Discretionary Transfers $1,728,138 ($1,728,138) $0 $0 $0 ($1,728,138) (100.0%) FY 2013 BSA $0 $124,386 ($124,386) $0 $0 $0 N/A Public Advocate $2,255 $1,607 $1,610 $1,610 $1,610 ($645) (28.6%) City Council $52,090 $52,090 $49,442 $49,442 $49,442 ($2,648) (5.1%) City Clerk $4,435 $4,356 $4,359 $4,362 $4,362 ($73) (1.6%) Dept. for the Aging $268,150 $234,075 $232,361 $232,359 $232,359 ($35,791) (13.3%) Dept. of Cultural Affairs $150,335 $102,851 $102,851 $102,851 $102,851 ($47,484) (31.6%) Financial Info. Serv. Agency $86,906 $99,519 $91,787 $90,554 $91,054 $4,148 4.8% Office of Payroll Admin. $57,856 $44,349 $29,627 $29,680 $29,680 ($28,176) (48.7%) Independent Budget Office $4,391 $4,359 $4,345 $4,338 $4,334 ($57) (1.3%) Equal Employment Practices Comm. $789 $790 $790 $790 $790 $1 0.1%
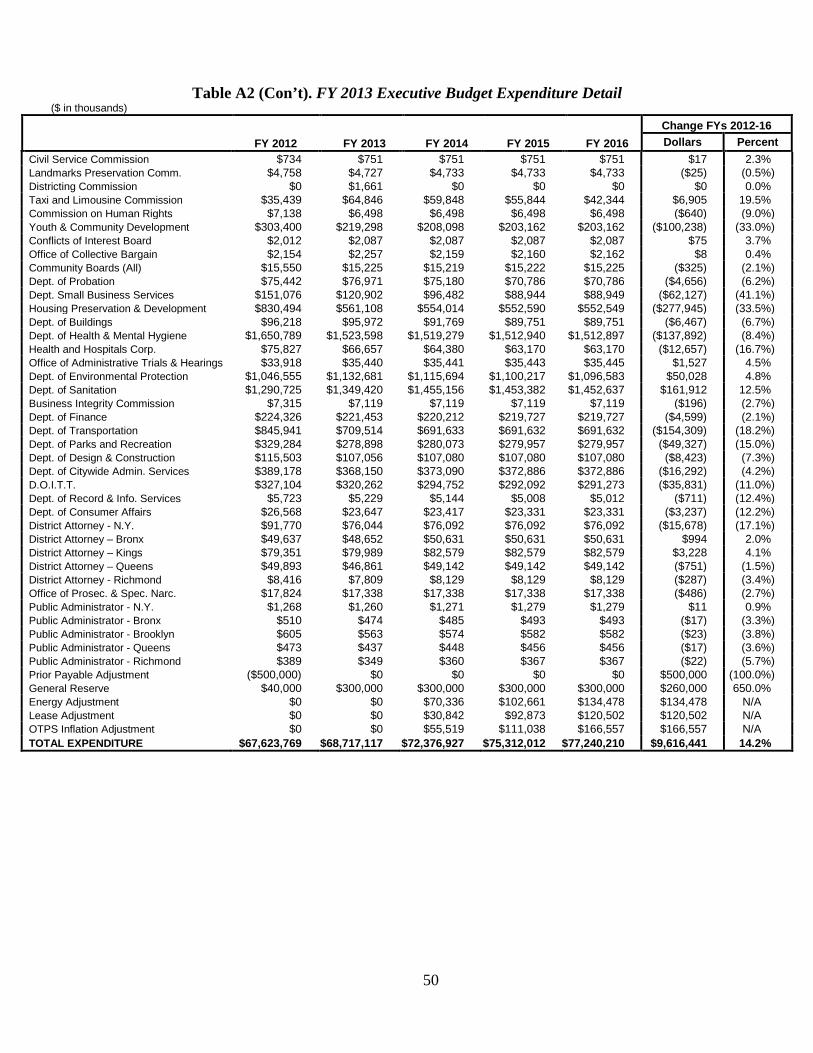
50
Table A2 (Con’t). FY 2013 Executive Budget Expenditure Detail ($ in thousands)
FY 2012 FY 2013 FY 2014 FY 2015 FY 2016
Change FYs 2012-16 Dollars Percent
Civil Service Commission $734 $751 $751 $751 $751 $17 2.3% Landmarks Preservation Comm. $4,758 $4,727 $4,733 $4,733 $4,733 ($25) (0.5%) Districting Commission $0 $1,661 $0 $0 $0 $0 0.0% Taxi and Limousine Commission $35,439 $64,846 $59,848 $55,844 $42,344 $6,905 19.5% Commission on Human Rights $7,138 $6,498 $6,498 $6,498 $6,498 ($640) (9.0%) Youth & Community Development $303,400 $219,298 $208,098 $203,162 $203,162 ($100,238) (33.0%) Conflicts of Interest Board $2,012 $2,087 $2,087 $2,087 $2,087 $75 3.7% Office of Collective Bargain $2,154 $2,257 $2,159 $2,160 $2,162 $8 0.4% Community Boards (All) $15,550 $15,225 $15,219 $15,222 $15,225 ($325) (2.1%) Dept. of Probation $75,442 $76,971 $75,180 $70,786 $70,786 ($4,656) (6.2%) Dept. Small Business Services $151,076 $120,902 $96,482 $88,944 $88,949 ($62,127) (41.1%) Housing Preservation & Development $830,494 $561,108 $554,014 $552,590 $552,549 ($277,945) (33.5%) Dept. of Buildings $96,218 $95,972 $91,769 $89,751 $89,751 ($6,467) (6.7%) Dept. of Health & Mental Hygiene $1,650,789 $1,523,598 $1,519,279 $1,512,940 $1,512,897 ($137,892) (8.4%) Health and Hospitals Corp. $75,827 $66,657 $64,380 $63,170 $63,170 ($12,657) (16.7%) Office of Administrative Trials & Hearings $33,918 $35,440 $35,441 $35,443 $35,445 $1,527 4.5% Dept. of Environmental Protection $1,046,555 $1,132,681 $1,115,694 $1,100,217 $1,096,583 $50,028 4.8% Dept. of Sanitation $1,290,725 $1,349,420 $1,455,156 $1,453,382 $1,452,637 $161,912 12.5% Business Integrity Commission $7,315 $7,119 $7,119 $7,119 $7,119 ($196) (2.7%) Dept. of Finance $224,326 $221,453 $220,212 $219,727 $219,727 ($4,599) (2.1%) Dept. of Transportation $845,941 $709,514 $691,633 $691,632 $691,632 ($154,309) (18.2%) Dept. of Parks and Recreation $329,284 $278,898 $280,073 $279,957 $279,957 ($49,327) (15.0%) Dept. of Design & Construction $115,503 $107,056 $107,080 $107,080 $107,080 ($8,423) (7.3%) Dept. of Citywide Admin. Services $389,178 $368,150 $373,090 $372,886 $372,886 ($16,292) (4.2%) D.O.I.T.T. $327,104 $320,262 $294,752 $292,092 $291,273 ($35,831) (11.0%) Dept. of Record & Info. Services $5,723 $5,229 $5,144 $5,008 $5,012 ($711) (12.4%) Dept. of Consumer Affairs $26,568 $23,647 $23,417 $23,331 $23,331 ($3,237) (12.2%) District Attorney - N.Y. $91,770 $76,044 $76,092 $76,092 $76,092 ($15,678) (17.1%) District Attorney – Bronx $49,637 $48,652 $50,631 $50,631 $50,631 $994 2.0% District Attorney – Kings $79,351 $79,989 $82,579 $82,579 $82,579 $3,228 4.1% District Attorney – Queens $49,893 $46,861 $49,142 $49,142 $49,142 ($751) (1.5%) District Attorney - Richmond $8,416 $7,809 $8,129 $8,129 $8,129 ($287) (3.4%) Office of Prosec. & Spec. Narc. $17,824 $17,338 $17,338 $17,338 $17,338 ($486) (2.7%) Public Administrator - N.Y. $1,268 $1,260 $1,271 $1,279 $1,279 $11 0.9% Public Administrator - Bronx $510 $474 $485 $493 $493 ($17) (3.3%) Public Administrator - Brooklyn $605 $563 $574 $582 $582 ($23) (3.8%) Public Administrator - Queens $473 $437 $448 $456 $456 ($17) (3.6%) Public Administrator - Richmond $389 $349 $360 $367 $367 ($22) (5.7%) Prior Payable Adjustment ($500,000) $0 $0 $0 $0 $500,000 (100.0%) General Reserve $40,000 $300,000 $300,000 $300,000 $300,000 $260,000 650.0% Energy Adjustment $0 $0 $70,336 $102,661 $134,478 $134,478 N/A Lease Adjustment $0 $0 $30,842 $92,873 $120,502 $120,502 N/A OTPS Inflation Adjustment $0 $0 $55,519 $111,038 $166,557 $166,557 N/A TOTAL EXPENDITURE $67,623,769 $68,717,117 $72,376,927 $75,312,012 $77,240,210 $9,616,441 14.2%

51
Glossary of Acronyms
AIRA Actuarial Investment Rate Assumption
ARRA American Recovery and Reinvestment Act
BARB Building Aid Revenue Bond
BCT Banking Corporation Tax
BSA Budget Stabilization Account
CSA Council of School Supervisors and Administrators
CSO Combined Sewer Overflow
CUNY City University of New York
CY Calendar Year
DCA Department of Cultural Affairs
DEP Department of Environmental Protection
DOC Department of Correction
DOE Department of Education
DOITT Department of Information Technology and Telecommunications
DOT Department of Transportation
ECB European Central Bank

52
FMAP Federal Medical Assistance Percentage
FTE Full-Time Equivalent
FY Fiscal Year
GCP Gross City Product
GCT General Corporation Tax
GDP Gross Domestic Product
GO Debt General Obligation Debt
HHC Health and Hospitals Corporation
HPD Housing Preservation and Development
HYIC Hudson Yards Infrastructure Corporation
J&C Judgments and Claims
MTA Metropolitan Transportation Authority
NYC New York City
NYCHA New York City Housing Authority
NYCT New York City Transit
NYCTFA New York City Transitional Finance Authority
NYWFA New York Water Finance Authority

53
OPEB Other Post-Employment Benefits
OTPS Other than Personal Services
PERB Public Employment Relations Board
PEG Program to Eliminate the Gap
PIT Personal Income Tax
PS Personal Services
QSCB Qualified School Construction Bonds
RHBT Retiree Health Benefits Trust
SAIC Science Applications International Corporation
TLC Taxi and Limousine Commission
UBT Unincorporated Business Tax
UFT United Federation of Teachers
U.S. United States
VRDB Variable Rate Demand Bond