Embed Size (px)
Citation preview

COMM 250 Agenda - Week 12
Housekeeping
• RP2 Due Wed.
• RAT 5 – Wed. (FBK 12, 13)
Lecture
• Experiments
• Descriptive and Inferential Statistics

In-Class Team Exercise # 8 – (Review)
First Do as Individuals, then produce a Team Version:
1) Design a Factorial Experiment to answer these questions:Which can be read faster on a web site - plain text (plain black letters on a white
background, no links) or text supplemented in some way?
What other variables might affect a user’s ability to read text? (Name 3 and then Choose one for Step 2)
2) Draw a table of the design - at least 3 levels of one variable, 2 of another (you choose the second IV)
• Label the 2 IVs and Label Their Levels
3) Write out 2 Hypotheses (H1, H2):• One Predicting Effects of IV 1, the other the Effects of IV 2
4) Declare the DV (It is in your H1, H2)
5) List Two (“People”) Variable you Should “Control for”

Statistics
Why Study Statistics ? Integral to the “Scientific Method” Seeing the Forest Amid the Trees
Describing (Sports Statistics) Inferring (Correlates of Cancer) Predicting (Science, Business)
To Pursue an ‘Objective’ View

Statistics
Descriptive Statistics: a way to summarize data
Inferential Statistics: strategies for estimating population
characteristics from data gathered on a sample

Descriptive Statistics
Measures of Central Tendency Used to describe similarities among scores What number best describes the entire
distribution?
Measures of Dispersion Used to describe differences among scores How much do scores vary?

Descriptive Statistics
Measures of Central Tendency
Mean The Average Medium The Middle Score Mode The Most Common Score

Measures of Dispersion
• Range The Highest & Lowest Scores
Variance A Measure Of Dispersion Equal To The
Average Distance Of The Scores, Squared, From The Mean Of All Scores, Divided By N
Standard Deviation The Square Root Of The Variance
(Dispersion About The Mean, Based In The Original Units)

Inferential Statistics
Used For -
Estimation To Extrapolate from a Sample to a
Population
Significance Testing• To Determine the Importance of
Observed Differences; e.g., Between Groups or Variables

Using Inferential Statistics for EstimationPurpose To Estimate (Extrapolate) from a Sample (Statistic)
to a Population (Parameter)
Reason Why It Saves Time and Money (Don’t Have to Survey/Measure the
Entire Population)
A Statistic Measure of a Sample (E.g., Comm250) on Some Variable
E.g., Average (Mean) Height of Comm250 Students
A Parameter A Characteristic of a Population (E.g., Virginia)
E.g., Average (Mean) Height of Residents of VA

Inferential Statistics
Note: When Statistics are Used for Estimation, this is the “Heart” of Using Statistics to Infer -
Statistic Measure of a Sample (E.g., HSers taking SAT in ‘02) on
Some VariableE.g., Average (Mean) SAT score in 2002E.g., Average (Mean) SAT score Among GMU Freshmen
Parameter A Characteristic of a Population (E.g., All HSers Who Have
Taken the SAT)
E.g., Average (Mean) SAT Across ALL HSers (50 years?)

Parametric & Non-Parametric
Parametric Statistics • Stats Used to Establish Attributes of a
Population Based on Attributes of a Sample
Non-Parametric Statistics Stats Used ONLY to Describe The Attributes
of a Sample No Generalization Back to Its Population is
Attempted

Inferential Statistics
Estimation of Population Parameters Assumes: A Normal Distribution
“Bell-Shaped Curve” Most Variables ARE Normally Distributed
A Random Sample Unless Some Form of Random Sampling is
Used, the Sample Will NOT be “Representative” of the Population (to Which One Wishes to Generalize)

Significance Testing
Analyzing Sample Data To Test Hypotheses About Populations
• By Convention, There are Always Two H:• The Null (H0: No Differences)
• The Experimental (H1: Differences Exist)
Hypotheses One-Tailed = Directional Two-Tailed = 2-Directional (Non-Directional)
Testing The Null Hypothesis
Set The Significance Level
Compute The Calculated Value
Compare This To The Critical Value Needed To Reject The Null

Testing Differences
Nominal Data: Chi Square Test
Ordinal Data: Median Test
Interval Data T-Test, ANOVA, & Ratio Data: Regression

Types of Variables
Definition: “Concepts that take on 2 or more values”
• Nominal = Equal Groupings• (Gender, Race, Political Party)
• Ordered = Some Priority or Rank• Ordinal
• Rank Order: (Hottest Days, Top Ten)
• Interval• Equal Intervals: (Temp., IQ, Scale from 1-7)
• Ratio• Interval, with a “True” Zero (Weight; Height)

t-Test and ANOVA
The t-test 2 independent samples (groups) Are the samples different ? A Different Online Example to Try
Analysis of Variance (ANOVA) 2 or more levels of a (Discrete) IV Often Multiple IVs; Single DV Factorial Designs Main Effects; Interactions
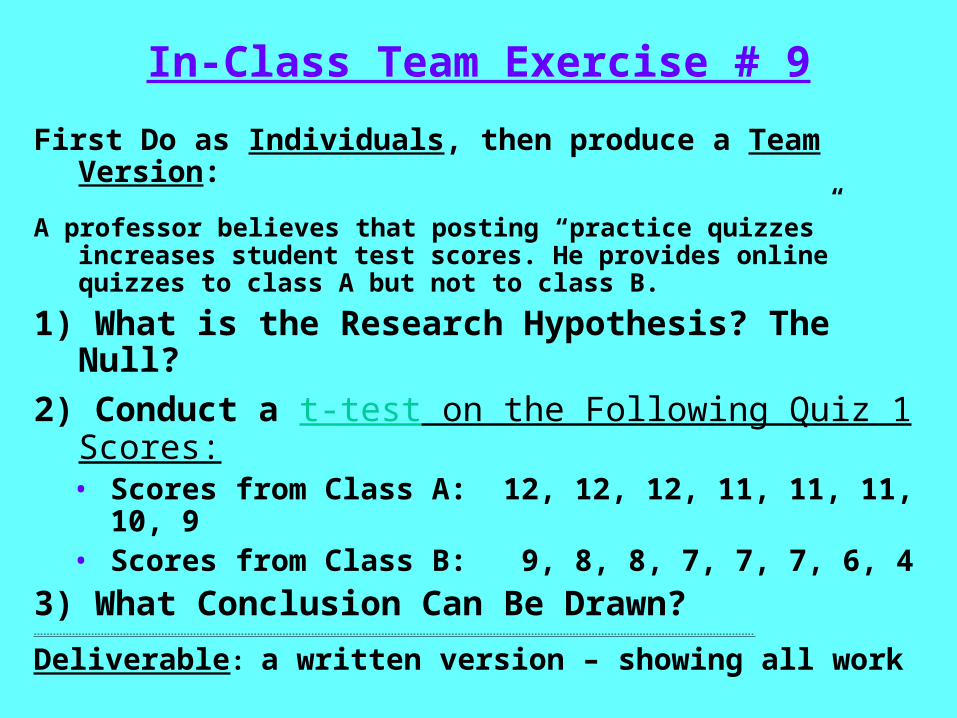
In-Class Team Exercise # 9
First Do as Individuals, then produce a Team Version:
A professor believes that posting “practice quizzes” increases student test scores. He provides online quizzes to class A but not to class B.
1) What is the Research Hypothesis? The Null?2) Conduct a t-test on the Following Quiz 1
Scores:• Scores from Class A: 12, 12, 12, 11, 11, 11, 10, 9• Scores from Class B: 9, 8, 8, 7, 7, 7, 6, 4
3) What Conclusion Can Be Drawn?----------------------------------------------------------------------------------------------------------------------------------------------------------------------------------------------------------------------------------
Deliverable: a written version – showing all work

Review of: In-Class Team Exercise # 9
The answers are on the link on the previous page, or click on this link for answers.--------------------------------------------------------------------------------------------------------------------------------------------------------------------------------------------------------------------------------
You will be required to do a similar problem
(a t-test and the accompanying questions)
on P-RAT 6 and in-class RAT 5.----------------------------------------------------------------------------------------------------------------------------------------------------------------------------------------------------------------------------------

In-Class Team Exercise # 10Produce a Team Version only:How does talking on a cell phone affect driving?
Design a 3 x 2 Factorial Experiment (draw a Table)You Must Use These IVs:• Level of Driving Experience (Pick 3 Levels)
• Type of Distraction (Pick 3: Cell Phone, Changing CDs, You choose #3)
Write out 2 Hypotheses (H1, H2):• Your DV should be: MPH deviation from the average speed
on the road
• One Predicting the Effects of Driving Experience• One Predicting Differences Due to Type of Distraction
Label the 2 IVs and Label Their LevelsList Two Other Variables you Should “Control for”


![Guideline Report Writing RP2[1]](https://img.pdfslide.us/doc/110x75/577ccd751a28ab9e788c6cd3/guideline-report-writing-rp21.jpg)