Embed Size (px)
Citation preview
Adv. Space Res. Vol. 5, No. 12, pp.95—104. 1985. 0273—1177/85 $0.00 + .50
Printed in Great Britain. All rights reserved, Copyright © COSPAR
COMET HALLEY: NUCLEUS AND JETS (RESULTSOF THE VEGA MISSION)
R. Z. Sagdeev,*G. A. Avanesov,* I. V. Barinov,* A. I. Debabov,*V. A. Kvasikov,* V. I. Moroz,* V. A. Shamis,~V. I. Tarnapolski,*D. A. Usikov,* Ya. L. Ziman,* B. S. Zhukov,* F. Szabo,** K. SzegO,**B. A. Smith,** t A. Kondor,** S. Larson,** :1 E. Merényi,** L. Szabo,**I. Toth,~’”L. Värha1mi,~~P. Cruvellier,*** A. Abergel,***J.-L. Bertaux,*** J. E. Blamont,*** M. Danz,t D. Mohlmann,tH. Stillert andH. P. Zapfet*Space ResearchInstitute, Profsoyuznaya84/32, 117810 Moscow, GSP-7, U.S.S.R.* * Central ResearchInstitutefor Physics, P.O. Box 49, H-1525 Budapest, Hungary** *Serviced’Aeronomie Spatiale CNRS, 13012 Marseille, France
tSpaceResearchInstitute, Berlin, G.D.R.~Also Lunar and Planetary Laboratory, University of Arizona, Tucson, AZ, U.S.A.
ABSTRACT
rhe VEGA—i and VEGA—2spacecraft made their closest approach to Comet Halleyon 6 and 9 March, respectively. In this paper those results of the onboardimaging experiment which were obtained around closest approach arediscussed. The nucleus of the comet was clearly identifiable as anirregularly shaped object, with overall dimensions of (16±i)x(8±i)x(8±1) km.The nucleus rotates in the prograde sense about an axis nearly perpendicularto the orbital plane with a period of 53±2 hours. Its albedo is only 0.04±~~Many of the jet features observed during the second fly—by have beenspatially reconstructed. Their sources form a quasi—linear structure on thesurface. The dust above the surface is shown to be generally optically thinwith the exception of certain specific dust jets. Brightness features on thesurface are clearly seen. Correlating our data with other measurements, weconclude that the dirty snow—ball model will probably need to be revised.
INTRODUCTI ON
One of the main scientific objectives of the Vega mission was to accomplishstudies of the nucleus and its immediate environment, including visualimaging of this region and of the nucleus itself. The device dedicated tothis task was the on—board television system (TVS) of the spacecraft. As theprobes Vega—i and Vega—2 were three—axis stabilized and at closest approachthe relative speed of the s/c to comet was high, 79.222 km/sec and 76.785km/sec respectively, TVS was put on a steerable pointing platform whichoperated under the automatic control of the TVS.
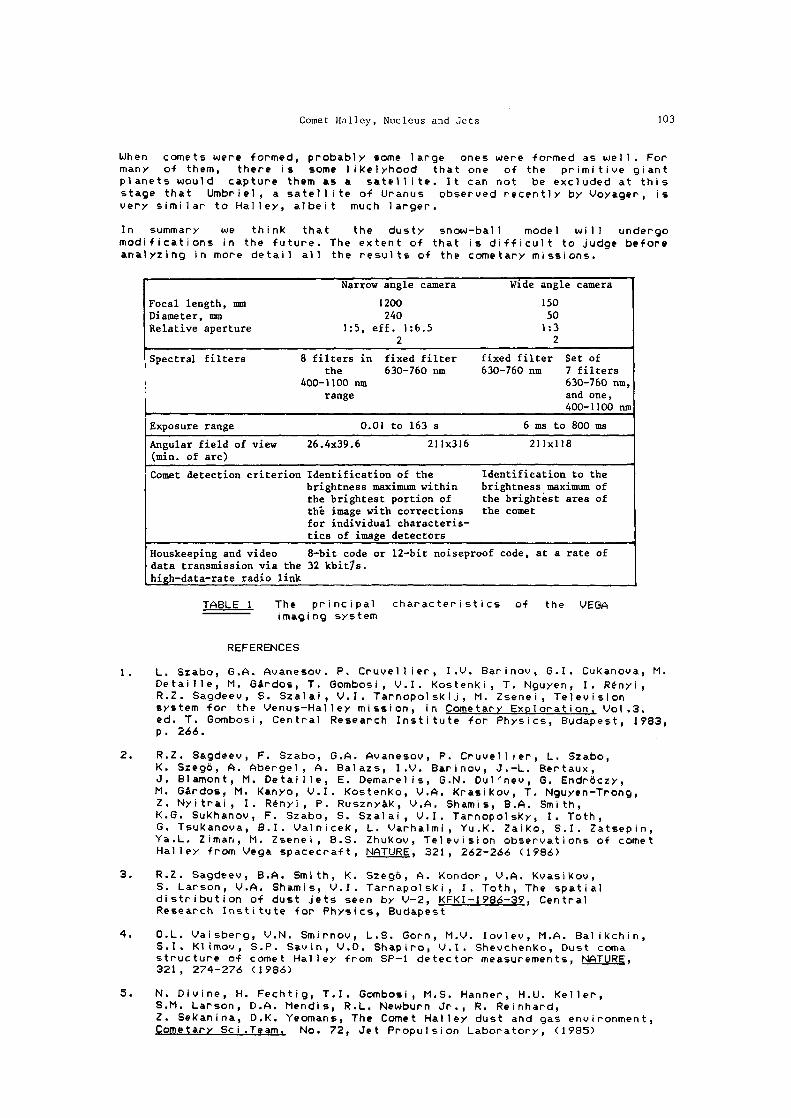
The TVS itself has two telescopes, a wide angle (focal length 150 mm) usedonly for navigation during the actual encounter and a narrow angleRitchey—Chretien (focal length 1200 mm). In each telescope the light pathwas split into two beams before reaching the 5i2x512 pixel CCD detectors.The resolution was 24.8x33 and 3.4x4.i arc sec, respectively. In front ofone of the CCDs in the narrow angle camera, there was a filter magazine with5 wide—band and one narrow—band filters to cover the 400—1100 ~ range: theother channels had fixed filters. The description of the TVS and itsvarious operating modes has been publ ished earl icr /1/. (see Table 1.)
The power and telemetry allocated for TVS made it possible to observe thecomet for two hours, at —14, —7, 7, 14 mill ion km and for three hours aroundclosest approach. Some of the observation windows were not used because oftechnical reasons. To economize the telemetry, there were several options tosend back images to Earth. During the actual encounter we used almostexclusively only two: either the whole 512x512 frame or a 128x128 pixelmoving window’ around the nucleus was transmitted. The center of the moving
window and the exposure time was set automatically by the on—boardprocessors, the sequence of the filters (photo—sequences) was preselectedbefore launch and fixed in memory. There was a further option to defineadditional photo sequences by ground commands. We took advantage of thiscapability several times. Occasionally, the automatic exposure time wasoverridden to get better details of an overexposed center. Housekeeping datawere also relayed to ground.
95
96 R. Z. Sagdeev et aL.
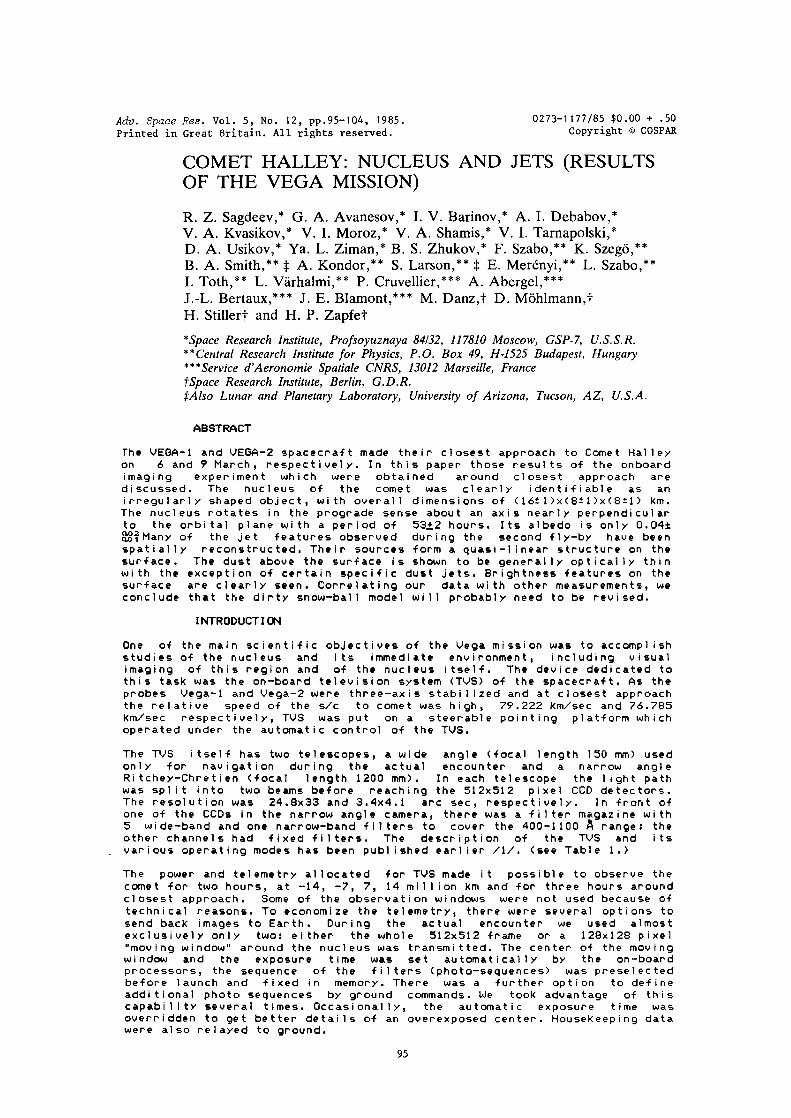
Before launch the system underwent appropriate ground calibration. Thetemperature dependence of the dark current and different transfer functions(spectral, point, line) were measured; it was established that the chargetransfer efficiency is better than 0.9997/line, the pixel—to—pixelsensitivity (flat field) was recorded in different spectral bands atdifferent exposure times, and the linearity of the detectors was evaluatedas well as the angular resolution of the system, using a special gridpattern. An example of these measurements, the spectral response function isshown in Figure 1.
GLS
4,000 5,000 6,000 7,000 8.000 9,000 10,000A iAi
Fig. 1. The spectral sensitivity of the scientificimaging telescope, for different filters used.
Provision was made for in—fl ight calibration as well. Until mid—February1986, the pointing platform was in retracted position, and built—incalibration lamps were used to check the response of the system every othermonth. After putting the platform into the operational position, Jupiter andSaturn were observed several times before and after encounter, both to checkthe operation and to obtain basel inc data for the photometric analysis ofthe comet.
In the following chapter we summarize the data analysis acomplished sincepubl ishing the first, preliminary results /2/, and in chapter 3 wesummarize the most important results relating to the nucleus of Comet Halleyand conclude with a coherent description of it.
DATA ~LYSIS
I. The data we are using here were obtained by Vega—i (2) on 6(9) March 1986around closest approach at 7 h 20:06 UT (7 h 20:00 UT) at a minimumdistance of 8889 km (8030 km). In the case of V—i, small (128x128 pixel)images were relayed to Earth approximately every 20 sec, for V—2, due to anon—board malfuction, we had to send commands to transmit full—frame (5i2x512pixel) images at a rate of about one each 90 sec. The projection of the V—2path onto a sphere centered on the nucleus is shown in Figure 2, with therecording of individual images indicated. The flight—path of V—i was similarbut about 30 further to ccl iptic North. In all these images the phase angleis less than 900; this is in contrast to Giotto’s HMC /8/ where the phaseangle was greater than 90°. The quality of the images is generally good, buttwo problems should be mentioned:a) On V—i, as in—fl ight calibration data has shown, an offset of unknowncause appeared in the output signal ; thus, only intensities higher than acertain threshold were digitized and transmitted.
b.) Both the V—i and V—2 images exhibited some noise, possibly of differentorigin. Although this noise interferes with the data, different effortsincluding Fourier transformation are being tried to remove or to suppressthe coherent components. Preliminary results are encouraging.
Images were taken through several spectral filters. At the present state ofanalysis, no significant differences have been observed in differentspectral bands.
Comet Halley, Nucleus and Jets 97
In the following discussion we call preprocessed” images those, which areat least partially corrected for calibration and noise.
+ go’
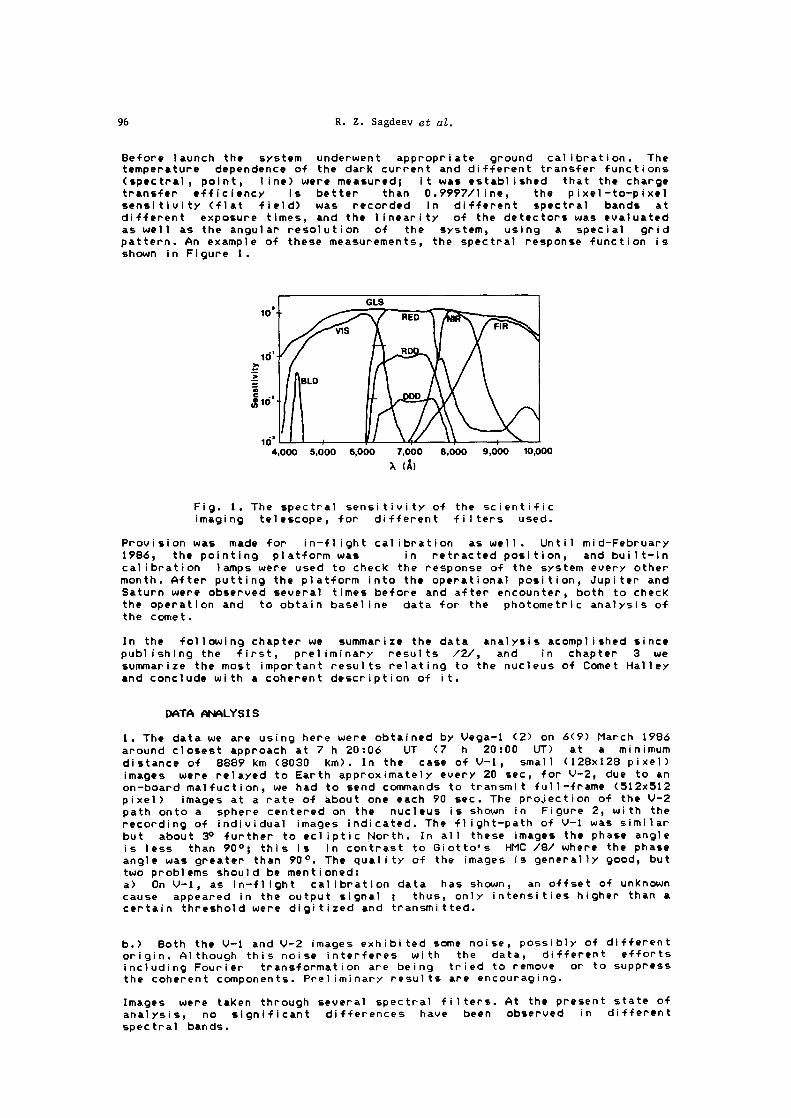
Fig. 2. The path of VEGA—2 projected onto a sphere centered onthe nucleus. North is ccl iptic north on the figure, the subsolarpoint defines zero longitude. Or, the path, dots indicate therecording of the images; e.g. we list for images A—G therecording time relative to encounter (E) and distance from thenucleus. (A: E—370.5 sec, 29539 km; B: E—1O1.7 sec, 11197 km; C:E—1.5 sec, 8031 km; D: E+98.7 sec, 11037 km; E: E+i87.3 sec,16462 km; F: E+280.5 sec 22971 km; 6: E+558.1 sec, 43567 km).The identified line—like jet sources are denoted by 1—2, 3—4 and5—6, point sources are 7 and 8.
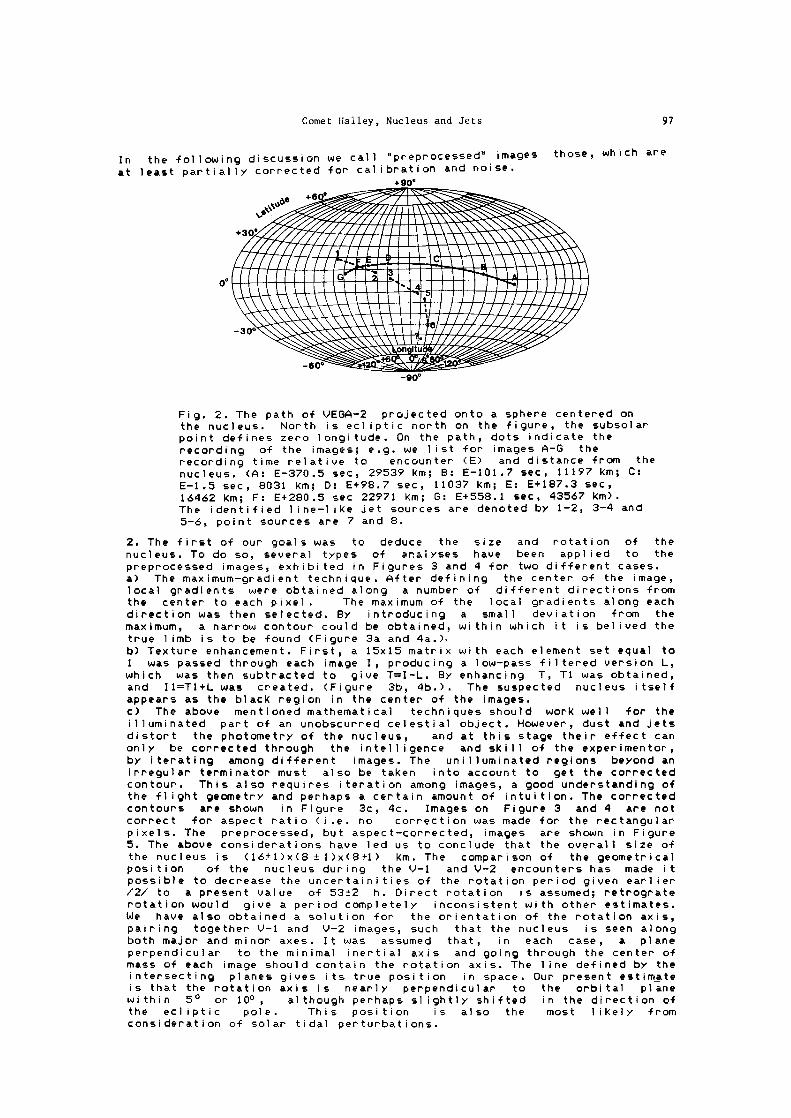
2. The first of our goals was to deduce the size and rotation of thenucleus. To do so, several types of analyses have been applied to thepreprocessed images, exhibited in Figures 3 and 4 for two different cases.a) The maximum—gradient technique. After defining the center of the image,local gradients were obtained along a number of different directions fromthe center to each pixel. The maximum of the local gradients along eachdirection was then selected. By introducing a small deviation from themaximum, a narrow contour could be obtained, within which it is belived thetrue limb is to be found (Figure 3a and 4a.),
b) Texture enhancement. First, a 15x15 matrix with each element set equal toI was passed through each image I, producing a low—pass filtered version L,which was then subtracted to give T=I—L. By enhancing T, Ti was obtained,and I1T1+L was created. (Figure 3b, 4b.). The suspected nucleus itselfappears as the black region in the center of the images.c) The above mentioned mathematical techniques should work well for theilluminated part of an unobscurred celestial object. However, dust and jetsdistort the photometry of the nucleus, and at this stage their effect canonly be corrected through the irutell igence and skill of the experimentor,by iterating among different images. The unilluminated regions beyond anirregular terminator must also be taken into account to get the correctedcontour. This also requires iteration among images, a good understanding ofthe flight geometry and perhaps a certain amount of intuition. The correctedcontours are shown in Figure 3c, 4c. Images on Figure 3 and 4 are notcorrect for aspect ratio (i.e. no correction was made for the rectangularpixels. The preprocessed, but aspect—corrected, images are shown in Figure5. The above considerations have led us to conclude that the overall size ofthe nucleus is (16±1)x(8 ±1)x(8±1) km. The comparison of the geometricalposition of the nucleus during the V—i and V—2 encounters has made itpossible to decrease the uncertainities of the rotation period given earlier/2/ to a present value of 53±2 h. Direct rotation is assumed; retrograterotation would give a period completely inconsistent with other estimates.We have also obtained a solution for the orientation of the rotation axis,pairing together V—i and V—2 images, such that the nucleus is seen alongboth major and minor axes. It was assumed that, in each case, a planeperpendicular to the minimal inertial axis and going through the center ofmass of each image should contain the rotation axis. The line defined by theintersecting planes gives its true position in space. Our present estimateis that the rotation axis is nearly perpendicular to the orbital planewithin 5° cr 100, although perhaps slightly shifted in the direction ofthe ccl iptic pole. This posi tion is also the most likely fromconsideration of solar tidal perturbations.
98 R. Z. Sagdeev et ci.
~~ ~!.IJ!TT _____
Fig. 3. Solution for the limb of image C in Fig. 2.
Fig. 4. Solution for the limb of image D in Fig. 2
!.;,:t,. __
_____ I I
d -‘ .r
Fig. 5. Size corrected, prepocessed images C and 0.
~1
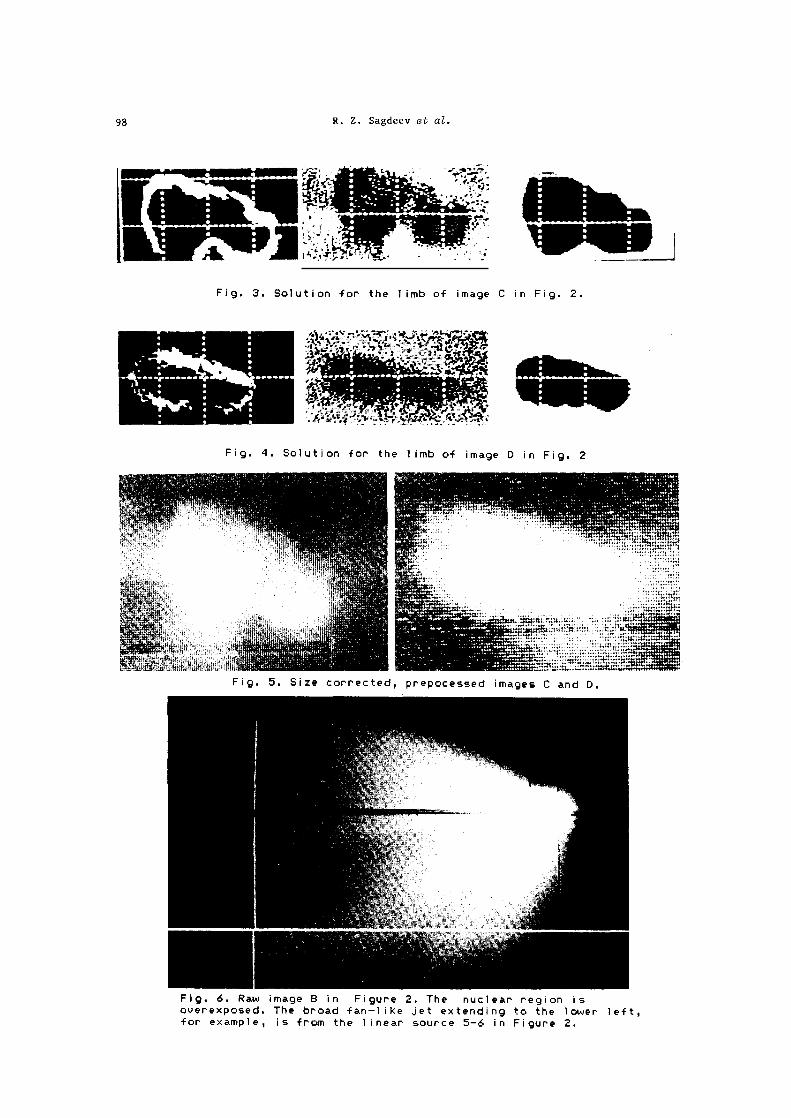
Fig. 6. Raw image B in Figure 2. The nuclear region isoverexposed. The broad fan—i ike jet extending to the lower left,for example, is from the linear source 5—6 in Figure 2.
Comet Halley, Nucleus and Jets 99
3. To obtain better limb fits, an understanding of the 3—dimensionaljet—pattern was important. A detailed analysis is reported elsewhere /3/;here the results are summarized. The analysis was done only for the V—2encounter, because full—frame images and the absence of the intensityoffset made it easier to define the jet cores and their boundaries. Atypical raw image of the set used is shown in Figure 6. To get thespatial reconstruction, we assumed that the jet sources could beapproximated by either discrete points or lines, since two edges of a linearsource should generally be distinguishable on several of the images. Withthese assumptions many (but not all) of the features were spatiallyreconstructed. The results are shown in Figure 1. One important discovery isthat not only are many of the sources actually pointlike or linear, but thatthey seem to be ordered to form an even larger quasi—I inear structure alongthe surface.
One part of this long source crosses the projection of the s/c trajectory,and V—2 should have crossed it shortly after closest approach. This isconfirmed by the SP—I dust—counter data which detected it between 7h 20:30 —
21:00 UT /4/ and partly by the general diffuse nature of dust jets seen inthe image taken at 7h 21:38 UT.
4. An important question is up to what extent the nucleus itself car, beresolved on the background of a duet cocoon surrounding it. First wehave to analyse how dust can alter surface observation.
It is known that immediately above the surface of the cometary nucleus thereis some boundary layer, inside of which velocity of the dust particles isincreasing with height. Near the surface the velocity of particles is almostzero and increasing at a rate proportional to the square root of the height,at height ‘~i km it is equal to 80 or 9O~ of terminal value /5/.Consequently the number density of the dust particles near the surface canbe large and the dust boundary layer can, in principle, screen the surfaceand even make it invisible. Three cases are possible where T is thevertical optical thickness of the boundary layer:
A. T � 0.1. Surface features can be seen.
B. 0.1 � T � 1.0. Surface features are strongly masked by dust, butsome of them may be seen with difficulty
C. r �1.O. Only dust boundary layer is seen.
In model ing the photometric properties of the system consisting both of thesurface and a geometrically thin and (to a first approximation) horizontallyhomogeneous scattering and absorbing dust layer, a comparison can be madewith the observed photometric properties, and thus allow discriminationamong cases A, B, C.
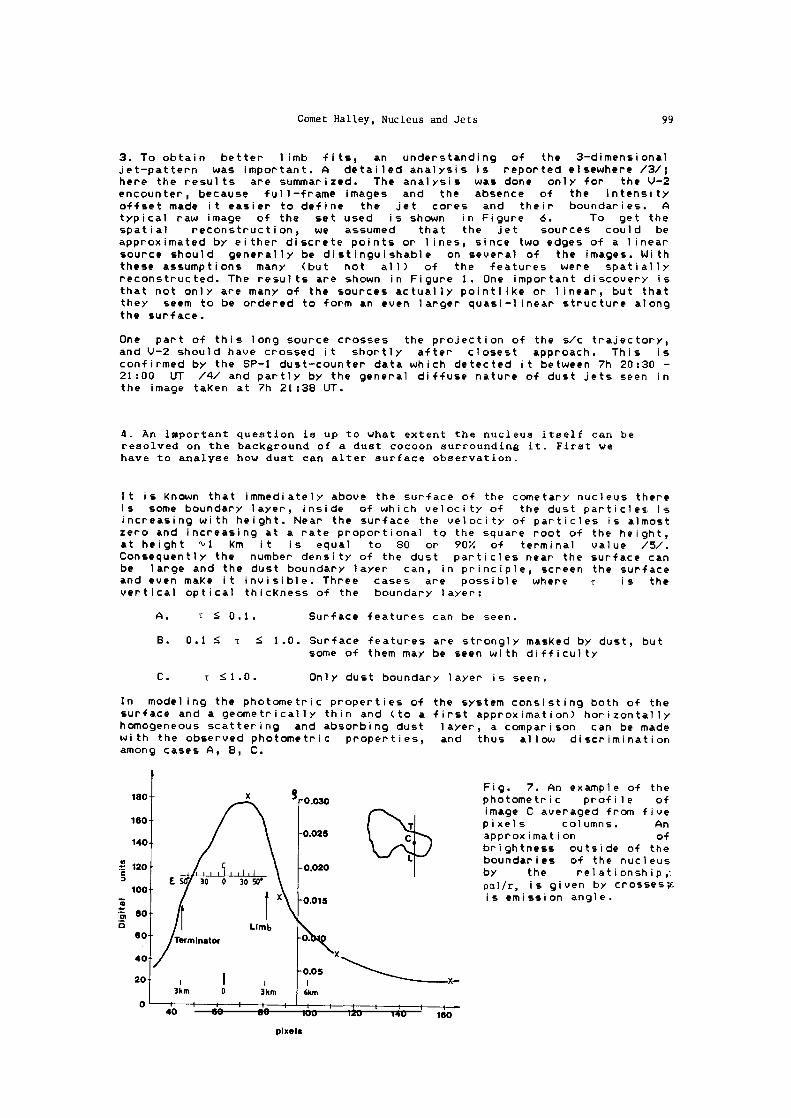
Fig. 7. An example of the180 X oo~o photometric profile of
image C averaged from five160 T pixels columns. An140 0.025 c ~~~io~utside of the
120 0.020 L boundari:s of t~ nucleus
100 0 3050° pcl/r, is given by crosses~
~, 80 x ooi~ is emission angle.
60 Terminator Limb
•,053km 0 3km 6km
I —i-----—t I I I
40 60 80 100 120 140 160pixels
100 R. Z. Sagdeev et al.
For the surface, it is assumed that the angular dependence of the brightnessfactoi- p =118 /E
0 , where B is the brightness and ~ is the normal
illuminance, is the same as for the Moon; the absolute values, however, willbe normal ized to the measured numbers.
The analysis consists of two types of photometric data: the profile of P fora given phase angle (Figure 7,8) and the phase curve (Figure 9). Note thatthis particular phase curve is not the conventional phase dependence,expressed in stellar magnitudes, of the disk—integrated brightness, butrather is the phase curve of the brightest part of the image. This isassumed to be the subsolar point of the nucleus, where the incidence anglei0 and the emission angle e is thus equal to the phase angle a
For the dust, we assume a single scattering albedo, a = 0.5. This is theminimal possible value for large particles with 211r/A >> 1, where r is theradius of the scattering particles and A is the wavelength. Measurements insitu on VEGA—2 /4,6/ and Giotto /7/ lead to the conclusion that such largeparticles dominate in the scattering and extinction of light.
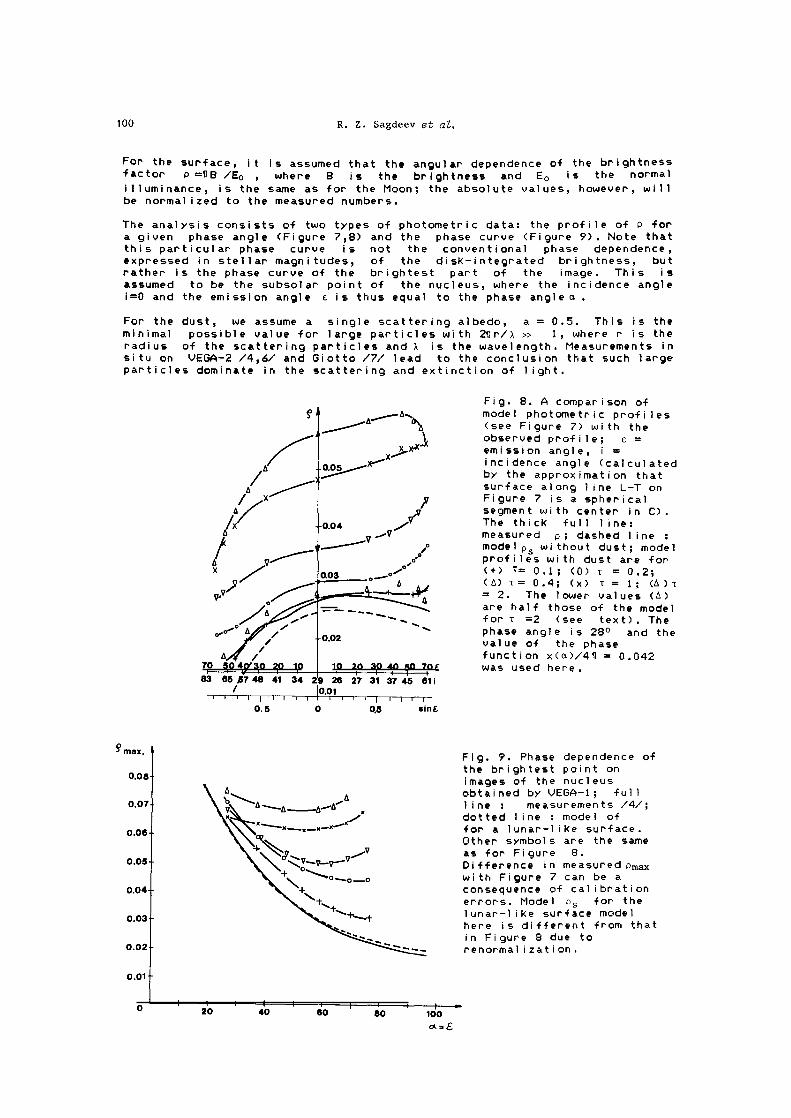
Fig. 8. A comparison ofmodel photometric profiles
___.._.- (see Figure 7) with the
emission angle, i =observed profile; ~ =incidence angle (calculatedby the approximation that
surface along line L—T onFigure 7 is a spherical
/x 0.04 ~ segment with center in C).The thick full line:A -V measured p ; dashed 1 inc
I model p5 without dust; model
~ a03 pr0f~s with dust are for(4~) r= 0.1; (0) t = 0.2;______ °~ (t) T= 0.4; (x) t = 1; (t)t~V’y ,_-~ ~ = 2. The lower values (Lx)are half those of the model—- -— fort =2 (see text). The
002 S phase angle is 28° and thevalue of the phasefunction x(a)/4~T = 0.042
70 504,5y30 ~0 10 10 20 30 40 ~0 70E was used here.
83 65 $7 48 41 34 29 26 27 31 37 45 611/
I I I I I I
0.5 0 0.5 sin6
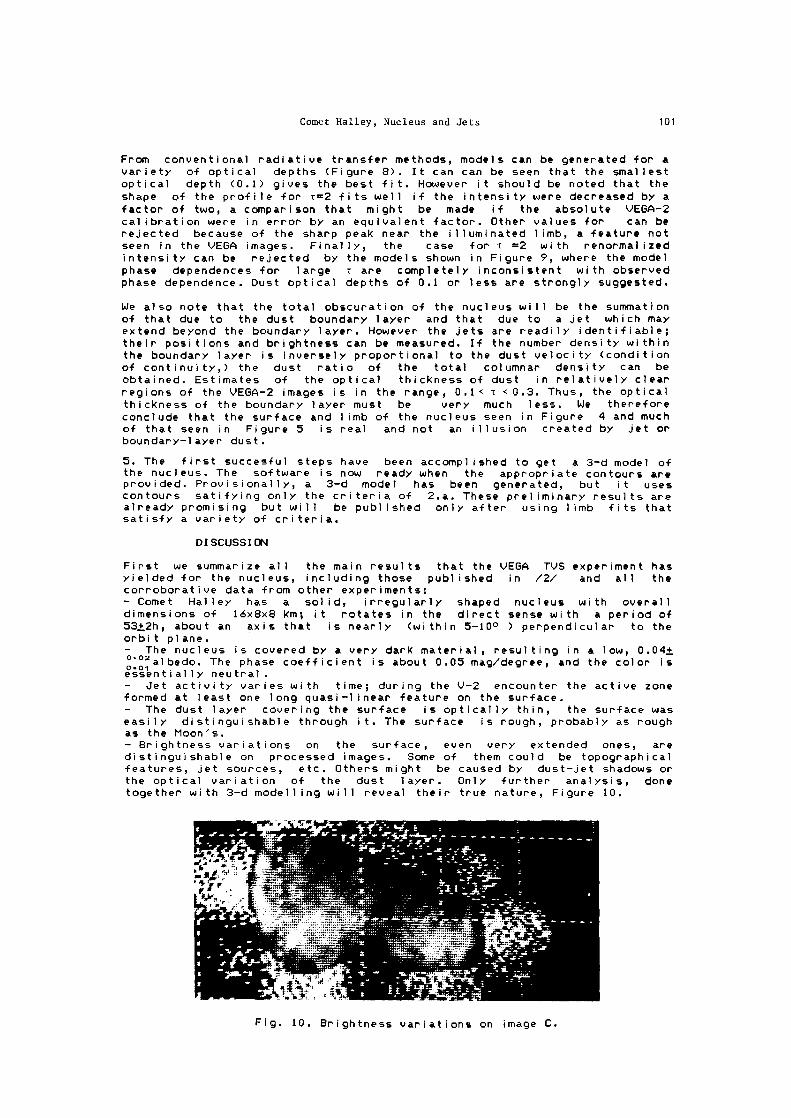
max.Fig. 9. Phase dependence ofthe brightest point on
0.08 images of the nucleus
obtained by VEGA—i; full- \ ~ ~A_A~A line : measurements /4/;
dotted line : model offor a lunar—like surface.0.06Other symbols are the sameas for Figure 8.
0.05 Difference in measured Pmax0 with Figure 7 can be aI consequence of cal i brat ion0.04 errors. Model p5 for thelunar—like surface model
here is different from thatin Figure 8 due to
0.02renormal izat ion.
0.01
o~ I I I -u i 1
20 40 60 80 100
ou~
Comet Halley, Nucleus and Jets 101
From conventional radiative transfer methods, models can be generated for avariety of optical depths (Figure 8). It can can be seen that the smallestoptical depth (0.1) gives the best fit. However it should be noted that the
shape of the profile for r2 fits well if the intensity were decreased by afactor of two, a comparison that might be made if the absolute VEGA—2calibration were in error by an equivalent factor. Other values for can berejected because of the sharp peak near the illuminated limb, a feature notseen in the VEGA images. Finally, the case for r =2 with renormal izedintensity can be rejected by the models shown in Figure 9, where the modelphase dependences for large r are completely inconsistent with observedphase dependence. Dust optical depths of 0.1 or less are strongly suggested.
We also note that the total obscuration of the nucleus will be the summationof that due to the dust boundary layer and that due to a jet which mayextend beyond the boundary layer. However the jets are readily identifiable;their positions and brightness can be measured. If the number density withinthe boundary layer is inversely proportional to the dust velocity (conditionof continuity,) the dust ratio of the total columnar density can beobtained. Estimates of the optical thickness of dust in relatively clear
regions of the VEGA—2images is in the range, 0.1< r <0.3. Thus, the opticalthickness of the boundary layer must be very much less. We thereforeconclude that the surface and limb of the nucleus seen in Figure 4 and muchof that seen in Figure 5 is real and not aru illusion created by jet orboundary—layer dust.
5. The first succesful steps have been accomplished to get a 3—d model ofthe nucleus. The software is now ready when the appropriate contours areprovided. Provisionally, a 3—d model has been generated, but it usescontours satifying only the criteria of 2.a. These preliminary results arealready promising but will be published only after using limb fits thatsatisfy a variety of criteria.
DISCUSSION
First we summarize all the main results that the VEGA TVS experiment hasyielded for the nucleus, including those publ shed in /2/ and all thecorroborative data from other experiments:— Comet Halley has a solid, irregularly shaped nucleus with overalldimensions of i6x8x8 km; it rotates in the direct sense with a period of
53±2h, about an axis that is nearly (within 5—10° ) perpendicular to theorbit plane.— The nucleus is covered by a very dark material, resulting in a low, 0.04±
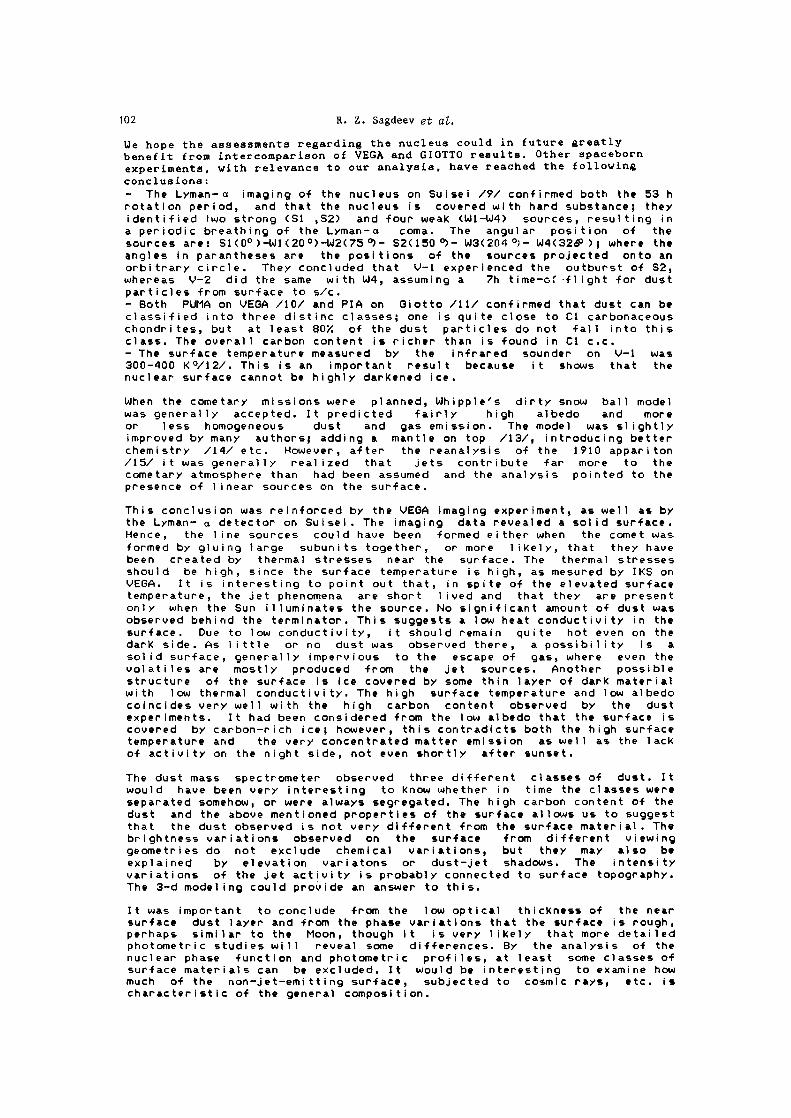
~albedo. The phase coefficient is about 0.05 mag/degree, and the color isessentially neutral.— Jet activity varies with time; during the V—2 encounter the active zoneformed at least one long quasi—linear feature on the surface.— The dust layer covering the surface is optically thin, the surface waseasily distinguishable through it. The surface is rough, probably as roughas the Moon’s.— Brightness variations on the surface, even very extended ones, aredistinguishable on processed images. Some of them could be topographicalfeatures, jet sources, etc. Others might be caused by dust—jet shadows orthe optical variation of the dust layer. Only further analysis, donetogether with 3—d modelling will reveal their true nature, Figure 10.
Fig. 10. Brightness variations on image C.
102 R. Z. Sagdeev at al.
LJe hope the assessments regarding the nucleus could in future greatlybenefit from intercomparison of VEGA and GIOTTO results. Other spacebornexperiments, with relevance to our analysis, have reached the followingconclusions:— The Lyman—a imaging o-f the nucleus on Suisei /9/ confirmed both the 53 hrotation period, and that the nucleus is covered with hard substance; theyidentified Iwo strong (Si ,S2) and four weak (W1—W4) sources, resulting ina periodic breathing of the Lyman—a coma. The angular position of thesources are: Si(0°)—W1(20°)—W2(75°)— 52(150 O)_ W3(2O4°~—W4(32~ ); where theangles in parantheses are the positions of the sources projected onto anorbitrary circle. They concluded that V—i experienced the outburst of S2,whereas V—2 did the same with W4, assuming a 7h time—cl-flight for dustparticles from surface to s/c.— Both PUMA on VEGA /10/ and PIA on Giotto /11/ confirmed that dust can beclassified into three distinc classes; one is quite close to Ci carbonaceouschondrites, but at least 8O~ of the dust particles do not fall into thisclass. The overall carbon content is richer than is found in Ci c.c.— The surface temperature measured by the infrared sounder on V—i was300—400 K°/12/. This is an important result because it shows that thenuclear surface cannot be highly darkened ice.
When the cometary missions were planned, Whipple’s dirty snow ball modelwas generally accepted. It predicted fairly high albedo and moreor less homogeneous dust and gas emission. The model was slightlyimproved by many authors; adding a mantle on top /i3/, introducing betterchemistry /14/ etc. However, after the reanalysis of the 1910 appariton/15/ it was generally realized that jets contribute far more to thecometary atmosphere than had been assumed and the analysis pointed to thepresence of linear sources on the surface.
This conclusion was reinforced by the VEGA imaging experiment, as well as bythe Lyman— a detector on Suisei. The imaging data revealed a solid surface.Hence, the 1 inc sources could have been formed either when the comet wasformed by gluing large subunits together, or more likely, that they havebeen created by thermal stresses near the surface. The thermal stressesshould be high, since the surface temperature is high, as mesured by IKS onVEGA. It is interesting to point out that, in spite of the elevated surfacetemperature, the jet phenomena are short lived and that they are presentonly when the Sun illuminates the source. No significant amount of dust wasobserved behind the terminator. This suggests a low heat conductivity in thesurface. Due to low conductivity, it should remain quite hot even on thedark side. As little or no dust was observed there, a possibility is a
solid surface, generally impervious to the escape of gas, where even thevolatiles are mostly produced from the jet sources. Another possiblestructure of the surface is ice covered by some thin layer of dark materialwith low thermal conductivity. The high surface temperature and low albedocoincides very well with the high carbon content observed by the dustexperiments. It had been considered from the low albedo that the surface iscovered by carbon—rich ice; however, this contradicts both the high surfacetemperature and the very concentrated matter emission as well as the lackof activity on the night side, not even shortly after sunset.
The dust mass spectrometer observed three different classes of dust. Itwould have been very interesting to know whether in time the classes wereseparated somehow, or were always segregated. The high carbon content of thedust and the above mentioned properties of the surface allows us to suggestthat the dust observed is not very different from the surface material. Thebrightness variations observed on the surface from different viewinggeometries do not exclude chemical variations, but they may also beexplained by elevation variatons or dust—jet shadows. The intensityvariations of the jet activity is probably connected to surface topography.The 3—d modeling could provide an answer to this.
It was important to conclude from the low optical thickness of the nearsurface dust layer and from the phase variations that the surface is rough,perhaps similar to the Moon, though It is very likely that more detailedphotometric studies will reveal some differences. By the analysis of thenuclear phase function and photometric profiles, at least some classes ofsurface materials can be excluded. It would be interesting to examine howmuch of the non—jet—emitting surface, subjected to cosmic rays, etc. ischaracteristic of the general composition.
Comet Halley, Nucleus and Jets 103
When comets were formed, probably some large ones were formed as well. Formany of them, there is some 1 ikelyhood that one of the primitive giantplanets would capture them as a satellite. It can not be excluded at thisstage that Umbriel , a satell ite of Uranus observed recently by Voyager, isvery similar to Halley, albeit much larger.
In summary we think that the dusty snow—ball model will undergomodifications in the future. The extent of that is difficult to judge beforeanalyzing in more detail all the results of the cometary missions.
Narrow angle camera Wide angle camera
Focal length, mm 1200 150Diameter, mm 240 50Relative aperture 1:5, eff. 1:6.5 1:3
2 2
Spectral filters 8 filters in fixed filter fixed filter Set ofthe 630—760 nw 630—760 nm 7 filters
400—1100 nm 630—760 nm,range and one,
400—1100 nm
Exposure range 0.01 to 163 s 6 ms to 800 ms
Angular field of view 26.4x39.6 211x316 2l1xi18(miii. of arc)
Comet detection criterion Identification of the Identification to thebrightness maximum within brightness maximum ofthe brightest portion of the brightest area ofth~ image with corrections the cometfor individual characteris-tics of image detectors
Houskeeping and video 8—bit code or 12—bit noiseproof code, at a rate ofdata transmission via the 32 kbitls.high—data—rate radio link
TABLE 1 The principal characteristics of the VEGAimaging system
REFERENCES
1. L. Szabo, G.A. Avanesov. P. Cruvell icr, 1.1.). Barinov, 0.1. Cukanova, M.Detaille, M. G~rdos, T. Gombosi, V.1. Kostenki, T. Nguyen, I. R~nyi,R.Z. Sagdeev, 8. Szalai , V.1. Tarnopolskij, M. Zsenei , Televisionsystem for the Venus—Halley mission, in Cometary Exploration, Vol.3.ed. T. Gombosi , Central Research Insti tute for Physics, Budapest, 1983,p. 266.
2. R.Z. Sagdeev, F. Szabo, 0.A. Avanesov, P. Cruvellier, L. Szabo,K. Szega, A. Abergel, A. Balazs, I.V. Barinov, J.—L. Bertaux,J. Blamont, M. Detaille, E. Demarelis, G.N. Dul’nev, G. Endrdczy,M. G~rdos, M. Kanyo, V.1. Kostenko, V.A. Krasikov, T. Nguyen—Trong,2. Nyitrai, 1. Rényl, P. Ruszny~k, V.A. Shamis, B.A. Smith,K.G. Sukhanov, F. Szabo, S. Szalai, V.1. Tarnopolsky, I. Toth,6. Tsukanova, 8.1. Valnicek, L. Varhalmi , Yu.K. Zaiko, 5.1. Zatsepin,‘i’a.L. Zimaru, M. Zsenei , 8.S. Zhukov, Television observations of cometHalley from Vega spacecraft, NATURE, 321, 262—266 (1986)
3. R.Z. Sagdeev, B.A. Smith, K. SzegQ, A. Kondor, V.A. Kvasikov,S. Larson, V.A. Shamis, VI. Tarnapolski , I. Toth, The spatialdistribution of dust jets seen by V—2, KFKI—1986—39, CentralResearch Institute for Physics, Budapest
4. O.L. Vaisberg, U.N. Smirnov, L.S. 6am, M.V. Iovlev, M.A. Balikchin,S.I. Klimov, S.P. Savin, V.0. Shapiro, V.1. Sheychenko, Dust comastructure of comet Halley from SP—1 detector measurements, NATURE,321, 274—276 (1986)
5. N. Divine, H. Fechtig, T.I. Gombosi, M.S. Hanner, H.U. Keller,S.M. Larson, D.A. Mendis, R.L. Newbumn Jr., R. Reinhard,2. Sekanina, DK. Yeomans, The Comet Halley dust and gas environment,Cometary Sci .Team. No. 72, Jet Propulsion Laboratory, (1985)
104 R. Z. Sagdeev at ci.
6. E.P. Mazets, R.L. Aptekar, S.V. Golenetskii, Yu.A. Guryan,A.V. Dyachkov, V.N. Ilyinskii, V.N. Panov, G.G. Petrov, A.V. Savvin,R.Z. Sagdeev, l.A. Sokolov, N.G. Khavenson, V.0. Shapiro,V.1. Shevchenko, Comet Halley dust environment from SP—2 detectormeasuerements, NATURE, 321, 276—278, (1986)
7. J.A.M. McDonnell, W.M. Alexander, tui.M. Burton, E. Bussoletti,D.H. Clark, R.J.L. Grarci, E.Grun, M.S. Hariner, D.W. Hughes,E. lgenbergs, H. Kuczera, B.A. Lindblad, J.—C. Mandeville, A. Minafra,G.H. Schwehm, Z. Sekanina, M.K. Wallis, J.C. Zamnecki, S.C. Chakaveh,G.C. Evans, S.T. Evans, J.G. Firth, A.N. Little, L. Massonne,R.E. Olearczyk, 6.5. Pankiewicz, T.J. Stevenson, R.F. Turner,Dust density and mass distribution near comet Halley from Giottoobservations, NATURE. 321, 338—341, 1986.
8. H.U. Keller, C. Arpigny, C. Barbieri, R.M. Bonnet, S. Cazes,M. Coradini, C.B. Cosmovici, t4.u?4. Delamere, W.F. Huebner, D.W. Huges,C. Jarnar, 0. Malaise, H.J. Reitsema, H.U. Schmidt, W.K.H. Schmidt,P. Seige, F.L.Whipple, K. Wilhelm, First Halleymulticolour cameraimaging results from Giotto, NATURE. 321, 320—326, 1986.
9. E. Kaneda, 0. Ashihara, M. Shimizu, M. Takagi , K. Hirao, Observationof comet Halley by the ultraviolet imager of Suisei, NATURE. 321,297—299, 1986.
10. ~.7. Kissel, R.Z. Sagdeev, J.L. Bemtaux, V.N. Angarov, J. Audouzel,J.E. Blamont, K. Buchler, E.N. Evlanov, H. Fechtig, M.N. Fomenkova,H. von Hoerner, N.A. Inogamov, V.N. Khoromov, tuJ. Knabe, F.R. Krueger,
Y. Langevin, V.8. Leonas, A.C. Levasseur—Regourd, 6.6. Managadze,S.N. Podkolzln, V.0. Shapiro, S.R. Tabaldyev, B.V. Zubkov,Composition of comet Halley dust particles from Vega observations,NATURE. 321, 280—282, 1986.
ii. J. Kissel , D.E. Brownlee, K. Buchler, B.C. Clark, H. Fechtig,H. Gmün, K. Hornung, E.B. Igenbergs, E.K. Jessberger, F.R. Krueger,H. Kuczera, J.A.M. McDonnell, G.M. Morfill, J. Rahe, G.H. Schwehm,Z. Sekanina, N.G. Utterback, H.J. Volk, H.A. Zook, Composition ofcomet Halley dust particles from Giotto observations, NATURE, 321,336—337, 1986.
12. 11. Combes, V.1. Moroz, J.F. Crifo, J.M. Larnarre, J. Charra,N.F. Sanko, A. Soufflot, J.P. Bibring, S. Cazes, N. Coron,J. Crovisier, C. Emerich, T. Encrenaz, R. Gispert, A.V. Grigoryev,G. Guyot, V.A. Krasnapolsky, Yu.V. Nikoisky, F. Rocamd, Infraredsounding of comet Halley from Vega—i, NATURE. 321, 266—268, 1986
13. M. Hor~nyi, 1.1. Gombosi, I.E. Cravens, A. Kömösmezey, K. Kecskemety,A.F. Nagy, K. Szegö, The friable sponge model of a cometary nucleus,Astrophysical J., 278, 449—435, 1985
14. D.A. Mendis, H.L.F. Houpis, M.L. Marconi, The physics of comets,Fundamental of Cosmic Physics, 10, 1—380, 1985.
iS. S.M. Larson, Z. Sekania, Coma morphology and dust—emission patternof periodic comet Halley, Astr.J., 89, 571—578, 1984.