Embed Size (px)
Citation preview
ADECOAGRO S.A.
ANNUAL REPORTDECEMBER 31, 2019
1
MANAGEMENT REPORT
COMPANY PROFILEAdecoagro S.A. (the "Company" or "Adecoagro") is a holding company primarily engaged through its operating
subsidiaries in agricultural and agro-industrial activities. The Company and its operating subsidiaries are collectively referred to hereinafter as the "Group". These activities are carried out through three major lines of business, namely, Farming; Sugar, Ethanol and Energy; and Land Transformation. Farming is further comprised of five reportable segments, which are described in detail in Note 3 to these consolidated financial statements.
The Group was established in 2002 and has subsequently grown significantly both organically and through acquisitions. The Group currently has operations in Argentina, Brazil and Uruguay. See Note 32 for a description of the Group companies.
The Company is the Group’s ultimate parent company and is a Societe Anonyme corporation incorporated and domiciled in the Grand Duchy of Luxembourg. The address of its registered office is 6 Eugené Ruppert, L-2453, Luxembourg.
The authorized share capital is of US$ 3,000,000,000 and the Board of Directors is authorized to issue up to 2,000,000,000 shares of a nominal value of US$ 1.5 each out of such authorized unissued share capital. As of December 31, 2019, the total unissued share capital totaled US$ 2,816,427,276. From the total number of outstanding shares as of December 31, 2019, the Company held 5,295,765 treasury shares.
Business overviewAdecoagro is an agricultural company with operations in Argentina, Brazil and Uruguay. We are currently involved
in a broad range of businesses, including farming crops and other agricultural products, and dairy operations, sugar, ethanol and energy production and land transformation.
1. Farming Business: We believe we are one of the largest owners of productive farmland in South America. As of December 31, 2019 we owned 221,425 hectares (excluding sugarcane farms) of farmland in Argentina and Uruguay, of which 123,131 hectares are croppable, 14,054 hectares are being evaluated for transformation, 55,228 hectares are suitable for raising beef cattle and are mostly leased to third party cattle farmers, constituting a total of 192,413 productive hectares, and 39,299 hectares are legal land reserves pursuant to local regulations or other land reserves. During the 2018/2019 harvest year we held leases or have entered into agriculture partnerships for an additional 86,450 croppable hectares. We own the facilities and have the resources to store and condition 100% of our crop and rice production. We do not depend on third parties to condition our production for sale. Our farming business is subdivided into four main businesses:
• Crop business: We produce a wide range of agricultural commodities including soybeans, corn, wheat, sunflower and cotton, among others. In Argentina, our farming activities are conducted mainly in the Argentine humid pampas region, where agro-ecological conditions are optimal for low-cost production. Since 2004, we have expanded our operations throughout the center-west region of Uruguay and the western part of the state of Bahia, Brazil, as well as in the northern region of Argentina. During the 2018/2019 harvest year, we planted approximately 185,807 hectares of crops, including second harvests, producing 605,169 tons of grains, including soybeans, wheat and corn, sunflower and cotton. We also planted an additional 5,828 hectares where we produced over 212,650 tons of forage that we used for cow feed in our dairy operation. During the current 2019/20 harvest year, we planted approximately 196,950 hectares of crops, including second harvest, and also planted an additional 6,338 hectares of forage.
On February 2019 we seized the opportunity to vertically integrate our operations through the acquisition of a state-of-the-art peanut processing facility. The plant has been granted with all the necessary certifications and permits, enabling us to control processing activities, avoid tolling and brokerage fees and have access to the most strict markets worldwide which demand Argentine peanut for its superior quality, and are willing to pay a premium for it.
2
• Rice business: We own a fully-integrated rice operation in Argentina. We produce irrigated rice in the northeast provinces of Argentina, where the availability of water, sunlight, and fertile soil results in one of the most ideal regions in the world for producing rice at low cost. We believe that we are one of the largest producers of rough (unprocessed) rice in Argentina, producing 239,779 tons during the 2018/2019 harvest year, which accounted for 21% of the total Argentine production according to Conmasur. We own three rice mills that process our own production, as well as rice purchased from third parties. We produce different types of white and brown rice that are sold both in the domestic Argentine retail market under our own brand; and exported. During the current 2019/20 harvest year, we planted 41,544 hectares of rice.
• Dairy business: We believe that we are a leading dairy producer in South America in terms of our utilization of cutting-edge technology, productivity per cow and grain conversion efficiencies. Through the production of raw milk, we are able to transform forage and grains into value-added animal protein. Our “free-stall” dairies in Argentina allow us to optimize our use of resources (land, dairy cow feed and capital), increase our productivity and maximize the conversion of forage and grain into raw milk. We produced 120.6 million liters of raw milk during 2019, with a daily average of 9,066 milking cows, delivering an average of 36.3 liters of milk per cow per day. On October, 2017 we completed the construction of our first bio-digestor with a 1.4MWH of installed capacity. The facility generates electricity by burning biogas extracted from the effluents produced by our seven thousand milking cows. On November 3, 2017, we began the energy generation and the delivery of electricity to the local power grid. In addition to increasing revenues and securing our energy requirements, this facility enhances the sustainability of our free stall dairy operation by reducing greenhouse gas emissions, improving the effluent management and concentrating valuable nutrients which are applied back to the fields.
In February 2019 we completed the acquisition of two milk processing plants, with the conviction that controlling the supply chain will allow us to enhance efficiencies and increase margins. We are already close to our reaching our target of processing 1 million liters per day between our Morteros facility (milk powder and cheese) and Chivilcoy facility (fluid milk). We have incorporated new destinations to our international client portfolios such as Russia and LatAm countries, as well as having expanded our product line up in the domestic market to include UP milk and yogurt, which we have recently begun producing (both under our own brand and private label agreements).
• All Other Segments business: Our all other segments business consists of leasing pasture land to cattle farmers in Argentina. We lease over 13,546 hectares of pasture land which is not suitable for crop production to third party cattle farmers.
2. Sugar, Ethanol and Energy Business: We cultivate and harvest sugarcane which is then processed in our own mills to produce sugar, ethanol and energy. As of December 31, 2019, our total sugarcane plantation consisted of 166,041 hectares, planted over both owned and leased land. We currently own and operate three sugar and ethanol mills, UMA, Angélica and Ivinhema, with a total crushing capacity of 13.2 million tons of sugarcane per year as of December 31, 2019. UMA is a small but efficient mill located in the state of Minas Gerais, Brazil, with a sugarcane crushing capacity of 1.2 million tons per year, full cogeneration capacity and an associated sugar brand with strong presence in the regional retail market (Açúcar Monte Alegre). We plant and harvest 99.7% of the sugarcane milled at UMA, with the remaining 0.3% acquired from third parties. Angélica and Ivinhema are two new, modern mills, which we built in the state of Mato Grosso do Sul, Brazil, with current sugarcane crushing capacities of 5.6 and 6.4 million tons per year, respectively. Both mills are located 45 km apart, and form a cluster surrounded by one large sugarcane plantation. Angelica and Ivinhema are equipped with high pressure steam boilers and turbo-generators with the capacity to use all the sugarcane bagasse by-product to generate electricity. Approximately 28% of the electricity generated is used to power the mill and the excess electricity is sold to the local power grid, resulting in the mills having full cogeneration capacity.
3
For the year ended December 31, 2019, we crushed 10.8 million tons of sugarcane. Our mills produce both sugar and ethanol, and accordingly, we have some flexibility to adjust our production (within certain capacity limits that generally vary between 40% and 80%) between sugar and ethanol, to take advantage of more favorable market demand and prices at given points in time. For the year ended December 31, 2019 we produced 213,256 tons of sugar and 756,494 cubic meters of ethanol.
As of December 31, 2019, our overall sugarcane plantation consisted of 166,041 hectares of sugarcane in the states of Mato Grosso do Sul and Minas Gerais, Brazil, of which 13,291 hectares of sugarcane were planted on owned land, and 152,750 hectares were planted on land leased from third parties under long term agreements.
3. Land Transformation Business: We acquire farmlands we believe are underdeveloped or underutilized and, by implementing cutting-edge production technology and agricultural best practices, transform the land to be suitable for more productive uses, enhance yields and increase the value of the land. During the sixteen-year period since our inception, we have effectively put into production 175,866 hectares of land that was previously undeveloped or undermanaged. During 2019, we put into production 1,000 hectares and in addition continued the transformation process of over 133,428 hectares we own. We realize and capture land transformation value through the strategic disposition of assets that have reached full development potential. We believe that the rotation of our land portfolio allows us to re-allocate capital efficiently, maximizing our return on invested capital. Our current owned land portfolio consists of 225,630 hectares, distributed throughout our operating regions as follows: 93% in Argentina, 6% in Brazil, and 1% in Uruguay. During the last twelve years, we sold 23 of our fully mature farms, generating capital gains of approximately $244 million.
We promote sustainable land use through our land transformation activities, which seek to promote environmentally responsible agricultural production and a balance between production and ecosystem preservation. We do not operate in heavily wooded areas or wetland areas.
From time to time, the company seeks to recycle its capital by disposing of a portion of its fully developed farms. This allows the company to monetize the capital gains generated by its land transformation activities and allocate its capital to acquire land with higher transformation potential or to deploy it in other businesses, thereby enhancing the return on invested capital.
FINANCIAL RISK AND UNCERTAINTIES The Group manages exposures to financial and commodity risks using hedging instruments that provide the
appropriate economic outcome. The principal hedging instruments used may include commodity future contracts, put and call options, foreign exchange forward contracts and interest rate swaps. The Group does not use derivative financial instruments for speculative purposes.
For a detailed analysis of financial risk and uncertainties of the Company, see Note 2 to the Company´s consolidated financial statements as of December 31, 2019.
OPERATING AND FINANCIAL REVIEW AND PROSPECTSThe following tables present selected historical consolidated financial data of Adecoagro S.A. for the years
indicated below. We have derived the selected historical statement of income, cash flow and balance sheet data as of and for the years ended December 31, 2019, and 2018 from the consolidated financial statements.
The consolidated financial statements are prepared in accordance with IFRS as issued by the IASB and the interpretations of the IFRIC and in accordance with IFRS adopted by the European Union. You should read the information contained in these tables in conjunction with the consolidated financial statements.
4
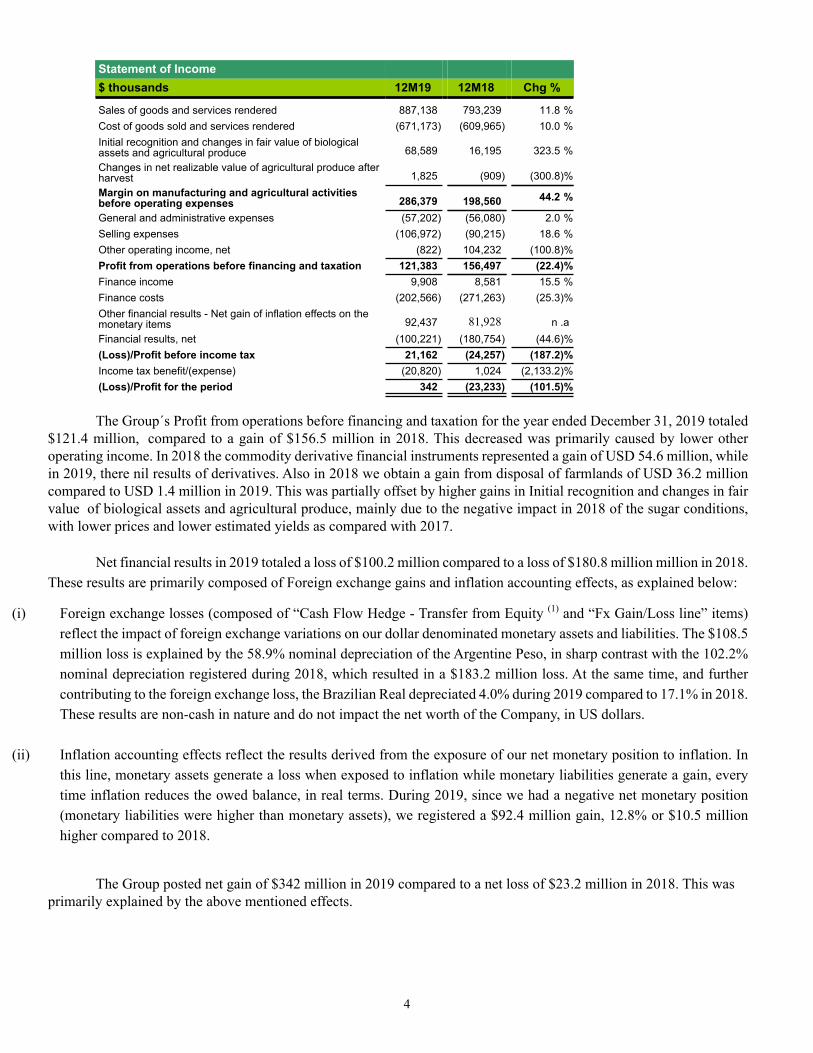
Statement of Income$ thousands 12M19 12M18 Chg %
Sales of goods and services rendered 887,138 793,239 11.8 %Cost of goods sold and services rendered (671,173) (609,965) 10.0 %Initial recognition and changes in fair value of biologicalassets and agricultural produce 68,589 16,195 323.5 %Changes in net realizable value of agricultural produce afterharvest 1,825 (909) (300.8)%Margin on manufacturing and agricultural activitiesbefore operating expenses 286,379 198,560 44.2 %
General and administrative expenses (57,202) (56,080) 2.0 %Selling expenses (106,972) (90,215) 18.6 %Other operating income, net (822) 104,232 (100.8)%Profit from operations before financing and taxation 121,383 156,497 (22.4)%Finance income 9,908 8,581 15.5 %Finance costs (202,566) (271,263) (25.3)%Other financial results - Net gain of inflation effects on themonetary items 92,437 81,928 n .aFinancial results, net (100,221) (180,754) (44.6)%(Loss)/Profit before income tax 21,162 (24,257) (187.2)%Income tax benefit/(expense) (20,820) 1,024 (2,133.2)%(Loss)/Profit for the period 342 (23,233) (101.5)%
The Group´s Profit from operations before financing and taxation for the year ended December 31, 2019 totaled $121.4 million, compared to a gain of $156.5 million in 2018. This decreased was primarily caused by lower other operating income. In 2018 the commodity derivative financial instruments represented a gain of USD 54.6 million, while in 2019, there nil results of derivatives. Also in 2018 we obtain a gain from disposal of farmlands of USD 36.2 million compared to USD 1.4 million in 2019. This was partially offset by higher gains in Initial recognition and changes in fair value of biological assets and agricultural produce, mainly due to the negative impact in 2018 of the sugar conditions, with lower prices and lower estimated yields as compared with 2017.
Net financial results in 2019 totaled a loss of $100.2 million compared to a loss of $180.8 million million in 2018. These results are primarily composed of Foreign exchange gains and inflation accounting effects, as explained below:
(i) Foreign exchange losses (composed of “Cash Flow Hedge - Transfer from Equity (1) and “Fx Gain/Loss line” items) reflect the impact of foreign exchange variations on our dollar denominated monetary assets and liabilities. The $108.5 million loss is explained by the 58.9% nominal depreciation of the Argentine Peso, in sharp contrast with the 102.2% nominal depreciation registered during 2018, which resulted in a $183.2 million loss. At the same time, and further contributing to the foreign exchange loss, the Brazilian Real depreciated 4.0% during 2019 compared to 17.1% in 2018. These results are non-cash in nature and do not impact the net worth of the Company, in US dollars.
(ii) Inflation accounting effects reflect the results derived from the exposure of our net monetary position to inflation. In this line, monetary assets generate a loss when exposed to inflation while monetary liabilities generate a gain, every time inflation reduces the owed balance, in real terms. During 2019, since we had a negative net monetary position (monetary liabilities were higher than monetary assets), we registered a $92.4 million gain, 12.8% or $10.5 million higher compared to 2018.
The Group posted net gain of $342 million in 2019 compared to a net loss of $23.2 million in 2018. This was primarily explained by the above mentioned effects.
5
BUSINESS SEGMENT HIGHLIGHTS
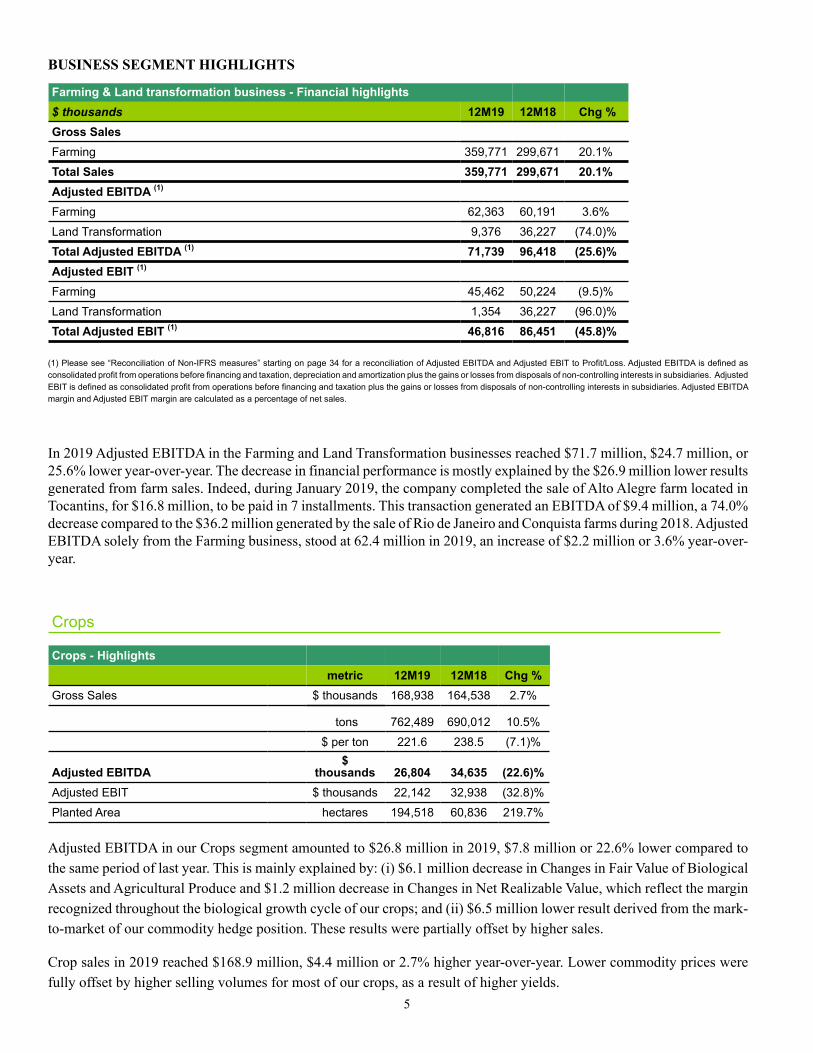
Farming & Land transformation business - Financial highlights$ thousands 12M19 12M18 Chg %Gross SalesFarming 359,771 299,671 20.1%
Total Sales 359,771 299,671 20.1%Adjusted EBITDA (1)
Farming 62,363 60,191 3.6%
Land Transformation 9,376 36,227 (74.0)%
Total Adjusted EBITDA (1) 71,739 96,418 (25.6)%Adjusted EBIT (1)
Farming 45,462 50,224 (9.5)%
Land Transformation 1,354 36,227 (96.0)%
Total Adjusted EBIT (1) 46,816 86,451 (45.8)%
(1) Please see “Reconciliation of Non-IFRS measures” starting on page 34 for a reconciliation of Adjusted EBITDA and Adjusted EBIT to Profit/Loss. Adjusted EBITDA is defined as consolidated profit from operations before financing and taxation, depreciation and amortization plus the gains or losses from disposals of non-controlling interests in subsidiaries. Adjusted EBIT is defined as consolidated profit from operations before financing and taxation plus the gains or losses from disposals of non-controlling interests in subsidiaries. Adjusted EBITDA margin and Adjusted EBIT margin are calculated as a percentage of net sales.
In 2019 Adjusted EBITDA in the Farming and Land Transformation businesses reached $71.7 million, $24.7 million, or 25.6% lower year-over-year. The decrease in financial performance is mostly explained by the $26.9 million lower results generated from farm sales. Indeed, during January 2019, the company completed the sale of Alto Alegre farm located in Tocantins, for $16.8 million, to be paid in 7 installments. This transaction generated an EBITDA of $9.4 million, a 74.0% decrease compared to the $36.2 million generated by the sale of Rio de Janeiro and Conquista farms during 2018. Adjusted EBITDA solely from the Farming business, stood at 62.4 million in 2019, an increase of $2.2 million or 3.6% year-over-year.
Crops
Crops - Highlightsmetric 12M19 12M18 Chg %
Gross Sales $ thousands 168,938 164,538 2.7%
tons 762,489 690,012 10.5%
$ per ton 221.6 238.5 (7.1)%
Adjusted EBITDA$
thousands 26,804 34,635 (22.6)%Adjusted EBIT $ thousands 22,142 32,938 (32.8)%
Planted Area hectares 194,518 60,836 219.7%
Adjusted EBITDA in our Crops segment amounted to $26.8 million in 2019, $7.8 million or 22.6% lower compared to the same period of last year. This is mainly explained by: (i) $6.1 million decrease in Changes in Fair Value of Biological Assets and Agricultural Produce and $1.2 million decrease in Changes in Net Realizable Value, which reflect the margin recognized throughout the biological growth cycle of our crops; and (ii) $6.5 million lower result derived from the mark-to-market of our commodity hedge position. These results were partially offset by higher sales.
Crop sales in 2019 reached $168.9 million, $4.4 million or 2.7% higher year-over-year. Lower commodity prices were fully offset by higher selling volumes for most of our crops, as a result of higher yields.
6
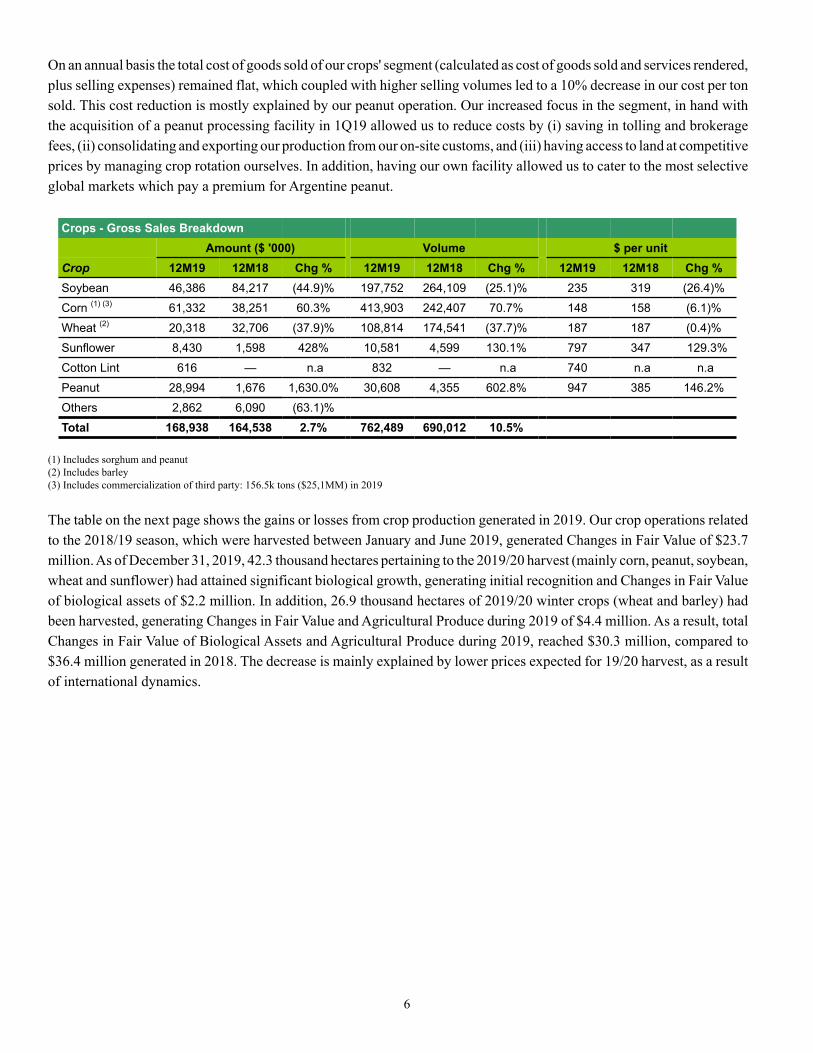
On an annual basis the total cost of goods sold of our crops' segment (calculated as cost of goods sold and services rendered, plus selling expenses) remained flat, which coupled with higher selling volumes led to a 10% decrease in our cost per ton sold. This cost reduction is mostly explained by our peanut operation. Our increased focus in the segment, in hand with the acquisition of a peanut processing facility in 1Q19 allowed us to reduce costs by (i) saving in tolling and brokerage fees, (ii) consolidating and exporting our production from our on-site customs, and (iii) having access to land at competitive prices by managing crop rotation ourselves. In addition, having our own facility allowed us to cater to the most selective global markets which pay a premium for Argentine peanut.
Crops - Gross Sales BreakdownAmount ($ '000) Volume $ per unit
Crop 12M19 12M18 Chg % 12M19 12M18 Chg % 12M19 12M18 Chg %Soybean 46,386 84,217 (44.9)% 197,752 264,109 (25.1)% 235 319 (26.4)%
Corn (1) (3) 61,332 38,251 60.3% 413,903 242,407 70.7% 148 158 (6.1)%
Wheat (2) 20,318 32,706 (37.9)% 108,814 174,541 (37.7)% 187 187 (0.4)%
Sunflower 8,430 1,598 428% 10,581 4,599 130.1% 797 347 129.3%
Cotton Lint 616 — n.a 832 — n.a 740 n.a n.a
Peanut 28,994 1,676 1,630.0% 30,608 4,355 602.8% 947 385 146.2%
Others 2,862 6,090 (63.1)%
Total 168,938 164,538 2.7% 762,489 690,012 10.5%
(1) Includes sorghum and peanut(2) Includes barley(3) Includes commercialization of third party: 156.5k tons ($25,1MM) in 2019
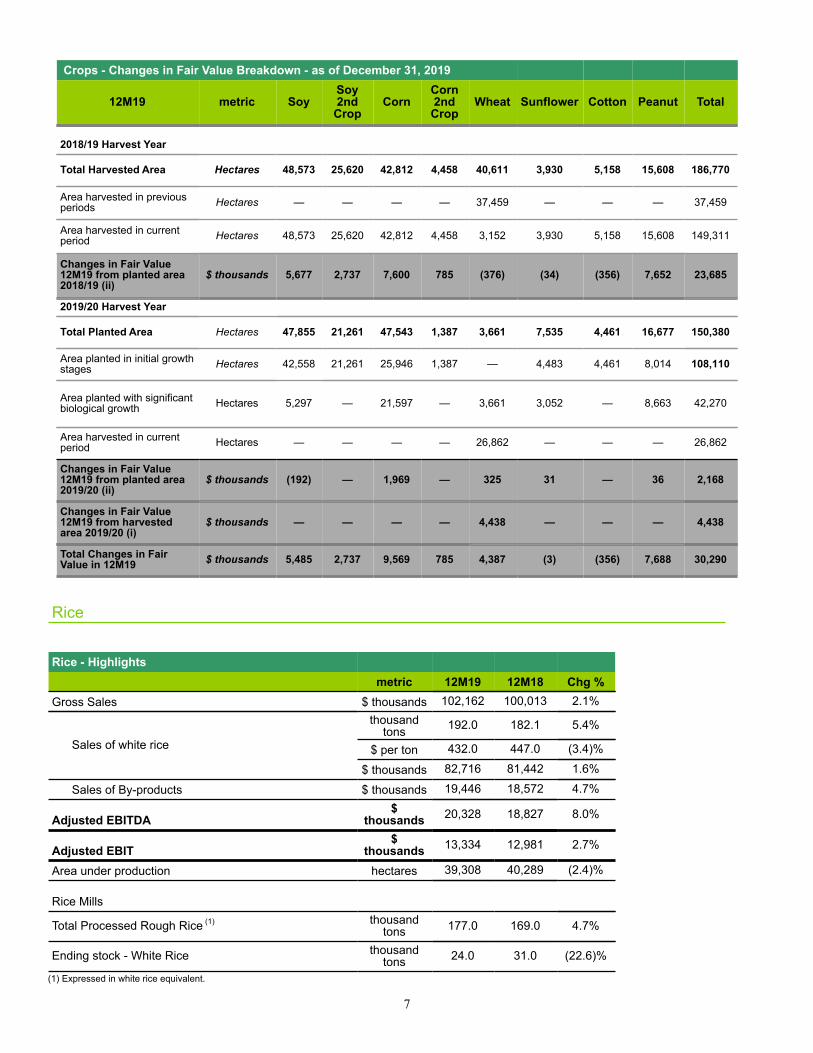
The table on the next page shows the gains or losses from crop production generated in 2019. Our crop operations related to the 2018/19 season, which were harvested between January and June 2019, generated Changes in Fair Value of $23.7 million. As of December 31, 2019, 42.3 thousand hectares pertaining to the 2019/20 harvest (mainly corn, peanut, soybean, wheat and sunflower) had attained significant biological growth, generating initial recognition and Changes in Fair Value of biological assets of $2.2 million. In addition, 26.9 thousand hectares of 2019/20 winter crops (wheat and barley) had been harvested, generating Changes in Fair Value and Agricultural Produce during 2019 of $4.4 million. As a result, total Changes in Fair Value of Biological Assets and Agricultural Produce during 2019, reached $30.3 million, compared to $36.4 million generated in 2018. The decrease is mainly explained by lower prices expected for 19/20 harvest, as a result of international dynamics.
7
Crops - Changes in Fair Value Breakdown - as of December 31, 2019
12M19 metric SoySoy2ndCrop
CornCorn2ndCrop
Wheat Sunflower Cotton Peanut Total
2018/19 Harvest Year
Total Harvested Area Hectares 48,573 25,620 42,812 4,458 40,611 3,930 5,158 15,608 186,770
Area harvested in previousperiods Hectares — — — — 37,459 — — — 37,459
Area harvested in currentperiod Hectares 48,573 25,620 42,812 4,458 3,152 3,930 5,158 15,608 149,311
Changes in Fair Value12M19 from planted area2018/19 (ii)
$ thousands 5,677 2,737 7,600 785 (376) (34) (356) 7,652 23,685
2019/20 Harvest Year
Total Planted Area Hectares 47,855 21,261 47,543 1,387 3,661 7,535 4,461 16,677 150,380
Area planted in initial growthstages Hectares 42,558 21,261 25,946 1,387 — 4,483 4,461 8,014 108,110
Area planted with significantbiological growth Hectares 5,297 — 21,597 — 3,661 3,052 — 8,663 42,270
Area harvested in currentperiod Hectares — — — — 26,862 — — — 26,862
Changes in Fair Value12M19 from planted area2019/20 (ii)
$ thousands (192) — 1,969 — 325 31 — 36 2,168
Changes in Fair Value12M19 from harvestedarea 2019/20 (i)
$ thousands — — — — 4,438 — — — 4,438
Total Changes in FairValue in 12M19 $ thousands 5,485 2,737 9,569 785 4,387 (3) (356) 7,688 30,290
Rice
Rice - Highlightsmetric 12M19 12M18 Chg %
Gross Sales $ thousands 102,162 100,013 2.1%
Sales of white rice
thousandtons 192.0 182.1 5.4%
$ per ton 432.0 447.0 (3.4)%
$ thousands 82,716 81,442 1.6%
Sales of By-products $ thousands 19,446 18,572 4.7%
Adjusted EBITDA$
thousands 20,328 18,827 8.0%
Adjusted EBIT$
thousands 13,334 12,981 2.7%
Area under production hectares 39,308 40,289 (2.4)%
Rice Mills
Total Processed Rough Rice (1) thousandtons 177.0 169.0 4.7%
Ending stock - White Rice thousandtons 24.0 31.0 (22.6)%
(1) Expressed in white rice equivalent.
8
Adjusted EBITDA corresponding to the Rice segment in 2019 is primarily explained by the harvest of the 2018/19 crop season which took place during 1Q19 and 2Q19, and the biological growth of the 2019/20 season at year-end. Rice crop is planted during the end of the third quarter, grows mainly throughout the fourth quarter, and is mostly harvested during the first quarter of the following year. Harvested rough rice is processed throughout the year and transformed into white rice, which is sold in the local and export markets year round. The majority of the segment’s margins are generated in the first quarter as the crop is harvested, while only a small portion of the margin is generated as the rice is processed and sold during the fourth quarter.
Rice sales during 2019 reached $102.2 million, 2.1% higher year-over-year. This was attributable to the 5.4% increase in selling volumes. Rough rice availability coupled with enhanced efficiencies at the industry level, enabled us to increase processing operations from 169.0 thousand tons to 177.0 thousand tons, 4.7% increase year-over-year. Total sales were partially offset by a slight reduction in average selling prices, as a consequence of the re-introduction of export taxes.
Adjusted EBITDA totaled $20.3 million in 2019, marking a 8.0% increase compared to the same period of last year. The increase was driven by: i) higher selling volumes and a lower carry of inventories (5.4% increase and 22.6% decrease, respectively); ii) $4.2 million increase in Changes in Fair Value of Biological Assets and Agricultural Produce iii) higher operational efficiencies at farm and industry level, coupled with the cost dilution effect as a result of the depreciation of the Argentine peso during 2019, partially offset by lower selling prices due to export taxes.
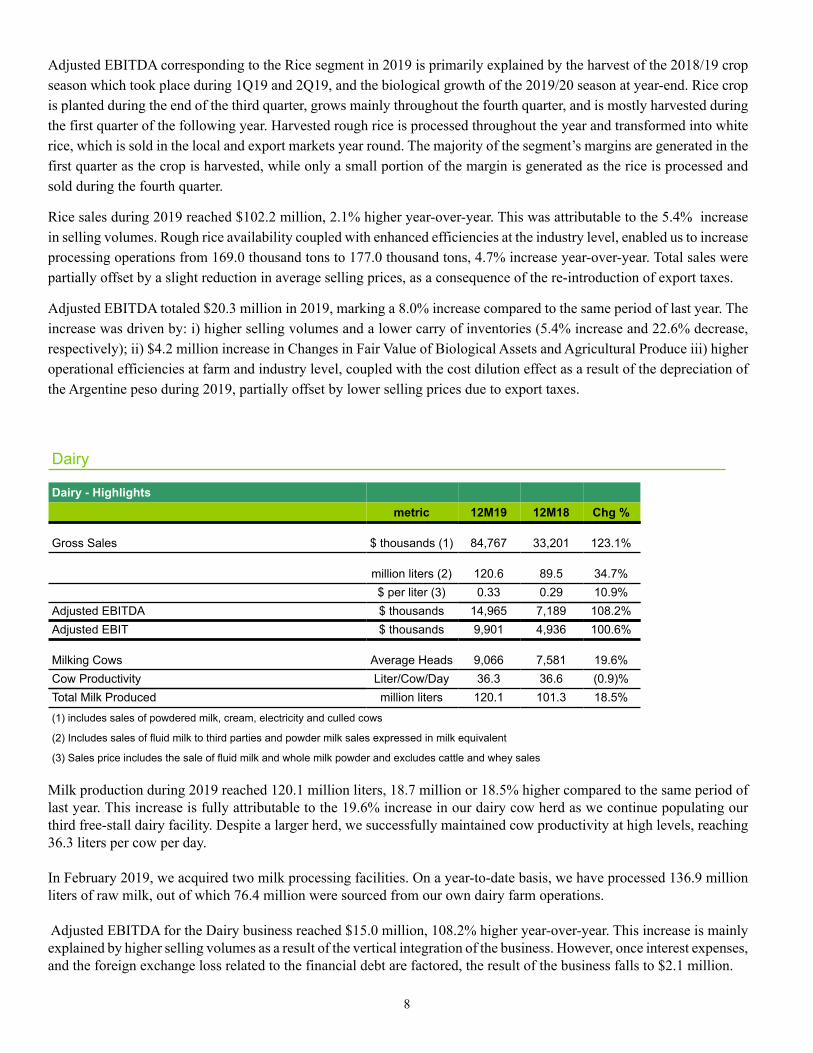
Dairy
Dairy - Highlightsmetric 12M19 12M18 Chg %
Gross Sales $ thousands (1) 84,767 33,201 123.1%
million liters (2) 120.6 89.5 34.7%$ per liter (3) 0.33 0.29 10.9%
Adjusted EBITDA $ thousands 14,965 7,189 108.2%Adjusted EBIT $ thousands 9,901 4,936 100.6%
Milking Cows Average Heads 9,066 7,581 19.6%Cow Productivity Liter/Cow/Day 36.3 36.6 (0.9)%Total Milk Produced million liters 120.1 101.3 18.5%
(1) includes sales of powdered milk, cream, electricity and culled cows
(2) Includes sales of fluid milk to third parties and powder milk sales expressed in milk equivalent
(3) Sales price includes the sale of fluid milk and whole milk powder and excludes cattle and whey sales
Milk production during 2019 reached 120.1 million liters, 18.7 million or 18.5% higher compared to the same period of last year. This increase is fully attributable to the 19.6% increase in our dairy cow herd as we continue populating our third free-stall dairy facility. Despite a larger herd, we successfully maintained cow productivity at high levels, reaching 36.3 liters per cow per day.
In February 2019, we acquired two milk processing facilities. On a year-to-date basis, we have processed 136.9 million liters of raw milk, out of which 76.4 million were sourced from our own dairy farm operations.
Adjusted EBITDA for the Dairy business reached $15.0 million, 108.2% higher year-over-year. This increase is mainly explained by higher selling volumes as a result of the vertical integration of the business. However, once interest expenses, and the foreign exchange loss related to the financial debt are factored, the result of the business falls to $2.1 million.
9
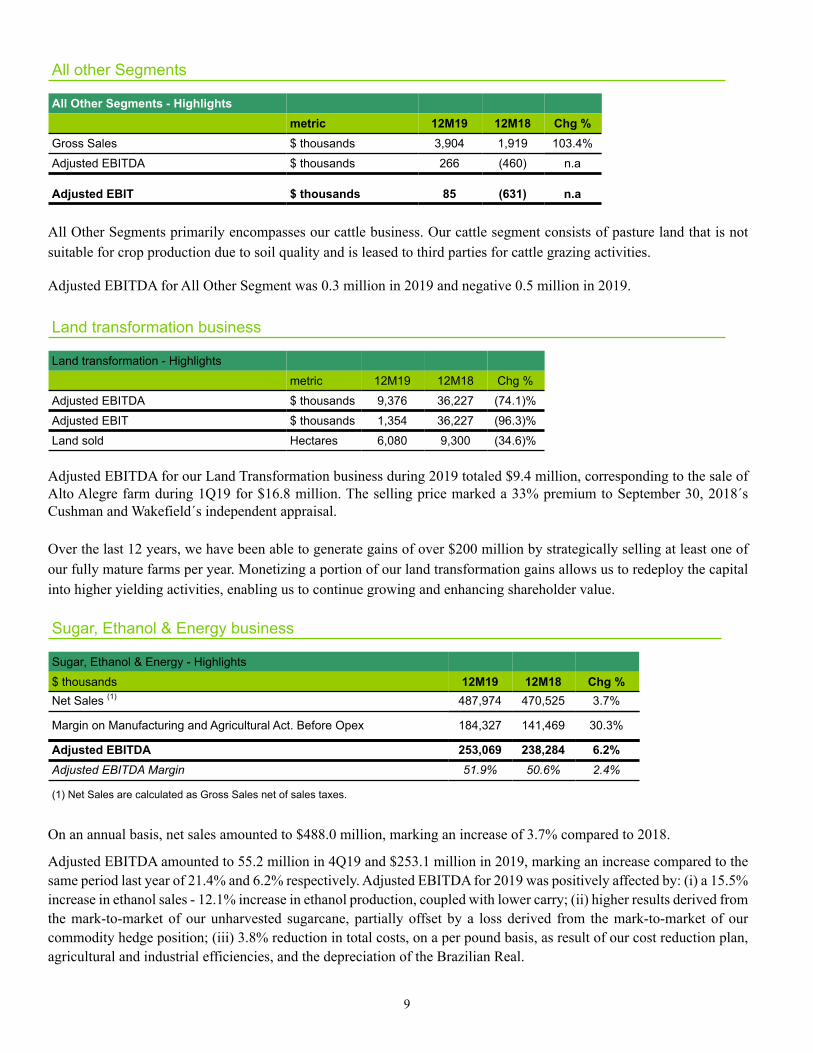
All other Segments
All Other Segments - Highlightsmetric 12M19 12M18 Chg %
Gross Sales $ thousands 3,904 1,919 103.4%
Adjusted EBITDA $ thousands 266 (460) n.a
Adjusted EBIT $ thousands 85 (631) n.a
All Other Segments primarily encompasses our cattle business. Our cattle segment consists of pasture land that is not suitable for crop production due to soil quality and is leased to third parties for cattle grazing activities.
Adjusted EBITDA for All Other Segment was 0.3 million in 2019 and negative 0.5 million in 2019.
Land transformation business
Land transformation - Highlights
metric 12M19 12M18 Chg %
Adjusted EBITDA $ thousands 9,376 36,227 (74.1)%
Adjusted EBIT $ thousands 1,354 36,227 (96.3)%
Land sold Hectares 6,080 9,300 (34.6)%
Adjusted EBITDA for our Land Transformation business during 2019 totaled $9.4 million, corresponding to the sale of Alto Alegre farm during 1Q19 for $16.8 million. The selling price marked a 33% premium to September 30, 2018´s Cushman and Wakefield´s independent appraisal.
Over the last 12 years, we have been able to generate gains of over $200 million by strategically selling at least one of our fully mature farms per year. Monetizing a portion of our land transformation gains allows us to redeploy the capital into higher yielding activities, enabling us to continue growing and enhancing shareholder value.
Sugar, Ethanol & Energy business
Sugar, Ethanol & Energy - Highlights
$ thousands 12M19 12M18 Chg %Net Sales (1) 487,974 470,525 3.7%
Margin on Manufacturing and Agricultural Act. Before Opex 184,327 141,469 30.3%
Adjusted EBITDA 253,069 238,284 6.2%Adjusted EBITDA Margin 51.9% 50.6% 2.4%
(1) Net Sales are calculated as Gross Sales net of sales taxes.
On an annual basis, net sales amounted to $488.0 million, marking an increase of 3.7% compared to 2018.
Adjusted EBITDA amounted to 55.2 million in 4Q19 and $253.1 million in 2019, marking an increase compared to the same period last year of 21.4% and 6.2% respectively. Adjusted EBITDA for 2019 was positively affected by: (i) a 15.5% increase in ethanol sales - 12.1% increase in ethanol production, coupled with lower carry; (ii) higher results derived from the mark-to-market of our unharvested sugarcane, partially offset by a loss derived from the mark-to-market of our commodity hedge position; (iii) 3.8% reduction in total costs, on a per pound basis, as result of our cost reduction plan, agricultural and industrial efficiencies, and the depreciation of the Brazilian Real.
10
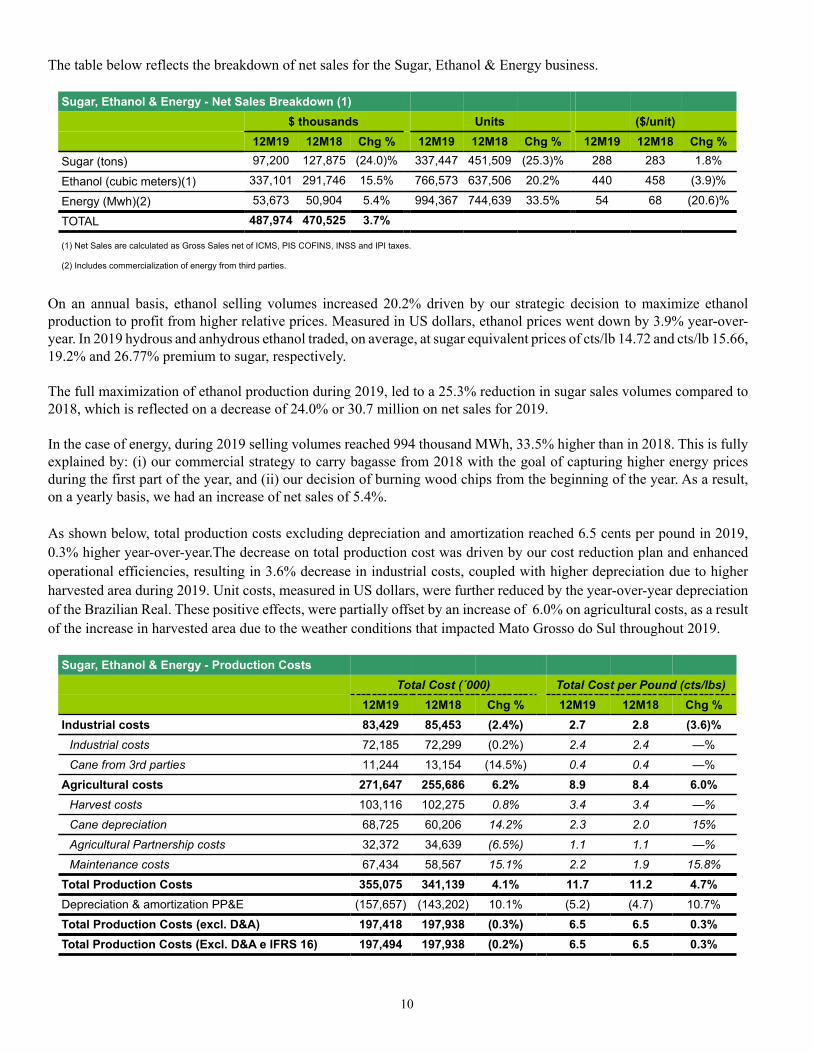
The table below reflects the breakdown of net sales for the Sugar, Ethanol & Energy business.
Sugar, Ethanol & Energy - Net Sales Breakdown (1)$ thousands Units ($/unit)
12M19 12M18 Chg % 12M19 12M18 Chg % 12M19 12M18 Chg %Sugar (tons) 97,200 127,875 (24.0)% 337,447 451,509 (25.3)% 288 283 1.8%
Ethanol (cubic meters)(1) 337,101 291,746 15.5% 766,573 637,506 20.2% 440 458 (3.9)%
Energy (Mwh)(2) 53,673 50,904 5.4% 994,367 744,639 33.5% 54 68 (20.6)%
TOTAL 487,974 470,525 3.7%
(1) Net Sales are calculated as Gross Sales net of ICMS, PIS COFINS, INSS and IPI taxes.
(2) Includes commercialization of energy from third parties.
On an annual basis, ethanol selling volumes increased 20.2% driven by our strategic decision to maximize ethanol production to profit from higher relative prices. Measured in US dollars, ethanol prices went down by 3.9% year-over-year. In 2019 hydrous and anhydrous ethanol traded, on average, at sugar equivalent prices of cts/lb 14.72 and cts/lb 15.66, 19.2% and 26.77% premium to sugar, respectively.
The full maximization of ethanol production during 2019, led to a 25.3% reduction in sugar sales volumes compared to 2018, which is reflected on a decrease of 24.0% or 30.7 million on net sales for 2019.
In the case of energy, during 2019 selling volumes reached 994 thousand MWh, 33.5% higher than in 2018. This is fully explained by: (i) our commercial strategy to carry bagasse from 2018 with the goal of capturing higher energy prices during the first part of the year, and (ii) our decision of burning wood chips from the beginning of the year. As a result, on a yearly basis, we had an increase of net sales of 5.4%.
As shown below, total production costs excluding depreciation and amortization reached 6.5 cents per pound in 2019, 0.3% higher year-over-year.The decrease on total production cost was driven by our cost reduction plan and enhanced operational efficiencies, resulting in 3.6% decrease in industrial costs, coupled with higher depreciation due to higher harvested area during 2019. Unit costs, measured in US dollars, were further reduced by the year-over-year depreciation of the Brazilian Real. These positive effects, were partially offset by an increase of 6.0% on agricultural costs, as a result of the increase in harvested area due to the weather conditions that impacted Mato Grosso do Sul throughout 2019.
Sugar, Ethanol & Energy - Production CostsTotal Cost (´000) Total Cost per Pound (cts/lbs)
12M19 12M18 Chg % 12M19 12M18 Chg %Industrial costs 83,429 85,453 (2.4%) 2.7 2.8 (3.6)%
Industrial costs 72,185 72,299 (0.2%) 2.4 2.4 —%
Cane from 3rd parties 11,244 13,154 (14.5%) 0.4 0.4 —%
Agricultural costs 271,647 255,686 6.2% 8.9 8.4 6.0%Harvest costs 103,116 102,275 0.8% 3.4 3.4 —%
Cane depreciation 68,725 60,206 14.2% 2.3 2.0 15%
Agricultural Partnership costs 32,372 34,639 (6.5%) 1.1 1.1 —%
Maintenance costs 67,434 58,567 15.1% 2.2 1.9 15.8%
Total Production Costs 355,075 341,139 4.1% 11.7 11.2 4.7%Depreciation & amortization PP&E (157,657) (143,202) 10.1% (5.2) (4.7) 10.7%
Total Production Costs (excl. D&A) 197,418 197,938 (0.3%) 6.5 6.5 0.3%Total Production Costs (Excl. D&A e IFRS 16) 197,494 197,938 (0.2%) 6.5 6.5 0.3%
11
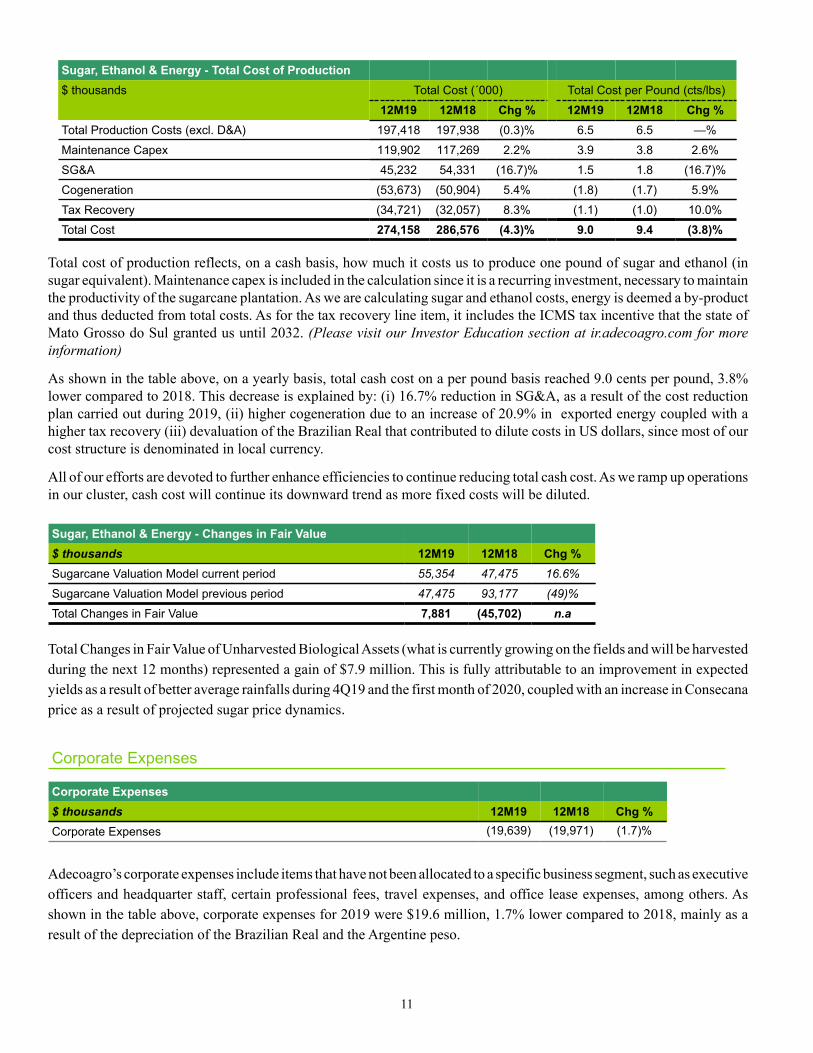
Sugar, Ethanol & Energy - Total Cost of Production$ thousands Total Cost (´000) Total Cost per Pound (cts/lbs)
12M19 12M18 Chg % 12M19 12M18 Chg %Total Production Costs (excl. D&A) 197,418 197,938 (0.3)% 6.5 6.5 —%
Maintenance Capex 119,902 117,269 2.2% 3.9 3.8 2.6%
SG&A 45,232 54,331 (16.7)% 1.5 1.8 (16.7)%
Cogeneration (53,673) (50,904) 5.4% (1.8) (1.7) 5.9%
Tax Recovery (34,721) (32,057) 8.3% (1.1) (1.0) 10.0%
Total Cost 274,158 286,576 (4.3)% 9.0 9.4 (3.8)%
Total cost of production reflects, on a cash basis, how much it costs us to produce one pound of sugar and ethanol (in sugar equivalent). Maintenance capex is included in the calculation since it is a recurring investment, necessary to maintain the productivity of the sugarcane plantation. As we are calculating sugar and ethanol costs, energy is deemed a by-product and thus deducted from total costs. As for the tax recovery line item, it includes the ICMS tax incentive that the state of Mato Grosso do Sul granted us until 2032. (Please visit our Investor Education section at ir.adecoagro.com for more information)
As shown in the table above, on a yearly basis, total cash cost on a per pound basis reached 9.0 cents per pound, 3.8%lower compared to 2018. This decrease is explained by: (i) 16.7% reduction in SG&A, as a result of the cost reduction plan carried out during 2019, (ii) higher cogeneration due to an increase of 20.9% in exported energy coupled with a higher tax recovery (iii) devaluation of the Brazilian Real that contributed to dilute costs in US dollars, since most of our cost structure is denominated in local currency.
All of our efforts are devoted to further enhance efficiencies to continue reducing total cash cost. As we ramp up operations in our cluster, cash cost will continue its downward trend as more fixed costs will be diluted.
Sugar, Ethanol & Energy - Changes in Fair Value$ thousands 12M19 12M18 Chg %Sugarcane Valuation Model current period 55,354 47,475 16.6%
Sugarcane Valuation Model previous period 47,475 93,177 (49)%
Total Changes in Fair Value 7,881 (45,702) n.a
Total Changes in Fair Value of Unharvested Biological Assets (what is currently growing on the fields and will be harvested during the next 12 months) represented a gain of $7.9 million. This is fully attributable to an improvement in expected yields as a result of better average rainfalls during 4Q19 and the first month of 2020, coupled with an increase in Consecana price as a result of projected sugar price dynamics.
Corporate Expenses
Corporate Expenses$ thousands 12M19 12M18 Chg %Corporate Expenses (19,639) (19,971) (1.7)%
Adecoagro’s corporate expenses include items that have not been allocated to a specific business segment, such as executive officers and headquarter staff, certain professional fees, travel expenses, and office lease expenses, among others. As shown in the table above, corporate expenses for 2019 were $19.6 million, 1.7% lower compared to 2018, mainly as a result of the depreciation of the Brazilian Real and the Argentine peso.
12
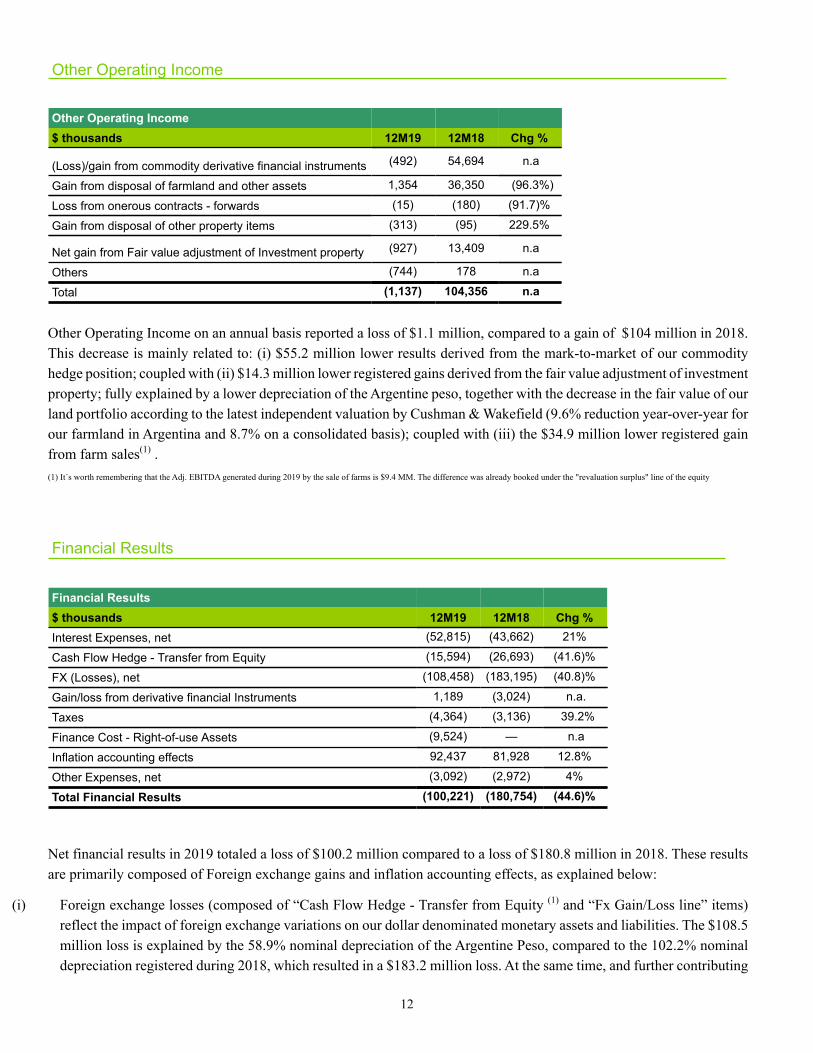
Other Operating Income
Other Operating Income$ thousands 12M19 12M18 Chg %
(Loss)/gain from commodity derivative financial instruments (492) 54,694 n.a
Gain from disposal of farmland and other assets 1,354 36,350 (96.3%)
Loss from onerous contracts - forwards (15) (180) (91.7)%
Gain from disposal of other property items (313) (95) 229.5%
Net gain from Fair value adjustment of Investment property (927) 13,409 n.a
Others (744) 178 n.a
Total (1,137) 104,356 n.a
Other Operating Income on an annual basis reported a loss of $1.1 million, compared to a gain of $104 million in 2018. This decrease is mainly related to: (i) $55.2 million lower results derived from the mark-to-market of our commodity hedge position; coupled with (ii) $14.3 million lower registered gains derived from the fair value adjustment of investment property; fully explained by a lower depreciation of the Argentine peso, together with the decrease in the fair value of our land portfolio according to the latest independent valuation by Cushman & Wakefield (9.6% reduction year-over-year for our farmland in Argentina and 8.7% on a consolidated basis); coupled with (iii) the $34.9 million lower registered gain from farm sales(1) .(1) It´s worth remembering that the Adj. EBITDA generated during 2019 by the sale of farms is $9.4 MM. The difference was already booked under the "revaluation surplus" line of the equity
Financial Results
Financial Results$ thousands 12M19 12M18 Chg %Interest Expenses, net (52,815) (43,662) 21%
Cash Flow Hedge - Transfer from Equity (15,594) (26,693) (41.6)%
FX (Losses), net (108,458) (183,195) (40.8)%
Gain/loss from derivative financial Instruments 1,189 (3,024) n.a.
Taxes (4,364) (3,136) 39.2%
Finance Cost - Right-of-use Assets (9,524) — n.a
Inflation accounting effects 92,437 81,928 12.8%
Other Expenses, net (3,092) (2,972) 4%
Total Financial Results (100,221) (180,754) (44.6)%
Net financial results in 2019 totaled a loss of $100.2 million compared to a loss of $180.8 million in 2018. These results are primarily composed of Foreign exchange gains and inflation accounting effects, as explained below:
(i) Foreign exchange losses (composed of “Cash Flow Hedge - Transfer from Equity (1) and “Fx Gain/Loss line” items) reflect the impact of foreign exchange variations on our dollar denominated monetary assets and liabilities. The $108.5 million loss is explained by the 58.9% nominal depreciation of the Argentine Peso, compared to the 102.2% nominal depreciation registered during 2018, which resulted in a $183.2 million loss. At the same time, and further contributing
13
to the foreign exchange loss, the Brazilian Real depreciated 4.0% during 2019 compared to 17.1% in 2018. These results are non-cash in nature and do not impact the net worth of the Company, in US dollars.
(ii) Inflation accounting effects reflect the results derived from the exposure of our net monetary position to inflation. In this line, monetary assets generate a loss when exposed to inflation while monetary liabilities generate a gain, every time inflation reduces the owed balance, in real terms. During 2019, since we had a negative net monetary position (monetary liabilities were higher than monetary assets), we registered a $92.4 million gain, 12.8% or $10.5 million higher compared to 2018.
(1) Effective July 1, 2014, Adecoagro formally documented and designated cash flow hedging relationships to hedge the foreign exchange rate risk of a portion of its highly probable future sales in US dollars using a portion of its borrowings denominated in US dollars and foreign currency forward contracts. Cash flow hedge accounting permits that gains and losses arising from the effect of changes in foreign currency exchange rates on derivative and non-derivative hedging instruments not be immediately recognized in profit or loss, but be reclassified from equity to profit or loss in the same periods during which the future sales occur, thus allowing for a more appropriate presentation of the results for the period reflecting Adecoagro's Risk Management Policy.
Strategy Execution
5-Year Plan Update
We are reaching the final phase of our 5-year Plan, with only 15% of total projected capex left to be deployed. Out of the remaining $60 million, Brazil will absorb most of it in expanding the sugarcane plantation. Projects are estimated to contribute to a 50% increase in EBITDA and strong cash generation. It should be noted that the remaining projects are marginal in nature, thereby bearing low execution risk.
SE&E Update
The expansion of our cluster in Mato Grosso do Sul continues to proceed according to plan. Virtually all the necessary hectares to fully supply the 3 million tons of additional crushing capacity have already been secured, taking the execution risk of the project to its minimum. Planting operations are also well underway and we feel confident that we will be able to plant the remaining hectares throughout 2020 and 2021, dependent on normal weather conditions.
The combined effect of the frost and dry weather that hit our cluster in 2019, led us to slow down our cane crushing pace for superior agricultural results and a recovery of our sugarcane fields. The reassessment of our crushing strategy derived in a slight delay in our 5-Year-Plan in terms of cash generation. As previously explained, this has been partially mitigated by our ability to divert a record-high of TRS production to ethanol and benefit from higher relative prices. Our continuous focus on enhancing efficiencies and upgrading our industrial assets is a key aspect of our plan, since it allows us to make a more efficient use of our fixed assets and sell the product with the highest marginal contribution.
Processing Facilities Update
Since February 2019 we have been operating our two state-of-the art milk processing facilities with a focus on both quality and cost. The plants' high degree of flexibility has allowed us to sell into the export and domestic markets based on relative profitability, with a view to generate attractive returns.
Our peanut processing facility, acquired in February 2019, has all the necessary certifications and permits, enabling us to control processing activities, avoid tolling and brokerage fees and have access to the most strict markets worldwide which demand Argentine peanut for its superior quality, and are willing to pay a premium for it. In our first campaign as peanut processors, we benefited from better than expected peanut quality due to good weather conditions, coupled with a below average production in our main competitors, Brazil and USA.
14
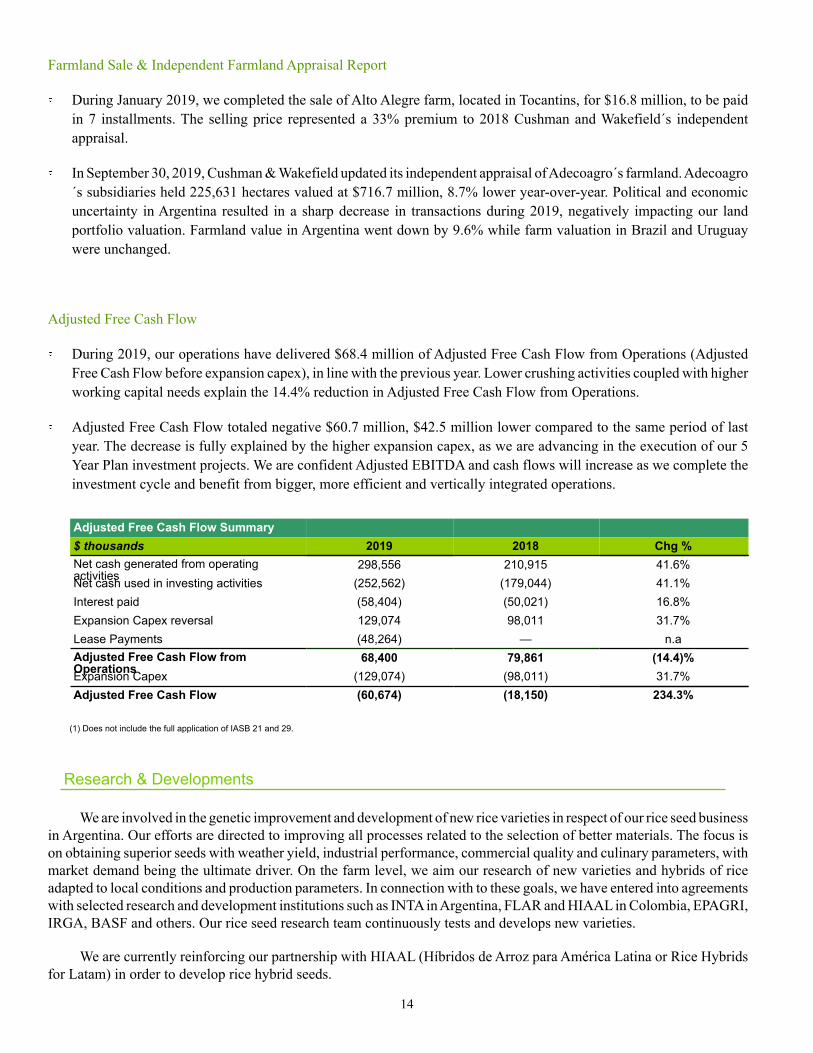
Farmland Sale & Independent Farmland Appraisal Report
During January 2019, we completed the sale of Alto Alegre farm, located in Tocantins, for $16.8 million, to be paid in 7 installments. The selling price represented a 33% premium to 2018 Cushman and Wakefield´s independent appraisal.
In September 30, 2019, Cushman & Wakefield updated its independent appraisal of Adecoagro´s farmland. Adecoagro´s subsidiaries held 225,631 hectares valued at $716.7 million, 8.7% lower year-over-year. Political and economic uncertainty in Argentina resulted in a sharp decrease in transactions during 2019, negatively impacting our land portfolio valuation. Farmland value in Argentina went down by 9.6% while farm valuation in Brazil and Uruguay were unchanged.
Adjusted Free Cash Flow
During 2019, our operations have delivered $68.4 million of Adjusted Free Cash Flow from Operations (Adjusted Free Cash Flow before expansion capex), in line with the previous year. Lower crushing activities coupled with higher working capital needs explain the 14.4% reduction in Adjusted Free Cash Flow from Operations.
Adjusted Free Cash Flow totaled negative $60.7 million, $42.5 million lower compared to the same period of last year. The decrease is fully explained by the higher expansion capex, as we are advancing in the execution of our 5 Year Plan investment projects. We are confident Adjusted EBITDA and cash flows will increase as we complete the investment cycle and benefit from bigger, more efficient and vertically integrated operations.
Adjusted Free Cash Flow Summary$ thousands 2019 2018 Chg %Net cash generated from operatingactivities
298,556 210,915 41.6%Net cash used in investing activities (252,562) (179,044) 41.1%Interest paid (58,404) (50,021) 16.8%Expansion Capex reversal 129,074 98,011 31.7%Lease Payments (48,264) — n.aAdjusted Free Cash Flow fromOperations
68,400 79,861 (14.4)%Expansion Capex (129,074) (98,011) 31.7%Adjusted Free Cash Flow (60,674) (18,150) 234.3%
(1) Does not include the full application of IASB 21 and 29.
Research & Developments
We are involved in the genetic improvement and development of new rice varieties in respect of our rice seed business in Argentina. Our efforts are directed to improving all processes related to the selection of better materials. The focus is on obtaining superior seeds with weather yield, industrial performance, commercial quality and culinary parameters, with market demand being the ultimate driver. On the farm level, we aim our research of new varieties and hybrids of rice adapted to local conditions and production parameters. In connection with to these goals, we have entered into agreements with selected research and development institutions such as INTA in Argentina, FLAR and HIAAL in Colombia, EPAGRI, IRGA, BASF and others. Our rice seed research team continuously tests and develops new varieties.
We are currently reinforcing our partnership with HIAAL (Híbridos de Arroz para América Latina or Rice Hybrids for Latam) in order to develop rice hybrid seeds.
15
Since 2008, we developed and released four new rice varieties to the market. The newest one, named SCS121 CL, was introduced in 2017, and includes the Clearfield® technology, which was developed in collaboration with BASF, and is tolerant to herbicides that control harmful weeds.
We have registered our own varieties of rice seeds with the corresponding Argentine authorities; the National Institute of Seeds (INASE) and the National Registry of Seed Variety Property (RNPC). Regarding intellectual property of our seeds, we operate under the standards of ArPOV (Asociación Argentina de Protección de las Obtenciones Vegetales)
We use our seed varieties in our farms and also sell them to rice producers in Argentina, Brazil, Uruguay and Paraguay.
We are also developing Zero Grade Level technology in our farms, which help us to reduce water consumption and so energy consumption as well. Additionally, we are developing an Irrigation Surveillance methodology based on the use of Drones, from which we expect to improve water management efficiencies and improved rice yield performance. See more details for both cases in “Technology and Best Practices” section.
Regarding our Sugar & Ethanol business, we have effectively implemented state-of-the-art technologies such as high pressure boilers for high cogeneration capacity, full mechanization of agricultural operations with online GPS tracking systems on all vehicles (trucks, combines, planters), and concentrated vinasse system among others. In addition to that, we are developing vinasse-to-biogas technology in our Cluster in Mato Grosso do Sul (For more details see “Sugar, Ethanol and Energy” in “Operations and Principal Activities” Section). Currently, we are developing a seedling production method called “MPB” (Muda Pre Brotada or Pre-Sprout Seedling). It briefly consist of making the seedling sprout in a greenhouse and planting them directly on the fields, instead of the traditional planting of billets (sugarcane stalk pieces). Two main goals are pursued through this technique. One is to introduce new promising and healthy varieties quickly. Second goal is to obtain a reduction of planting cost, which is achieved by using much less volume of planting seedling per hectare. In addition, and because of this, more land can be applied to sugarcane for milling, instead of using that sugarcane for seedling purposes.
With regards to our Dairy segment in Argentina, we have successfully adapted and implemented the Free Stall model in our operations. Additionally, we have invested in technology to improve the genetics, health and feeding techniques of our cows in order to enhance our milk production. Currently, we are implementing Sexed Semen Technology in all our cows, which is delivering preliminary promising results. The primary goal is to enhance the production of females from our own herd. This allows us to increase the speed-capacity of organic growth and/or to intensify our cow-genetic selection process. The former being critical to our current Dairy growth project, and the latter being key to improve cow performance (productivity, health, and fertility) (See more details in “Dairy Business” in “Operations and Principal Activities” Section).
In addition to traditional R&D activities, since we are constantly looking to improve efficiencies in each of our businesses, we are also constantly researching and analyzing all the available technologies that could be applied in our operations. In addition, we do not only select the best technologies and techniques, but we are strongly involved in their adaptation to our specific needs and local circumstances. Our internal research group is comprised of interdisciplinary teams (agronomists, veterinarians, industrial engineers, technicians, finance and commercial). The group offers support to all business lines and through different levels, from the optimization of current operations, evaluation of new technologies, development of new products, to the assessment of a whole new production system.
Currently we are actively involved in the local AgTech (Agricultural digital-based Technology) ecosystems to identify any high-potential Startup that would not only be able to provide alternative solutions for our operationsand potentially the market. We are also evaluating potential investment in Startups that fit our business (see “Technology and Best Practices” section)
We do not own any registered patents, industrial models or designs, apart from those described in the first paragraph of this section.
16
Forward-looking Statements
This press release contains forward-looking statements that are based on our current expectations, assumptions, estimates and projections about us and our industry. These forward-looking statements can be identified by words or phrases such as “anticipate,” “forecast”, “believe,” “continue,” “estimate,” “expect,” “intend,” “is/are likely to,” “may,” “plan,” “should,” “would,” or other similar expressions.
The forward-looking statements included in this press release relate to, among others: (i) our business prospects and future results of operations; (ii) weather and other natural phenomena; (iii) developments in, or changes to, the laws, regulations and governmental policies governing our business, including limitations on ownership of farmland by foreign entities in certain jurisdictions in which we operate, environmental laws and regulations; (iv) the implementation of our business strategy, including the expansion of our sugarcane cluster in Mato Grosso do Sul and other current projects; (v) our plans relating to acquisitions, joint ventures, strategic alliances or divestitures; (vi) the implementation of our financing strategy and capital expenditure plan; (vii) the maintenance of our relationships with customers; (viii) the competitive nature of the industries in which we operate; (ix) the cost and availability of financing; (x) future demand for the commodities we produce; (xi) international prices for commodities; (xii) the condition of our land holdings; (xiii) the development of the logistics and infrastructure for transportation of our products in the countries where we operate; (xiv) the performance of the South American and world economies; and (xv) the relative value of the Brazilian Reais, the Argentine Peso, and the Uruguayan Peso compared to other currencies; as well as other risks included in the registrant’s other filings and submissions with the United States Securities and Exchange Commission.
These forward-looking statements involve various risks and uncertainties. Although we believe that our expectations expressed in these forward-looking statements are reasonable, our expectations may turn out to be incorrect. Our actual results could be materially different from our expectations. In light of the risks and uncertainties described above, the estimates and forward-looking statements discussed in this press release might not occur, and our future results and our performance may differ materially from those expressed in these forward-looking statements due to, inclusive, but not limited to, the factors mentioned above. Because of these uncertainties, you should not make any investment decision based on these estimates and forward-looking statements.
The forward-looking statements made in this press release related only to events or information as of the date on which the statements are made in this press release. We undertake no obligation to update any forward-looking statements to reflect events or circumstances after the date on which the statements are made or to reflect the occurrence of unanticipated events.
17
OPERATING PERFORMANCE
Farming Business
2019/20 Harvest Year
2019/2020 Planting PlanPlanting & Production Planting Plan (hectares) 2019/20 Planting Progress
2019/2020 2018/2019 Chg % 2019/2020 Chg %Soybean 47,530 47,411 0.2% 47,530 100.0%
Soybean 2nd Crop 27,169 25,621 6.0% 25,391 93.5%
Corn (1) 53,914 43,449 24.0% 53,458 99.2%
Corn 2nd Crop 7,319 7,913 (7.5)% 7,121 97.3%
Wheat (2) 32,925 40,271 (18.2)% 32,925 100.0%
Sunflower 6,818 3,825 78.2% 6,818 100.0%
Cotton 4,461 5,316 (16.1)% 4,461 100.0%
Peanut 16,814 15,608 7.7% 16,814 100.0%
Total Crops 196,950 189,412 4.0% 194,518 98.8%
Rice 41,544 40,435 2.7% 41,544 100.0%
Total Farming 238,494 229,847 3.8% 236,062 99.0%
Owned Croppable Area 106,513 110,974 (4.0)%
Leased Area 97,493 86,450 12.8%
Second Crop Area 34,488 32,423 6.4%
Total Farming Area 238,494 229,847 3.8%
(1) Includes chia.(2) Includes barley.
During the second half of 2019, we began our planting activities for the 2019/20 harvest year. Planting activities continued throughout early 2020, and we have so far seeded a total of 236,062 hectares, representing a planting progress of 99.0%. 2019/20 planting plan of 238,494 represents a 3.8% increase in planting area compared to the previous season. Owned croppable area reached 106,513 hectares, 4.0% or 4,461 hectares lower than the 2018/19 season. Leased area, which varies in size on the basis of return on invested capital, has increased by 12.8%, reaching 97,493 hectares.
Crops Update
Soybean: 47,530 hectares have been successfully seeded, which represent 100% of our revised planting plan. We planted the soybean crop between mid-October and December, according to schedule. Timely and abundant rainfalls during January 2020 allowed the crop to develop optimally and we expect above-average yields.
Soybean 2nd crop: 25,391 hectares have been successfully planted, representing a 93.5% planting progress. Crops are developing well.
Corn: 53,458 hectares have been successfully planted, representing almost 100% of the planting plan. In an effort to diversify our crop risk and minimize our water requirements, approximately 35% of the area was planted with early corn seeds in August and September and the remaining 65% of the area was planted with late seed varieties during the end of November and December of 2019. Early corn grew under favorable conditions with adequate rains in December 2019 and the beginning of January 2020, which occurred during the plant flowering or critical growth stage, resulting in higher than expected yields. Late corn planted areas are expected to develop normally.
18
Peanut: 16,814 hectares have been successfully seeded, 7.7% higher compared to the 2018/19 harvest season. The crop is developing in excellent conditions with favorable rainfall during the December-February period. We expect yields to be good, and in line with our budget.
Sugar, Ethanol & Energy Business
Sugar, Ethanol & Energy - Selected Informationmetric 2019 2018 Chg %
MillingSugarcane Milled tons 10,845,136 11,359,204 (4.5)%Own Cane tons 10,411,801 10,748,091 (3.1)%
Third Party Cane tons 433,335 611,112 (29.1)%
Production
TRS Equivalent Produced tons 1,508,869 1,506,048 0.2%
Sugar tons 213,256 344,137 (38.0)%
Ethanol M3 756,494 675,001 12.1%
Hydrous Ethanol M3 510,358 470,448 8.5%
Anhydrous Ethanol M3 246,136 204,553 20.3%
Sugar mix in production % 15% 26% (42.3)%
Ethanol mix in production % 85% 74% 14.9%
Energy Exported (sold to grid) MWh 853,139 705,539 20.9%
Cogen efficiency (KWh sold per ton crushed) KWh/ton 79 62 26.7%
Agricultural Metrics
Harvested own sugarcane tons 10,411,801 10,748,091 (3.1)%
Harvested area Hectares 137,730 120,401 14.4%
Yield tons/hectare 76 89 (14.6)%
TRS content kg/ton 133 128 4.2%
TRS per hectare kg/hectare 10,049 11,392 (11.8)%
Mechanized harvest % 98.4% 98.7% (0.3)%
Area
Sugarcane Plantation hectares 166,041 153,690 8.0%
Expansion & Renewal Area hectares 29,594 29,653 (0.2)%
We milled a total of 1.8 million tons of sugarcane in 4Q19 and 10.8 million during 2019, a decrease of 34.3% and 4.5%respectively compared to the same period last year. The reduction in tons crushed is explained by the combination of dry weather that affected Mato Grosso do Sul during the first three quarters of the year, impacting 2019 yields (14.6% lower), and the frost that hit the region during July. We continued with our strategy of slowing down our crushing pace, on a per hour basis, which in hand with the favorable weather conditions experienced during 4Q19 (average rains for the period were 456mm, in line with 10 year average), will allow our sugarcane plantation to reach optimal conditions in the following quarters.
Despite the adverse weather conditions, we were able to extract the highest value of each ton crushed, explained by: (i) the maximization of the production mix, with ethanol mix reaching 94% in 4Q19 and 85% on a yearly basis, allowing us to profit from higher relative prices during the year (in 2019 hydrous and anhydrous ethanol traded on average at sugar equivalent prices of cts/lb 14.72 and cts/lb 15.66, 19.2% and 26.77% premium to sugar, respectively), and (ii) our focus on efficiencies and cost reduction plan, which resulted in a lower cash cost per unit, despite the decrease in sugarcane crushing (it is worth highlighting that almost 80% of our costs are fixed, therefore as more sugarcane is crushed more fixed cost will be diluted).
19
Ethanol production in 2019 was 12.1% higher year-over-year, reaching 756.5 thousand cubic meters - an all-time record -, whereas our sugar production was 213.3 thousand tons, 38.0% lower than in 2018. Ethanol production was driven by (i) higher alcohol content in the cane juice, and (ii) minor investments made during the year in the industrial process, including accumulation in storage tanks that enabled us to store sugar molasses (a sub-product of the sugar production process). This allowed us to produce ethanol during rainy days - when no cane is being crushed - thus maximizing total ethanol production.
Exported energy totaled 177.5 thousand MWh in 4Q19 and 853.1 thousand MWh during 2019, 17.3% and 20.9% higher compared to the same period last year, respectively. The increase is driven by our strategy of burning bagasse that was carried from 2018, coupled with the burning of wood chips. Our cogeneration efficiency ratio was 98 KWh per ton crushed in 4Q19, marking a record high, and 79 KWh/ton in 2019, an increase of 78.6% and 26.7% respectively. This fits into our sustainability model and situates us in a solid position as green power suppliers.
As of December 31, 2019, our sugarcane plantation consisted of 166.0 thousand hectares, 8.0% higher compared to 2018. Sugarcane planting continues to be a key strategy to supply our mills with quality raw material at low cost. During 2019, we planted a total of 29.6 thousand hectares of sugarcane. Of this total area, 12.3 thousand hectares corresponded to expansion areas planted to supply our growing crushing capacity, and 17.2 thousand hectares corresponded to areas planted to renew old plantations with newer and high-yielding sugarcane, thus allowing us to maintain the productivity of our plantation.
RECONCILIATION OF NON-IFRS MEASURES
To supplement our consolidated financial statements, which are prepared and presented in accordance with IFRS, we use the following non-IFRS financial measures in this press release:
• Adjusted EBITDA• Adjusted EBIT• Adjusted EBITDA margin• Net Debt• Net Debt to Adjusted EBITDA• Adjusted Net Income• Adjusted Free Cash Flow• Adjusted Free Cash Flow from Operations
In this section, we provide an explanation and a reconciliation of each of our non-IFRS financial measures to their most directly comparable IFRS measures. The presentation of these financial measures is not intended to be considered in isolation or as a substitute for, or superior to, financial information prepared and presented in accordance with IFRS.
We believe these non-GAAP financial measures provide investors with useful supplemental information about the financial performance of our business, enable comparison of financial results between periods where certain items may vary independent of business performance, and allow for greater transparency with respect to key metrics used by management for financial and operational decision making and as a means to evaluate period-to-period.
There are limitations associated with the use of non-IFRS financial measures as an analytical tool. In particular, many of the adjustments to our IFRS financial measures reflect the exclusion of items, such as depreciation and amortization, changes in fair value and the related income tax effects of the aforementioned exclusions and exchange differences generated by the net liability monetary position in USD in the countries where the functional currency is the local currency, that are recurring and will be reflected in our financial results for the foreseeable future. In addition, these measures may be different from non-IFRS financial measures used by other companies, limiting their usefulness for comparison purposes.
20
Adjusted EBITDA, Adjusted EBIT & Adjusted EBITDA margin
We define Adjusted EBITDA for each of our operating segments as the segment’s share of consolidated profit from operations before financing and taxation for the year or period, as applicable, before depreciation of Property, plant and equipment and amortization of intangible assets, excluding the revaluation result of the hectares hold as investment property, and adjusted by profit or loss from discontinued operations and by gains or losses from disposals of non-controlling interests in subsidiaries whose main underlying asset is farmland which are reflected in our Shareholders Equity under the line item “Reserve from the sale of minority interests in subsidiaries.” Revaluation results from the farmland held as Property, Plant & Equipment
We define “Adjusted Consolidated EBITDA” as (i) consolidated net profit (loss) for the year, as applicable, before interest expense, income taxes, depreciation of Property, plant and equipment and amortization of intangible assets, net gain from fair value adjustments of investment property land, foreign exchange gains or losses, other net financial expenses; and (ii) adjusted by profit or loss from discontinued operations if any; and (iii) adjusted by those items, that do not impact profit and loss, but are recorded directly in shareholders’ equity, i.e., (x) the gains or losses from disposals of non-controlling interests in subsidiaries whose main underlying asset is farmland , reflected under the line item: "Reserve from the sale of non-controlling interests in subsidiaries; and (y) the net increase in value of sold farmland, which has been recognized in either Revaluation surplus or retained earnings.
We believe that Adjusted EBITDA and Adjusted EBIT are for the Company and each operating segment, respectively important measures of operating performance because they allow investors and others to evaluate and compare our consolidated operating results and to evaluate and compare the operating performance of our segments, respectively, including our return on capital and operating efficiencies, from period to period by removing the impact of our capital structure (interest expense from our outstanding debt), asset base (depreciation of Property, plant and equipment and amortization of intangible assets), tax consequences (income taxes), foreign exchange gains or losses and other financial expenses. In addition, by including the gains or losses from disposals of non-controlling interests in subsidiaries whose main underlying asset is farmland, investors can evaluate the full value and returns generated by our land transformation activities. Other companies may calculate Adjusted EBITDA and Adjusted EBIT differently, and therefore Adjusted EBITDA and Adjusted EBIT may not be comparable to similarly titled measures used by other companies. Adjusted EBITDA and Adjusted EBIT are not measure of financial performance under IFRS, and should not be considered in isolation or as an alternative to consolidated net profit (loss), cash flows from operating activities, profit from operations before financing and taxation and other measures determined in accordance with IFRS.
We define Adjusted EBITDA margin as Adjusted EBITDA to net sales. We consider that the presentation of adjusted EBITDA margin provides useful information on how successfully we operate our Company and enhances the ability of investors to compare profitability between segments, periods and with other public companies.
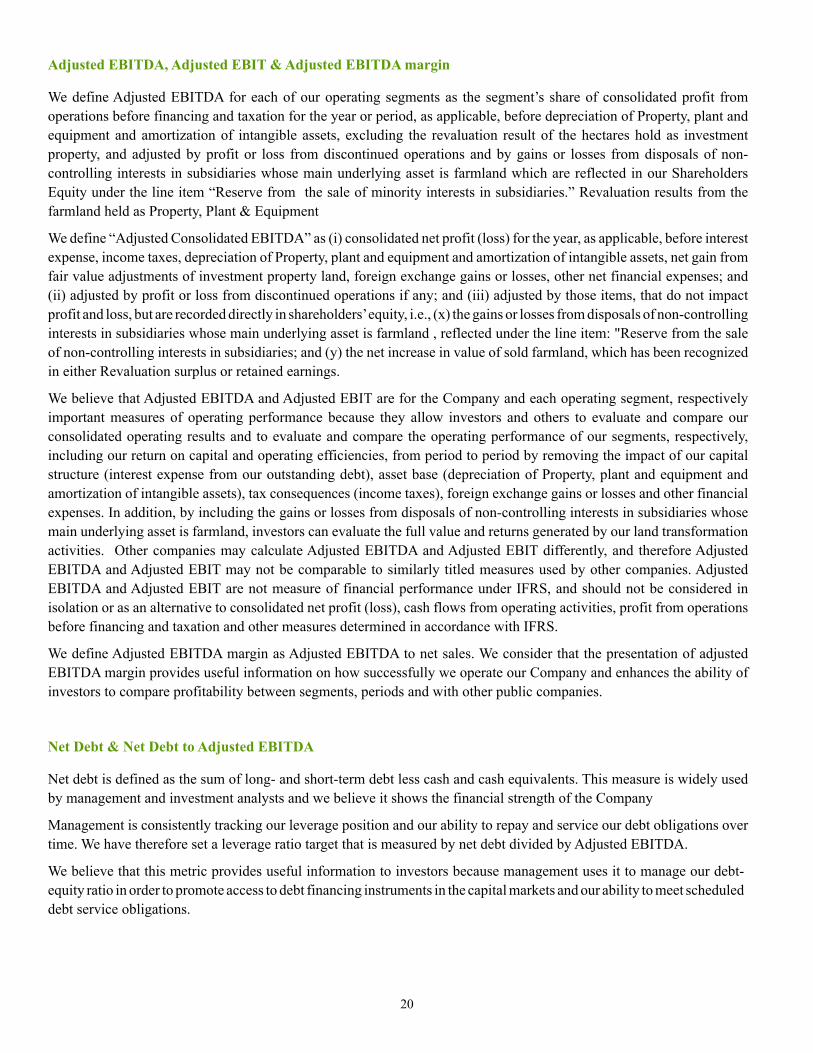
Net Debt & Net Debt to Adjusted EBITDA
Net debt is defined as the sum of long- and short-term debt less cash and cash equivalents. This measure is widely used by management and investment analysts and we believe it shows the financial strength of the Company
Management is consistently tracking our leverage position and our ability to repay and service our debt obligations over time. We have therefore set a leverage ratio target that is measured by net debt divided by Adjusted EBITDA.
We believe that this metric provides useful information to investors because management uses it to manage our debt-equity ratio in order to promote access to debt financing instruments in the capital markets and our ability to meet scheduled debt service obligations.
21
Reconciliation - Net Debt$ thousands 4Q19 4Q18Total Borrowings 968,280 862,116
Cash and Cash equivalents 290,276 273,635
Net Debt 678.004 588,481
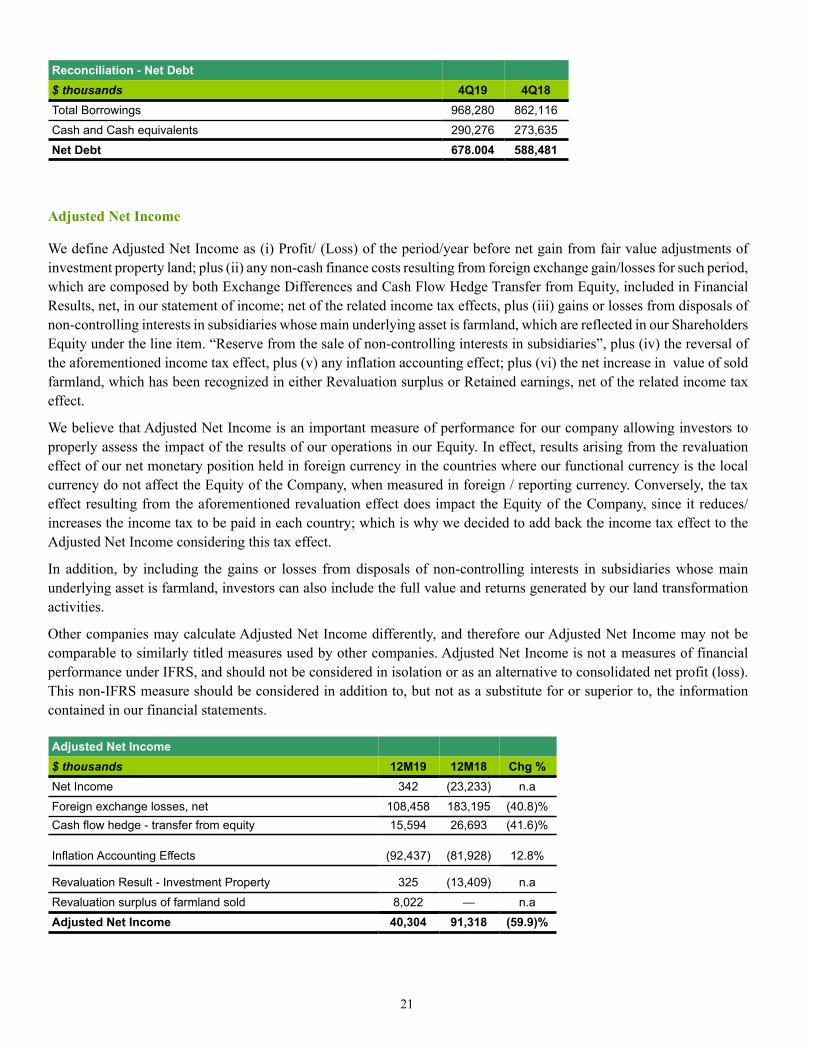
Adjusted Net Income
We define Adjusted Net Income as (i) Profit/ (Loss) of the period/year before net gain from fair value adjustments of investment property land; plus (ii) any non-cash finance costs resulting from foreign exchange gain/losses for such period, which are composed by both Exchange Differences and Cash Flow Hedge Transfer from Equity, included in Financial Results, net, in our statement of income; net of the related income tax effects, plus (iii) gains or losses from disposals of non-controlling interests in subsidiaries whose main underlying asset is farmland, which are reflected in our Shareholders Equity under the line item. “Reserve from the sale of non-controlling interests in subsidiaries”, plus (iv) the reversal of the aforementioned income tax effect, plus (v) any inflation accounting effect; plus (vi) the net increase in value of sold farmland, which has been recognized in either Revaluation surplus or Retained earnings, net of the related income tax effect.
We believe that Adjusted Net Income is an important measure of performance for our company allowing investors to properly assess the impact of the results of our operations in our Equity. In effect, results arising from the revaluation effect of our net monetary position held in foreign currency in the countries where our functional currency is the local currency do not affect the Equity of the Company, when measured in foreign / reporting currency. Conversely, the tax effect resulting from the aforementioned revaluation effect does impact the Equity of the Company, since it reduces/increases the income tax to be paid in each country; which is why we decided to add back the income tax effect to the Adjusted Net Income considering this tax effect.
In addition, by including the gains or losses from disposals of non-controlling interests in subsidiaries whose main underlying asset is farmland, investors can also include the full value and returns generated by our land transformation activities.
Other companies may calculate Adjusted Net Income differently, and therefore our Adjusted Net Income may not be comparable to similarly titled measures used by other companies. Adjusted Net Income is not a measures of financial performance under IFRS, and should not be considered in isolation or as an alternative to consolidated net profit (loss). This non-IFRS measure should be considered in addition to, but not as a substitute for or superior to, the information contained in our financial statements.
Adjusted Net Income$ thousands 12M19 12M18 Chg %Net Income 342 (23,233) n.a
Foreign exchange losses, net 108,458 183,195 (40.8)%Cash flow hedge - transfer from equity 15,594 26,693 (41.6)%
Inflation Accounting Effects (92,437) (81,928) 12.8%
Revaluation Result - Investment Property 325 (13,409) n.a
Revaluation surplus of farmland sold 8,022 — n.a
Adjusted Net Income 40,304 91,318 (59.9)%
22
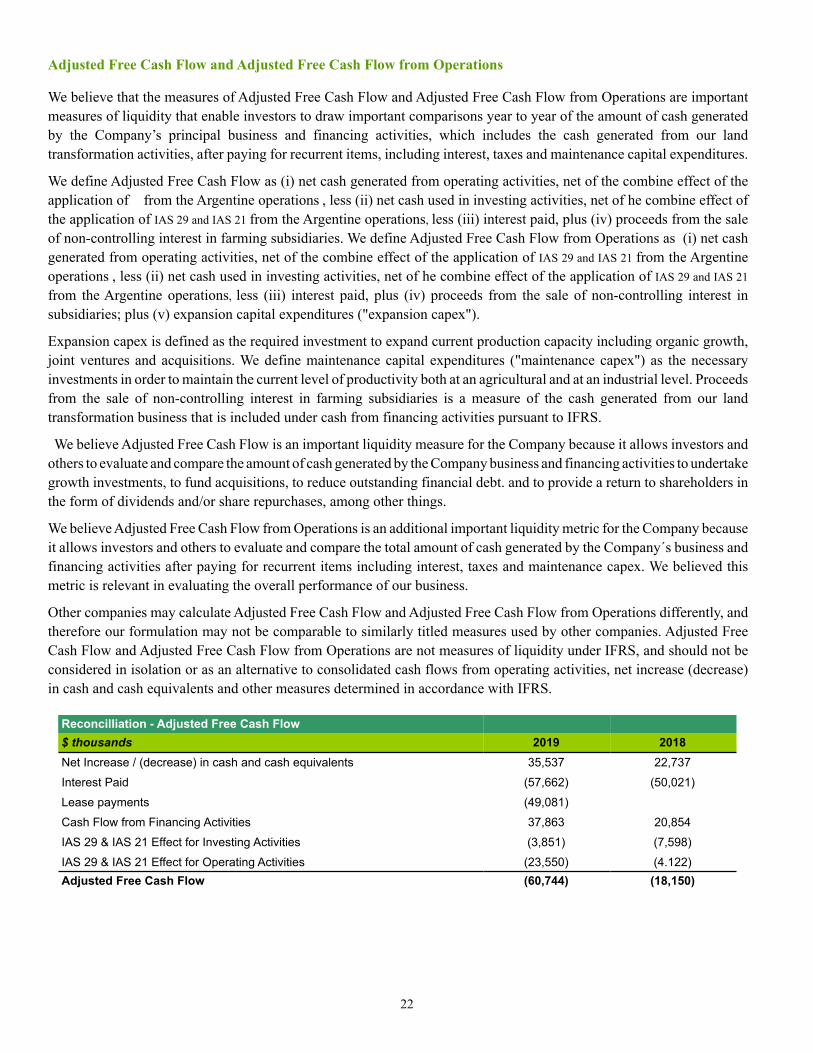
Adjusted Free Cash Flow and Adjusted Free Cash Flow from Operations
We believe that the measures of Adjusted Free Cash Flow and Adjusted Free Cash Flow from Operations are important measures of liquidity that enable investors to draw important comparisons year to year of the amount of cash generated by the Company’s principal business and financing activities, which includes the cash generated from our land transformation activities, after paying for recurrent items, including interest, taxes and maintenance capital expenditures.
We define Adjusted Free Cash Flow as (i) net cash generated from operating activities, net of the combine effect of the application of from the Argentine operations , less (ii) net cash used in investing activities, net of he combine effect of the application of IAS 29 and IAS 21 from the Argentine operations, less (iii) interest paid, plus (iv) proceeds from the sale of non-controlling interest in farming subsidiaries. We define Adjusted Free Cash Flow from Operations as (i) net cash generated from operating activities, net of the combine effect of the application of IAS 29 and IAS 21 from the Argentine operations , less (ii) net cash used in investing activities, net of he combine effect of the application of IAS 29 and IAS 21 from the Argentine operations, less (iii) interest paid, plus (iv) proceeds from the sale of non-controlling interest in subsidiaries; plus (v) expansion capital expenditures ("expansion capex").
Expansion capex is defined as the required investment to expand current production capacity including organic growth, joint ventures and acquisitions. We define maintenance capital expenditures ("maintenance capex") as the necessary investments in order to maintain the current level of productivity both at an agricultural and at an industrial level. Proceeds from the sale of non-controlling interest in farming subsidiaries is a measure of the cash generated from our land transformation business that is included under cash from financing activities pursuant to IFRS.
We believe Adjusted Free Cash Flow is an important liquidity measure for the Company because it allows investors and others to evaluate and compare the amount of cash generated by the Company business and financing activities to undertake growth investments, to fund acquisitions, to reduce outstanding financial debt. and to provide a return to shareholders in the form of dividends and/or share repurchases, among other things.
We believe Adjusted Free Cash Flow from Operations is an additional important liquidity metric for the Company because it allows investors and others to evaluate and compare the total amount of cash generated by the Company´s business and financing activities after paying for recurrent items including interest, taxes and maintenance capex. We believed this metric is relevant in evaluating the overall performance of our business.
Other companies may calculate Adjusted Free Cash Flow and Adjusted Free Cash Flow from Operations differently, and therefore our formulation may not be comparable to similarly titled measures used by other companies. Adjusted Free Cash Flow and Adjusted Free Cash Flow from Operations are not measures of liquidity under IFRS, and should not be considered in isolation or as an alternative to consolidated cash flows from operating activities, net increase (decrease) in cash and cash equivalents and other measures determined in accordance with IFRS.
Reconcilliation - Adjusted Free Cash Flow$ thousands 2019 2018Net Increase / (decrease) in cash and cash equivalents 35,537 22,737
Interest Paid (57,662) (50,021)
Lease payments (49,081)
Cash Flow from Financing Activities 37,863 20,854
IAS 29 & IAS 21 Effect for Investing Activities (3,851) (7,598)
IAS 29 & IAS 21 Effect for Operating Activities (23,550) (4.122)Adjusted Free Cash Flow (60,744) (18,150)
23
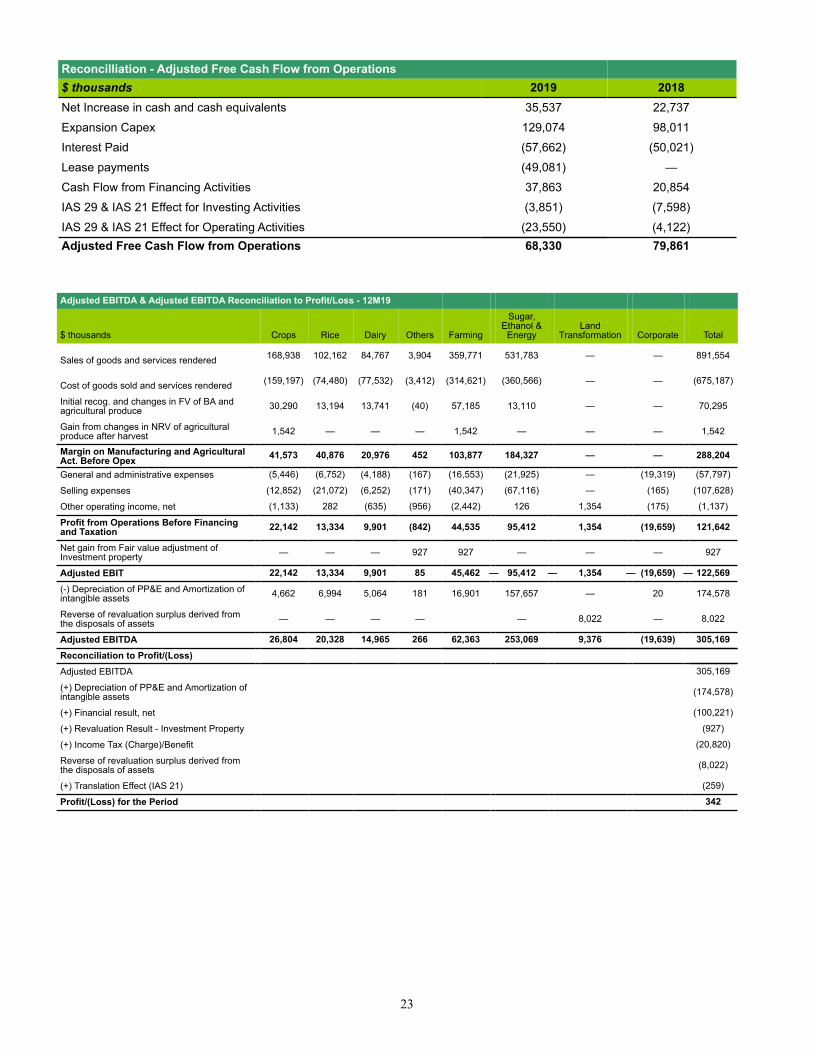
Reconcilliation - Adjusted Free Cash Flow from Operations$ thousands 2019 2018Net Increase in cash and cash equivalents 35,537 22,737
Expansion Capex 129,074 98,011
Interest Paid (57,662) (50,021)
Lease payments (49,081) —
Cash Flow from Financing Activities 37,863 20,854
IAS 29 & IAS 21 Effect for Investing Activities (3,851) (7,598)
IAS 29 & IAS 21 Effect for Operating Activities (23,550) (4,122)Adjusted Free Cash Flow from Operations 68,330 79,861
Adjusted EBITDA & Adjusted EBITDA Reconciliation to Profit/Loss - 12M19
$ thousands Crops Rice Dairy Others Farming
Sugar,Ethanol &
EnergyLand
Transformation Corporate Total
Sales of goods and services rendered 168,938 102,162 84,767 3,904 359,771 531,783 — — 891,554
Cost of goods sold and services rendered (159,197) (74,480) (77,532) (3,412) (314,621) (360,566) — — (675,187)
Initial recog. and changes in FV of BA andagricultural produce 30,290 13,194 13,741 (40) 57,185 13,110 — — 70,295
Gain from changes in NRV of agriculturalproduce after harvest 1,542 — — — 1,542 — — — 1,542
Margin on Manufacturing and AgriculturalAct. Before Opex 41,573 40,876 20,976 452 103,877 184,327 — — 288,204
General and administrative expenses (5,446) (6,752) (4,188) (167) (16,553) (21,925) — (19,319) (57,797)
Selling expenses (12,852) (21,072) (6,252) (171) (40,347) (67,116) — (165) (107,628)
Other operating income, net (1,133) 282 (635) (956) (2,442) 126 1,354 (175) (1,137)
Profit from Operations Before Financingand Taxation 22,142 13,334 9,901 (842) 44,535 95,412 1,354 (19,659) 121,642
Net gain from Fair value adjustment ofInvestment property — — — 927 927 — — — 927
Adjusted EBIT 22,142 13,334 9,901 85 45,462 — 95,412 — 1,354 — (19,659) — 122,569
(-) Depreciation of PP&E and Amortization ofintangible assets 4,662 6,994 5,064 181 16,901 157,657 — 20 174,578
Reverse of revaluation surplus derived fromthe disposals of assets — — — — — 8,022 — 8,022
Adjusted EBITDA 26,804 20,328 14,965 266 62,363 253,069 9,376 (19,639) 305,169
Reconciliation to Profit/(Loss)Adjusted EBITDA 305,169
(+) Depreciation of PP&E and Amortization ofintangible assets (174,578)
(+) Financial result, net (100,221)
(+) Revaluation Result - Investment Property (927)
(+) Income Tax (Charge)/Benefit (20,820)
Reverse of revaluation surplus derived fromthe disposals of assets (8,022)
(+) Translation Effect (IAS 21) (259)
Profit/(Loss) for the Period 342
24
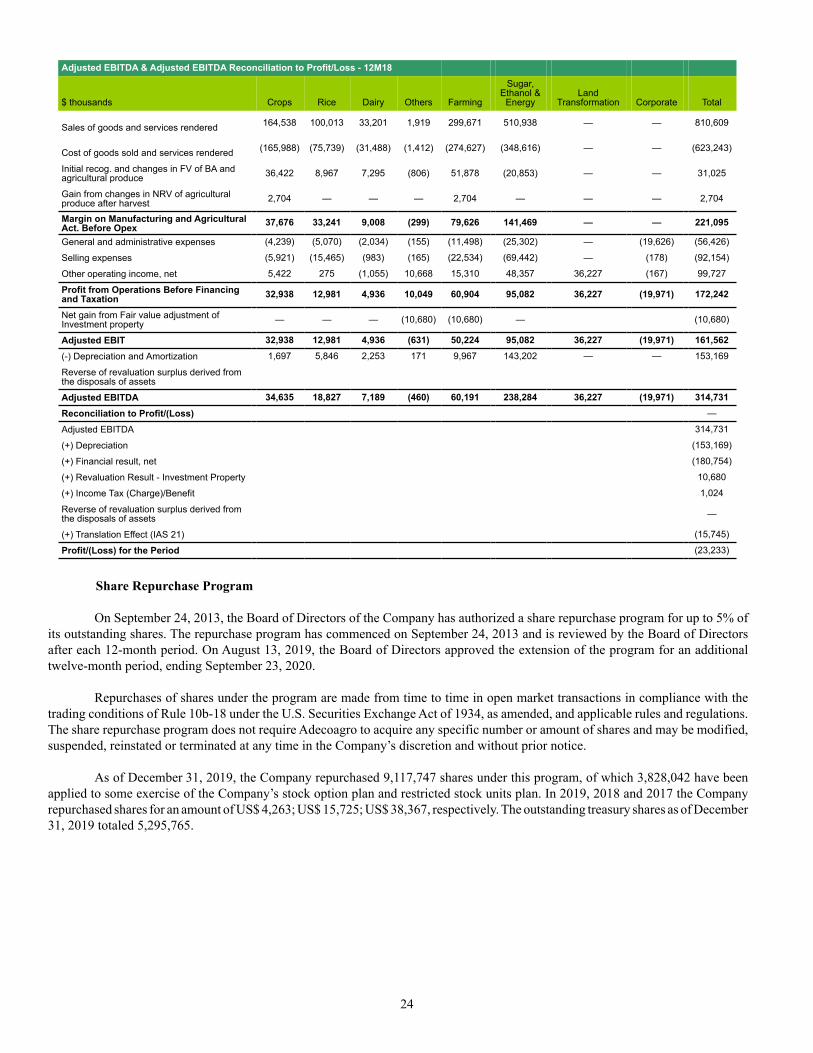
Adjusted EBITDA & Adjusted EBITDA Reconciliation to Profit/Loss - 12M18
$ thousands Crops Rice Dairy Others Farming
Sugar,Ethanol &
EnergyLand
Transformation Corporate Total
Sales of goods and services rendered 164,538 100,013 33,201 1,919 299,671 510,938 — — 810,609
Cost of goods sold and services rendered (165,988) (75,739) (31,488) (1,412) (274,627) (348,616) — — (623,243)
Initial recog. and changes in FV of BA andagricultural produce 36,422 8,967 7,295 (806) 51,878 (20,853) — — 31,025
Gain from changes in NRV of agriculturalproduce after harvest 2,704 — — — 2,704 — — — 2,704
Margin on Manufacturing and AgriculturalAct. Before Opex 37,676 33,241 9,008 (299) 79,626 141,469 — — 221,095
General and administrative expenses (4,239) (5,070) (2,034) (155) (11,498) (25,302) — (19,626) (56,426)
Selling expenses (5,921) (15,465) (983) (165) (22,534) (69,442) — (178) (92,154)
Other operating income, net 5,422 275 (1,055) 10,668 15,310 48,357 36,227 (167) 99,727
Profit from Operations Before Financingand Taxation 32,938 12,981 4,936 10,049 60,904 95,082 36,227 (19,971) 172,242
Net gain from Fair value adjustment ofInvestment property — — — (10,680) (10,680) — (10,680)
Adjusted EBIT 32,938 12,981 4,936 (631) 50,224 95,082 36,227 (19,971) 161,562
(-) Depreciation and Amortization 1,697 5,846 2,253 171 9,967 143,202 — — 153,169
Reverse of revaluation surplus derived fromthe disposals of assets
Adjusted EBITDA 34,635 18,827 7,189 (460) 60,191 238,284 36,227 (19,971) 314,731
Reconciliation to Profit/(Loss) —
Adjusted EBITDA 314,731
(+) Depreciation (153,169)
(+) Financial result, net (180,754)
(+) Revaluation Result - Investment Property 10,680
(+) Income Tax (Charge)/Benefit 1,024
Reverse of revaluation surplus derived fromthe disposals of assets —
(+) Translation Effect (IAS 21) (15,745)
Profit/(Loss) for the Period (23,233)
Share Repurchase Program
On September 24, 2013, the Board of Directors of the Company has authorized a share repurchase program for up to 5% of its outstanding shares. The repurchase program has commenced on September 24, 2013 and is reviewed by the Board of Directors after each 12-month period. On August 13, 2019, the Board of Directors approved the extension of the program for an additional twelve-month period, ending September 23, 2020.
Repurchases of shares under the program are made from time to time in open market transactions in compliance with the trading conditions of Rule 10b-18 under the U.S. Securities Exchange Act of 1934, as amended, and applicable rules and regulations. The share repurchase program does not require Adecoagro to acquire any specific number or amount of shares and may be modified, suspended, reinstated or terminated at any time in the Company’s discretion and without prior notice.
As of December 31, 2019, the Company repurchased 9,117,747 shares under this program, of which 3,828,042 have been
applied to some exercise of the Company’s stock option plan and restricted stock units plan. In 2019, 2018 and 2017 the Company repurchased shares for an amount of US$ 4,263; US$ 15,725; US$ 38,367, respectively. The outstanding treasury shares as of December 31, 2019 totaled 5,295,765.
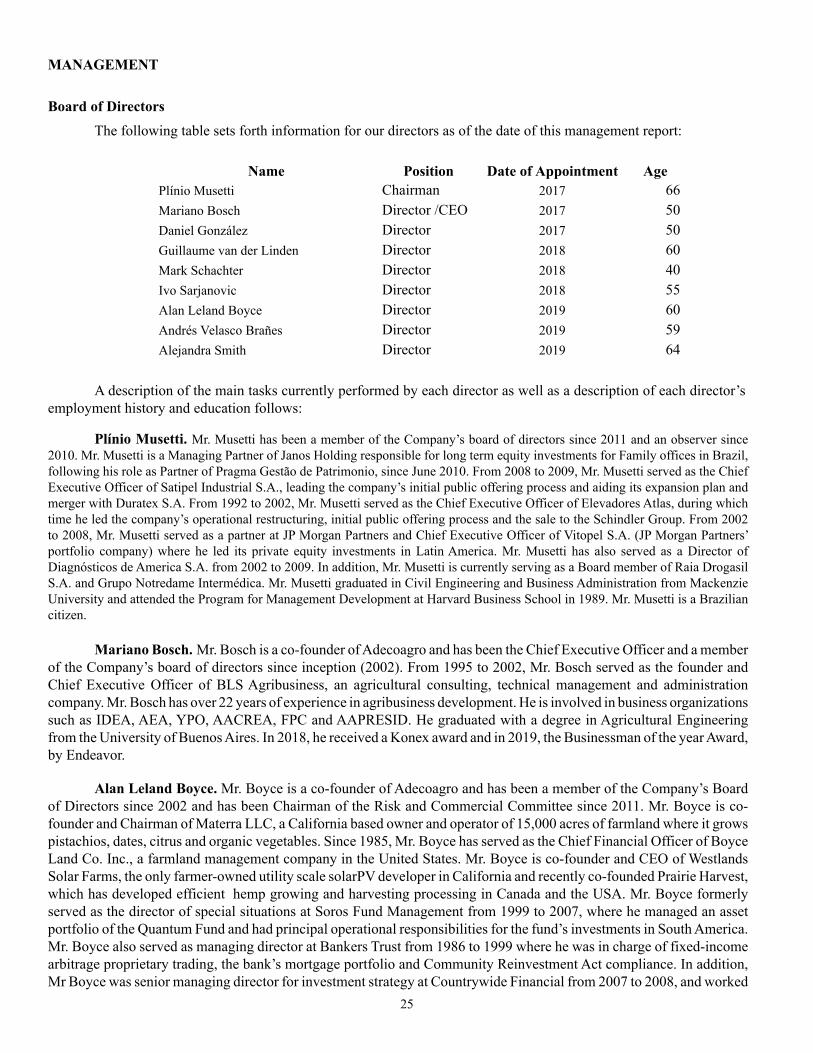
25
MANAGEMENT
Board of Directors The following table sets forth information for our directors as of the date of this management report:
Name Position Date of Appointment AgePlínio Musetti Chairman 2017 66Mariano Bosch Director /CEO 2017 50Daniel González Director 2017 50Guillaume van der Linden Director 2018 60Mark Schachter Director 2018 40Ivo Sarjanovic Director 2018 55Alan Leland Boyce Director 2019 60Andrés Velasco Brañes Director 2019 59Alejandra Smith Director 2019 64
A description of the main tasks currently performed by each director as well as a description of each director’s employment history and education follows:
Plínio Musetti. Mr. Musetti has been a member of the Company’s board of directors since 2011 and an observer since 2010. Mr. Musetti is a Managing Partner of Janos Holding responsible for long term equity investments for Family offices in Brazil, following his role as Partner of Pragma Gestão de Patrimonio, since June 2010. From 2008 to 2009, Mr. Musetti served as the Chief Executive Officer of Satipel Industrial S.A., leading the company’s initial public offering process and aiding its expansion plan and merger with Duratex S.A. From 1992 to 2002, Mr. Musetti served as the Chief Executive Officer of Elevadores Atlas, during which time he led the company’s operational restructuring, initial public offering process and the sale to the Schindler Group. From 2002 to 2008, Mr. Musetti served as a partner at JP Morgan Partners and Chief Executive Officer of Vitopel S.A. (JP Morgan Partners’ portfolio company) where he led its private equity investments in Latin America. Mr. Musetti has also served as a Director of Diagnósticos de America S.A. from 2002 to 2009. In addition, Mr. Musetti is currently serving as a Board member of Raia Drogasil S.A. and Grupo Notredame Intermédica. Mr. Musetti graduated in Civil Engineering and Business Administration from Mackenzie University and attended the Program for Management Development at Harvard Business School in 1989. Mr. Musetti is a Brazilian citizen.
Mariano Bosch. Mr. Bosch is a co-founder of Adecoagro and has been the Chief Executive Officer and a member of the Company’s board of directors since inception (2002). From 1995 to 2002, Mr. Bosch served as the founder and Chief Executive Officer of BLS Agribusiness, an agricultural consulting, technical management and administration company. Mr. Bosch has over 22 years of experience in agribusiness development. He is involved in business organizations such as IDEA, AEA, YPO, AACREA, FPC and AAPRESID. He graduated with a degree in Agricultural Engineering from the University of Buenos Aires. In 2018, he received a Konex award and in 2019, the Businessman of the year Award, by Endeavor.
Alan Leland Boyce. Mr. Boyce is a co-founder of Adecoagro and has been a member of the Company’s Board of Directors since 2002 and has been Chairman of the Risk and Commercial Committee since 2011. Mr. Boyce is co-founder and Chairman of Materra LLC, a California based owner and operator of 15,000 acres of farmland where it grows pistachios, dates, citrus and organic vegetables. Since 1985, Mr. Boyce has served as the Chief Financial Officer of Boyce Land Co. Inc., a farmland management company in the United States. Mr. Boyce is co-founder and CEO of Westlands Solar Farms, the only farmer-owned utility scale solarPV developer in California and recently co-founded Prairie Harvest, which has developed efficient hemp growing and harvesting processing in Canada and the USA. Mr. Boyce formerly served as the director of special situations at Soros Fund Management from 1999 to 2007, where he managed an asset portfolio of the Quantum Fund and had principal operational responsibilities for the fund’s investments in South America. Mr. Boyce also served as managing director at Bankers Trust from 1986 to 1999 where he was in charge of fixed-income arbitrage proprietary trading, the bank’s mortgage portfolio and Community Reinvestment Act compliance. In addition, Mr Boyce was senior managing director for investment strategy at Countrywide Financial from 2007 to 2008, and worked
26
at the U.S. Federal Reserve Board from 1982 to 1984. He graduated with a degree in Economics from Pomona College, and has a Masters in Business Administration from Stanford University. Mr. Boyce is an American citizen.
Andres Velasco Brañes. Mr. Velasco has been a member of the Company’s board of directors since 2011. Mr. Velasco was the Minister of Finance of Chile between March 2006 and March 2010, and was also the president of the Latin American and Caribbean Economic Association from 2005 to 2007. Prior to entering the government sector, Mr. Velasco was Sumitomo-FASID Professor of Development and International Finance at Harvard University’s John F. Kennedy School of Government, an appointment he had held since 2000. From 1993 to 2000, he was Assistant and then Associate Professor of Economics and the director of the Center for Latin American and Caribbean Studies at New York University. During 1988 to 1989, he was Assistant Professor at Columbia University. Currently Mr. Velasco serves as Adjunct Professor of Public Policy at Harvard University, and a Tinker Visiting Professor at Columbia University. He also performs consulting services on various economic matters rendering economic advice to an array of clients, including certain of our shareholders. Mr. Velasco has been appointed Dean of New School of Public Policy at London School of Economics. Mr. Velasco holds a Ph.D. in economics from Columbia University and was a postdoctoral fellow in political economy at Harvard University and the Massachusetts Institute of Technology. He received an B.A. in economics and philosophy and an M.A. in international relations from Yale University. Mr. Velasco is a Chilean citizen.
Daniel C. Gonzalez. Mr. Gonzalez has been a member of the Company’s board of directions since April 16, 2014. Mr. Gonzalez holds a degree in Business Administration from the Argentine Catholic University. He served for 14 years in the investment bank Merrill Lynch & Co in Buenos Aires and New York, holding the positions of Head of Mergers and Acquisitions for Latin America and President for the Southern Cone (Argentina, Chile, Peru and Uruguay), among others. While at Merrill Lynch, Mr. Gonzalez played a leading role in several of the most important investment banking transactions in the region and was an active member of the firm’s global fairness opinion committee. He remained as a consultant to Bank of America Merrill Lynch after his departure from the bank. Previously, he was Head of Financial Planning and Investor Relations in Transportadora de Gas del Sur SA. Mr. Gonzalez is currently the Chief Executive Officer of YPF Sociedad Anónima, where he is also a member of its Board of Directors. Mr Gonzalez is also a member of the Board of Directors of Hidroeléctrica Piedra del Aguila S.A. Mr. González is an Argentine citizen.
Guillaume van der Linden. Mr. van der Linden has been a member of the Company’s board of directors since 2009. Since 2007, Mr. van der Linden has been Senior Investment Manager at PGGM Vermogensbeheer B.V., currently responsible for investments in emerging markets local currency sovereign debt. From 1993 to 2007, Mr. van der Linden worked for ING Bank in various roles, including in risk management and derivatives trading. From 1988 to 1993, Mr. van der Linden was employed as a management consultant for KPMG and from 1985 to 1988 as a corporate finance analyst for Bank Mees & Hope. Mr. van der Linden graduated with Masters degrees in Economics from Erasmus University Rotterdam and Business Administration from the University of Rochester. Mr. van der Linden is a Dutch citizen.
Mark Schachter. Mr. Schachter has been a member of the Company’s board of directors since 2009. Mr. Schachter has been a Managing Partner of Elm Park Capital Management since 2010. From 2004 to 2010, he was a Portfolio Manager with HBK Capital Management where he was responsible for the firm’s North American private credit activities. His responsibilities included corporate credit investments with a primary focus on middle-market lending and other special situation investment opportunities. From 2003 to 2004, Mr. Schachter worked for American Capital, a middle-market private equity and mezzanine firm and worked in the investment banking division of Credit Suisse Group from 2001 to 2003. Mr. Schachter received a degree in Business Administration from the Ivey Business School at the University of Western Ontario and completed the Program for Leadership Development at Harvard Business School. Mr. Schachter is a Canadian citizen and has permanent American residence.
Ivo Andrés Sarjanovic. Mr. Sarjanovic served for more than 25 years in Cargill International, starting as trader in the Grain and Oilseeds business. While in Cargill he held between years 2000-2011 the position of Vice-president and Global Trading Manager of Oilseeds in Geneva, coordinating worldwide trading and crushing activities, and between 2007-2011 he was also the Africa and Middle East General Manager of Agriculture. From 2011 to 2014 Mr. Sarjanovic held the position of Vice-president and World Manager of Cargill Sugar Operations, playing a leading role in the radical transformation of the organization that led to the strategic decision to spin-off in 2014 the sugar business of Cargill creating Alvean Sugar SL, a joint venture integrated with Copersucar, Brazil. Mr. Sarjanovic served as the Chief Executive Officer
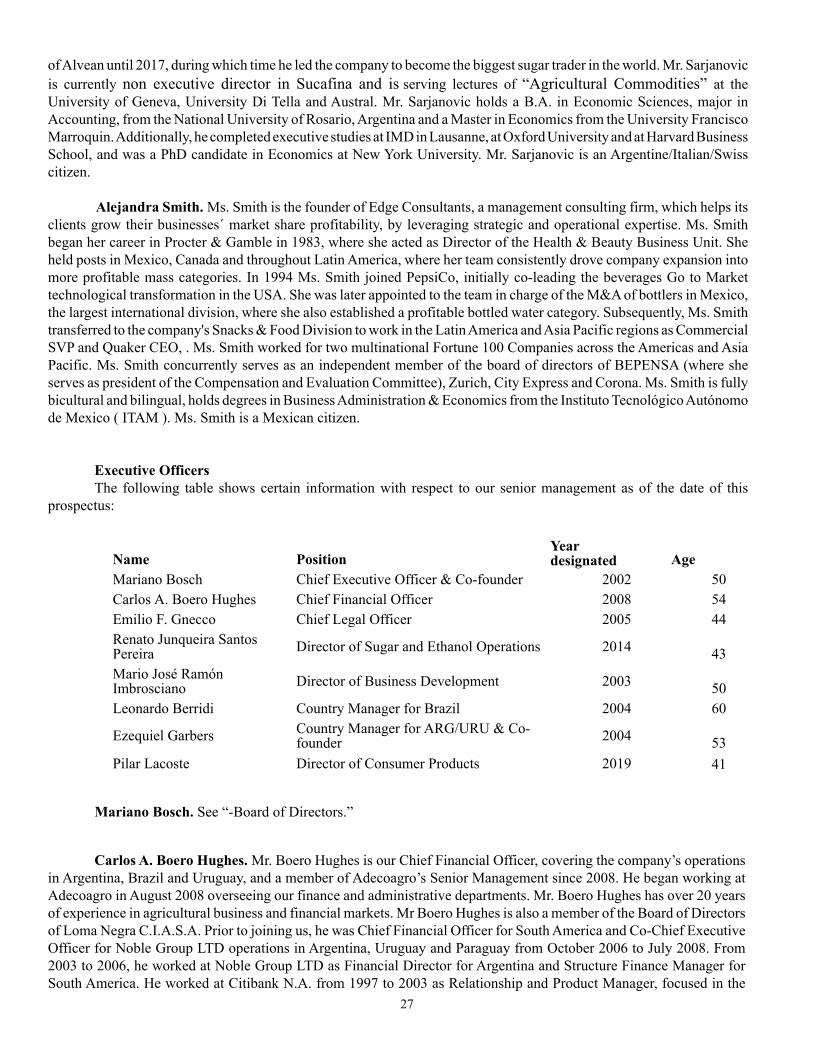
27
of Alvean until 2017, during which time he led the company to become the biggest sugar trader in the world. Mr. Sarjanovic is currently non executive director in Sucafina and is serving lectures of “Agricultural Commodities” at the University of Geneva, University Di Tella and Austral. Mr. Sarjanovic holds a B.A. in Economic Sciences, major in Accounting, from the National University of Rosario, Argentina and a Master in Economics from the University Francisco Marroquin. Additionally, he completed executive studies at IMD in Lausanne, at Oxford University and at Harvard Business School, and was a PhD candidate in Economics at New York University. Mr. Sarjanovic is an Argentine/Italian/Swiss citizen.
Alejandra Smith. Ms. Smith is the founder of Edge Consultants, a management consulting firm, which helps its clients grow their businesses´ market share profitability, by leveraging strategic and operational expertise. Ms. Smith began her career in Procter & Gamble in 1983, where she acted as Director of the Health & Beauty Business Unit. She held posts in Mexico, Canada and throughout Latin America, where her team consistently drove company expansion into more profitable mass categories. In 1994 Ms. Smith joined PepsiCo, initially co-leading the beverages Go to Market technological transformation in the USA. She was later appointed to the team in charge of the M&A of bottlers in Mexico, the largest international division, where she also established a profitable bottled water category. Subsequently, Ms. Smith transferred to the company's Snacks & Food Division to work in the Latin America and Asia Pacific regions as Commercial SVP and Quaker CEO, . Ms. Smith worked for two multinational Fortune 100 Companies across the Americas and Asia Pacific. Ms. Smith concurrently serves as an independent member of the board of directors of BEPENSA (where she serves as president of the Compensation and Evaluation Committee), Zurich, City Express and Corona. Ms. Smith is fully bicultural and bilingual, holds degrees in Business Administration & Economics from the Instituto Tecnológico Autónomo de Mexico ( ITAM ). Ms. Smith is a Mexican citizen.
Executive OfficersThe following table shows certain information with respect to our senior management as of the date of this
prospectus:
Name PositionYeardesignated Age
Mariano Bosch Chief Executive Officer & Co-founder 2002 50Carlos A. Boero Hughes Chief Financial Officer 2008 54Emilio F. Gnecco Chief Legal Officer 2005 44Renato Junqueira SantosPereira Director of Sugar and Ethanol Operations 2014 43Mario José RamónImbrosciano Director of Business Development 2003 50Leonardo Berridi Country Manager for Brazil 2004 60
Ezequiel Garbers Country Manager for ARG/URU & Co-founder 2004 53
Pilar Lacoste Director of Consumer Products 2019 41
Mariano Bosch. See “-Board of Directors.”
Carlos A. Boero Hughes. Mr. Boero Hughes is our Chief Financial Officer, covering the company’s operations in Argentina, Brazil and Uruguay, and a member of Adecoagro’s Senior Management since 2008. He began working at Adecoagro in August 2008 overseeing our finance and administrative departments. Mr. Boero Hughes has over 20 years of experience in agricultural business and financial markets. Mr Boero Hughes is also a member of the Board of Directors of Loma Negra C.I.A.S.A. Prior to joining us, he was Chief Financial Officer for South America and Co-Chief Executive Officer for Noble Group LTD operations in Argentina, Uruguay and Paraguay from October 2006 to July 2008. From 2003 to 2006, he worked at Noble Group LTD as Financial Director for Argentina and Structure Finance Manager for South America. He worked at Citibank N.A. from 1997 to 2003 as Relationship and Product Manager, focused in the
28
agribusiness industry, and at Banco Privado de Inversiones S.A. as Relationship Manager. He also worked for six years at Carlos Romano Boero S.A.I.C., a flour and dairy cow feed mill family company, as Commercial Manager, Local Grain Elevator and Nursery Manager and finally as General Manager. Mr. Boero Hughes holds a degree in Business Administration from the University of Buenos Aires and a Masters in Business Administration from the Argentine Catholic University. He also graduated from INSEAD’s Executive Program in 2007.
Emilio Federico Gnecco. Mr. Gnecco is our Chief Legal Officer for all operations in Argentina, Brazil and Uruguay and a member of Adecoagro’s Senior Management since 2005. He is responsible for all legal and corporate matters and compliance. Before joining us, he was a corporate law associate at the law firm of Marval, O’Farrell & Mairal for more than 8 years, where he specialized in mergers and acquisitions, project financing, structured finance, corporate financing, private equity, joint ventures and corporate law and business contracts in general. Mr. Gnecco was in charge of Adecoagro’s corporate matters including mergers and acquisitions since our inception in 2002. Prior to that, he worked at the National Civil Court of Appeals of the City of Buenos Aires for four years. Mr. Gnecco has a law degree from the University of Buenos Aires, where he graduated with honors.
Renato Junqueira Santos Pereira. Renato Junqueira Santos Pereira is the Director of our Sugar, Ethanol & Energy business and has been a member of the senior management team since 2014. He began working at Adecoagro in 2010 as the Operations Manager for our Sugar, Ethanol & Energy business and has vast experience in the Brazilian sugarcane industry. Before joining Adecoagro, he served as the CFO of Moema Group, one of the largest sugarcane clusters in Brazil. His main responsibilities at Moema included designing the optimal capital structure to finance the construction of five greenfield mills, preparing the company for an IPO and coordinating the M&A process which culminated in a $1.5 billion dollar sale to Bunge Ltda. Previously, Mr. Pereira held responsibilities as Mill Director and Agricultural Manager in Moema’s mills. He is an Agricultural Engineer from Universidade de Sao Paulo and holds an MBA from the University of California, Davis.
Mario José Ramón Imbrosciano. Mr. Imbrosciano is the head of our Business Development Department for all operations in Argentina, Brazil and Uruguay where he oversees all new business initiatives, and a member of Adecoagro’s Senior Management since 2003. He has over 27 years of experience in farm management and agriculture production. Prior to joining Adecoagro, Mr. Imbrosciano was the Chief Operating Officer of Beraza Hnos. S.C., a farming company that owns farms in the humid pampas region of Argentina. He was in charge of production, commercialization and logistics for a 60,000 hectare operation. Mr. Imbrosciano has also worked as a private consultant for various clients. Mr. Imbrosciano received a degree in Agricultural Production Engineering from the Argentine Catholic University and holds a Masters in Business Administration from the Instituto de Altos Estudios of the Universidad Austral.
Leonardo Raúl Berridi. Mr. Berridi is our Country Manager for Brazil and, prior to the Reorganization, had been Adecoagro’s Country Manager for Brazil since the beginning of its operations in Brazil and a member of Adecoagro’s Senior Management since 2004. He coordinates all of our operations and human resources development activities in Brazil. Mr. Berridi has over 36 years of international experience in agricultural business. Prior to joining us, Mr. Berridi was Vice President of Pago Viejo S.A., a company dedicated to agriculture production and dairy farming in in the humid pampas of argentina, Argentina. He also worked for Trans-Continental Tobacco Corporation as Chief Operating Officer of Epasa (Exportadora de Productos Agrarios S.A.), a company dedicated to producing, processing and exporting tobacco in the north east and north west of Argentina, and Production Manager of World Wide Tobacco España S.A. in the Caceres and Zamora provinces in Spain. Mr. Berridi holds a degree in Forestry Engineering from the Universidad Nacional de La Plata.
Ezequiel Garbers. Mr. Garbers is the Country Manager for Argentina and Uruguay and a member of Adecoagro’s Senior Management and the Country Manager since 2002. He coordinates all of our production and human resources development activities in Argentina and Uruguay. Mr. Garbers has over 20 years of experience in agriculture production. Prior to joining Adecoagro, he was the Chief Operating Officer of an agricultural consulting and investment company he
29
co-founded, developing projects both within and outside of Argentina, related to crop production and the cattle and dairy business. Mr. Garbers holds a degree in Agronomic Engineering from the University of Buenos Aires and a Masters in Business Administration from the Instituto de Altos Estudios of the Austral University.
Pilar Lacoste. Ms. Lacoste is the Director of Consumer Products and is responsible for the business and brand development in Argentina’s retail unit. She has over 19 years of experience in leading consumer goods companies. Prior to joining Adecoagro in March 2019, she was a Sales Development Director at Danone Dairy Argentina. Ms. Lacoste also held various positions in sales, route to market and strategic planning for Danone’s Dairy and Waters divisions, from August 2009 through February 2019. In addition, Ms. Lacoste held other positions in the commercial planning department for 9 years in Anheuser-Busch InBev. Ms. Lacoste holds a Master in Business Administration and an Executive MBA from the IAE Business School and a Business Administration degree from the University of San Andres.
Our managers supervise our day-to-day transactions so as to ensure that all of our general strategic objectives are carried out, and they report to our board of directors.
Directors, Senior Management and Committees Pursuant to our articles of incorporation, the board of directors must be composed for a minimum of three and
maximum of eleven members. The number of directors is determined and the directors are appointed at the general meeting of shareholders (except in case of a vacancy in the office of a director because of death, retirement, resignation, dismissal, removal or otherwise, the remaining directors may fill such vacancy and appoint a successor in accordance with applicable Luxembourg law).
The directors are appointed by the general meeting of shareholders for a period of up to three years; provided, however, the directors shall be elected on a staggered basis, with one-third of the directors being elected each year and provided further that such three year term may be exceeded by a period up to the annual general meeting held following the third anniversary of the appointment. Directors may be removed with or without cause (ad nutum) by the general meeting of shareholders by a simple majority of votes cast at a general meeting of shareholders. The directors are eligible for re-election indefinitely.
There are no agreements with majority shareholders, customers, suppliers or others governing the selection of any of the directors or members of senior management. None of our non-executive directors has a service contract with us that provides for benefits upon termination of employment.
The board of directors is empowered to manage Adecoagro S.A. and carry out our operations. The board of directors is vested with the broadest powers to manage the business of the Company and to authorize and/or perform all acts of disposal, management and administration falling within the purposes of Adecoagro S.A. and all powers not expressly reserved by Luxembourg law or by our articles of incorporation to the general meeting of shareholders is within the competence of the board of directors.
Accordingly, within the limitations established by Luxembourg law and in particular the Luxembourg law of August 10, 1915 on commercial companies (as amended) and our articles of incorporation, the board of directors can take any action (by resolution or otherwise) it deems necessary, appropriate, convenient or fit to implement the purpose of the Company, including without limitation:
• execute any acts or contracts on our behalf aimed at fulfilling our corporate purpose, including those for which a special power of attorney is required;
• carry out any transactions;• agree, establish, authorize and regulate our operations, services and expenses;• delegate special tasks to directors, regulate the formation and operation of committees and fix the remuneration
and compensation of expenses of advisors and/or staff with special duties, with a charge to overhead;• appoint, suspend or remove agents or employees, establish their duties, remuneration, -and bonuses and grant
them the powers that it deems advisable;
30
• grant signature authorization to directors and officers, grant general or special powers of attorney, including those to prosecute;
• call regular and special shareholders’ meetings and establish agendas, submit for the shareholders’ approval our inventory, annual report, balance sheet, statement of income and exhibits, propose depreciation, amortization and reserves that it deems advisable, establish the amount of gains and losses, propose the distribution of earnings and submit all this to the shareholders’ meeting for consideration and resolution;
• fix the date for the payment of dividends established by the shareholders´ meeting and make their payment; and
• make decisions relating to the issuance, subscription or payment of shares pursuant to our articles of incorporation and decision of the regular or special shareholders´ meetings.
Audit Committee The Company’s articles of incorporation provide that the board of directors may set up an audit committee. The
board of directors has set up an Audit Committee and has appointed, pursuant to board resolutions dated May 19, 2019, Mr. Andrés Velasco Brañes, Mr. Mark Schachter (Chairman since May, 2017), and Ivo Sarjanovic as members of its audit committee.
The Company’s articles of incorporation provide that the audit committee shall (a) assist the board of directors in fulfilling its oversight responsibilities relating to the integrity of the Company’s financial statements, including periodically reporting to the board of directors on its activity and the adequacy of the Company’s systems of internal controls over financial reporting; (b) make recommendations for the appointment, compensation, retention and oversight of, and consider the independence of, the Company’s external auditors; (c) review material transactions (as defined in the articles) between the Company or its subsidiaries with related parties (other than transactions that were reviewed and approved by the independent members of the board of directors (as defined in the articles of the Company) or other governing body of any subsidiary of the Company or through any other procedures as the board of directors may deem substantially equivalent to the foregoing) to determine whether their terms are consistent with market conditions or are otherwise fair to the Company and its subsidiaries; and (d) perform such other duties imposed on it by the laws and regulations of the regulated market(s) on which the shares of the Company are listed, applicable to the Company, as well as any other duties entrusted to it by the board of directors.
In addition, the charter of the audit committee sets forth, among other things, the audit committee’s purpose and responsibilities.
Compensation Committee The Company has a Compensation Committee that reviews and approves the compensation and benefits of the
executive officers and other key employees, and makes recommendations to the board of directors regarding principles for compensation, performance evaluation, and retention strategies. It is responsible for administering our share option plans and our restricted share plan for executive officers and other key employees. See “-E. Share Ownership-Share Options and Restricted Share Plan.” The committee has the discretion to interpret and amend the Plan, and delegate to the Chief Executive Officer the right to award equity-based compensation to executive officers and other key employees.
The committee meets at least once a year and as needed on the initiative of the Chief Executive Officer or at the request of one of its members. The members of the Compensation Committee, appointed pursuant to board resolutions dated May 19, 2019 are Mr. Guillaume Van der Linden (Chairman since April 16, 2014), Plínio Musetti, and Mr. Daniel González.
Risk and Commercial CommitteeThe Company has a Risk and Commercial Committee that has the duty to (i) make such inquiries as are necessary
or advisable to understand and evaluate material business risks and risk management processes as they evolve from time to time; (ii) review with the board of directors and management the guidelines and policies to govern the process for assessing and managing risks; (iii) discuss and review with the board of directors management’s efforts to evaluate and manage the Company’s business from a risk perspective; (iv) request input from the board of directors, management and operating staff, as well as from outside resources, as it may deem necessary; (v) discuss with the board of directors and
31
management which elements of enterprise risk are most significant, the prioritization of business risks, and make recommendations as to resource allocation for risk management and risk mitigation strategies and activities; and (vi) oversee the development of plans for risk mitigation in any area which it deems to be a material risk to the Company; and monitor management’s implementation of such plans, and the effectiveness generally of its risk mitigation strategies and activities.
The committee meets at least four times a year and as often as deemed necessary or appropriate in its judgment. The members of the Risk and Commercial Committee appointed by the board meeting held on May 19, 2019 are Mr. Ivo Sarjanovic (Chairman since May 19, 2019), Mr. Andrés Velasco Brañes, and Guillaume van der Linden.
Strategy Committee The Company’s Strategy Committee has the duty to: (i) discuss and review with the board management’s
identification and setting of strategic goals; including potential acquisitions, joint ventures and strategic alliances and dispositions; (ii) make recommendations to the board of directors as to the means of pursuing strategic goals; and (iii) review with the board management’s progress in implementing its strategic decisions and suggest appropriate modifications to reflect changes in market and business conditions.
The committee meets at least four times a year and as often as deemed necessary or appropriate in its judgment. The members of Strategy Committee appointed by the board meetings held on May 19, 2019 are Mr. Plínio Musetti (Chairman since May 10, 2018), Mr. Alan Leland Boyce, Mrs. Alejandra Smith, and Daniel Gonzalez.

Adecoagro S.A.
Consolidated Financial Statements as of December 31, 2019 and 2018 and for the years ended December 31, 2019, 2018 and 2017
Audit report
To the Shareholders ofAdecoagro S.A.
Report on the audit of the consolidated financial statements
Our opinion
In our opinion, the accompanying consolidated financial statements give a true and fair view of the consolidated financial position of Adecoagro S.A. (the “Company”) and its subsidiaries (the “Group”) as at 31 December 2019, and of its consolidated financial performance and its consolidated cash flows for the year then ended in accordance with International Financial Reporting Standards (IFRSs) as adopted by the European Union.
What we have audited
The Group’s consolidated financial statements comprise:
• the consolidated statement of income for the year then ended;• the consolidated statement of comprehensive income for the year then ended;• the consolidated statement of financial position as at 31 December 2019;• the consolidated statement of changes in shareholders' equity for the year then ended;• the consolidated statement of cash flows for the year then ended; and• the notes to the consolidated financial statements, which include a summary of significant accounting policies.
Basis for opinion
We conducted our audit in accordance with the Law of 23 July 2016 on the audit profession (Law of 23 July 2016) and with International Standards on Auditing (ISAs) as adopted for Luxembourg by the “Commission de Surveillance du Secteur Financier” (CSSF). Our responsibilities under the Law of 23 July 2016 and ISAs as adopted for Luxembourg by the CSSF are further described in the “Responsibilities of the “Réviseur d’entreprises agréé” for the audit of the consolidated financial statements” section of our report.
We believe that the audit evidence we have obtained is sufficient and appropriate to provide a basis for our opinion.
We are independent of the Group in accordance with the International Ethics Standards Board for Accountants’ Code of Ethics for Professional Accountants (IESBA Code) as adopted for Luxembourg by the CSSF together with the ethical requirements that are relevant to our audit of the consolidated financial statements. We have fulfilled our other ethical responsibilities under those ethical requirements.
Other information
The Board of Directors is responsible for the other information. The other information comprises the information stated in the consolidated management report but does not include the consolidated financial statements and our audit report thereon.
PricewaterhouseCoopers, Société coopérative, 2 rue Gerhard Mercator, B.P. 1443, L-1014 LuxembourgT : +352 494848 1, F : +352 494848 2900, www.pwc.lu
Cabinet de révision agréé. Expert-comptable (autorisation gouvernementale n°10028256)R.C.S. Luxembourg B 65 477 - TVA LU25482518
2
Our opinion on the consolidated financial statements does not cover the other information and we do not express any form of assurance conclusion thereon.
In connection with our audit of the consolidated financial statements, our responsibility is to read the other information identified above and, in doing so, consider whether the other information is materially inconsistent with the consolidated financial statements or our knowledge obtained in the audit, or otherwise appears to be materially misstated. If, based on the work we have performed, we conclude that there is a material misstatement of this other information, we are required to report that fact. We have nothing to report in this regard.
Responsibilities of the Board of Directors and those charged with governance for the consolidated financial statements
The Board of Directors is responsible for the preparation and fair presentation of the consolidated financial statements in accordance with IFRSs as adopted by the European Union, and for such internal control as the Board of Directors determines is necessary to enable the preparation of consolidated financial statements that are free from material misstatement, whether due to fraud or error.
In preparing the consolidated financial statements, the Board of Directors is responsible for assessing the Group’s ability to continue as a going concern, disclosing, as applicable, matters related to going concern and using the going concern basis of accounting unless the Board of Directors either intends to liquidate the Group or to cease operations, or has no realistic alternative but to do so.
Those charged with governance are responsible for overseeing the Group’s financial reporting process.
Responsibilities of the “Réviseur d’entreprises agréé” for the audit of the consolidated financial statements
The objectives of our audit are to obtain reasonable assurance about whether the consolidated financial statements as a whole are free from material misstatement, whether due to fraud or error, and to issue an audit report that includes our opinion. Reasonable assurance is a high level of assurance, but is not a guarantee that an audit conducted in accordance with the Law of 23 July 2016 and with ISAs as adopted for Luxembourg by the CSSF will always detect a material misstatement when it exists. Misstatements can arise from fraud or error and are considered material if, individually or in the aggregate, they could reasonably be expected to influence the economic decisions of users taken on the basis of these consolidated financial statements.
As part of an audit in accordance with the Law of 23 July 2016 and with ISAs as adopted for Luxembourg by the CSSF, we exercise professional judgment and maintain professional scepticism throughout the audit. We also:
• identify and assess the risks of material misstatement of the consolidated financial statements, whether due to fraud or error, design and perform audit procedures responsive to those risks, and obtain audit evidence that is sufficient and appropriate to provide a basis for our opinion. The risk of not detecting a material misstatement resulting from fraud is higher than for one resulting from error, as fraud may involve collusion, forgery, intentional omissions, misrepresentations, or the override of internal control;
• obtain an understanding of internal control relevant to the audit in order to design audit procedures that are appropriate in the circumstances, but not for the purpose of expressing an opinion on the effectiveness of the Group’s internal control;
• evaluate the appropriateness of accounting policies used and the reasonableness of accounting estimates and related disclosures made by the Board of Directors;
• conclude on the appropriateness of the Board of Directors’ use of the going concern basis of accounting and, based on the audit evidence obtained, whether a material uncertainty exists related to events or conditions that may cast significant doubt on the Group’s ability to continue as a going concern. If we conclude that a material uncertainty exists, we are required to draw attention in our audit report to the related disclosures in the consolidated financial statements or, if such disclosures are inadequate, to modify our opinion. Our conclusions are based on the audit evidence obtained up to the date of our audit report. However, future events or conditions may cause the Group to cease to continue as a going concern;
• evaluate the overall presentation, structure and content of the consolidated financial statements, including the disclosures, and whether the consolidated financial statements represent the underlying transactions and events in a manner that achieves fair presentation;
3
• obtain sufficient appropriate audit evidence regarding the financial information of the entities and business activities within the Group to express an opinion on the consolidated financial statements. We are responsible for the direction, supervision and performance of the Group audit. We remain solely responsible for our audit opinion.
We communicate with those charged with governance regarding, among other matters, the planned scope and timing of the audit and significant audit findings, including any significant deficiencies in internal control that we identify during our audit.
We also provide those charged with governance with a statement that we have complied with relevant ethical requirements regarding independence, and communicate to them all relationships and other matters that may reasonably be thought to bear on our independence, and where applicable, related safeguards.
Report on other legal and regulatory requirements
The consolidated management report is consistent with the consolidated financial statements and has been prepared in accordance with applicable legal requirements.
PricewaterhouseCoopers, Société coopérativeRepresented by
Fabrice Goffin Luxembourg, 20 March 2020
F-4
Legal information
Denomination: Adecoagro S.A. Legal address: Vertigo Naos Building, 6, Rue Eugène Ruppert, L-2453, Luxembourg Company activity: Agricultural and agro-industrialDate of registration: June 11, 2010Expiration of company charter: No term definedNumber of register (RCS Luxembourg): B153.681Issued Capital Stock: 122,381,815 common sharesOutstanding Capital stock: 117,086,050 common sharesTreasury shares: 5,295,765 common shares
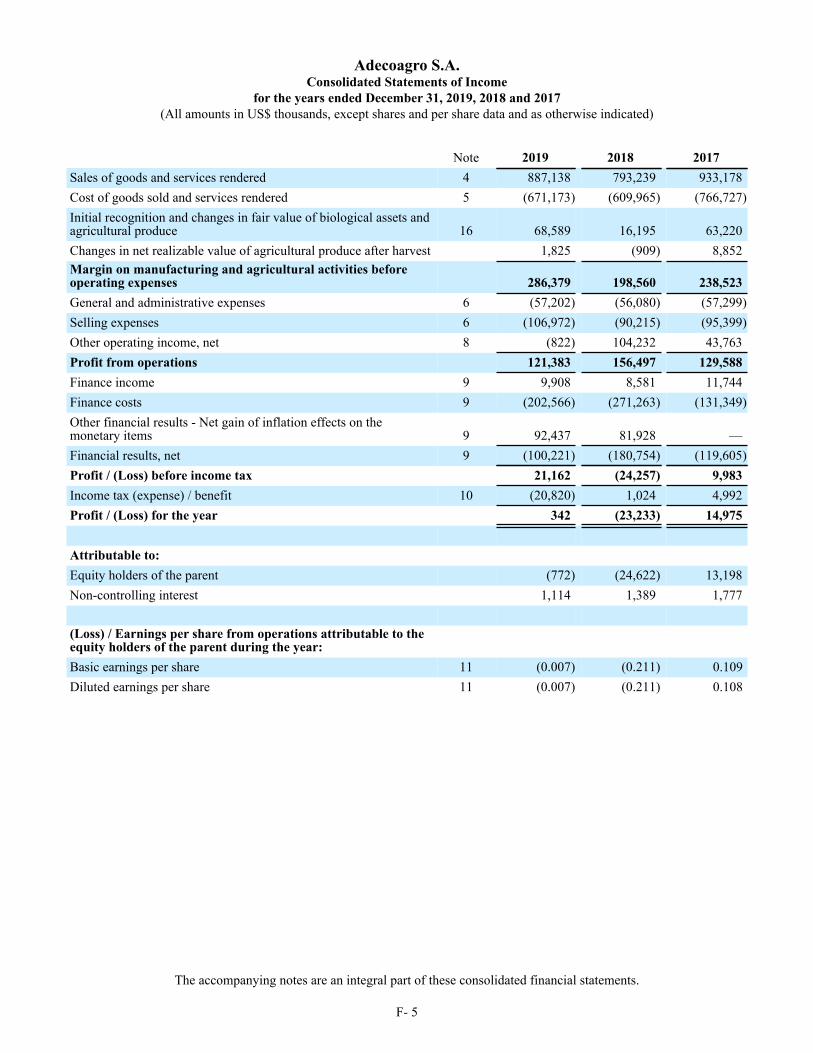
The accompanying notes are an integral part of these consolidated financial statements.
F- 5
Adecoagro S.A.Consolidated Statements of Income
for the years ended December 31, 2019, 2018 and 2017 (All amounts in US$ thousands, except shares and per share data and as otherwise indicated)
Note 2019 2018 2017Sales of goods and services rendered 4 887,138 793,239 933,178Cost of goods sold and services rendered 5 (671,173) (609,965) (766,727)Initial recognition and changes in fair value of biological assets andagricultural produce 16 68,589 16,195 63,220Changes in net realizable value of agricultural produce after harvest 1,825 (909) 8,852Margin on manufacturing and agricultural activities beforeoperating expenses 286,379 198,560 238,523General and administrative expenses 6 (57,202) (56,080) (57,299)Selling expenses 6 (106,972) (90,215) (95,399)Other operating income, net 8 (822) 104,232 43,763Profit from operations 121,383 156,497 129,588Finance income 9 9,908 8,581 11,744Finance costs 9 (202,566) (271,263) (131,349)Other financial results - Net gain of inflation effects on themonetary items 9 92,437 81,928 —Financial results, net 9 (100,221) (180,754) (119,605)Profit / (Loss) before income tax 21,162 (24,257) 9,983Income tax (expense) / benefit 10 (20,820) 1,024 4,992Profit / (Loss) for the year 342 (23,233) 14,975
Attributable to: Equity holders of the parent (772) (24,622) 13,198Non-controlling interest 1,114 1,389 1,777
(Loss) / Earnings per share from operations attributable to theequity holders of the parent during the year: Basic earnings per share 11 (0.007) (0.211) 0.109Diluted earnings per share 11 (0.007) (0.211) 0.108
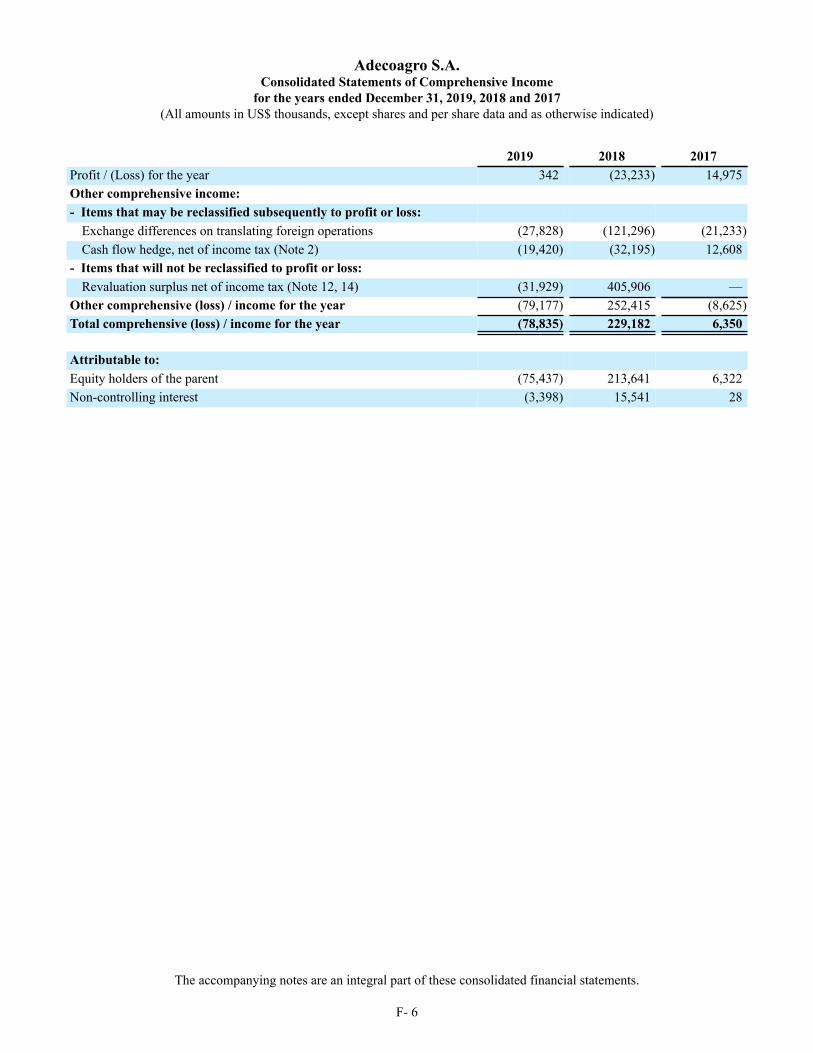
The accompanying notes are an integral part of these consolidated financial statements.
F- 6
Adecoagro S.A.Consolidated Statements of Comprehensive Income
for the years ended December 31, 2019, 2018 and 2017(All amounts in US$ thousands, except shares and per share data and as otherwise indicated)
2019 2018 2017Profit / (Loss) for the year 342 (23,233) 14,975Other comprehensive income:- Items that may be reclassified subsequently to profit or loss:
Exchange differences on translating foreign operations (27,828) (121,296) (21,233)Cash flow hedge, net of income tax (Note 2) (19,420) (32,195) 12,608
- Items that will not be reclassified to profit or loss:Revaluation surplus net of income tax (Note 12, 14) (31,929) 405,906 —
Other comprehensive (loss) / income for the year (79,177) 252,415 (8,625)Total comprehensive (loss) / income for the year (78,835) 229,182 6,350
Attributable to: Equity holders of the parent (75,437) 213,641 6,322Non-controlling interest (3,398) 15,541 28

The accompanying notes are an integral part of these consolidated financial statements.
F- 7
Adecoagro S.A.Consolidated Statements of Financial Position
as of December 31, 2019 and 2018 (All amounts in US$ thousands, except shares and per share data and as otherwise indicated)
Note 2019 2018ASSETSNon-Current AssetsProperty, plant and equipment 12 1,493,220 1,480,439Right of use assets 13 238,053 —Investment property 14 34,295 40,725Intangible assets 15 33,679 27,909Biological assets 16 13,303 11,270Deferred income tax assets 10 13,664 16,191Trade and other receivables, net 19 44,993 38,820Other assets 1,034 1,184Total Non-Current Assets 1,872,241 1,616,538Current AssetsBiological assets 16 117,133 94,117Inventories 20 112,790 128,102Trade and other receivables, net 19 127,338 158,686Derivative financial instruments 18 1,435 6,286Other assets 94 8Cash and cash equivalents 21 290,276 273,635Total Current Assets 649,066 660,834TOTAL ASSETS 2,521,307 2,277,372SHAREHOLDERS EQUITYCapital and reserves attributable to equity holders of the parentShare capital 23 183,573 183,573Share premium 23 901,739 900,503Cumulative translation adjustment (680,322) (666,037)Equity-settled compensation 15,354 16,191Cash flow hedge 2 (76,303) (56,884)Other reserves 66,047 32,380Treasury shares (7,946) (8,741)Revaluation surplus 337,884 383,889Reserve from the sale of non-controlling interests in subsidiaries 41,574 41,574Retained earnings 206,669 237,188Equity attributable to equity holders of the parent 988,269 1,063,636Non-controlling interest 40,614 44,509TOTAL SHAREHOLDERS EQUITY 1,028,883 1,108,145LIABILITIESNon-Current LiabilitiesTrade and other payables 26 3,599 211Borrowings 27 780,202 718,484Lease liabilities 28 174,570 —Deferred income tax liabilities 10 165,508 168,171Payroll and social liabilities 29 1,209 1,219Provisions for other liabilities 30 2,936 3,296Total Non-Current Liabilities 1,128,024 891,381Current LiabilitiesTrade and other payables 26 106,887 106,226Current income tax liabilities 754 1,398Payroll and social liabilities 29 25,208 25,978Borrowings 27 188,078 143,632Lease liabilities 28 41,814 —Derivative financial instruments 18 1,423 283Provisions for other liabilities 30 236 329Total Current Liabilities 364,400 277,846TOTAL LIABILITIES 1,492,424 1,169,227TOTAL SHAREHOLDERS EQUITY AND LIABILITIES 2,521,307 2,277,372
The accompanying notes are an integral part of these consolidated financial statements.
F- 8
Adecoagro S.A.Consolidated Statements of Changes in Shareholders’ Equity
for the years ended December 31, 2019, 2018 and 2017(All amounts in US$ thousands, except shares and per share data and as otherwise indicated)
Attributable to equity holders of the parent
Share capital(Note 23)
Sharepremium(Note 23)
Cumulativetranslationadjustment
Equity-settledcompensation Cash flow hedge Treasury
shares
Reserve from the sale of non-controlling
interests in subsidiaries
Retainedearnings Subtotal
Non-controlling
interest
Totalshareholders’
equity
Balance at January 1, 2017 183,573 937,250 (533,120) 17,218 (37,299) (1,859) 41,574 92,997 700,334 11,970 712,304
Profit for the year — — — — — — — 13,198 13,198 1,777 14,975
Other comprehensive income:
- Items that may be reclassified subsequently to profit or loss:
Exchange differences on translating foreign operations — — (19,484) — — — — — (19,484) (1,749) (21,233)
Cash flow hedge (*) — — — — 12,608 — — — 12,608 — 12,608
Other comprehensive income for the year — — (19,484) — 12,608 — — — (6,876) (1,749) (8,625)
Total comprehensive income for the year — — (19,484) — 12,608 — — 13,198 6,322 28 6,350
Employee share options (Note 24)
- Exercised — 50 — (21) — 10 — — 39 — 39
- Forfeited — — — (14) — — — 14 — — —
Restricted shares (Note 24):
- Value of employee services — — — 5,552 — — — — 5,552 — 5,552
- Vested — 4,149 — (4,883) — 734 — — — — —
Purchase of own shares (Note 23) — (32,515) — — — (5,852) — — (38,367) — (38,367)
Dividends — — — — — — — — — (2,859) (2,859)
Balance at December 31, 2017 183,573 908,934 (552,604) 17,852 (24,691) (6,967) 41,574 106,209 673,880 9,139 683,019
(*) Net of (8,715) of income tax.

The accompanying notes are an integral part of these consolidated financial statements.
F- 9
Adecoagro S.A.Consolidated Statements of Changes in Shareholders’ Equity
for the years ended December 31, 2019, 2018 and 2017(All amounts in US$ thousands, except shares and per share data and as otherwise indicated)
Attributable to equity holders of the parent
Share capital(Note 23)
Sharepremium(Note 23)
Cumulativetranslationadjustment
Equity-settled
compensation
Cash flowhedge
OtherReserves
Treasuryshares
Revaluationsurplus
Reserve from thesale of non-controllinginterests insubsidiaries
Retainedearnings Subtotal
Non-controlling
interest
Totalshareholders’
equity
Balance at January 1, 2018 183,573 908,934 (552,604) 17,852 (24,691) — (6,967) — 41,574 106,209 673,880 9,139 683,019Adjustment of opening balance for the application of IAS29 — — — — — — — — — 187.941 187,941 20.237 208,178
Total equity at the beginning of financial year 183,573 908,934 (552,604) 17,852 (24,691) — (6,967) — 41,574 294,150 861,821 29,376 891,197
Loss for the year — — — — — — — — — (24,622) (24,622) 1,389 (23,233)
Other comprehensive income:
- Items that may be reclassified subsequently to profit or loss:
Exchange differences on translating foreign operations — — (113,433) — — — — — — — (113,433) (7,863) (121,296)
Cash flow hedge (*) — — — — (32,193) — — — — — (32,193) (2) (32,195)
- Items will not be reclassified to profit or loss:
Revaluation surplus (**) — — — — — — — 383,889 — — 383,889 22,017 405,906
Other comprehensive income for the year — — (113,433) — (32,193) — — 383,889 — — 238,263 14,152 252,415
Total comprehensive income for the year — — (113,433) — (32,193) — — 383,889 — (24,622) 213,641 15,541 229,182
Reserves for the benefit of government grants (1) — — — — — 32,380 — — — (32,380) — — —
Employee share options (Note 24):
- Forfeited — — — (40) — — — — — 40 — — —
Restricted shares (Note 24):
- Value of employee services — — — 3,899 — — — — — — 3,899 — 3,899
- Vested — 4,775 — (5,520) — — 745 — — — — — —
Purchase of own shares (Note 23) — (13,206) — — — — (2,519) — — — (15,725) — (15,725)
Dividends — — — — — — — — — — — (408) (408)
Balance at December 31, 2018 183,573 900,503 (666,037) 16,191 (56,884) 32,380 (8,741) 383,889 41,574 237,188 1,063,636 44,509 1,108,145
(*) Net of 11,322 of Income tax.(**) Net of 139,223 of Income tax.(1) Correspond to the presumed credit of ICMS (Imposto sobre Circulação de Mercadorias e Prestação de Serviços) over the sale values in our Sugar, ethanol and energy business. (please see Note 25).
The accompanying notes are an integral part of these consolidated financial statements.
F- 10
Adecoagro S.A.Consolidated Statements of Changes in Shareholders’ Equity
for the years ended December 31, 2019, 2018 and 2017(All amounts in US$ thousands, except shares and per share data and as otherwise indicated)
Attributable to equity holders of the parent
Share capital(Note 23)
Sharepremium(Note 23)
Cumulativetranslationadjustment
Equity-settledcompensation
Cash flowhedge Other reserves Treasury
sharesRevaluation
surplus
Reserve from thesale of non-
controlling interestsin subsidiaries
Retainedearnings Subtotal
Non-controlling
interest
Totalshareholders’
equity
Balance at January 1, 2019 183,573 900,503 (666,037) 16,191 (56,884) 32,380 (8,741) 383,889 41,574 237,188 1,063,636 44,509 1,108,145
Profit for the year — — — — — — — — — (772) (772) 1,114 342
Other comprehensive income:
- Items that may be reclassified subsequently to profit or loss:
Exchange differences on translating foreignoperations — — (14,278) — — — — (12,183) — — (26,461) (1,367) (27,828)
Cash flow hedge (*) — — — — (19,419) — — — — — (19,419) (1) (19,420)
- Items will not be reclassified to profit or loss:
Revaluation surplus (**) — — — — — — — (28,785) — — (28,785) (3,144) (31,929)
Reserve of the revaluation surplus derivedfrom the disposals of assets (***) — — — — — — — (5,044) — 5,044 — — —
Other comprehensive income for the year — — (14,278) — (19,419) — — (46,012) — 5,044 (74,665) (4,512) (79,177)
Total comprehensive income for the year — — (14,278) — (19,419) — — (46,012) — 4,272 (75,437) (3,398) (78,835)
Reserves for the benefit of government grants(1) — — — — — 34,791 — — — (34,791) — — —
Employee share options (Note 24):
Restricted shares (Note 24):
- Value of employee services — — — 3,612 — — — — — — 3,612 — 3,612
- Vested — 4,455 — (4,449) — — 715 — — — 721 — 721
- Forfeited — — — — — 5 (5) — — — — — —
- Granted — — — — — (1,129) 1,129 — — — — — —
Purchase of own shares (Note 23) — (3,219) — — — — (1,044) — — — (4,263) — (4,263)
Dividends — — — — — — — — — — — (497) (497)
Balance at December 31, 2019 183,573 901,739 (680,315) 15,354 (76,303) 66,047 (7,946) 337,877 41,574 206,669 988,269 40,614 1,028,883
(*) Net of (6,752) of Income tax.(**) Net of 2,978 of Income tax.(***) Net of 14,691 of Income tax.(1) Correspond to the presumed credit of ICMS (Imposto sobre Circulação de Mercadorias e Prestação de Serviços) over the sale values in our Sugar, ethanol and energy business. (please see Note 25).
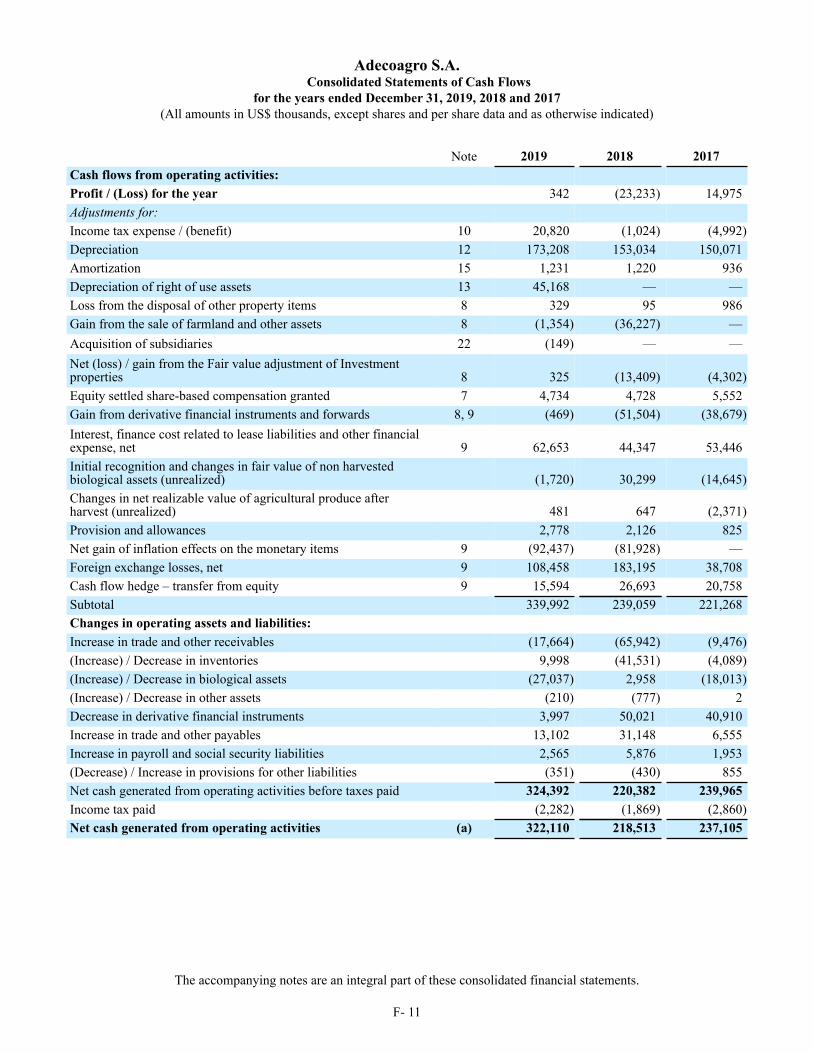
The accompanying notes are an integral part of these consolidated financial statements.
F- 11
Adecoagro S.A.Consolidated Statements of Cash Flows
for the years ended December 31, 2019, 2018 and 2017(All amounts in US$ thousands, except shares and per share data and as otherwise indicated)
Note 2019 2018 2017Cash flows from operating activities: Profit / (Loss) for the year 342 (23,233) 14,975Adjustments for: Income tax expense / (benefit) 10 20,820 (1,024) (4,992)Depreciation 12 173,208 153,034 150,071Amortization 15 1,231 1,220 936Depreciation of right of use assets 13 45,168 — —Loss from the disposal of other property items 8 329 95 986Gain from the sale of farmland and other assets 8 (1,354) (36,227) —Acquisition of subsidiaries 22 (149) — —Net (loss) / gain from the Fair value adjustment of Investmentproperties 8 325 (13,409) (4,302)Equity settled share-based compensation granted 7 4,734 4,728 5,552Gain from derivative financial instruments and forwards 8, 9 (469) (51,504) (38,679)Interest, finance cost related to lease liabilities and other financialexpense, net 9 62,653 44,347 53,446Initial recognition and changes in fair value of non harvestedbiological assets (unrealized) (1,720) 30,299 (14,645)Changes in net realizable value of agricultural produce afterharvest (unrealized) 481 647 (2,371)Provision and allowances 2,778 2,126 825Net gain of inflation effects on the monetary items 9 (92,437) (81,928) —Foreign exchange losses, net 9 108,458 183,195 38,708Cash flow hedge – transfer from equity 9 15,594 26,693 20,758Subtotal 339,992 239,059 221,268Changes in operating assets and liabilities: Increase in trade and other receivables (17,664) (65,942) (9,476)(Increase) / Decrease in inventories 9,998 (41,531) (4,089)(Increase) / Decrease in biological assets (27,037) 2,958 (18,013)(Increase) / Decrease in other assets (210) (777) 2Decrease in derivative financial instruments 3,997 50,021 40,910Increase in trade and other payables 13,102 31,148 6,555Increase in payroll and social security liabilities 2,565 5,876 1,953(Decrease) / Increase in provisions for other liabilities (351) (430) 855Net cash generated from operating activities before taxes paid 324,392 220,382 239,965Income tax paid (2,282) (1,869) (2,860)Net cash generated from operating activities (a) 322,110 218,513 237,105
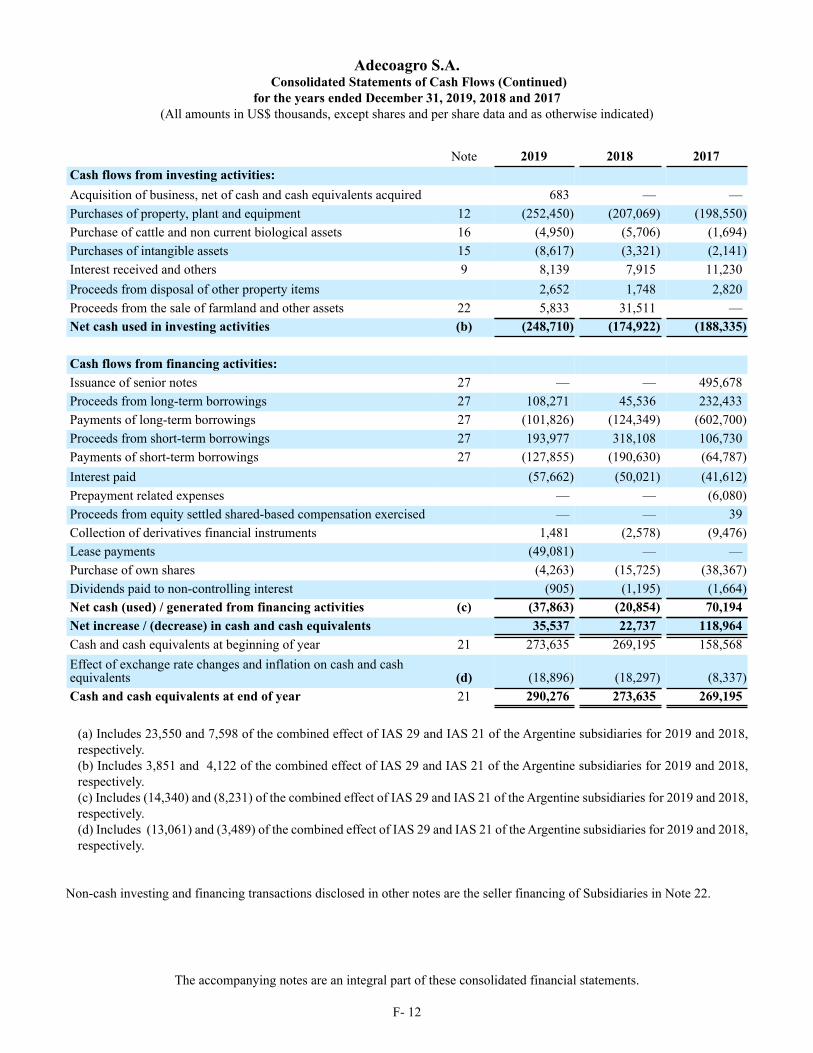
The accompanying notes are an integral part of these consolidated financial statements.
F- 12
Adecoagro S.A.Consolidated Statements of Cash Flows (Continued)
for the years ended December 31, 2019, 2018 and 2017(All amounts in US$ thousands, except shares and per share data and as otherwise indicated)
Note 2019 2018 2017Cash flows from investing activities: Acquisition of business, net of cash and cash equivalents acquired 683 — —Purchases of property, plant and equipment 12 (252,450) (207,069) (198,550)Purchase of cattle and non current biological assets 16 (4,950) (5,706) (1,694)Purchases of intangible assets 15 (8,617) (3,321) (2,141)Interest received and others 9 8,139 7,915 11,230Proceeds from disposal of other property items 2,652 1,748 2,820Proceeds from the sale of farmland and other assets 22 5,833 31,511 —Net cash used in investing activities (b) (248,710) (174,922) (188,335)
Cash flows from financing activities: Issuance of senior notes 27 — — 495,678Proceeds from long-term borrowings 27 108,271 45,536 232,433Payments of long-term borrowings 27 (101,826) (124,349) (602,700)Proceeds from short-term borrowings 27 193,977 318,108 106,730Payments of short-term borrowings 27 (127,855) (190,630) (64,787)Interest paid (57,662) (50,021) (41,612)Prepayment related expenses — — (6,080)Proceeds from equity settled shared-based compensation exercised — — 39Collection of derivatives financial instruments 1,481 (2,578) (9,476)Lease payments (49,081) — —Purchase of own shares (4,263) (15,725) (38,367)Dividends paid to non-controlling interest (905) (1,195) (1,664)Net cash (used) / generated from financing activities (c) (37,863) (20,854) 70,194Net increase / (decrease) in cash and cash equivalents 35,537 22,737 118,964Cash and cash equivalents at beginning of year 21 273,635 269,195 158,568Effect of exchange rate changes and inflation on cash and cashequivalents (d) (18,896) (18,297) (8,337)Cash and cash equivalents at end of year 21 290,276 273,635 269,195
(a) Includes 23,550 and 7,598 of the combined effect of IAS 29 and IAS 21 of the Argentine subsidiaries for 2019 and 2018, respectively.(b) Includes 3,851 and 4,122 of the combined effect of IAS 29 and IAS 21 of the Argentine subsidiaries for 2019 and 2018, respectively.(c) Includes (14,340) and (8,231) of the combined effect of IAS 29 and IAS 21 of the Argentine subsidiaries for 2019 and 2018, respectively.(d) Includes (13,061) and (3,489) of the combined effect of IAS 29 and IAS 21 of the Argentine subsidiaries for 2019 and 2018, respectively.
Non-cash investing and financing transactions disclosed in other notes are the seller financing of Subsidiaries in Note 22.
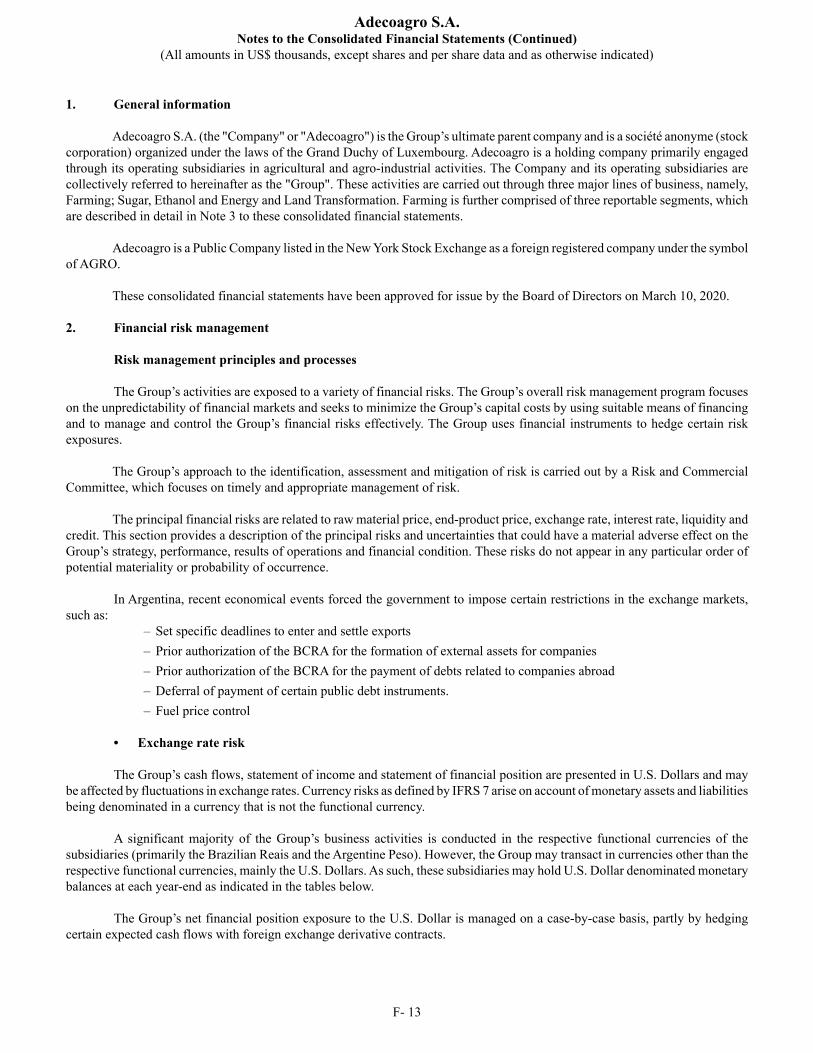
Adecoagro S.A.Notes to the Consolidated Financial Statements (Continued)
(All amounts in US$ thousands, except shares and per share data and as otherwise indicated)
F- 13
1. General information
Adecoagro S.A. (the "Company" or "Adecoagro") is the Group’s ultimate parent company and is a société anonyme (stock corporation) organized under the laws of the Grand Duchy of Luxembourg. Adecoagro is a holding company primarily engaged through its operating subsidiaries in agricultural and agro-industrial activities. The Company and its operating subsidiaries are collectively referred to hereinafter as the "Group". These activities are carried out through three major lines of business, namely, Farming; Sugar, Ethanol and Energy and Land Transformation. Farming is further comprised of three reportable segments, which are described in detail in Note 3 to these consolidated financial statements.
Adecoagro is a Public Company listed in the New York Stock Exchange as a foreign registered company under the symbol
of AGRO. These consolidated financial statements have been approved for issue by the Board of Directors on March 10, 2020.
2. Financial risk management
Risk management principles and processes
The Group’s activities are exposed to a variety of financial risks. The Group’s overall risk management program focuses on the unpredictability of financial markets and seeks to minimize the Group’s capital costs by using suitable means of financing and to manage and control the Group’s financial risks effectively. The Group uses financial instruments to hedge certain risk exposures.
The Group’s approach to the identification, assessment and mitigation of risk is carried out by a Risk and Commercial Committee, which focuses on timely and appropriate management of risk.
The principal financial risks are related to raw material price, end-product price, exchange rate, interest rate, liquidity and
credit. This section provides a description of the principal risks and uncertainties that could have a material adverse effect on the Group’s strategy, performance, results of operations and financial condition. These risks do not appear in any particular order of potential materiality or probability of occurrence.
In Argentina, recent economical events forced the government to impose certain restrictions in the exchange markets, such as:
– Set specific deadlines to enter and settle exports– Prior authorization of the BCRA for the formation of external assets for companies– Prior authorization of the BCRA for the payment of debts related to companies abroad– Deferral of payment of certain public debt instruments.– Fuel price control
• Exchange rate risk
The Group’s cash flows, statement of income and statement of financial position are presented in U.S. Dollars and may be affected by fluctuations in exchange rates. Currency risks as defined by IFRS 7 arise on account of monetary assets and liabilities being denominated in a currency that is not the functional currency.
A significant majority of the Group’s business activities is conducted in the respective functional currencies of the subsidiaries (primarily the Brazilian Reais and the Argentine Peso). However, the Group may transact in currencies other than the respective functional currencies, mainly the U.S. Dollars. As such, these subsidiaries may hold U.S. Dollar denominated monetary balances at each year-end as indicated in the tables below.
The Group’s net financial position exposure to the U.S. Dollar is managed on a case-by-case basis, partly by hedging certain expected cash flows with foreign exchange derivative contracts.
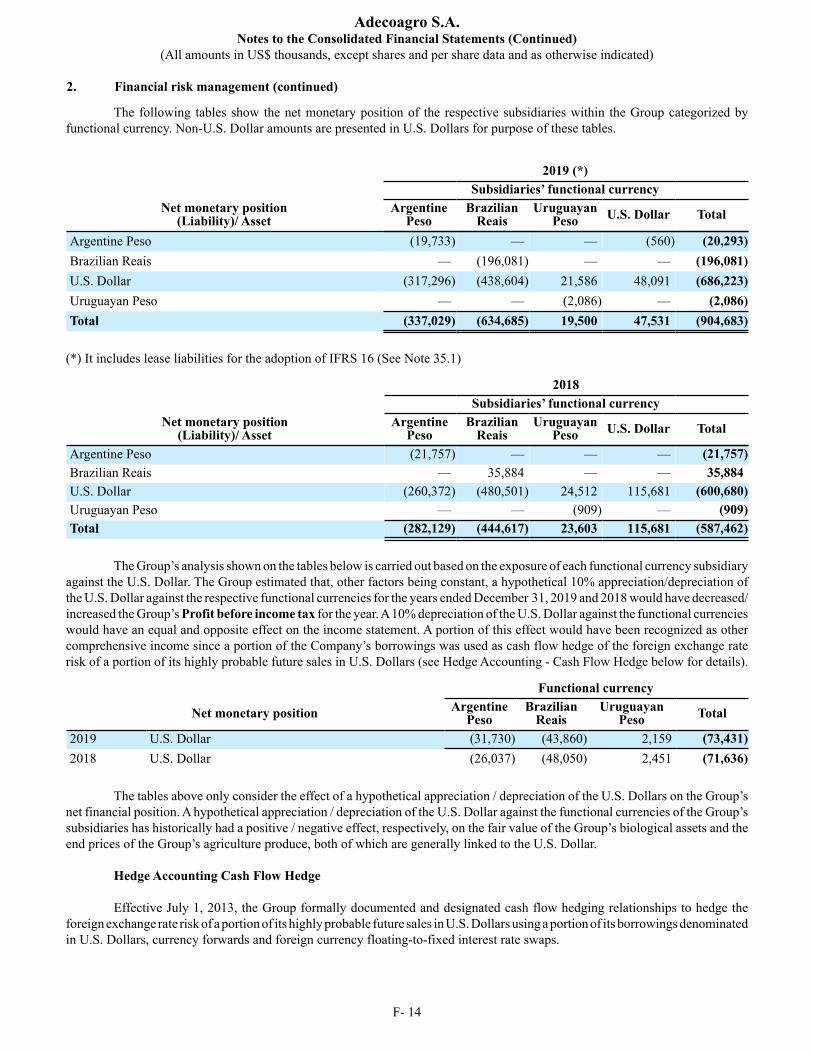
Adecoagro S.A.Notes to the Consolidated Financial Statements (Continued)
(All amounts in US$ thousands, except shares and per share data and as otherwise indicated)
2. Financial risk management (continued)
F- 14
The following tables show the net monetary position of the respective subsidiaries within the Group categorized by functional currency. Non-U.S. Dollar amounts are presented in U.S. Dollars for purpose of these tables.
2019 (*) Subsidiaries’ functional currency
Net monetary position(Liability)/ Asset
ArgentinePeso
BrazilianReais
UruguayanPeso U.S. Dollar Total
Argentine Peso (19,733) — — (560) (20,293)Brazilian Reais — (196,081) — — (196,081)U.S. Dollar (317,296) (438,604) 21,586 48,091 (686,223)Uruguayan Peso — — (2,086) — (2,086)Total (337,029) (634,685) 19,500 47,531 (904,683)
(*) It includes lease liabilities for the adoption of IFRS 16 (See Note 35.1)
2018 Subsidiaries’ functional currency
Net monetary position(Liability)/ Asset
ArgentinePeso
BrazilianReais
UruguayanPeso U.S. Dollar Total
Argentine Peso (21,757) — — — (21,757)Brazilian Reais — 35,884 — — 35,884U.S. Dollar (260,372) (480,501) 24,512 115,681 (600,680)Uruguayan Peso — — (909) — (909)Total (282,129) (444,617) 23,603 115,681 (587,462)
The Group’s analysis shown on the tables below is carried out based on the exposure of each functional currency subsidiary
against the U.S. Dollar. The Group estimated that, other factors being constant, a hypothetical 10% appreciation/depreciation of the U.S. Dollar against the respective functional currencies for the years ended December 31, 2019 and 2018 would have decreased/increased the Group’s Profit before income tax for the year. A 10% depreciation of the U.S. Dollar against the functional currencies would have an equal and opposite effect on the income statement. A portion of this effect would have been recognized as other comprehensive income since a portion of the Company’s borrowings was used as cash flow hedge of the foreign exchange rate risk of a portion of its highly probable future sales in U.S. Dollars (see Hedge Accounting - Cash Flow Hedge below for details).
Functional currency
Net monetary position ArgentinePeso
BrazilianReais
UruguayanPeso Total
2019 U.S. Dollar (31,730) (43,860) 2,159 (73,431)2018 U.S. Dollar (26,037) (48,050) 2,451 (71,636)
The tables above only consider the effect of a hypothetical appreciation / depreciation of the U.S. Dollars on the Group’s
net financial position. A hypothetical appreciation / depreciation of the U.S. Dollar against the functional currencies of the Group’s subsidiaries has historically had a positive / negative effect, respectively, on the fair value of the Group’s biological assets and the end prices of the Group’s agriculture produce, both of which are generally linked to the U.S. Dollar.
Hedge Accounting Cash Flow Hedge Effective July 1, 2013, the Group formally documented and designated cash flow hedging relationships to hedge the
foreign exchange rate risk of a portion of its highly probable future sales in U.S. Dollars using a portion of its borrowings denominated in U.S. Dollars, currency forwards and foreign currency floating-to-fixed interest rate swaps.
Adecoagro S.A.Notes to the Consolidated Financial Statements (Continued)
(All amounts in US$ thousands, except shares and per share data and as otherwise indicated)
2. Financial risk management (continued)
F- 15
Principal amounts of long-term borrowings (non-derivative financial instruments) and notional values of foreign currency forward contracts (derivative financial instruments) were designated as hedging instruments. These instruments are exposed to Brazilian Reais/ U.S. Dollar foreign currency risks related to operations in Brazil and Argentine Peso/U.S. Dollar in Argentina, respectively. As of December 31, 2019 and 2018, approximately 30.2% and 19.5%, respectively, of projected sales qualify as highly probable forecast transactions for hedge accounting purposes and were designated as hedged items.
The Group has prepared formal documentation in order to support the designation above, including an explanation of
how the designation of the hedging relationship is aligned with the Group’s Risk Management Policy, identification of the hedging instrument, the hedged transactions, the nature of the risk being hedged and an analysis which demonstrates that the hedge is expected to be highly effective. The Group reassesses the prospective and retrospective effectiveness of the hedge on an ongoing basis comparing the foreign currency component of the carrying amount of the hedging instruments and of the highly probable future sales.
Under cash flow hedge accounting, effect of changes in foreign currency exchange rates on derivative and non-derivative hedging instruments not be immediately recognized in profit or loss, but be reclassified from equity to profit or loss in the periods when the future sales occur, thus allowing for a more appropriate presentation of the results for the period reflecting the strategy in the Group’s Risk Management Policy.
The Company expects that the cash flows will occur and affect profit or loss between 2020 and 2024.
For the year ended December 31, 2019, a total amount before income tax of US$ 54,312 gain (US$ 75,822 gain in 2018)
was recognized in other comprehensive income and an amount of US$ 15,594 loss (US$ 26,693 loss in 2018) was reclassified from equity to profit or loss within “Financial results, net”.
• Raw material price risk
Inflation in the costs of raw materials and goods and services from industry suppliers and manufacturers presents risks to project economics. A significant portion of the Group’s cost structure includes the cost of raw materials primarily seeds, fertilizers and agrochemicals, among others. Prices for these raw materials may vary significantly.
• End-product price risk
Prices for commodity products have historically been cyclical, reflecting overall economic conditions and changes in capacity within the industry, which affect the profitability of entities engaged in the agribusiness industry. The Group combines different actions to minimize price risk. A percentage of crops are to be sold during and post harvest period. The Group manages minimum and maximum prices for each commodity as well as gross margin per each crop as to decide when and how to sell. End-product price risks are hedged if economically viable and possible by entering into forward contracts with major trading houses or by using derivative financial instruments, consisting mainly of crops and sugar future contracts, but also includes occasionally put and call options. A movement in end-product futures prices would result in a change in the fair value of the end product hedging contracts. These fair value changes, after taxes, are recorded in the consolidated statement of income.
Contract positions are designed to ensure that the Group would receive a defined minimum price for certain quantities
of its production. The counterparties to these instruments generally are major financial institutions. In entering into these contracts, the Group has assumed the risk that might arise from the possible inability of counterparties to meet the terms of their contracts. The Group does not expect any material losses as a result of counterparty defaults. The Group is also obliged to pay margin deposits and premiums for these instruments. These estimates represent only the sensitivity of the financial instruments to market risk and not the Group exposure to end product price risks as a whole, since the crops and cattle products sales are not financial instruments within the scope of IFRS 7 disclosure requirements.
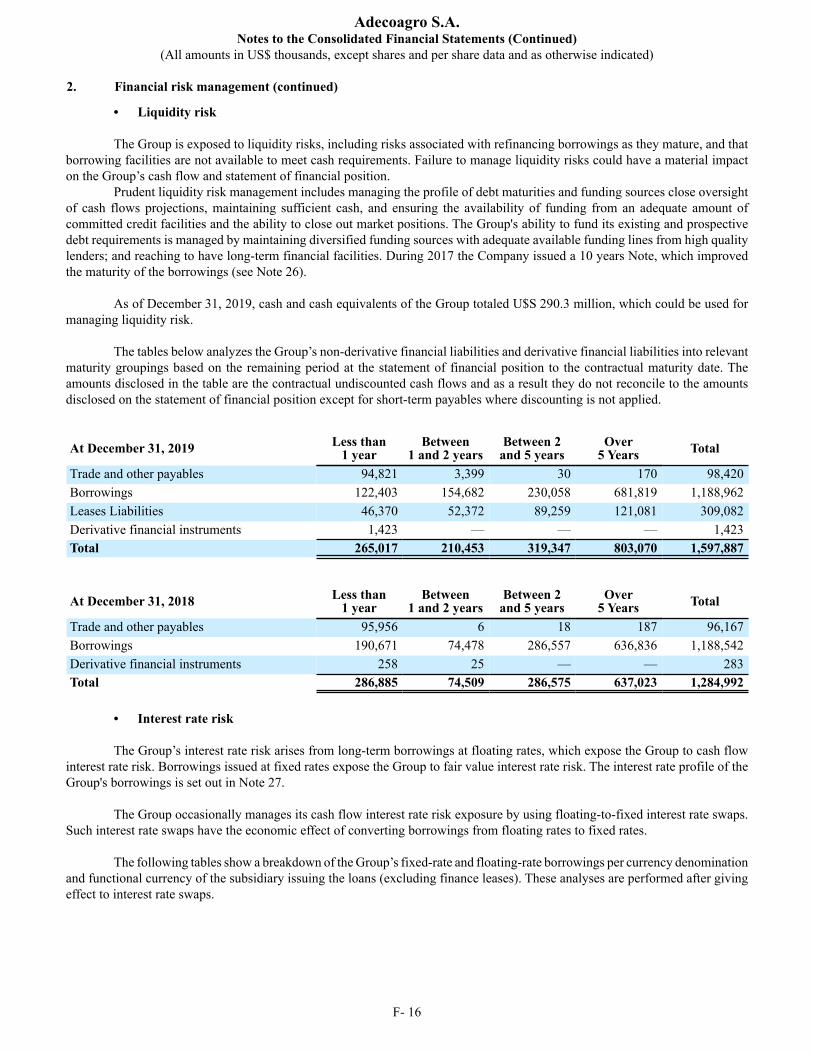
Adecoagro S.A.Notes to the Consolidated Financial Statements (Continued)
(All amounts in US$ thousands, except shares and per share data and as otherwise indicated)
2. Financial risk management (continued)
F- 16
• Liquidity risk
The Group is exposed to liquidity risks, including risks associated with refinancing borrowings as they mature, and that borrowing facilities are not available to meet cash requirements. Failure to manage liquidity risks could have a material impact on the Group’s cash flow and statement of financial position.
Prudent liquidity risk management includes managing the profile of debt maturities and funding sources close oversight of cash flows projections, maintaining sufficient cash, and ensuring the availability of funding from an adequate amount of committed credit facilities and the ability to close out market positions. The Group's ability to fund its existing and prospective debt requirements is managed by maintaining diversified funding sources with adequate available funding lines from high quality lenders; and reaching to have long-term financial facilities. During 2017 the Company issued a 10 years Note, which improved the maturity of the borrowings (see Note 26).
As of December 31, 2019, cash and cash equivalents of the Group totaled U$S 290.3 million, which could be used for
managing liquidity risk. The tables below analyzes the Group’s non-derivative financial liabilities and derivative financial liabilities into relevant
maturity groupings based on the remaining period at the statement of financial position to the contractual maturity date. The amounts disclosed in the table are the contractual undiscounted cash flows and as a result they do not reconcile to the amounts disclosed on the statement of financial position except for short-term payables where discounting is not applied.
At December 31, 2019 Less than1 year
Between1 and 2 years
Between 2and 5 years
Over5 Years Total
Trade and other payables 94,821 3,399 30 170 98,420Borrowings 122,403 154,682 230,058 681,819 1,188,962Leases Liabilities 46,370 52,372 89,259 121,081 309,082Derivative financial instruments 1,423 — — — 1,423Total 265,017 210,453 319,347 803,070 1,597,887
At December 31, 2018 Less than1 year
Between1 and 2 years
Between 2and 5 years
Over5 Years Total
Trade and other payables 95,956 6 18 187 96,167Borrowings 190,671 74,478 286,557 636,836 1,188,542Derivative financial instruments 258 25 — — 283Total 286,885 74,509 286,575 637,023 1,284,992
• Interest rate risk
The Group’s interest rate risk arises from long-term borrowings at floating rates, which expose the Group to cash flow interest rate risk. Borrowings issued at fixed rates expose the Group to fair value interest rate risk. The interest rate profile of the Group's borrowings is set out in Note 27.
The Group occasionally manages its cash flow interest rate risk exposure by using floating-to-fixed interest rate swaps.
Such interest rate swaps have the economic effect of converting borrowings from floating rates to fixed rates. The following tables show a breakdown of the Group’s fixed-rate and floating-rate borrowings per currency denomination
and functional currency of the subsidiary issuing the loans (excluding finance leases). These analyses are performed after giving effect to interest rate swaps.
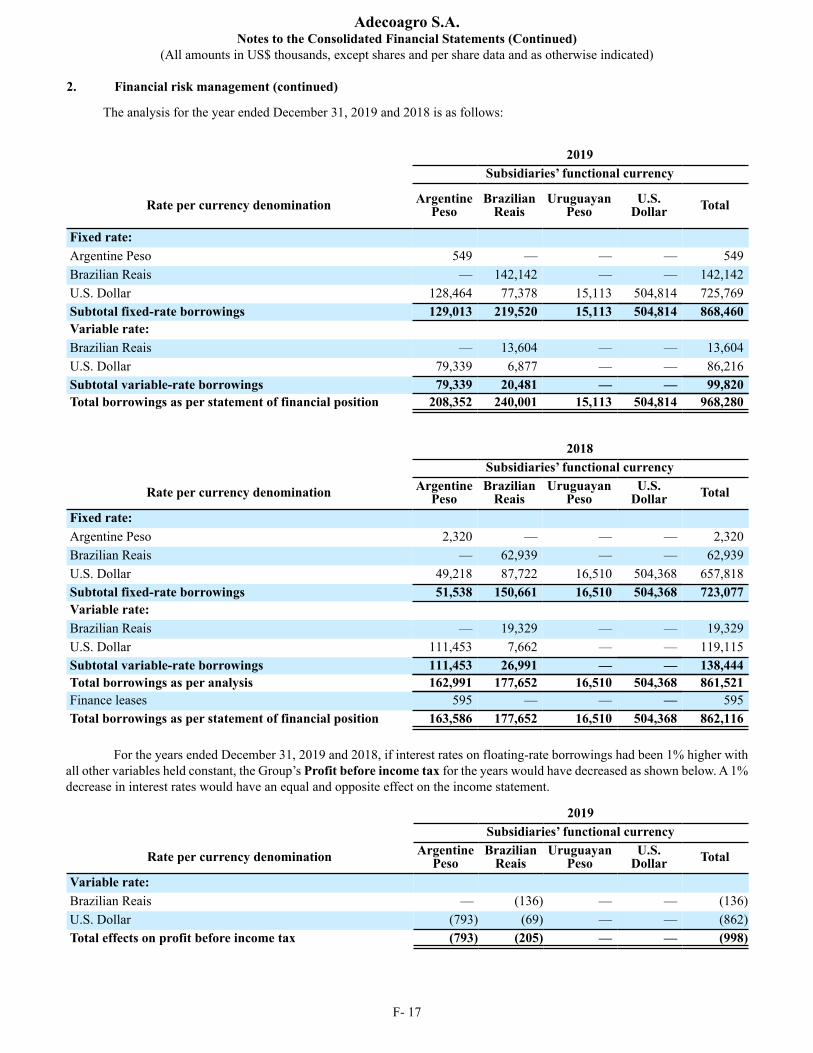
Adecoagro S.A.Notes to the Consolidated Financial Statements (Continued)
(All amounts in US$ thousands, except shares and per share data and as otherwise indicated)
2. Financial risk management (continued)
F- 17
The analysis for the year ended December 31, 2019 and 2018 is as follows:
2019 Subsidiaries’ functional currency
Rate per currency denomination ArgentinePeso
BrazilianReais
UruguayanPeso
U.S.Dollar Total
Fixed rate: Argentine Peso 549 — — — 549Brazilian Reais — 142,142 — — 142,142U.S. Dollar 128,464 77,378 15,113 504,814 725,769Subtotal fixed-rate borrowings 129,013 219,520 15,113 504,814 868,460Variable rate: Brazilian Reais — 13,604 — — 13,604U.S. Dollar 79,339 6,877 — — 86,216Subtotal variable-rate borrowings 79,339 20,481 — — 99,820Total borrowings as per statement of financial position 208,352 240,001 15,113 504,814 968,280
2018 Subsidiaries’ functional currency
Rate per currency denomination ArgentinePeso
BrazilianReais
UruguayanPeso
U.S.Dollar Total
Fixed rate: Argentine Peso 2,320 — — — 2,320Brazilian Reais — 62,939 — — 62,939U.S. Dollar 49,218 87,722 16,510 504,368 657,818Subtotal fixed-rate borrowings 51,538 150,661 16,510 504,368 723,077Variable rate: Brazilian Reais — 19,329 — — 19,329U.S. Dollar 111,453 7,662 — — 119,115Subtotal variable-rate borrowings 111,453 26,991 — — 138,444Total borrowings as per analysis 162,991 177,652 16,510 504,368 861,521Finance leases 595 — — — 595Total borrowings as per statement of financial position 163,586 177,652 16,510 504,368 862,116
For the years ended December 31, 2019 and 2018, if interest rates on floating-rate borrowings had been 1% higher with
all other variables held constant, the Group’s Profit before income tax for the years would have decreased as shown below. A 1%decrease in interest rates would have an equal and opposite effect on the income statement.
2019 Subsidiaries’ functional currency
Rate per currency denomination ArgentinePeso
BrazilianReais
UruguayanPeso
U.S.Dollar Total
Variable rate: Brazilian Reais — (136) — — (136)U.S. Dollar (793) (69) — — (862)Total effects on profit before income tax (793) (205) — — (998)
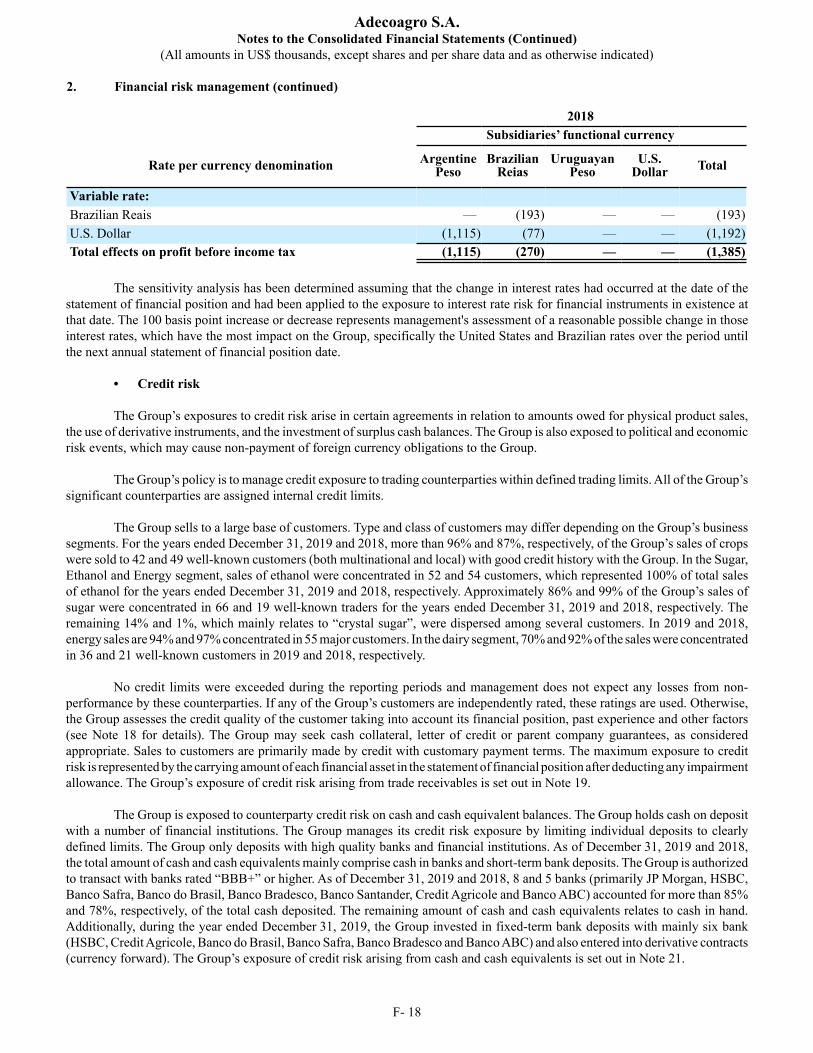
Adecoagro S.A.Notes to the Consolidated Financial Statements (Continued)
(All amounts in US$ thousands, except shares and per share data and as otherwise indicated)
2. Financial risk management (continued)
F- 18
2018 Subsidiaries’ functional currency
Rate per currency denomination ArgentinePeso
BrazilianReias
UruguayanPeso
U.S.Dollar Total
Variable rate: Brazilian Reais — (193) — — (193)U.S. Dollar (1,115) (77) — — (1,192)Total effects on profit before income tax (1,115) (270) — — (1,385)
The sensitivity analysis has been determined assuming that the change in interest rates had occurred at the date of the
statement of financial position and had been applied to the exposure to interest rate risk for financial instruments in existence at that date. The 100 basis point increase or decrease represents management's assessment of a reasonable possible change in those interest rates, which have the most impact on the Group, specifically the United States and Brazilian rates over the period until the next annual statement of financial position date.
• Credit risk
The Group’s exposures to credit risk arise in certain agreements in relation to amounts owed for physical product sales, the use of derivative instruments, and the investment of surplus cash balances. The Group is also exposed to political and economic risk events, which may cause non-payment of foreign currency obligations to the Group.
The Group’s policy is to manage credit exposure to trading counterparties within defined trading limits. All of the Group’s
significant counterparties are assigned internal credit limits. The Group sells to a large base of customers. Type and class of customers may differ depending on the Group’s business
segments. For the years ended December 31, 2019 and 2018, more than 96% and 87%, respectively, of the Group’s sales of crops were sold to 42 and 49 well-known customers (both multinational and local) with good credit history with the Group. In the Sugar, Ethanol and Energy segment, sales of ethanol were concentrated in 52 and 54 customers, which represented 100% of total sales of ethanol for the years ended December 31, 2019 and 2018, respectively. Approximately 86% and 99% of the Group’s sales of sugar were concentrated in 66 and 19 well-known traders for the years ended December 31, 2019 and 2018, respectively. The remaining 14% and 1%, which mainly relates to “crystal sugar”, were dispersed among several customers. In 2019 and 2018, energy sales are 94% and 97% concentrated in 55 major customers. In the dairy segment, 70% and 92% of the sales were concentrated in 36 and 21 well-known customers in 2019 and 2018, respectively.
No credit limits were exceeded during the reporting periods and management does not expect any losses from non-
performance by these counterparties. If any of the Group’s customers are independently rated, these ratings are used. Otherwise, the Group assesses the credit quality of the customer taking into account its financial position, past experience and other factors (see Note 18 for details). The Group may seek cash collateral, letter of credit or parent company guarantees, as considered appropriate. Sales to customers are primarily made by credit with customary payment terms. The maximum exposure to credit risk is represented by the carrying amount of each financial asset in the statement of financial position after deducting any impairment allowance. The Group’s exposure of credit risk arising from trade receivables is set out in Note 19.
The Group is exposed to counterparty credit risk on cash and cash equivalent balances. The Group holds cash on deposit
with a number of financial institutions. The Group manages its credit risk exposure by limiting individual deposits to clearly defined limits. The Group only deposits with high quality banks and financial institutions. As of December 31, 2019 and 2018, the total amount of cash and cash equivalents mainly comprise cash in banks and short-term bank deposits. The Group is authorized to transact with banks rated “BBB+” or higher. As of December 31, 2019 and 2018, 8 and 5 banks (primarily JP Morgan, HSBC, Banco Safra, Banco do Brasil, Banco Bradesco, Banco Santander, Credit Agricole and Banco ABC) accounted for more than 85%and 78%, respectively, of the total cash deposited. The remaining amount of cash and cash equivalents relates to cash in hand. Additionally, during the year ended December 31, 2019, the Group invested in fixed-term bank deposits with mainly six bank (HSBC, Credit Agricole, Banco do Brasil, Banco Safra, Banco Bradesco and Banco ABC) and also entered into derivative contracts (currency forward). The Group’s exposure of credit risk arising from cash and cash equivalents is set out in Note 21.
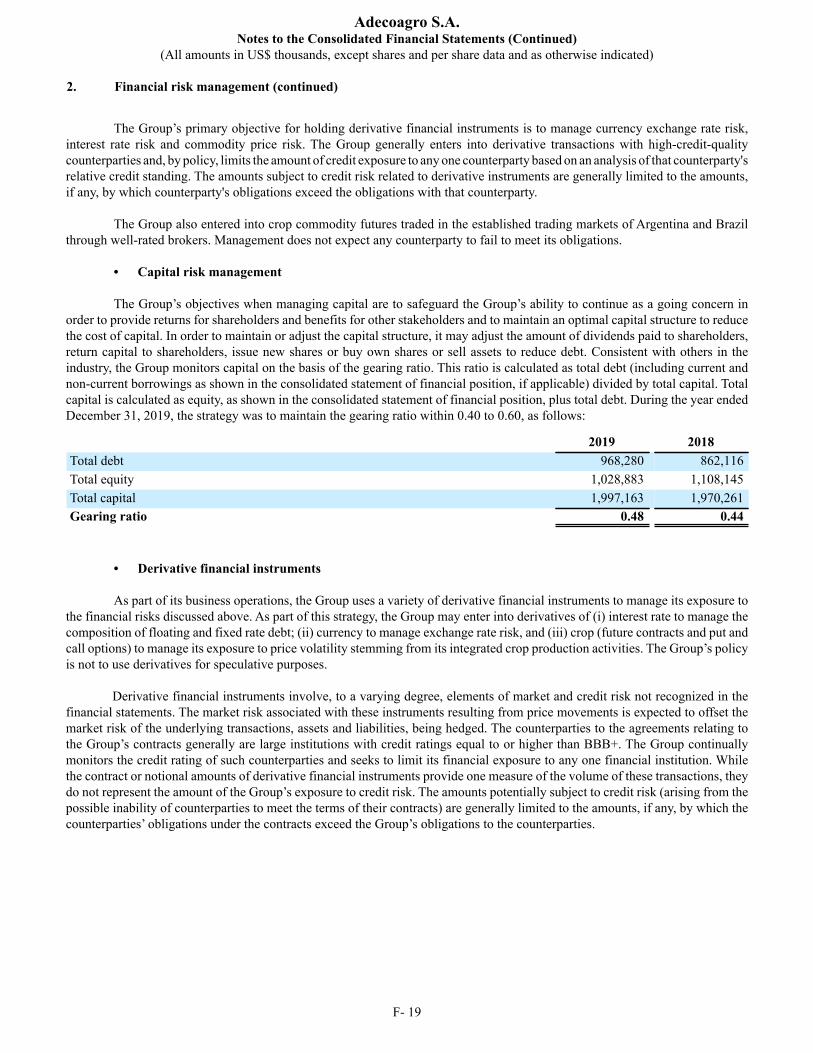
Adecoagro S.A.Notes to the Consolidated Financial Statements (Continued)
(All amounts in US$ thousands, except shares and per share data and as otherwise indicated)
2. Financial risk management (continued)
F- 19
The Group’s primary objective for holding derivative financial instruments is to manage currency exchange rate risk,
interest rate risk and commodity price risk. The Group generally enters into derivative transactions with high-credit-quality counterparties and, by policy, limits the amount of credit exposure to any one counterparty based on an analysis of that counterparty's relative credit standing. The amounts subject to credit risk related to derivative instruments are generally limited to the amounts, if any, by which counterparty's obligations exceed the obligations with that counterparty.
The Group also entered into crop commodity futures traded in the established trading markets of Argentina and Brazil
through well-rated brokers. Management does not expect any counterparty to fail to meet its obligations.
• Capital risk management
The Group’s objectives when managing capital are to safeguard the Group’s ability to continue as a going concern in order to provide returns for shareholders and benefits for other stakeholders and to maintain an optimal capital structure to reduce the cost of capital. In order to maintain or adjust the capital structure, it may adjust the amount of dividends paid to shareholders, return capital to shareholders, issue new shares or buy own shares or sell assets to reduce debt. Consistent with others in the industry, the Group monitors capital on the basis of the gearing ratio. This ratio is calculated as total debt (including current and non-current borrowings as shown in the consolidated statement of financial position, if applicable) divided by total capital. Total capital is calculated as equity, as shown in the consolidated statement of financial position, plus total debt. During the year ended December 31, 2019, the strategy was to maintain the gearing ratio within 0.40 to 0.60, as follows:
2019 2018Total debt 968,280 862,116Total equity 1,028,883 1,108,145Total capital 1,997,163 1,970,261Gearing ratio 0.48 0.44
• Derivative financial instruments
As part of its business operations, the Group uses a variety of derivative financial instruments to manage its exposure to the financial risks discussed above. As part of this strategy, the Group may enter into derivatives of (i) interest rate to manage the composition of floating and fixed rate debt; (ii) currency to manage exchange rate risk, and (iii) crop (future contracts and put and call options) to manage its exposure to price volatility stemming from its integrated crop production activities. The Group’s policy is not to use derivatives for speculative purposes.
Derivative financial instruments involve, to a varying degree, elements of market and credit risk not recognized in the financial statements. The market risk associated with these instruments resulting from price movements is expected to offset the market risk of the underlying transactions, assets and liabilities, being hedged. The counterparties to the agreements relating to the Group’s contracts generally are large institutions with credit ratings equal to or higher than BBB+. The Group continually monitors the credit rating of such counterparties and seeks to limit its financial exposure to any one financial institution. While the contract or notional amounts of derivative financial instruments provide one measure of the volume of these transactions, they do not represent the amount of the Group’s exposure to credit risk. The amounts potentially subject to credit risk (arising from the possible inability of counterparties to meet the terms of their contracts) are generally limited to the amounts, if any, by which the counterparties’ obligations under the contracts exceed the Group’s obligations to the counterparties.
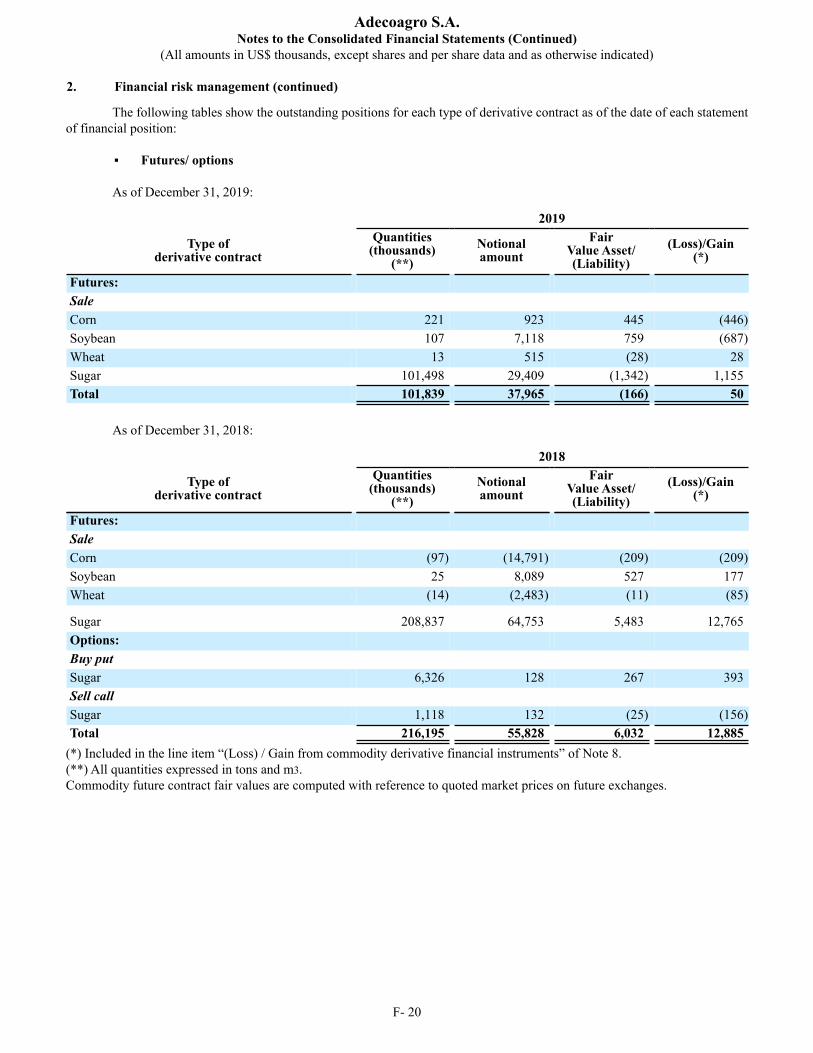
Adecoagro S.A.Notes to the Consolidated Financial Statements (Continued)
(All amounts in US$ thousands, except shares and per share data and as otherwise indicated)
2. Financial risk management (continued)
F- 20
The following tables show the outstanding positions for each type of derivative contract as of the date of each statement of financial position:
Futures/ options
As of December 31, 2019:
2019
Type ofderivative contract
Quantities(thousands)
(**)Notionalamount
FairValue Asset/(Liability)
(Loss)/Gain(*)
Futures: Sale Corn 221 923 445 (446)Soybean 107 7,118 759 (687)Wheat 13 515 (28) 28Sugar 101,498 29,409 (1,342) 1,155Total 101,839 37,965 (166) 50
As of December 31, 2018:
2018
Type ofderivative contract
Quantities(thousands)
(**)Notionalamount
FairValue Asset/(Liability)
(Loss)/Gain(*)
Futures: Sale Corn (97) (14,791) (209) (209)Soybean 25 8,089 527 177Wheat (14) (2,483) (11) (85)
Sugar 208,837 64,753 5,483 12,765Options: Buy putSugar 6,326 128 267 393Sell callSugar 1,118 132 (25) (156)Total 216,195 55,828 6,032 12,885
(*) Included in the line item “(Loss) / Gain from commodity derivative financial instruments” of Note 8.(**) All quantities expressed in tons and m3.Commodity future contract fair values are computed with reference to quoted market prices on future exchanges.
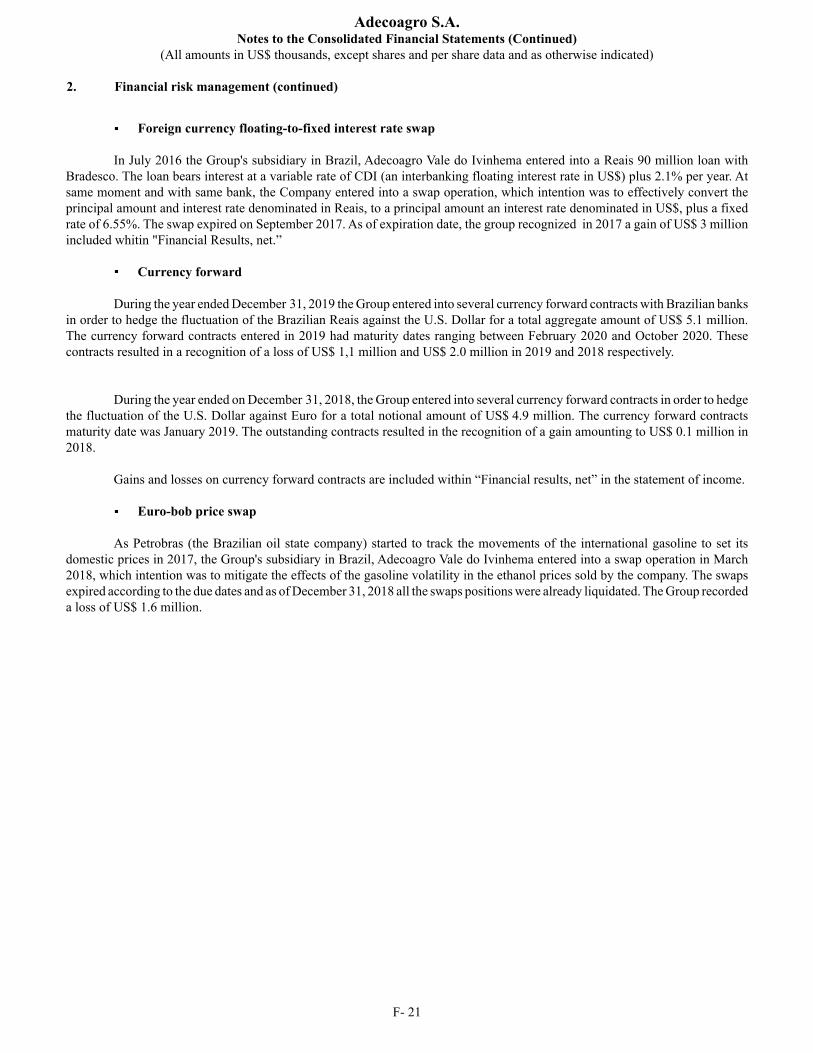
Adecoagro S.A.Notes to the Consolidated Financial Statements (Continued)
(All amounts in US$ thousands, except shares and per share data and as otherwise indicated)
2. Financial risk management (continued)
F- 21
Foreign currency floating-to-fixed interest rate swap
In July 2016 the Group's subsidiary in Brazil, Adecoagro Vale do Ivinhema entered into a Reais 90 million loan with Bradesco. The loan bears interest at a variable rate of CDI (an interbanking floating interest rate in US$) plus 2.1% per year. At same moment and with same bank, the Company entered into a swap operation, which intention was to effectively convert the principal amount and interest rate denominated in Reais, to a principal amount an interest rate denominated in US$, plus a fixed rate of 6.55%. The swap expired on September 2017. As of expiration date, the group recognized in 2017 a gain of US$ 3 million included whitin "Financial Results, net.”
Currency forward
During the year ended December 31, 2019 the Group entered into several currency forward contracts with Brazilian banks in order to hedge the fluctuation of the Brazilian Reais against the U.S. Dollar for a total aggregate amount of US$ 5.1 million. The currency forward contracts entered in 2019 had maturity dates ranging between February 2020 and October 2020. These contracts resulted in a recognition of a loss of US$ 1,1 million and US$ 2.0 million in 2019 and 2018 respectively.
During the year ended on December 31, 2018, the Group entered into several currency forward contracts in order to hedge
the fluctuation of the U.S. Dollar against Euro for a total notional amount of US$ 4.9 million. The currency forward contracts maturity date was January 2019. The outstanding contracts resulted in the recognition of a gain amounting to US$ 0.1 million in 2018.
Gains and losses on currency forward contracts are included within “Financial results, net” in the statement of income.
Euro-bob price swap
As Petrobras (the Brazilian oil state company) started to track the movements of the international gasoline to set its domestic prices in 2017, the Group's subsidiary in Brazil, Adecoagro Vale do Ivinhema entered into a swap operation in March 2018, which intention was to mitigate the effects of the gasoline volatility in the ethanol prices sold by the company. The swaps expired according to the due dates and as of December 31, 2018 all the swaps positions were already liquidated. The Group recorded a loss of US$ 1.6 million.
Adecoagro S.A.Notes to the Consolidated Financial Statements (Continued)
(All amounts in US$ thousands, except shares and per share data and as otherwise indicated)
F- 22
3. Segment information
According to IFRS 8, operating segments are identified based on the ‘management approach’. Operating segments are components of an entity about which separate financial information is available that is evaluated regularly by the chief operating decision maker (“CODM”) in deciding how to allocate resources and in assessing performance. The Group’s CODM is the Management Committee. IFRS 8 stipulates external segment reporting based on the Group’s internal organizational and management structure and on internal financial reporting to the chief operating decision maker.
The Group operates in three major lines of business, namely, Farming; Sugar, Ethanol and Energy; and Land Transformation.
• The Company’s ‘Farming’ is further comprised of five reportable segments:
• The Company’s ‘Crops’ Segment consists of planting, harvesting and sale of grains, oilseeds and fibers (including wheat, corn, soybeans, cotton and sunflowers, among others), and to a lesser extent the provision of grain warehousing/conditioning and handling and drying services to third parties. Each underlying crop in this segment does not represent a separate operating segment. Management seeks to maximize the use of the land through the cultivation of one or more type of crops. Types and surface amount of crops cultivated may vary from harvest year to harvest year depending on several factors, some of them out of the Group´s control. Management is focused on the long-term performance of the productive land, and to that extent, the performance is assessed considering the aggregated combination, if any, of crops planted in the land. A single manager is responsible for the management of operating activity of all crops rather than for each individual crop.
• The Company’s ‘Rice’ Segment consists of planting, harvesting, processing and marketing of rice.
• The Company’s ‘Dairy’ Segment consists of the production and sale of raw milk and industrialized products, including UHT, cheese and powder milk among others.
• The Company’s ‘All Other Segments’ consists of the aggregation of the remaining non-reportable operating segments, which do not meet the quantitative thresholds for disclosure, namely, Coffee and Cattle.
• The Company’s ‘Sugar, Ethanol and Energy’ Segment consists of cultivating sugarcane which is processed in owned sugar mills, transformed into ethanol, sugar and electricity and marketed;
• The Company’s ‘Land Transformation’ Segment comprises the (i) identification and acquisition of underdeveloped and undermanaged farmland businesses; and (ii) realization of value through the strategic disposition of assets (generating profits).
Total segment assets and liabilities are measured in a manner consistent with that of the consolidated financial statements. These assets and liabilities are allocated based on the operations of the segment and the physical location of the asset.
Effective July 1, 2018, the Group applied IAS 29 “Financial Reporting in Hyperinflationary Economies” (“IAS 29”) to its operations in Argentina. IAS 29 “Financial Reporting in Hyperinflationary Economies” requires that the financial statements of entities whose functional currency is that of a hyperinflationary economy be adjusted for the effects of changes in the general price index and be expressed in terms of the current unit of measurement at the closing date of the reporting period (“inflation accounting”). In order to determine whether an economy is classified as hyperinflationary, IAS 29 sets forth a series of factors to be considered, including whether the amount of cumulative inflation nears or exceeds a threshold of 100 %. Accordingly, Argentina has been classified as a hyperinflationary economy under the terms of IAS 29 from July 1, 2018. (Please see Note 33 - Basis of preparation and presentations).
According to IAS 29, all Argentine Peso-denominated non-monetary items in the statement of financial position are adjusted by applying a general price index from the date they were initially recognized to the end of the reporting period. Likewise, all Argentine Peso-denominated items in the statement of income should be expressed in terms of the measuring unit current at the end of the reporting period, consequently, income statement items are adjusted by applying a general price index on a monthly basis from the dates they were initially recognized in the financial statements to the end of the reporting period. This process is called “re-measurement”.
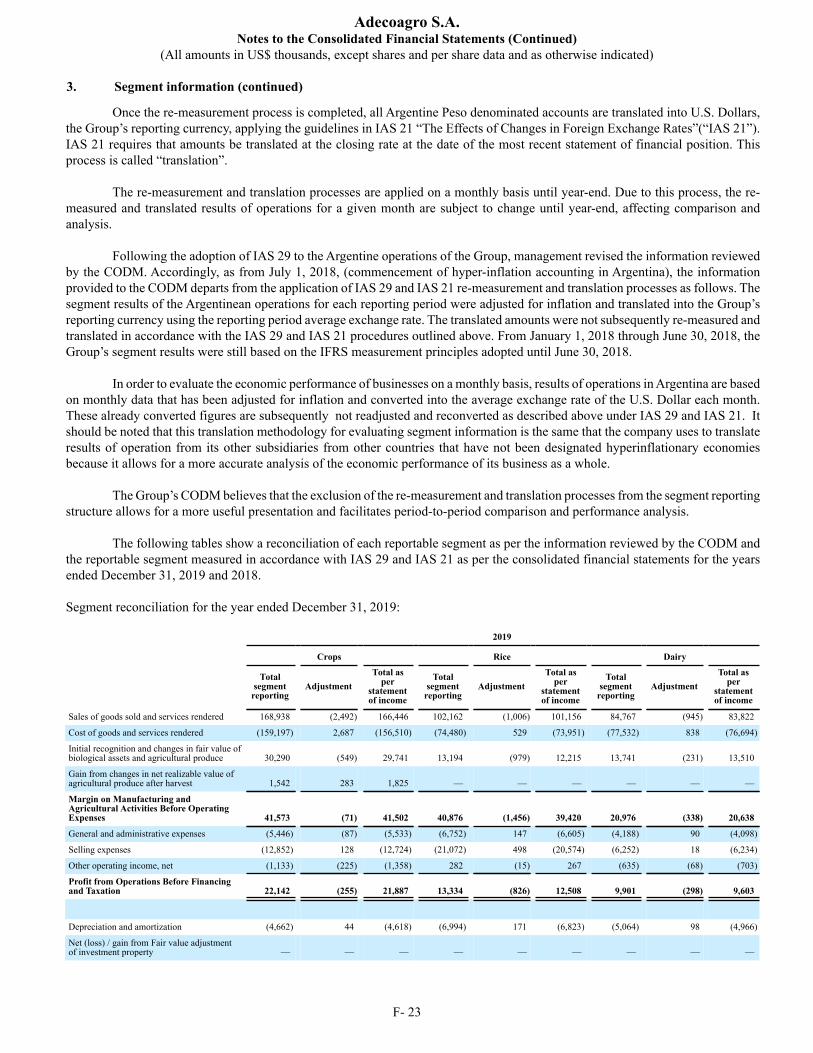
Adecoagro S.A.Notes to the Consolidated Financial Statements (Continued)
(All amounts in US$ thousands, except shares and per share data and as otherwise indicated)
3. Segment information (continued)
F- 23
Once the re-measurement process is completed, all Argentine Peso denominated accounts are translated into U.S. Dollars, the Group’s reporting currency, applying the guidelines in IAS 21 “The Effects of Changes in Foreign Exchange Rates”(“IAS 21”). IAS 21 requires that amounts be translated at the closing rate at the date of the most recent statement of financial position. This process is called “translation”.
The re-measurement and translation processes are applied on a monthly basis until year-end. Due to this process, the re-measured and translated results of operations for a given month are subject to change until year-end, affecting comparison and analysis.
Following the adoption of IAS 29 to the Argentine operations of the Group, management revised the information reviewed by the CODM. Accordingly, as from July 1, 2018, (commencement of hyper-inflation accounting in Argentina), the information provided to the CODM departs from the application of IAS 29 and IAS 21 re-measurement and translation processes as follows. The segment results of the Argentinean operations for each reporting period were adjusted for inflation and translated into the Group’s reporting currency using the reporting period average exchange rate. The translated amounts were not subsequently re-measured and translated in accordance with the IAS 29 and IAS 21 procedures outlined above. From January 1, 2018 through June 30, 2018, the Group’s segment results were still based on the IFRS measurement principles adopted until June 30, 2018.
In order to evaluate the economic performance of businesses on a monthly basis, results of operations in Argentina are based on monthly data that has been adjusted for inflation and converted into the average exchange rate of the U.S. Dollar each month. These already converted figures are subsequently not readjusted and reconverted as described above under IAS 29 and IAS 21. It should be noted that this translation methodology for evaluating segment information is the same that the company uses to translate results of operation from its other subsidiaries from other countries that have not been designated hyperinflationary economies because it allows for a more accurate analysis of the economic performance of its business as a whole.
The Group’s CODM believes that the exclusion of the re-measurement and translation processes from the segment reporting structure allows for a more useful presentation and facilitates period-to-period comparison and performance analysis.
The following tables show a reconciliation of each reportable segment as per the information reviewed by the CODM and the reportable segment measured in accordance with IAS 29 and IAS 21 as per the consolidated financial statements for the years ended December 31, 2019 and 2018.
Segment reconciliation for the year ended December 31, 2019:
2019
Crops Rice Dairy
Totalsegment
reportingAdjustment
Total asper
statementof income
Totalsegment
reportingAdjustment
Total asper
statementof income
Totalsegment
reportingAdjustment
Total asper
statementof income
Sales of goods sold and services rendered 168,938 (2,492) 166,446 102,162 (1,006) 101,156 84,767 (945) 83,822
Cost of goods and services rendered (159,197) 2,687 (156,510) (74,480) 529 (73,951) (77,532) 838 (76,694)
Initial recognition and changes in fair value ofbiological assets and agricultural produce 30,290 (549) 29,741 13,194 (979) 12,215 13,741 (231) 13,510
Gain from changes in net realizable value ofagricultural produce after harvest 1,542 283 1,825 — — — — — —
Margin on Manufacturing andAgricultural Activities Before OperatingExpenses 41,573 (71) 41,502 40,876 (1,456) 39,420 20,976 (338) 20,638
General and administrative expenses (5,446) (87) (5,533) (6,752) 147 (6,605) (4,188) 90 (4,098)
Selling expenses (12,852) 128 (12,724) (21,072) 498 (20,574) (6,252) 18 (6,234)
Other operating income, net (1,133) (225) (1,358) 282 (15) 267 (635) (68) (703)
Profit from Operations Before Financingand Taxation 22,142 (255) 21,887 13,334 (826) 12,508 9,901 (298) 9,603
Depreciation and amortization (4,662) 44 (4,618) (6,994) 171 (6,823) (5,064) 98 (4,966)
Net (loss) / gain from Fair value adjustmentof investment property — — — — — — — — —
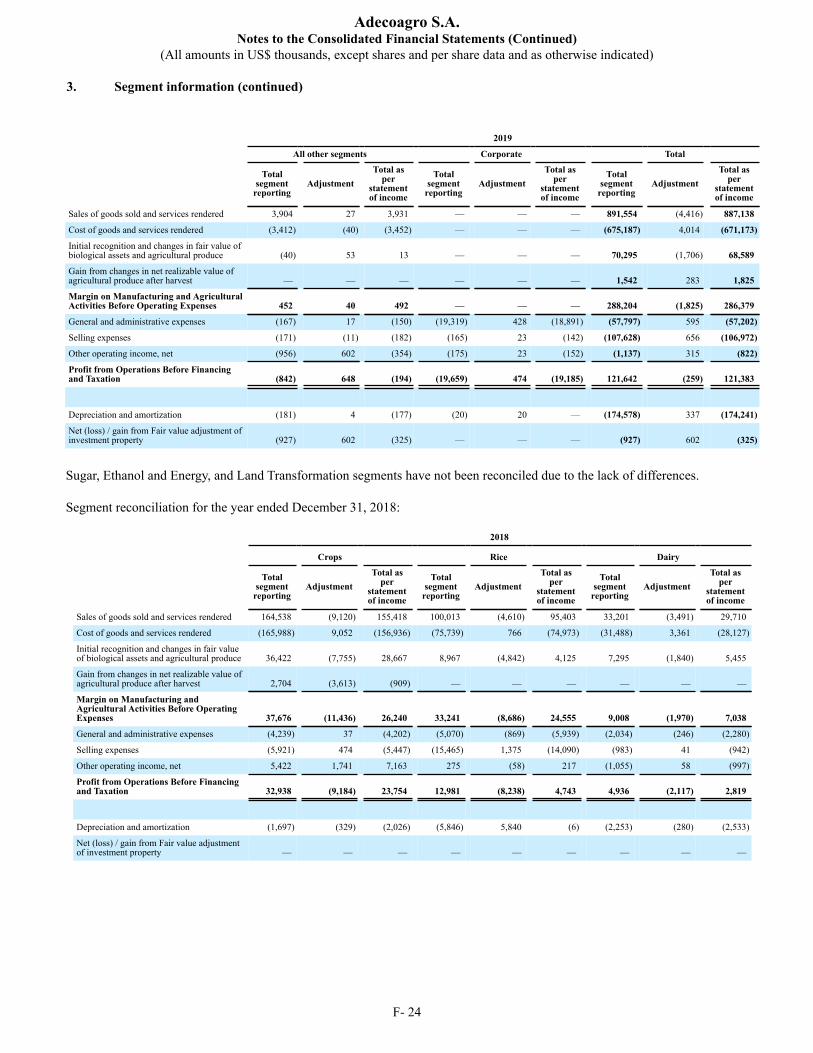
Adecoagro S.A.Notes to the Consolidated Financial Statements (Continued)
(All amounts in US$ thousands, except shares and per share data and as otherwise indicated)
3. Segment information (continued)
F- 24
2019
All other segments Corporate Total
Totalsegment
reportingAdjustment
Total asper
statementof income
Totalsegment
reportingAdjustment
Total asper
statementof income
Totalsegment
reportingAdjustment
Total asper
statementof income
Sales of goods sold and services rendered 3,904 27 3,931 — — — 891,554 (4,416) 887,138
Cost of goods and services rendered (3,412) (40) (3,452) — — — (675,187) 4,014 (671,173)
Initial recognition and changes in fair value ofbiological assets and agricultural produce (40) 53 13 — — — 70,295 (1,706) 68,589
Gain from changes in net realizable value ofagricultural produce after harvest — — — — — — 1,542 283 1,825
Margin on Manufacturing and AgriculturalActivities Before Operating Expenses 452 40 492 — — — 288,204 (1,825) 286,379
General and administrative expenses (167) 17 (150) (19,319) 428 (18,891) (57,797) 595 (57,202)
Selling expenses (171) (11) (182) (165) 23 (142) (107,628) 656 (106,972)
Other operating income, net (956) 602 (354) (175) 23 (152) (1,137) 315 (822)
Profit from Operations Before Financingand Taxation (842) 648 (194) (19,659) 474 (19,185) 121,642 (259) 121,383
Depreciation and amortization (181) 4 (177) (20) 20 — (174,578) 337 (174,241)
Net (loss) / gain from Fair value adjustment ofinvestment property (927) 602 (325) — — — (927) 602 (325)
Sugar, Ethanol and Energy, and Land Transformation segments have not been reconciled due to the lack of differences.
Segment reconciliation for the year ended December 31, 2018:
2018
Crops Rice Dairy
Totalsegment
reportingAdjustment
Total asper
statementof income
Totalsegment
reportingAdjustment
Total asper
statementof income
Totalsegment
reportingAdjustment
Total asper
statementof income
Sales of goods sold and services rendered 164,538 (9,120) 155,418 100,013 (4,610) 95,403 33,201 (3,491) 29,710
Cost of goods and services rendered (165,988) 9,052 (156,936) (75,739) 766 (74,973) (31,488) 3,361 (28,127)
Initial recognition and changes in fair valueof biological assets and agricultural produce 36,422 (7,755) 28,667 8,967 (4,842) 4,125 7,295 (1,840) 5,455
Gain from changes in net realizable value ofagricultural produce after harvest 2,704 (3,613) (909) — — — — — —
Margin on Manufacturing andAgricultural Activities Before OperatingExpenses 37,676 (11,436) 26,240 33,241 (8,686) 24,555 9,008 (1,970) 7,038
General and administrative expenses (4,239) 37 (4,202) (5,070) (869) (5,939) (2,034) (246) (2,280)
Selling expenses (5,921) 474 (5,447) (15,465) 1,375 (14,090) (983) 41 (942)
Other operating income, net 5,422 1,741 7,163 275 (58) 217 (1,055) 58 (997)
Profit from Operations Before Financingand Taxation 32,938 (9,184) 23,754 12,981 (8,238) 4,743 4,936 (2,117) 2,819
Depreciation and amortization (1,697) (329) (2,026) (5,846) 5,840 (6) (2,253) (280) (2,533)
Net (loss) / gain from Fair value adjustmentof investment property — — — — — — — — —
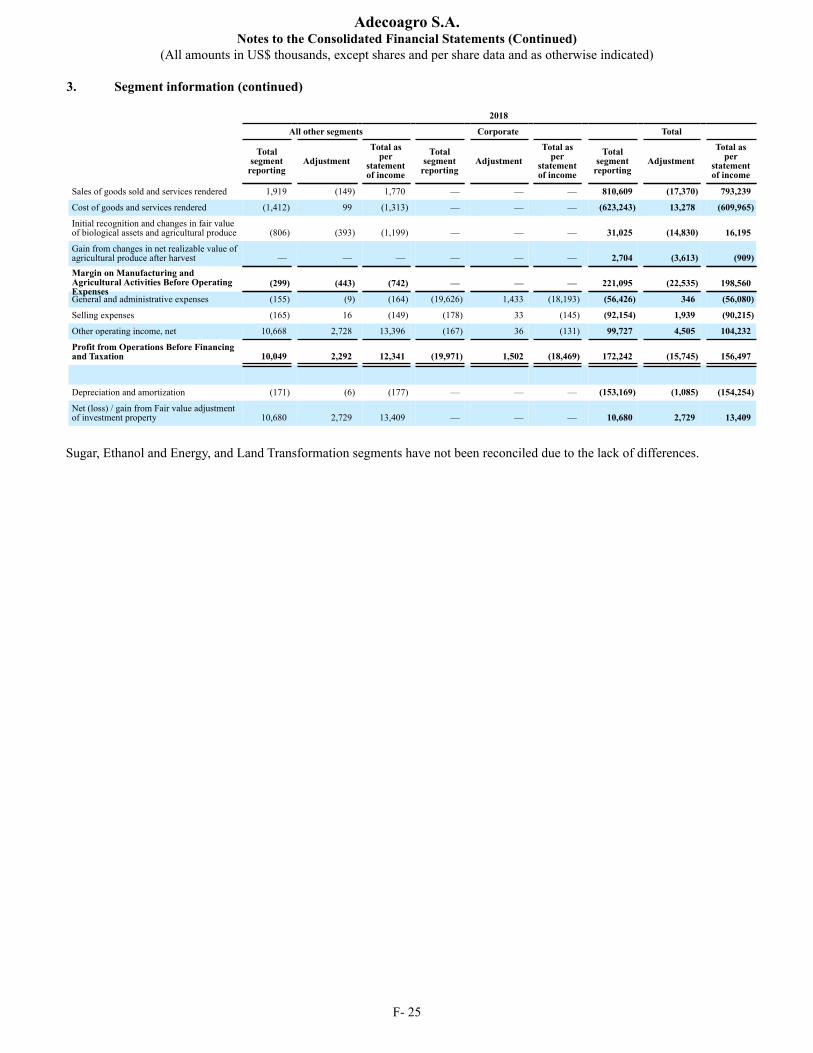
Adecoagro S.A.Notes to the Consolidated Financial Statements (Continued)
(All amounts in US$ thousands, except shares and per share data and as otherwise indicated)
3. Segment information (continued)
F- 25
2018
All other segments Corporate Total
Totalsegment
reportingAdjustment
Total asper
statementof income
Totalsegment
reportingAdjustment
Total asper
statementof income
Totalsegment
reportingAdjustment
Total asper
statementof income
Sales of goods sold and services rendered 1,919 (149) 1,770 — — — 810,609 (17,370) 793,239
Cost of goods and services rendered (1,412) 99 (1,313) — — — (623,243) 13,278 (609,965)
Initial recognition and changes in fair valueof biological assets and agricultural produce (806) (393) (1,199) — — — 31,025 (14,830) 16,195
Gain from changes in net realizable value ofagricultural produce after harvest — — — — — — 2,704 (3,613) (909)Margin on Manufacturing andAgricultural Activities Before OperatingExpenses
(299) (443) (742) — — — 221,095 (22,535) 198,560
General and administrative expenses (155) (9) (164) (19,626) 1,433 (18,193) (56,426) 346 (56,080)
Selling expenses (165) 16 (149) (178) 33 (145) (92,154) 1,939 (90,215)
Other operating income, net 10,668 2,728 13,396 (167) 36 (131) 99,727 4,505 104,232
Profit from Operations Before Financingand Taxation 10,049 2,292 12,341 (19,971) 1,502 (18,469) 172,242 (15,745) 156,497
Depreciation and amortization (171) (6) (177) — — — (153,169) (1,085) (154,254)
Net (loss) / gain from Fair value adjustmentof investment property 10,680 2,729 13,409 — — — 10,680 2,729 13,409
Sugar, Ethanol and Energy, and Land Transformation segments have not been reconciled due to the lack of differences.

Adecoagro S.A.Notes to the Consolidated Financial Statements (Continued)
(All amounts in US$ thousands, except shares and per share data and as otherwise indicated)
3. Segment information (continued)
F- 26
The following table presents information with respect to the Group’s reportable segments. Certain other activities of a holding function nature not allocable to the segments are disclosed in the column ‘Corporate’.
Segment analysis for the year ended December 31, 2019
Farming Sugar,Ethanol
and Energy
Land Transformation Corporate Total
Crops Rice Dairy All othersegments
Farmingsubtotal
Sales of goods and services rendered 168,938 102,162 84,767 3,904 359,771 531,783 — — 891,554
Cost of goods sold and services rendered (159,197) (74,480) (77,532) (3,412) (314,621) (360,566) — — (675,187)
Initial recognition and changes in fair value ofbiological assets and agricultural produce 30,290 13,194 13,741 (40) 57,185 13,110 — — 70,295
Changes in net realizable value of agriculturalproduce after harvest 1,542 — — — 1,542 — — — 1,542
Margin on manufacturing and agriculturalactivities before operating expenses 41,573 40,876 20,976 452 103,877 184,327 — — 288,204
General and administrative expenses (5,446) (6,752) (4,188) (167) (16,553) (21,925) — (19,319) (57,797)
Selling expenses (12,852) (21,072) (6,252) (171) (40,347) (67,116) — (165) (107,628)
Other operating income, net (1,133) 282 (635) (956) (2,442) 126 1,354 (175) (1,137)
Profit / (loss) from operations before financingand taxation 22,142 13,334 9,901 (842) 44,535 95,412 1,354 (19,659) 121,642
Depreciation and amortization (4,662) (6,994) (5,064) (181) (16,901) (157,657) — (20) (174,578)
Net (loss) / gain from Fair value adjustment ofinvestment property — — — (927) (927) — — — (927)
Reverse of revaluation surplus derived from thedisposals of assets before taxes — — — — — — 8,022 — 8,022
Initial recognition and changes in fair value ofbiological assets and agricultural produce(unrealized) 6,091 509 (3,957) (72) 2,571 (851) — — 1,720
Initial recognition and changes in fair value ofbiological assets and agricultural produce (realized) 24,199 12,685 17,698 32 54,614 13,961 — — 68,575
Changes in net realizable value of agriculturalproduce after harvest (unrealized) (481) — — — (481) — — — (481)
Changes in net realizable value of agriculturalproduce after harvest (realized) 2,023 — — — 2,023 — — — 2,023
Farmlands and farmland improvements, net 474,922 142,864 611 52,874 671,271 63,594 — — 734,865
Machinery, equipment and other fixed assets, net 29,038 25,425 74,403 507 129,373 316,304 — — 445,677
Bearer plants, net 592 — — — 592 252,928 — — 253,520
Work in progress 11,457 15,669 15,394 1,214 43,734 15,424 — — 59,158
Right of use assest 4,378 567 371 — 5,316 231,832 — 905 238,053
Investment property — — — 34,295 34,295 — — — 34,295
Goodwill 9,896 3,890 — 817 14,603 5,417 — — 20,020
Biological assets 38,404 21,484 11,521 3,673 75,082 55,354 — — 130,436
Finished goods 17,830 5,805 4,779 — 28,414 36,864 — — 65,278Raw materials, stocks held by third parties andothers
17,187 4,876 5,156 90 27,309 20,203 — — 47,512
Total segment assets 603,704 220,580 112,235 93,470 1,029,989 997,920 — 905 2,028,814
Borrowings 28,045 45,602 100,262 — 173,909 240,001 — 554,370 968,280
Lease liabilities 4.857 490 378 — 5,725 209,700 — 959 216,384
Total segment liabilities 32,902 46,092 100,640 — 179,634 449,701 — 555,329 1,184,664
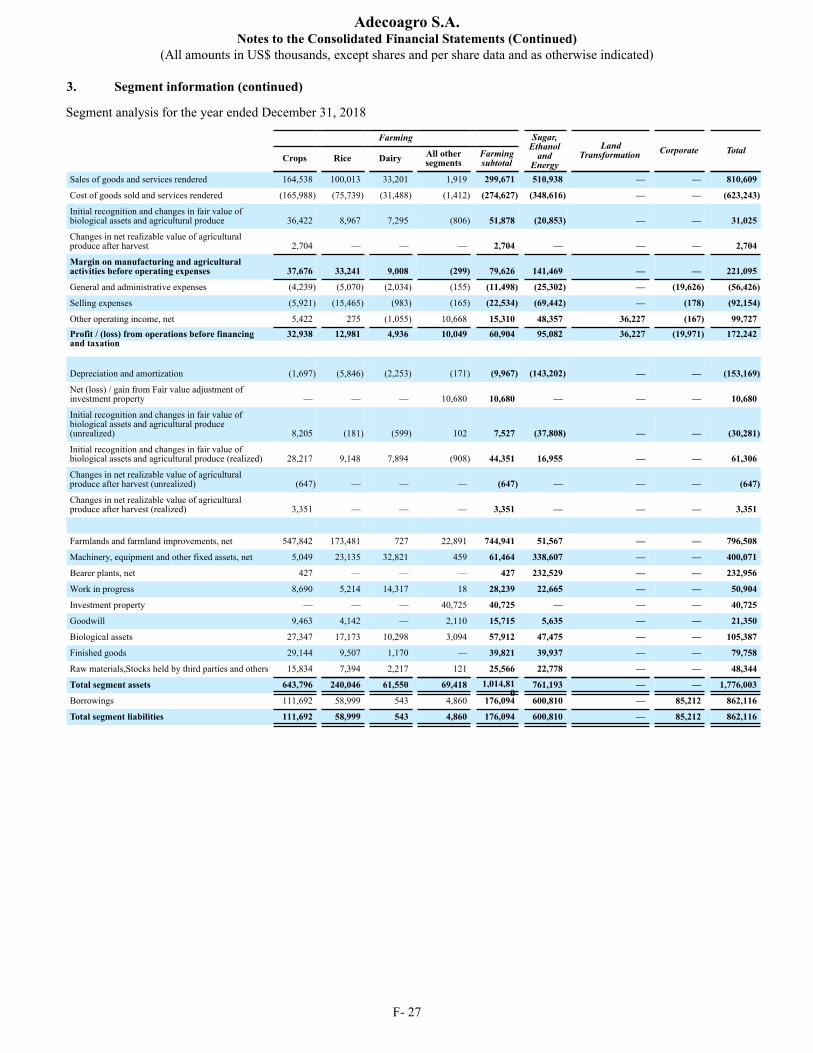
Adecoagro S.A.Notes to the Consolidated Financial Statements (Continued)
(All amounts in US$ thousands, except shares and per share data and as otherwise indicated)
3. Segment information (continued)
F- 27
Segment analysis for the year ended December 31, 2018
Farming Sugar,Ethanol
and Energy
Land Transformation Corporate Total
Crops Rice Dairy All othersegments
Farmingsubtotal
Sales of goods and services rendered 164,538 100,013 33,201 1,919 299,671 510,938 — — 810,609
Cost of goods sold and services rendered (165,988) (75,739) (31,488) (1,412) (274,627) (348,616) — — (623,243)
Initial recognition and changes in fair value ofbiological assets and agricultural produce 36,422 8,967 7,295 (806) 51,878 (20,853) — — 31,025
Changes in net realizable value of agriculturalproduce after harvest 2,704 — — — 2,704 — — — 2,704
Margin on manufacturing and agriculturalactivities before operating expenses 37,676 33,241 9,008 (299) 79,626 141,469 — — 221,095
General and administrative expenses (4,239) (5,070) (2,034) (155) (11,498) (25,302) — (19,626) (56,426)
Selling expenses (5,921) (15,465) (983) (165) (22,534) (69,442) — (178) (92,154)
Other operating income, net 5,422 275 (1,055) 10,668 15,310 48,357 36,227 (167) 99,727Profit / (loss) from operations before financingand taxation
32,938 12,981 4,936 10,049 60,904 95,082 36,227 (19,971) 172,242
Depreciation and amortization (1,697) (5,846) (2,253) (171) (9,967) (143,202) — — (153,169)
Net (loss) / gain from Fair value adjustment ofinvestment property — — — 10,680 10,680 — — — 10,680
Initial recognition and changes in fair value ofbiological assets and agricultural produce(unrealized) 8,205 (181) (599) 102 7,527 (37,808) — — (30,281)
Initial recognition and changes in fair value ofbiological assets and agricultural produce (realized) 28,217 9,148 7,894 (908) 44,351 16,955 — — 61,306
Changes in net realizable value of agriculturalproduce after harvest (unrealized) (647) — — — (647) — — — (647)
Changes in net realizable value of agriculturalproduce after harvest (realized) 3,351 — — — 3,351 — — — 3,351
Farmlands and farmland improvements, net 547,842 173,481 727 22,891 744,941 51,567 — — 796,508
Machinery, equipment and other fixed assets, net 5,049 23,135 32,821 459 61,464 338,607 — — 400,071
Bearer plants, net 427 — — — 427 232,529 — — 232,956
Work in progress 8,690 5,214 14,317 18 28,239 22,665 — — 50,904
Investment property — — — 40,725 40,725 — — — 40,725
Goodwill 9,463 4,142 — 2,110 15,715 5,635 — — 21,350
Biological assets 27,347 17,173 10,298 3,094 57,912 47,475 — — 105,387
Finished goods 29,144 9,507 1,170 — 39,821 39,937 — — 79,758
Raw materials,Stocks held by third parties and others 15,834 7,394 2,217 121 25,566 22,778 — — 48,344
Total segment assets 643,796 240,046 61,550 69,418 1,014,810
761,193 — — 1,776,003
Borrowings 111,692 58,999 543 4,860 176,094 600,810 — 85,212 862,116
Total segment liabilities 111,692 58,999 543 4,860 176,094 600,810 — 85,212 862,116
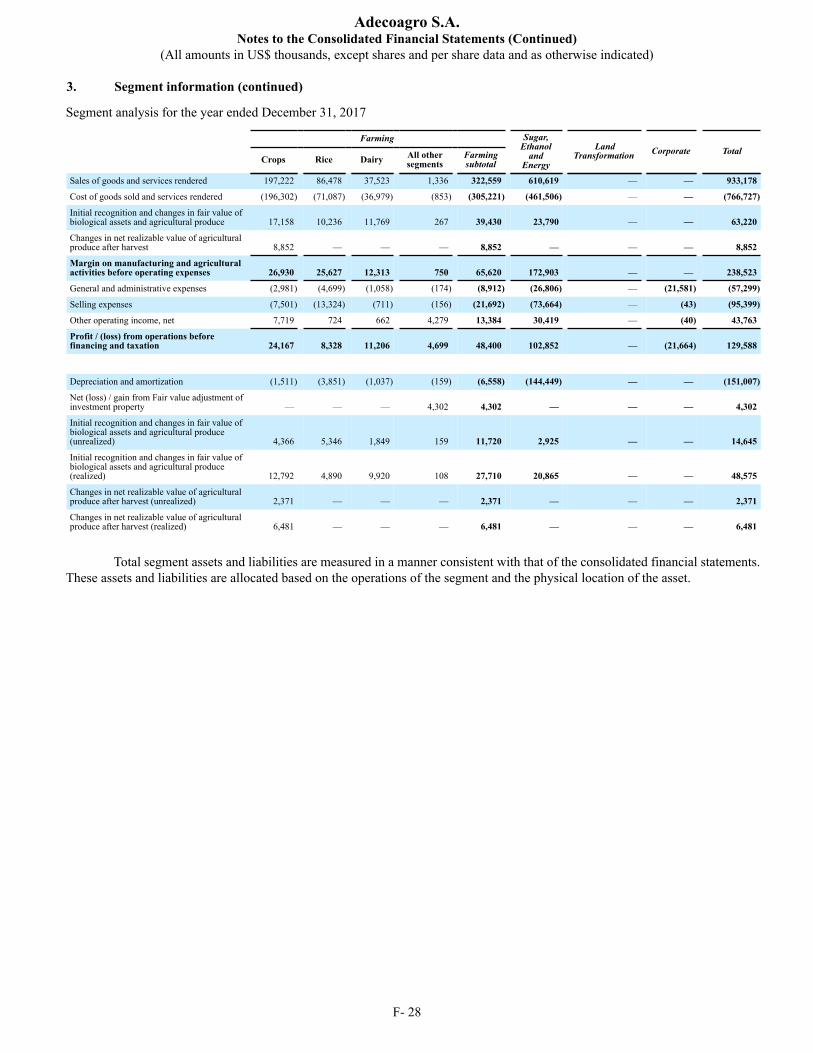
Adecoagro S.A.Notes to the Consolidated Financial Statements (Continued)
(All amounts in US$ thousands, except shares and per share data and as otherwise indicated)
3. Segment information (continued)
F- 28
Segment analysis for the year ended December 31, 2017
Farming Sugar,Ethanol
and Energy
Land Transformation Corporate Total
Crops Rice Dairy All othersegments
Farmingsubtotal
Sales of goods and services rendered 197,222 86,478 37,523 1,336 322,559 610,619 — — 933,178
Cost of goods sold and services rendered (196,302) (71,087) (36,979) (853) (305,221) (461,506) — — (766,727)
Initial recognition and changes in fair value ofbiological assets and agricultural produce 17,158 10,236 11,769 267 39,430 23,790 — — 63,220
Changes in net realizable value of agriculturalproduce after harvest 8,852 — — — 8,852 — — — 8,852
Margin on manufacturing and agriculturalactivities before operating expenses 26,930 25,627 12,313 750 65,620 172,903 — — 238,523
General and administrative expenses (2,981) (4,699) (1,058) (174) (8,912) (26,806) — (21,581) (57,299)
Selling expenses (7,501) (13,324) (711) (156) (21,692) (73,664) — (43) (95,399)
Other operating income, net 7,719 724 662 4,279 13,384 30,419 — (40) 43,763
Profit / (loss) from operations beforefinancing and taxation 24,167 8,328 11,206 4,699 48,400 102,852 — (21,664) 129,588
Depreciation and amortization (1,511) (3,851) (1,037) (159) (6,558) (144,449) — — (151,007)
Net (loss) / gain from Fair value adjustment ofinvestment property — — — 4,302 4,302 — — — 4,302
Initial recognition and changes in fair value ofbiological assets and agricultural produce(unrealized) 4,366 5,346 1,849 159 11,720 2,925 — — 14,645
Initial recognition and changes in fair value ofbiological assets and agricultural produce(realized) 12,792 4,890 9,920 108 27,710 20,865 — — 48,575
Changes in net realizable value of agriculturalproduce after harvest (unrealized) 2,371 — — — 2,371 — — — 2,371
Changes in net realizable value of agriculturalproduce after harvest (realized) 6,481 — — — 6,481 — — — 6,481
Total segment assets and liabilities are measured in a manner consistent with that of the consolidated financial statements. These assets and liabilities are allocated based on the operations of the segment and the physical location of the asset.
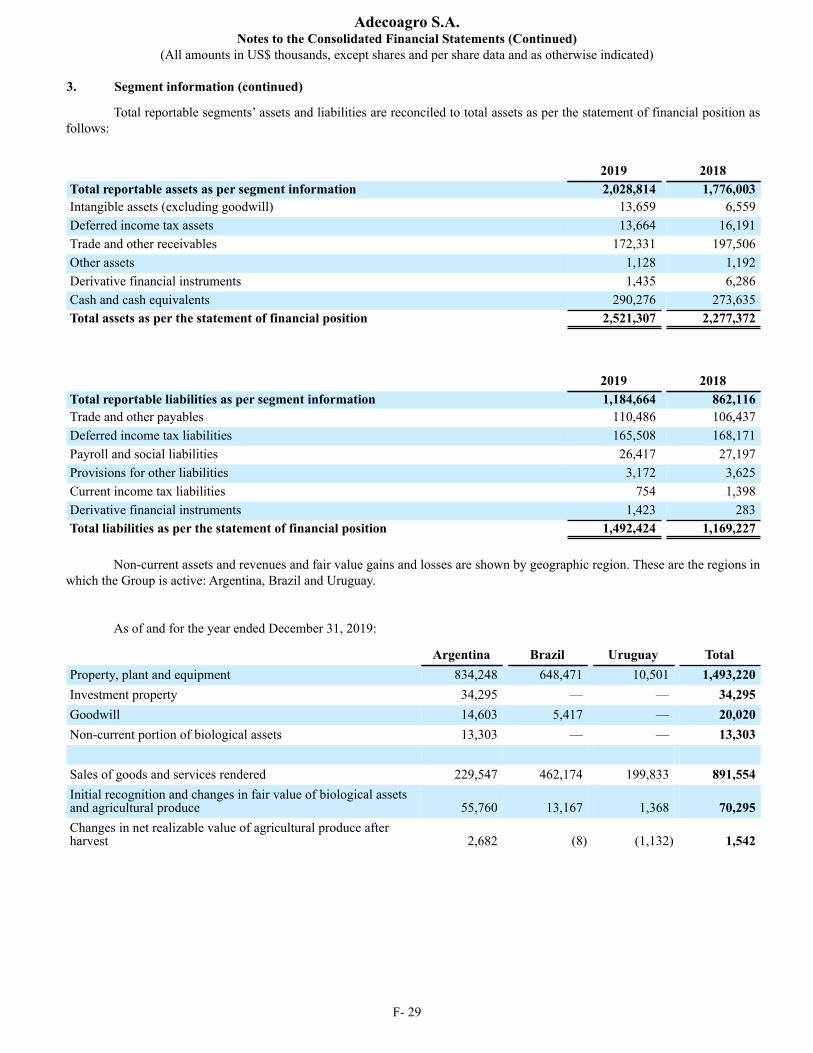
Adecoagro S.A.Notes to the Consolidated Financial Statements (Continued)
(All amounts in US$ thousands, except shares and per share data and as otherwise indicated)
3. Segment information (continued)
F- 29
Total reportable segments’ assets and liabilities are reconciled to total assets as per the statement of financial position as follows:
2019 2018Total reportable assets as per segment information 2,028,814 1,776,003Intangible assets (excluding goodwill) 13,659 6,559Deferred income tax assets 13,664 16,191Trade and other receivables 172,331 197,506Other assets 1,128 1,192Derivative financial instruments 1,435 6,286Cash and cash equivalents 290,276 273,635Total assets as per the statement of financial position 2,521,307 2,277,372
2019 2018Total reportable liabilities as per segment information 1,184,664 862,116Trade and other payables 110,486 106,437Deferred income tax liabilities 165,508 168,171Payroll and social liabilities 26,417 27,197Provisions for other liabilities 3,172 3,625Current income tax liabilities 754 1,398Derivative financial instruments 1,423 283Total liabilities as per the statement of financial position 1,492,424 1,169,227
Non-current assets and revenues and fair value gains and losses are shown by geographic region. These are the regions in which the Group is active: Argentina, Brazil and Uruguay.
As of and for the year ended December 31, 2019:
Argentina Brazil Uruguay TotalProperty, plant and equipment 834,248 648,471 10,501 1,493,220Investment property 34,295 — — 34,295Goodwill 14,603 5,417 — 20,020Non-current portion of biological assets 13,303 — — 13,303
Sales of goods and services rendered 229,547 462,174 199,833 891,554Initial recognition and changes in fair value of biological assetsand agricultural produce 55,760 13,167 1,368 70,295Changes in net realizable value of agricultural produce afterharvest 2,682 (8) (1,132) 1,542
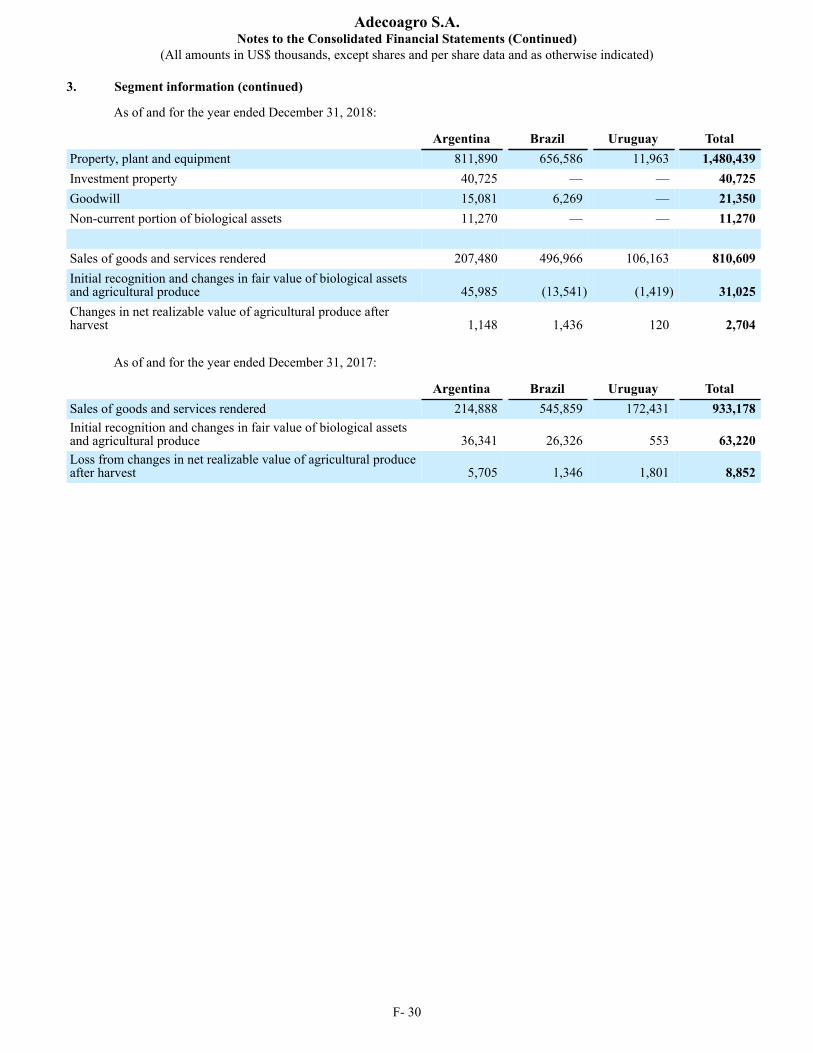
Adecoagro S.A.Notes to the Consolidated Financial Statements (Continued)
(All amounts in US$ thousands, except shares and per share data and as otherwise indicated)
3. Segment information (continued)
F- 30
As of and for the year ended December 31, 2018:
Argentina Brazil Uruguay TotalProperty, plant and equipment 811,890 656,586 11,963 1,480,439Investment property 40,725 — — 40,725Goodwill 15,081 6,269 — 21,350Non-current portion of biological assets 11,270 — — 11,270
Sales of goods and services rendered 207,480 496,966 106,163 810,609Initial recognition and changes in fair value of biological assetsand agricultural produce 45,985 (13,541) (1,419) 31,025Changes in net realizable value of agricultural produce afterharvest 1,148 1,436 120 2,704
As of and for the year ended December 31, 2017:
Argentina Brazil Uruguay TotalSales of goods and services rendered 214,888 545,859 172,431 933,178Initial recognition and changes in fair value of biological assetsand agricultural produce 36,341 26,326 553 63,220Loss from changes in net realizable value of agricultural produceafter harvest 5,705 1,346 1,801 8,852
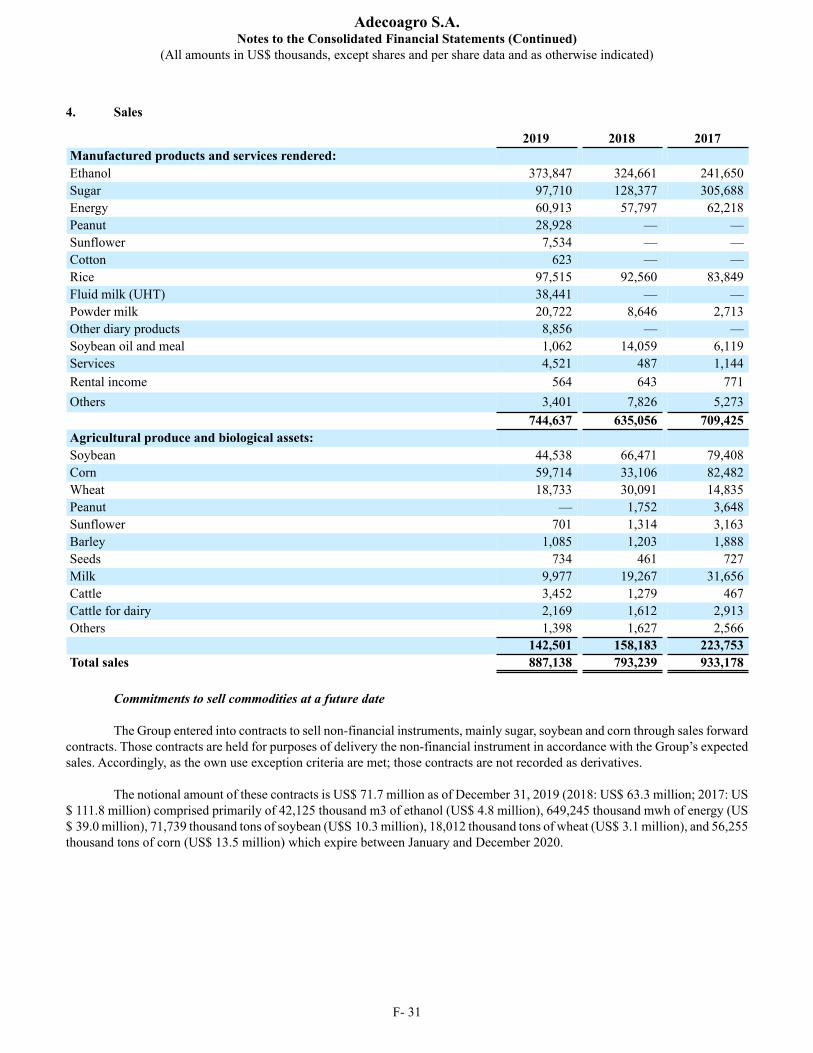
Adecoagro S.A.Notes to the Consolidated Financial Statements (Continued)
(All amounts in US$ thousands, except shares and per share data and as otherwise indicated)
F- 31
4. Sales
2019 2018 2017Manufactured products and services rendered: Ethanol 373,847 324,661 241,650Sugar 97,710 128,377 305,688Energy 60,913 57,797 62,218Peanut 28,928 — —Sunflower 7,534 — —Cotton 623 — —Rice 97,515 92,560 83,849Fluid milk (UHT) 38,441 — —Powder milk 20,722 8,646 2,713Other diary products 8,856 — —Soybean oil and meal 1,062 14,059 6,119Services 4,521 487 1,144Rental income 564 643 771Others 3,401 7,826 5,273 744,637 635,056 709,425Agricultural produce and biological assets: Soybean 44,538 66,471 79,408Corn 59,714 33,106 82,482Wheat 18,733 30,091 14,835Peanut — 1,752 3,648Sunflower 701 1,314 3,163Barley 1,085 1,203 1,888Seeds 734 461 727Milk 9,977 19,267 31,656Cattle 3,452 1,279 467Cattle for dairy 2,169 1,612 2,913Others 1,398 1,627 2,566
142,501 158,183 223,753Total sales 887,138 793,239 933,178
Commitments to sell commodities at a future date The Group entered into contracts to sell non-financial instruments, mainly sugar, soybean and corn through sales forward
contracts. Those contracts are held for purposes of delivery the non-financial instrument in accordance with the Group’s expected sales. Accordingly, as the own use exception criteria are met; those contracts are not recorded as derivatives.
The notional amount of these contracts is US$ 71.7 million as of December 31, 2019 (2018: US$ 63.3 million; 2017: US
$ 111.8 million) comprised primarily of 42,125 thousand m3 of ethanol (US$ 4.8 million), 649,245 thousand mwh of energy (US$ 39.0 million), 71,739 thousand tons of soybean (U$S 10.3 million), 18,012 thousand tons of wheat (US$ 3.1 million), and 56,255 thousand tons of corn (US$ 13.5 million) which expire between January and December 2020.
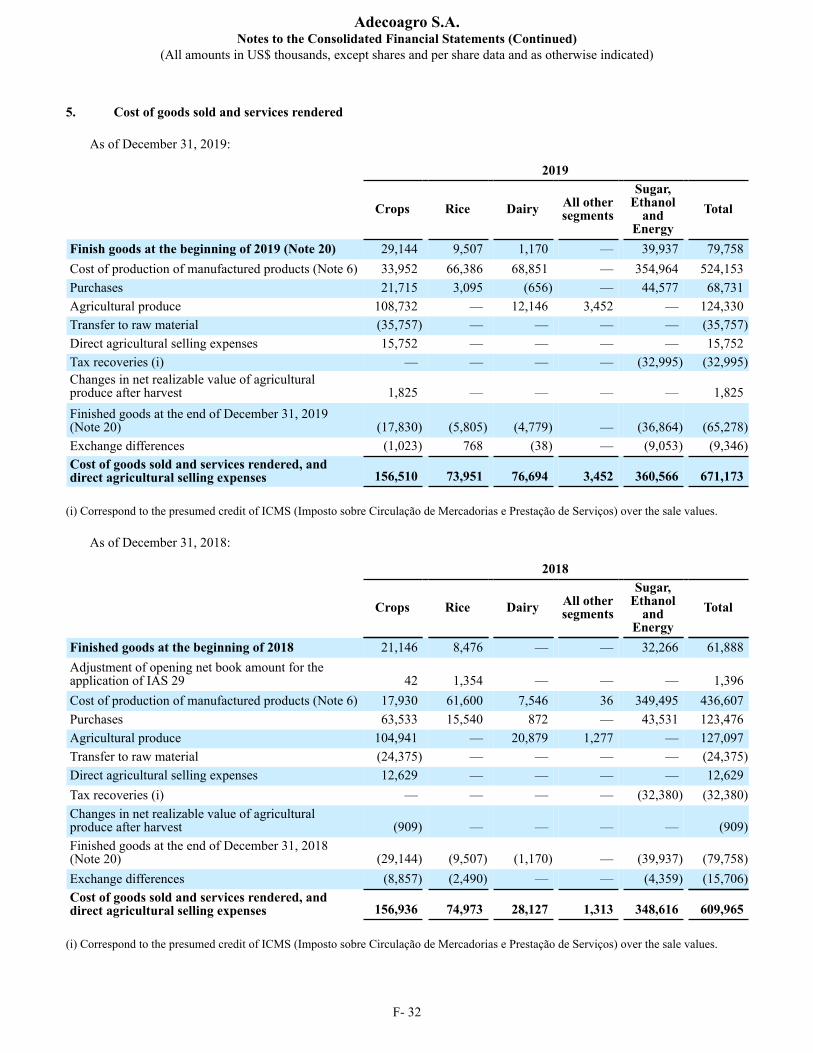
Adecoagro S.A.Notes to the Consolidated Financial Statements (Continued)
(All amounts in US$ thousands, except shares and per share data and as otherwise indicated)
F- 32
5. Cost of goods sold and services rendered
As of December 31, 2019:
2019
Crops Rice Dairy All other
segments
Sugar,Ethanol
andEnergy
Total
Finish goods at the beginning of 2019 (Note 20) 29,144 9,507 1,170 — 39,937 79,758Cost of production of manufactured products (Note 6) 33,952 66,386 68,851 — 354,964 524,153Purchases 21,715 3,095 (656) — 44,577 68,731Agricultural produce 108,732 — 12,146 3,452 — 124,330Transfer to raw material (35,757) — — — — (35,757)Direct agricultural selling expenses 15,752 — — — — 15,752Tax recoveries (i) — — — — (32,995) (32,995)Changes in net realizable value of agriculturalproduce after harvest 1,825 — — — — 1,825Finished goods at the end of December 31, 2019(Note 20) (17,830) (5,805) (4,779) — (36,864) (65,278)Exchange differences (1,023) 768 (38) — (9,053) (9,346)Cost of goods sold and services rendered, anddirect agricultural selling expenses 156,510 73,951 76,694 3,452 360,566 671,173
(i) Correspond to the presumed credit of ICMS (Imposto sobre Circulação de Mercadorias e Prestação de Serviços) over the sale values.
As of December 31, 2018:
2018
Crops Rice Dairy All other
segments
Sugar,Ethanol
andEnergy
Total
Finished goods at the beginning of 2018 21,146 8,476 — — 32,266 61,888Adjustment of opening net book amount for theapplication of IAS 29 42 1,354 — — — 1,396Cost of production of manufactured products (Note 6) 17,930 61,600 7,546 36 349,495 436,607Purchases 63,533 15,540 872 — 43,531 123,476Agricultural produce 104,941 — 20,879 1,277 — 127,097Transfer to raw material (24,375) — — — — (24,375)Direct agricultural selling expenses 12,629 — — — — 12,629Tax recoveries (i) — — — — (32,380) (32,380)Changes in net realizable value of agriculturalproduce after harvest (909) — — — — (909)Finished goods at the end of December 31, 2018(Note 20) (29,144) (9,507) (1,170) — (39,937) (79,758)Exchange differences (8,857) (2,490) — — (4,359) (15,706)Cost of goods sold and services rendered, anddirect agricultural selling expenses 156,936 74,973 28,127 1,313 348,616 609,965
(i) Correspond to the presumed credit of ICMS (Imposto sobre Circulação de Mercadorias e Prestação de Serviços) over the sale values.
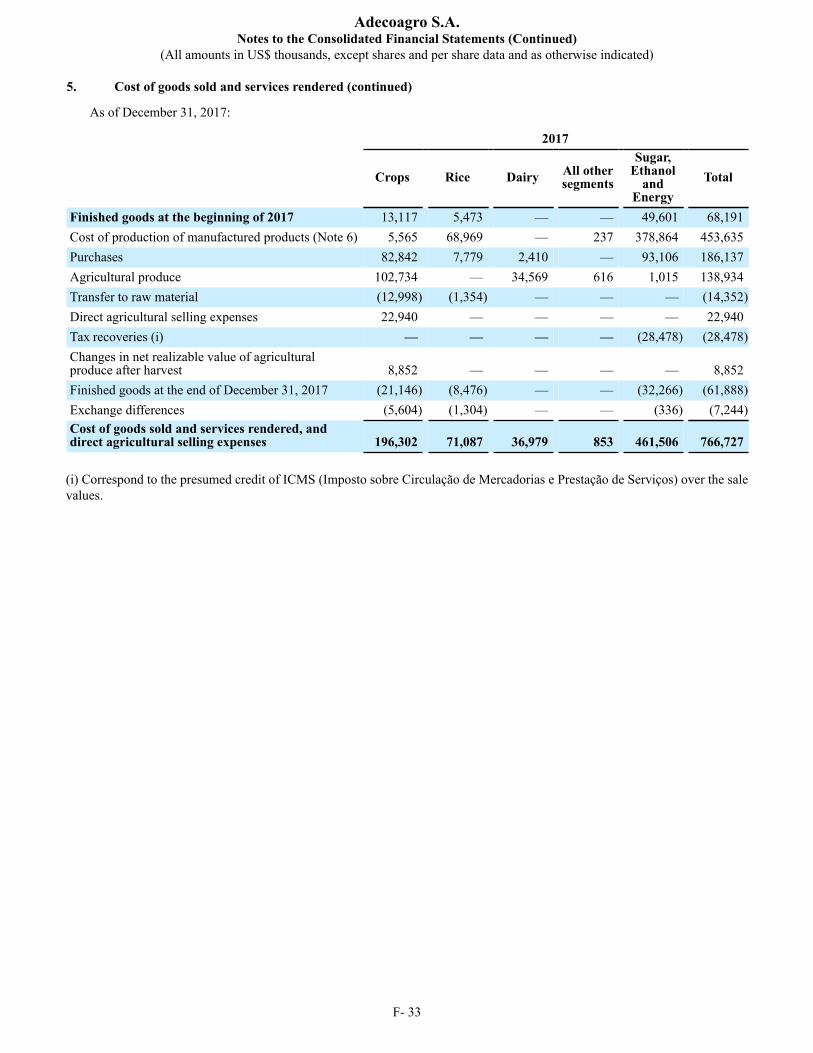
Adecoagro S.A.Notes to the Consolidated Financial Statements (Continued)
(All amounts in US$ thousands, except shares and per share data and as otherwise indicated)
5. Cost of goods sold and services rendered (continued)
F- 33
As of December 31, 2017:
2017
Crops Rice Dairy All other
segments
Sugar,Ethanol
andEnergy
Total
Finished goods at the beginning of 2017 13,117 5,473 — — 49,601 68,191Cost of production of manufactured products (Note 6) 5,565 68,969 — 237 378,864 453,635Purchases 82,842 7,779 2,410 — 93,106 186,137Agricultural produce 102,734 — 34,569 616 1,015 138,934Transfer to raw material (12,998) (1,354) — — — (14,352)Direct agricultural selling expenses 22,940 — — — — 22,940Tax recoveries (i) — — — — (28,478) (28,478)Changes in net realizable value of agriculturalproduce after harvest 8,852 — — — — 8,852Finished goods at the end of December 31, 2017 (21,146) (8,476) — — (32,266) (61,888)Exchange differences (5,604) (1,304) — — (336) (7,244)Cost of goods sold and services rendered, anddirect agricultural selling expenses 196,302 71,087 36,979 853 461,506 766,727
(i) Correspond to the presumed credit of ICMS (Imposto sobre Circulação de Mercadorias e Prestação de Serviços) over the sale values.
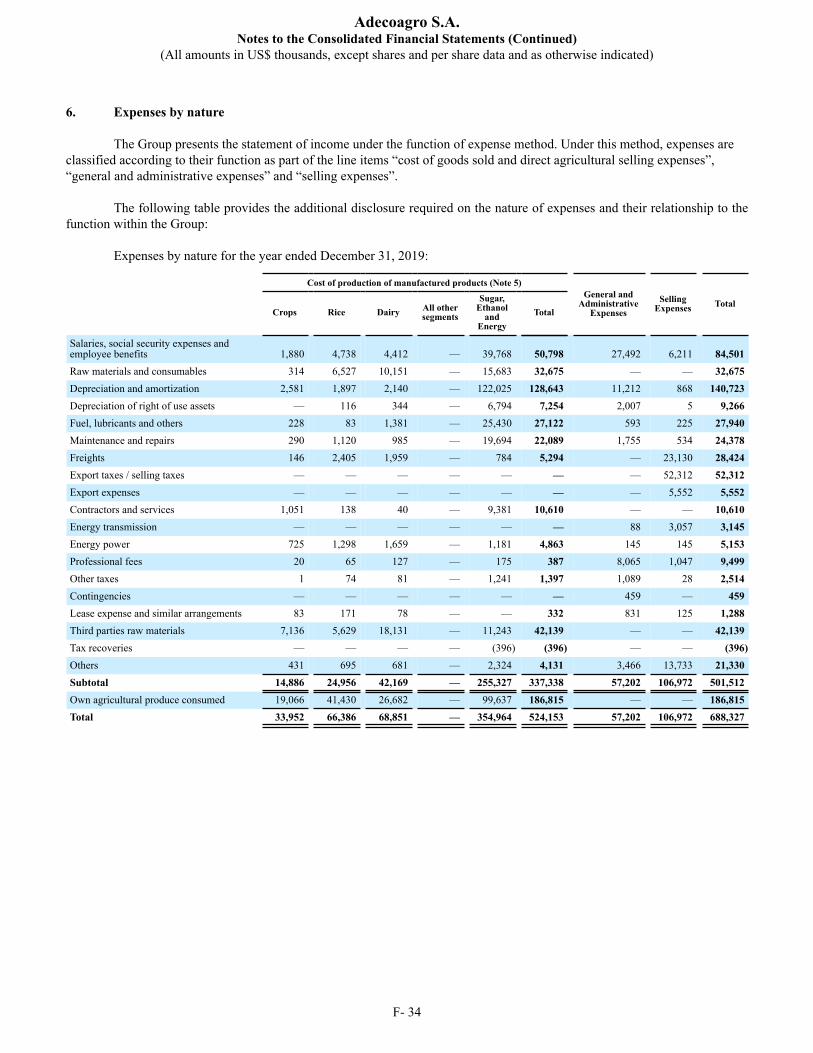
Adecoagro S.A.Notes to the Consolidated Financial Statements (Continued)
(All amounts in US$ thousands, except shares and per share data and as otherwise indicated)
F- 34
6. Expenses by nature
The Group presents the statement of income under the function of expense method. Under this method, expenses are classified according to their function as part of the line items “cost of goods sold and direct agricultural selling expenses”, “general and administrative expenses” and “selling expenses”.
The following table provides the additional disclosure required on the nature of expenses and their relationship to the
function within the Group: Expenses by nature for the year ended December 31, 2019:
Cost of production of manufactured products (Note 5)General and
AdministrativeExpenses
SellingExpenses Total
Crops Rice Dairy All other
segments
Sugar,Ethanol
andEnergy
Total
Salaries, social security expenses andemployee benefits 1,880 4,738 4,412 — 39,768 50,798 27,492 6,211 84,501Raw materials and consumables 314 6,527 10,151 — 15,683 32,675 — — 32,675Depreciation and amortization 2,581 1,897 2,140 — 122,025 128,643 11,212 868 140,723Depreciation of right of use assets — 116 344 — 6,794 7,254 2,007 5 9,266Fuel, lubricants and others 228 83 1,381 — 25,430 27,122 593 225 27,940Maintenance and repairs 290 1,120 985 — 19,694 22,089 1,755 534 24,378Freights 146 2,405 1,959 — 784 5,294 — 23,130 28,424Export taxes / selling taxes — — — — — — — 52,312 52,312Export expenses — — — — — — — 5,552 5,552Contractors and services 1,051 138 40 — 9,381 10,610 — — 10,610Energy transmission — — — — — — 88 3,057 3,145Energy power 725 1,298 1,659 — 1,181 4,863 145 145 5,153Professional fees 20 65 127 — 175 387 8,065 1,047 9,499Other taxes 1 74 81 — 1,241 1,397 1,089 28 2,514Contingencies — — — — — — 459 — 459Lease expense and similar arrangements 83 171 78 — — 332 831 125 1,288Third parties raw materials 7,136 5,629 18,131 — 11,243 42,139 — — 42,139Tax recoveries — — — — (396) (396) — — (396)Others 431 695 681 — 2,324 4,131 3,466 13,733 21,330Subtotal 14,886 24,956 42,169 — 255,327 337,338 57,202 106,972 501,512Own agricultural produce consumed 19,066 41,430 26,682 — 99,637 186,815 — — 186,815Total 33,952 66,386 68,851 — 354,964 524,153 57,202 106,972 688,327
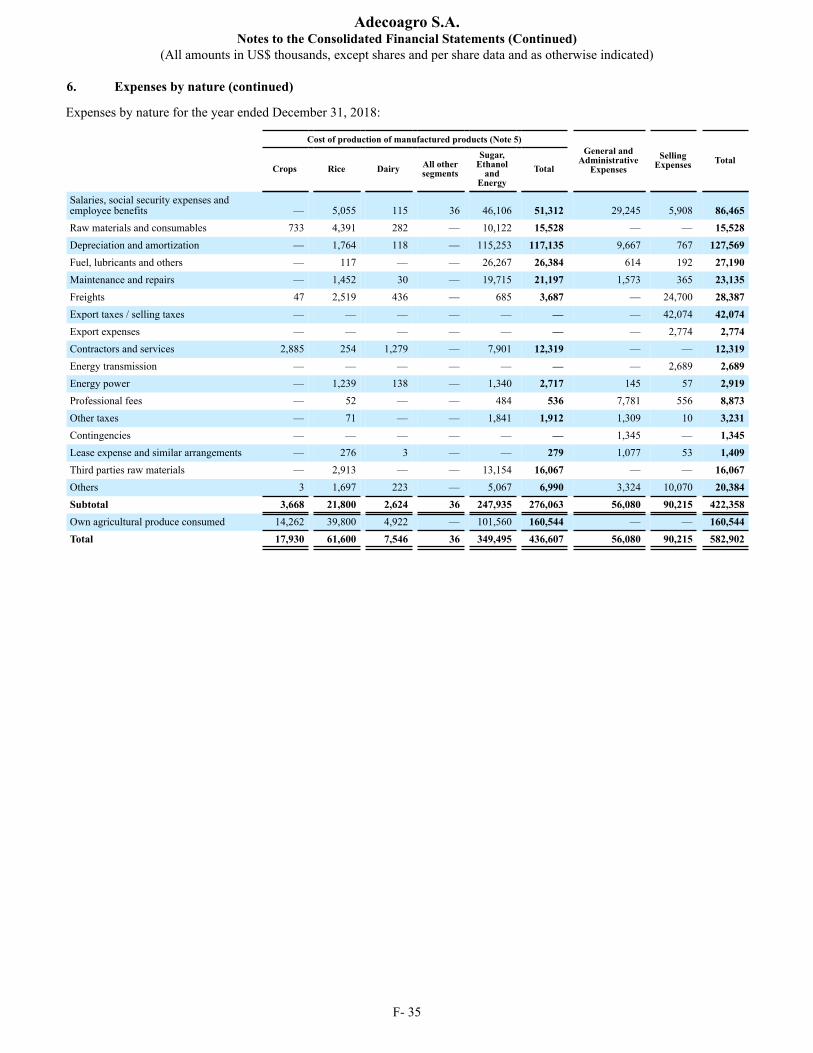
Adecoagro S.A.Notes to the Consolidated Financial Statements (Continued)
(All amounts in US$ thousands, except shares and per share data and as otherwise indicated)
6. Expenses by nature (continued)
F- 35
Expenses by nature for the year ended December 31, 2018:
Cost of production of manufactured products (Note 5)General and
AdministrativeExpenses
SellingExpenses Total
Crops Rice Dairy All other
segments
Sugar,Ethanol
andEnergy
Total
Salaries, social security expenses andemployee benefits — 5,055 115 36 46,106 51,312 29,245 5,908 86,465Raw materials and consumables 733 4,391 282 — 10,122 15,528 — — 15,528Depreciation and amortization — 1,764 118 — 115,253 117,135 9,667 767 127,569Fuel, lubricants and others — 117 — — 26,267 26,384 614 192 27,190Maintenance and repairs — 1,452 30 — 19,715 21,197 1,573 365 23,135Freights 47 2,519 436 — 685 3,687 — 24,700 28,387Export taxes / selling taxes — — — — — — — 42,074 42,074Export expenses — — — — — — — 2,774 2,774Contractors and services 2,885 254 1,279 — 7,901 12,319 — — 12,319Energy transmission — — — — — — — 2,689 2,689Energy power — 1,239 138 — 1,340 2,717 145 57 2,919Professional fees — 52 — — 484 536 7,781 556 8,873Other taxes — 71 — — 1,841 1,912 1,309 10 3,231Contingencies — — — — — — 1,345 — 1,345Lease expense and similar arrangements — 276 3 — — 279 1,077 53 1,409Third parties raw materials — 2,913 — — 13,154 16,067 — — 16,067Others 3 1,697 223 — 5,067 6,990 3,324 10,070 20,384Subtotal 3,668 21,800 2,624 36 247,935 276,063 56,080 90,215 422,358Own agricultural produce consumed 14,262 39,800 4,922 — 101,560 160,544 — — 160,544Total 17,930 61,600 7,546 36 349,495 436,607 56,080 90,215 582,902
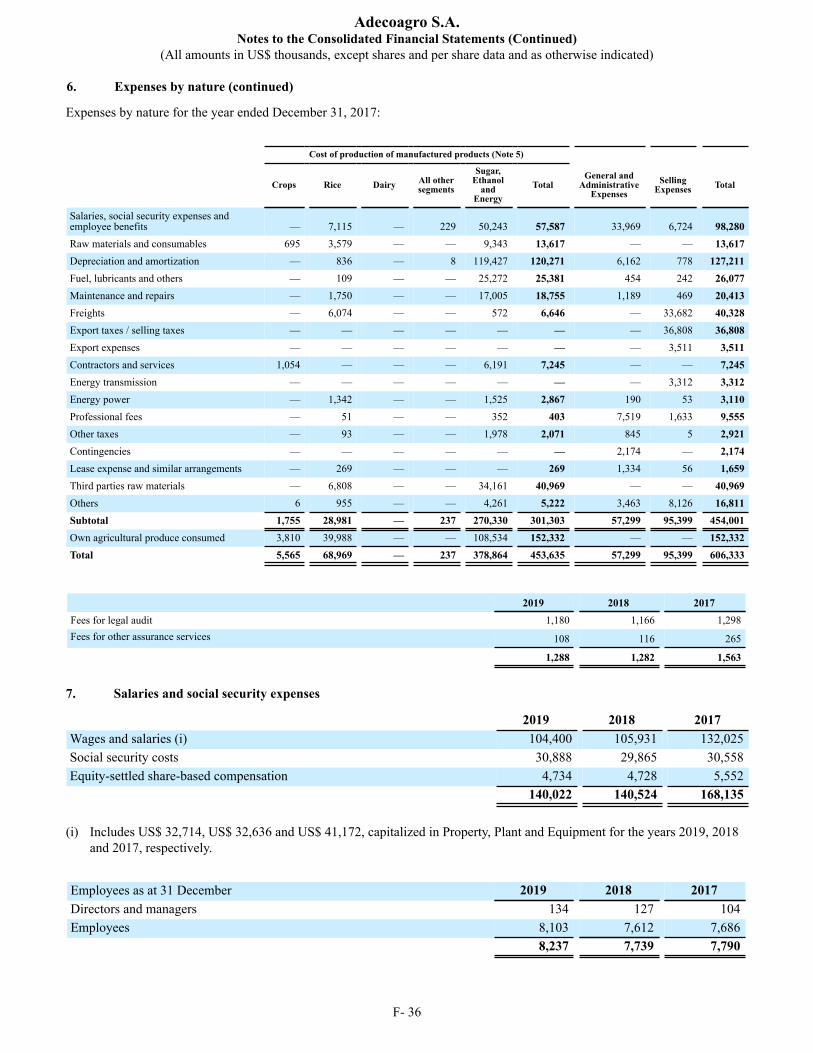
Adecoagro S.A.Notes to the Consolidated Financial Statements (Continued)
(All amounts in US$ thousands, except shares and per share data and as otherwise indicated)
6. Expenses by nature (continued)
F- 36
Expenses by nature for the year ended December 31, 2017:
Cost of production of manufactured products (Note 5)
Crops Rice Dairy All other
segments
Sugar,Ethanol
andEnergy
TotalGeneral and
AdministrativeExpenses
SellingExpenses Total
Salaries, social security expenses andemployee benefits — 7,115 — 229 50,243 57,587 33,969 6,724 98,280Raw materials and consumables 695 3,579 — — 9,343 13,617 — — 13,617Depreciation and amortization — 836 — 8 119,427 120,271 6,162 778 127,211Fuel, lubricants and others — 109 — — 25,272 25,381 454 242 26,077Maintenance and repairs — 1,750 — — 17,005 18,755 1,189 469 20,413Freights — 6,074 — — 572 6,646 — 33,682 40,328Export taxes / selling taxes — — — — — — — 36,808 36,808Export expenses — — — — — — — 3,511 3,511Contractors and services 1,054 — — — 6,191 7,245 — — 7,245Energy transmission — — — — — — — 3,312 3,312Energy power — 1,342 — — 1,525 2,867 190 53 3,110Professional fees — 51 — — 352 403 7,519 1,633 9,555Other taxes — 93 — — 1,978 2,071 845 5 2,921Contingencies — — — — — — 2,174 — 2,174Lease expense and similar arrangements — 269 — — — 269 1,334 56 1,659Third parties raw materials — 6,808 — — 34,161 40,969 — — 40,969Others 6 955 — — 4,261 5,222 3,463 8,126 16,811Subtotal 1,755 28,981 — 237 270,330 301,303 57,299 95,399 454,001Own agricultural produce consumed 3,810 39,988 — — 108,534 152,332 — — 152,332Total 5,565 68,969 — 237 378,864 453,635 57,299 95,399 606,333
2019 2018 2017Fees for legal audit 1,180 1,166 1,298Fees for other assurance services 108 116 265
1,288 1,282 1,563
7. Salaries and social security expenses
2019 2018 2017Wages and salaries (i) 104,400 105,931 132,025Social security costs 30,888 29,865 30,558Equity-settled share-based compensation 4,734 4,728 5,552 140,022 140,524 168,135
(i) Includes US$ 32,714, US$ 32,636 and US$ 41,172, capitalized in Property, Plant and Equipment for the years 2019, 2018 and 2017, respectively.
Employees as at 31 December 2019 2018 2017Directors and managers 134 127 104Employees 8,103 7,612 7,686
8,237 7,739 7,790
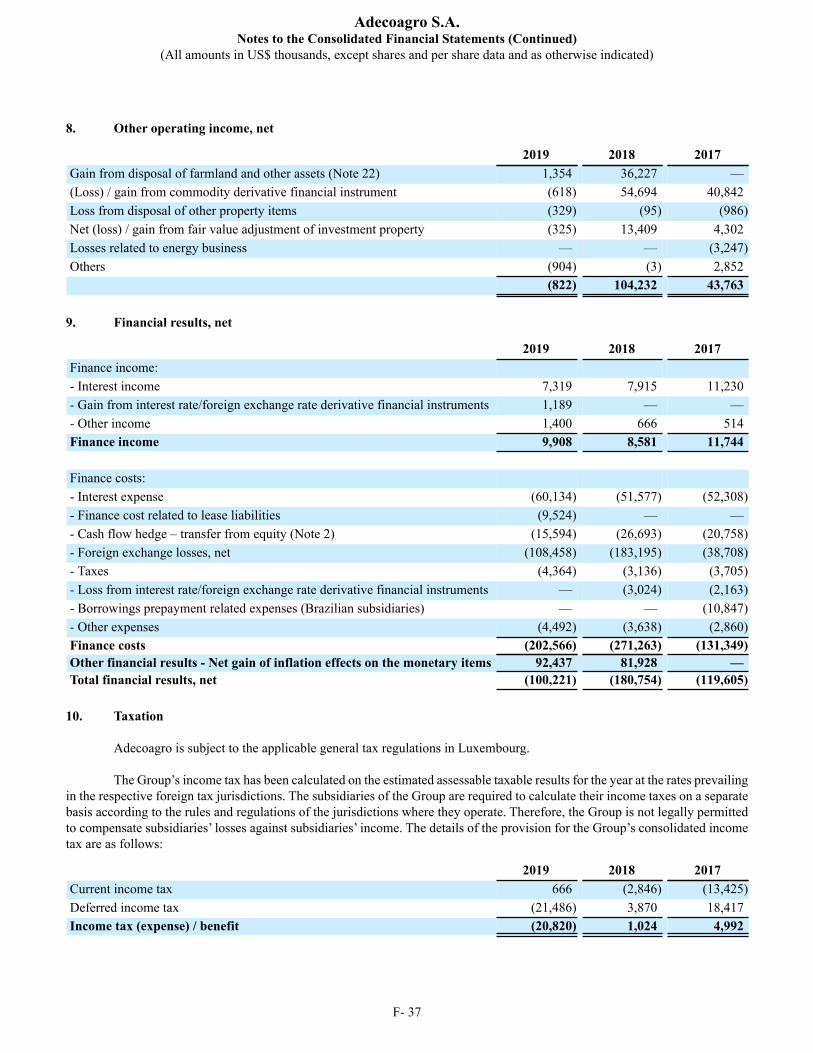
Adecoagro S.A.Notes to the Consolidated Financial Statements (Continued)
(All amounts in US$ thousands, except shares and per share data and as otherwise indicated)
F- 37
8. Other operating income, net
2019 2018 2017Gain from disposal of farmland and other assets (Note 22) 1,354 36,227 —(Loss) / gain from commodity derivative financial instrument (618) 54,694 40,842Loss from disposal of other property items (329) (95) (986)Net (loss) / gain from fair value adjustment of investment property (325) 13,409 4,302Losses related to energy business — — (3,247)Others (904) (3) 2,852 (822) 104,232 43,763
9. Financial results, net
2019 2018 2017Finance income: - Interest income 7,319 7,915 11,230- Gain from interest rate/foreign exchange rate derivative financial instruments 1,189 — —- Other income 1,400 666 514Finance income 9,908 8,581 11,744
Finance costs: - Interest expense (60,134) (51,577) (52,308)- Finance cost related to lease liabilities (9,524) — —- Cash flow hedge – transfer from equity (Note 2) (15,594) (26,693) (20,758)- Foreign exchange losses, net (108,458) (183,195) (38,708)- Taxes (4,364) (3,136) (3,705)- Loss from interest rate/foreign exchange rate derivative financial instruments — (3,024) (2,163)- Borrowings prepayment related expenses (Brazilian subsidiaries) — — (10,847)- Other expenses (4,492) (3,638) (2,860)Finance costs (202,566) (271,263) (131,349)Other financial results - Net gain of inflation effects on the monetary items 92,437 81,928 —Total financial results, net (100,221) (180,754) (119,605)
10. Taxation
Adecoagro is subject to the applicable general tax regulations in Luxembourg. The Group’s income tax has been calculated on the estimated assessable taxable results for the year at the rates prevailing
in the respective foreign tax jurisdictions. The subsidiaries of the Group are required to calculate their income taxes on a separate basis according to the rules and regulations of the jurisdictions where they operate. Therefore, the Group is not legally permitted to compensate subsidiaries’ losses against subsidiaries’ income. The details of the provision for the Group’s consolidated income tax are as follows:
2019 2018 2017Current income tax 666 (2,846) (13,425)Deferred income tax (21,486) 3,870 18,417Income tax (expense) / benefit (20,820) 1,024 4,992
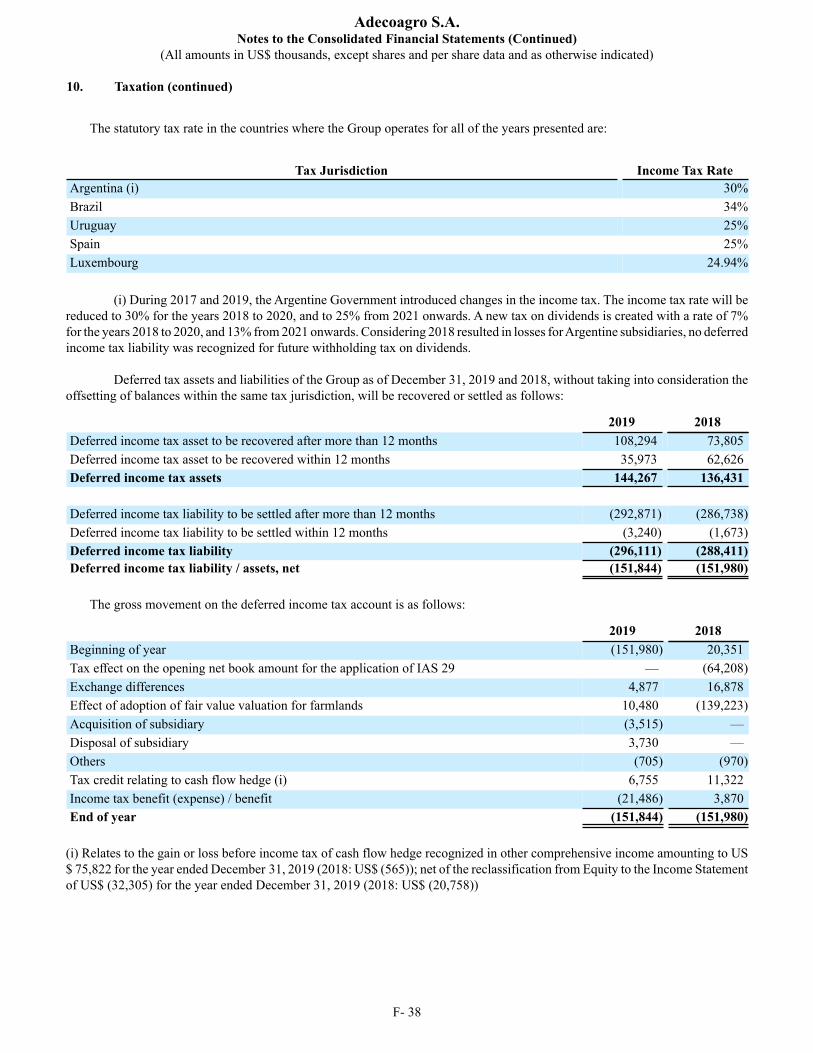
Adecoagro S.A.Notes to the Consolidated Financial Statements (Continued)
(All amounts in US$ thousands, except shares and per share data and as otherwise indicated)
10. Taxation (continued)
F- 38
The statutory tax rate in the countries where the Group operates for all of the years presented are:
Tax Jurisdiction Income Tax RateArgentina (i) 30%Brazil 34%Uruguay 25%Spain 25%Luxembourg 24.94%
(i) During 2017 and 2019, the Argentine Government introduced changes in the income tax. The income tax rate will be
reduced to 30% for the years 2018 to 2020, and to 25% from 2021 onwards. A new tax on dividends is created with a rate of 7%for the years 2018 to 2020, and 13% from 2021 onwards. Considering 2018 resulted in losses for Argentine subsidiaries, no deferred income tax liability was recognized for future withholding tax on dividends.
Deferred tax assets and liabilities of the Group as of December 31, 2019 and 2018, without taking into consideration the offsetting of balances within the same tax jurisdiction, will be recovered or settled as follows:
2019 2018Deferred income tax asset to be recovered after more than 12 months 108,294 73,805Deferred income tax asset to be recovered within 12 months 35,973 62,626Deferred income tax assets 144,267 136,431
Deferred income tax liability to be settled after more than 12 months (292,871) (286,738)Deferred income tax liability to be settled within 12 months (3,240) (1,673)Deferred income tax liability (296,111) (288,411)Deferred income tax liability / assets, net (151,844) (151,980)
The gross movement on the deferred income tax account is as follows:
2019 2018Beginning of year (151,980) 20,351Tax effect on the opening net book amount for the application of IAS 29 — (64,208)Exchange differences 4,877 16,878Effect of adoption of fair value valuation for farmlands 10,480 (139,223)Acquisition of subsidiary (3,515) —Disposal of subsidiary 3,730 —Others (705) (970)Tax credit relating to cash flow hedge (i) 6,755 11,322Income tax benefit (expense) / benefit (21,486) 3,870End of year (151,844) (151,980)
(i) Relates to the gain or loss before income tax of cash flow hedge recognized in other comprehensive income amounting to US$ 75,822 for the year ended December 31, 2019 (2018: US$ (565)); net of the reclassification from Equity to the Income Statement of US$ (32,305) for the year ended December 31, 2019 (2018: US$ (20,758))
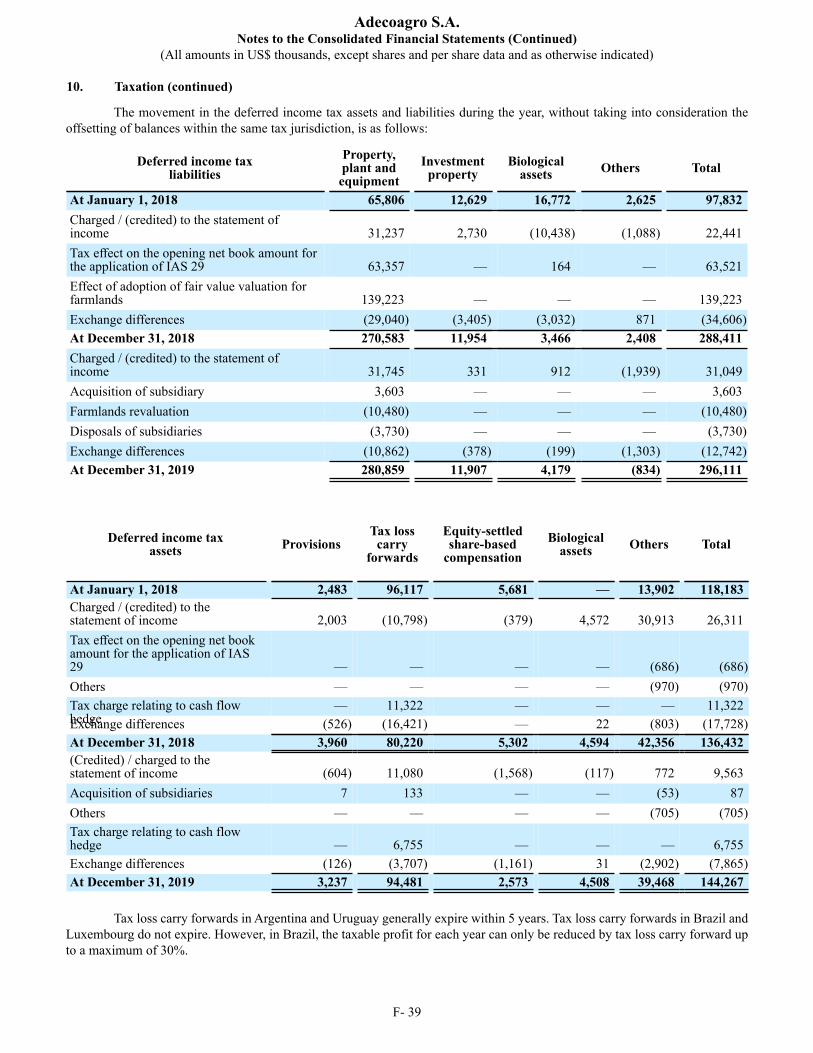
Adecoagro S.A.Notes to the Consolidated Financial Statements (Continued)
(All amounts in US$ thousands, except shares and per share data and as otherwise indicated)
10. Taxation (continued)
F- 39
The movement in the deferred income tax assets and liabilities during the year, without taking into consideration the offsetting of balances within the same tax jurisdiction, is as follows:
Deferred income taxliabilities
Property,plant andequipment
Investmentproperty
Biologicalassets Others Total
At January 1, 2018 65,806 12,629 16,772 2,625 97,832Charged / (credited) to the statement ofincome 31,237 2,730 (10,438) (1,088) 22,441Tax effect on the opening net book amount forthe application of IAS 29 63,357 — 164 — 63,521Effect of adoption of fair value valuation forfarmlands 139,223 — — — 139,223Exchange differences (29,040) (3,405) (3,032) 871 (34,606)At December 31, 2018 270,583 11,954 3,466 2,408 288,411Charged / (credited) to the statement ofincome 31,745 331 912 (1,939) 31,049Acquisition of subsidiary 3,603 — — — 3,603Farmlands revaluation (10,480) — — — (10,480)Disposals of subsidiaries (3,730) — — — (3,730)Exchange differences (10,862) (378) (199) (1,303) (12,742)At December 31, 2019 280,859 11,907 4,179 (834) 296,111
Deferred income taxassets Provisions
Tax losscarry
forwards
Equity-settledshare-based
compensationBiological
assets Others Total
At January 1, 2018 2,483 96,117 5,681 — 13,902 118,183Charged / (credited) to thestatement of income 2,003 (10,798) (379) 4,572 30,913 26,311Tax effect on the opening net bookamount for the application of IAS29 — — — — (686) (686)Others — — — — (970) (970)Tax charge relating to cash flowhedge
— 11,322 — — — 11,322Exchange differences (526) (16,421) — 22 (803) (17,728)At December 31, 2018 3,960 80,220 5,302 4,594 42,356 136,432(Credited) / charged to thestatement of income (604) 11,080 (1,568) (117) 772 9,563Acquisition of subsidiaries 7 133 — — (53) 87Others — — — — (705) (705)Tax charge relating to cash flowhedge — 6,755 — — — 6,755Exchange differences (126) (3,707) (1,161) 31 (2,902) (7,865)At December 31, 2019 3,237 94,481 2,573 4,508 39,468 144,267
Tax loss carry forwards in Argentina and Uruguay generally expire within 5 years. Tax loss carry forwards in Brazil and
Luxembourg do not expire. However, in Brazil, the taxable profit for each year can only be reduced by tax loss carry forward up to a maximum of 30%.
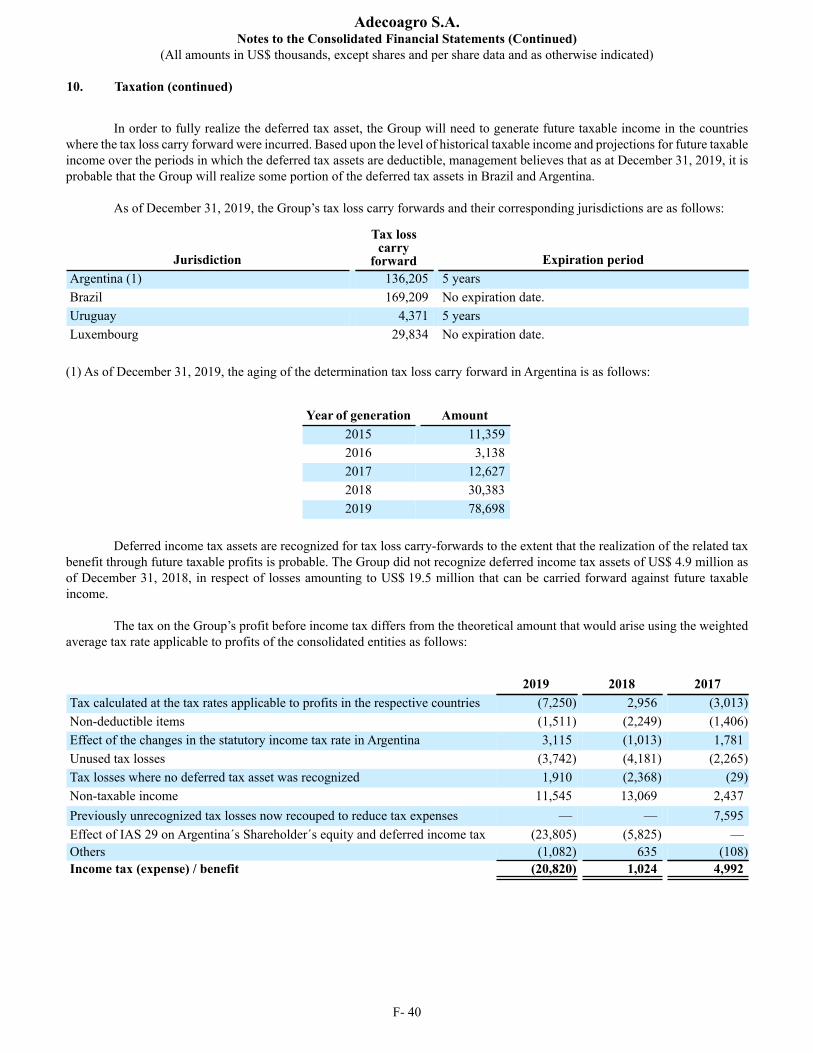
Adecoagro S.A.Notes to the Consolidated Financial Statements (Continued)
(All amounts in US$ thousands, except shares and per share data and as otherwise indicated)
10. Taxation (continued)
F- 40
In order to fully realize the deferred tax asset, the Group will need to generate future taxable income in the countries
where the tax loss carry forward were incurred. Based upon the level of historical taxable income and projections for future taxable income over the periods in which the deferred tax assets are deductible, management believes that as at December 31, 2019, it is probable that the Group will realize some portion of the deferred tax assets in Brazil and Argentina.
As of December 31, 2019, the Group’s tax loss carry forwards and their corresponding jurisdictions are as follows:
Jurisdiction
Tax losscarry
forward Expiration periodArgentina (1) 136,205 5 yearsBrazil 169,209 No expiration date.Uruguay 4,371 5 yearsLuxembourg 29,834 No expiration date.
(1) As of December 31, 2019, the aging of the determination tax loss carry forward in Argentina is as follows:
Year of generation Amount2015 11,3592016 3,1382017 12,6272018 30,3832019 78,698
Deferred income tax assets are recognized for tax loss carry-forwards to the extent that the realization of the related tax benefit through future taxable profits is probable. The Group did not recognize deferred income tax assets of US$ 4.9 million as of December 31, 2018, in respect of losses amounting to US$ 19.5 million that can be carried forward against future taxable income.
The tax on the Group’s profit before income tax differs from the theoretical amount that would arise using the weighted average tax rate applicable to profits of the consolidated entities as follows:
2019 2018 2017Tax calculated at the tax rates applicable to profits in the respective countries (7,250) 2,956 (3,013)Non-deductible items (1,511) (2,249) (1,406)Effect of the changes in the statutory income tax rate in Argentina 3,115 (1,013) 1,781Unused tax losses (3,742) (4,181) (2,265)Tax losses where no deferred tax asset was recognized 1,910 (2,368) (29)Non-taxable income 11,545 13,069 2,437Previously unrecognized tax losses now recouped to reduce tax expenses — — 7,595Effect of IAS 29 on Argentina´s Shareholder´s equity and deferred income tax (23,805) (5,825) —Others (1,082) 635 (108)Income tax (expense) / benefit (20,820) 1,024 4,992
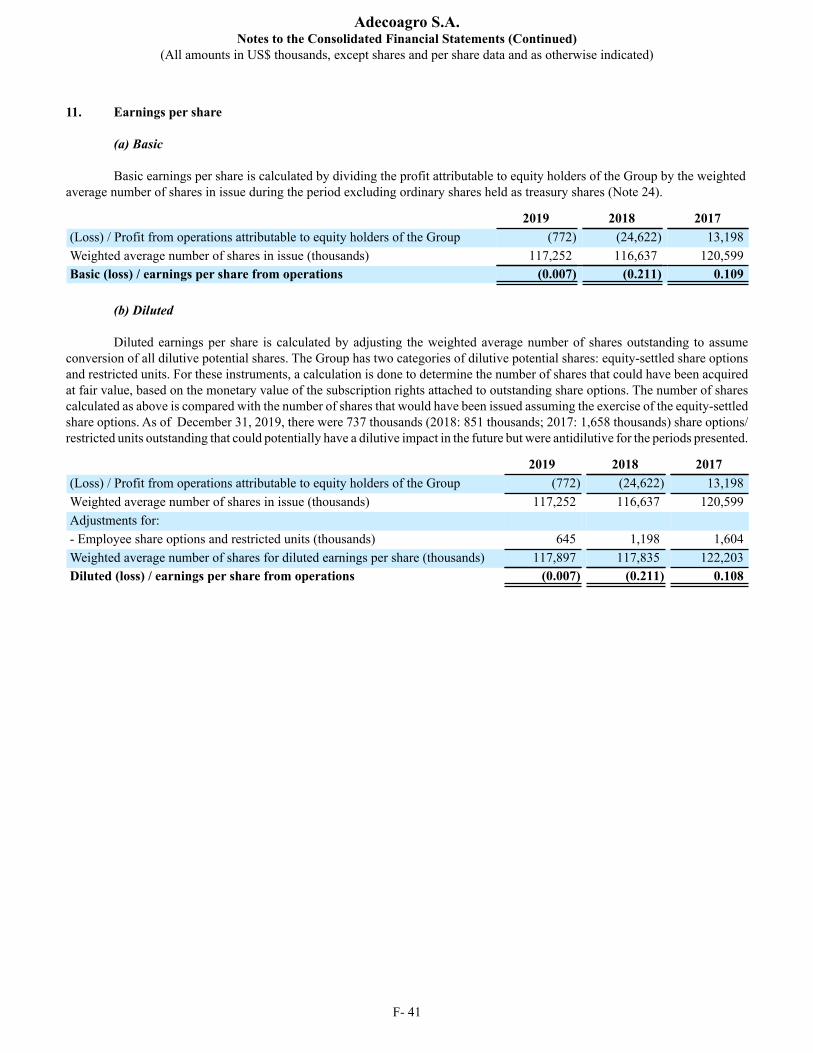
Adecoagro S.A.Notes to the Consolidated Financial Statements (Continued)
(All amounts in US$ thousands, except shares and per share data and as otherwise indicated)
F- 41
11. Earnings per share
(a) Basic
Basic earnings per share is calculated by dividing the profit attributable to equity holders of the Group by the weighted average number of shares in issue during the period excluding ordinary shares held as treasury shares (Note 24).
2019 2018 2017(Loss) / Profit from operations attributable to equity holders of the Group (772) (24,622) 13,198Weighted average number of shares in issue (thousands) 117,252 116,637 120,599Basic (loss) / earnings per share from operations (0.007) (0.211) 0.109
(b) Diluted Diluted earnings per share is calculated by adjusting the weighted average number of shares outstanding to assume
conversion of all dilutive potential shares. The Group has two categories of dilutive potential shares: equity-settled share options and restricted units. For these instruments, a calculation is done to determine the number of shares that could have been acquired at fair value, based on the monetary value of the subscription rights attached to outstanding share options. The number of shares calculated as above is compared with the number of shares that would have been issued assuming the exercise of the equity-settled share options. As of December 31, 2019, there were 737 thousands (2018: 851 thousands; 2017: 1,658 thousands) share options/restricted units outstanding that could potentially have a dilutive impact in the future but were antidilutive for the periods presented.
2019 2018 2017(Loss) / Profit from operations attributable to equity holders of the Group (772) (24,622) 13,198Weighted average number of shares in issue (thousands) 117,252 116,637 120,599Adjustments for:- Employee share options and restricted units (thousands) 645 1,198 1,604Weighted average number of shares for diluted earnings per share (thousands) 117,897 117,835 122,203Diluted (loss) / earnings per share from operations (0.007) (0.211) 0.108
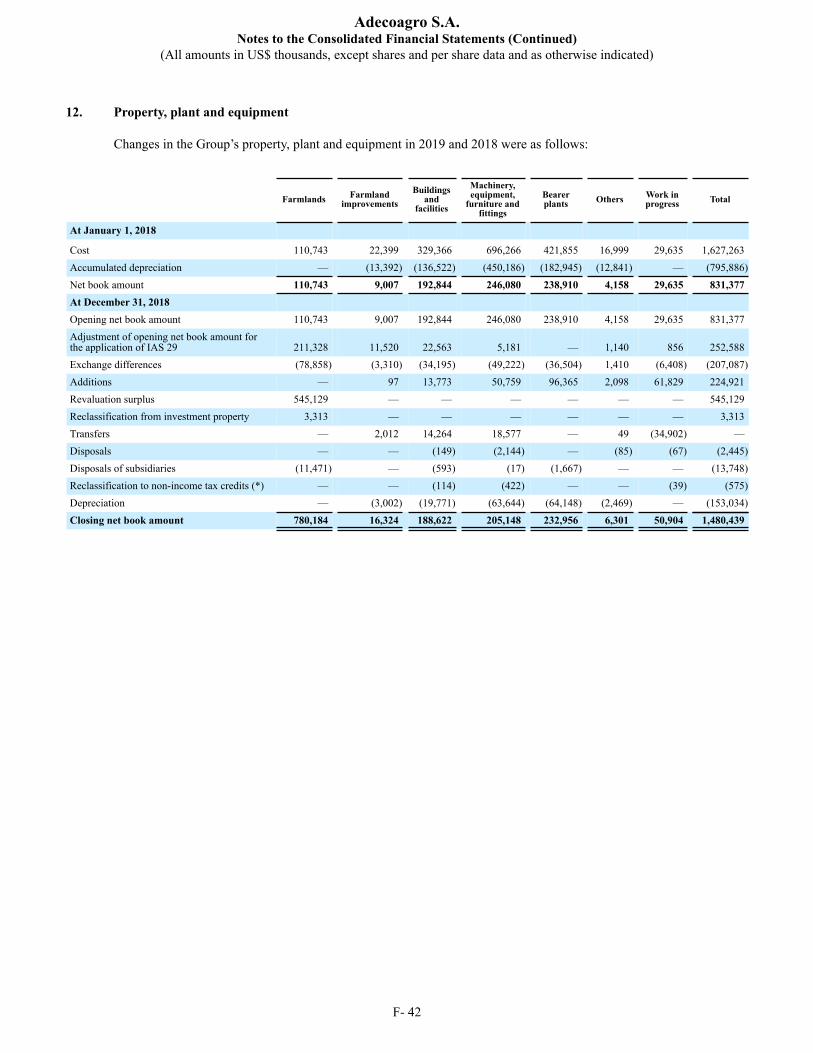
Adecoagro S.A.Notes to the Consolidated Financial Statements (Continued)
(All amounts in US$ thousands, except shares and per share data and as otherwise indicated)
F- 42
12. Property, plant and equipment
Changes in the Group’s property, plant and equipment in 2019 and 2018 were as follows:
Farmlands Farmland
improvementsBuildings
and facilities
Machinery, equipment,
furniture andfittings
Bearerplants Others Work in
progress Total
At January 1, 2018
Cost 110,743 22,399 329,366 696,266 421,855 16,999 29,635 1,627,263Accumulated depreciation — (13,392) (136,522) (450,186) (182,945) (12,841) — (795,886)Net book amount 110,743 9,007 192,844 246,080 238,910 4,158 29,635 831,377At December 31, 2018 Opening net book amount 110,743 9,007 192,844 246,080 238,910 4,158 29,635 831,377Adjustment of opening net book amount forthe application of IAS 29 211,328 11,520 22,563 5,181 — 1,140 856 252,588Exchange differences (78,858) (3,310) (34,195) (49,222) (36,504) 1,410 (6,408) (207,087)Additions — 97 13,773 50,759 96,365 2,098 61,829 224,921Revaluation surplus 545,129 — — — — — — 545,129Reclassification from investment property 3,313 — — — — — — 3,313Transfers — 2,012 14,264 18,577 — 49 (34,902) —Disposals — — (149) (2,144) — (85) (67) (2,445)Disposals of subsidiaries (11,471) — (593) (17) (1,667) — — (13,748)Reclassification to non-income tax credits (*) — — (114) (422) — — (39) (575)Depreciation — (3,002) (19,771) (63,644) (64,148) (2,469) — (153,034)Closing net book amount 780,184 16,324 188,622 205,148 232,956 6,301 50,904 1,480,439
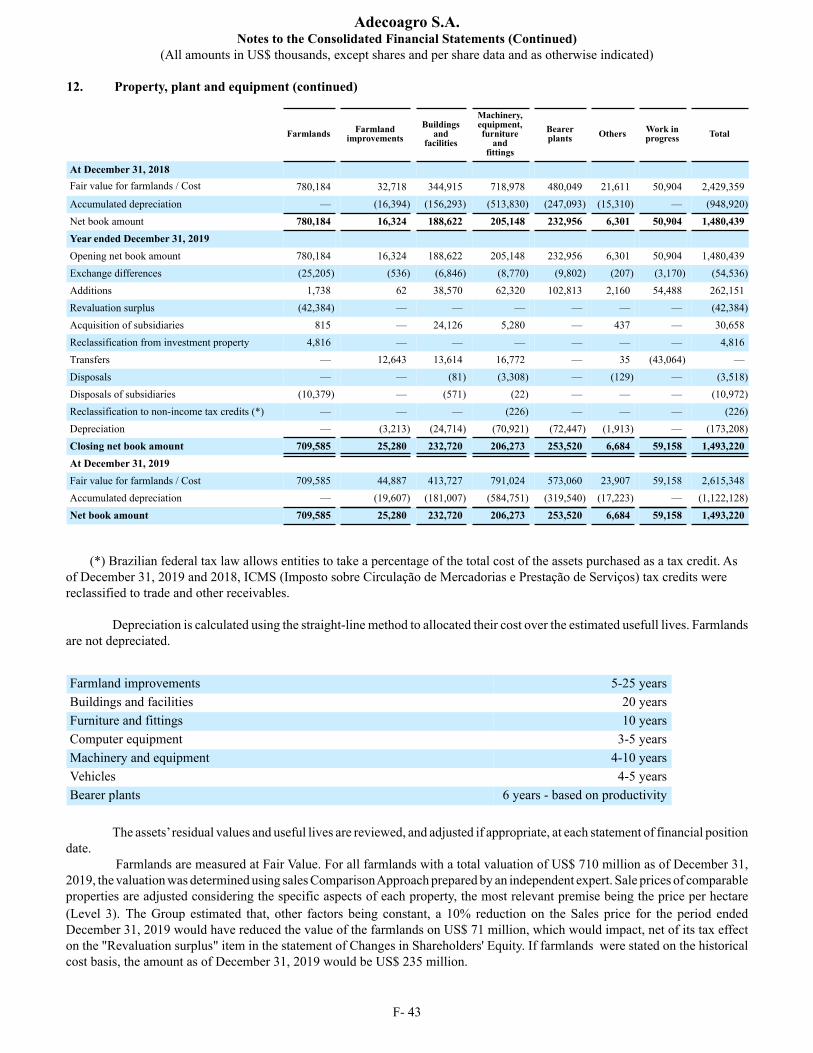
Adecoagro S.A.Notes to the Consolidated Financial Statements (Continued)
(All amounts in US$ thousands, except shares and per share data and as otherwise indicated)
12. Property, plant and equipment (continued)
F- 43
Farmlands Farmlandimprovements
Buildings and
facilities
Machinery,equipment,furniture
andfittings
Bearerplants Others Work in
progress Total
At December 31, 2018 Fair value for farmlands / Cost 780,184 32,718 344,915 718,978 480,049 21,611 50,904 2,429,359Accumulated depreciation — (16,394) (156,293) (513,830) (247,093) (15,310) — (948,920)Net book amount 780,184 16,324 188,622 205,148 232,956 6,301 50,904 1,480,439Year ended December 31, 2019 Opening net book amount 780,184 16,324 188,622 205,148 232,956 6,301 50,904 1,480,439Exchange differences (25,205) (536) (6,846) (8,770) (9,802) (207) (3,170) (54,536)Additions 1,738 62 38,570 62,320 102,813 2,160 54,488 262,151Revaluation surplus (42,384) — — — — — — (42,384)Acquisition of subsidiaries 815 — 24,126 5,280 — 437 — 30,658Reclassification from investment property 4,816 — — — — — — 4,816Transfers — 12,643 13,614 16,772 — 35 (43,064) —Disposals — — (81) (3,308) — (129) — (3,518)Disposals of subsidiaries (10,379) — (571) (22) — — — (10,972)Reclassification to non-income tax credits (*) — — — (226) — — — (226)Depreciation — (3,213) (24,714) (70,921) (72,447) (1,913) — (173,208)Closing net book amount 709,585 25,280 232,720 206,273 253,520 6,684 59,158 1,493,220At December 31, 2019 Fair value for farmlands / Cost 709,585 44,887 413,727 791,024 573,060 23,907 59,158 2,615,348Accumulated depreciation — (19,607) (181,007) (584,751) (319,540) (17,223) — (1,122,128)Net book amount 709,585 25,280 232,720 206,273 253,520 6,684 59,158 1,493,220
(*) Brazilian federal tax law allows entities to take a percentage of the total cost of the assets purchased as a tax credit. As of December 31, 2019 and 2018, ICMS (Imposto sobre Circulação de Mercadorias e Prestação de Serviços) tax credits were reclassified to trade and other receivables.
Depreciation is calculated using the straight-line method to allocated their cost over the estimated usefull lives. Farmlands are not depreciated.
Farmland improvements 5-25 yearsBuildings and facilities 20 yearsFurniture and fittings 10 yearsComputer equipment 3-5 yearsMachinery and equipment 4-10 yearsVehicles 4-5 yearsBearer plants 6 years - based on productivity
The assets’ residual values and useful lives are reviewed, and adjusted if appropriate, at each statement of financial position
date. Farmlands are measured at Fair Value. For all farmlands with a total valuation of US$ 710 million as of December 31,
2019, the valuation was determined using sales Comparison Approach prepared by an independent expert. Sale prices of comparable properties are adjusted considering the specific aspects of each property, the most relevant premise being the price per hectare (Level 3). The Group estimated that, other factors being constant, a 10% reduction on the Sales price for the period ended December 31, 2019 would have reduced the value of the farmlands on US$ 71 million, which would impact, net of its tax effect on the "Revaluation surplus" item in the statement of Changes in Shareholders' Equity. If farmlands were stated on the historical cost basis, the amount as of December 31, 2019 would be US$ 235 million.
Adecoagro S.A.Notes to the Consolidated Financial Statements (Continued)
(All amounts in US$ thousands, except shares and per share data and as otherwise indicated)
12. Property, plant and equipment (continued)
F- 44
Depreciation charges are included in “Cost of production of Biological Assets”, “Cost of production of manufactures products”, “General and administrative expenses”, “Selling expenses” and capitalized in “Property, plant and equipment” for the years ended December 31, 2019 and 2018.
During the year ended December 31, 2019, borrowing costs of US$ 13,904 (2018:US$ 3,660) were capitalized as
components of the cost of acquisition or construction for qualifying assets. Certain of the Group’s assets have been pledged as collateral to secure the Group’s borrowings and other payables. The
net book value of the pledged assets amounts to US$ 324,129 as of December 31, 2019 (2018: US$ 265,099).
13. Right of use assets
Changes in the Group’s right of use assets in 2019 were as follows:
Agriculturalpartnerships Others Total
At January 1, 2019Adoption of IFRS 16 194,763 10,174 204,937Exchange differences 1,582 (14,364) (12,782)Additions and re-measurement 60,770 30,296 91,066Depreciation (37,278) (7,890) (45,168)Closing net book amount 219,837 18,216 238,053
Since January 1,2019, the Company mandatorily adopted IFRS 16, (Note 35.1). Agricultural partnership has an average of 6 years duration.
As of December 31, 2019 included within Right of use assets balances are US$ 706 related to the net book value of assets under finance leases.
Depreciation charges are included in “Cost of production of Biological Assets”, “Cost of production of manufactures products”, “General and administrative expenses”, “Selling expenses” and capitalized in “Property, plant and equipment” for the year ended December 31, 2019.
14. Investment property Changes in the Group’s investment property in 2019 and 2018 were as follows:
2019 2018Beginning of the year 40,725 42,342Net (loss) / gain from fair value adjustment (Note 8) (325) 13,409Reclassification to property, plant and equipment (i) (4,816) (3,313)Exchange difference (1,289) (11,713)End of the year 34,295 40,725Fair value 34,295 40,725Net book amount 34,295 40,725
(i) Relates to new contracts with third parties.
Adecoagro S.A.Notes to the Consolidated Financial Statements (Continued)
(All amounts in US$ thousands, except shares and per share data and as otherwise indicated)
14. Investment property (continued)
F- 45
The accounting policy for all Investment properties are measured at Fair Value. For all Investment properties with a total valuation of US$ 34.2 million and US$ 40.7 million as of December 31, 2019 and 2018 respectively, the valuation was determined using Sales Comparison Approach prepared by an independent expert. Sale prices of comparable properties are adjusted considering the specific aspects of each property, the most relevant premise being the price per hectare (Level 3). The increase /decrease in the Fair value is recognized in the Statement of income under the line item "Other operating income, net". The Group estimated that, other factors being constant, a 10% reduction on the Sales price for the period ended December 31, 2019 and 2018 would have reduced the value of the Investment properties on US$ 3.4 million and US$ 4.1 million respectively, which would impact the line item "Net gain from fair value adjustment ".
15. Intangible assets
Changes in the Group’s intangible assets in 2019 and 2018 were as follows:
Goodwill Software Trademarks Others TotalAt January 1, 2018 Cost 12,412 7,251 2,461 234 22,358Accumulated amortization — (3,400) (1,556) (210) (5,166)Net book amount 12,412 3,851 905 24 17,192Year ended December 31, 2018 Opening net book amount 12,412 3,851 905 24 17,192Adjustment of opening net book amount forthe application of IAS 29 15,554 836 — — 16,390Exchange differences (6,616) (1,139) (19) (1) (7,775)Additions — 3,217 — 105 3,322Amortization charge (i) — (1,168) — (52) (1,220)Closing net book amount 21,350 5,597 886 76 27,909At December 31, 2018 Cost 21,350 10,165 2,442 338 34,295Accumulated amortization — (4,568) (1,556) (262) (6,386)Net book amount 21,350 5,597 886 76 27,909Year ended December 31, 2019 Opening net book amount 21,350 5,597 886 76 27,909Exchange differences (695) (329) (1) (16) (1,041)Additions — 2,080 6,431 106 8,617Acquisition of subsidiaries — 66 — — 66Disposal (635) (6) — — (641)Amortization charge (i) — (1,147) — (84) (1,231)Closing net book amount 20,020 6,261 7,316 82 33,679At December 31, 2019 Cost 20,020 11,976 8,872 428 41,296Accumulated amortization — (5,715) (1,556) (346) (7,617)Net book amount 20,020 6,261 7,316 82 33,679
(i) Amortization charges are included in “General and administrative expenses” and “Selling expenses” for the years ended
December 31, 2019 and 2018, respectively. There were no impairment charges for any of the years presented (see Note 32 (a)).
Adecoagro S.A.Notes to the Consolidated Financial Statements (Continued)
(All amounts in US$ thousands, except shares and per share data and as otherwise indicated)
F- 46
16. Biological assets
Changes in the Group’s biological assets in 2019 and 2018 were as follows:
2019
Crops
(ii)Rice(ii) Dairy All other
segmentsSugarcane
(ii) Total
Beginning of the year 27,347 17,173 10,298 3,094 47,475 105,387Increase due to purchases — — — 1,080 — 1,080Initial recognition and changes in fair valueof biological assets (i) 29,741 12,215 13,510 13 13,110 68,589Decrease due to harvest / disposals (108,732) (39,331) (38,828) (3,452) (103,551) (293,894)Costs incurred during the year 93,715 32,802 26,735 3,035 100,775 257,062Exchange differences (3,667) (1,375) (194) (97) (2,455) (7,788)End of the year 38,404 21,484 11,521 3,673 55,354 130,436
2018
Crops
(ii)Rice(ii) Dairy All other
segmentsSugarcane
(ii) Total
Beginning of the year 31,745 29,717 9,338 4,016 93,178 167,994Adjustment of opening net book amount forthe application of IAS 29 640 17 — — — 657Increase due to purchases — — — 906 — 906Initial recognition and changes in fair valueof biological assets (i) 28,663 4,125 5,455 (1,198) (20,850) 16,195Decrease due to harvest / disposals (104,941) (39,578) (25,800) (1,278) (105,536) (277,133)Costs incurred during the year 78,984 33,121 23,731 1,769 94,121 231,726Exchange differences (7,744) (10,229) (2,426) (1,121) (13,438) (34,958)End of the year 27,347 17,173 10,298 3,094 47,475 105,387
(i) Biological asset with a production cycle of more than one year (that is dairy and cattle) generated “Initial recognition and changes in fair value of biological assets” amounting to US$ 4,257 for the year ended December 31, 2019 (2018: US$ 12,036). In 2019, an amount of US$ 2,414 (2018: US$ 2,830) was attributable to price changes, and an amount of US$ 1,843 (2018: US$ 9,206) was attributable to physical changes.(ii) Biological assets that are measured at fair value within level 3 of the hierarchy.
Adecoagro S.A.Notes to the Consolidated Financial Statements (Continued)
(All amounts in US$ thousands, except shares and per share data and as otherwise indicated)
16. Biological assets (continued)
F- 47
Cost of production as of December 31, 2019:
Crops Rice Dairy All othersegments
Sugar,Ethanol and
EnergyTotal
Salaries, social security expenses andemployee benefits 2,600 5,192 3,776 582 10,657 22,807Depreciation and amortization 3 — — — 5,465 5,468Depreciation of right of use assets — — — — 31,190 31,190Fertilizers, agrochemicals and seeds 40,767 9,924 — 33 40,355 91,079Fuel, lubricants and others 886 678 889 77 3,031 5,561Maintenance and repairs 996 2,648 1,582 253 2,254 7,733Freights 1,446 318 89 151 — 2,004Contractors and services 27,782 10,745 3 96 5,161 43,787Feeding expenses 3 — 10,538 810 — 11,351Veterinary expenses — — 2,020 209 — 2,229Energy power 69 2,310 979 10 — 3,368Professional fees 196 74 138 4 214 626Other taxes 1,182 105 8 96 43 1,434Lease expense and similar arrangements 14,767 53 3 8 1,417 16,248Others 3,018 755 307 28 988 5,096Subtotal 93,715 32,802 20,332 2,357 100,775 249,981Own agricultural produce consumed — — 6,403 678 — 7,081Total 93,715 32,802 26,735 3,035 100,775 257,062
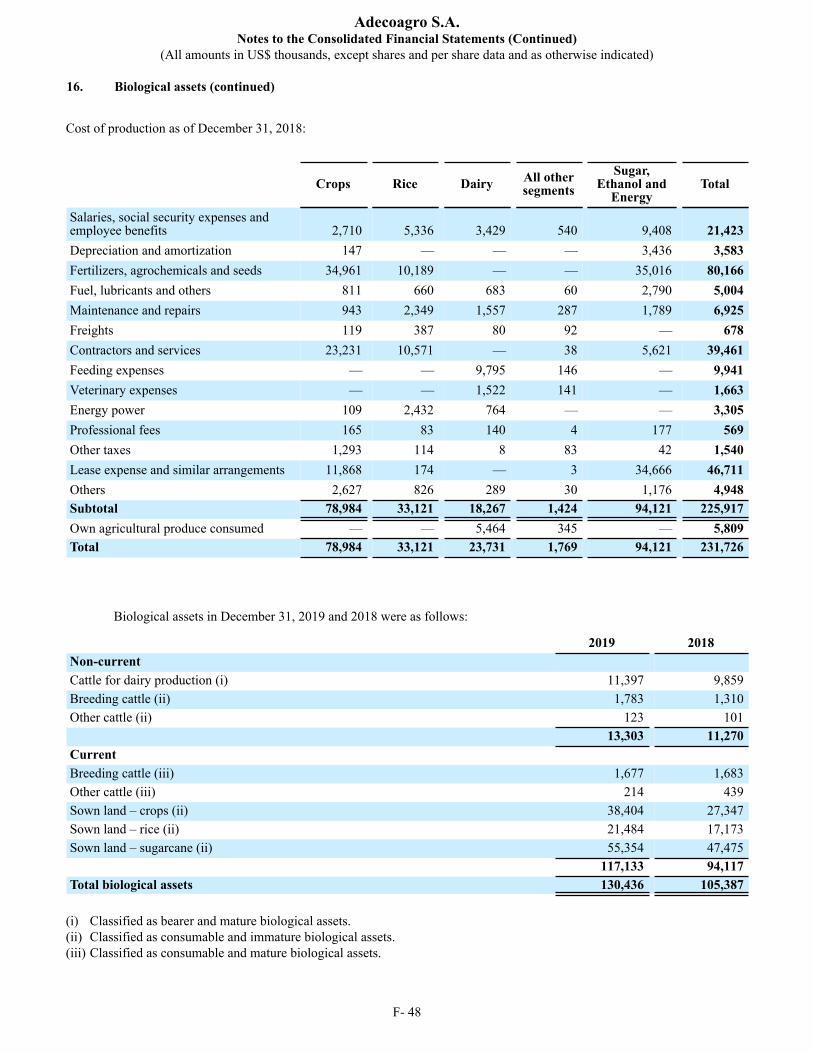
Adecoagro S.A.Notes to the Consolidated Financial Statements (Continued)
(All amounts in US$ thousands, except shares and per share data and as otherwise indicated)
16. Biological assets (continued)
F- 48
Cost of production as of December 31, 2018:
Crops Rice Dairy All othersegments
Sugar,Ethanol and
EnergyTotal
Salaries, social security expenses andemployee benefits 2,710 5,336 3,429 540 9,408 21,423Depreciation and amortization 147 — — — 3,436 3,583Fertilizers, agrochemicals and seeds 34,961 10,189 — — 35,016 80,166Fuel, lubricants and others 811 660 683 60 2,790 5,004Maintenance and repairs 943 2,349 1,557 287 1,789 6,925Freights 119 387 80 92 — 678Contractors and services 23,231 10,571 — 38 5,621 39,461Feeding expenses — — 9,795 146 — 9,941Veterinary expenses — — 1,522 141 — 1,663Energy power 109 2,432 764 — — 3,305Professional fees 165 83 140 4 177 569Other taxes 1,293 114 8 83 42 1,540Lease expense and similar arrangements 11,868 174 — 3 34,666 46,711Others 2,627 826 289 30 1,176 4,948Subtotal 78,984 33,121 18,267 1,424 94,121 225,917Own agricultural produce consumed — — 5,464 345 — 5,809Total 78,984 33,121 23,731 1,769 94,121 231,726
Biological assets in December 31, 2019 and 2018 were as follows:
2019 2018Non-current Cattle for dairy production (i) 11,397 9,859Breeding cattle (ii) 1,783 1,310Other cattle (ii) 123 101 13,303 11,270Current Breeding cattle (iii) 1,677 1,683Other cattle (iii) 214 439Sown land – crops (ii) 38,404 27,347Sown land – rice (ii) 21,484 17,173Sown land – sugarcane (ii) 55,354 47,475 117,133 94,117Total biological assets 130,436 105,387
(i) Classified as bearer and mature biological assets.(ii) Classified as consumable and immature biological assets.(iii) Classified as consumable and mature biological assets.
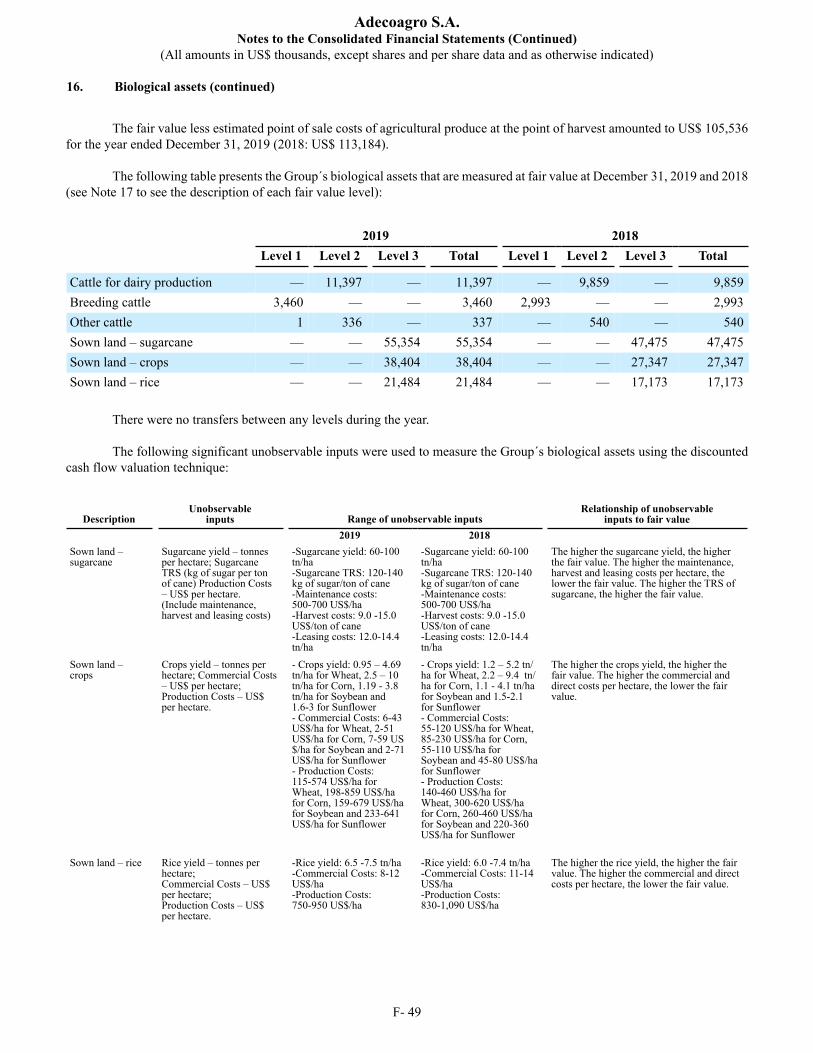
Adecoagro S.A.Notes to the Consolidated Financial Statements (Continued)
(All amounts in US$ thousands, except shares and per share data and as otherwise indicated)
16. Biological assets (continued)
F- 49
The fair value less estimated point of sale costs of agricultural produce at the point of harvest amounted to US$ 105,536 for the year ended December 31, 2019 (2018: US$ 113,184).
The following table presents the Group´s biological assets that are measured at fair value at December 31, 2019 and 2018
(see Note 17 to see the description of each fair value level):
2019 2018 Level 1 Level 2 Level 3 Total Level 1 Level 2 Level 3 Total
Cattle for dairy production — 11,397 — 11,397 — 9,859 — 9,859Breeding cattle 3,460 — — 3,460 2,993 — — 2,993Other cattle 1 336 — 337 — 540 — 540Sown land – sugarcane — — 55,354 55,354 — — 47,475 47,475Sown land – crops — — 38,404 38,404 — — 27,347 27,347Sown land – rice — — 21,484 21,484 — — 17,173 17,173
There were no transfers between any levels during the year. The following significant unobservable inputs were used to measure the Group´s biological assets using the discounted
cash flow valuation technique:
DescriptionUnobservable
inputs Range of unobservable inputsRelationship of unobservable
inputs to fair value 2019 2018
Sown land –sugarcane
Sugarcane yield – tonnesper hectare; SugarcaneTRS (kg of sugar per tonof cane) Production Costs– US$ per hectare.(Include maintenance,harvest and leasing costs)
-Sugarcane yield: 60-100tn/ha-Sugarcane TRS: 120-140kg of sugar/ton of cane-Maintenance costs:500-700 US$/ha-Harvest costs: 9.0 -15.0US$/ton of cane-Leasing costs: 12.0-14.4tn/ha
-Sugarcane yield: 60-100tn/ha-Sugarcane TRS: 120-140kg of sugar/ton of cane-Maintenance costs:500-700 US$/ha-Harvest costs: 9.0 -15.0US$/ton of cane-Leasing costs: 12.0-14.4tn/ha
The higher the sugarcane yield, the higherthe fair value. The higher the maintenance,harvest and leasing costs per hectare, thelower the fair value. The higher the TRS ofsugarcane, the higher the fair value.
Sown land –crops
Crops yield – tonnes perhectare; Commercial Costs– US$ per hectare;Production Costs – US$per hectare.
- Crops yield: 0.95 – 4.69tn/ha for Wheat, 2.5 – 10 tn/ha for Corn, 1.19 - 3.8tn/ha for Soybean and1.6-3 for Sunflower- Commercial Costs: 6-43US$/ha for Wheat, 2-51US$/ha for Corn, 7-59 US$/ha for Soybean and 2-71US$/ha for Sunflower- Production Costs:115-574 US$/ha forWheat, 198-859 US$/hafor Corn, 159-679 US$/hafor Soybean and 233-641US$/ha for Sunflower
- Crops yield: 1.2 – 5.2 tn/ha for Wheat, 2.2 – 9.4 tn/ha for Corn, 1.1 - 4.1 tn/hafor Soybean and 1.5-2.1for Sunflower- Commercial Costs:55-120 US$/ha for Wheat,85-230 US$/ha for Corn,55-110 US$/ha forSoybean and 45-80 US$/hafor Sunflower- Production Costs:140-460 US$/ha forWheat, 300-620 US$/hafor Corn, 260-460 US$/hafor Soybean and 220-360US$/ha for Sunflower
The higher the crops yield, the higher thefair value. The higher the commercial anddirect costs per hectare, the lower the fairvalue.
Sown land – rice Rice yield – tonnes perhectare;Commercial Costs – US$per hectare;Production Costs – US$per hectare.
-Rice yield: 6.5 -7.5 tn/ha-Commercial Costs: 8-12US$/ha-Production Costs:750-950 US$/ha
-Rice yield: 6.0 -7.4 tn/ha-Commercial Costs: 11-14US$/ha-Production Costs:830-1,090 US$/ha
The higher the rice yield, the higher the fairvalue. The higher the commercial and directcosts per hectare, the lower the fair value.
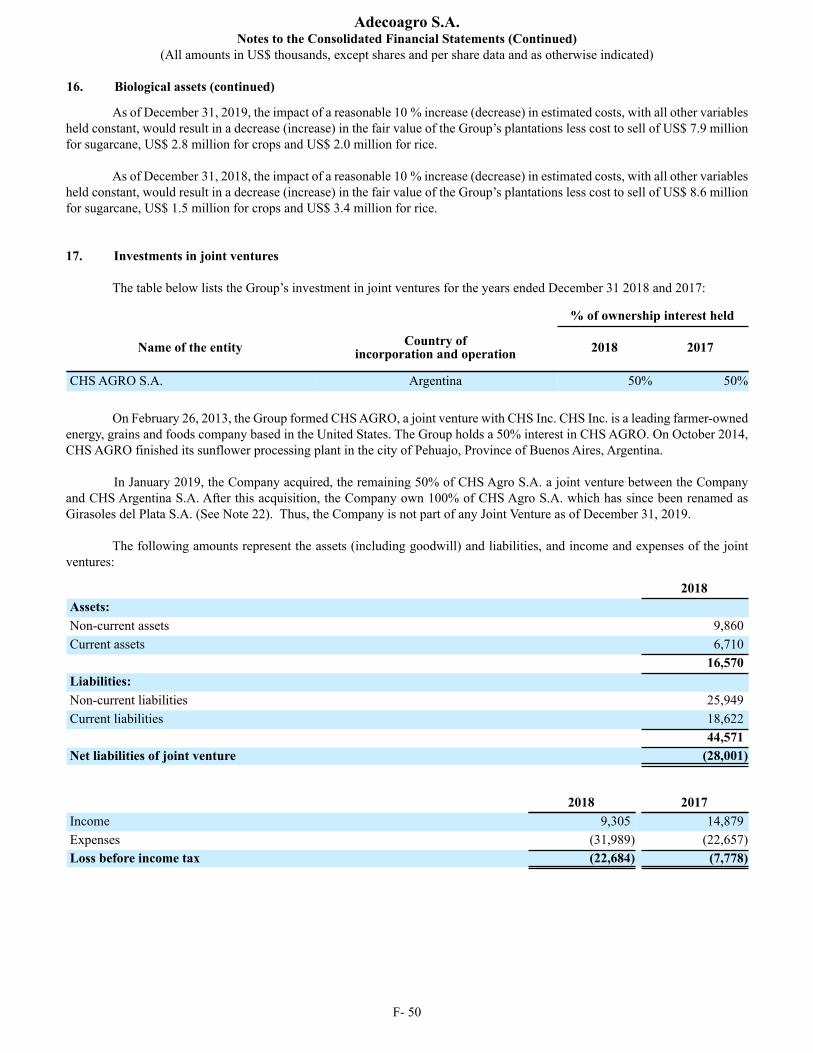
Adecoagro S.A.Notes to the Consolidated Financial Statements (Continued)
(All amounts in US$ thousands, except shares and per share data and as otherwise indicated)
16. Biological assets (continued)
F- 50
As of December 31, 2019, the impact of a reasonable 10 % increase (decrease) in estimated costs, with all other variables held constant, would result in a decrease (increase) in the fair value of the Group’s plantations less cost to sell of US$ 7.9 millionfor sugarcane, US$ 2.8 million for crops and US$ 2.0 million for rice.
As of December 31, 2018, the impact of a reasonable 10 % increase (decrease) in estimated costs, with all other variables held constant, would result in a decrease (increase) in the fair value of the Group’s plantations less cost to sell of US$ 8.6 millionfor sugarcane, US$ 1.5 million for crops and US$ 3.4 million for rice.
17. Investments in joint ventures
The table below lists the Group’s investment in joint ventures for the years ended December 31 2018 and 2017:
% of ownership interest held
Name of the entity Country ofincorporation and operation 2018 2017
CHS AGRO S.A. Argentina 50% 50%
On February 26, 2013, the Group formed CHS AGRO, a joint venture with CHS Inc. CHS Inc. is a leading farmer-owned energy, grains and foods company based in the United States. The Group holds a 50% interest in CHS AGRO. On October 2014, CHS AGRO finished its sunflower processing plant in the city of Pehuajo, Province of Buenos Aires, Argentina.
In January 2019, the Company acquired, the remaining 50% of CHS Agro S.A. a joint venture between the Company and CHS Argentina S.A. After this acquisition, the Company own 100% of CHS Agro S.A. which has since been renamed as Girasoles del Plata S.A. (See Note 22). Thus, the Company is not part of any Joint Venture as of December 31, 2019.
The following amounts represent the assets (including goodwill) and liabilities, and income and expenses of the joint ventures:
2018Assets: Non-current assets 9,860Current assets 6,710 16,570Liabilities: Non-current liabilities 25,949Current liabilities 18,622 44,571Net liabilities of joint venture (28,001)
2018 2017Income 9,305 14,879Expenses (31,989) (22,657)Loss before income tax (22,684) (7,778)
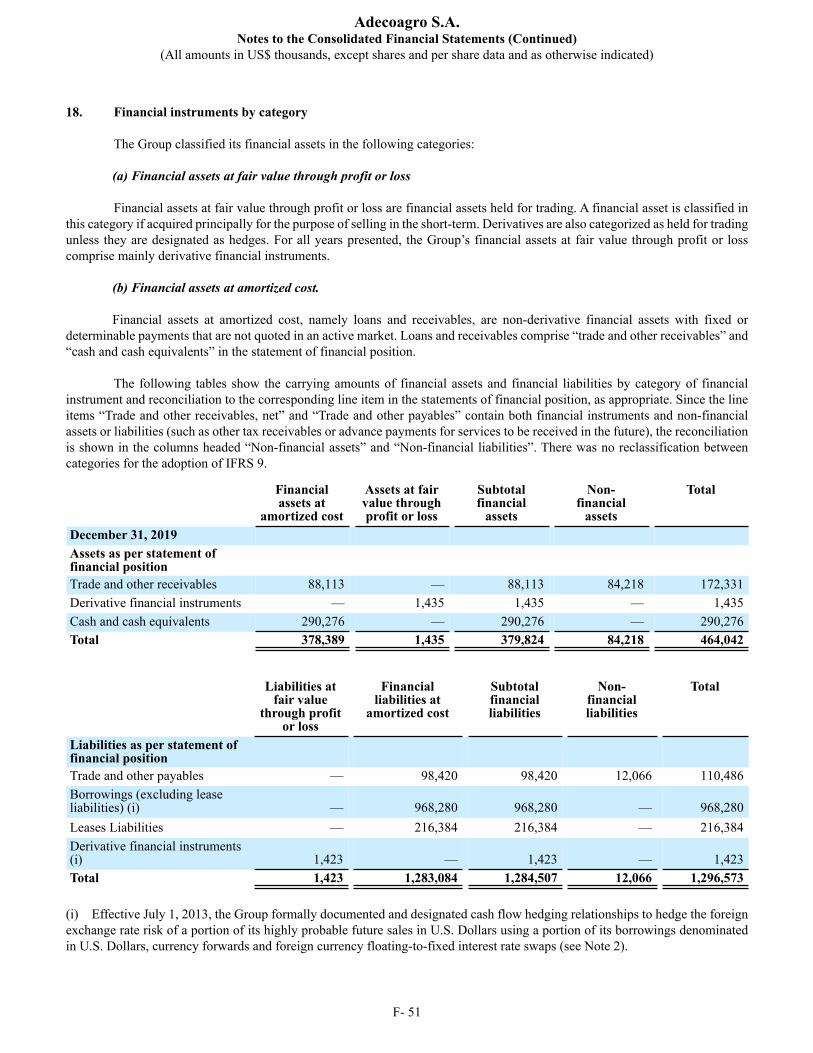
Adecoagro S.A.Notes to the Consolidated Financial Statements (Continued)
(All amounts in US$ thousands, except shares and per share data and as otherwise indicated)
F- 51
18. Financial instruments by category
The Group classified its financial assets in the following categories: (a) Financial assets at fair value through profit or loss
Financial assets at fair value through profit or loss are financial assets held for trading. A financial asset is classified in
this category if acquired principally for the purpose of selling in the short-term. Derivatives are also categorized as held for trading unless they are designated as hedges. For all years presented, the Group’s financial assets at fair value through profit or loss comprise mainly derivative financial instruments.
(b) Financial assets at amortized cost. Financial assets at amortized cost, namely loans and receivables, are non-derivative financial assets with fixed or
determinable payments that are not quoted in an active market. Loans and receivables comprise “trade and other receivables” and “cash and cash equivalents” in the statement of financial position.
The following tables show the carrying amounts of financial assets and financial liabilities by category of financial
instrument and reconciliation to the corresponding line item in the statements of financial position, as appropriate. Since the line items “Trade and other receivables, net” and “Trade and other payables” contain both financial instruments and non-financial assets or liabilities (such as other tax receivables or advance payments for services to be received in the future), the reconciliation is shown in the columns headed “Non-financial assets” and “Non-financial liabilities”. There was no reclassification between categories for the adoption of IFRS 9.
Financialassets at
amortized cost
Assets at fairvalue throughprofit or loss
Subtotalfinancial
assets
Non-financial
assets
Total
December 31, 2019 Assets as per statement offinancial position Trade and other receivables 88,113 — 88,113 84,218 172,331Derivative financial instruments — 1,435 1,435 — 1,435Cash and cash equivalents 290,276 — 290,276 — 290,276Total 378,389 1,435 379,824 84,218 464,042
Liabilities atfair value
through profitor loss
Financialliabilities at
amortized cost
Subtotalfinancialliabilities
Non-financialliabilities
Total
Liabilities as per statement offinancial position Trade and other payables — 98,420 98,420 12,066 110,486Borrowings (excluding leaseliabilities) (i) — 968,280 968,280 — 968,280Leases Liabilities — 216,384 216,384 — 216,384Derivative financial instruments(i) 1,423 — 1,423 — 1,423Total 1,423 1,283,084 1,284,507 12,066 1,296,573
(i) Effective July 1, 2013, the Group formally documented and designated cash flow hedging relationships to hedge the foreign exchange rate risk of a portion of its highly probable future sales in U.S. Dollars using a portion of its borrowings denominated in U.S. Dollars, currency forwards and foreign currency floating-to-fixed interest rate swaps (see Note 2).
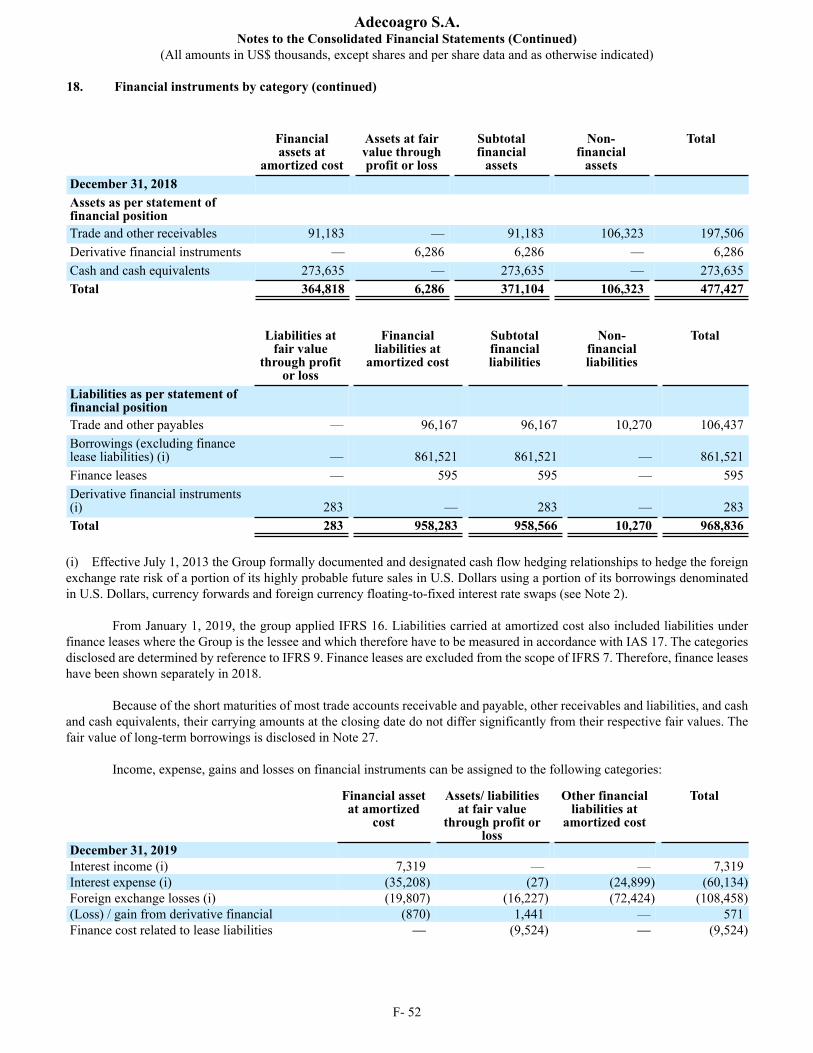
Adecoagro S.A.Notes to the Consolidated Financial Statements (Continued)
(All amounts in US$ thousands, except shares and per share data and as otherwise indicated)
18. Financial instruments by category (continued)
F- 52
Financialassets at
amortized cost
Assets at fairvalue throughprofit or loss
Subtotalfinancial
assets
Non-financial
assets
Total
December 31, 2018 Assets as per statement offinancial position Trade and other receivables 91,183 — 91,183 106,323 197,506Derivative financial instruments — 6,286 6,286 — 6,286Cash and cash equivalents 273,635 — 273,635 — 273,635Total 364,818 6,286 371,104 106,323 477,427
Liabilities atfair value
through profitor loss
Financialliabilities at
amortized cost
Subtotalfinancialliabilities
Non-financialliabilities
Total
Liabilities as per statement offinancial position Trade and other payables — 96,167 96,167 10,270 106,437Borrowings (excluding financelease liabilities) (i) — 861,521 861,521 — 861,521Finance leases — 595 595 — 595Derivative financial instruments(i) 283 — 283 — 283Total 283 958,283 958,566 10,270 968,836
(i) Effective July 1, 2013 the Group formally documented and designated cash flow hedging relationships to hedge the foreign exchange rate risk of a portion of its highly probable future sales in U.S. Dollars using a portion of its borrowings denominated in U.S. Dollars, currency forwards and foreign currency floating-to-fixed interest rate swaps (see Note 2).
From January 1, 2019, the group applied IFRS 16. Liabilities carried at amortized cost also included liabilities under finance leases where the Group is the lessee and which therefore have to be measured in accordance with IAS 17. The categories disclosed are determined by reference to IFRS 9. Finance leases are excluded from the scope of IFRS 7. Therefore, finance leases have been shown separately in 2018.
Because of the short maturities of most trade accounts receivable and payable, other receivables and liabilities, and cash
and cash equivalents, their carrying amounts at the closing date do not differ significantly from their respective fair values. The fair value of long-term borrowings is disclosed in Note 27.
Income, expense, gains and losses on financial instruments can be assigned to the following categories:
Financial assetat amortized
cost
Assets/ liabilitiesat fair value
through profit orloss
Other financialliabilities at
amortized cost
Total
December 31, 2019Interest income (i) 7,319 — — 7,319Interest expense (i) (35,208) (27) (24,899) (60,134)Foreign exchange losses (i) (19,807) (16,227) (72,424) (108,458)(Loss) / gain from derivative financial (870) 1,441 — 571Finance cost related to lease liabilities — (9,524) — (9,524)
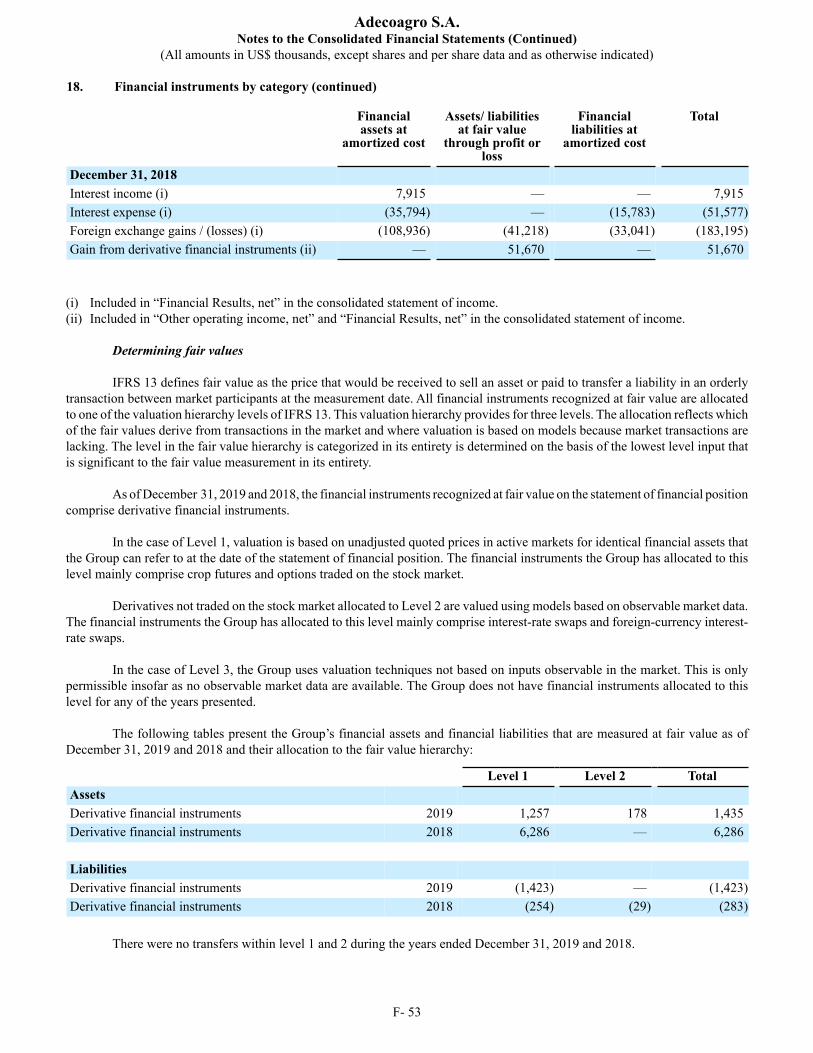
Adecoagro S.A.Notes to the Consolidated Financial Statements (Continued)
(All amounts in US$ thousands, except shares and per share data and as otherwise indicated)
18. Financial instruments by category (continued)
F- 53
Financialassets at
amortized cost
Assets/ liabilitiesat fair value
through profit orloss
Financialliabilities at
amortized cost
Total
December 31, 2018 Interest income (i) 7,915 — — 7,915Interest expense (i) (35,794) — (15,783) (51,577)Foreign exchange gains / (losses) (i) (108,936) (41,218) (33,041) (183,195)Gain from derivative financial instruments (ii) — 51,670 — 51,670
(i) Included in “Financial Results, net” in the consolidated statement of income.(ii) Included in “Other operating income, net” and “Financial Results, net” in the consolidated statement of income.
Determining fair values
IFRS 13 defines fair value as the price that would be received to sell an asset or paid to transfer a liability in an orderly transaction between market participants at the measurement date. All financial instruments recognized at fair value are allocated to one of the valuation hierarchy levels of IFRS 13. This valuation hierarchy provides for three levels. The allocation reflects which of the fair values derive from transactions in the market and where valuation is based on models because market transactions are lacking. The level in the fair value hierarchy is categorized in its entirety is determined on the basis of the lowest level input that is significant to the fair value measurement in its entirety.
As of December 31, 2019 and 2018, the financial instruments recognized at fair value on the statement of financial position comprise derivative financial instruments.
In the case of Level 1, valuation is based on unadjusted quoted prices in active markets for identical financial assets that
the Group can refer to at the date of the statement of financial position. The financial instruments the Group has allocated to this level mainly comprise crop futures and options traded on the stock market.
Derivatives not traded on the stock market allocated to Level 2 are valued using models based on observable market data. The financial instruments the Group has allocated to this level mainly comprise interest-rate swaps and foreign-currency interest-rate swaps.
In the case of Level 3, the Group uses valuation techniques not based on inputs observable in the market. This is only permissible insofar as no observable market data are available. The Group does not have financial instruments allocated to this level for any of the years presented.
The following tables present the Group’s financial assets and financial liabilities that are measured at fair value as of
December 31, 2019 and 2018 and their allocation to the fair value hierarchy:
Level 1 Level 2 TotalAssets Derivative financial instruments 2019 1,257 178 1,435Derivative financial instruments 2018 6,286 — 6,286
Liabilities Derivative financial instruments 2019 (1,423) — (1,423)Derivative financial instruments 2018 (254) (29) (283)
There were no transfers within level 1 and 2 during the years ended December 31, 2019 and 2018.
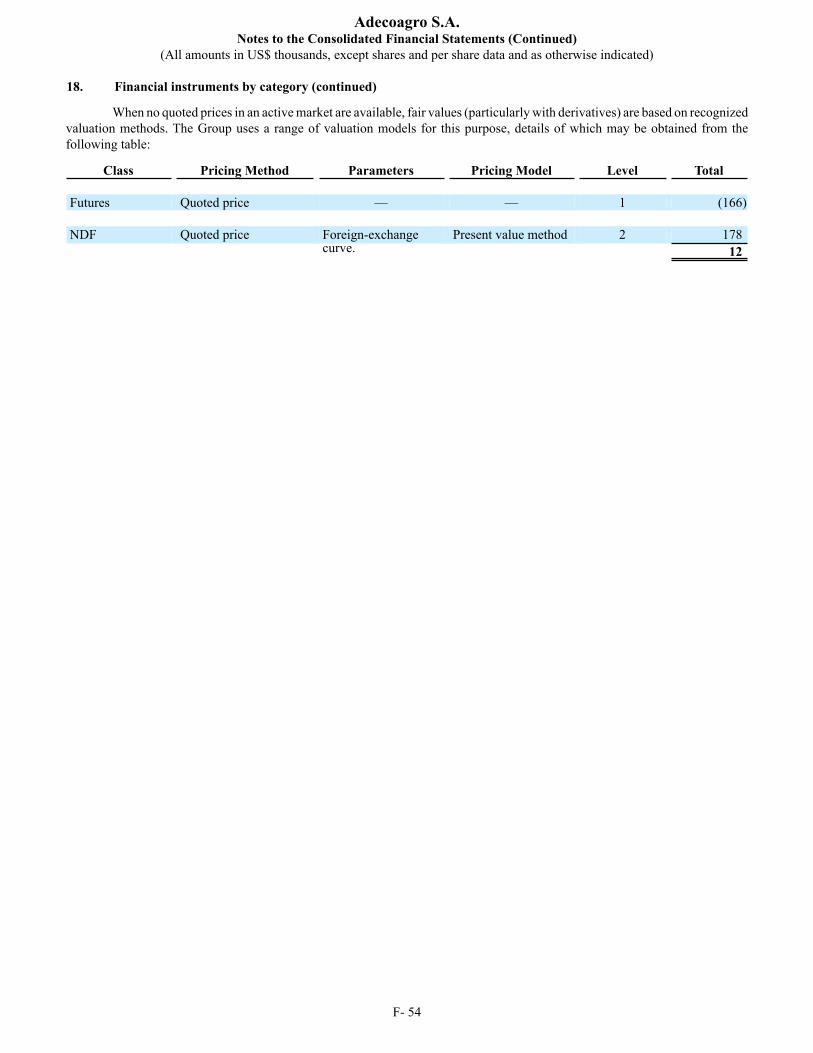
Adecoagro S.A.Notes to the Consolidated Financial Statements (Continued)
(All amounts in US$ thousands, except shares and per share data and as otherwise indicated)
18. Financial instruments by category (continued)
F- 54
When no quoted prices in an active market are available, fair values (particularly with derivatives) are based on recognized valuation methods. The Group uses a range of valuation models for this purpose, details of which may be obtained from the following table:
Class Pricing Method Parameters Pricing Model Level Total
Futures Quoted price — — 1 (166)
NDF Quoted price Foreign-exchangecurve.
Present value method 2 17812
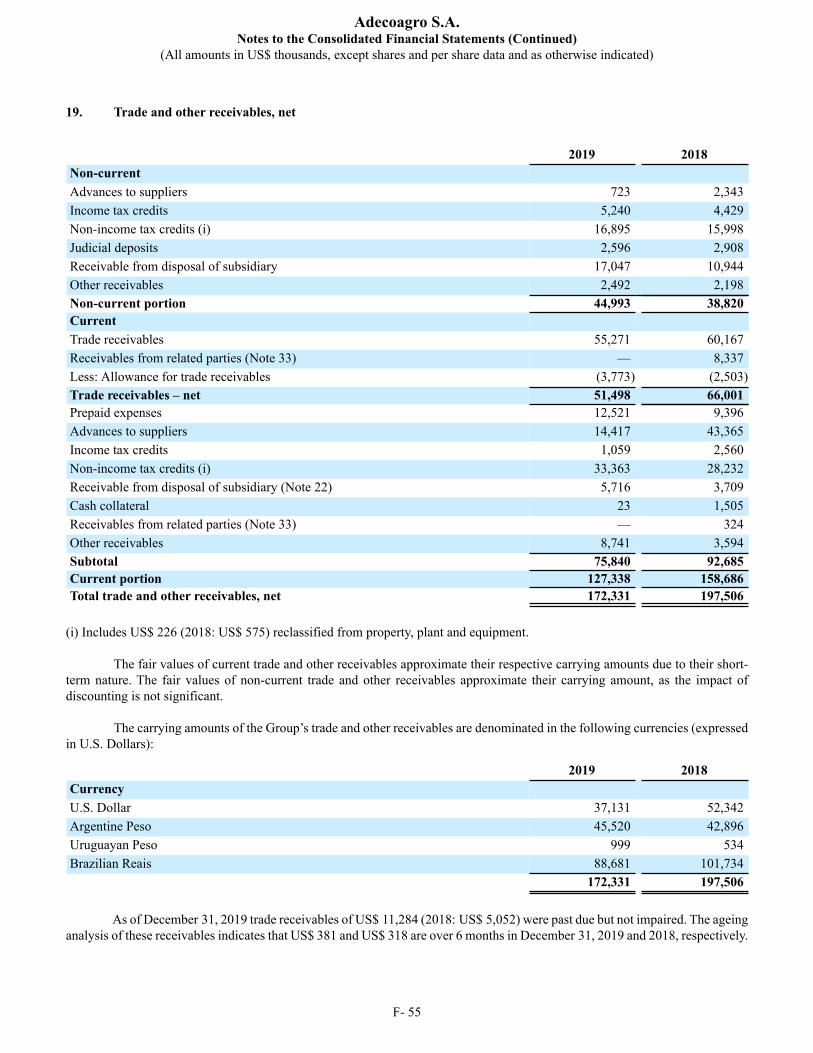
Adecoagro S.A.Notes to the Consolidated Financial Statements (Continued)
(All amounts in US$ thousands, except shares and per share data and as otherwise indicated)
F- 55
19. Trade and other receivables, net
2019 2018Non-current Advances to suppliers 723 2,343Income tax credits 5,240 4,429Non-income tax credits (i) 16,895 15,998Judicial deposits 2,596 2,908Receivable from disposal of subsidiary 17,047 10,944Other receivables 2,492 2,198Non-current portion 44,993 38,820Current Trade receivables 55,271 60,167Receivables from related parties (Note 33) — 8,337Less: Allowance for trade receivables (3,773) (2,503)Trade receivables – net 51,498 66,001Prepaid expenses 12,521 9,396Advances to suppliers 14,417 43,365Income tax credits 1,059 2,560Non-income tax credits (i) 33,363 28,232Receivable from disposal of subsidiary (Note 22) 5,716 3,709Cash collateral 23 1,505Receivables from related parties (Note 33) — 324Other receivables 8,741 3,594Subtotal 75,840 92,685Current portion 127,338 158,686Total trade and other receivables, net 172,331 197,506
(i) Includes US$ 226 (2018: US$ 575) reclassified from property, plant and equipment.
The fair values of current trade and other receivables approximate their respective carrying amounts due to their short-
term nature. The fair values of non-current trade and other receivables approximate their carrying amount, as the impact of discounting is not significant.
The carrying amounts of the Group’s trade and other receivables are denominated in the following currencies (expressed in U.S. Dollars):
2019 2018Currency U.S. Dollar 37,131 52,342Argentine Peso 45,520 42,896Uruguayan Peso 999 534Brazilian Reais 88,681 101,734 172,331 197,506
As of December 31, 2019 trade receivables of US$ 11,284 (2018: US$ 5,052) were past due but not impaired. The ageing
analysis of these receivables indicates that US$ 381 and US$ 318 are over 6 months in December 31, 2019 and 2018, respectively.
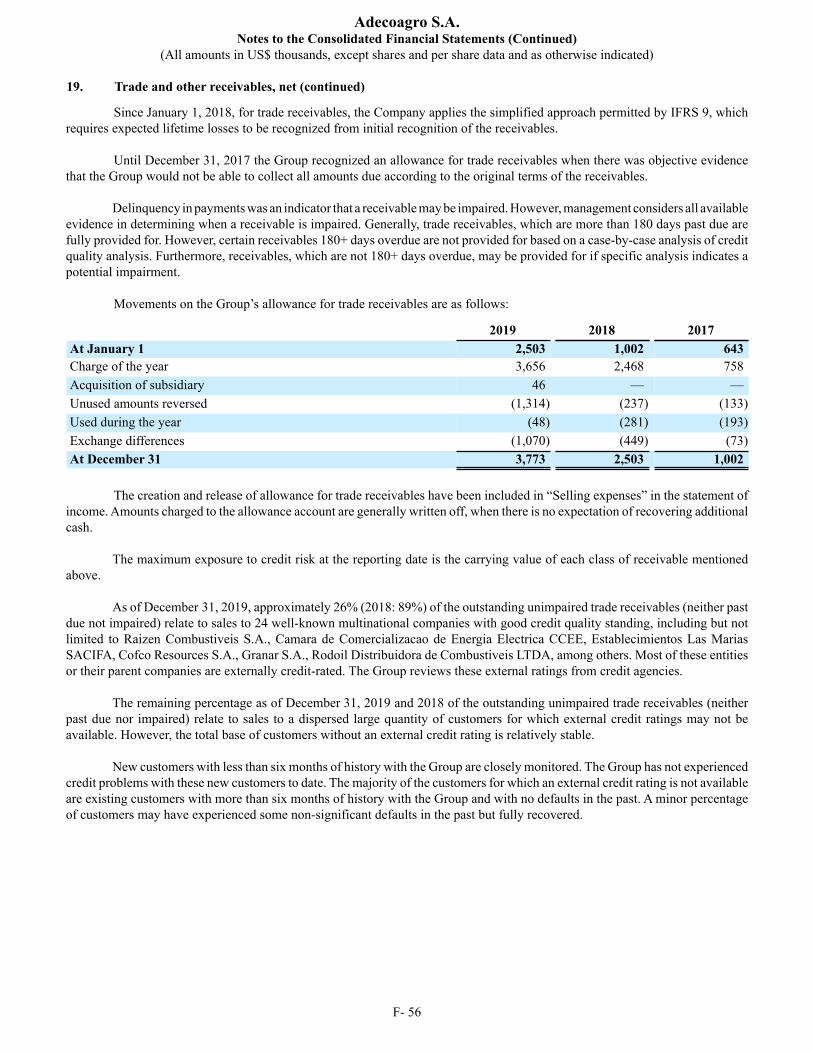
Adecoagro S.A.Notes to the Consolidated Financial Statements (Continued)
(All amounts in US$ thousands, except shares and per share data and as otherwise indicated)
19. Trade and other receivables, net (continued)
F- 56
Since January 1, 2018, for trade receivables, the Company applies the simplified approach permitted by IFRS 9, which requires expected lifetime losses to be recognized from initial recognition of the receivables.
Until December 31, 2017 the Group recognized an allowance for trade receivables when there was objective evidence that the Group would not be able to collect all amounts due according to the original terms of the receivables.
Delinquency in payments was an indicator that a receivable may be impaired. However, management considers all available evidence in determining when a receivable is impaired. Generally, trade receivables, which are more than 180 days past due are fully provided for. However, certain receivables 180+ days overdue are not provided for based on a case-by-case analysis of credit quality analysis. Furthermore, receivables, which are not 180+ days overdue, may be provided for if specific analysis indicates a potential impairment.
Movements on the Group’s allowance for trade receivables are as follows:
2019 2018 2017At January 1 2,503 1,002 643Charge of the year 3,656 2,468 758Acquisition of subsidiary 46 — —Unused amounts reversed (1,314) (237) (133)Used during the year (48) (281) (193)Exchange differences (1,070) (449) (73)At December 31 3,773 2,503 1,002
The creation and release of allowance for trade receivables have been included in “Selling expenses” in the statement of
income. Amounts charged to the allowance account are generally written off, when there is no expectation of recovering additional cash.
The maximum exposure to credit risk at the reporting date is the carrying value of each class of receivable mentioned
above. As of December 31, 2019, approximately 26% (2018: 89%) of the outstanding unimpaired trade receivables (neither past
due not impaired) relate to sales to 24 well-known multinational companies with good credit quality standing, including but not limited to Raizen Combustiveis S.A., Camara de Comercializacao de Energia Electrica CCEE, Establecimientos Las Marias SACIFA, Cofco Resources S.A., Granar S.A., Rodoil Distribuidora de Combustiveis LTDA, among others. Most of these entities or their parent companies are externally credit-rated. The Group reviews these external ratings from credit agencies.
The remaining percentage as of December 31, 2019 and 2018 of the outstanding unimpaired trade receivables (neither past due nor impaired) relate to sales to a dispersed large quantity of customers for which external credit ratings may not be available. However, the total base of customers without an external credit rating is relatively stable.
New customers with less than six months of history with the Group are closely monitored. The Group has not experienced
credit problems with these new customers to date. The majority of the customers for which an external credit rating is not available are existing customers with more than six months of history with the Group and with no defaults in the past. A minor percentage of customers may have experienced some non-significant defaults in the past but fully recovered.
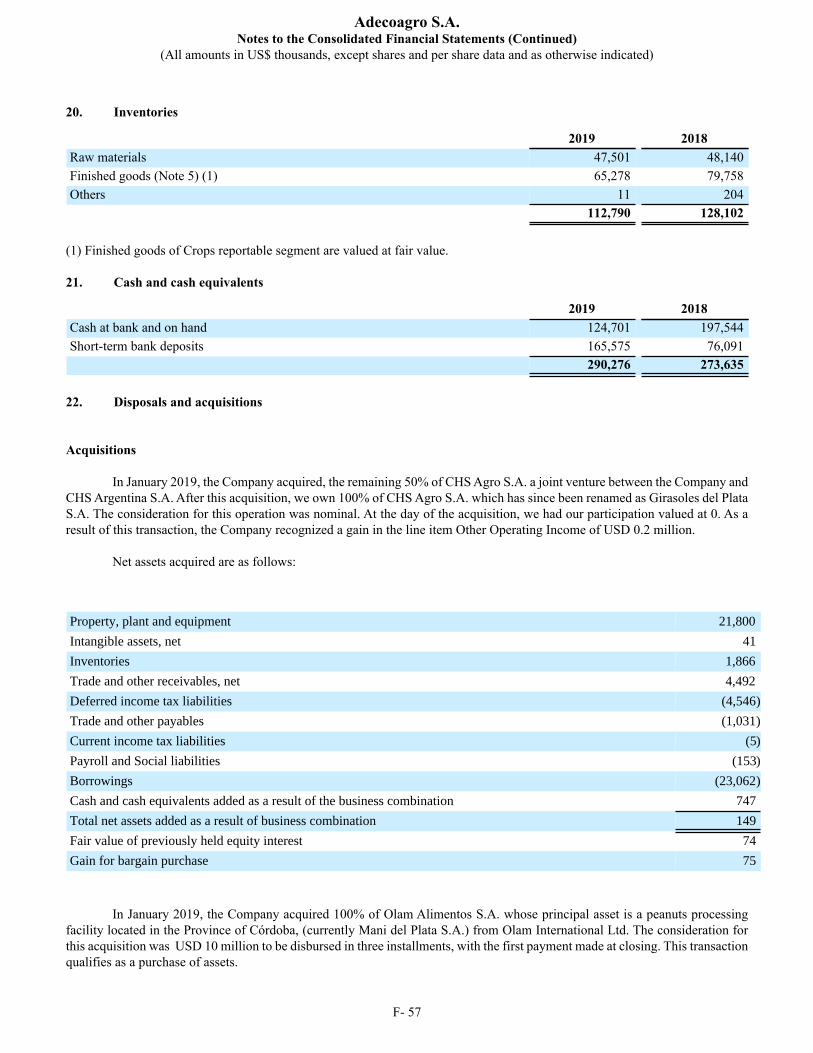
Adecoagro S.A.Notes to the Consolidated Financial Statements (Continued)
(All amounts in US$ thousands, except shares and per share data and as otherwise indicated)
F- 57
20. Inventories
2019 2018Raw materials 47,501 48,140Finished goods (Note 5) (1) 65,278 79,758Others 11 204 112,790 128,102
(1) Finished goods of Crops reportable segment are valued at fair value. 21. Cash and cash equivalents
2019 2018Cash at bank and on hand 124,701 197,544Short-term bank deposits 165,575 76,091 290,276 273,635
22. Disposals and acquisitions
Acquisitions
In January 2019, the Company acquired, the remaining 50% of CHS Agro S.A. a joint venture between the Company and CHS Argentina S.A. After this acquisition, we own 100% of CHS Agro S.A. which has since been renamed as Girasoles del Plata S.A. The consideration for this operation was nominal. At the day of the acquisition, we had our participation valued at 0. As a result of this transaction, the Company recognized a gain in the line item Other Operating Income of USD 0.2 million.
Net assets acquired are as follows:
Property, plant and equipment 21,800
Intangible assets, net 41
Inventories 1,866
Trade and other receivables, net 4,492
Deferred income tax liabilities (4,546)
Trade and other payables (1,031)
Current income tax liabilities (5)
Payroll and Social liabilities (153)
Borrowings (23,062)
Cash and cash equivalents added as a result of the business combination 747
Total net assets added as a result of business combination 149
Fair value of previously held equity interest 74
Gain for bargain purchase 75
In January 2019, the Company acquired 100% of Olam Alimentos S.A. whose principal asset is a peanuts processing facility located in the Province of Córdoba, (currently Mani del Plata S.A.) from Olam International Ltd. The consideration for this acquisition was USD 10 million to be disbursed in three installments, with the first payment made at closing. This transaction qualifies as a purchase of assets.
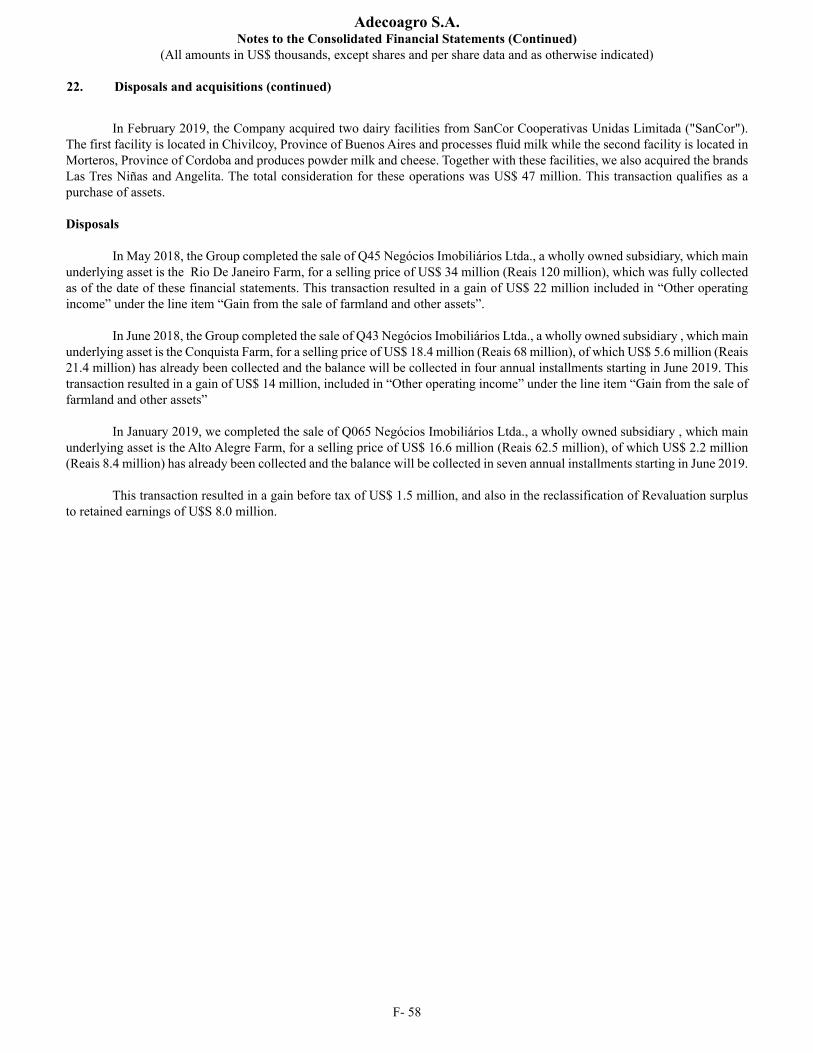
Adecoagro S.A.Notes to the Consolidated Financial Statements (Continued)
(All amounts in US$ thousands, except shares and per share data and as otherwise indicated)
22. Disposals and acquisitions (continued)
F- 58
In February 2019, the Company acquired two dairy facilities from SanCor Cooperativas Unidas Limitada ("SanCor"). The first facility is located in Chivilcoy, Province of Buenos Aires and processes fluid milk while the second facility is located in Morteros, Province of Cordoba and produces powder milk and cheese. Together with these facilities, we also acquired the brands Las Tres Niñas and Angelita. The total consideration for these operations was US$ 47 million. This transaction qualifies as a purchase of assets.
Disposals
In May 2018, the Group completed the sale of Q45 Negócios Imobiliários Ltda., a wholly owned subsidiary, which main underlying asset is the Rio De Janeiro Farm, for a selling price of US$ 34 million (Reais 120 million), which was fully collected as of the date of these financial statements. This transaction resulted in a gain of US$ 22 million included in “Other operating income” under the line item “Gain from the sale of farmland and other assets”.
In June 2018, the Group completed the sale of Q43 Negócios Imobiliários Ltda., a wholly owned subsidiary , which main underlying asset is the Conquista Farm, for a selling price of US$ 18.4 million (Reais 68 million), of which US$ 5.6 million (Reais 21.4 million) has already been collected and the balance will be collected in four annual installments starting in June 2019. This transaction resulted in a gain of US$ 14 million, included in “Other operating income” under the line item “Gain from the sale of farmland and other assets”
In January 2019, we completed the sale of Q065 Negócios Imobiliários Ltda., a wholly owned subsidiary , which main underlying asset is the Alto Alegre Farm, for a selling price of US$ 16.6 million (Reais 62.5 million), of which US$ 2.2 million (Reais 8.4 million) has already been collected and the balance will be collected in seven annual installments starting in June 2019.
This transaction resulted in a gain before tax of US$ 1.5 million, and also in the reclassification of Revaluation surplus to retained earnings of U$S 8.0 million.

Adecoagro S.A.Notes to the Consolidated Financial Statements (Continued)
(All amounts in US$ thousands, except shares and per share data and as otherwise indicated)
F- 59
23. Shareholders' contributions
The share capital of the Group is represented by common shares with a nominal value of US$ 1.5 per share and one vote each.
Number of sharesShare capital andshare premium
At January 1, 2017 122,382 1,120,823Employee share options exercised (Note 24) (1) — 50Restricted shares and units vested (Note 24) — 4,149Purchase of own shares — (32,515)At December 31,2017 122,382 1,092,507Restricted shares and units vested (Note 24) — 4,775Purchase of own shares — (13,206)At December 31,2018 122,382 1,084,076Restricted shares units vested (Note 24) — 4,455Purchase of own shares — (3,219)At December 31,2019 122,382 1,085,312
(1) Treasury shares were used to settle these options and units.
Share Repurchase Program
On September 24, 2013, the Board of Directors of the Company has authorized a share repurchase program for up to 5%of its outstanding shares. The repurchase program has commenced on September 24, 2013 and is reviewed by the Board of Directors after each 12-month period. On August 13, 2019, the Board of Directors approved the extension of the program for an additional twelve-month period, ending September 23, 2020.
Repurchases of shares under the program are made from time to time in open market transactions in compliance with the trading conditions of Rule 10b-18 under the U.S. Securities Exchange Act of 1934, as amended, and applicable rules and regulations. The share repurchase program does not require Adecoagro to acquire any specific number or amount of shares and may be modified, suspended, reinstated or terminated at any time in the Company’s discretion and without prior notice.
As of December 31, 2019, the Company repurchased 9,117,747 shares under this program, of which 3,828,042 have been
applied to some exercise of the Company’s stock option plan and restricted stock units plan. In 2019, 2018 and 2017 the Company repurchased shares for an amount of US$ 4,263; US$ 15,725; US$ 38,367, respectively. The outstanding treasury shares as of December 31, 2019 totaled 5,295,765.
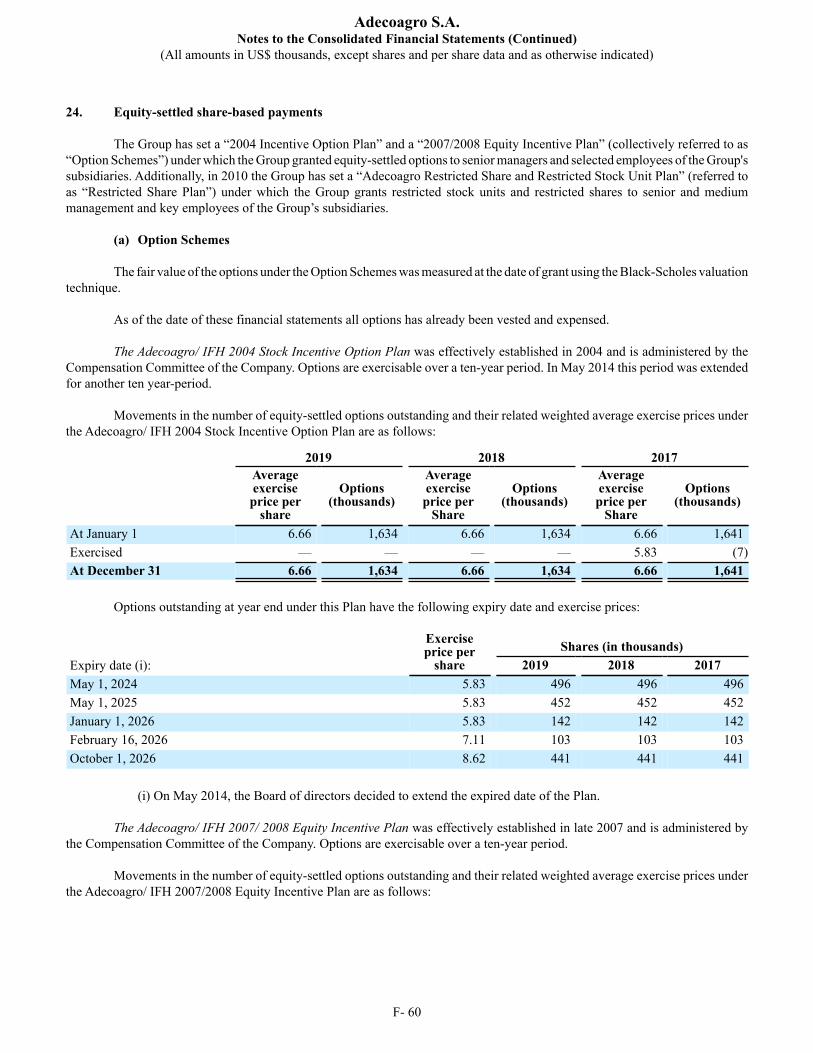
Adecoagro S.A.Notes to the Consolidated Financial Statements (Continued)
(All amounts in US$ thousands, except shares and per share data and as otherwise indicated)
F- 60
24. Equity-settled share-based payments
The Group has set a “2004 Incentive Option Plan” and a “2007/2008 Equity Incentive Plan” (collectively referred to as “Option Schemes”) under which the Group granted equity-settled options to senior managers and selected employees of the Group's subsidiaries. Additionally, in 2010 the Group has set a “Adecoagro Restricted Share and Restricted Stock Unit Plan” (referred to as “Restricted Share Plan”) under which the Group grants restricted stock units and restricted shares to senior and medium management and key employees of the Group’s subsidiaries.
(a) Option Schemes
The fair value of the options under the Option Schemes was measured at the date of grant using the Black-Scholes valuation technique.
As of the date of these financial statements all options has already been vested and expensed. The Adecoagro/ IFH 2004 Stock Incentive Option Plan was effectively established in 2004 and is administered by the
Compensation Committee of the Company. Options are exercisable over a ten-year period. In May 2014 this period was extended for another ten year-period.
Movements in the number of equity-settled options outstanding and their related weighted average exercise prices under
the Adecoagro/ IFH 2004 Stock Incentive Option Plan are as follows:
2019 2018 2017
Averageexerciseprice per
share
Options(thousands)
Averageexerciseprice per
Share
Options(thousands)
Averageexerciseprice per
Share
Options(thousands)
At January 1 6.66 1,634 6.66 1,634 6.66 1,641Exercised — — — — 5.83 (7)At December 31 6.66 1,634 6.66 1,634 6.66 1,641
Options outstanding at year end under this Plan have the following expiry date and exercise prices:
Exerciseprice per
shareShares (in thousands)
Expiry date (i): 2019 2018 2017May 1, 2024 5.83 496 496 496May 1, 2025 5.83 452 452 452January 1, 2026 5.83 142 142 142February 16, 2026 7.11 103 103 103October 1, 2026 8.62 441 441 441
(i) On May 2014, the Board of directors decided to extend the expired date of the Plan.
The Adecoagro/ IFH 2007/ 2008 Equity Incentive Plan was effectively established in late 2007 and is administered by
the Compensation Committee of the Company. Options are exercisable over a ten-year period. Movements in the number of equity-settled options outstanding and their related weighted average exercise prices under
the Adecoagro/ IFH 2007/2008 Equity Incentive Plan are as follows:
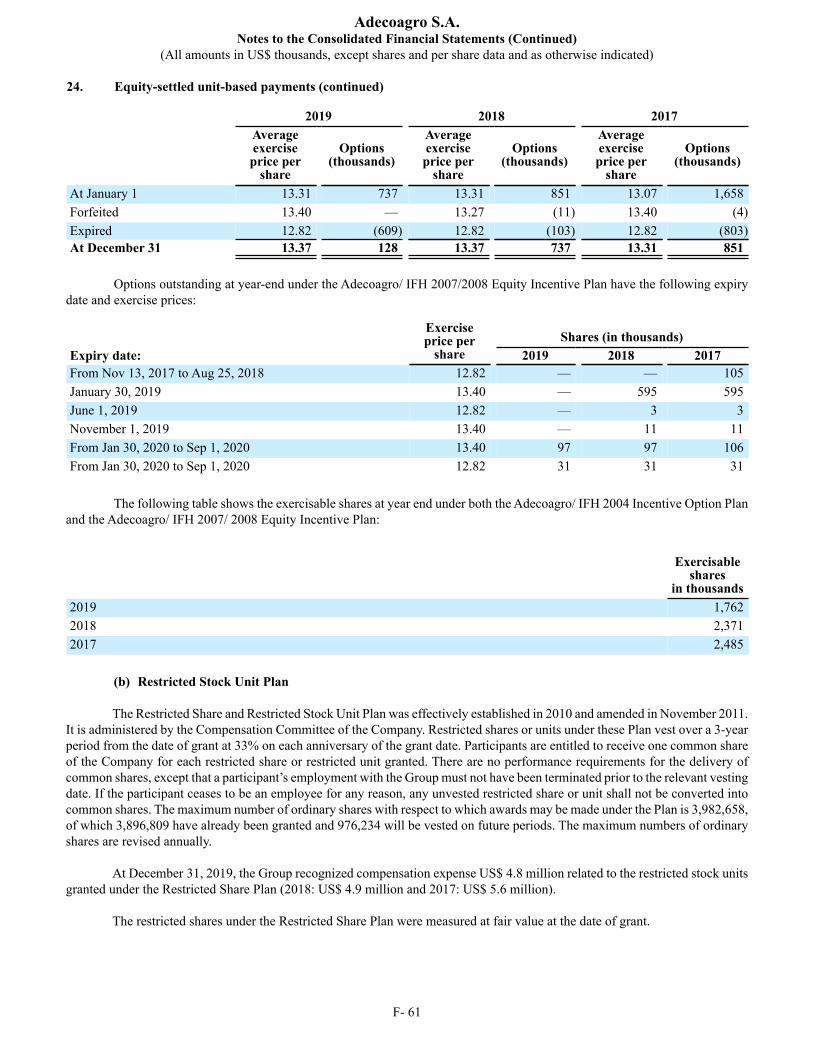
Adecoagro S.A.Notes to the Consolidated Financial Statements (Continued)
(All amounts in US$ thousands, except shares and per share data and as otherwise indicated)
24. Equity-settled unit-based payments (continued)
F- 61
2019 2018 2017
Averageexerciseprice per
share
Options(thousands)
Averageexerciseprice per
share
Options(thousands)
Averageexerciseprice per
share
Options(thousands)
At January 1 13.31 737 13.31 851 13.07 1,658Forfeited 13.40 — 13.27 (11) 13.40 (4)Expired 12.82 (609) 12.82 (103) 12.82 (803)At December 31 13.37 128 13.37 737 13.31 851
Options outstanding at year-end under the Adecoagro/ IFH 2007/2008 Equity Incentive Plan have the following expiry
date and exercise prices:
Exerciseprice per
shareShares (in thousands)
Expiry date: 2019 2018 2017From Nov 13, 2017 to Aug 25, 2018 12.82 — — 105January 30, 2019 13.40 — 595 595June 1, 2019 12.82 — 3 3November 1, 2019 13.40 — 11 11From Jan 30, 2020 to Sep 1, 2020 13.40 97 97 106From Jan 30, 2020 to Sep 1, 2020 12.82 31 31 31
The following table shows the exercisable shares at year end under both the Adecoagro/ IFH 2004 Incentive Option Plan
and the Adecoagro/ IFH 2007/ 2008 Equity Incentive Plan:
Exercisable shares
in thousands2019 1,7622018 2,3712017 2,485
(b) Restricted Stock Unit Plan
The Restricted Share and Restricted Stock Unit Plan was effectively established in 2010 and amended in November 2011. It is administered by the Compensation Committee of the Company. Restricted shares or units under these Plan vest over a 3-year period from the date of grant at 33% on each anniversary of the grant date. Participants are entitled to receive one common share of the Company for each restricted share or restricted unit granted. There are no performance requirements for the delivery of common shares, except that a participant’s employment with the Group must not have been terminated prior to the relevant vesting date. If the participant ceases to be an employee for any reason, any unvested restricted share or unit shall not be converted into common shares. The maximum number of ordinary shares with respect to which awards may be made under the Plan is 3,982,658, of which 3,896,809 have already been granted and 976,234 will be vested on future periods. The maximum numbers of ordinary shares are revised annually.
At December 31, 2019, the Group recognized compensation expense US$ 4.8 million related to the restricted stock units
granted under the Restricted Share Plan (2018: US$ 4.9 million and 2017: US$ 5.6 million). The restricted shares under the Restricted Share Plan were measured at fair value at the date of grant.
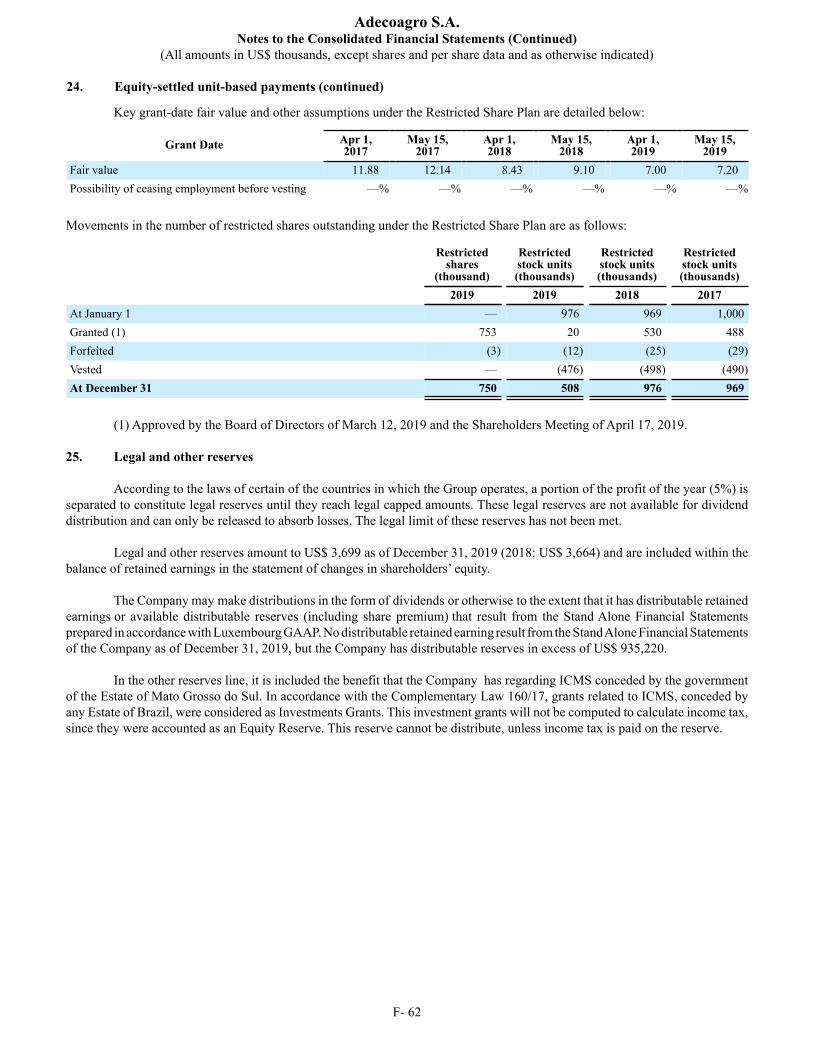
Adecoagro S.A.Notes to the Consolidated Financial Statements (Continued)
(All amounts in US$ thousands, except shares and per share data and as otherwise indicated)
24. Equity-settled unit-based payments (continued)
F- 62
Key grant-date fair value and other assumptions under the Restricted Share Plan are detailed below:
Grant Date Apr 1,2017
May 15,2017
Apr 1,2018
May 15,2018
Apr 1,2019
May 15,2019
Fair value 11.88 12.14 8.43 9.10 7.00 7.20Possibility of ceasing employment before vesting —% —% —% —% —% —%
Movements in the number of restricted shares outstanding under the Restricted Share Plan are as follows:
Restrictedshares
(thousand)
Restrictedstock units(thousands)
Restrictedstock units(thousands)
Restrictedstock units(thousands)
2019 2019 2018 2017At January 1 — 976 969 1,000Granted (1) 753 20 530 488Forfeited (3) (12) (25) (29)Vested — (476) (498) (490)At December 31 750 508 976 969
(1) Approved by the Board of Directors of March 12, 2019 and the Shareholders Meeting of April 17, 2019.
25. Legal and other reserves
According to the laws of certain of the countries in which the Group operates, a portion of the profit of the year (5%) is separated to constitute legal reserves until they reach legal capped amounts. These legal reserves are not available for dividend distribution and can only be released to absorb losses. The legal limit of these reserves has not been met.
Legal and other reserves amount to US$ 3,699 as of December 31, 2019 (2018: US$ 3,664) and are included within the
balance of retained earnings in the statement of changes in shareholders’ equity. The Company may make distributions in the form of dividends or otherwise to the extent that it has distributable retained
earnings or available distributable reserves (including share premium) that result from the Stand Alone Financial Statements prepared in accordance with Luxembourg GAAP. No distributable retained earning result from the Stand Alone Financial Statements of the Company as of December 31, 2019, but the Company has distributable reserves in excess of US$ 935,220.
In the other reserves line, it is included the benefit that the Company has regarding ICMS conceded by the government of the Estate of Mato Grosso do Sul. In accordance with the Complementary Law 160/17, grants related to ICMS, conceded by any Estate of Brazil, were considered as Investments Grants. This investment grants will not be computed to calculate income tax, since they were accounted as an Equity Reserve. This reserve cannot be distribute, unless income tax is paid on the reserve.
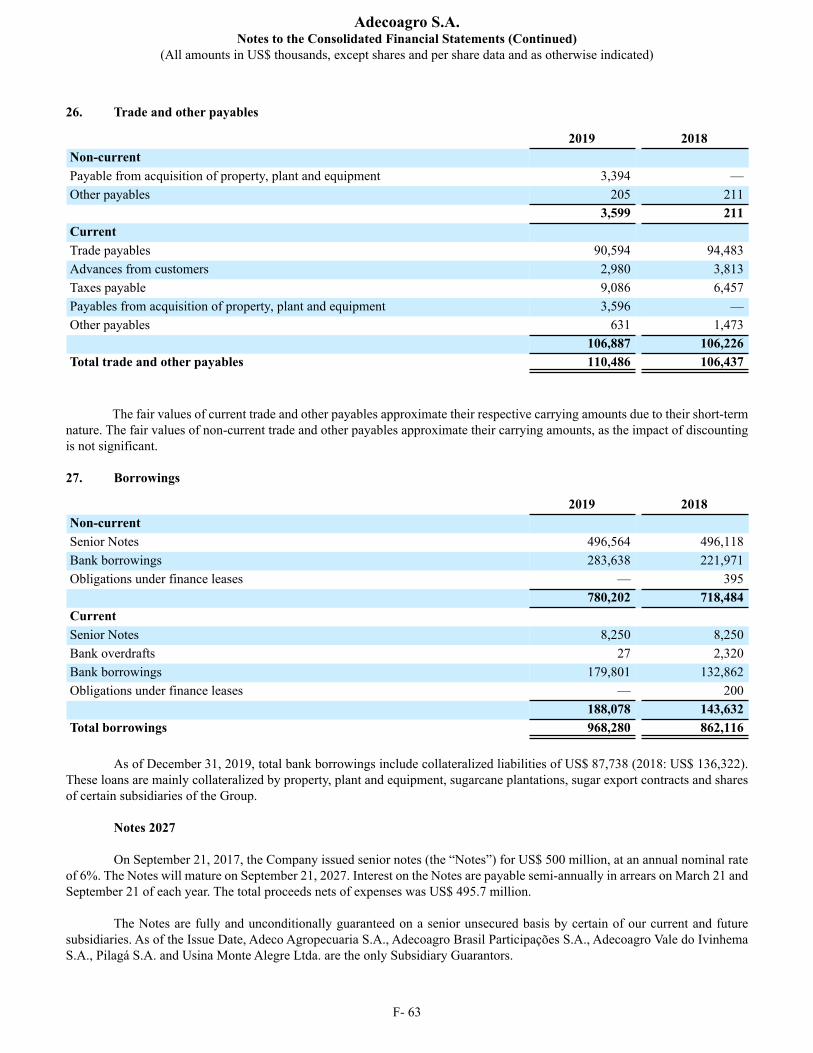
Adecoagro S.A.Notes to the Consolidated Financial Statements (Continued)
(All amounts in US$ thousands, except shares and per share data and as otherwise indicated)
F- 63
26. Trade and other payables
2019 2018Non-current Payable from acquisition of property, plant and equipment 3,394 —Other payables 205 211 3,599 211Current Trade payables 90,594 94,483Advances from customers 2,980 3,813Taxes payable 9,086 6,457Payables from acquisition of property, plant and equipment 3,596 —Other payables 631 1,473 106,887 106,226Total trade and other payables 110,486 106,437
The fair values of current trade and other payables approximate their respective carrying amounts due to their short-term nature. The fair values of non-current trade and other payables approximate their carrying amounts, as the impact of discounting is not significant. 27. Borrowings
2019 2018Non-current Senior Notes 496,564 496,118Bank borrowings 283,638 221,971Obligations under finance leases — 395 780,202 718,484Current Senior Notes 8,250 8,250Bank overdrafts 27 2,320Bank borrowings 179,801 132,862Obligations under finance leases — 200 188,078 143,632Total borrowings 968,280 862,116
As of December 31, 2019, total bank borrowings include collateralized liabilities of US$ 87,738 (2018: US$ 136,322).
These loans are mainly collateralized by property, plant and equipment, sugarcane plantations, sugar export contracts and shares of certain subsidiaries of the Group.
Notes 2027
On September 21, 2017, the Company issued senior notes (the “Notes”) for US$ 500 million, at an annual nominal rate of 6%. The Notes will mature on September 21, 2027. Interest on the Notes are payable semi-annually in arrears on March 21 and September 21 of each year. The total proceeds nets of expenses was US$ 495.7 million.
The Notes are fully and unconditionally guaranteed on a senior unsecured basis by certain of our current and future subsidiaries. As of the Issue Date, Adeco Agropecuaria S.A., Adecoagro Brasil Participações S.A., Adecoagro Vale do Ivinhema S.A., Pilagá S.A. and Usina Monte Alegre Ltda. are the only Subsidiary Guarantors.
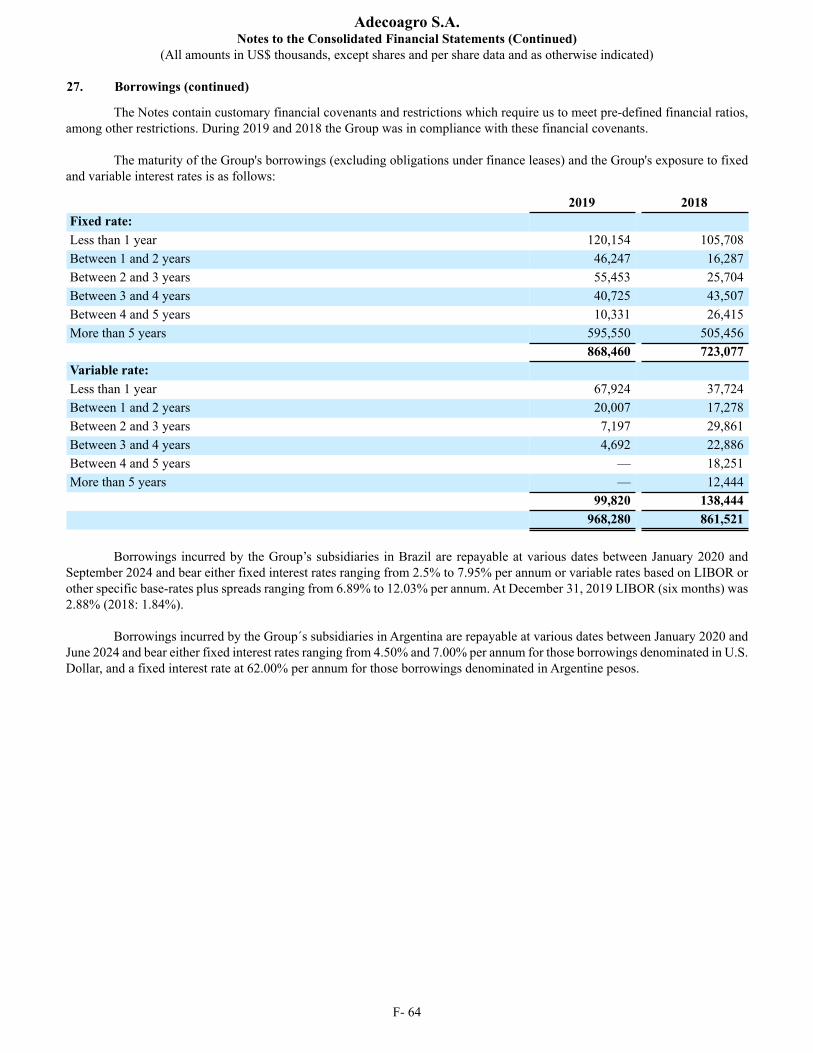
Adecoagro S.A.Notes to the Consolidated Financial Statements (Continued)
(All amounts in US$ thousands, except shares and per share data and as otherwise indicated)
27. Borrowings (continued)
F- 64
The Notes contain customary financial covenants and restrictions which require us to meet pre-defined financial ratios, among other restrictions. During 2019 and 2018 the Group was in compliance with these financial covenants.
The maturity of the Group's borrowings (excluding obligations under finance leases) and the Group's exposure to fixed and variable interest rates is as follows:
2019 2018Fixed rate: Less than 1 year 120,154 105,708Between 1 and 2 years 46,247 16,287Between 2 and 3 years 55,453 25,704Between 3 and 4 years 40,725 43,507Between 4 and 5 years 10,331 26,415More than 5 years 595,550 505,456 868,460 723,077Variable rate: Less than 1 year 67,924 37,724Between 1 and 2 years 20,007 17,278Between 2 and 3 years 7,197 29,861Between 3 and 4 years 4,692 22,886Between 4 and 5 years — 18,251More than 5 years — 12,444 99,820 138,444 968,280 861,521
Borrowings incurred by the Group’s subsidiaries in Brazil are repayable at various dates between January 2020 and
September 2024 and bear either fixed interest rates ranging from 2.5% to 7.95% per annum or variable rates based on LIBOR or other specific base-rates plus spreads ranging from 6.89% to 12.03% per annum. At December 31, 2019 LIBOR (six months) was 2.88% (2018: 1.84%).
Borrowings incurred by the Group´s subsidiaries in Argentina are repayable at various dates between January 2020 and
June 2024 and bear either fixed interest rates ranging from 4.50% and 7.00% per annum for those borrowings denominated in U.S. Dollar, and a fixed interest rate at 62.00% per annum for those borrowings denominated in Argentine pesos.
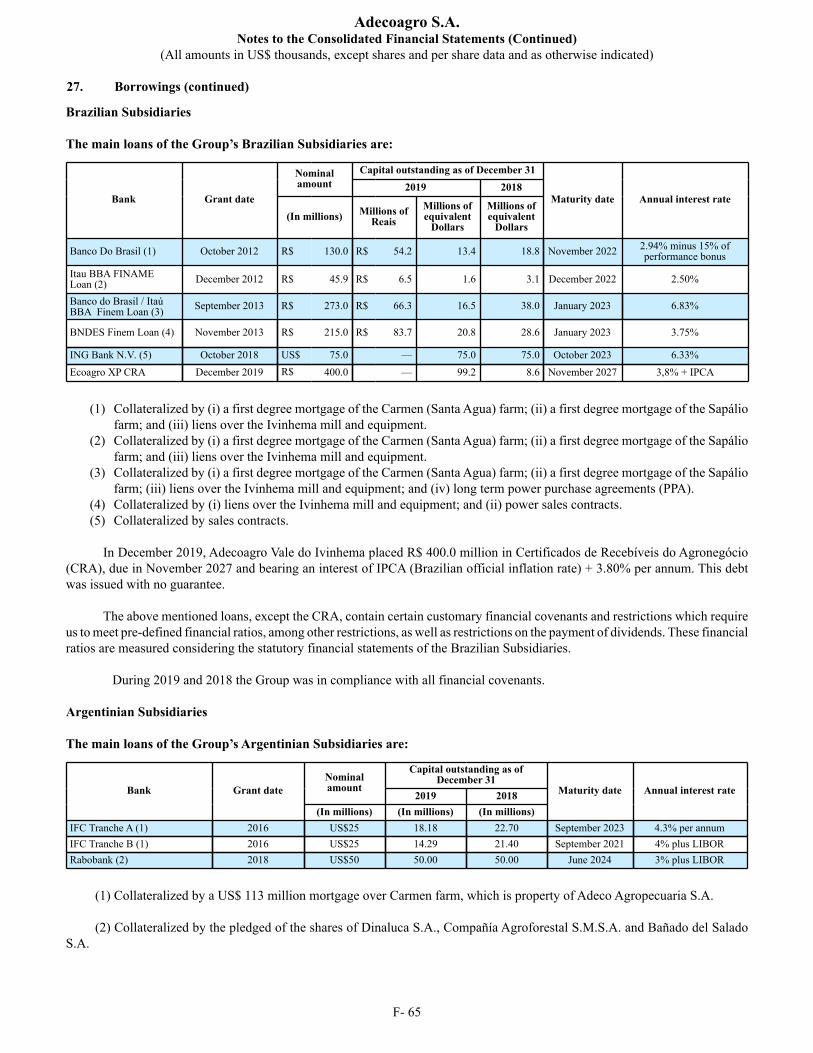
Adecoagro S.A.Notes to the Consolidated Financial Statements (Continued)
(All amounts in US$ thousands, except shares and per share data and as otherwise indicated)
27. Borrowings (continued)
F- 65
Brazilian Subsidiaries The main loans of the Group’s Brazilian Subsidiaries are:
Bank Grant date
Nominal amount
Capital outstanding as of December 31
Maturity date Annual interest rate2019 2018
(In millions) Millions ofReais
Millions of equivalent
Dollars
Millions ofequivalent
Dollars
Banco Do Brasil (1) October 2012 R$ 130.0 R$ 54.2 13.4 18.8 November 2022 2.94% minus 15% ofperformance bonus
Itau BBA FINAMELoan (2) December 2012 R$ 45.9 R$ 6.5 1.6 3.1 December 2022 2.50%
Banco do Brasil / ItaúBBA Finem Loan (3) September 2013 R$ 273.0 R$ 66.3 16.5 38.0 January 2023 6.83%
BNDES Finem Loan (4) November 2013 R$ 215.0 R$ 83.7 20.8 28.6 January 2023 3.75%
ING Bank N.V. (5) October 2018 US$ 75.0 — 75.0 75.0 October 2023 6.33%Ecoagro XP CRA December 2019 R$ 400.0 — 99.2 8.6 November 2027 3,8% + IPCA
(1) Collateralized by (i) a first degree mortgage of the Carmen (Santa Agua) farm; (ii) a first degree mortgage of the Sapálio
farm; and (iii) liens over the Ivinhema mill and equipment.(2) Collateralized by (i) a first degree mortgage of the Carmen (Santa Agua) farm; (ii) a first degree mortgage of the Sapálio
farm; and (iii) liens over the Ivinhema mill and equipment.(3) Collateralized by (i) a first degree mortgage of the Carmen (Santa Agua) farm; (ii) a first degree mortgage of the Sapálio
farm; (iii) liens over the Ivinhema mill and equipment; and (iv) long term power purchase agreements (PPA).(4) Collateralized by (i) liens over the Ivinhema mill and equipment; and (ii) power sales contracts.(5) Collateralized by sales contracts.
In December 2019, Adecoagro Vale do Ivinhema placed R$ 400.0 million in Certificados de Recebíveis do Agronegócio
(CRA), due in November 2027 and bearing an interest of IPCA (Brazilian official inflation rate) + 3.80% per annum. This debt was issued with no guarantee.
The above mentioned loans, except the CRA, contain certain customary financial covenants and restrictions which require us to meet pre-defined financial ratios, among other restrictions, as well as restrictions on the payment of dividends. These financial ratios are measured considering the statutory financial statements of the Brazilian Subsidiaries.
During 2019 and 2018 the Group was in compliance with all financial covenants.
Argentinian Subsidiaries The main loans of the Group’s Argentinian Subsidiaries are:
Bank Grant dateNominalamount
Capital outstanding as ofDecember 31
Maturity date Annual interest rate2019 2018(In millions) (In millions) (In millions)
IFC Tranche A (1) 2016 US$25 18.18 22.70 September 2023 4.3% per annumIFC Tranche B (1) 2016 US$25 14.29 21.40 September 2021 4% plus LIBORRabobank (2) 2018 US$50 50.00 50.00 June 2024 3% plus LIBOR
(1) Collateralized by a US$ 113 million mortgage over Carmen farm, which is property of Adeco Agropecuaria S.A.
(2) Collateralized by the pledged of the shares of Dinaluca S.A., Compañía Agroforestal S.M.S.A. and Bañado del Salado S.A.
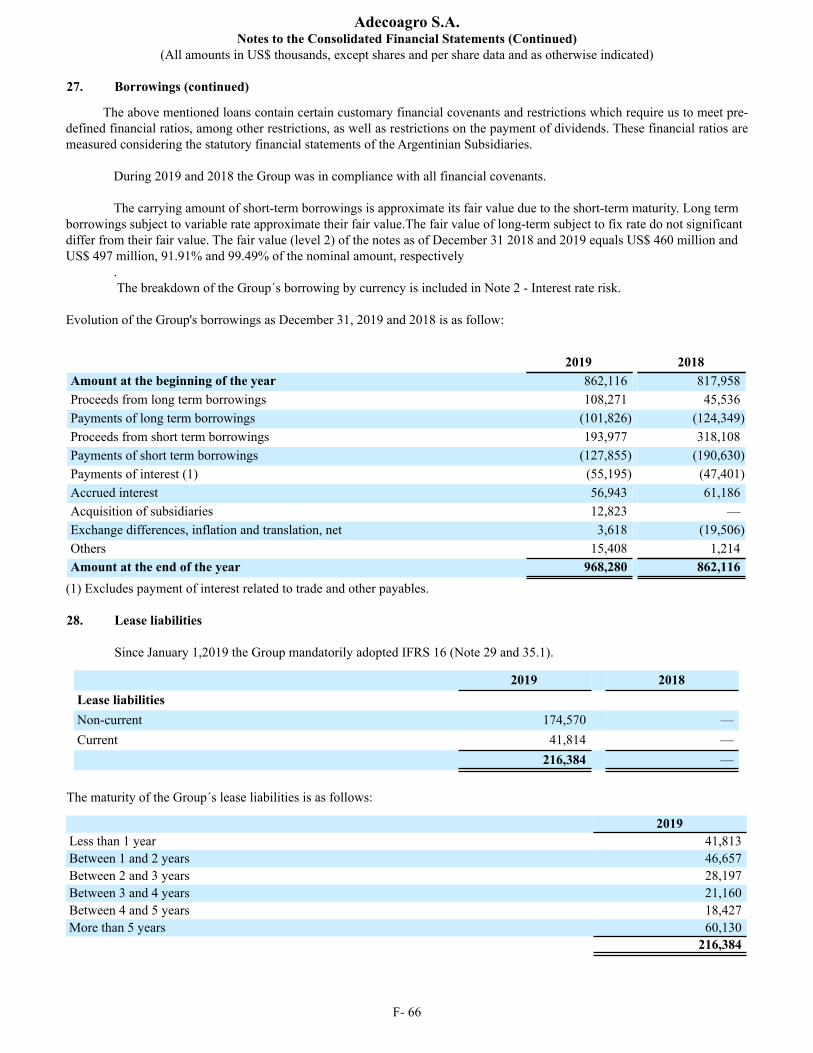
Adecoagro S.A.Notes to the Consolidated Financial Statements (Continued)
(All amounts in US$ thousands, except shares and per share data and as otherwise indicated)
27. Borrowings (continued)
F- 66
The above mentioned loans contain certain customary financial covenants and restrictions which require us to meet pre-defined financial ratios, among other restrictions, as well as restrictions on the payment of dividends. These financial ratios are measured considering the statutory financial statements of the Argentinian Subsidiaries.
During 2019 and 2018 the Group was in compliance with all financial covenants.
The carrying amount of short-term borrowings is approximate its fair value due to the short-term maturity. Long term borrowings subject to variable rate approximate their fair value.The fair value of long-term subject to fix rate do not significant differ from their fair value. The fair value (level 2) of the notes as of December 31 2018 and 2019 equals US$ 460 million and US$ 497 million, 91.91% and 99.49% of the nominal amount, respectively
. The breakdown of the Group´s borrowing by currency is included in Note 2 - Interest rate risk.
Evolution of the Group's borrowings as December 31, 2019 and 2018 is as follow:
2019 2018Amount at the beginning of the year 862,116 817,958Proceeds from long term borrowings 108,271 45,536Payments of long term borrowings (101,826) (124,349)Proceeds from short term borrowings 193,977 318,108Payments of short term borrowings (127,855) (190,630)Payments of interest (1) (55,195) (47,401)Accrued interest 56,943 61,186Acquisition of subsidiaries 12,823 —Exchange differences, inflation and translation, net 3,618 (19,506)Others 15,408 1,214Amount at the end of the year 968,280 862,116
(1) Excludes payment of interest related to trade and other payables.
28. Lease liabilities
Since January 1,2019 the Group mandatorily adopted IFRS 16 (Note 29 and 35.1).
2019 2018Lease liabilitiesNon-current 174,570 —Current 41,814 —
216,384 — The maturity of the Group´s lease liabilities is as follows:
2019Less than 1 year 41,813Between 1 and 2 years 46,657Between 2 and 3 years 28,197Between 3 and 4 years 21,160Between 4 and 5 years 18,427More than 5 years 60,130
216,384
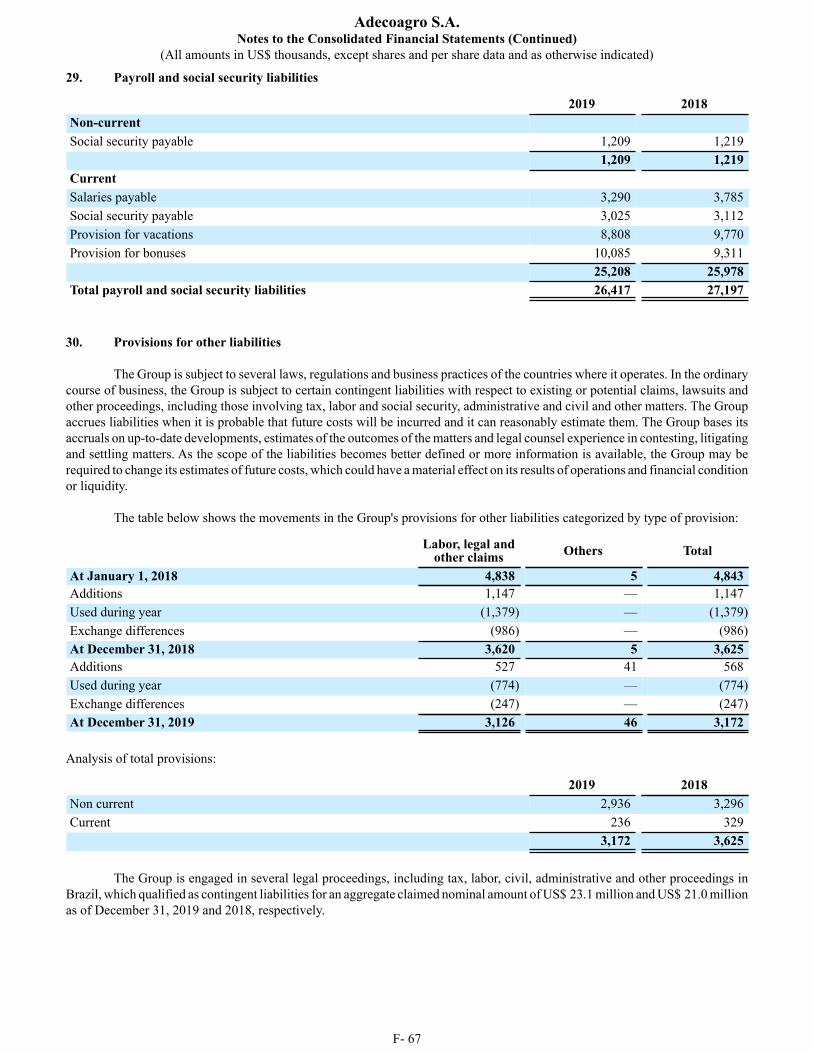
Adecoagro S.A.Notes to the Consolidated Financial Statements (Continued)
(All amounts in US$ thousands, except shares and per share data and as otherwise indicated)
F- 67
29. Payroll and social security liabilities
2019 2018Non-current Social security payable 1,209 1,219 1,209 1,219Current Salaries payable 3,290 3,785Social security payable 3,025 3,112Provision for vacations 8,808 9,770Provision for bonuses 10,085 9,311 25,208 25,978Total payroll and social security liabilities 26,417 27,197
30. Provisions for other liabilities
The Group is subject to several laws, regulations and business practices of the countries where it operates. In the ordinary course of business, the Group is subject to certain contingent liabilities with respect to existing or potential claims, lawsuits and other proceedings, including those involving tax, labor and social security, administrative and civil and other matters. The Group accrues liabilities when it is probable that future costs will be incurred and it can reasonably estimate them. The Group bases its accruals on up-to-date developments, estimates of the outcomes of the matters and legal counsel experience in contesting, litigating and settling matters. As the scope of the liabilities becomes better defined or more information is available, the Group may be required to change its estimates of future costs, which could have a material effect on its results of operations and financial condition or liquidity.
The table below shows the movements in the Group's provisions for other liabilities categorized by type of provision:
Labor, legal andother claims Others Total
At January 1, 2018 4,838 5 4,843Additions 1,147 — 1,147Used during year (1,379) — (1,379)Exchange differences (986) — (986)At December 31, 2018 3,620 5 3,625Additions 527 41 568Used during year (774) — (774)Exchange differences (247) — (247)At December 31, 2019 3,126 46 3,172
Analysis of total provisions:
2019 2018Non current 2,936 3,296Current 236 329 3,172 3,625
The Group is engaged in several legal proceedings, including tax, labor, civil, administrative and other proceedings in
Brazil, which qualified as contingent liabilities for an aggregate claimed nominal amount of US$ 23.1 million and US$ 21.0 millionas of December 31, 2019 and 2018, respectively.
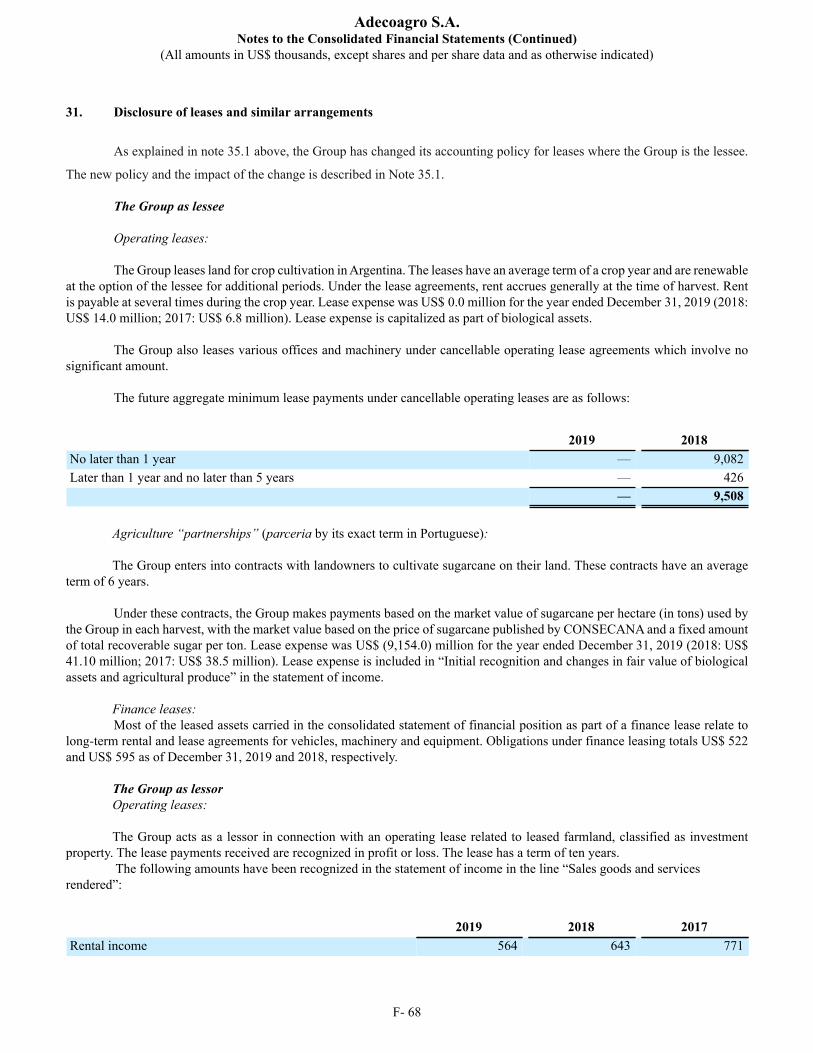
Adecoagro S.A.Notes to the Consolidated Financial Statements (Continued)
(All amounts in US$ thousands, except shares and per share data and as otherwise indicated)
F- 68
31. Disclosure of leases and similar arrangements
As explained in note 35.1 above, the Group has changed its accounting policy for leases where the Group is the lessee.
The new policy and the impact of the change is described in Note 35.1.
The Group as lessee Operating leases: The Group leases land for crop cultivation in Argentina. The leases have an average term of a crop year and are renewable
at the option of the lessee for additional periods. Under the lease agreements, rent accrues generally at the time of harvest. Rent is payable at several times during the crop year. Lease expense was US$ 0.0 million for the year ended December 31, 2019 (2018: US$ 14.0 million; 2017: US$ 6.8 million). Lease expense is capitalized as part of biological assets.
The Group also leases various offices and machinery under cancellable operating lease agreements which involve no
significant amount. The future aggregate minimum lease payments under cancellable operating leases are as follows:
2019 2018No later than 1 year — 9,082Later than 1 year and no later than 5 years — 426 — 9,508
Agriculture “partnerships” (parceria by its exact term in Portuguese): The Group enters into contracts with landowners to cultivate sugarcane on their land. These contracts have an average
term of 6 years. Under these contracts, the Group makes payments based on the market value of sugarcane per hectare (in tons) used by
the Group in each harvest, with the market value based on the price of sugarcane published by CONSECANA and a fixed amount of total recoverable sugar per ton. Lease expense was US$ (9,154.0) million for the year ended December 31, 2019 (2018: US$ 41.10 million; 2017: US$ 38.5 million). Lease expense is included in “Initial recognition and changes in fair value of biological assets and agricultural produce” in the statement of income.
Finance leases:
Most of the leased assets carried in the consolidated statement of financial position as part of a finance lease relate to long-term rental and lease agreements for vehicles, machinery and equipment. Obligations under finance leasing totals US$ 522 and US$ 595 as of December 31, 2019 and 2018, respectively.
The Group as lessor Operating leases: The Group acts as a lessor in connection with an operating lease related to leased farmland, classified as investment
property. The lease payments received are recognized in profit or loss. The lease has a term of ten years. The following amounts have been recognized in the statement of income in the line “Sales goods and services
rendered”:
2019 2018 2017Rental income 564 643 771
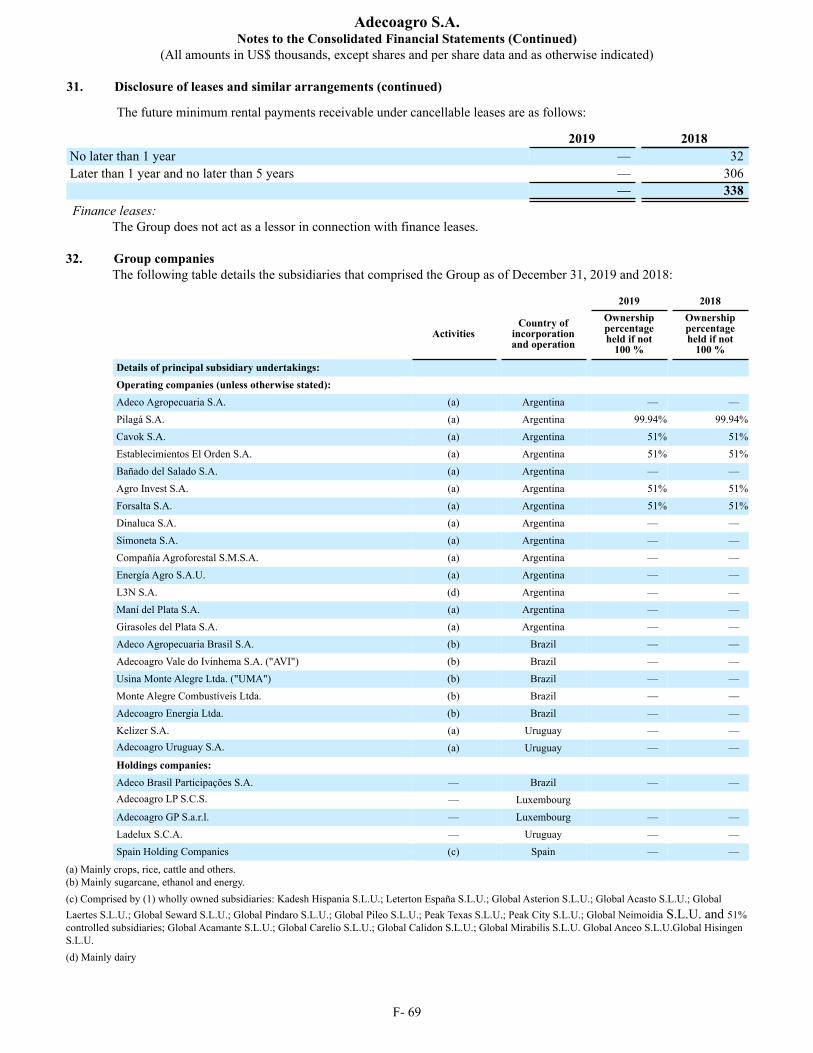
Adecoagro S.A.Notes to the Consolidated Financial Statements (Continued)
(All amounts in US$ thousands, except shares and per share data and as otherwise indicated)
31. Disclosure of leases and similar arrangements (continued)
F- 69
The future minimum rental payments receivable under cancellable leases are as follows:
2019 2018No later than 1 year — 32Later than 1 year and no later than 5 years — 306 — 338
Finance leases:The Group does not act as a lessor in connection with finance leases.
32. Group companiesThe following table details the subsidiaries that comprised the Group as of December 31, 2019 and 2018:
2019 2018
ActivitiesCountry of
incorporationand operation
Ownershippercentageheld if not
100 %
Ownershippercentageheld if not
100 %
Details of principal subsidiary undertakings: Operating companies (unless otherwise stated): Adeco Agropecuaria S.A. (a) Argentina — —Pilagá S.A. (a) Argentina 99.94% 99.94%Cavok S.A. (a) Argentina 51% 51%Establecimientos El Orden S.A. (a) Argentina 51% 51%Bañado del Salado S.A. (a) Argentina — —Agro Invest S.A. (a) Argentina 51% 51%Forsalta S.A. (a) Argentina 51% 51%Dinaluca S.A. (a) Argentina — —Simoneta S.A. (a) Argentina — —Compañía Agroforestal S.M.S.A. (a) Argentina — —Energía Agro S.A.U. (a) Argentina — —L3N S.A. (d) Argentina — —Maní del Plata S.A. (a) Argentina — —Girasoles del Plata S.A. (a) Argentina — —Adeco Agropecuaria Brasil S.A. (b) Brazil — —Adecoagro Vale do Ivinhema S.A. ("AVI") (b) Brazil — —Usina Monte Alegre Ltda. ("UMA") (b) Brazil — —Monte Alegre Combustíveis Ltda. (b) Brazil — —Adecoagro Energia Ltda. (b) Brazil — —Kelizer S.A. (a) Uruguay — —Adecoagro Uruguay S.A. (a) Uruguay — —Holdings companies: Adeco Brasil Participações S.A. — Brazil — —Adecoagro LP S.C.S. — LuxembourgAdecoagro GP S.a.r.l. — Luxembourg — —Ladelux S.C.A. — Uruguay — —Spain Holding Companies (c) Spain — —
(a) Mainly crops, rice, cattle and others.(b) Mainly sugarcane, ethanol and energy.(c) Comprised by (1) wholly owned subsidiaries: Kadesh Hispania S.L.U.; Leterton España S.L.U.; Global Asterion S.L.U.; Global Acasto S.L.U.; Global Laertes S.L.U.; Global Seward S.L.U.; Global Pindaro S.L.U.; Global Pileo S.L.U.; Peak Texas S.L.U.; Peak City S.L.U.; Global Neimoidia S.L.U. and 51% controlled subsidiaries; Global Acamante S.L.U.; Global Carelio S.L.U.; Global Calidon S.L.U.; Global Mirabilis S.L.U. Global Anceo S.L.U.Global Hisingen S.L.U.(d) Mainly dairy

Adecoagro S.A.Notes to the Consolidated Financial Statements (Continued)
(All amounts in US$ thousands, except shares and per share data and as otherwise indicated)
32. Group companies (continued)
F- 70
The percentage voting right for each principal subsidiary is the same as the percentage of capital stock held. Issued share capital represents only ordinary shares/ quotas, units or their equivalent. There are no preference shares or units issued in any subsidiary undertaking.
According to the laws of certain of the countries in which the Group operates, 5% of the profit of the year is separated to
constitute legal reserves until they reach legal capped amounts (20% of total capital). These legal reserves are not available for dividend distribution and can only be released to absorb losses. The Group’s joint ventures have not reached the legal capped amounts. 33. Related-party transactions
The following is a summary of the balances and transactions with related parties:
Related party Relationship Description of transactionIncome (loss) included in the
statement of incomeBalance receivable(payable)/(equity)
2019 2018 2017 2019 2018Directors and seniormanagement
Employment Compensation selectedemployees (5,232) (7,122) (7,040) (15,499) (16,353)
Girasoles del Plata S.A (ii) Joint venture Receivable from relatedparties (Note 19) (i) — — — — 8,337
Payables (Note 26) — — — — (194)
Sales of goods — 456 2,487 — —
Services — 210 88 — —
Interest income — 242 308 — —
(i) It includes US$ 8 million of a loan that accruing a 3% interest rate per year with the final maturity in 2022.(ii) Since February 2019, Girasoles del Plata S.A. (formerly CHS Agro S.A.) is fully part of the Group.
Adecoagro S.A.Notes to the Consolidated Financial Statements (Continued)
(All amounts in US$ thousands, except shares and per share data and as otherwise indicated)
F- 71
34. Critical accounting estimates and judgments
Critical accounting policies are those that are most important to the portrayal of the Group’s financial condition, results of operations and cash flows, and require management to make difficult, subjective or complex judgments and estimates about matters that are inherently uncertain. Management bases its estimates on historical experience and other assumptions that it believes are reasonable. The Group’s critical accounting policies are discussed below.
Actual results could differ from estimates used in employing the critical accounting policies and these could have a material impact on the Group’s results of operations. The Group also has other policies that are considered key accounting policies, such as the policy for revenue recognition. However, these other policies, which are discussed in the notes to the Group’s financial statements, do not meet the definition of critical accounting estimates, because they do not generally require estimates to be made or judgments that are difficult or subjective.
(a)Impairment of non-financial assets
At the date of each statement of financial position, the Group reviews the carrying amounts of its property, plant and equipment and finite lived intangible assets to determine whether there is any indication that those assets could have suffered an impairment loss. If any such indication exists, the recoverable amount of the asset is estimated in order to determine the extent, if any, of the impairment loss. Where the asset does not generate cash flows that are independently, the Group estimates the recoverable amount of the cash-generating unit to which the asset belongs. The Group’s property, plant and equipment items generally do not generate independent cash flows.
In the case of Goodwill, any goodwill acquired is allocated to the cash-generating unit (‘CGU’) expected to benefit from the business combination. CGU to which goodwill is allocated is tested for impairment annually, or more frequently if events or changes in circumstances indicate that the carrying amount of the CGU may be impaired. The carrying amount of the CGU is compared to its recoverable amount, which is the higher of fair value less costs to sell and the value in use. An impairment loss is recognized for the amount by which the carrying amount exceeds its recoverable amount. The impairment review requires management to undertake certain significant judgments, including estimating the recoverable value of the CGU to which goodwill is allocated, based on either fair value less costs-to-sell or the value-in-use, as appropriate, in order to reach a conclusion on whether it deems the goodwill is impaired or not.
For purposes of the impairment testing, each CGU represents the smallest identifiable group of assets that generate cash inflows that are largely independent of the cash inflows from other assets or group of assets.
Farmlands may be used for different activities that may generate independent cash flows. Those farmlands that are used for more than one segment activity (i.e. crops and cattle or rental income), the farmland is further subdivided into two or more CGUs, as appropriate, for purposes of impairment testing. For its properties in Brazil, management identified a farmland together with its related mill as separate CGUs. Most of the farmlands in Argentina and Uruguay are treated as single CGUs.
Based on these criteria, management identified a total amount of 40 CGUs as of September 30, 2019 and 37 CGUs as of September 30, 2018.
As of September 30, 2019 and 2018, due to the fact that there were no impairment indicators, the Group only tested those CGUs with allocated goodwill in Argentina and Brazil.
CGUs tested based on a fair-value-less-costs-to-sell model at September 30, 2019 and 2018:
As of September 30, 2019, the Group identified 12 CGUs in Argentina (2018: 11 CGUs) to be tested based on this model (all CGUs with allocated goodwill). Estimating the fair value less costs-to-sell is based on the best information available, and refers to the amount at which the CGU could be bought or sold in a current transaction between willing parties. Management may be assisted by the work of external advisors. When using this model, the Group applies the “sales comparison approach” as its method of valuing most properties, which relies on results of sales of similar agricultural properties to estimate the value of the CGU. This approach is based on the theory that the fair value of a property is directly related to the selling prices of similar properties.
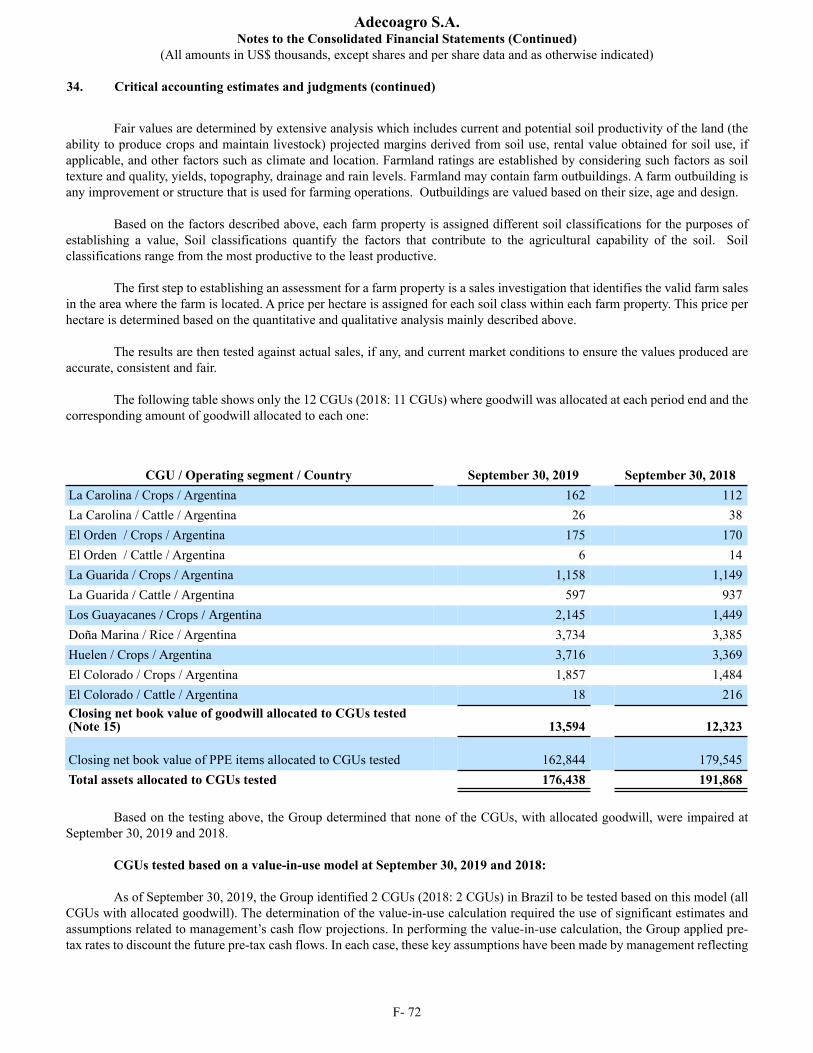
Adecoagro S.A.Notes to the Consolidated Financial Statements (Continued)
(All amounts in US$ thousands, except shares and per share data and as otherwise indicated)
34. Critical accounting estimates and judgments (continued)
F- 72
Fair values are determined by extensive analysis which includes current and potential soil productivity of the land (the ability to produce crops and maintain livestock) projected margins derived from soil use, rental value obtained for soil use, if applicable, and other factors such as climate and location. Farmland ratings are established by considering such factors as soil texture and quality, yields, topography, drainage and rain levels. Farmland may contain farm outbuildings. A farm outbuilding is any improvement or structure that is used for farming operations. Outbuildings are valued based on their size, age and design.
Based on the factors described above, each farm property is assigned different soil classifications for the purposes of establishing a value, Soil classifications quantify the factors that contribute to the agricultural capability of the soil. Soil classifications range from the most productive to the least productive.
The first step to establishing an assessment for a farm property is a sales investigation that identifies the valid farm sales in the area where the farm is located. A price per hectare is assigned for each soil class within each farm property. This price per hectare is determined based on the quantitative and qualitative analysis mainly described above.
The results are then tested against actual sales, if any, and current market conditions to ensure the values produced are accurate, consistent and fair.
The following table shows only the 12 CGUs (2018: 11 CGUs) where goodwill was allocated at each period end and the corresponding amount of goodwill allocated to each one:
CGU / Operating segment / Country September 30, 2019 September 30, 2018La Carolina / Crops / Argentina 162 112La Carolina / Cattle / Argentina 26 38El Orden / Crops / Argentina 175 170El Orden / Cattle / Argentina 6 14La Guarida / Crops / Argentina 1,158 1,149La Guarida / Cattle / Argentina 597 937Los Guayacanes / Crops / Argentina 2,145 1,449Doña Marina / Rice / Argentina 3,734 3,385Huelen / Crops / Argentina 3,716 3,369El Colorado / Crops / Argentina 1,857 1,484El Colorado / Cattle / Argentina 18 216Closing net book value of goodwill allocated to CGUs tested(Note 15) 13,594 12,323
Closing net book value of PPE items allocated to CGUs tested 162,844 179,545Total assets allocated to CGUs tested 176,438 191,868
Based on the testing above, the Group determined that none of the CGUs, with allocated goodwill, were impaired at September 30, 2019 and 2018. CGUs tested based on a value-in-use model at September 30, 2019 and 2018:
As of September 30, 2019, the Group identified 2 CGUs (2018: 2 CGUs) in Brazil to be tested based on this model (all CGUs with allocated goodwill). The determination of the value-in-use calculation required the use of significant estimates and assumptions related to management’s cash flow projections. In performing the value-in-use calculation, the Group applied pre-tax rates to discount the future pre-tax cash flows. In each case, these key assumptions have been made by management reflecting
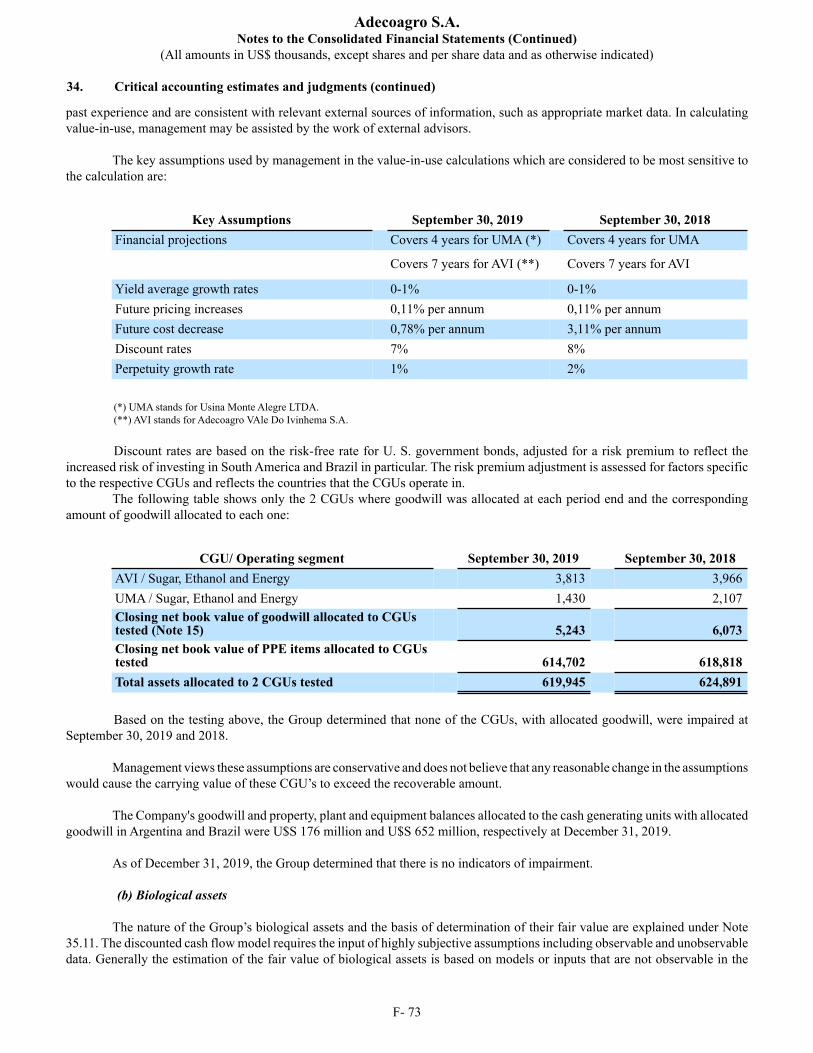
Adecoagro S.A.Notes to the Consolidated Financial Statements (Continued)
(All amounts in US$ thousands, except shares and per share data and as otherwise indicated)
34. Critical accounting estimates and judgments (continued)
F- 73
past experience and are consistent with relevant external sources of information, such as appropriate market data. In calculating value-in-use, management may be assisted by the work of external advisors.
The key assumptions used by management in the value-in-use calculations which are considered to be most sensitive to the calculation are:
Key Assumptions September 30, 2019 September 30, 2018Financial projections Covers 4 years for UMA (*) Covers 4 years for UMA
Covers 7 years for AVI (**) Covers 7 years for AVI
Yield average growth rates 0-1% 0-1%Future pricing increases 0,11% per annum 0,11% per annumFuture cost decrease 0,78% per annum 3,11% per annumDiscount rates 7% 8%Perpetuity growth rate 1% 2%
(*) UMA stands for Usina Monte Alegre LTDA. (**) AVI stands for Adecoagro VAle Do Ivinhema S.A.
Discount rates are based on the risk-free rate for U. S. government bonds, adjusted for a risk premium to reflect the increased risk of investing in South America and Brazil in particular. The risk premium adjustment is assessed for factors specific to the respective CGUs and reflects the countries that the CGUs operate in.
The following table shows only the 2 CGUs where goodwill was allocated at each period end and the corresponding amount of goodwill allocated to each one:
CGU/ Operating segment September 30, 2019 September 30, 2018AVI / Sugar, Ethanol and Energy 3,813 3,966UMA / Sugar, Ethanol and Energy 1,430 2,107Closing net book value of goodwill allocated to CGUstested (Note 15) 5,243 6,073Closing net book value of PPE items allocated to CGUstested 614,702 618,818Total assets allocated to 2 CGUs tested 619,945 624,891
Based on the testing above, the Group determined that none of the CGUs, with allocated goodwill, were impaired at September 30, 2019 and 2018.
Management views these assumptions are conservative and does not believe that any reasonable change in the assumptions would cause the carrying value of these CGU’s to exceed the recoverable amount.
The Company's goodwill and property, plant and equipment balances allocated to the cash generating units with allocated goodwill in Argentina and Brazil were U$S 176 million and U$S 652 million, respectively at December 31, 2019.
As of December 31, 2019, the Group determined that there is no indicators of impairment.
(b) Biological assets The nature of the Group’s biological assets and the basis of determination of their fair value are explained under Note
35.11. The discounted cash flow model requires the input of highly subjective assumptions including observable and unobservable data. Generally the estimation of the fair value of biological assets is based on models or inputs that are not observable in the
Adecoagro S.A.Notes to the Consolidated Financial Statements (Continued)
(All amounts in US$ thousands, except shares and per share data and as otherwise indicated)
34. Critical accounting estimates and judgments (continued)
F- 74
market and the use of unobservable inputs is significant to the overall valuation of the assets. Unobservable inputs are determined based on the best information available, for example by reference to historical information of past practices and results, statistical and agronomical information, and other analytical techniques. The discounted cash flow model includes significant assumptions relating to the cash flow projections including future costs of harvesting and other costs, and estimated discount rate.
Market prices are generally determined by reference to observable data in the principal market for the agricultural produce. Harvesting costs and other costs are estimated based on historical and statistical data. Yields are estimated based on several factors including the location of the farmland and soil type, environmental conditions, infrastructure and other restrictions and growth at the time of measurement. Yields are subject to a high degree of uncertainty and may be affected by several factors out of the Group’s control including but not limited to extreme or unusual weather conditions, plagues and other crop diseases, among other factors.
The significant assumptions discussed above are highly sensitive. Reasonable shifts in assumptions including but not
limited to increases or decreases in prices, costs and discount factors used would result in a significant increase or decrease to the fair value of biological assets. In addition, cash flows are projected over a number of years and based on estimated production. Estimates of production in themselves are dependent on various assumptions, in addition to those described above, including but not limited to several factors such as location, environmental conditions and other restrictions. Changes in these estimates could materially impact on estimated production, and could therefore affect estimates of future cash flows used in the assessment of fair value (see Note 16).
(c) Income taxes The Group is subject to income taxes in numerous jurisdictions. Significant judgment is required in determining the
worldwide provision for income taxes. There are many transactions and calculations for which the ultimate tax determination is uncertain. The Group recognizes liabilities for anticipated tax audit issues based on estimates of whether additional taxes will be due. Where the final tax outcome of these matters is different from the amounts that were initially recorded, such differences will impact the current and deferred income tax assets and liabilities in the period in which such determination is made.
Deferred tax assets are reviewed each reporting date and reduced to the extent that it is no longer probable that sufficient taxable income will be available to allow all or part of the asset to be settled. Deferred tax assets and liabilities are not discounted. The ultimate realization of deferred tax assets is dependent upon the generation of future taxable income during the periods in which those temporary differences become deductible. Management considers the scheduled reversal of deferred tax liabilities, projected future taxable income and tax planning strategies in making this assessment (see Note 10).
(d) Fair value for farmlands and investment property
Property, plant and equipment
Farmlands are recognized at fair value based on periodic, but at least annual, valuations prepared by an external independent expert. A revaluation reserve is credited in shareholders’ equity. The valuation is determined using sales Comparison Approach. Sale prices of comparable properties are adjusted considering the specific aspects of each property, the most relevant premise being the price per hectare (Level 3) (see Note 12).
Investment property
Investment property consists of farmland for rental or for capital appreciation and not used in production or for sale in the ordinary course of business, and it is measured at fair value. The changes of the Fair value, which is based on an independent external expert, impacts the profit and loss of the period, in the line item Other operating income, net (see Note 14).
Adecoagro S.A.Notes to the Consolidated Financial Statements (Continued)
(All amounts in US$ thousands, except shares and per share data and as otherwise indicated)
F- 75
35. Summary of significant accounting policies
The principal accounting policies applied in the preparation of these consolidated financial statements are set out below. These policies have been consistently applied to all the years presented, unless otherwise stated.
Financial reporting in a hyperinflation economy
IAS 29 “Financial Reporting in Hyperinflationary Economies” requires that the financial statements of entities whose functional currency is that of a hyperinflationary economy to be adjusted for the effects of changes in a suitable general price index and to be expressed in terms of the current unit of measurement at the closing date of the reporting period. Accordingly, the inflation produced from the date of acquisition or from the revaluation date, as applicable, must be computed in the non-monetary items.
In order to conclude on whether an economy is categorized as hyperinflationary under the terms of IAS 29, the Standard details a series of factors to be considered, including the existence of a cumulative inflation rate in three years that approximates or exceeds 100 %.
Considering a significant increase in inflation during 2018, which exceeded the 100% three-year cumulative inflation rate, and that the rest of the indicators do not contradict the conclusion that Argentina should be considered a hyperinflationary economy for accounting purposes. It is agreed that there is sufficient evidence to conclude that Argentina is a hyperinflationary economy under the terms of IAS 29 and that as from July 1, 2018, it will apply IAS 29 as from that date in the financial reporting of its subsidiaries and associates with Argentine peso as functional currency.
Financial statements of a foreign entity with a functional currency of a country that has a highly inflationary economy, are restated to reflect changes in the general price level or index in that country before translation into U.S. Dollars. In adjusting for hyperinflation, a general price index is applied to all non-monetary items in the financial statements (including equity) and the resulting gain or loss, which is the gain or loss on the entity's net monetary position, is recognized in the income statement. Monetary items in the closing statement of financial position are not adjusted. The Group treated all Argentine subsidiaries as a hyperinflationary economy as all of them have argentine peso as functional currency. The results and financial position of all foreign entities with a functional currency of a country that has a highly inflationary economy are translated at closing rates after the restatement for changes in the general purchasing power argentine peso.
The inflation adjustment on the initial balances was calculated by means of conversion factor derived from the Argentine price indexes published by the National Institute of Statistics and the year-over-year change in the index was 1.538.
The main procedures for the above-mentioned adjustment are as follows:
• Monetary assets and liabilities which are carried at amounts current at the balance sheet date are not restated because they are already expressed in terms of the monetary unit current at the balance sheet date.
• Non-monetary assets and liabilities which are not carried at amounts current at the balance sheet date, and components of shareholders' equity are adjusted by applying the relevant conversion factors.
• All items in the income statement are restated by applying the relevant conversion factors. The company has elected not to segregate the impact of inflation over financial results.
• The effect of inflation on the Company’s net monetary position is included in the income statement, in "Other financial results" (Note 9).
• The ongoing application of the re-translation of comparative amounts to closing exchanges rates under IAS 21 and the hyperinflation adjustments required by IAS 29 will lead to a difference in addition to the difference arising on the adoption of hyperinflation accounting.
Adecoagro S.A.Notes to the Consolidated Financial Statements (Continued)
(All amounts in US$ thousands, except shares and per share data and as otherwise indicated)
35. Summary of significant accounting policies (continued)
F- 76
The comparative figures in these consolidated financial statements presented in a stable currency are not adjusted for subsequent changes in the price level or exchange rates. This resulted in an initial difference, arising on the adoption of hyperinflation accounting, between the closing equity of the previous year and the opening equity of the current year. The Company recognized this initial difference directly in equity.
35.1 Basis of preparation and presentation
The consolidated financial statements of the Group have been prepared in accordance with International Financial Reporting Standards (IFRS) of the International Accounting Standards Board (IASB) and the Interpretations of the International Financial Reporting Interpretations Committee (IFRIC) and in accordance with IFRS as adopted by European Union. All IFRS issued by the IASB, effective at the time of preparing these consolidated financial statements have been applied.
The consolidated financial statements have been prepared under the historical cost convention as modified by financial assets and financial liabilities (including derivative instruments) at fair value through profit or loss, biological assets and agricultural produce at the point of harvest and farmlands measured at fair value.
The preparation of consolidated financial statements in conformity with IFRS requires the use of certain critical accounting
estimates. It also requires management to exercise its judgment in the process of applying the Group’s accounting policies. The areas involving a higher degree of judgment or complexity, or areas where assumptions and estimates are significant to the consolidated financial statements are disclosed in Note 34.
Description of accounting policies changed during the fiscal-year.
Leases
For fiscal years beginning on January 1st, 2019 and onward the adoption of IFRS 16 - Leases it is mandatory. We disclose herein the new accounting policies that have been applied from January 1, 2019, where they are different to those applied in prior periods.
IFRS 16 was adopted following the simplified approach, without restating comparative. The reclassifications and the adjustments arising from the new lease accounting rules are directly recognized in the opening balance sheet on January 1, 2019.
The Company has adopted IFRS 16 Leases from January 1, 2019, but has not restated comparatives for previous reporting period as permitted under the specific transition provisions in the Standard.
On adoption of IFRS 16, the Company recognized lease liabilities in relation to leases which had previously been classified as ‘operating leases’ under the principles of IAS 17 Leases. In the previous year, the Company only recognize lease liabilities in relation to leases that were classified as "Finance leases" under IAS 17 Leases. For the initial recognition, these liabilities were measured at the present value of the remaining lease payments, discounted using the lessee’s incremental borrowing rate as of January 1, 2019.
The adoption of IFRS 16 Leases from January 1, 2019, resulted in changes in accounting policies and adjustments to the amounts recognized in the financial statements.
Right-of-use assets
The total of the right-of-use assets are included under such type in the Statement of Financial Position:
Right of use Lease liabilitiesClosing balance as of December 31, 2018 — —Initial recognition 204,937 (204,937)Reclassifications from Trade and other receivables, net — 26,794Opening balance as of January 1, 2019 204,937 (178,143)
Adecoagro S.A.Notes to the Consolidated Financial Statements (Continued)
(All amounts in US$ thousands, except shares and per share data and as otherwise indicated)
35.1 Basis of preparation and presentation (continued)
F- 77
The impact of the adoption of IFRS 16 did not have effect in retained earnings at January 1, 2019.
Initial measurement of lease liability:
2019Operating lease commitments disclosed as of December 31, 2018 9,508Finance leases 595(Less): short-term leases not recognised as a liability (9,308)Add: adjustments as a result of a different treatment 199,929Add: adjustments relating to changes in the index or rate affecting variable payments 4,213Initial recognition of lease liability 204,937
According with the adoption of IFRS 16, the new accounting policy for leases is as follows:
Leases are recognized as a right-of-use asset and corresponding liability at the date of which the leased asset is available for use by the group. Each lease payment is allocated between the liability and finance cost. The finance cost is charged to profit or loss over the lease period so as to produce a constant periodic rate of interest on the remaining balance of the liability for each period. The right-of-use asset is depreciated over the shorter of the asset's useful life and the lease term on a straight-line basis.
In determining the lease term, the Company considers all facts and circumstances that create an economic incentive to exercise an extension option, or not exercise a termination option. Extension options (or periods after termination options) are only included in the lease term if the lease is reasonably certain to be extended (or not terminated).
Short term leases are recognized on a straight line basis as an expense in the income statement.
Accounting as lessee
The Company recognizes a right-of-use asset and a lease liability at the commencement date of each lease contract that grants the right to control the use of an identified asset during a period of time. The commencement date is the date in which the lessor makes an underlying asset available for use by the lessee.
The Company applied exemptions for leases with a duration lower than 12 months, with a value lower than thirty thousand dollars and/or with clauses related to variable payments. These leases have been considered as short-term leases and, accordingly, no right-of-use asset or lease liability have been recognized.
The weighted average lessee’s incremental borrowing rate applied to lease liabilities recognised in the statement of financial position at the date of initial application was 7.06%.
At initial recognition, the right-of-use asset is measured considering:
• The value of the initial measurement of the lease liability;• Any lease payments made at or before the commencement date, less any lease incentives; and• Any initial direct costs incurred by the lessee; and
After initial recognition, the right-of-use assets are measured at cost, less any accumulated depreciation and/or impairment losses, and adjusted for any re-measurement of the lease liability.
Adecoagro S.A.Notes to the Consolidated Financial Statements (Continued)
(All amounts in US$ thousands, except shares and per share data and as otherwise indicated)
35.1 Basis of preparation and presentation (continued)
F- 78
Depreciation of the right-of-use asset is calculated using the straight-line method over the estimated duration of the lease contract.
The lease liability is initially measured at the present value of the lease payments that are not paid at such date, including the following concepts:
• Variable lease payments that depend on an index or rate, initially measured using the index or rate as of the commencement date;
• Amounts expected to be payable by the lessee under residual value guarantees;• The exercise price of a purchase option if the lessee is reasonably certain to exercise that option; and• Payments of penalties for terminating the lease, if the lease term reflects the lessee exercising an option to terminate the
lease;• Fixed payments, less any lease incentives receivable;• Variable lease payments that depend on an index or rate, initially measured using the index or rate as of the commencement
date;• Amounts expected to be payable by the lessee under residual value guarantees;• The exercise price of a purchase option if the lessee is reasonably certain to exercise that option; and• Payments of penalties for terminating the lease, if the lease term reflects the lessee exercising an option to terminate the
lease.
After the commencement date, the Company measures the lease liability by:
• Increasing the carrying amount to reflect interest on the lease liability;• Reducing the carrying amount to reflect lease payments made; and• Re-measuring the carrying amount to reflect any reassessment or lease modifications.
The above mentioned inputs for the valuation of the right of use assets and lease liabilities including the determination of the contracts within the scope of the standard, the contract term ant interest rate used in the discounted cash flow involved a high degree of management´s estimations.
Early adoption of IFRS 3 Amendment
The IASB has issued narrow-scope amendments to IFRS 3,'Business combinations', to improve the definition of a business.
The amended definition emphasizes that the output of a business is to provide goods and services to customers, whereas the previous definition focused on returns in the form of dividends, lower costs or other economic benefits to investors and others.
Entities are required to apply the amendments to transactions for which the acquisition date is on or after the beginning of the first annual reporting period beginning on or after 1 January 2020. The Company applied this amendment form the period beginning on 1 January 2019.
Description of accounting policies changed during the previous year.
During the period ended September 30, 2018, the group has adopted the revaluation model for its Farmlands within Property, plant and equipment. Previously, the Company valued all these group of assets under the cost model. These amendments have resulted in an increase of Property, plant and equipment of US$ 545 million. This higher valuation resulted in an increase of the deferred tax liability of US$ 139 million. This change in accordance with IAS 16 is applied prospectively.
Also the Company also adopted the revaluation model for its Investment property. The higher valuation resulted in an increase in Retained earning of US$ 45 million; an increase in Investment property of US$ 40 million as of December 31, 2017and an increase in Deferred tax liability of US$ 12 million.
Adecoagro S.A.Notes to the Consolidated Financial Statements (Continued)
(All amounts in US$ thousands, except shares and per share data and as otherwise indicated)
F- 79
35.2 Scope of consolidation
The consolidated financial statements include the results of the Company and all of its subsidiaries from the date that control commences to the date that control ceases. They also include the Group’s share of the net income of its jointly-controlled entities on an equity-accounted basis from the point at which joint control commences, to the date that it ceases.
(a) Subsidiaries Subsidiaries are all entities over which the Group has control. The Group controls an entity when the Group is exposed
to, or has rights to, variable returns from its involvement with the entity and has the ability to affect those returns through its power over the entity. Subsidiaries are fully consolidated from the date that control commences and deconsolidated from the date that control ceases.
The Group uses the acquisition method of accounting to account for business combinations. The consideration transferred
for the acquisition of a subsidiary is the fair value of the assets transferred, the liabilities incurred and the equity interests issued by the Group. The consideration transferred includes the fair value of any asset or liability resulting from a contingent consideration arrangement. Acquisition-related costs are expensed as incurred. Identifiable assets acquired and liabilities and contingent liabilities assumed in a business combination are measured initially at their fair values at the acquisition date.
The Group recognizes any non-controlling interest in the acquiree on an acquisition-by-acquisition basis either at fair
value or at the non-controlling interest’s proportionate share of the acquiree’s net assets. The excess of the consideration transferred, the amount of any non-controlling interest in the acquiree and the acquisition-
date fair value of any previous equity interest in the acquiree over the fair value of the identifiable net assets acquired is recorded as goodwill.
Inter-company transactions, balances and unrealized gains on transactions between group companies are eliminated.
Unrealized losses are also eliminated. Accounting policies of subsidiaries have been changed where necessary to ensure consistency with the policies adopted by the Group.
(b) Changes in ownership interests in subsidiaries without change of control
Transactions with non-controlling interests that do not result in loss of control are accounted for as equity transactions – that is, as transactions with the owners in their capacity as owners. The difference between the fair value of any consideration paid and the relevant share acquired of the carrying value of net assets of the subsidiary is recorded in equity. Gains or losses on disposals to non-controlling interests are also recorded in equity.
(c) Disposal of subsidiaries
When the Group ceases to have control any retained interest in the entity is re-measured to its fair value at the date when control is lost, with the change in carrying amount recognized in profit or loss. The fair value is the initial carrying amount for the purposes of subsequently accounting for the retained interest as an associate, joint venture or financial asset. In addition, any amount previously recognized in other comprehensive income in respect of that entity is accounted for as if the Group had directly disposed of the related assets or liabilities. This may mean that amounts previously recognized in other comprehensive income are reclassified to profit or loss.
(d) Joint arrangements Under IFRS 11, investments in joint arrangements are classified as either joint operations or joint ventures depending on
the contractual rights and obligations each investor has rather than the legal structure of the joint arrangement. The Group has assessed the nature of its joint arrangements and determined them to be joint ventures and value them
under the equity method.
Adecoagro S.A.Notes to the Consolidated Financial Statements (Continued)
(All amounts in US$ thousands, except shares and per share data and as otherwise indicated)
F- 80
35.2 Scope of consolidation (continued)
Under the equity method of accounting, interests in joint ventures are initially recognized in the consolidated statement of financial position at cost and adjusted thereafter to recognize the Group’s share of the post-acquisition of profits or losses and movements in other comprehensive income, respectively. When the share of losses of an investee equals or exceeds the carrying amount of an investment the Group discontinue applying the equity method, the investment is reduced to zero and does not record additional losses. If the investee subsequently reports net income, the Group would resume applying the equity method only after its share of that net income equals the share of net losses not recognized during the period the equity method was suspended.
Unrealized gains on transactions between the Group and its joint ventures are eliminated to the extent of the Group’s interest in the joint ventures. Unrealized losses are also eliminated unless the transaction provides evidence of an impairment of the asset transferred. Accounting policies of the joint ventures have been changed where necessary to ensure consistency with the policies adopted by the Group.
35.3 Segment reporting
According to IFRS 8, operating segments are identified based on the ‘management approach’. This approach stipulates
external segment reporting based on the Group’s internal organizational and management structure and on internal financial reporting to the chief operating decision maker (the Management Committee in the case of the Company) 35.4 Foreign currency translation
(a) Functional and presentation currency
Items included in the financial statements of each of the Group’s entities are measured using the currency of the primary economic environment in which the entity operates (‘the functional currency’). The consolidated financial statements are presented in US dollars, which is the Group’s presentation currency.
(b) Transactions and balances
Foreign currency transactions are translated into the functional currency using the exchange rates prevailing at the dates
of the transactions or valuation where items are remeasured. Foreign exchange gains and losses resulting from the settlement of such transactions and from the translation at year-end exchange rates of monetary assets and liabilities denominated in foreign currencies are recognized in the statement of income, in the line Item “Finance income” or “Finance cost”, as appropriate.
(c) Group companies The results and financial position of Group entities (except those that has the currency of a hyper-inflationary economy
- Argentine subsidiaries) that have a functional currency different from the presentation currency are translated into the presentation currency as follows:
• assets and liabilities for each statement of financial position presented are translated at the closing rate at the date
of that statement of financial position;• income and expenses for each statement of income are translated at average exchange rates (unless this average is
not a reasonable approximation of the cumulative effect of the rates prevailing on the transaction dates, in which case income and expenses are translated at the rate on the dates of the transactions); and
• all resulting exchange differences are recognized as a separate component of equity.
When a foreign operation is partially disposed of or sold, exchange differences that were recorded in equity are recognized in the statement of income as part of the gain or loss on sale.
Goodwill and fair value adjustments arising on the acquisition of a foreign entity are treated as assets and liabilities of the foreign entity and translated at the closing rate.
Adecoagro S.A.Notes to the Consolidated Financial Statements (Continued)
(All amounts in US$ thousands, except shares and per share data and as otherwise indicated)
F- 81
35.5 Property, plant and equipment
Farmlands are initially recorded at fair value and subsequently under the revaluation model based on periodic, but at least annual, valuations prepared by an external independent expert. A revaluation reserve is credited in shareholders’ equity. All other property, plant and equipment is recorded at cost, less accumulated depreciation and impairment losses, if any. Historical cost comprises the purchase price and any costs directly attributable to the acquisition. Under the definition of Property plant and equipment is included the bearer plants, such as sugarcane and coffee trees.
Where individual components of an item of property, plant and equipment have different useful lives, they are accounted
for as separate items, which are depreciated separately. Subsequent costs are included in the asset’s carrying amount or recognized as a separate asset, as appropriate, only when
it is probable that future economic benefits associated with the item will flow to the Group and the cost of the item can be measured reliably. The carrying amount of the replaced part is derecognized. All other repairs and maintenance are charged to the statement of income when they are incurred.
The depreciation methods and periods used by the group are disclosed in Note 12. Gains and losses on disposals are determined by comparing the proceeds with the carrying amount and are recognized
within “Other operating income, net” in the consolidated statement of income.
35.6 Investment property Investment property consists of farmland for rental or for capital appreciation and not used in production or for sale in
the ordinary course of business, and it is measured at fair value net of any impairment losses if any. The changes of the Fair value, which is based on an independent external expert, impacts the profit and loss of the period, in the line item Other operating income, net.
35.7 Leases
As explained in note 35.1 above, the Group has changed its accounting policy for leases where the Group is the lessee.
The new policy and the impact of the change is described in Note 35.1. Until December 31, 2018 the Group classified its leases at the inception as finance or operating leases. Leases were classified as finance leases whenever the terms of the lease transfer substantially all the risks and rewards of ownership to the lessee. All other leases were classified as operating leases and charged to the statements of income in a straight-line basis over the period of the lease. Finance leases are capitalized at the lease’s inception at the lower of the fair value of the leased property and the present value of the minimum lease payments. The corresponding rental obligations, net of finance charges, were included as “Borrowings”. From 2019 onwards, leases are accounted under the IFRS 16.
35.8 Goodwill
Goodwill represents future economic benefits arising from assets that are not capable of being individually identified and
separately recognized by the Group on an acquisition. Goodwill on acquisition is initially measured at cost. being the excess of the consideration over the fair value of the Group’s share of net assets of the acquired subsidiary undertaking at the acquisition date. Following initial recognition, goodwill is measured at cost less any accumulated impairment losses. It is allocated to those cash generating units expected to benefit from the acquisition for the purpose of impairment testing. Goodwill arising on the acquisition of subsidiaries is included within “Intangible assets” on the statement of financial position. Goodwill arising on the acquisition of foreign entities is treated as an asset of the foreign entity denominated in the local currency and translated at the closing rate.
Adecoagro S.A.Notes to the Consolidated Financial Statements (Continued)
(All amounts in US$ thousands, except shares and per share data and as otherwise indicated)
F- 82
35.8 Goodwill (continued)
Goodwill is not amortized but tested for impairment on an annual basis, or more frequently if there is an indication of impairment (see Note 34 (a)). Gains and losses on the disposal of a Group entity include any goodwill relating to the entity sold (see Note 35.10).
35.9 Other intangible assets
Other intangible assets that are acquired by the Group, which have finite useful lives, are measured at cost less accumulated amortization and impairment losses, if any. These intangible assets comprise trademarks and computer software and are amortized in the statement of income on a straight-line basis over their estimated useful lives estimated to be 10 to 20 years and 3 to 5 years, respectively.
35.10 Impairment of assets
Goodwill The Company conducts an impairment test annually or more frequently if events or changes in circumstances indicate
that the carrying amount may not be recoverable. An impairment loss is recognized for the amount by which the carrying amount exceeds its recoverable amount. For the purpose of impairment testing, assets are grouped at the lowest levels for which there are separately identifiable cash flows, known as cash-generating units. If the recoverable amount of the cash-generating unit is less than its carrying amount , the impairment loss is allocated first to reduce the carrying amount of any goodwill allocated to the cash generating unit and then to the other assets of the unit pro-rata on the basis of the carrying amount of each asset may in the unit. Impairment losses recognized for goodwill cannot be reversed in a subsequent period. Recoverable amount is the higher of the fair value less costs to sell and value in use. In determining the value in use, the estimated future cash flows are discounted to their present value using a pre-tax discount rate that reflects current market assessments of the time value of money and the risks specific to the asset for which the estimates of future cash flows have not been adjusted (see Note 34 (a) for details).
Property, plant and equipment and finite lived intangible assets At each statement of financial position date, the Group reviews the carrying amounts of its property, plant and equipment
and other intangible assets which have finite lives to determine whether there is any indication that those assets have suffered an impairment loss. If any such indication exists, the recoverable amount of the asset is estimated in order to determine the extent, if any, of the impairment loss. Where the asset does not generate cash flows that are independent from other assets, the Group estimates the recoverable amount of the cash-generating unit to which the asset belongs.
If the recoverable amount of an asset or cash-generating unit is estimated to be less than its carrying amount, that carrying
amount is reduced to its recoverable amount. An impairment loss is recognized immediately in the statement of income. Where an impairment loss subsequently reverses, the carrying amount of the asset or cash-generating unit is increased to
the revised estimate of its recoverable amount, not to exceed the carrying amount that would have been determined had no impairment loss been recognized for the asset or cash-generating unit in prior years. A reversal of an impairment loss is recognized immediately in the statement of income.
35.11 Biological assets
Biological assets comprise growing crops (mainly corn, wheat, soybeans, sunflower and rice), sugarcane, coffee and livestock (growing herd and cattle for dairy production).
The Group distinguishes between consumable and bearer biological assets, and between mature and immature biological
assets. “Consumable” biological assets are those assets that may be harvested as agriculture produce or sold as biological assets, for example livestock intended for dairy production. “Bearer” biological assets are those assets capable of producing more than one harvest, for example sugarcane or livestock from which raw milk is produced. “Mature” biological assets are those that have
Adecoagro S.A.Notes to the Consolidated Financial Statements (Continued)
(All amounts in US$ thousands, except shares and per share data and as otherwise indicated)
35.11 Biological assets (continued)
F- 83
attained harvestable specifications (for consumable biological assets) or are able to sustain regular harvests (for bearer biological assets). “Immature” biological assets are those assets other than mature biological assets.
Costs are capitalized as biological assets if, and only if, (a) it is probable that future economic benefits will flow to the
entity, and (b) the cost can be measured reliably. The Group capitalizes costs such as: planting, harvesting, weeding, seedlings, irrigation, agrochemicals, fertilizers and a systematic allocation of fixed and variable production overheads that are directly attributable to the management of biological assets, among others. Costs that are expensed as incurred include administration and other general overhead and unallocated production overhead, among others.
Biological assets, both at initial recognition and at each subsequent reporting date, are measured at fair value less costs to sell, except where fair value cannot be reliably measured. Cost approximates fair value when little biological transformation has taken place since the costs were originally incurred or the impact of biological transformation on price is not expected to be material.
Gains and losses that arise on measuring biological assets at fair value less costs to sell and measuring agricultural produce
at the point of harvest at fair value less costs to sell are recognized in the statement of income in the period in which they arise in the line item “Initial recognition and changes in fair value of biological assets and agricultural produce”.
Where there is an active market for a biological asset or agricultural produce, quoted market prices in the most relevant
market are used as a basis to determine the fair value. Otherwise, when there is no active market or market-determined prices are not available, fair value of biological assets is determined through the use of valuation techniques.
Therefore, the fair value of biological assets is generally derived from the expected discounted cash flows of the related
agricultural produce. The fair value of the agricultural produce at the point of harvest is generally derived from market determined prices. A general description of the determination of fair values based on the Company’s business segments follow:
• Growing crops including rice:
Growing crops including rice, for which biological growth is not significant, are measured at cost, which approximates fair value. Expenditure on growing crops includes land preparation expenses and other direct expenses incurred during the sowing period including labor, seedlings, agrochemicals and fertilizers among others.
Otherwise, biological assets are measured at fair value less estimated point-of-sale costs at initial recognition and at any
subsequent period. Point-of-sale costs include all costs that would be necessary to sell the assets The fair value of growing crops including rice is measured based on a formula, which takes into consideration the estimated
crop yields, estimated market prices and costs, and discount rates. Yields are determined based on several factors including location of farmland, environmental conditions and other restrictions and growth at the time of measurement. Yields are multiplied by sown hectares to determine the estimated tons of crops including rice to be obtained. The tons are then multiplied by a net cash flow determined at the future crop prices less the direct costs to be incurred. This amount is discounted at a discount rate, which reflects current market assessments of the assets involved and the time value of money.
• Growing herd and cattle:
Livestock are measured at fair value less estimated point-of-sale costs, with any changes therein recognized in the statement of income, on initial recognition as well as subsequently at each reporting period. The fair value of livestock is determined based on the actual selling prices less estimated point-of-sale costs in the markets where the Group operates.
• Sugarcane:
Sugarcane planting costs form part of Property plant and equipment. The agricultural produce growing on sugarcane is classified as biological assets and are measured at fair value less cost to sell. The fair value of agricultural produce growing on sugarcane depends on the variety, location and maturity of the plantation.
Adecoagro S.A.Notes to the Consolidated Financial Statements (Continued)
(All amounts in US$ thousands, except shares and per share data and as otherwise indicated)
35.11 Biological assets (continued)
F- 84
Agricultural produce growing in the Sugarcane, for which biological growth is not significant, is valued at cost, which approximates fair value. Expenditure on the agricultural produce growing in the sugarcane consists mainly of labor, agrochemicals and fertilizers among others. When it has attained significant biological growth, it is measured at fair value through a discounted cash flow model. Revenues are based on estimated yearly production volume (which will be destined to sugar, ethanol, energy and raw cane production) and the price is calculated as the average of daily prices for sugar future contracts (Sugar #11 ICE-NY contracts) for a six months period. Projected costs include maintenance and land leasing among others. These estimates are discounted at an appropriate discount rate.
35.12 Inventories
Inventories comprise of raw materials, finished goods (including harvested agricultural produce and manufactured goods)
and others. Harvested agricultural produce (except for rice and milk) are measured at net realizable value until the point of sale
because there is an active market in the produce, there is a negligible risk that the produce will not be sold and there is a well-established practice in the industry carrying the inventories at net realizable value. Changes in net realizable value are recognized in the statement of income in the period in which they arise under the line item “Changes in net realizable value of agricultural produce after harvest”.
All other inventories (including rice and milk) are measured at the lower of cost and net realizable value. Cost is determined
using the weighted average method.35.13 Financial assets
Financial assets are classified in the following categories: at fair value through profit or loss and at amortized cost, namely loans and receivables. The classification depends on the purpose for which the financial assets were acquired. Management determines the classification of its financial assets at initial recognition (see Note 18).
(a) Recognition and measurement Regular purchases and sales of financial assets are recognized on the trade-date – the date on which the Group commits
to purchase or sell the asset. Financial assets not carried at fair value through profit or loss are initially recognized at fair value plus transaction costs. Financial assets carried at fair value through profit or loss are initially recognized at fair value and transaction costs are expensed in the statement of income. Financial assets are derecognized when the rights to receive cash flows from the investments have expired or have been transferred and the Group has transferred substantially all risks and rewards of ownership. Financial assets at fair value through profit or loss are subsequently carried at fair value. Loans and receivables are subsequently carried at amortized cost using the effective interest method.
Gains or losses arising from changes in the fair value of the “financial assets at fair value through profit or loss” category
are presented in the statement of income within “Other operating income, net” in the period in which they arise.
If the market for a financial asset is not active (and for unlisted securities), the Group establishes fair value by using valuation techniques. These include the use of recent arm’s length transactions, reference to other instruments that are substantially the same, discounted cash flow analysis, and option pricing models, making maximum use of market inputs and relying as little as possible on entity-specific inputs.
The Group assesses at each statement of financial position date whether there is objective evidence that a financial asset
or a group of financial assets is impaired. Impairment testing of trade receivables is described in Note 35.15. (b) Offsetting financial instruments
Financial assets and liabilities are offset and the net amount reported in the statement of financial position when there is
a legally enforceable right to offset the recognized amounts and there is an intention to settle on a net basis, or realize the asset and settle the liability simultaneously. This right must not be contingent on future events and must be enforceable in any case.
Adecoagro S.A.Notes to the Consolidated Financial Statements (Continued)
(All amounts in US$ thousands, except shares and per share data and as otherwise indicated)
F- 85
35.14 Derivative financial instruments and hedging activities
Derivatives are initially recognized at fair value on the date a derivative contract is entered into and are subsequently remeasured at their fair value. Commodity future contract fair values are computed with reference to quoted market prices on future exchanges markets. The fair values of commodity options are calculated using year-end market rates together with common option pricing models. The fair value of interest rate swaps has been calculated using a discounted cash flow analysis.
The Group manages exposures to financial and commodity risks using hedging instruments that provide the appropriate
economic outcome. The principal hedging instruments used may include commodity future contracts, put and call options, foreign exchange forward contracts and interest rate swaps. The Group does not use derivative financial instruments for speculative purposes.
The Group’s policy is to apply hedge accounting to hedging relationships where it is both permissible under IFRS 9,
practical to do so and its application reduces volatility, but transactions that may be effective hedges in economic terms may not always qualify for hedge accounting under IFRS 9. Any derivatives that the Group holds to hedge these exposures are classified as “held for trading” and are shown in a separate line on the face of the statement of financial position. The method of recognizing gains or losses on derivatives depends on whether the derivative is designated as a hedging instrument, and if so, the nature of the item being hedged. Gains and losses on commodity derivatives are classified within “Other operating income, net”. Gains and losses on interest rate and foreign exchange rate derivatives are classified within ‘Financial results, net’. The Group designates certain derivatives as hedges of the foreign currency risk associated with highly probable forecast transactions (cash flow hedge).
The Group documents at the inception of the transaction the relationship between hedging instruments and hedged items,
as well as its risk management objectives and strategy for undertaking various hedging transactions. The Group also documents its assessment, both at hedge inception and on an ongoing basis, of whether the instruments that are used in hedging transactions are highly effective in offsetting changes in fair value or cash flows of hedged items.
Cash flow hedge The effective portion of the gain or loss on the instruments that are designated and qualify as cash flow hedges is recognized
in other comprehensive income. The gain or loss relating to the ineffective portion is recognized immediately in the statement of income within "Finance income” or “Finance cost”, as appropriate.
Amounts accumulated in equity are reclassified to profit or loss in the periods when the hedged item affects profit or loss. The gain or loss relating to the effective portion is recognized in the statement of income within "Finance income” or “Finance cost”, as appropriate.
When a hedging instrument expires or is sold, or when a hedge no longer meets the criteria for hedge accounting, any
cumulative gain or loss existing in equity at that time remains in equity and is recognized when the forecast transaction is ultimately recognized in the statement of income. When a forecast transaction is no longer expected to occur, the cumulative gain or loss that was reported in equity is immediately transferred to the statement of income. 35.15 Trade and other receivables and trade and other payables
Trade receivables are recognized initially at fair value and subsequently measured at amortized cost using the effective
interest method. In the case of receivables, less allowance for trade receivables. The group applies the IFRS 9 simplified approach to measuring expected credit losses which uses a lifetime expected
loss allowance for all trade receivables. To measure the expected credit losses, trade receivables have been grouped based on shared credit risk characteristics and the days past due.
Adecoagro S.A.Notes to the Consolidated Financial Statements (Continued)
(All amounts in US$ thousands, except shares and per share data and as otherwise indicated)
F- 86
35.16 Cash and cash equivalents Cash and cash equivalents includes cash in hand, deposits held at call with banks and other short-term highly liquid
investments with original maturities of three months or less. In the statements of cash flows, interest paid is presented within financing cash flows and interest received is presented within investing activities. 35.17 Borrowings
Borrowings are initially recognized at fair value, net of transaction costs incurred. Borrowings are subsequently measured
at amortized cost using the effective interest method. Borrowing costs are capitalized during the period of time that is required to complete and prepare the asset for its intended use.
35.18 Provisions
Provisions are recognized when (i) the Group has a present legal or constructive obligation as a result of past events; (ii) it is probable that an outflow of resources will be required to settle the obligation; and (iii) a reliable estimate of the amount of the obligation can be made. Provisions are measured at the present value of the expenditures expected to be required to settle the obligation using a pre-tax rate that reflects current market assessments of the time value of money and the risks specific to the obligation.
35.19 Onerous contracts
The Group enters into contracts, which require the Group to sell commodities in accordance with the Group's expected sales. These contracts do not qualify as derivatives. These contracts are not recognized until at least one of the parties has performed under the agreement. However, when the contracts are onerous, the Group recognizes the present obligation under the contracts as a provision included within “Provision and other liabilities” in the statement of financial position. Losses under these onerous contracts are recognized within “Other operating income, net” in the statement of income.
35.20 Current and deferred income tax The Group’s tax benefit or expense for each year comprises the charge for current tax payable and deferred taxation
attributable to the Group’s operating subsidiaries. Tax is recognized in the statement of income, except to the extent that it relates to items recognized directly in equity. In this case, the tax is also recognized in equity.
The current income tax charge is calculated on the basis of the tax laws enacted at the date of the statement of financial
position in the countries where the Group’s subsidiaries operate and generate taxable income. Management periodically evaluates positions taken in tax returns with respect to situations in which applicable tax regulation is subject to interpretation. It establishes provisions where appropriate on the basis of amounts expected to be paid to the tax authorities.
Deferred income tax is recognized, using the liability method, on temporary differences arising between the tax bases of
assets and liabilities and their carrying amounts in the consolidated financial statements. However, the deferred income tax is not accounted for if it arises from initial recognition of an asset or liability in a transaction other than a business combination that at the time of the transaction affects neither accounting nor taxable profit or loss. Deferred income tax is determined using tax rates (and laws) effective in the countries where the Group’s subsidiaries operate and generate taxable income.
Deferred income tax assets are recognized only to the extent that it is probable that future taxable profit will be available
against which the temporary differences can be utilized. Deferred income tax is provided on temporary differences arising on investments in subsidiaries, except where the timing
of the reversal of the temporary difference is controlled by the Group and it is probable that the temporary difference will not reverse in the foreseeable future.
The Group is able to control the timing of dividends from its subsidiaries and hence does not expect to remit overseas
earnings in the foreseeable future in a way that would result in a charge to taxable profit. Hence deferred tax is recognized in respect of the retained earnings of overseas subsidiaries only to the extent that, at the date of the statement of financial position,
Adecoagro S.A.Notes to the Consolidated Financial Statements (Continued)
(All amounts in US$ thousands, except shares and per share data and as otherwise indicated)
F- 87
35.20 Current and deferred income tax (continued)
dividends have been accrued as receivable or a binding agreement to distribute past earnings in future has been entered into by the subsidiary.
35.21 Revenue Recognition
The Group’s primary activities comprise agricultural and agro-industrial activities.
The Group’s agricultural activities comprise growing and selling agricultural produce. In accordance with IAS 41 “Agriculture”, cattle are measured at fair value with changes therein recognized in the statement of income as they arise. Agricultural produce is measured at net realizable value with changes therein recognized in the statement of income as they arise. Therefore, sales of agricultural produce and cattle generally do not generate any separate gains or losses in the statement of income.
The Group’s agro-industrial activities comprise the selling of manufactured products (i.e. industrialized rice, milk-related
products, ethanol, sugar, energy, among others). These sales are measured at the fair value of the consideration received or receivable, net of returns and allowances, trade and other discounts, and sales taxes, as applicable.
Revenue is recognized when the full control have been transferred to the buyer, recovery of the consideration is probable, the associated costs and possible return of goods can be estimated reliably, and there is no continuing management involvement with the goods. Transfers of control vary depending on the individual terms of the contract of sale. Revenues are recognised when control of the products has transferred, being when the products are delivered to the customer, having this full discretion over the channel and price to sell the products, and there is no unfulfilled obligation that could affect the customer’s acceptance of the products.
The Group also provides certain agricultural-related services such as grain warehousing/conditioning and other services, e.g. handling and drying services. Revenue from services is recognized as services are provided.
The Group leases owned farmland property to third parties under operating lease agreements. Rental income is recognized on a straight-line basis over the period of the lease.
The Group is a party to a 15-year power agreement for the sale of electricity which expires in 2042. The delivery period starts in April and ends in November of each year. The Group is also a party to two 15-year power agreements which delivery period starts in March and ends in December of each year, these two agreements will expire in 2024 and 2025, respectively. Prices under all the agreements are adjusted annually for inflation. Revenue related to the sale of electricity under these two agreements is recorded based upon output delivered.
35.22 Farmlands sales
The Group’s strategy is to profit from land appreciation value generated through the transformation of its productive capabilities. Therefore, the Group may seek to realize value from the sale of farmland assets and businesses.
Farmland sales are not recognized until (i) the sale is completed, (ii) the Group has determined that it is probable the buyer will pay, (iii) the amount of revenue can be measured reliably, and (iv) the Group has transferred to the buyer the risk of ownership, and does not have a continuing involvement. Gains from “farmland sales” are included in the statement of income under the line item “Other operating income, net”.
Adecoagro S.A.Notes to the Consolidated Financial Statements (Continued)
(All amounts in US$ thousands, except shares and per share data and as otherwise indicated)
F- 88
35.23 Assets held for sale and discontinued operations
When the Group intends to dispose of, or classify as held for sale, a business component that represents a separate major line of business or geographical area of operations, or a subsidiary acquired exclusively with a view to resale, it classifies such operations as discontinued. The post tax profit or loss of the discontinued operations is shown as a single amount on the face of the statement of income, separate from the other results of the Group. Assets and liabilities classified as held for sale are measured at the lower of carrying value and fair value less costs to sell.
Non-current assets and disposal groups are classified as held for sale if their carrying amount will be recovered through
a disposal rather than through continuing use. This condition is regarded as met only when management is committed to the sale (disposal), the sale (disposal) is highly probable and expected to be completed within one year from classification and the asset is available for immediate sale (disposal) in its present condition. The statements of income for the comparative periods are represented to show the discontinued operations separate from the continuing operations. 35.24 Earnings per share
Basic earnings per share is calculated by dividing the net income for the year attributable to equity holders of the parent by the weighted average number of ordinary shares outstanding during the year. Diluted net earnings per share is computed by dividing the net income for the period by the weighted average number of ordinary shares outstanding, and when dilutive, adjusted for the effect of all potentially dilutive shares, including share options, on an as-if converted basis.
35.25 Equity-settled share-based payments
The Group issues equity settled share-based payments to certain directors, senior management and employees. Options under the awards were measured at fair value at the date of grant. An expense is recognized to spread the fair value of each award over the vesting period on a straight-line basis, after allowing for an estimate of the awards that will eventually vest. The estimate of the level of vesting is reviewed at least annually, with any impact on the cumulative charge being recognized immediately. 35.26 Research and development
Research phase expenditure is expensed as incurred. Development expenditure is capitalized as an internally generated intangible asset only if it meets strict criteria, relating in particular to technical feasibility and generation of future economic benefits. Research expenses have been immaterial to date. The Group has not capitalized any development expenses to date.
ADECOAGRO S.A.
Annual Accounts
for the financial year ended December 31, 2019
Vertigo Naos Building, 6, Rue Eugène Ruppert, L-2453, Luxembourg
RCS Luxembourg: B153681
Audit report
To the Shareholders ofAdecoagro S.A.
Our opinion
In our opinion, the accompanying annual accounts give a true and fair view of the financial position of Adecoagro S.A. (the “Company”) as at 31 December 2019, and of the results of its operations for the year then ended in accordance with Luxembourg legal and regulatory requirements relating to the preparation and presentation of the annual accounts.
What we have audited
The Company’s annual accounts comprise:
• the balance sheet as at 31 December 2019;• the profit and loss account for the year then ended; and• the notes to the annual accounts, which include a summary of significant accounting policies.
Basis for opinion
We conducted our audit in accordance with the Law of 23 July 2016 on the audit profession (Law of 23 July 2016) and with International Standards on Auditing (ISAs) as adopted for Luxembourg by the “Commission de Surveillance du Secteur Financier” (CSSF). Our responsibilities under the Law of 23 July 2016 and ISAs as adopted for Luxembourg by the CSSF are further described in the “Responsibilities of the “Réviseur d’entreprises agréé” for the audit of the annual accounts” section of our report.
We believe that the audit evidence we have obtained is sufficient and appropriate to provide a basis for our opinion.
We are independent of the Company in accordance with the International Ethics Standards Board for Accountants’ Code of Ethics for Professional Accountants (IESBA Code) as adopted for Luxembourg by the CSSF together with the ethical requirements that are relevant to our audit of the annual accounts. We have fulfilled our other ethical responsibilities under those ethical requirements.
Responsibilities of the Board of Directors and those charged with governance for the annual accounts
The Board of Directors is responsible for the preparation and fair presentation of the annual accounts in accordance with Luxembourg legal and regulatory requirements relating to the preparation and presentation of the annual accounts, and for such internal control as the Board of Directors determines is necessary to enable the preparation of annual accounts that are free from material misstatement, whether due to fraud or error.
In preparing the annual accounts, the Board of Directors is responsible for assessing the Company’s ability to continue as a going concern, disclosing, as applicable, matters related to going concern and using the going concern basis of accounting unless the Board of Directors either intends to liquidate the Company or to cease operations, or has no realistic alternative but to do so.
PricewaterhouseCoopers, Société coopérative, 2 rue Gerhard Mercator, B.P. 1443, L-1014 LuxembourgT : +352 494848 1, F : +352 494848 2900, www.pwc.lu
Cabinet de révision agréé. Expert-comptable (autorisation gouvernementale n°10028256) R.C.S. Luxembourg B 65 477 - TVA LU25482518
2
Those charged with governance are responsible for overseeing the Company’s financial reporting process.
Responsibilities of the “Réviseur d’entreprises agréé” for the audit of the annual accounts
The objectives of our audit are to obtain reasonable assurance about whether the annual accounts as a whole are free from material misstatement, whether due to fraud or error, and to issue an audit report that includes our opinion. Reasonable assurance is a high level of assurance, but is not a guarantee that an audit conducted in accordance with the Law of 23 July 2016 and with ISAs as adopted for Luxembourg by the CSSF will always detect a material misstatement when it exists. Misstatements can arise from fraud or error and are considered material if, individually or in the aggregate, they could reasonably be expected to influence the economic decisions of users taken on the basis of these annual accounts.
As part of an audit in accordance with the Law of 23 July 2016 and with ISAs as adopted for Luxembourg by the CSSF, we exercise professional judgment and maintain professional scepticism throughout the audit. We also:
• identify and assess the risks of material misstatement of the annual accounts, whether due to fraud or error, design and perform audit procedures responsive to those risks, and obtain audit evidence that is sufficient and appropriate to provide a basis for our opinion. The risk of not detecting a material misstatement resulting from fraud is higher than for one resulting from error, as fraud may involve collusion, forgery, intentional omissions, misrepresentations, or the override of internal control;
• obtain an understanding of internal control relevant to the audit in order to design audit procedures that are appropriate in the circumstances, but not for the purpose of expressing an opinion on the effectiveness of the Company’s internal control;
• evaluate the appropriateness of accounting policies used and the reasonableness of accounting estimates and related disclosures made by the Board of Directors;
• conclude on the appropriateness of the Board of Directors’ use of the going concern basis of accounting and, based on the audit evidence obtained, whether a material uncertainty exists related to events or conditions that may cast significant doubt on the Company’s ability to continue as a going concern. If we conclude that a material uncertainty exists, we are required to draw attention in our audit report to the related disclosures in the annual accounts or, if such disclosures are inadequate, to modify our opinion. Our conclusions are based on the audit evidence obtained up to the date of our audit report. However, future events or conditions may cause the Company to cease to continue as a going concern;
• evaluate the overall presentation, structure and content of the annual accounts, including the disclosures, and whether the annual accounts represent the underlying transactions and events in a manner that achieves fair presentation.
We communicate with those charged with governance regarding, among other matters, the planned scope and timing of the audit and significant audit findings, including any significant deficiencies in internal control that we identify during our audit.
We also provide those charged with governance with a statement that we have complied with relevant ethical requirements regarding independence, and communicate to them all relationships and other matters that may reasonably be thought to bear on our independence, and where applicable, related safeguards.
PricewaterhouseCoopers, Société coopérativeRepresented by
Fabrice Goffin Luxembourg, 20 March 2020
3
Legal information
Denomination: ADECOAGRO S.A.
Legal address: Vertigo Naos Building, 6 rue Eugène Ruppert, L-2453, Luxembourg
Company activity: Agricultural and agro-industrialDate of registration: June 11, 2010Expiration of company charter: No term definedNumber of register: B153.681
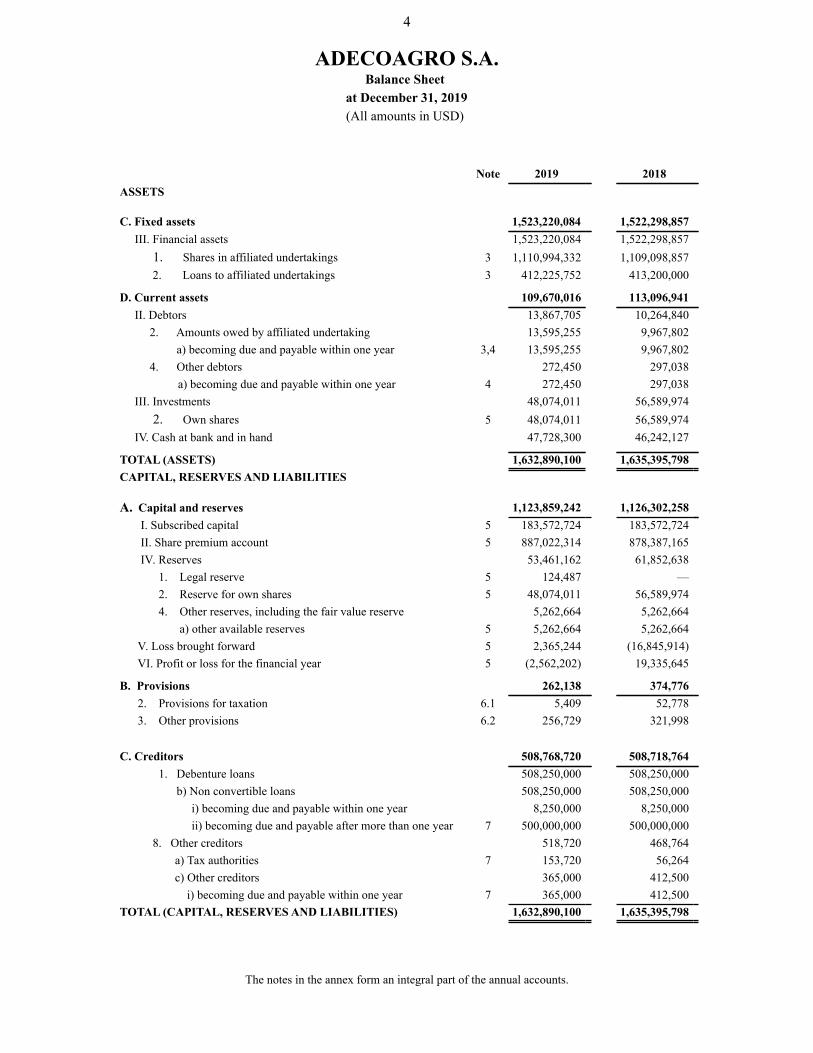
4
ADECOAGRO S.A.Balance Sheet
at December 31, 2019(All amounts in USD)
The notes in the annex form an integral part of the annual accounts.
Note 2019 2018ASSETS
C. Fixed assets 1,523,220,084 1,522,298,857 III. Financial assets 1,523,220,084 1,522,298,857 1. Shares in affiliated undertakings 3 1,110,994,332 1,109,098,857 2. Loans to affiliated undertakings 3 412,225,752 413,200,000
D. Current assets 109,670,016 113,096,941 II. Debtors 13,867,705 10,264,840 2. Amounts owed by affiliated undertaking 13,595,255 9,967,802 a) becoming due and payable within one year 3,4 13,595,255 9,967,802 4. Other debtors 272,450 297,038
a) becoming due and payable within one year 4 272,450 297,038 III. Investments 48,074,011 56,589,974 2. Own shares 5 48,074,011 56,589,974 IV. Cash at bank and in hand 47,728,300 46,242,127
TOTAL (ASSETS) 1,632,890,100 1,635,395,798CAPITAL, RESERVES AND LIABILITIES
A. Capital and reserves 1,123,859,242 1,126,302,258 I. Subscribed capital 5 183,572,724 183,572,724 II. Share premium account 5 887,022,314 878,387,165 IV. Reserves 53,461,162 61,852,638 1. Legal reserve 5 124,487 — 2. Reserve for own shares 5 48,074,011 56,589,974 4. Other reserves, including the fair value reserve 5,262,664 5,262,664 a) other available reserves 5 5,262,664 5,262,664 V. Loss brought forward 5 2,365,244 (16,845,914) VI. Profit or loss for the financial year 5 (2,562,202) 19,335,645
B. Provisions 262,138 374,776 2. Provisions for taxation 6.1 5,409 52,778 3. Other provisions 6.2 256,729 321,998
C. Creditors 508,768,720 508,718,764 1. Debenture loans 508,250,000 508,250,000 b) Non convertible loans 508,250,000 508,250,000 i) becoming due and payable within one year 8,250,000 8,250,000 ii) becoming due and payable after more than one year 7 500,000,000 500,000,000 8. Other creditors 518,720 468,764
a) Tax authorities 7 153,720 56,264 c) Other creditors 365,000 412,500 i) becoming due and payable within one year 7 365,000 412,500
TOTAL (CAPITAL, RESERVES AND LIABILITIES) 1,632,890,100 1,635,395,798
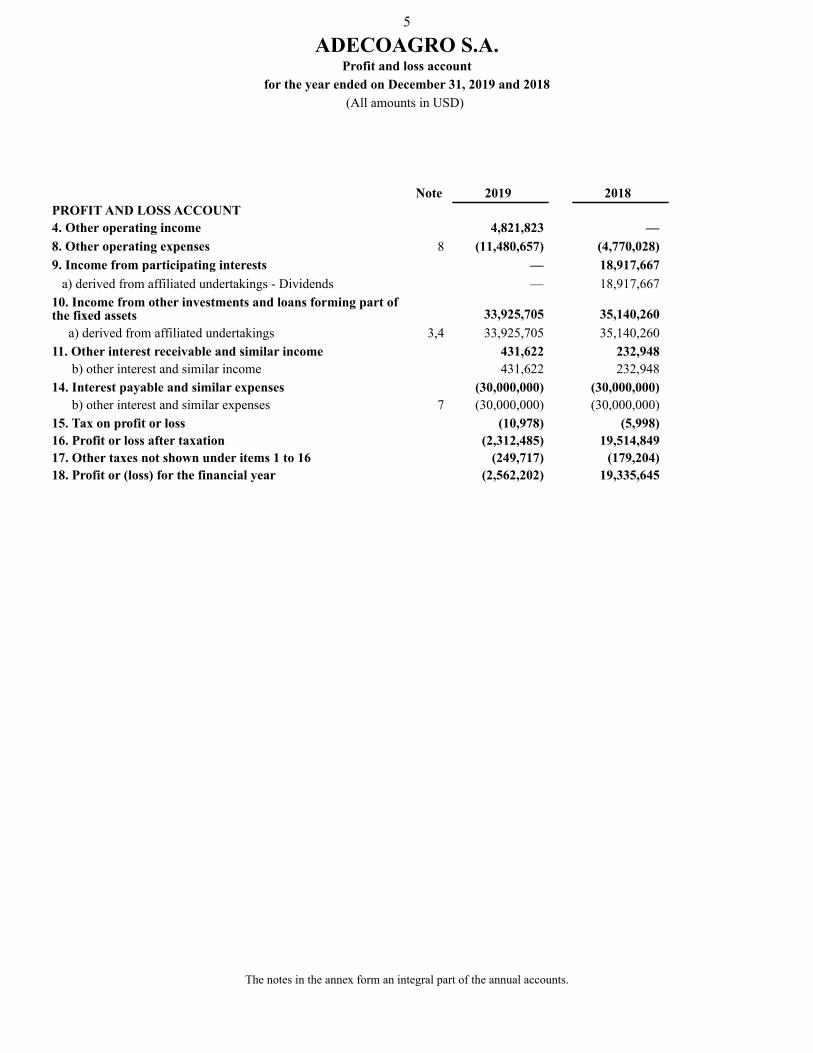
5
ADECOAGRO S.A.Profit and loss account
for the year ended on December 31, 2019 and 2018(All amounts in USD)
The notes in the annex form an integral part of the annual accounts.
Note 2019 2018PROFIT AND LOSS ACCOUNT4. Other operating income 4,821,823 —8. Other operating expenses 8 (11,480,657) (4,770,028)9. Income from participating interests — 18,917,667 a) derived from affiliated undertakings - Dividends — 18,917,66710. Income from other investments and loans forming part ofthe fixed assets 33,925,705 35,140,260 a) derived from affiliated undertakings 3,4 33,925,705 35,140,26011. Other interest receivable and similar income 431,622 232,948 b) other interest and similar income 431,622 232,94814. Interest payable and similar expenses (30,000,000) (30,000,000) b) other interest and similar expenses 7 (30,000,000) (30,000,000)15. Tax on profit or loss (10,978) (5,998)16. Profit or loss after taxation (2,312,485) 19,514,84917. Other taxes not shown under items 1 to 16 (249,717) (179,204)18. Profit or (loss) for the financial year (2,562,202) 19,335,645

6
ADECOAGRO S.A.Notes to the annual accounts (continued)
(All amounts in USD)
1. General information
ADECOAGRO S.A. (the “Company” or “Adecoagro”) is organized as a “société anonyme” (a public company limited by shares)
under the laws of Luxembourg and was incorporated on June 11, 2010 for an unlimited period.
ADECOAGRO S.A. is primarily engaged through its operating subsidiaries in agricultural and agro-industrial activities. The Company and its operating subsidiaries are collectively referred to hereinafter as the "Group". The main activity of the Company is the holding of participations, in any form whatsoever, in Luxembourg and foreign companies, or other entities or enterprises.
The Group was established in 2002 and has subsequently grown significantly both organically and through acquisitions.
The registered office of the Company is established in Luxembourg, Luxembourg. The Company's financial year starts on January 1st and ends on December 31st of each year.
These annual accounts have been approved for issue by the Board of Directors on March 10, 2020.
In accordance with the legal provisions in the Title II of the law of December 19, 2002, these annual accounts were presented on a non-consolidated basis for the approval of the Shareholders during the Annual General Meeting.
Pursuant to the Title XVII of the mended law of August 10, 2015, ADECOAGRO S.A. also prepares consolidated financial statements which are published according to the provisions of Luxembourg law.
2. Summary of significant accounting policies
2.1. Basis of preparation
The annual accounts are prepared in accordance with Luxembourg legal and regulatory requirements under the historical cost convention. The accounting policies and valuation principles are, apart from those enforced by the Law of December 19, 2002, determined and implemented by the Board of Directors.
The preparation of annual accounts requires the use of certain critical accounting estimates. It also requires the Board of Directors to exercise its judgement in the process of applying the accounting policies. Changes in assumptions may have a significant impact on the annual accounts in the period in which the assumptions changed.
The Board of Directors believes that the underlying assumptions are appropriate and that the annual accounts therefore present the financial position and it results fairly.
The Company makes estimates and assumptions that affect the reported amounts of assets and liabilities in the next financial year. Estimates and judgements are continually evaluated and are based on historical experience and other factors, including expectations of future events that are believed to be reasonable under the circumstances.
The books and records are maintained in United States Dollar (hereinafter “USD”) and the annual accounts have been prepared in accordance with the valuation rules and accounting policies described below.
2.2. Significant accounting policies
The main valuation rules applied by the Company are the following:
7
ADECOAGRO S.A.Notes to the annual accounts (continued)
(All amounts in USD)
2.2. Significant accounting policies (continued)
2.2.1. Financial assets
Shares in affiliated undertaking and loans to these undertaking are valued at purchase price and nominal value including the expenses incidental thereto.
In the case of durable depreciation in value according to the opinion of the Board of Directors, value adjustments are made in respect of financial fixed assets, so that they are valued at the lower figure to be attributed to them at the balance sheet date. These value adjustments are not continued if the reasons for which the value adjustments were made have ceased to apply.
2.2.2. Debtors
Debtors are valued at their nominal value. They are subject to value adjustments where their recovery is compromised. These value adjustments are not continued if the reasons for which the value adjustments were made have ceased to apply.
2.2.3. Foreign currency translation
Transactions expressed in currencies other than USD are translated into USD at the exchange rate effective at the time of the transaction. Cash at bank, debtors and liabilities, denominated in currencies other than the USD, are translated into USD at the exchange rate effective at the balance sheet date. Exchange losses and gains are recorded in the profit and loss account of the period.
2.2.4. Provisions
Provisions are intended to cover losses or debts, the nature of which is clearly defined and which, at the date of the balance sheet, are either likely to be incurred but uncertain as to their amount or the date on which they will arise.
Provision for taxation
Provision for taxation corresponds to the tax liability estimated by the Company for the financial year for which the tax return has not yet been filed. See Note 6
2.2.5. Creditors
Debts are recorded at their reimbursement value. Where the amount repayable on account is greater that the amount received, the difference is recorded in the profit and loss account when the date is issued.
2.2.6. Equity-settled share-based payments
The Group has issued equity-settled share-based payments to certain directors, senior management and employees. See further information in Note 10.
Options under the awards are recorded for the exercised price when the shares are issued.
In the case of the Restricted Share and Restricted Stock units plan, the award is recorded when the shares are issued for an amount equal to the nominal value of the shares. Shares vested under the Restricted Share plan are recorded in equity at fair value (using a valuation technique that may include Black-Scholes calculations or other models) under "Other reserves", with the corresponding charge in the Profit and Loss account or a receivable with a related party.
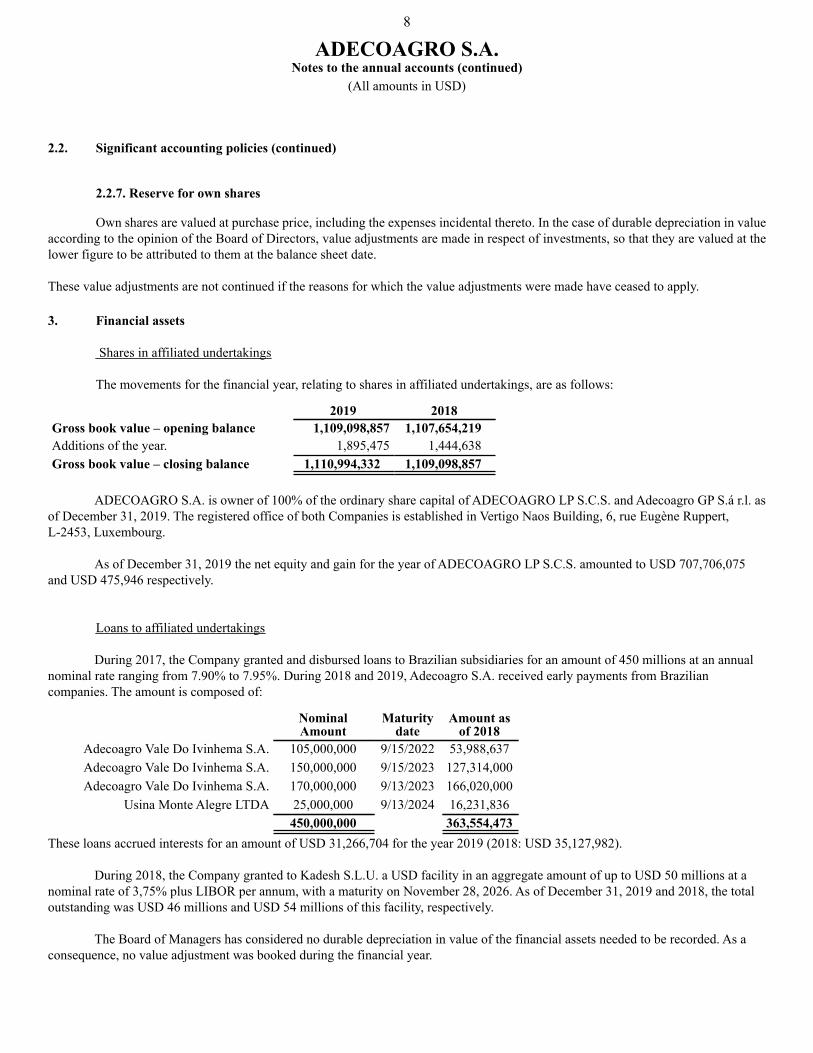
8
ADECOAGRO S.A.Notes to the annual accounts (continued)
(All amounts in USD)
2.2. Significant accounting policies (continued)
2.2.7. Reserve for own shares
Own shares are valued at purchase price, including the expenses incidental thereto. In the case of durable depreciation in value according to the opinion of the Board of Directors, value adjustments are made in respect of investments, so that they are valued at the lower figure to be attributed to them at the balance sheet date.
These value adjustments are not continued if the reasons for which the value adjustments were made have ceased to apply.
3. Financial assets
Shares in affiliated undertakings
The movements for the financial year, relating to shares in affiliated undertakings, are as follows:
2019 2018Gross book value – opening balance 1,109,098,857 1,107,654,219Additions of the year. 1,895,475 1,444,638Gross book value – closing balance 1,110,994,332 1,109,098,857
ADECOAGRO S.A. is owner of 100% of the ordinary share capital of ADECOAGRO LP S.C.S. and Adecoagro GP S.á r.l. as
of December 31, 2019. The registered office of both Companies is established in Vertigo Naos Building, 6, rue Eugène Ruppert, L-2453, Luxembourg.
As of December 31, 2019 the net equity and gain for the year of ADECOAGRO LP S.C.S. amounted to USD 707,706,075 and USD 475,946 respectively.
Loans to affiliated undertakings
During 2017, the Company granted and disbursed loans to Brazilian subsidiaries for an amount of 450 millions at an annual nominal rate ranging from 7.90% to 7.95%. During 2018 and 2019, Adecoagro S.A. received early payments from Brazilian companies. The amount is composed of:
NominalAmount
Maturitydate
Amount asof 2018
Adecoagro Vale Do Ivinhema S.A. 105,000,000 9/15/2022 53,988,637Adecoagro Vale Do Ivinhema S.A. 150,000,000 9/15/2023 127,314,000Adecoagro Vale Do Ivinhema S.A. 170,000,000 9/13/2023 166,020,000
Usina Monte Alegre LTDA 25,000,000 9/13/2024 16,231,836450,000,000 363,554,473
These loans accrued interests for an amount of USD 31,266,704 for the year 2019 (2018: USD 35,127,982).
During 2018, the Company granted to Kadesh S.L.U. a USD facility in an aggregate amount of up to USD 50 millions at a nominal rate of 3,75% plus LIBOR per annum, with a maturity on November 28, 2026. As of December 31, 2019 and 2018, the total outstanding was USD 46 millions and USD 54 millions of this facility, respectively.
The Board of Managers has considered no durable depreciation in value of the financial assets needed to be recorded. As a consequence, no value adjustment was booked during the financial year.
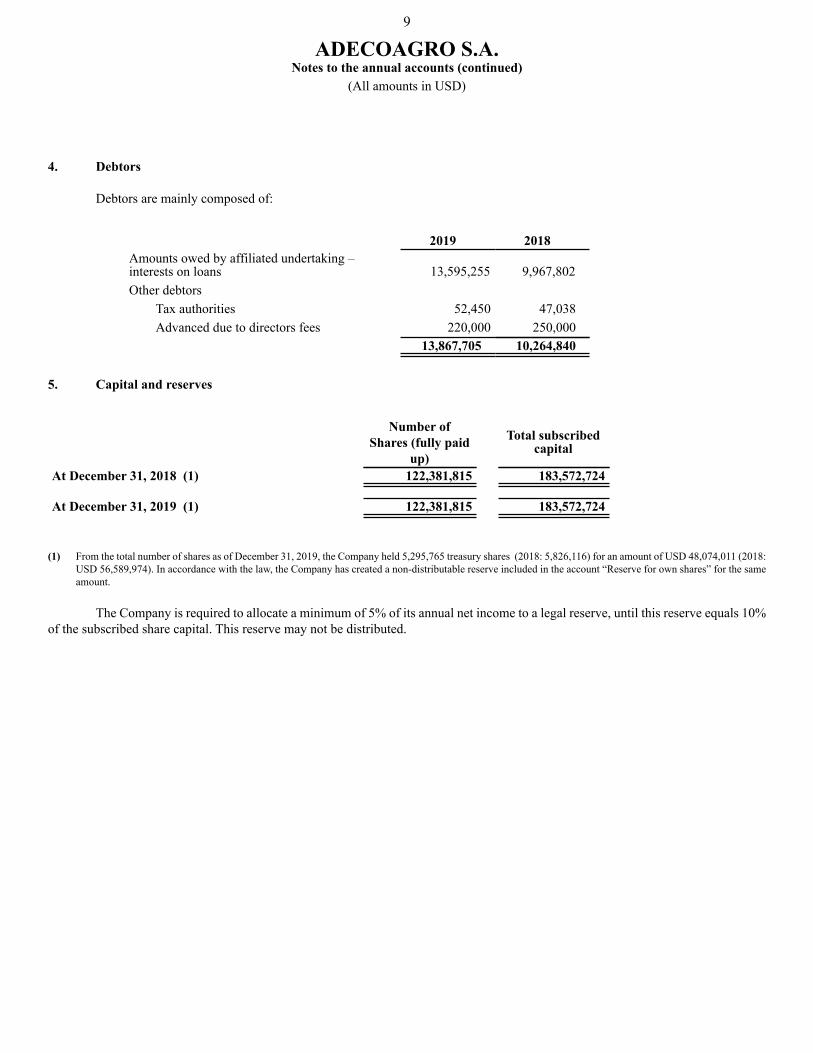
9
ADECOAGRO S.A.Notes to the annual accounts (continued)
(All amounts in USD)
4. Debtors
Debtors are mainly composed of:
2019 2018Amounts owed by affiliated undertaking –interests on loans 13,595,255 9,967,802Other debtors
Tax authorities 52,450 47,038Advanced due to directors fees 220,000 250,000
13,867,705 10,264,840
5. Capital and reserves
Number ofShares (fully paid
up)
Total subscribedcapital
At December 31, 2018 (1) 122,381,815 183,572,724
At December 31, 2019 (1) 122,381,815 183,572,724
(1) From the total number of shares as of December 31, 2019, the Company held 5,295,765 treasury shares (2018: 5,826,116) for an amount of USD 48,074,011 (2018: USD 56,589,974). In accordance with the law, the Company has created a non-distributable reserve included in the account “Reserve for own shares” for the same amount.
The Company is required to allocate a minimum of 5% of its annual net income to a legal reserve, until this reserve equals 10% of the subscribed share capital. This reserve may not be distributed.
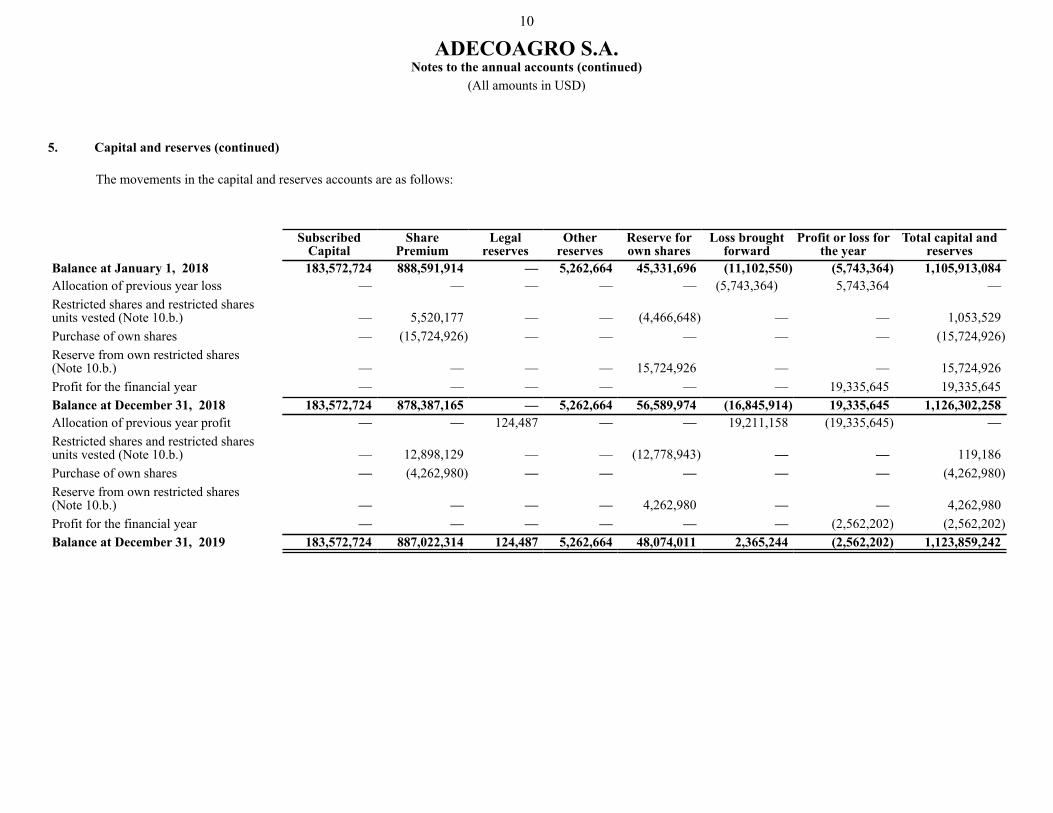
10
ADECOAGRO S.A.Notes to the annual accounts (continued)
(All amounts in USD)
5. Capital and reserves (continued)
The movements in the capital and reserves accounts are as follows:
SubscribedCapital
SharePremium
Legalreserves
Otherreserves
Reserve forown shares
Loss broughtforward
Profit or loss forthe year
Total capital andreserves
Balance at January 1, 2018 183,572,724 888,591,914 — 5,262,664 45,331,696 (11,102,550) (5,743,364) 1,105,913,084Allocation of previous year loss — — — — — (5,743,364) 5,743,364 —Restricted shares and restricted sharesunits vested (Note 10.b.) — 5,520,177 — — (4,466,648) — — 1,053,529Purchase of own shares — (15,724,926) — — — — — (15,724,926)Reserve from own restricted shares(Note 10.b.) — — — — 15,724,926 — — 15,724,926Profit for the financial year — — — — — — 19,335,645 19,335,645Balance at December 31, 2018 183,572,724 878,387,165 — 5,262,664 56,589,974 (16,845,914) 19,335,645 1,126,302,258Allocation of previous year profit — — 124,487 — — 19,211,158 (19,335,645) —Restricted shares and restricted sharesunits vested (Note 10.b.) — 12,898,129 — — (12,778,943) — — 119,186Purchase of own shares — (4,262,980) — — — — — (4,262,980)Reserve from own restricted shares(Note 10.b.) — — — — 4,262,980 — — 4,262,980Profit for the financial year — — — — — — (2,562,202) (2,562,202)Balance at December 31, 2019 183,572,724 887,022,314 124,487 5,262,664 48,074,011 2,365,244 (2,562,202) 1,123,859,242
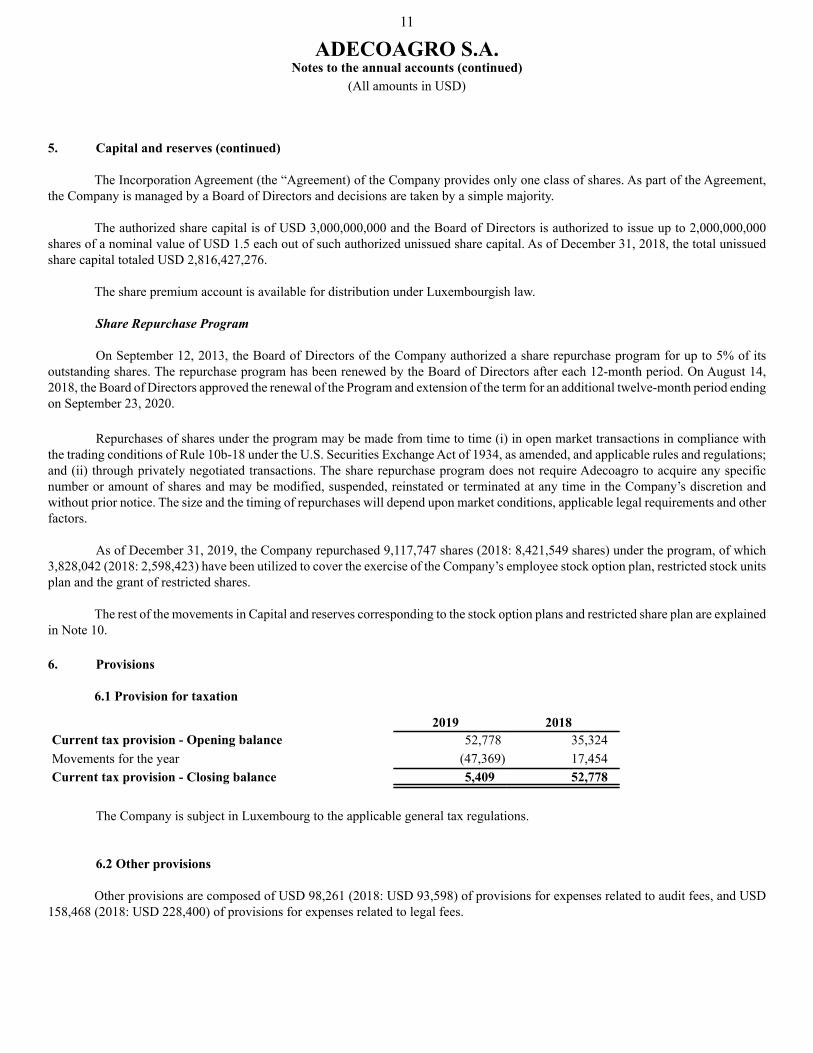
11
ADECOAGRO S.A.Notes to the annual accounts (continued)
(All amounts in USD)
5. Capital and reserves (continued)
The Incorporation Agreement (the “Agreement) of the Company provides only one class of shares. As part of the Agreement, the Company is managed by a Board of Directors and decisions are taken by a simple majority.
The authorized share capital is of USD 3,000,000,000 and the Board of Directors is authorized to issue up to 2,000,000,000 shares of a nominal value of USD 1.5 each out of such authorized unissued share capital. As of December 31, 2018, the total unissued share capital totaled USD 2,816,427,276.
The share premium account is available for distribution under Luxembourgish law.
Share Repurchase Program
On September 12, 2013, the Board of Directors of the Company authorized a share repurchase program for up to 5% of its outstanding shares. The repurchase program has been renewed by the Board of Directors after each 12-month period. On August 14, 2018, the Board of Directors approved the renewal of the Program and extension of the term for an additional twelve-month period ending on September 23, 2020.
Repurchases of shares under the program may be made from time to time (i) in open market transactions in compliance with the trading conditions of Rule 10b-18 under the U.S. Securities Exchange Act of 1934, as amended, and applicable rules and regulations; and (ii) through privately negotiated transactions. The share repurchase program does not require Adecoagro to acquire any specific number or amount of shares and may be modified, suspended, reinstated or terminated at any time in the Company’s discretion and without prior notice. The size and the timing of repurchases will depend upon market conditions, applicable legal requirements and other factors.
As of December 31, 2019, the Company repurchased 9,117,747 shares (2018: 8,421,549 shares) under the program, of which 3,828,042 (2018: 2,598,423) have been utilized to cover the exercise of the Company’s employee stock option plan, restricted stock units plan and the grant of restricted shares.
The rest of the movements in Capital and reserves corresponding to the stock option plans and restricted share plan are explained in Note 10.
6. Provisions
6.1 Provision for taxation
2019 2018Current tax provision - Opening balance 52,778 35,324Movements for the year (47,369) 17,454Current tax provision - Closing balance 5,409 52,778
The Company is subject in Luxembourg to the applicable general tax regulations.
6.2 Other provisions
Other provisions are composed of USD 98,261 (2018: USD 93,598) of provisions for expenses related to audit fees, and USD 158,468 (2018: USD 228,400) of provisions for expenses related to legal fees.
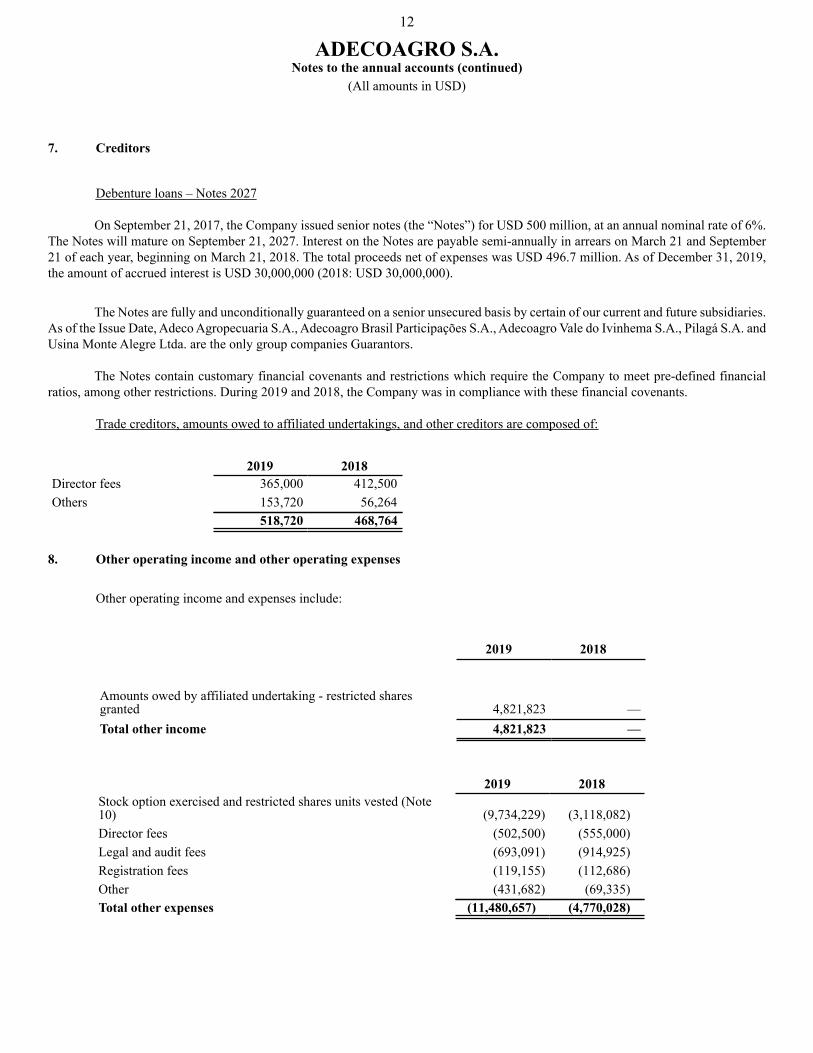
12
ADECOAGRO S.A.Notes to the annual accounts (continued)
(All amounts in USD)
7. Creditors
Debenture loans – Notes 2027
On September 21, 2017, the Company issued senior notes (the “Notes”) for USD 500 million, at an annual nominal rate of 6%. The Notes will mature on September 21, 2027. Interest on the Notes are payable semi-annually in arrears on March 21 and September 21 of each year, beginning on March 21, 2018. The total proceeds net of expenses was USD 496.7 million. As of December 31, 2019, the amount of accrued interest is USD 30,000,000 (2018: USD 30,000,000).
The Notes are fully and unconditionally guaranteed on a senior unsecured basis by certain of our current and future subsidiaries. As of the Issue Date, Adeco Agropecuaria S.A., Adecoagro Brasil Participações S.A., Adecoagro Vale do Ivinhema S.A., Pilagá S.A. and Usina Monte Alegre Ltda. are the only group companies Guarantors.
The Notes contain customary financial covenants and restrictions which require the Company to meet pre-defined financial ratios, among other restrictions. During 2019 and 2018, the Company was in compliance with these financial covenants.
Trade creditors, amounts owed to affiliated undertakings, and other creditors are composed of:
2019 2018Director fees 365,000 412,500Others 153,720 56,264
518,720 468,764
8. Other operating income and other operating expenses
Other operating income and expenses include:
2019 2018
Amounts owed by affiliated undertaking - restricted sharesgranted 4,821,823 —Total other income 4,821,823 —
2019 2018Stock option exercised and restricted shares units vested (Note10) (9,734,229) (3,118,082)Director fees (502,500) (555,000)Legal and audit fees (693,091) (914,925)Registration fees (119,155) (112,686)Other (431,682) (69,335)Total other expenses (11,480,657) (4,770,028)
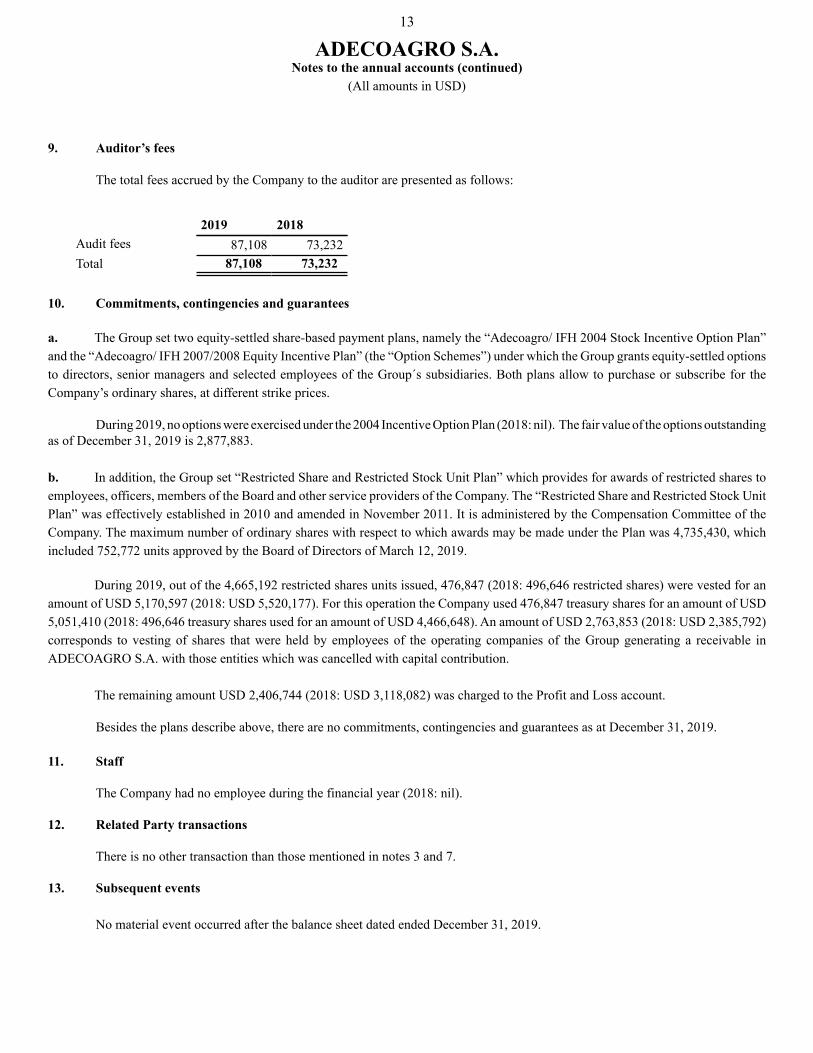
13
ADECOAGRO S.A.Notes to the annual accounts (continued)
(All amounts in USD)
9. Auditor’s fees
The total fees accrued by the Company to the auditor are presented as follows:
2019 2018Audit fees 87,108 73,232Total 87,108 73,232
10. Commitments, contingencies and guarantees
a. The Group set two equity-settled share-based payment plans, namely the “Adecoagro/ IFH 2004 Stock Incentive Option Plan” and the “Adecoagro/ IFH 2007/2008 Equity Incentive Plan” (the “Option Schemes”) under which the Group grants equity-settled options to directors, senior managers and selected employees of the Group´s subsidiaries. Both plans allow to purchase or subscribe for the Company’s ordinary shares, at different strike prices.
During 2019, no options were exercised under the 2004 Incentive Option Plan (2018: nil). The fair value of the options outstanding as of December 31, 2019 is 2,877,883.
b. In addition, the Group set “Restricted Share and Restricted Stock Unit Plan” which provides for awards of restricted shares to employees, officers, members of the Board and other service providers of the Company. The “Restricted Share and Restricted Stock Unit Plan” was effectively established in 2010 and amended in November 2011. It is administered by the Compensation Committee of the Company. The maximum number of ordinary shares with respect to which awards may be made under the Plan was 4,735,430, which included 752,772 units approved by the Board of Directors of March 12, 2019.
During 2019, out of the 4,665,192 restricted shares units issued, 476,847 (2018: 496,646 restricted shares) were vested for an amount of USD 5,170,597 (2018: USD 5,520,177). For this operation the Company used 476,847 treasury shares for an amount of USD 5,051,410 (2018: 496,646 treasury shares used for an amount of USD 4,466,648). An amount of USD 2,763,853 (2018: USD 2,385,792) corresponds to vesting of shares that were held by employees of the operating companies of the Group generating a receivable in ADECOAGRO S.A. with those entities which was cancelled with capital contribution.
The remaining amount USD 2,406,744 (2018: USD 3,118,082) was charged to the Profit and Loss account.
Besides the plans describe above, there are no commitments, contingencies and guarantees as at December 31, 2019.
11. Staff
The Company had no employee during the financial year (2018: nil).
12. Related Party transactions
There is no other transaction than those mentioned in notes 3 and 7.
13. Subsequent events
No material event occurred after the balance sheet dated ended December 31, 2019.