Embed Size (px)
Citation preview
JOURNAL OF MASS SPECTROMETRYJ. Mass Spectrom. 34, 377È383 (1999)
Combining Solid-phase Preconcentration, CapillaryElectrophoresis and O†-line Matrix-assisted LaserDesorption/Ionization Mass Spectrometry :Intracerebral Metabolic Processing of Peptide E InVivo¤
Haying Zhang,3 Markus Stoeckli,1 Per E. Andren2 and Richard M. Caprioli1*1 Departments of Biochemistry and Pharmacology, Vanderbilt University School of Medicine, Nashville, TN 37232, USA2 Department of Pharmaceutical Biosciences, Uppsala University, P.O. Box 591, Biomedicum, SE-75124 Uppsala and
Department of Chemistry, National Veterinary Institute, P.O. Box 7073, SE-75007 Uppsala, Sweden3 Bristol Meyers Squibb, Princeton, NJ 08543, USA
The in vivo metabolism of peptide E was studied in the anesthetized rat using a combination of microdialysissampling, solid-phase preconcentration capillary electrophoresis and imaging matrix-assisted laser desorp-tion/ionization mass spectrometry (MALDI/MS). The metabolic proÐle of peptides identiÐed by MALDI/MSshowed that the primary enzymatic activity for degradation of peptide E was due to carboxypeptidases and, to alesser extent, aminopeptidases and some trypsin-like endopeptidases. Over 75 metabolic fragments were detectedfrom the action of these enzymes in vivo. Copyright 1999 John Wiley & Sons Ltd.(
KEYWORDS: peptide E; matrix-assisted laser desorption/ionization mass spectrometry ; microdialysis ; capillaryelectrophoresis
INTRODUCTION
Peptide E (YGGFMRRVGRPEWWMDYQKRYGGFL), a mu-selective opioid peptide derived fromproenkephalin A, and some of its metabolites have beenidentiÐed in brain and gastrointestinal tissue. Peptide Eis unusual in that it contains two biologically activepeptides that could contribute to opioid action, [Met]5-enkephalin at the amino-terminus and [Leu]5-enkepha-lin at the carboxyl-terminus. The in vivo metabolism ofpeptide E in rat brain has previously been studied inthis laboratory using microdialysis/capillary liquidchromatography/micro-electrospray mass spectrom-etry.1 In that preliminary study we were able to identifyseveral peptide E fragments which were processed extra-cellularly. However, since the processing of peptide E iscomplex, giving many fragments, a technique withhigher separation efficiency was required to providemore detailed metabolic information.
For the separation of peptides at low concentration,capillary electrophoresis (CE) is a well suited separationtechnique for coupling with mass spectrometry. Theseparation process is primarily based on di†erences in
* Correspondence to : M. Department of Biochemistry,R. Caprioli,Vanderbilt University School of Medicine, Nashville, TN 37232, USA
¤ This paper is dedicated to the memory of Professor Dr Wilhelm J.Richter.
Contract/grant sponsor : NIH; Contract/grant number : GM50529.
the electrophoretic mobility of analytes. Typical capil-lary dimensions are between 10 and 100 lm i.d. and30È100 cm in length, having a volume of a few micro-liters at most. As a consequence, the loadability of thesystem is limited to an injection volume of \100 nl,thus placing high sensitivity demands on the detectionsystem. Although techniques such as mass spectrometryhave improved the detection limits for peptides to theattomole level,2,3 the corresponding sample concentra-tion required for CE remains high4 (typically [10~6 M),precluding certain applications such as the neuro-peptide microdialysis studies where dilute sample solu-tions (10~10 M range) are collected. In addition,fractionation of the large number of compounds incomplex samples is essential to achieve optimum resultsfrom most analytical systems, including mass spectrom-etry.
In order to enhance sample concentration detectionlimits, several approaches have been reported in recentyears for analyte preconcentration in CE. Principally,they can be divided into two categories.5 The Ðrst cate-gory is electrophoresis-based, including such techniquesas sample stacking and isotachophoresis (ITP).6h12ITPÈCE can be implemented using either a dual capil-lary system or a single capillary system. The latterapproach is termed on-column transient ITP (tITP).5The utility of hydrodynamic counterÑow in tITPÈCEhas been explored to improve the separation efficiencywhile maintaining the increased concentration sensi-tivity.13 For many biologically derived samples, anadditional clean-up pretreatment remains necessary
CCC 1076È5174/99/040377È07 $17.50 Received 20 October 1998Copyright ( 1999 John Wiley & Sons, Ltd. Accepted 20 November 1998
378 H. ZHANG ET AL .
because of the presence of salts and other componentsnormally present in these samples.14,15 The secondcategory of methods are chromatographic, involving anon-line precolumn adsorptive phase for the purpose ofsample enrichment and clean-up.14,16 Both surface-bound open-tubular concentrators and packed columnswith a small bed of high-performance liquid chromato-graphic solid phase have been employed. The latterapproach has been referred as on-line solid-phasepreconcentrationÈCE (spPCÈCE).15 An enrichmentcapacity of at least two orders of magnitude has beendemonstrated in spPCÈCE for a variety of analytetypes,17h22 although a compromised performance of CEhas been observed.15,23 In addition, the relatively largevolumes of organic solvent required to elute analytesfrom the solid phase within the capillary may also havean adverse e†ect on the CE process.15,23 Anotherapproach is the use of an on-line impregnated mem-brane preconcentrator (mPCÈCE) in conjunction withtITP for the CE analysis of peptides.24
In this paper, we describe an in vivo study of peptideE metabolism which utilizes a capillary solid-phase pre-concentration apparatus in an “on-line transfer, o†-lineanalysisÏ approach to achieve optimum performance inCE and subsequent matrix-assisted laser desorption/ionization mass spectrometric (MALDI/MS) analysis.O†-line analysis has the advantage that the per-formance of each of the individual analytical techniquescan be optimized separately, while on-line transferallows maximum sample recovery and efficiency. Theprocedure is efficient and easy to accomplish. With thecombination of MALDI/MS detection using a matrix-precoated membrane target,3 the overall concentrationdetection limit was 10~11 M for neurotensin. Further,MALDI imaging software25 was developed and usedfor automatic acquisition and visualization of the elec-tropherograms of analytes on the deposited CE track.
EXPERIMENTAL
Chemicals
Peptide and protein standards and a-cyano-4-hydroxy-cinnamic acid (CHCA) were obtained from SigmaChemical (St Louis, MO, USA) and were used withoutfurther puriÐcation.
Materials
An lSIL-WAX capillary (50 lm i.d., 360 lm o.d.) waspurchased from J&W ScientiÐc (Folsom, CA, USA) andall other fused-silica capillaries (50 or 75 lm i.d., 360 lmo.d.) from Polymicro Technologies (Phoenix, AZ, USA).TeÑon tubing (0.3 mm i.d., 1.5 mm o.d.) was obtainedfrom Rainin Instruments (Woburn, MA, USA). All thereversed-phase packing materials (ODS-AQ A120 S10,YMCbasic, TMS A300 S5) were supplied by YMC(Wilmington, NC, USA). Spectra/Por regenerated cellu-lose membranes were obtained from Spectrum MedicalIndustries (Los Angeles, CA, USA).
On-line solid-phase preconcentration
The procedure for the preparation of the solid-phasepacked capillaries has been described elsewhere.26YMCbasic was packed in a 75 lm i.d. capillary whereasthe other two materials were packed in 50 lm i.d. capil-laries. For the packing of the TMS column, a few par-ticles of YMCbasic beads were Ðrst tapped into thecapillary prior to packing to hold the TMS beads inplace.
The solid-phase preconcentration device is a shortlength of packed capillary (5 cm contains D20 nl bedvolume) connected to a Valco 10-port injector with a 10ll external loop for sample loading. The injector alsocontains two delivery lines from syringes mounted onInstech Model 2000 syringe pumps, one syringe pumpcontaining CE bu†er (2% acetic acid) for sample load/washing and another containing 75% acetonitrile forelution.
On-line transfer, o†-line analysis capillaryelectrophoresis
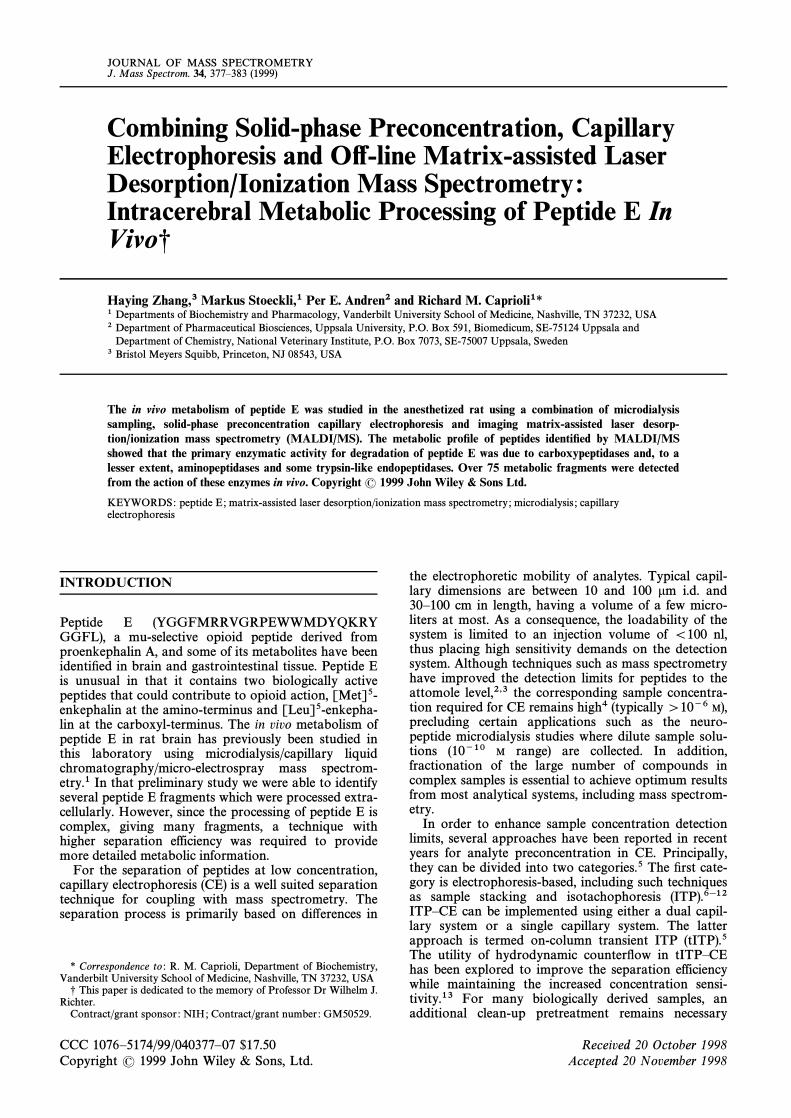
The “on-line transfer, o†-line analysisÏ procedure for thecombined spPC, CE and MALDI/MS system is illus-trated in Fig. 1. The concentrator capillary and the CEcapillary have the same o.d. (360 lm) and butt end-to-
Figure 1. Illustration of the ‘on-line transfer, off-line analysis’processes in a combined spPC CE and MALDI/MS imagingsystem.
Copyright ( 1999 John Wiley & Sons, Ltd. J. Mass Spectrom. 34, 377È383 (1999)
IN V IV O METABOLISM OF PEPTIDE E 379
end within a PTFE sleeve. A sample of typically 10 llwas loaded in the concentrator capillary and waswashed with CE bu†er to desalt, at a Ñow-rate of 0.5 llmin~1 [Fig. 1(A)]. An additional Ñow time of 3È4 minwas applied for the equilibration of the CE column. Theconcentrated and desalted sample was then eluted by aone-step organic solvent gradient at a Ñow-rate of 0.1 llmin~1 to achieve a narrow sample zone which wason-line transferred to the inlet of the CE capillary [Fig.1(B)]. The concentrator capillary was then immediatelymanually disconnected so that it would not deterioratethe performance of the subsequent electrophoresis andMALDI/MS analysis. Typically the concentrator capil-lary was switched o†-line 10 s after the sample zone hadentered the CE capillary, which allowed about 40 nl ofeluting solvent to enter the CE capillary.
The procedure for CE analysis, including target prep-aration and CE effluent deposition, has been detailedelsewhere.3 The CE eluate track deposited on the pre-coated cellulose target [Fig. 1(C)] was subsequentlyanalyzed by MALDI/MS. Typically, the track can bedeposited in 1È3 min per 50 mm target length and isabout 180 lm wide. Details can be found elsewhere.3Between sample analyses, the CE capillary was Ñushedwith several volumes of bu†er. The concentrator capil-lary was washed with several volumes of propan-2-ol,followed by equilibration with deionized water.
Mass spectrometry
MALDI/MS analysis was performed on a Voyager Elitetime-of-Ñight mass spectrometer (PerSeptive Biosys-tems, Framlingham, MA, USA) equipped with a nitro-gen laser (337 nm, 3 ns pulse). A pin-hole was placedimmediately in front of the laser source and the opticswere adjusted to give a spot size of about 30 lm diam-eter on the sample target. Analyses were performedusing the positive linear mode, with an acceleratingvoltage of 25 kV. For conventional MALDI/MS acqui-sition, the relative coordinates for each spectrum takenalong the deposited sample track were recorded duringacquisition and could be converted to electrophoreticmigration time.
To automate the MALDI analysis of the depositedCE track, software (MALDI Imaging Tool) wasdeveloped25 in order to scan the sample plate automati-cally. Basically, the software moves the sample plate,takes mass spectra and analyzes these data to produceÐles containing ion intensities in X,Y coordinates(further referred to as “image ÐlesÏ). Prior to data acqui-sition, the scan area on the sample plate and the spacingbetween image points are selected. Mass windows areselected for peaks of interest if desired. During theacquisition, the software scans these mass rangewindows and writes the MALDI peak area or theheight of the peak in these ranges to disk. With anaverage of Ðve laser shots per spot, it takes \3 s toacquire one spot and 500 spots analyzed along a trackrequire 25 min of acquisition time. By recording anddisplaying the MALDI signal intensities of multiplemass windows simultaneously, electrophoretic images ofselected ions can be generated. A second method forvisualization of the MALDI imaging data involves con-
version of the mass spectral data to chromatographic-type plots. This can be done by exporting the dataobtained with the MALDI image tool into a graphicsprogram. For example, the MALDI imaging data wereexported as text Ðles into SigmaPlot (SPSS) and theselected ion electropherograms were generated within afew minutes.
Microdialysis procedure
A male SpragueÈDawley rat was anesthetized with anintraperitoneal (i.p.) injection of pentobarbital (45 mgkg~1) and mounted in a stereotaxic frame (Stoelting,Wood Dale, IL, USA). An incision was made in thescalp, the skull exposed and a small hole drilled toallow implantation of the microdialysis probe into thestriatum. AnteriorÈposterior (AP ] 2.4), medialÈlateral(ML] 3.0) measurements were made with reference tobregma and the sagittal suture, respectively, and depth(dorsalÈventral, DV [6.5 mm) was measured from thesurface of the cortex. The coordinates were chosenaccording to the atlas of Pellegrino et al.27 A micro-dialysis probe with a membrane length of 4 mm (CMA/10, CMA Microdialysis, Sweden) was then slowlyinserted unilaterally into the striatum. The rats werekept anesthetized by a maintenance i.p. dose of pento-barbital (15È20 mg kg~1 every 90 min). The location ofthe microdialysis probe was determined after the experi-ment by examination of fresh frozen sections cut by acryomicrotome and inspected under a low-powermicroscope.
The microdialysis probe was used both to deliverpeptide E into the brain and to collect the degradationproducts. An infusion of 1 pmol ll~1 of peptide E inartiÐcial cerebrospinal Ñuid (CSF) was administered at300 nl min~1 for 30 min into the rat brain. A dialysisefficiency of about 15% was achieved, estimated from invitro calibration measurements, allowing a total ofabout 1.4 pmol to enter the brain. ArtiÐcial CSF wasperfused through the probe at a Ñow-rate of 300 nlmin~1 for 2 h prior to the peptide E infusion. Sampleswere taken every 30 min for 2 h.
RESULTS
spPC–CE/MALDI/MS performance
The “on-line transfer, o†-line analysisÏ was used in thecoupling of spPC and CE. Overall, CE separation effi-ciencies were maintained reasonably well while stillmaintaining the high concentration capability of spPC.Figure 2 shows the separation of a protein mixtureusing a polyethylene glycol-coated CE capillary (J&WmSIL-WAX) with and without spPC. Use of a pre-C1column allowed a concentration factor of about 500 tobe achieved, and the CE migration characteristics werereasonably comparable to those in conventional CE,although some degradation of resolution occurred [Fig.2(a) vs. 2(b)]. For small, hydrophilic peptides, a solidphase of or higher carbon load was found to beC8
Copyright ( 1999 John Wiley & Sons, Ltd. J. Mass Spectrom. 34, 377È383 (1999)

380 H. ZHANG ET AL .
Figure 2. (a) Electropherogram obtained using the combinedspPC and CE technique for the separation of a mixture of five pro-teins (cytochrome c, lysozyme, lactoglobulin A, ribonuclease Aand carbonic anhydrase). spPC conditions : 10 ll of 10 fmol llÉ1
each in 40 mM phosphoric acid ; TMS column with YMCbasic atthe tip ; 70% acetonitrile with 5% acetic acid as elution solvent. CEconditions : 76 cm lSIL-WAX capillary ; 10mM sodium phosphate(pH 2.8) ; 30 kV. (b) Electropherogram for a similar separationobtained using hydrostatic loading. Sample, 5 pmol llÉ1 each inwater ; 30 s loading.
Figure 3. (a) Electropherogram obtained using the combinedspPC and CE technique for the separation of a mixture of six pep-tides (kallidin, angiotensin I, neurotensin, insulin B-chain, caso-morphin, physalaemin). spPC conditions : 10 ll of 72 fmol llÉ1
each in CSF; ODS-AQ column, 75% acetonitrile with 2% aceticacid as elution solvent. CE conditions : 45 cm capillary ; 2% aceticacid ; 25 kV. (b) Electropherogram for a similar separation obtainedusing hydrostatic loading. Sample, 36 pmol llÉ1 in water ; 30 sloading.
more appropriate. Figure 3(a) shows the CE separationof a peptide sample after preconcentration and desaltingon an ODS-AQ column. Good separation was obtainedwith a concentration factor of about 500 [Fig. 3(a) vs.3(b)]. The D40 nl volume of organic solvent appearedto have some e†ect on the electroosmotic Ñow in thatthe electropherographic peaks more slightly compactedin time. When the spPC and CE device was usedtogether with MALDI/MS and a membrane target,3 afurther improvement in terms of sample concentrationwas achieved. For a typical sample injection of 10 ll, asingle-to-noise ratio of [3 : 1 was obtained for thepeptide neurotensin at 1.0 ] 10~11 M in physiologicalsalt solution [Fig. 4(a)], while that for the protein ribon-uclease A, also in physiological salt solution, required asample concentration of about 20-fold higher [Fig.4(b)]. Both experiments were performed using a YMC-basic column.
In vivo metabolism of peptide E
The combined spPC, CE and MALDI/MS imagingtechnique was employed for the analysis of in vivomicrodialysis samples obtained from the brain of afreely moving rat in a study of the metabolism ofpeptide E. The dialysate should therefore containpeptide metabolites of peptide E in addition to remain-ing (unprocessed) peptide E. The sample was precon-centrated using a YMCbasic column. CE conditionswere used which allowed the peptide metabolites to
Figure 4. (a) MALDI mass spectrum of neurotensin obtainedusing the combined spPC, CE and MALDI/MS technique spPCconditions : 10 ll of 10 amol llÉ1 in CSF; YMC basic column;70% acetonitrile with 2% acetic acid and 0.15% TFA as elutionsolvent. CE conditions : 55 cm capillary ; 2% acetic acid ; 30 kV. (b)MALDI mass spectrum of ribonuclease A obtained using the com-bined spPC, CE and MALDI/MS technique. The spPC conditionswere similar to those in (a) except that the sample was 400 amolllÉ1 in CSF. CE conditions : 71 cm lSIL-WAX capillary ; 10 mM
sodium phosphate (pH 2.8) ; 30 kV; 30 cm hydrostatic height.
Copyright ( 1999 John Wiley & Sons, Ltd. J. Mass Spectrom. 34, 377È383 (1999)
IN V IV O METABOLISM OF PEPTIDE E 381
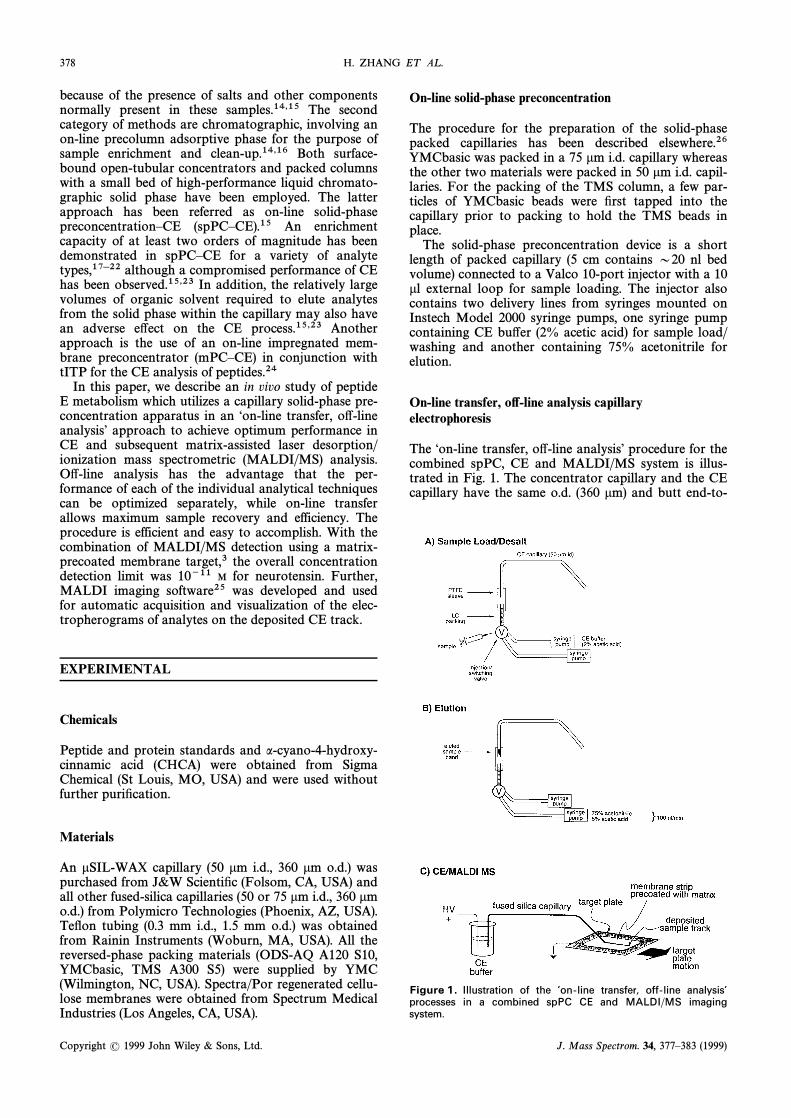
Figure 5. Selected ion electropherographic images obtainedusing the combined spPC, CE and MALDI/MS imaging techniquefor the analysis of a peptide E microdialysis sample. spPC condi-tions : 9 ll dialysate loading; YMCbasic column; 75% acetonitrilewith 5% acetic acid as election solvent. CE conditions : 58 cm cap-illary ; 2% acetic acid ; 30 kV.
migrate out of the CE capillary and be deposited on thematrix precoated membrane target in a single trackwithin a 3 min time window. Analysis of 9 ll of thedialysate showed that over 80 metabolites of peptide Ewere separated and tentatively identiÐed based on theirmolecular masses. Figure 5 shows the selected ion elec-tropherographic images of 68 of these metabolites.These images were generated by the MALDI ImagingTool and exported as TGA Ðles into Microsoft Word.Most of the CE bandwidths are \10 s. Metabolites
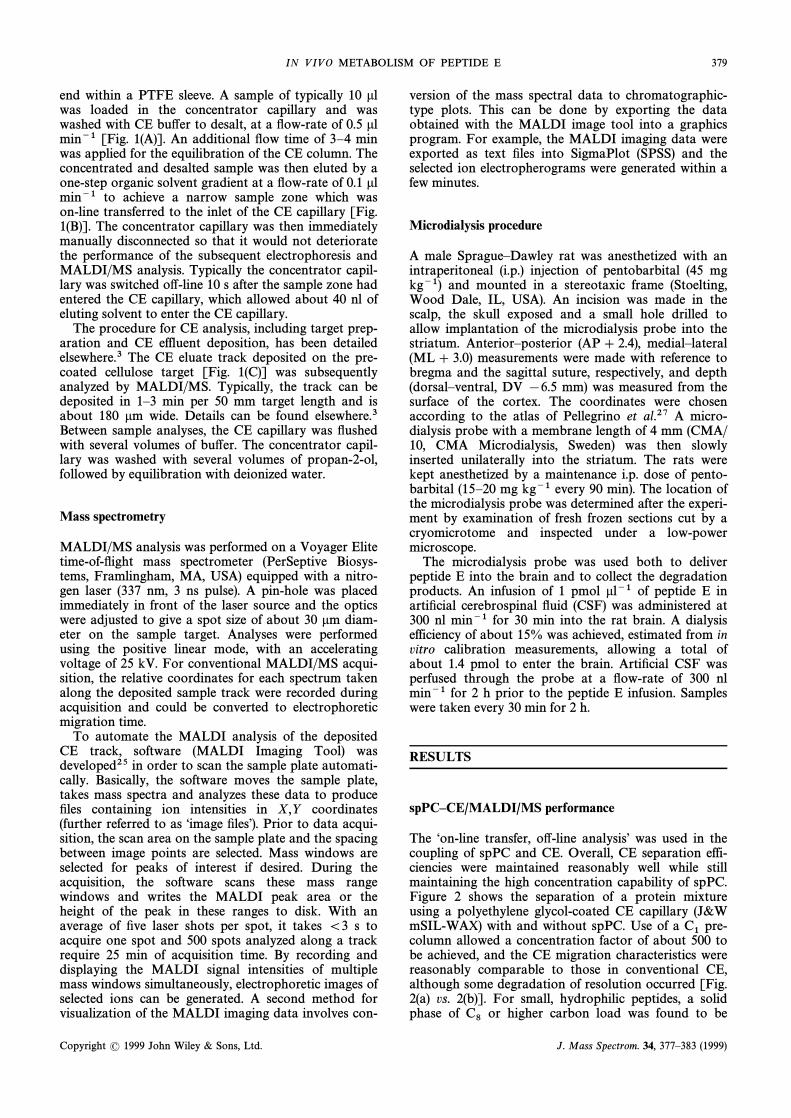
Figure 6. MALDI mass spectrum taken from one of the tracksshown in Fig. 5 at Á210 s (m /z 1055.5).
Figure 7. Arrangement of peptides, identified from their molecu-lar masses, from the in vivo metabolism of peptide E. In a fewcases where several peptides were possible given the experimentalerror of mass measurements (À0.5 Da), the closest fit to the mea-sured mass is shown.
were well di†erentiated by their mass-to-charge (m/z)and therefore overlapping peaks were not common. Inthe cases where the same masses occurred (such as m/z1246.5 and 1246.6), these could be distinguished by theirCE migration di†erences. The CE separation, althoughin this case only a partial separation, was sufficient toremove interfering substances and minimize the ionsuppression e†ects in the mass spectrometer, and thus
Copyright ( 1999 John Wiley & Sons, Ltd. J. Mass Spectrom. 34, 377È383 (1999)
382 H. ZHANG ET AL .
greatly improved MALDI/MS detection and identiÐca-tion. Figure 6 shows a representative MALDI massspectrum of m/z 1055.6 obtained from the MALDIimage of the CE track. From the pattern of fragments,summarized in Fig. 7, it appears that the peptide is pri-marily metabolized by carboxypeptidases and amino-peptidases. There are also several endopeptidasecleavage points at internal arginyl residues, followed byexopeptidase cleavage of these fragments. In contrast, aportion of the dialysate sample collected from the samemicrodialysis experiment was analyzed directly withoutCE separation (using micro-spotting MALDI/MS tech-niques described previously26) and only 39 metaboliteswere identiÐed.
DISCUSSION
The opioid neuropeptide peptide E is derived from itsprecursor proenkephalin A. Immunoreactive proenkep-halin fragments have been localized in mammalianhypothalamic extracts and also the striatum and theseptum. Brain membrane binding studies have shownthat the proenkephalin A-derived fragments interactwith various opioid receptor subtypes. The possibilityarises that actions thought to be initiated by larger frag-ments might actually result from smaller metabolic frag-ments speciÐc for one of the opioid receptor subtypes.Enzymatic peptide processing, therefore, may be anextremely important factor in determining the amounts,activities and selectivities of endogenous opioid pep-tides.
In the present study we were able to identify severalfragments of peptide E that are known to have potentbiological activity. For example, peptide E is rapidlycleaved to a fragment termed peptide E 15È25 (Mr1376). Peptide E 15È25 has a high affinity for the deltaopioid receptor and displays an activity proÐle charac-teristic of delta opioid peptides. No detailed study hasbeen made of the processed end-product opioid pep-tides in the brain in vivo. From our data, it is clear thatthe action of carboxypeptidases is the major route ofmetabolism of this and also other peptide E fragments.Other proteases can be implicated from the metabolicfragment pattern, such as aminopeptidase and atrypsin-like endoprotease. Several primary cleavagesites are observed on the C-terminal side of residues R6and R7, rendering the N-terminal [Met]5-enkephalincontaining fragments (m/z 730.3 and 886.4) and the C-terminal fragments which underwent extensive furtherdegradation. For example, 10 metabolites wereobserved with their sequences starting with an N-terminal R7. Similarly, there may be several internalcleavage sites on the C-terminal side of residues Y17,Q18 and K19, producing the C-terminal [Leu]5-enkep-halin containing fragments (m/z 968.5, 840.5 and 712.4).These N-terminal fragments also extensively degradedby exoproteases.
Peptide E contains two embedded neuropeptides,met- and leu-enkephalin (residues 1È5 and 20È25,respectively) at the two terminals, and therefore it is notsurprising that exopeptidases are the primary metabolicenzymes which appear to degrade peptide E. Although
met- and leu-enkephalin were not observed in theseexperiments, presumably owing to their rapid releaseand subsequent hydrolysis, they have been observed inother experiments of a similar nature but where largerdoses of peptide E were infused into the brain.1 Thegoal of future work is to determine which of the meta-bolic fragments containing the embedded neuropeptideshave biological activity and how much.
For the analysis of complex mixtures of peptides dis-solved in solutions containing high salt concentrations,the solid-phase capillary preconcentration method com-bined with CE and MALDI/MS for “on-line transfer,o†-line analysisÏ has considerable advantages. BrieÑy,these are as follows : (1) the CE separation is for themost part separated from the preconcentration step,allowing each step to be optimized independently ; (2)preconcentration columns of di†erent types may beused alternatively on the same CE apparatus forsamples with wide chemical diversity ; (3) the nano-scaleon-line transfer e†ectively passes the spPC concentra-tion power to the CE stage ; and (4) the coupling deviceis simple and easy to implement, lending itself toautomation.
The time needed for the MALDI Imaging Tool toscan through a CE track is largely dependent on boththe setting of the scan step size and the size of the scanarea. For analysis of the CE track containing peptide Emetabolites (Fig. 5), 12 parallel laser scan lines weretaken along the 5 cm CE track with a step size of 80lm, giving a total of 631 laser spots per scan line (eachscan line was 80 lm apart) for a total of 7572 datapoints. However, it is noted that the information from asingle track, taking about 2.5 h of acquisition time, wassufficient to identify the peptide fragments ; the 12 paral-lel tracks of data were taken to ensure complete dataanalysis in the early development of this technique.Current improvements to the software have allowedspeeds of \1 s per spot depending on the amount ofdata to be saved. In cases where structural informationis needed and, for example, post-source decay methodsare required, a survey imaging scan with larger step sizecould be used to generate an electropherographicproÐle and the remaining material on the track used forthese structural studies.
The present study o†ers a tenable means of determin-ing how precursor molecules are di†erentially processedto end-product peptides from in vivo experiments. Ito†ers the advantage of being compatible with micro-dialysis sampling in being able to deal with low concen-trations of metabolites in high concentrations of saltand in mixtures containing 100 or more compounds ofa similar chemical nature.
Acknowledgements
The authors acknowledge NIH grant GM50529 for support of thiswork, and thank Beverly B. DaGue (Analytical Chemistry Center,University of Texas Medical School at Houston) for her expert advice.P. E. Andre� n acknowledges the Swedish Medical Research Council,grant No. 11565. This paper is submitted in partial fulÐllment of therequirements of H. Zhang for the degree of Doctor of Philosophy inthe Graduate School of Biomedical Sciences, University of TexasHealth Science Center, Houston, TX.
Copyright ( 1999 John Wiley & Sons, Ltd. J. Mass Spectrom. 34, 377È383 (1999)
IN V IV O METABOLISM OF PEPTIDE E 383
REFERENCES
1. P. E. Andren, M. R. Emmett and R. M. Caprioli, in Proceedingsof the 43rd ASMS Conference on Mass Spectrometry andAllied Topics , Atlanta, GA, May 21–26, 1995, p. 518.
2. J. H. Wahl, D. R. Goodlett, H. R. Udseth and R. D. Smith,Anal . Chem. 64, 3194 (1992).
3. H. Zhang and R. M. Caprioli, J . Mass Spectrom. 31, 1039(1996).
4. R. M. McCormick, Anal . Chem. 60, 2322 (1988).5. T. J. Thompson, F. Foret, P. Vouros and B. L. Karger, Anal .
Chem. 65, 900 (1993).6. F. M. Everaerts, T. P. E. M. Verheggen and F. E. P. Mikkers, J .
Chromatogr . 169, 21 (1979).7. R. Aebersold and H. D. Morrison, J. Chromatogr . 516, 79
(1990).8. S. E. Moring, J. C. Colburn, P. D. Grossman and H. H. Lauer,
LC–GC 8, 34 (1990).9. R. L. Chien and D. S. Burgi, J . Chromatogr . 559, 141 (1991).
10. F. Foret, V. Sustacek and P. Bocek, J. Microcol . Sep. 2, 299(1990).
11. D. S. Stegehuis, H. Irth, U. R. Tjaden and J. van der Greef, J .Chromatogr . 538, 393 (1991).
12. D. Kaniansky and J. Marak, J. Chromatogr . 498, 191 (1990).13. N. J. Reinhoud, U. R. Tjaden and J. van der Greef, J . Chro-
matogr . 673, 239 (1994).14. J. Cai and Z. El Rassi, J . Liq . Chromatogr . 15, 1179 (1992).15. A. J. Tomlinson, N. A. Guzman and S. Naylor, J . Capillary
Electrophor . 2, 247 (1995).16. N. A. Guzman, M. A. Trebilock and J. P. Advis, J . Liq . Chro-
matogr . 14, 997 (1991).17. M. E. Swartz and M. Merion, J.Chromatogr . 632, 209 (1993).18. A. M. Hoyt, Jr, S. C. Beale, J. P. Larmann, Jr, and J. W. Jor-
genson. J.Microcol . Sep. 5, 325 (1993).19. L. M. Benson, A. J. Tomlinson and S. Naylor, J . High Resolut .
Chromatogr . 17, 671 (1994).20. M. A. Strausbauch, B. J. Madden, P. J. Wettstein and J. P.
Landers, Electrophoresis 16, 541 (1995).21. J. H. Beattie, R. Self and M. P. Richards, Electrophoresis 16,
322 (1995).22. I. Morita and J. Sawada, J.Chromatogr . 641, 375 (1993).23. A. J. J. Debets, M. Mazereeuw, W. H. Voogt, D. J. van Iperen,
H. Lingeman, K.-P. Hupe and U. A. Th. Brinkman, J. Chro-matogr . 608, 151 (1992).
24. A. J. Tomlinson and S. Naylor, J . High Resolut . Chromatogr .18, 384 (1995).
25. M. Stoeckli, T. B. Farmer and R. M. Caprioli, J . Am. Soc. MassSpectrom. 10, 67 (1999).
26. H. Zhang, P. Andren, and R. M. Caprioli, J . Mass Spectrom.30, 1768 (1995).
27. L. J. Pellegrino, A. S. Pellegrino and A. J. Cushmen, A Stereo-toxic Atlas of the Rat Brain , 2nd edition, Plenum Press, NewYork (1979).
Copyright ( 1999 John Wiley & Sons, Ltd. J. Mass Spectrom. 34, 377È383 (1999)


![Preconcentration, thermal desorption & analysis of ... · [3] US EPA (1997): «Compendium method TO-17 : Détermination of volatile organic compounds in ambient air using active sampling](https://img.pdfslide.us/doc/110x75/5f2ff683816ba37d836b4b81/preconcentration-thermal-desorption-analysis-of-3-us-epa-1997-compendium.jpg)