Embed Size (px)
Citation preview
Combining pedestrian simulation with a network flow optimization to
support security staff in handling an evacuation of a soccer stadium
Angelika Kneidl1, Markus Thiemann2, Dirk Hartmann3, André Borrmann1
1 Computational Modeling and Simulation Group, Technische Universität München 2Technische Universität Kaiserslautern
3Siemens AG, CT T DE TC3, München [email protected]
Abstract: In our contribution, we present a technique to route virtual pedestrians in a microscopic pedestrian simulation according to an optimal macroscopic dynamic network flow. The objective is to support security staff in planning and handling of major events by providing recommended distribution ratios at walkway junctions. Guiding pedestrians according to these distribution ratios helps to reduce the overall evacuation time by avoiding congested areas and thus preventing potentially dangerous situations upfront. We apply our approach on a real-world scenario, namely the surroundings of a soccer stadium, where we compare simulation results gained with and without an integrated optimization algorithm.
1 Introduction
Pedestrian simulations are used for a variety of applications, e.g. for calculation of evacuation times, identification of possible conflict points such as bottlenecks in buildings and surroundings, as well as determination of optimal evacuation routes. Different foci and the corresponding approaches can be found in Schadschneider et al. (2009).
Our objective is to develop a pedestrian simulator which serves as a training simulator for security staff of major events. The staff shall be able to simulate the evacuation of a certain scenario in order to detect possible critical points or bottlenecks. Dangerous situations can be prevented upfront by taking into account these findings during the planning of events. By doing so, the overall evacuation time can be reduced and a more secure evacuation can be conducted. Our case study refers to the surroundings of the soccer stadium of Kaiserslautern (Betzenberg).
To simulate pedestrian behavior, we use a microscopic pedestrian simulator. To map spatial orientation of pedestrians we extend this simulator by a navigation graph. This graph does not only serve as a basis for routing pedestrians, but can also be extended to a dynamic network for applying optimization algorithms. Using optimization, we can derive minimum evacuation times for a given scenario (Hamacher et. al. 2002, Hamacher et. al. 2010). The resulting time-dependent flow-distribution at each node (i.e. crossing) can be used by security staff to decide how to route pedestrians at
crossings in order to avoid congestions. Nevertheless, network flow optimization itself does not take into account pedestrian interaction, such as avoidance of dense areas or evading pedestrians, who walk in opposite direction. Therefore, the evacuation times resulting from optimization itself will in general be too optimistic.
In (Kneidl et al. 2010) we combine simulation and optimization approaches by means of a control cycle feeding output from one model into the other, and vice versa. This is reasonable, since the modification of route assignments resulting from the optimization run may lead to different microscopic behavior which has to be determined by the simulation. To include microscopic aspects in the optimization model, network parameters are adjusted based on the simulation run and then used as input for another optimization run. After a number of rounds of the control cycle, the evacuation time of both, simulation and optimization, converges to a steady state.
This approach works well for small scenarios, i.e. scenarios with few intersections and edges. For larger scenarios, it is difficult to balance both approaches in terms of the definition of correct start parameters and capacities, like the number of pedestrians entering an edge during one time step. This differs between simulation and optimization, since the optimization ignores microscopic aspects and therefore sends more pedestrians than the simulation will send. In small scenarios, it is possible to adjust these values, but it gets more complicated with many intersections – then the values influence each other too much and lead to high oscillations of the evacuation time. As a result, the gap between the evacuation times determined by the different approaches does not close. However, also a single optimization run can severely improve the distribution of the pedestrians among the different egress routes and hence reduce the evacuation time. Thus, for large-scale scenarios, we ignore the errors introduced by estimating the network flow parameters and combine simulation and optimization approaches only within one cycle: We perform one optimization run and feed the resulting edge load distributions into the simulation. In this way – provided that the assumptions of the macroscopic parameters are realistic - we can reduce the evacuation time of the simulation and provide distribution rates to support security staff.
2 Simulation setup
For a training simulator there exist concurrent requirements: It should be able to be run in real-time for a large number of pedestrians (~ 40.000) while having a fine resolution for a large area (1 km x 1 km).
To fulfill these requirements, a microscopic model was chosen which is based on a cellular automaton with a hexagonal grid. The size of one grid cell is implemented in such way that one person can occupy exactly one cell per time step. The potential field values of each cell are derived from the superposition of different potentials which influence each simulated pedestrian: A driving force to the destination, to which the pedestrian walks, and repellent potentials from other pedestrians and obstacles, which distract the pedestrian from the direct route. A pedestrian always chooses the neighbor cell with the lowest value, i.e. the pedestrian is trying to descent along the gradient of
the superimposed potential field. With this approach, interactions between pedestrians can be modeled and local phenomena like bottlenecks and lane formation can be observed. However, the route choice behavior of pedestrians as well as the influence of e.g. security staff located at strategic crossings cannot be modeled by this approach. Therefore the model is extended by a navigation layer, which maps spatial orientation of pedestrians: The layer is implemented as a navigation graph, on which different routing strategies can be applied, e.g. pedestrians who are familiar / are not familiar with a location. The model is depicted Figure 1. A detailed description of the model can be found in Klein et al. (2010) and Kneidl et al. (2011).
Using the simulation standalone, it is possible to assign routes to each pedestrian. However, the simulation cannot determine how the pedestrians can be distributed in such a way, that no congestions occur or at least as few as possible. Transferred to the application – serving as a training simulator – the simulation alone cannot support the security staff in making decisions with respect to optimally distributing pedestrians on the different routes available. Combining the simulation with an optimization algorithm helps to determine these distribution rates.
Figure 1: Hierarchical structure of the simulation model
3 Optimization setup
The optimization model relies on a dynamic network G consisting of a set of nodes N and a set of edges � ⊂ � × �. The edges refer to streets, walkways, stairs, etc. The nodes represent crossroads, junctions and sources as well as safe destinations for pedestrians. The set of sources is denoted by � ⊂ �, the set of safe destinations is defined as � ⊂ �. Each pedestrian is modeled as a flow unit traversing the network along edges from a specified starting node � ∈ � to a safe node ∈ �. We consider a discrete dynamic network, i.e. all parameters in the model are integral.
The time it takes for a flow unit to travel from node i to node j along an edge �, � ∈ � is defined as the edge travel time ��� ∈ ℤ�
�, i.e. a flow unit starting at node i at time t arrives at node j at time � +��� . The number of flow units that can enter edge �, � ∈
�at each time step is defined by the edge capacity ��� ∈ ℤ�. For each node � ∈ � the number of flow units starting at this node is given by the balance �� . Thus, the total number of pedestrians, which have to be evacuated is � = ∑ �� .�∈� A dynamic flow in the network G is an assignment of flow values to edges at each time step, such that for each time step flow is conserved at all nodes (i.e. the amount of inflow equals the amount of outflow) except at source and destination nodes while capacity constraints are fulfilled for all time steps on all edges in the network.
Evacuation problems can be handled by solving the quickest transshipment problem
which computes the minimum time to send all flow units from source nodes to safe destinations (Hoppe and Tardos 1995). As an output, routes through the network are assigned to individual pedestrians in such a way that the network topography is used optimally. The optimization result is represented by time-dependent flow-distribution rates at each node, which can reflect guidance at crossings.
The dynamic network optimization approach is capable of computing provable minimum evacuation times. However, the model does not allow individual free flow velocities and does not take into account local effects such as interaction between individuals and congestion and may therefore underestimate the actual total evacuation time.
4 Combining both approaches
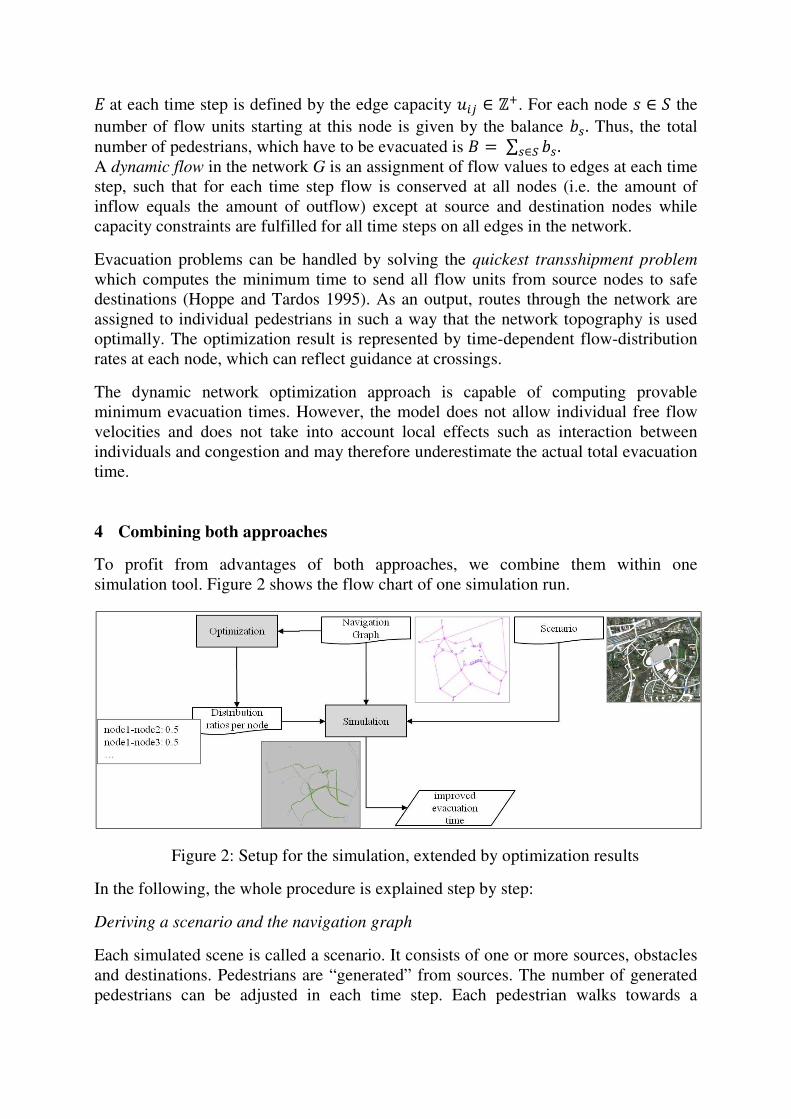
To profit from advantages of both approaches, we combine them within one simulation tool. Figure 2 shows the flow chart of one simulation run.
Figure 2: Setup for the simulation, extended by optimization results
In the following, the whole procedure is explained step by step:
Deriving a scenario and the navigation graph
Each simulated scene is called a scenario. It consists of one or more sources, obstacles and destinations. Pedestrians are “generated” from sources. The number of generated pedestrians can be adjusted in each time step. Each pedestrian walks towards a
destination which has been assigned during generation. Obstacles refer to walls or fences as well as buildings or non-accessible areas (like forests, fields).
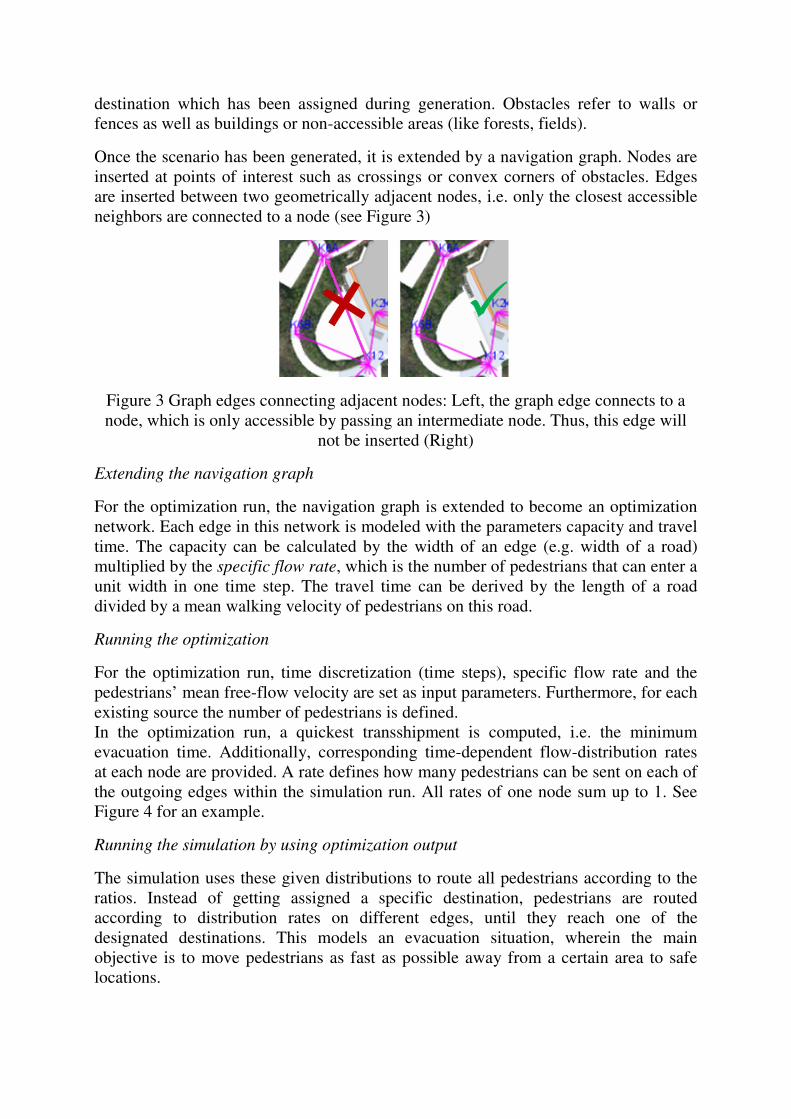
Once the scenario has been generated, it is extended by a navigation graph. Nodes are inserted at points of interest such as crossings or convex corners of obstacles. Edges are inserted between two geometrically adjacent nodes, i.e. only the closest accessible neighbors are connected to a node (see Figure 3)
Figure 3 Graph edges connecting adjacent nodes: Left, the graph edge connects to a node, which is only accessible by passing an intermediate node. Thus, this edge will
not be inserted (Right)
Extending the navigation graph
For the optimization run, the navigation graph is extended to become an optimization network. Each edge in this network is modeled with the parameters capacity and travel time. The capacity can be calculated by the width of an edge (e.g. width of a road) multiplied by the specific flow rate, which is the number of pedestrians that can enter a unit width in one time step. The travel time can be derived by the length of a road divided by a mean walking velocity of pedestrians on this road.
Running the optimization
For the optimization run, time discretization (time steps), specific flow rate and the pedestrians’ mean free-flow velocity are set as input parameters. Furthermore, for each existing source the number of pedestrians is defined. In the optimization run, a quickest transshipment is computed, i.e. the minimum evacuation time. Additionally, corresponding time-dependent flow-distribution rates at each node are provided. A rate defines how many pedestrians can be sent on each of the outgoing edges within the simulation run. All rates of one node sum up to 1. See Figure 4 for an example.
Running the simulation by using optimization output
The simulation uses these given distributions to route all pedestrians according to the ratios. Instead of getting assigned a specific destination, pedestrians are routed according to distribution rates on different edges, until they reach one of the designated destinations. This models an evacuation situation, wherein the main objective is to move pedestrians as fast as possible away from a certain area to safe locations.
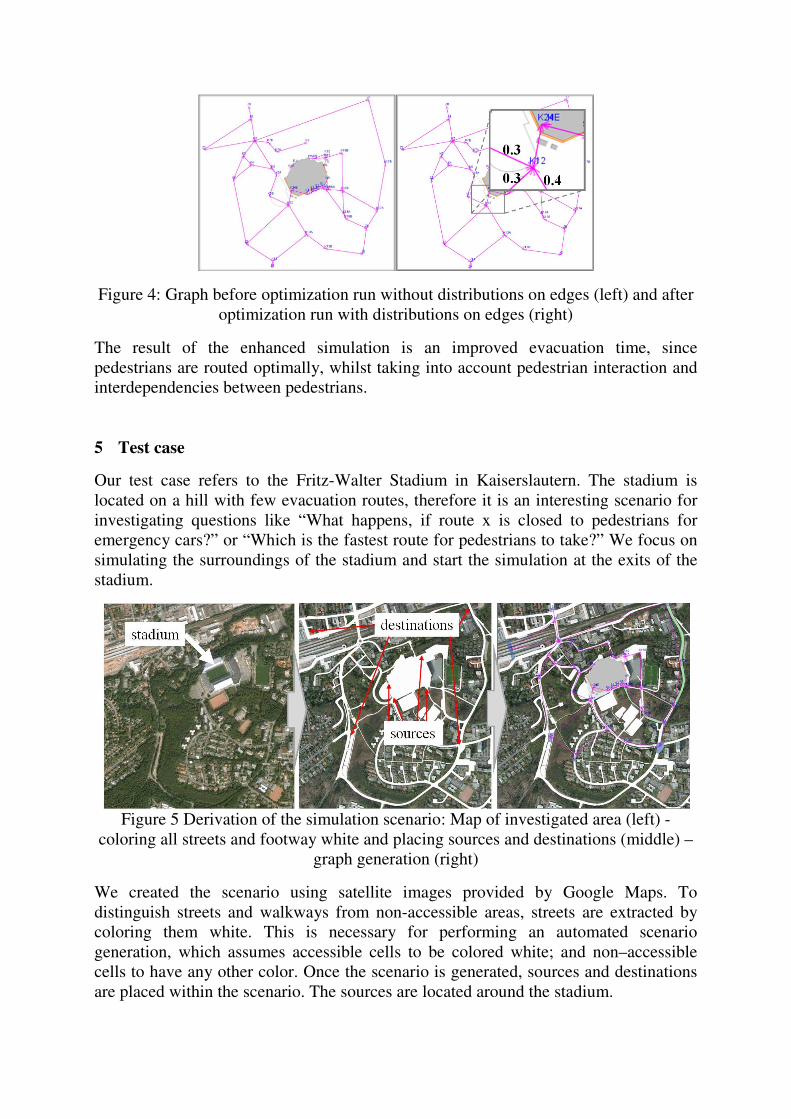
Figure 4: Graph before optimization run without distributions on edges (left) and after optimization run with distributions on edges (right)
The result of the enhanced simulation is an improved evacuation time, since pedestrians are routed optimally, whilst taking into account pedestrian interaction and interdependencies between pedestrians.
5 Test case
Our test case refers to the Fritz-Walter Stadium in Kaiserslautern. The stadium is located on a hill with few evacuation routes, therefore it is an interesting scenario for investigating questions like “What happens, if route x is closed to pedestrians for emergency cars?” or “Which is the fastest route for pedestrians to take?” We focus on simulating the surroundings of the stadium and start the simulation at the exits of the stadium.
Figure 5 Derivation of the simulation scenario: Map of investigated area (left) -
coloring all streets and footway white and placing sources and destinations (middle) – graph generation (right)
We created the scenario using satellite images provided by Google Maps. To distinguish streets and walkways from non-accessible areas, streets are extracted by coloring them white. This is necessary for performing an automated scenario generation, which assumes accessible cells to be colored white; and non–accessible cells to have any other color. Once the scenario is generated, sources and destinations are placed within the scenario. The sources are located around the stadium.
Simulation without
Optimization Simulation with Optimization
After 10
minutes
After 15
minutes
After 20
minutes
After 25
minutes
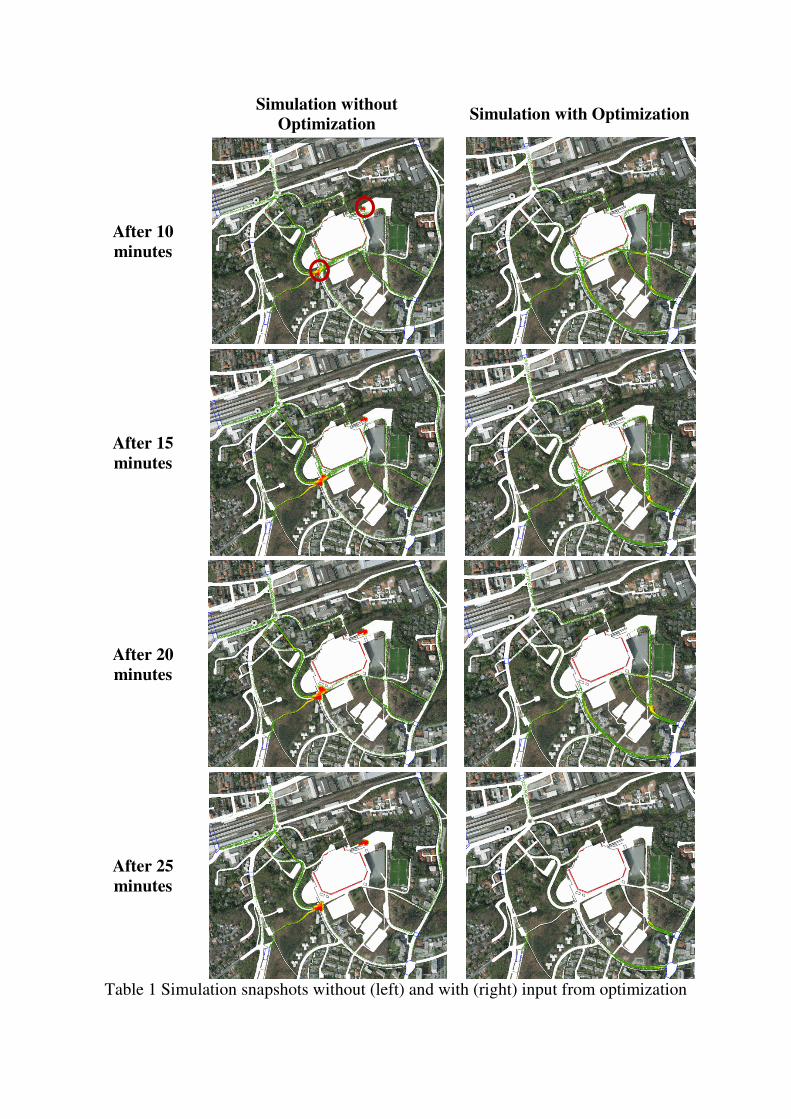
Table 1 Simulation snapshots without (left) and with (right) input from optimization
Destinations are placed at surrounding parking places and at the main station. From this scenario the navigation graph is derived. It forms the basis of the simulation and optimization. Table 1 shows the steps of the scenario generation.
The simulation was run using the following parameter values: In total, 40.000 pedestrians were simulated to exit the stadium, heading to one of the modeled destinations. The allocation of pedestrians to the sources was done according to statistical data provided by the security staff of the stadium.
The results of the simulation runs are depicted in Table 1. The green dots represent pedestrians moving along their way to the destination. Yellow dots represent more crowded areas, while red dots illustrate congestions.
In the simulation run without using the optimization algorithm (left-hand side), there are huge congestions, which occur already after 10 minutes. Since flow distributions at nodes have not been defined explicitly, all routes have the same probability and are therefore chosen equally by the pedestrians. The pictures on the right-hand side show the simulation results when using the edge distributions determined by the optimization algorithm. One can directly observe the improved flows at areas which were congested before. Security staff can profit from these results and use it for planning and handling major events.
As another consequence, the overall evacuation time decreases with the improved simulation. For 40,000 pedestrians, the evacuation time in the simulation without optimization input is improved by about 20 % by including optimal distribution rates on the edges.
6 Conclusion
In our contribution we presented a combination of microscopic pedestrian simulation and a macroscopic optimization technique to route virtual pedestrians optimally through a scenario. The presented test case refers to a soccer stadium. The results support security staff in planning and handling major events.
We explained the setup of the combined simulation and optimization in detail. Using this setup, we built our test case and simulated the scenario without and with a combination of both approaches. The results show that the combination of both techniques improves the pedestrian flow and decreases the total evacuation time.
Security staff is able to detect possible critical points or bottlenecks using such simulations. Dangerous situations can be prevented upfront by taking into account these findings during the planning of events.
This approach can now serve as a basis to simulate different what-if scenarios, such as the closing of certain walkways, for example. The basic scenario can easily be adapted by adding or deleting edges of the graph and the corresponding network. Thus, the security staff is able to conduct simulations by their own and change the scenarios depending on given situations and changing standards or requirements.
7 References
Hamacher, H. W., Heller, S., Klein, W., Köster, G., Ruzika, S., (2010). A Sandwich Approach for Evacuation Time Bounds. In: R.D. Peacock, E.D. Kuligowski, and J.D. Averill (Eds.), Pedestrian and Evacuation Dynamics, pp. 503-514, Springer US.
Hamacher, H. W., Tjandra, S. A. (2002). Mathematical Modelling of Evacuation Problems: A State of the Art. In: M. Schreckenberg and S.D. Sharma (Eds.), Pedestrian and Evacuation Dynamics, pp. 227-266, Springer, Berlin Heidelberg.
Hoppe, B., Tardos, É. (1995). The Quickest Transhipment Problem. Proceedings of the sixth annual ACM-SIAM symposium on Discrete algorithms, pp. 512-521.
Kneidl, A., Thiemann, M., Borrmann, A., Ruzika, S., Hamacher, H. W., Köster, G., Rank, E. (2011). Bidirectional Coupling of Macroscopic and Microscopic Approaches for Pedestrian Behavior Prediction. In: R.D. Peacock, E.D. Kuligowski, and J.D. Averill (Eds.), Pedestrian and Evacuation Dynamics, pp. 459-470, Springer US.
Kneidl, A., Borrmann A., Hartmann, D. (2011). Generating sparse navigation graphs for microscopic pedestrian simulation models. Proc. of the 2011 EG-ICE Workshop, Enschede, The Netherlands. Klein, W., Köster, G., Meister, A. (2010), Towards the Calibration of pedestrian stream models. In: J. Weglarz, R. Wyrzykowski & B. Szymanski (Eds.), 8th Int. Conf. on Parallel Processing and Applied Mathematics, Springer, Berlin.
Schadschneider, A, Klingsch, W, Kluepfel, H, Kretz, T, Rogsch, C., Seyfried, A., (2009). Evacuation dynamics: Empirical results, modeling and applications, Encyclopedia of Complexity and System Science, pp. 3142–3176.