Embed Size (px)
Citation preview
Combining Low-Temperature Combustion With Lean-NOx Trap Yields Progress Toward Targets Of Efficient NOx Control For Diesels
Presented by Shean Hufffeerc.ornl.gov/[email protected]
Oak Ridge National LaboratoryFuels, Engines, Emissions Research Centerfeerc.ornl.gov
DEER 2005August 25, 2005Technical Session: Advanced Combustion Technologies, Part 2
Sponsor: U.S. Department of Energy, OFCVTProgram Managers: Ken Howden, Gurpreet Singh, Kevin Stork
10/25/2005
This presentation discusses intermediate results for the work being done at the Oak Ridge National Laboratory in the area of Lean NOx Trap (LNT) research. The focus of the talk is to demonstrate how the use of Low Temperature Combustion (LTC) can regenerate the LNT and can be an effective way to achieve fuel efficient NOx control for diesels.
I’d like to thank our program managers Ken Howden, Gurpreet Singh, and Kevin Stork for funding out work.

2OAK RIDGE NATIONAL LABORATORYU. S. DEPARTMENT OF ENERGY
Diverse ORNL Team Working on This Project• Engine system management, experiment design, data
collection and analysis− Shean Huff− Brian West− Jim Parks− Matt Swartz
• Analytical chemistry− John Storey− Sam Lewis− Bill Partridge
• Bench reactors− Todd Toops − Jae-Soon Choi
• Modeling (CLEERS interaction)− Stuart Daw− Kalyan Chakravarthy
As you can see, we have a large team working on this project involving engine system management, analytical chemistry, bench testing and modeling.

3OAK RIDGE NATIONAL LABORATORYU. S. DEPARTMENT OF ENERGY
Lean NOx Trap Combines 3-way Catalyst Function with NOx Storage Material(s)
• LNT a.k.a. DNT, NOx Adsorber, NAC, NOxStorage and Reduction (NSR) Catalyst− Stores NOx during lean operation− Uses alkali and/or alkaline-earth metals for
storage− Pt group metals for oxidation/reduction
• Periodic rich regeneration releases and reduces NOx
Pt Ba
Al2O3
CO2, H2ON2
NO3-
H2, CO, HCs
NOx released & reduced“regeneration”
Rich A/F
Pt Ba
Al2O3
NO, O2 NO2NO3
-
NOx stored as nitrate“storage”
Lean A/F<15% of time~>85% of time~
HCCO
NOx
O2
LeanRich
• Conventional TWC oxidizes HC and CO, reduces NOx− Requires tight control of AFR
Although most everyone is familiar with the function of LNTs, I’ve included this overview slide for reference.
Most of the time the engine system runs in the normal lean mode as the LNT stores NOx. Periodic rich excursions then regenerate the LNT using excess reductant.
4OAK RIDGE NATIONAL LABORATORYU. S. DEPARTMENT OF ENERGY
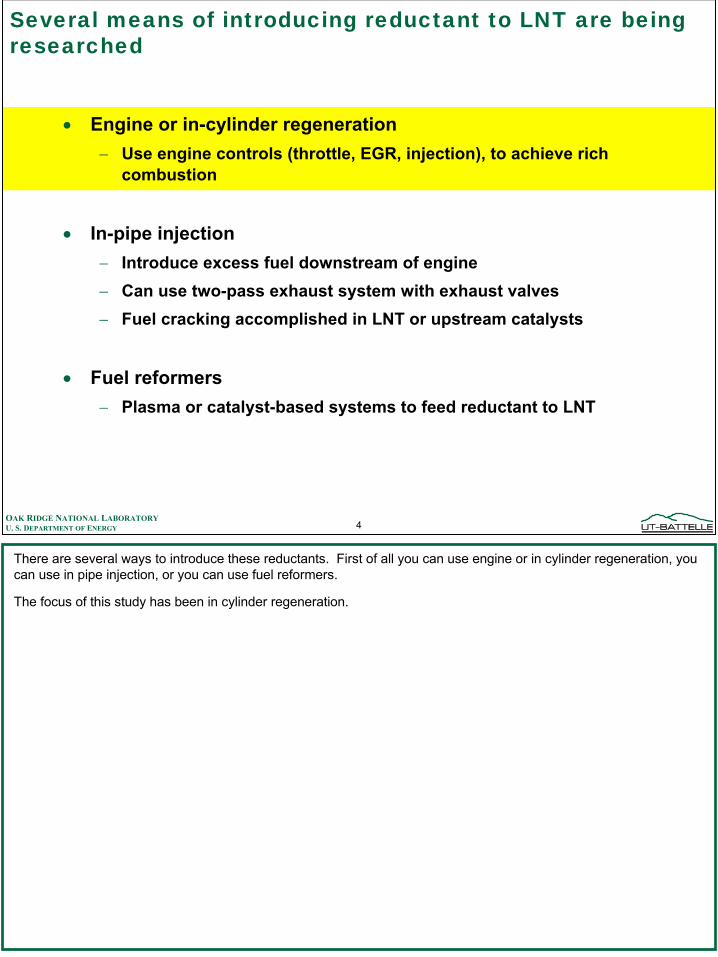
Several means of introducing reductant to LNT are being researched
• Engine or in-cylinder regeneration− Use engine controls (throttle, EGR, injection), to achieve rich
combustion
• In-pipe injection− Introduce excess fuel downstream of engine− Can use two-pass exhaust system with exhaust valves− Fuel cracking accomplished in LNT or upstream catalysts
• Fuel reformers− Plasma or catalyst-based systems to feed reductant to LNT
There are several ways to introduce these reductants. First of all you can use engine or in cylinder regeneration, you can use in pipe injection, or you can use fuel reformers.
The focus of this study has been in cylinder regeneration.
5OAK RIDGE NATIONAL LABORATORYU. S. DEPARTMENT OF ENERGY
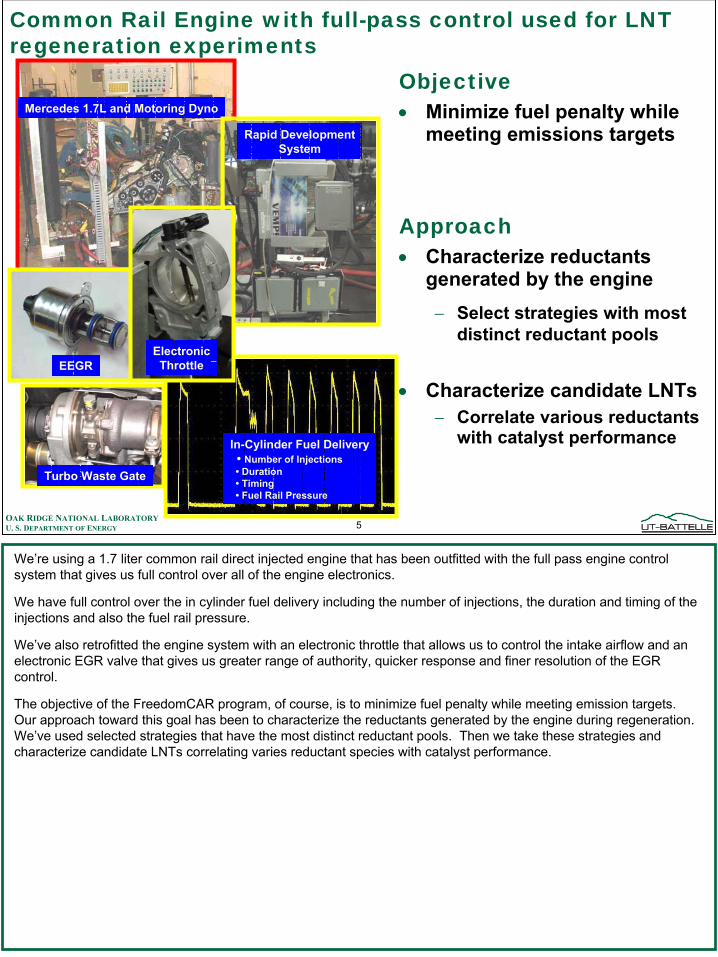
Common Rail Engine with full-pass control used for LNT regeneration experiments
EEGR
Objective• Minimize fuel penalty while
meeting emissions targets
Approach• Characterize reductants
generated by the engine− Select strategies with most
distinct reductant pools
• Characterize candidate LNTs− Correlate various reductants
with catalyst performanceIn-Cylinder Fuel Delivery• Number of Injections• Duration• Timing• Fuel Rail Pressure
Mercedes 1.7L and Motoring Dyno
Rapid DevelopmentSystem
Turbo Waste Gate
ElectronicThrottleEEGR
We’re using a 1.7 liter common rail direct injected engine that has been outfitted with the full pass engine control system that gives us full control over all of the engine electronics.
We have full control over the in cylinder fuel delivery including the number of injections, the duration and timing of the injections and also the fuel rail pressure.
We’ve also retrofitted the engine system with an electronic throttle that allows us to control the intake airflow and an electronic EGR valve that gives us greater range of authority, quicker response and finer resolution of the EGR control.
The objective of the FreedomCAR program, of course, is to minimize fuel penalty while meeting emission targets. Our approach toward this goal has been to characterize the reductants generated by the engine during regeneration. We’ve used selected strategies that have the most distinct reductant pools. Then we take these strategies and characterize candidate LNTs correlating varies reductant species with catalyst performance.

6OAK RIDGE NATIONAL LABORATORYU. S. DEPARTMENT OF ENERGY
Approach Summary: vary strategy or fuel to change reductant chemistry
Reductant Species (peak concentrations) through the engine/catalyst system
Engine
DO
C
NO
x Adsorber
methane ethane ethyne propenebutene formaldehyde acetaldehyde benzaldehydetoluene benzene napthalenetridecane indene styrenebenzofuran phenol methyl napthaleneacenathalene diphenylethene …many others
Other species measured:Nitro-organicsAmmoniaN2O
FuelH2
0.5-1.4%
Hydrocarbons2200-8000 ppmC
CO: 0-0.5%
H2 0- 0.3%
500-3000 ppmC
H2
0.6-1.5%
Hydrocarbons0.5 -1%
CO2.1-3.5%
CO1.9-3%
H2 and O2 transients measured using SpaciMS (SAE 2000-01-2952)
Summarizing this approach graphically this overview chart gives you a feel for the levels of reductant species as they come out of the engine and progress through the catalyst system.
A main objective of this project is to understand how the LNT catalyst performs based on this mixture of reductants.
The tool we’ve been using to measure H2 and O2 transients is the SpaciMS, which was developed at ORNL.
7OAK RIDGE NATIONAL LABORATORYU. S. DEPARTMENT OF ENERGY
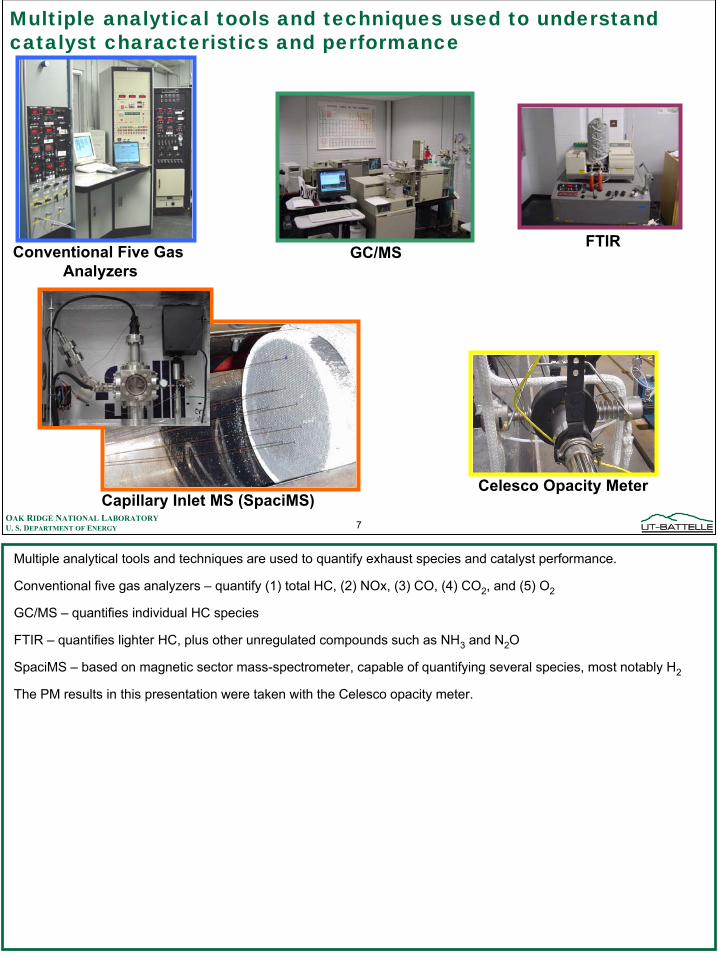
Multiple analytical tools and techniques used to understand catalyst characteristics and performance
Conventional Five GasAnalyzers
Capillary Inlet MS (SpaciMS)Celesco Opacity Meter
GC/MSFTIR
Multiple analytical tools and techniques are used to quantify exhaust species and catalyst performance.
Conventional five gas analyzers – quantify (1) total HC, (2) NOx, (3) CO, (4) CO2, and (5) O2
GC/MS – quantifies individual HC species
FTIR – quantifies lighter HC, plus other unregulated compounds such as NH3 and N2O
SpaciMS – based on magnetic sector mass-spectrometer, capable of quantifying several species, most notably H2
The PM results in this presentation were taken with the Celesco opacity meter.

8OAK RIDGE NATIONAL LABORATORYU. S. DEPARTMENT OF ENERGY
Experimental setup allows full exhaust species characterization throughout the catalyst system
Engine DOC LNT
Engine OutBench(SS1)
UEGO1 UEGO2 UEGO3
SS2
NOxSensor #1
NOxSensor #2
Turbo
1/4 LNT
1/2 LNT
3/4 LNT
FTIR(dilute)
Air
Bench 2
SpaciMS
The experimental setup allows for full exhaust species characterization throughout the catalyst system, including within the LNT.
9OAK RIDGE NATIONAL LABORATORYU. S. DEPARTMENT OF ENERGY
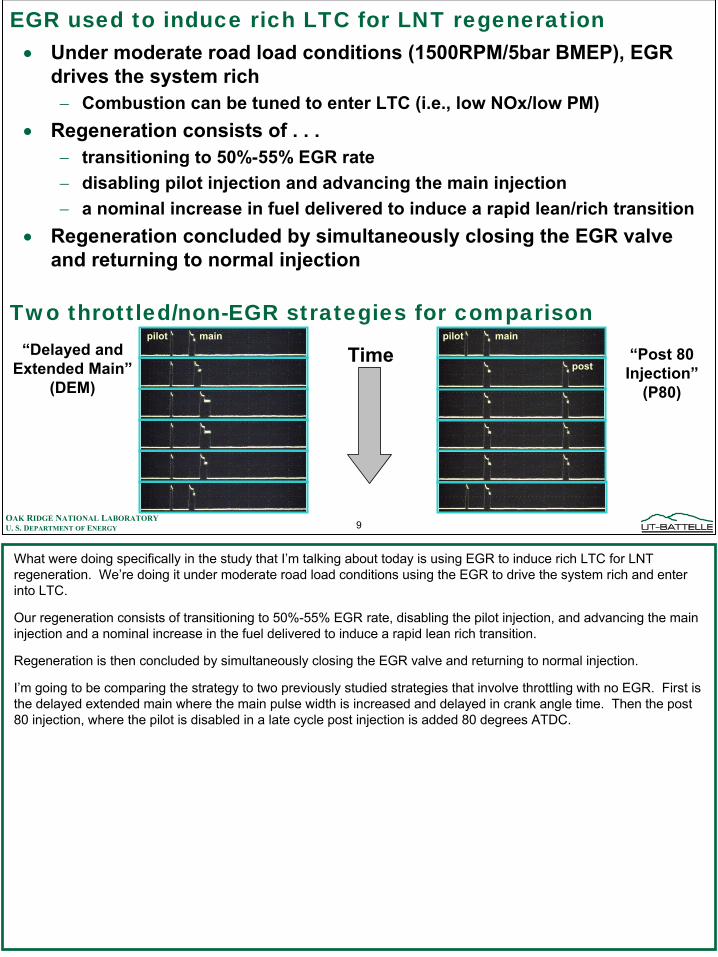
EGR used to induce rich LTC for LNT regeneration• Under moderate road load conditions (1500RPM/5bar BMEP), EGR
drives the system rich− Combustion can be tuned to enter LTC (i.e., low NOx/low PM)
• Regeneration consists of . . .− transitioning to 50%-55% EGR rate− disabling pilot injection and advancing the main injection− a nominal increase in fuel delivered to induce a rapid lean/rich transition
• Regeneration concluded by simultaneously closing the EGR valve and returning to normal injection
pilot main pilot main
postTime
Two throttled/non-EGR strategies for comparison“Delayed and
Extended Main”(DEM)
“Post 80Injection”
(P80)
What were doing specifically in the study that I’m talking about today is using EGR to induce rich LTC for LNT regeneration. We’re doing it under moderate road load conditions using the EGR to drive the system rich and enter into LTC.
Our regeneration consists of transitioning to 50%-55% EGR rate, disabling the pilot injection, and advancing the main injection and a nominal increase in the fuel delivered to induce a rapid lean rich transition.
Regeneration is then concluded by simultaneously closing the EGR valve and returning to normal injection.
I’m going to be comparing the strategy to two previously studied strategies that involve throttling with no EGR. First is the delayed extended main where the main pulse width is increased and delayed in crank angle time. Then the post 80 injection, where the pilot is disabled in a late cycle post injection is added 80 degrees ATDC.

10OAK RIDGE NATIONAL LABORATORYU. S. DEPARTMENT OF ENERGY
0
1
2
3
4
5
6
7
0 1 2 3 4 5
NOx [g/hp-h]
PM m
ass
rate
(a.u
.)
Rich LTC regeneration maintains low NOx/low PM
Increasing EGR
LTCRegion
Rich LTC Regeneration
Here I’d like to focus on the typical NOx/PM tradeoff curve for EGR. As EGR increases, NOx decreases and PM starts to rise, to a point which you reach a knee in the curve and then the PM rapidly drops off. I’d just like to highlight, in the bottom left hand corner, the region that is defined as LTC which gives low NOx and low PM levels. Also, I’ve plotted with the red dot, the operating condition for the rich LTC regeneration.
11OAK RIDGE NATIONAL LABORATORYU. S. DEPARTMENT OF ENERGY
0.0
0.5
1.0
1.5
2.0
2.5
3.0
3.5
4.0
0 5 10 15 20 25 30
Time (sec)
Spec
ies
Con
cent
ratio
n (%
)
15
10
5
0
5
10
15
20
25
Inlet Airflow
(g/s)
CO
HC
H2
Airflow
EGR/LTC
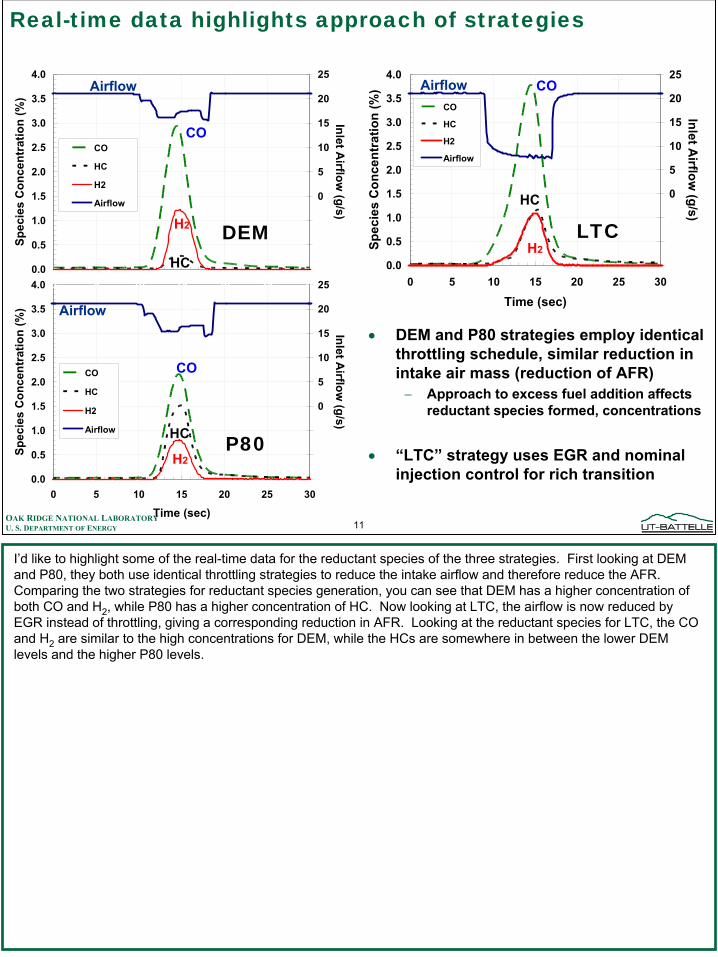
• DEM and P80 strategies employ identical throttling schedule, similar reduction in intake air mass (reduction of AFR)− Approach to excess fuel addition affects
reductant species formed, concentrations
• “LTC” strategy uses EGR and nominal injection control for rich transition0.0
0.5
1.0
1.5
2.0
2.5
3.0
3.5
4.0
0 5 10 15 20 25 30
Time (sec)
Spec
ies
Con
cent
ratio
n (%
)
15
10
5
0
5
10
15
20
25
Inlet Airflow
(g/s)CO
HC
H2
Airflow
Post80
0.0
0.5
1.0
1.5
2.0
2.5
3.0
3.5
4.0
0 5 10 15 20 25 30
Time (sec)
Spec
ies
Con
cent
ratio
n (%
)
15
10
5
0
5
10
15
20
25
Inlet Airflow
(g/s)
CO
HC
H2
Airflow
DEMAirflow
Airflow
Airflow
Real-time data highlights approach of strategies
DEM LTC
P80
CO
CO
CO
H2
H2
H2
HC
HC
HC
I’d like to highlight some of the real-time data for the reductant species of the three strategies. First looking at DEM and P80, they both use identical throttling strategies to reduce the intake airflow and therefore reduce the AFR. Comparing the two strategies for reductant species generation, you can see that DEM has a higher concentration of both CO and H2, while P80 has a higher concentration of HC. Now looking at LTC, the airflow is now reduced by EGR instead of throttling, giving a corresponding reduction in AFR. Looking at the reductant species for LTC, the CO and H2 are similar to the high concentrations for DEM, while the HCs are somewhere in between the lower DEM levels and the higher P80 levels.
12OAK RIDGE NATIONAL LABORATORYU. S. DEPARTMENT OF ENERGY
0
100
200
300
400
500
8 10 12 14 16 18 20 22
Time (sec)
Engi
ne-O
ut N
Ox
(ppm
)
0
10
20
30
40
50
Airf
low
(g/s
), sm
oke,
AFR
NOx Airflow AFR smoke DEM
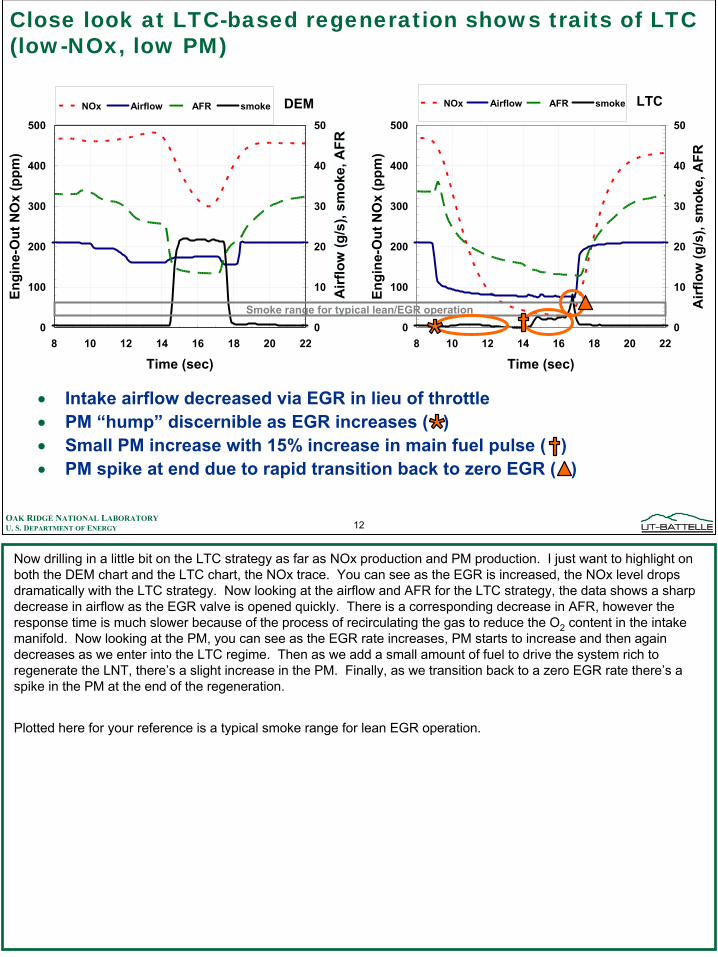
• Intake airflow decreased via EGR in lieu of throttle• PM “hump” discernible as EGR increases ( )• Small PM increase with 15% increase in main fuel pulse ( )• PM spike at end due to rapid transition back to zero EGR ( )
0
100
200
300
400
500
8 10 12 14 16 18 20 22
Time (sec)En
gine
-Out
NO
x (p
pm)
0
10
20
30
40
50
Airf
low
(g/s
), sm
oke,
AFR
NOx Airflow AFR smoke LTC
Airf
low
(g/s
), sm
oke,
AFR
Smoke range for typical lean/EGR operation
Close look at LTC-based regeneration shows traits of LTC (low-NOx, low PM)
Now drilling in a little bit on the LTC strategy as far as NOx production and PM production. I just want to highlight on both the DEM chart and the LTC chart, the NOx trace. You can see as the EGR is increased, the NOx level drops dramatically with the LTC strategy. Now looking at the airflow and AFR for the LTC strategy, the data shows a sharp decrease in airflow as the EGR valve is opened quickly. There is a corresponding decrease in AFR, however the response time is much slower because of the process of recirculating the gas to reduce the O2 content in the intake manifold. Now looking at the PM, you can see as the EGR rate increases, PM starts to increase and then again decreases as we enter into the LTC regime. Then as we add a small amount of fuel to drive the system rich to regenerate the LNT, there’s a slight increase in the PM. Finally, as we transition back to a zero EGR rate there’s a spike in the PM at the end of the regeneration.
Plotted here for your reference is a typical smoke range for lean EGR operation.

13OAK RIDGE NATIONAL LABORATORYU. S. DEPARTMENT OF ENERGY
0.0
0.2
0.4
0.6
0.8
1.0
1.2
DEM P80 LTC
Nor
mal
ized
PM
Mas
s
Zero EGRNo pilot
Zero EGRNormal pilot
~60% EGRNo pilot
LTC-based regeneration produces very low PM
This shows the total integrated PM mass during a regeneration. It has been normalized to the worst case which is DEM. You can see that LTC, on an integrated mass basis, is still below the typical lean EGR smoke level.
Note: “smoke” mass is (celesco opacity * SCFM / 60), giving an arbitrary PM mass rate unit.

14OAK RIDGE NATIONAL LABORATORYU. S. DEPARTMENT OF ENERGY
DEM Post80 LTC
Red
ucta
nt V
olum
e (m
mol
/rege
n)
Integration of reductant produced shows similar total mole count for LTC case
HCCOH2HCCOH2HCCOH2
Eng Out 0
10
20
30
40
50
60
70
80Engine Out Total CO-equivalent milli-moles
178 153131
LNT InletTailpipe
• Previous data indicates that H2 production dictates efficiency (SAE 2004-01-3023)
Looking at the reductants on an integrated molar basis for EO, LNT inlet, and TP for the three strategies. This chart shows engine out, LNT inlet, and tailpipe values for H2, CO, and HC. What is of interest is that while LTC had a higher concentration of these reductant species, when you do an integration, because of the reduced mass flow through the system, it actually falls in between the DEM and P80 strategies. This data shows that LTC has a total CO-equivalent moles of EO reductants comparable to DEM and P80.
Looking at the H2 integration for the three strategies, note there is a decreasing trend in H2 mass as you go from DEM to P80 to LTC. Previous data indicates the H2 production dictates the efficiency of the LNT. LTC has lowest H2 level!

15OAK RIDGE NATIONAL LABORATORYU. S. DEPARTMENT OF ENERGY
LTC strategy has potential for lower overall fuel penalty, despite lower average NOx conversionStrategies not optimized for FEP, NOx, torque, etc.
0
0.1
0.2
0.3
0.4
0.5
0.6
0.7
DEM P80 LTC
NO
xM
ass
Red
uced
[g]
0.0
0.1
0.2
0.3
0.4
0.5
Fuel
Spe
cific
NO
xR
educ
tion
(g N
Ox/
gex
cess
fuel
)
Moving into a discussion about LNT performance. What is plotted here is the mass of NOx reduced per regeneration cycle. As you can see, there is a decreasing trend from DEM to P80 to LTC for the grams of NOx reduced, following the same trend as the H2 production.
Now looking at the fuel cost to get these NOx reduction levels, when compared on a “fuel specific” basis (i.e., grams of NOx reduced per gram of excess fuel required to regenerate), LTC is dramatically better than both DEM and P80. I’ve plotted on the right axis fuel specific NOx reduction (FSNR). What you see is, while LTC has a lower mass of NOx reduced, it actually has quite a bit higher FSNR. Meaning that it’s a more efficient use of the excess fuel needed to regenerate the LNT.
Note: these strategies have not been tuned for FE penalty, torque stability, OR NOx reduction. Given it’s superior fuel specific NOx reduction, LTC shows great potential for improving NOx performance while maintaining lower fuel consumption.

16OAK RIDGE NATIONAL LABORATORYU. S. DEPARTMENT OF ENERGY
Further study attempting to leverage the LTC regeneration’s superior fuel specific NOx reduction
• Comparing the benefits of improving LTC regeneration (lowest fuel penalty) vs. improving DEM regeneration (best NRE)
• Revised experiment to improve assessment of regeneration fuel penalty
What this led into was a desire for us to further study and leverage the LTC regeneration’s superior FSNR. So what we’ve done now in the next phase of the study, is to compare the benefits of improving the LTC regeneration, which has the lowest fuel penalty, to improving the DEM regeneration, which has the best NRE.
We’ve also revised the experiment to improve the assessment of regeneration fuel penalty.

17OAK RIDGE NATIONAL LABORATORYU. S. DEPARTMENT OF ENERGY
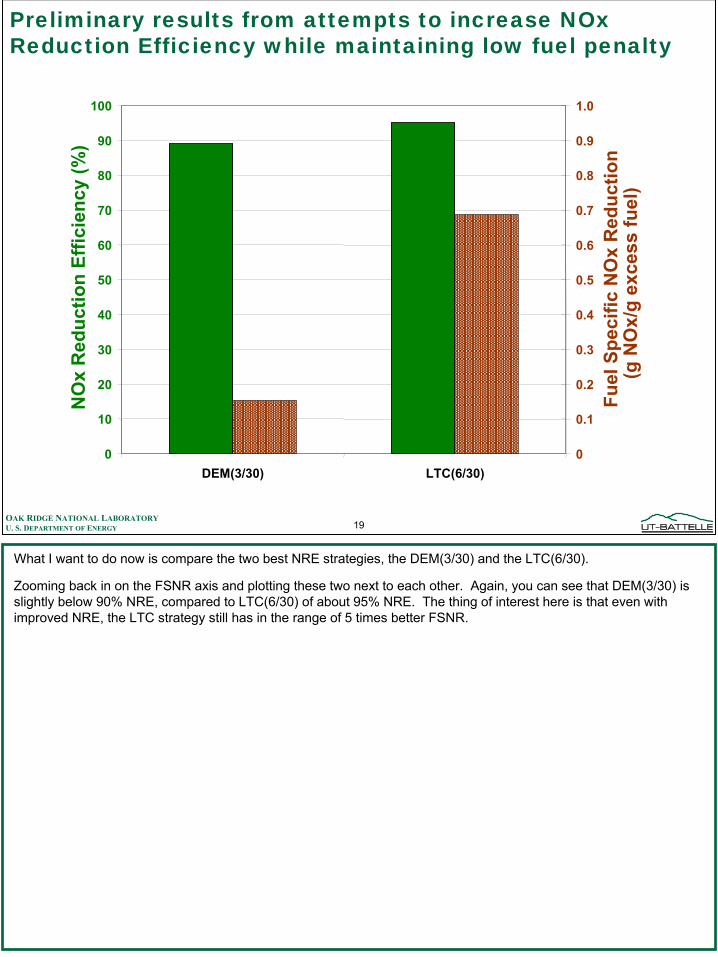
Preliminary results from attempts to increase NOxReduction Efficiency while maintaining low fuel penalty
DEM(3/60) DEM(3/30) LTC(3/60) LTC(6/60) LTC(6/30)0
0.1
0.2
0.3
0.4
0.5
0.6
0.7
0.8
0.9
1.0
0
10
20
30
40
50
60
70
80
90
100
NO
xR
educ
tion
Effic
ienc
y (%
)
Fuel
Spe
cific
NO
xR
educ
tion
(g N
Ox/
gex
cess
fuel
)
Now looking at the results. Again, plotted on the left is the NRE, which is defined as the percentage of NOx from the EO that’s reduced in the catalyst system. I want to point out a note about the nomenclature for the names of the strategies. The first number in parentheses represents the number of seconds for the rich duration and the second number denotes the overall cycle time of the regeneration. So DEM(3/60) is 3s rich on a 60s cycle.
Looking at the data, we see for this catalyst in the state that its in, the DEM(3/60) has in the high 70s for NRE and a little greater than 0.3 for grams of NOx reduced per gram of excess fuel used. We then looked for ways to improve the NRE, and the method used was the increase the frequency of the regeneration. So the next strategy used was a (3/30), that is 3s rich on a 30s cycle. What you see is that we were able to increase the NRE to almost 90%, but it came at a cost of about half of the FSNR.

18OAK RIDGE NATIONAL LABORATORYU. S. DEPARTMENT OF ENERGY
Preliminary results from attempts to increase NOxReduction Efficiency while maintaining low fuel penalty
DEM(3/60) DEM(3/30) LTC(3/60) LTC(6/60) LTC(6/30)0
2
4
6
8
10
12
14
16
18
20
0
10
20
30
40
50
60
70
80
90
100
NO
xR
educ
tion
Effic
ienc
y (%
)
Fuel
Spe
cific
NO
xR
educ
tion
(g N
Ox/
gex
cess
fuel
)
Now what I want to show you is the data from the baseline LTC case of a (3/60), or 3s rich on a 60s cycle. What you see is that LTC has a much lower NRE (below 25%). But when I try to plot the FSNR on the same axis as the DEM, it actually goes off the chart. So zooming out the y-scale for the FSNR and plot them on the same scale. What you see now is that the LTC baseline (3/60) is on the order of 50 times greater than either the DEM(3/60) or DEM (3/30).
Again, we had a desire to improve the NRE, while still capitalizing on the superior fuel efficiency of the LTC strategy. So then we looked at doubling the rich duration for the same cycle time (6/60). What you see is that we are actually able to get the LTC regeneration NRE very close to the level of the DEM(3/60), or about 75% NRE, with a corresponding reduction in FSNR.
We took it a step further and increased the frequency of the LTC regeneration, and we were able to get to somewhere around 90% NRE. However, there is a significant hit to the FSNR.
19OAK RIDGE NATIONAL LABORATORYU. S. DEPARTMENT OF ENERGY
Preliminary results from attempts to increase NOxReduction Efficiency while maintaining low fuel penalty
0
0.1
0.2
0.3
0.4
0.5
0.6
0.7
0.8
0.9
1.0
0
10
20
30
40
50
60
70
80
90
100
NO
xR
educ
tion
Effic
ienc
y (%
)
Fuel
Spe
cific
NO
xR
educ
tion
(g N
Ox/
gex
cess
fuel
)
DEM(3/30) LTC(6/30)
What I want to do now is compare the two best NRE strategies, the DEM(3/30) and the LTC(6/30).
Zooming back in on the FSNR axis and plotting these two next to each other. Again, you can see that DEM(3/30) is slightly below 90% NRE, compared to LTC(6/30) of about 95% NRE. The thing of interest here is that even with improved NRE, the LTC strategy still has in the range of 5 times better FSNR.
20OAK RIDGE NATIONAL LABORATORYU. S. DEPARTMENT OF ENERGY
• LTC regeneration produces PM levels less than typical lean/EGR operation, and considerably less than DEM
• Low fuel consumption for LTC regeneration yields superior Fuel Specific NOx Reduction
− Increasing frequency and duration of regeneration improves NOxreduction for LTC at minimal cost
• Preliminary data indicates potential for catalyst performance equivalent to DEM and P80, but with 5x-10x more efficient fuel utilization− potential for improving NOx conversion, fuel efficiency, PM generation,
and torque smoothing with further effort
Summary - preliminary LTC regeneration strategy has many benefits
Shean Hufffeerc.ornl.gov/[email protected]
865-946-1333
Conclusions:• I’d like to summarize by saying that the LTC regeneration produces PM levels less than typical lean EGR
operation and considerably less than the DEM strategy.
• Low fuel consumption for the LTC regeneration yields superior FSNR. A study shows that increasing the frequency and duration of the regeneration improves NOx reduction while still maintaining a superior FSNR compared to DEM.
• Preliminary data indicates the potential for catalyst performance equivalent, or even better than DEM and P80, but with 5-10 times more efficient fuel utilization.


![NOx Removal Using a Non-thermal Surface Plasma Discharge ... › content › files › pdf › IJPEST_Vol6_No1_13_pp074-080.… · NOx NOx i 100 (3) where [NOx]i and [NOx] are the](https://img.pdfslide.us/doc/110x75/5f1e3ef72e75905a25738ef6/nox-removal-using-a-non-thermal-surface-plasma-discharge-a-content-a-files.jpg)