Embed Size (px)
Citation preview
1
Combining Behavioral Safety Theory and TelematicsPeter Van Dyne, MA, CSP, CFPSDon Tolbert, CSP
June 29, 2016 Atlanta, GA Our risk control service is advisory only. We assume no responsibility for management or control of customer safety activities nor for implementation of recommended corrective measures. This presentation is based on information supplied by the customer and observations of conditions and practices at the time of the visit. We have not tried to identify all hazards. We do not warrant that requirements of any federal, state, or local law, regulation or ordinance have or have not been met. This report does not create coverage. Only your policy or contract provides coverage subject to its terms, conditions, and exclusions.
Liberty Mutual Insurance 2
Session Objectives
Examine the challenge of managing
performance systematically
Discuss the synthesis of
actionable insights from reliable data
Explore Telematics as a process data
source
Describe use of Root Cause Analysis
for systematic management of
aggressive driving events
2
Liberty Mutual Insurance 3
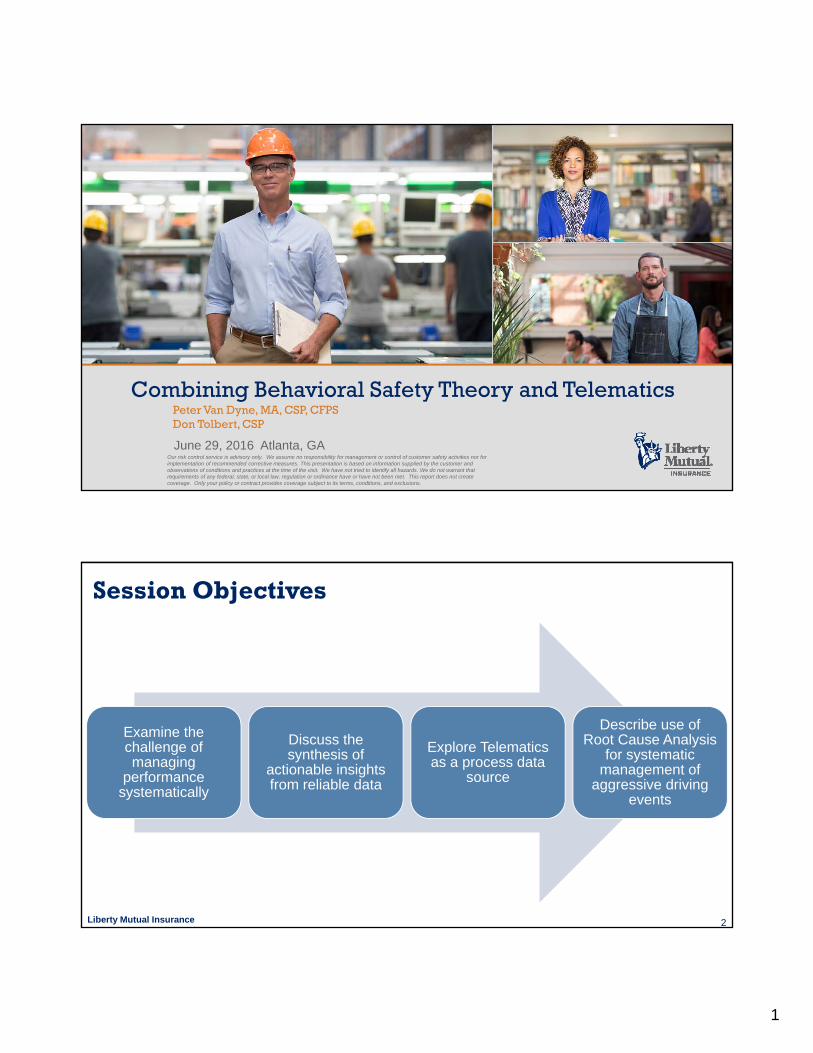
Elements of Well Performing Fleet Programs
Select drivers based on their history and ability to perform the job
Establish and communicate expectations on how jobs should be performed
Monitor performance against the expectations
Identify systemic barriers to expected performance
Adjust systems to support performance expected
Document actions taken as policy
Liberty Mutual Insurance 4ASSE PDC 2016 - Atlanta
Scenario Action
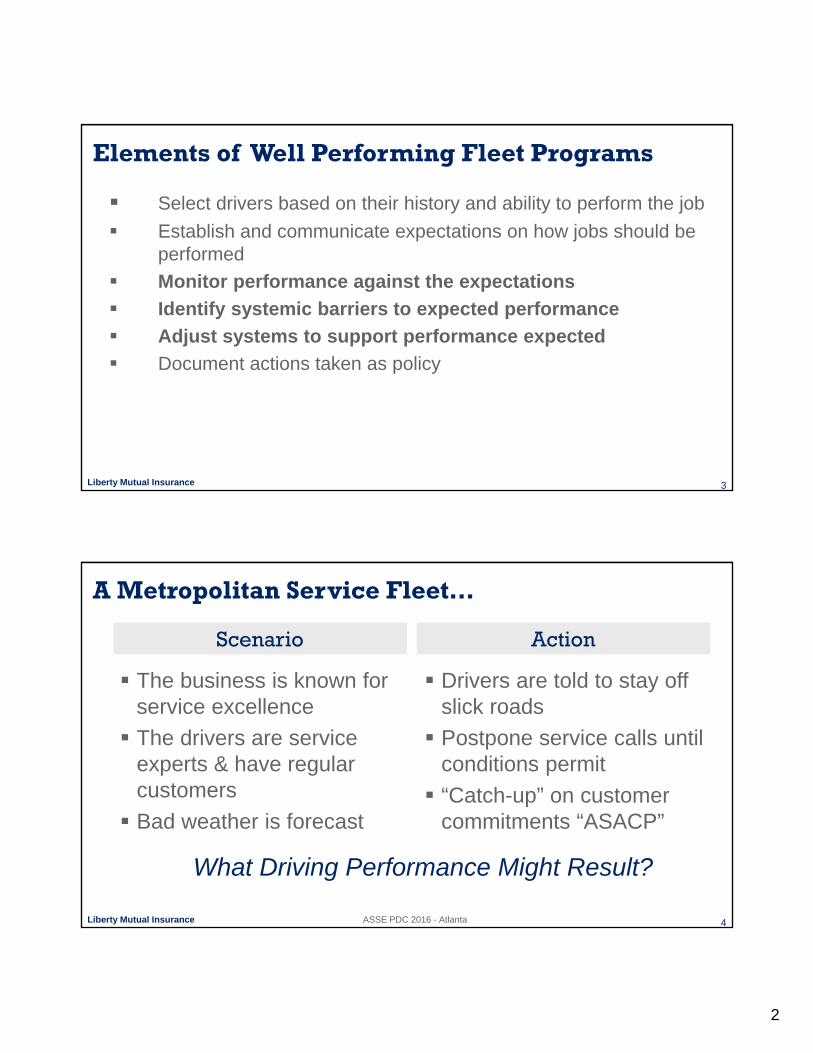
A Metropolitan Service Fleet…
The business is known for service excellence
The drivers are service experts & have regular customers
Bad weather is forecast
Drivers are told to stay off slick roads
Postpone service calls until conditions permit
“Catch-up” on customer commitments “ASACP”
What Driving Performance Might Result?
3
Liberty Mutual Insurance 5ASSE PDC 2016 - Atlanta
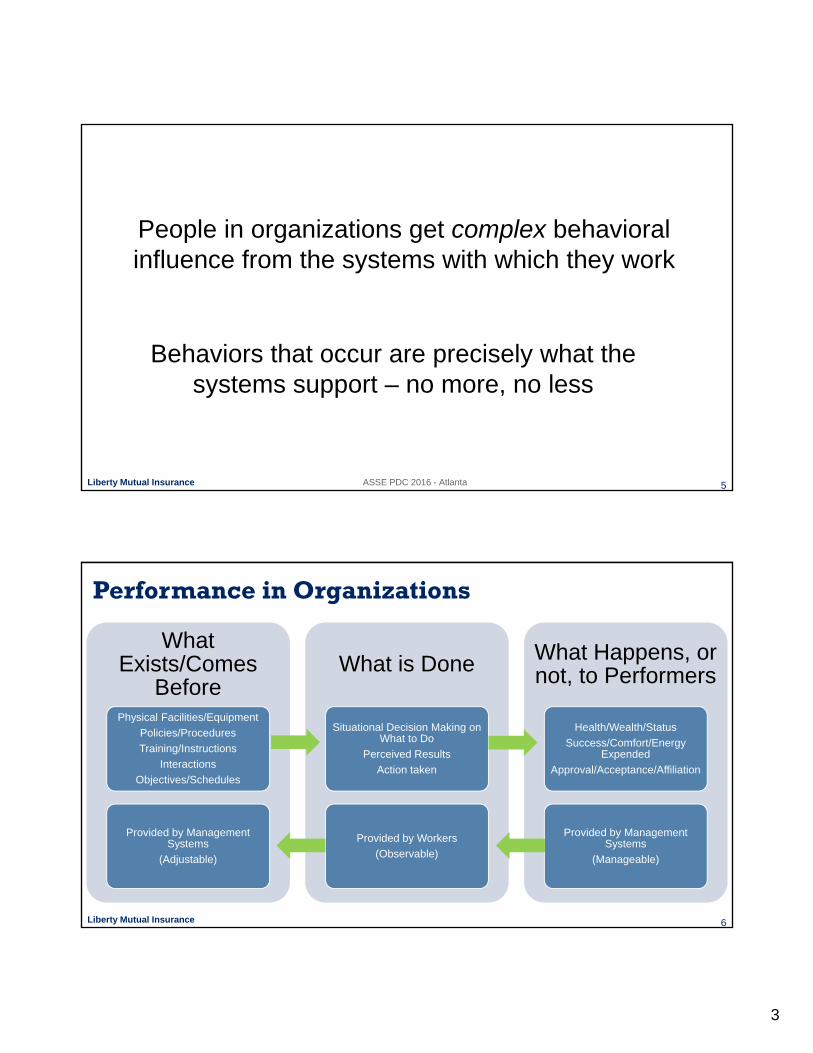
People in organizations get complex behavioral influence from the systems with which they work
Behaviors that occur are precisely what the systems support – no more, no less
Liberty Mutual Insurance 6
Performance in Organizations
What Exists/Comes
BeforePhysical Facilities/Equipment
Policies/Procedures
Training/Instructions
Interactions
Objectives/Schedules
Provided by Management Systems
(Adjustable)
What is Done
Situational Decision Making on What to Do
Perceived Results
Action taken
Provided by Workers
(Observable)
What Happens, or not, to Performers
Health/Wealth/Status
Success/Comfort/Energy Expended
Approval/Acceptance/Affiliation
Provided by Management Systems
(Manageable)
4
Liberty Mutual Insurance 7
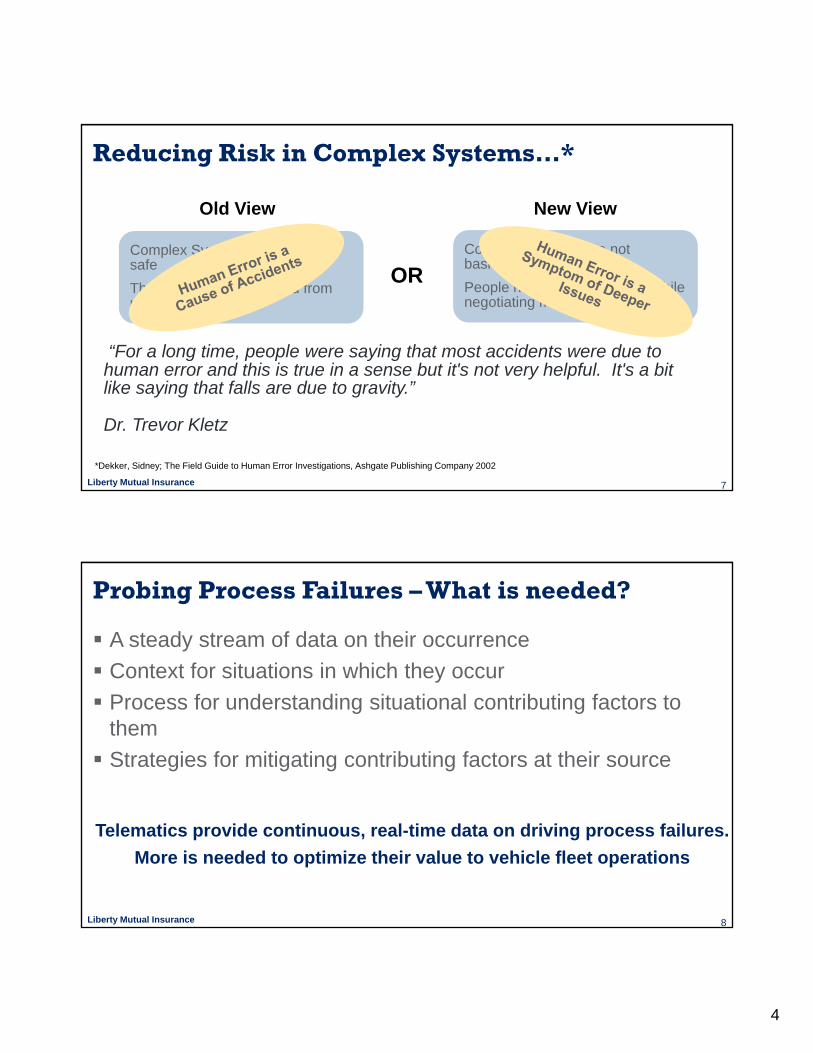
Reducing Risk in Complex Systems…*
*Dekker, Sidney; The Field Guide to Human Error Investigations, Ashgate Publishing Company 2002
ORComplex Systems are basically safe
They need to be protected from unreliable people
Old View
Complex Systems are not basically safe
People have to create safety while negotiating multiple system goals
New View
“For a long time, people were saying that most accidents were due to human error and this is true in a sense but it's not very helpful. It's a bit like saying that falls are due to gravity.”
Dr. Trevor Kletz
Liberty Mutual Insurance 8
Probing Process Failures – What is needed?
A steady stream of data on their occurrence
Context for situations in which they occur
Process for understanding situational contributing factors to them
Strategies for mitigating contributing factors at their source
Telematics provide continuous, real-time data on driving process failures.
More is needed to optimize their value to vehicle fleet operations
5
Liberty Mutual Insurance 9ASSE PDC 2016 - Atlanta
Graphic Source: http://www.systemswiki.org/index.php?title=Data,_Information,_Knowledge_and_Wisdom
Ackoff, Russell; 1988 Address to International Society for General Systems Research (Proceedings Published 1989)
Liberty Mutual Insurance 10
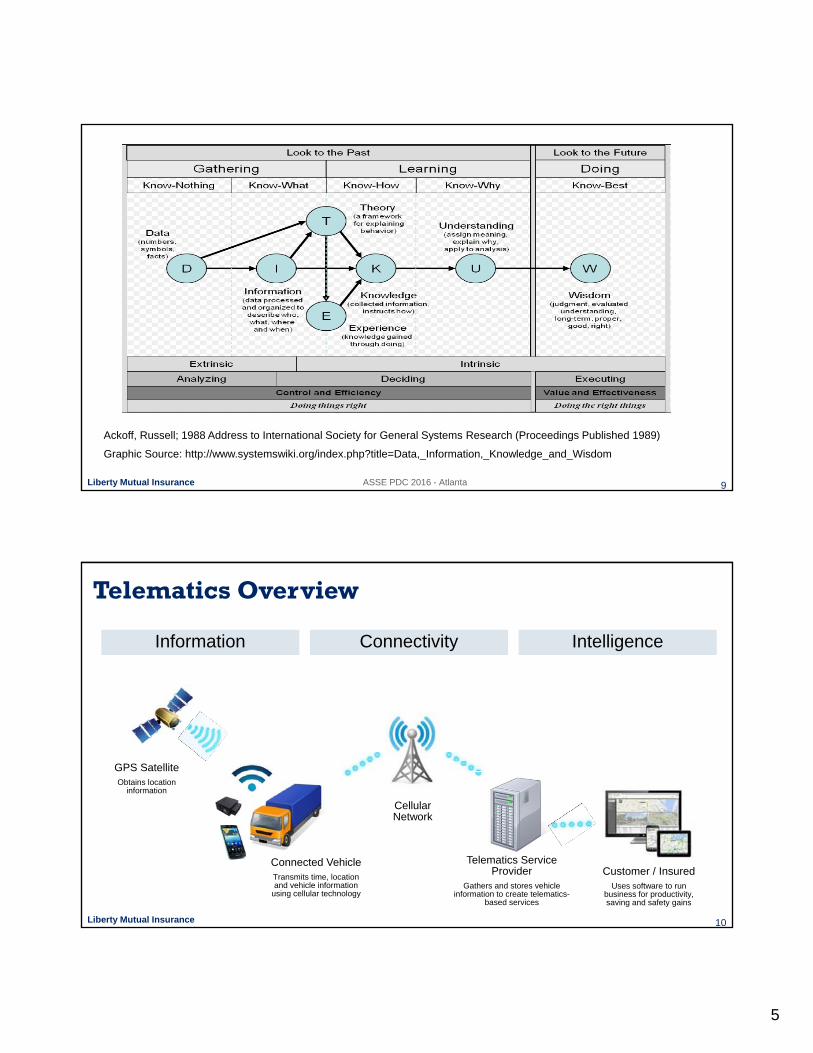
Telematics Overview
GPS SatelliteObtains location
information
Connected VehicleTransmits time, location and vehicle information
using cellular technology
Cellular Network
Telematics Service Provider
Gathers and stores vehicle information to create telematics-
based services
Customer / InsuredUses software to run
business for productivity, saving and safety gains
Information Connectivity Intelligence
6
Liberty Mutual Insurance 11
Technology Platforms
+
+
+
Smart Phone App or App tethered to OBDII
Self Installed OBDII Device
+
+
OEM Built-In Solutions
After Market Hardwired Professionally Installed Devices
or
Liberty Mutual Insurance 12
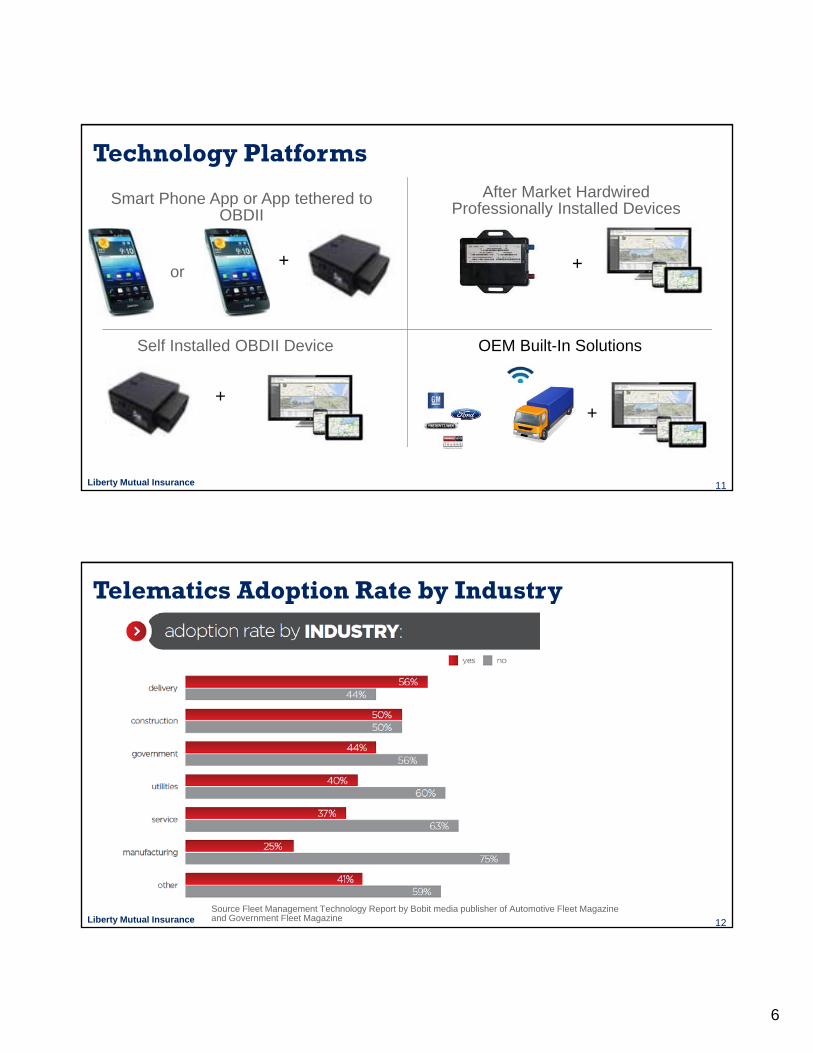
Telematics Adoption Rate by Industry
Source Fleet Management Technology Report by Bobit media publisher of Automotive Fleet Magazine and Government Fleet Magazine
7
Liberty Mutual Insurance 13
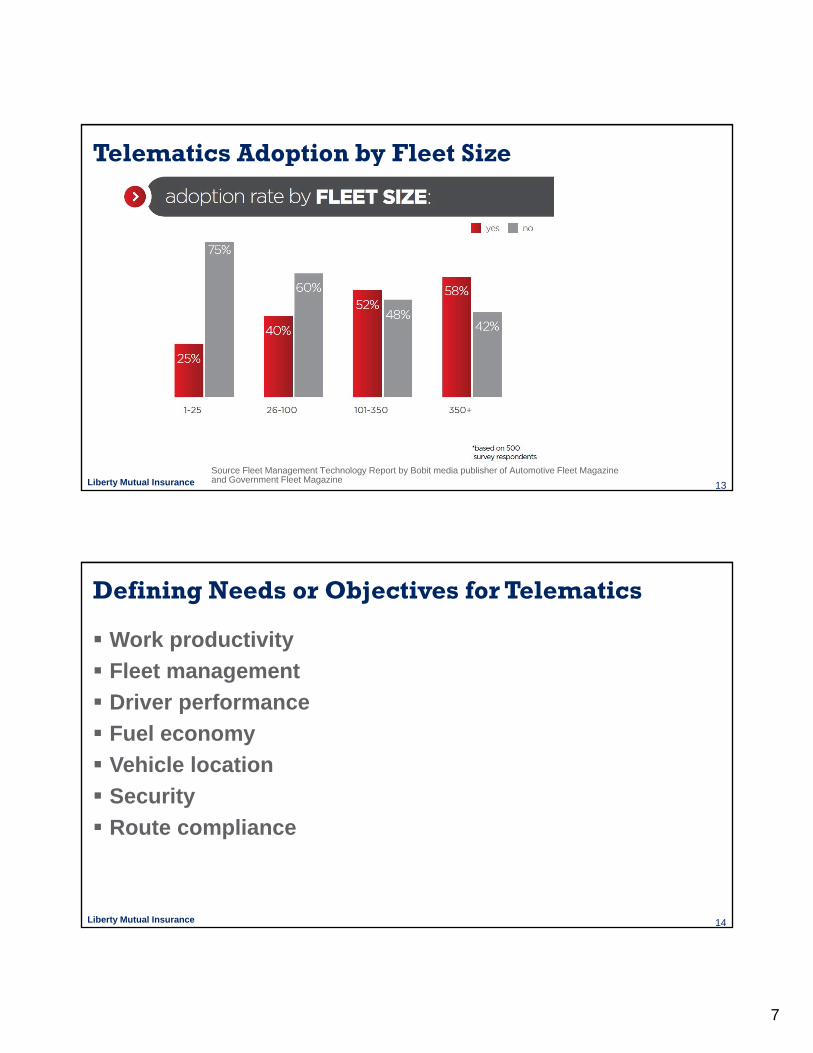
Telematics Adoption by Fleet Size
Source Fleet Management Technology Report by Bobit media publisher of Automotive Fleet Magazine and Government Fleet Magazine
Liberty Mutual Insurance 14
Defining Needs or Objectives for Telematics
Work productivity
Fleet management
Driver performance
Fuel economy
Vehicle location
Security
Route compliance
8
Liberty Mutual Insurance 15
Work Productivity
Map all your vehicles in one view
Real-time vehicle location and exception reporting
Route optimization and turn-by-turn directions
Rerouting with real-time weather and traffic updates
Customized geo-fencing to identify mapped areas of interest
Text-to-speech and speech-to-text messaging
Liberty Mutual Insurance 16
Fleet Management
Engine diagnostics and scheduled maintenance alerts
Accident notification and emergency services request
Integration with back-office payroll and accounting systems
Hours of service reporting
9
Liberty Mutual Insurance 17
Driver performance
Driver and fleet level reporting
Reports with drivers ranked or scored based on performance
Real-time exception notification of hard braking, swerving, and speeding events
Customized thresholds for exception notifications
Seat belt usage information
Feedback capabilities and coaching modules for drivers and managers
Liberty Mutual Insurance 18
Fuel Economy
Excessive idling alerts
Fuel consumption and fuel tank level monitoring
Speed monitoring (set limits and MPH compared to posted)
10
Liberty Mutual Insurance 19
Location and Security
Search feature to find vehicles, drivers or a location
Stolen vehicle assistance
Back up battery and data recovery systems
Liberty Mutual Insurance 20
Selecting a vendor
Identify vendors that can meet your needs/objectives
Review sample reports to verify they will provide you with tools for employee discussions
Review the amount of data you will get to avoid being overwhelmed with individual notifications
Look at scorecards that provide aggressive events per miles driven by driver and fleet
Look for vendors that will let you test their products prior to buying or entering into a contract
11
Liberty Mutual Insurance 21
Aggressive Events
Speeding can be measured in multiple ways
Speed vs. posted limits frequently used
Harsh acceleration may not tell much about large trucks
Cornering is measured in G force
Braking shows rapid speed changes
Parameters are adjustable (speed and time prior to becoming an event)
Parameter tolerance should be based on operations and equipment
Comparing fleets requires similar parameters to provide a valid benchmark
Liberty Mutual Insurance 22
Compliance vs. Measuring Risk
Speed risk from open interstate driving
Running yellow lights vs. stopping
Sudden stops can avoid a crash and be a good thing
Focus on event rates rather than individual events
12
Liberty Mutual Insurance 23
Telematics Service Provider (TSP) Scorecards
Scorecards can identify aggressive drivers
Understand the scoring methodology (algorithm)
A group of aggressive drivers can look average or one average driver can look aggressive depending on the comparisons
Group like operations and similar vehicles when comparing performance (don’t assume the TSP knows your operation that well)
Liberty Mutual Insurance 24
Selecting a TSP
Identify vendors based on achieving your objective
Review sample reports to verify they will provide you with tools for employee discussions
Review the amount of data you will get to avoid being overwhelmed with individual notifications
Look at scorecards and web sites for ease of use
Look for aggressive events per miles driven by driver and for the fleet
Understand event parameters and if they can be adjusted
Look for vendors that will let you test their products prior to buying or entering into a contract
13
Liberty Mutual Insurance 25
Calculating Event Rates
Events per 100 miles common
Type of event (speed, braking, cornering and acceleration)
% of time over posted
Liberty Mutual Insurance 26
Event Rate Outliers
Understand how your equipment works
Management should have or test devices
Review the range of event rates
Compare a driver to the median or middle of the pack driver
Establish company goals
14
Liberty Mutual Insurance 27
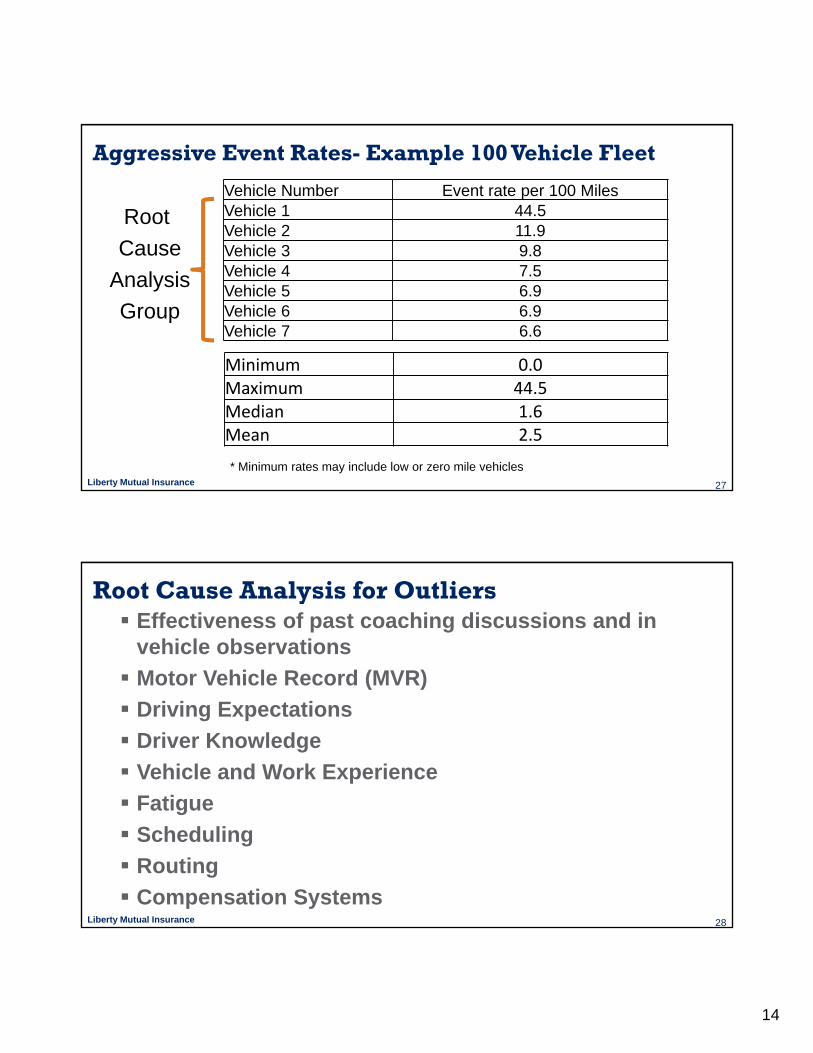
Aggressive Event Rates- Example 100 Vehicle Fleet
Minimum 0.0Maximum 44.5Median 1.6Mean 2.5
Vehicle Number Event rate per 100 MilesVehicle 1 44.5Vehicle 2 11.9Vehicle 3 9.8Vehicle 4 7.5Vehicle 5 6.9Vehicle 6 6.9Vehicle 7 6.6
* Minimum rates may include low or zero mile vehicles
Root
Cause
Analysis
Group
Liberty Mutual Insurance 28
Root Cause Analysis for Outliers Effectiveness of past coaching discussions and in
vehicle observations
Motor Vehicle Record (MVR)
Driving Expectations
Driver Knowledge
Vehicle and Work Experience
Fatigue
Scheduling
Routing
Compensation Systems
15
Liberty Mutual Insurance 29
Root Cause Analysis for Outliers Data Integrity/Telematics Device Performance
Consequences for Performance
Driver Outside Work Responsibilities/Situations
Multiple Jobs
Commuting Times
On Time Departure at Start Of Work Day
Distractions
Vehicle Condition
Breaks and Lost Time During The Work Day
Work Flow or Scheduling Exceptions
Health and Wellness
Liberty Mutual Insurance 30
Setting Company Goals
Look at the range of performance between drivers
Understand the average and median scores
Set realistic company goals for performance
Use benchmarks from a telematics service provider if they exist
Develop a plan to improve the drivers most in need of improvement
Track goals over the course of the year for the company or each location
16
Liberty Mutual Insurance 31
Developing Individual Action Plans Have expectations for the operation of vehicles Compare drivers to the median, average and company
goals Involve supervisors in coaching Provide regular feedback Avoid distracting the driver while in the vehicle Avoid setting unrealistic expectations (“I ran the red light
to avoid a hard brake”) Develop a culture of friendly competition Recognize the very best and use them as an example
of what is possible
Liberty Mutual Insurance 32
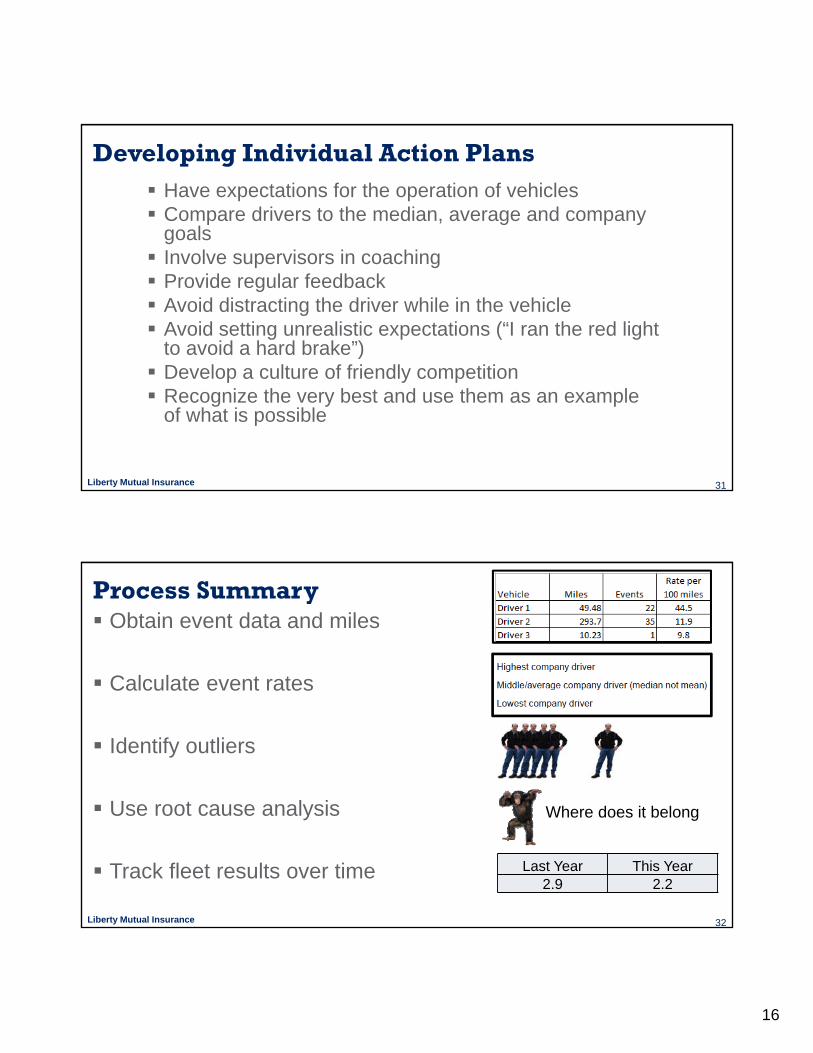
Process Summary Obtain event data and miles
Calculate event rates
Identify outliers
Use root cause analysis
Track fleet results over time Last Year This Year2.9 2.2
Where does it belong