Embed Size (px)
Citation preview


Arun SarinChief ExecutiveVodafone Group Plc© Vodafone Group 2004

This presentation contains forward-looking statements which are subject to risks and uncertainties because they relate to future events. Some of the facts which may cause actual results to differ from these forward looking statements are discussed in the penultimate slide to this presentation and others can be found by referring to our Preliminary Announcement of Results for the year ended 31 March 2004 and the “Risk Factors” in our Annual Report & Accounts and Form 20-F for the year ended 31 March 2003.
Information in this presentation about the yield on relevant investments cannot be relied upon as a guide to future performance.

Six Strategic GoalsProvide superior shareholder returns
Delight our customers
Leverage scale and scope
Expand market boundaries
Build the best team
Be a responsible business

Agenda• Performance and Group Strategy
• Results and Financial Position
• Operational Performance
• Delight our Customers
• Leverage Scale and Scope
• Outlook and Q&A
Arun SarinChief Executive
Ken HydonGroup Financial Director
Julian Horn-SmithChief Operating Officer
Peter BamfordChief Marketing Officer
Thomas GeitnerChief Technology OfficerGroup Technology and Business Integration
Arun SarinChief Executive

Six Strategic GoalsProvide superior shareholder returns
Delight our customers
Leverage scale and scope
Expand market boundaries
Build the best team
Be a responsible business

March '03 March '04
March '03 March '04
Statutory Results
* Before goodwill, amortisation and exceptional items
Turnover
March '03 March '04
10%
Operating profit*£10.7bn17%
Adjusted earnings per share*9.10p
34%
£30.4bn
Provide superior shareholder returns
£9.2bn
6.81p
£33.6bn

• Capital expenditure of £4.3bn
• Reduction in net debt to £8.5bn
March '03 March '04
£8.5bn
65%
Strong Free Cash Flow
£5.2bn
Provide superior shareholder returns

Better Than Expected Customer Growth
0
20
40
60
80
100
120
Mar-03 Mar-04
Mob
ile C
usto
mer
s (M
illio
ns)
Asia PacificSouthern Europe & MEANorthern EuropeUK & Ireland
* Proportionate
11% 133.4m119.7m
Provide superior shareholder returns
13.7m new customers*

ARPU Trends
Germany
March '03 March '04
JapanY80,695
March '03 March '04
-1%€313 €310 -7%
Provide superior shareholder returns
Y87,159
*Organic UK ARPU growth (excl. Singlepoint acquisition) was 1%
March '03 March '04
Italy €3614%€347
March '03 March '04
£3096%£292UK*

H1 03 H2 03 H1 04 H2 04
Strong Voice and Data Growth
* All subsidiaries
12 month rolling data % ofservice revenue*
14.6%
16.1%15.5%
Mar-03 Sep-03 Mar-04
68.5bn
70.4bn
76.4bn
78.4bnUp 11% yoy to 154.8bn mins
Provide superior shareholder returns
Group minutes of use*

Increasing EBITDA and Margin*
£12.2bn
£14.8bn
37.4%
38.3%
• Efficient running of the business offset additional investment in our customers
* proportionate
Provide superior shareholder returns
March 03 March 04
UK Germany Italy Japan Other

• Harsher regulatory environment - over £300m of termination cuts
• Difficult global economy
• Increasing competitive environment
Operating EnvironmentProvide superior shareholder returns

Up to now:
• Increased competitive activity in marketplace
• Currently limited ability to compete in 3G
• Investing in retention and attractive tariff plans
Looking forward:
• Wider range of 3G converged terminals in Christmas quarter
• Plan in place to transform competitive position in market
JapanProvide superior shareholder returns
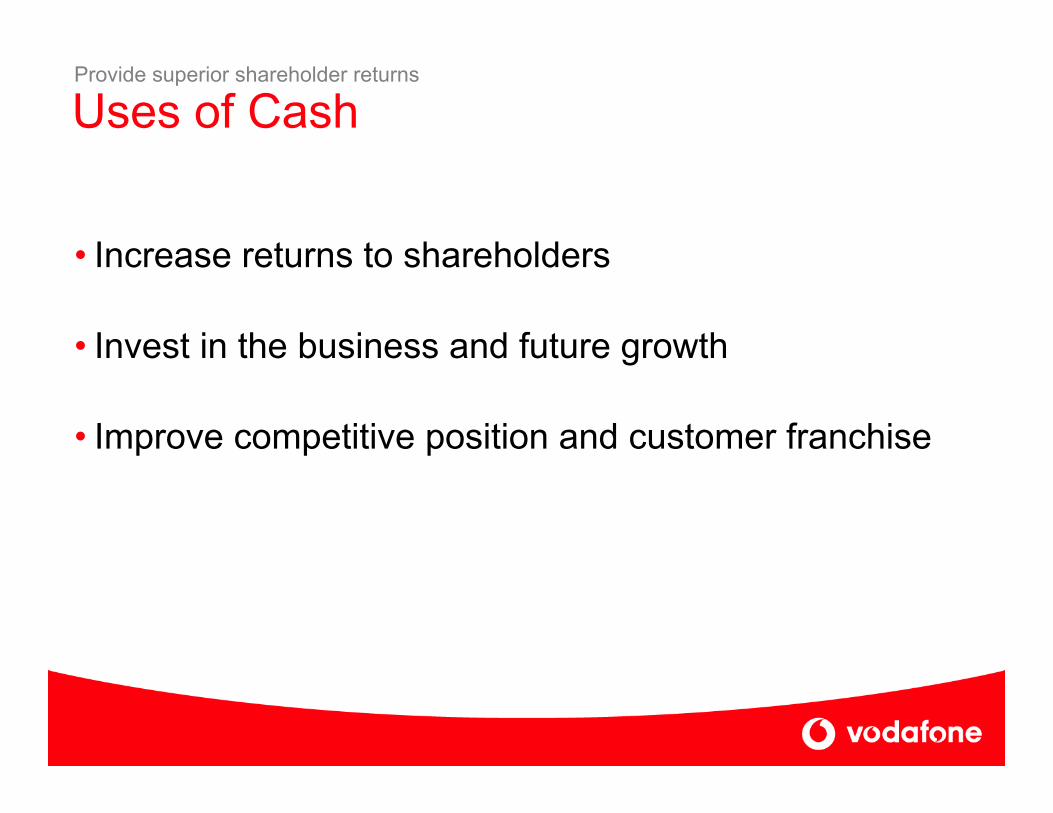
• Increase returns to shareholders
• Invest in the business and future growth
• Improve competitive position and customer franchise
Uses of CashProvide superior shareholder returns

Continued Dividend Growth
March '03 March '04
Dividend growth rate
1.6929p
2.0315p20%
5% 5% 5%
15%
20%
2000 2001 2002 2003 2004
Dividend growth (2000-4)
Provide superior shareholder returns

Nov '03 May '04
Increased Buyback Programme
• £3bn supercedes £2.5bn programme
• £3bn on top of £1.1bn already purchased
Provide superior shareholder returns
£2.5bn
£3bn
Bought Back £1.1bn

Six Strategic GoalsProvide superior shareholder returns
Delight our customers
Leverage scale and scope
Expand market boundaries
Build the best team
Be a responsible business

Vodafone live!TMDelight our customers
• Vodafone live!TM with 3G
– Germany, Portugal, Italy and Spain in Europe
– Several countries to follow
• Over 6.8m controlled customers

Vodafone Mobile Connect 3G Datacard• Launched in
February in 7 markets
• Over 50% of datacard sales - 3G
Delight our customers

Six Strategic GoalsProvide superior shareholder returns
Delight our customers
Leverage scale and scope
Expand market boundaries
Build the best team
Be a responsible business

Global Benefits
Speed to Market
Customer Experience
Strategic Cost Position
Growth for People
Leverage scale and scope
• Develop, implement and commercialise superior 3G based services

Six Strategic GoalsProvide superior shareholder returns
Delight our customers
Leverage scale and scope
Expand market boundaries
Build the best team
Be a responsible business

Strategic Relationships in Mobile EcosystemExpand market boundaries

Strong Equity Footprint Enhanced by Partner NetworksExpand market boundaries

Equity Footprint Investments Expand market boundaries
• Commitment to solid credit profile• Maintain strict financial discipline• Exceed appropriate cost of capital
Criteria for Future Opportunities
US• AT&T Wireless and Verizon deals in line with this approach• Committed to the US through Verizon Wireless

Creating Value for Vodafone ShareholdersExpand market boundaries
• Investments of up to c.£2.6 billion in Japan
• Consistent with Vodafone’s overall strategy
• Simplifies corporate structure, improves efficiency and increases management focus
• Long–term commitment to Japan
• EPSA accretive from first year

Equity Footprint Investments Expand market boundaries
• Commitment to solid credit profile• Maintain strict financial discipline• Exceed appropriate cost of capital
Criteria for Future Opportunities
US• AT&T Wireless consistent with investment approach• Committed to the US through Verizon Wireless
• Like to gain full control• At right price
Italy & France
Minority Assets
Low Penetrated Markets
• Selective opportunities for future growth
• Opportunities in Eastern Europe
MAJORITY OF FUTURE INVESTMENT

Six Strategic GoalsProvide superior shareholder returns
Delight our customers
Leverage scale and scope
Expand market boundaries
Build the best team
Be a responsible business

Build the Best Team
• Continue to develop and recruit people
• Motivated employees with strong Vodafone culture
Build the best global team

Six Strategic GoalsProvide superior shareholder returns
Delight our customers
Leverage scale and scope
Expand market boundaries
Build the best team
Be a responsible business

Be a Responsible Business• Committed to high standards of business integrity & professionalism
• Striving to earn trust and confidence of all our stakeholders
Be a responsible business


Ken HydonGroup Financial DirectorVodafone Group Plc© Vodafone Group 2004

Statutory Results
• £33.6 bn
• Up 10% (£3.2 bn)
• Mobile organic growth:
– Total: +10%
– Data: +20%
– Voice: +8%
Turnover
1.6
0.7
0.5
1.3
(0.9)
-
0.5
1.0
1.5
2.0
2.5
3.0
3.5
4.0
4.5
Mobile voicegrowth
(organic)
Mobile datagrowth
(organic)
Other growthincl. fixed(organic)
Foreigncurrency
Acquisitions& disposals
Ch
ang
e (£
bill
ion
s)
Analysis of Turnover Growth

Statutory Results
• £10.7 bn
• Up 17% (£1.6 bn)
• 13% mobile organic growth
• £4.5 bn depreciation**
Group Operating Profit*
* Before amortisation of goodwill and exceptional items as detailed in notes 3 & 4 of the Preliminary Announcement dated 25 May 2004** Includes amortisation of intangible fixed assets and loss on disposal of tangible fixed assets
(0.1)
0.10.3
0.11.2
-
0.5
1.0
1.5
2.0
Mobilegrowth
(organic)
Other growth
(organic)
Foreigncurrency
Acquisitions Disposals
Chan
ge (£
bill
ions
)
Analysis of Group Operating Profit* Growth

Year ended 31 March
2004£m
2003£m
Increase%
Turnover 33,559 30,375 10
Group operating profit* 10,749 9,181 17Net interest payable (714) (752) (5)
Profit before tax* 10,035 8,429 19Tax (3,154) (2,956)
Goodwill amortisation (15,207) (14,056)Exceptional items 125 (581)Minority interests (814) (655)
Loss for the financial year (9,015) (9,819)
Basic loss per share (13.24p) (14.41p)Adjusted earnings per share* 9.10p 6.81p
Statutory Results
* Before amortisation of goodwill and exceptional items as detailed in notes 3 & 4 of the Preliminary Announcement dated 25 May 2004
5.15
6.81
9.10
2001/2 2002/3 2003/4
Adjusted EPS* (pence)

Shareholder Returns• Dividends 2003/4:
Pence per share
Interim paid 0.9535Proposed final 1.0780
2.0315
• Share purchases:
– 2003/4: £1.1 bn
– 2004/5: £3.0 bn planned
£4.1 bn
5% 5% 5%
20%
15%
0.0%
0.2%
0.4%
0.6%
0.8%
1.0%
1.2%
1.4%
1.6%
2000 2001 2002 2003 2004
Div
iden
d Yi
eld
(Bas
ed o
n 31
/3/0
4 cl
osin
g sh
are
pric
e of
£1.
2875
)
Dividend Growth and Yield (2000-4)

Cash Flow Year ended 31 March2004
£m2003
£mIncrease
%EBITDA* 12,640 11,217 13 Working capital & exceptionals (323) (75) 331
Operating cash flow 12,317 11,142 11Capital expenditure (4,350) (5,180) (16)Licences (21) (99) (79)
Operating free cash flow 7,946 5,863 36Tax paid (1,182) (883) 34Net interest received/(paid) 31 (475) N/ADividends received & other 1,726 666 159
Free cash flow 8,521 5,171 65Acquisitions (2,083) (5,685)
Disposals 1,123 700Group dividends (1,258) (1,052)Share purchases (1,032) -Other 80 (939)
Net debt decrease 5,351 (1,805)Opening net debt (13,839) (12,034)
Closing net debt (8,488) (13,839)
Germany19%
Italy23%
United Kingdom
12%
Japan18%
Other Europe
21%
Other3%
Other Mobile
4%
Analysis of Operating Cash Flow
* EBITDA is not a performance measure recognised under UK GAAP but is presented in order to highlight operational performance of the Group

2G Network16%
Other Mobile7%
Transmission Network &
VAS16%
3G Network35%
Non-Network IT (Billing Systems,
CRM, ERP…)22%
Fixed line4%
• £4.8 bn additions
Germany18%
Italy15%
United Kingdom
11%Japan26%
Other Mobile
27%
Other Operations
3%
Tangible Fixed AssetsMarch 2004 March 2005
• Around £5 bn additionsGeographic Analysis Category Analysis

Debt Maturity by Calendar YearAt 31 March 2004 (£ Billions)
0.0
0.5
1.0
1.5
2.0
2.5
2004
2005
2006
2007
2008
2009
2010
2011
-20
2021
+
Net Debt• March 2004:
£bn
Gross debt (14.3)
Cash & investments 5.8
Net debt (8.5)
• Maintain solid credit profile
• Funds used for:
• Operations, incl. Tax
• Up to c.£2.6 bn in Japan
• £3.0 bn share buybacks
Total = £14.3 billion

Summary• Growth:
– Turnover
– EBITDA*
– Operating profit**
– Adjusted earnings per share**
– Free cash flow *
• Healthy financial position
• Increasing returns to shareholders
* EBITDA and free cash flow are not performance measures recognised under UK GAAP but are presented in order to highlight operational performance of the Group** Before amortisation of goodwill and exceptional items as detailed in notes 3 & 4 of the Preliminary Announcement dated 25 May 2004

Julian Horn-SmithGroup Chief Operating OfficerVodafone Group Plc© Vodafone Group 2004

Vodafone Germany
• Solid performance
• Strong customer and revenue growth
• Improved profitability
2004
£m2003
£mIncrease
Turnover
5,404 4,646 16%
Operating profit(1)
1,741 1,435 21%
EBITDA margin(2)
46.1% 43.4% 2.7pp
(1) Before goodwill amortisation and exceptional items(2) Proportionate EBITDA before exceptional items

Vodafone Germany
21,810
22,940
23,780
25,012
H1 02/03 H2 02/03 H1 03/04 H2 03/04
45.3%46.6%
47.6%48.5%
(400)
(200)
0
200
400
600
800
1,000
1,200
1,400
H1 02/03 H1 02/03 H1 03/04 H2 03/04
('000
s)
Contract Net Additions Prepaid Net AdditionsContract % of Total base
Net additionsCustomers

Vodafone Germany
11%
13%
11%
8%
0%
5%
10%
15%
20%
25%
H1 02/03 H2 02/03 H1 03/04 H2 03/04
Annu
alis
ed h
alf y
ear c
hurn
%
Churn % Upgrade %
Churn & upgrade %

Vodafone Germany
15.4%16.4%
17.0% 17.4%
250
260
270
280
290
300
310
320
330
Sep 02 Mar 03 Sep 03 Mar 04
12 m
onth
rollin
g A
RP
U (€
)
ARPU Data % of service revenue (1)
5%
7% 8% 7%
3%
9% 9%
4%4%
6%
8%
(1%)
(2%)
0%
2%
4%
6%
8%
10%
H1 02/03 H2 02/03 H1 03/04 H2 03/04Ye
ar o
n ye
ar g
row
th
Service revenue Average customers Total minutes
(1) 12 month rolling data % of service revenue
ARPU & data Year on year growth

Vodafone Germany
10.3%
14.8%
12.4%
14.2%
0
100
200
300
400
500
600
H1 02/03 H2 02/03 H1 03/04 H2 03/04
Cus
tom
er b
ase
cost
s (€
milli
ons)
SRC SAC % Service revenue
46.2% 46.7% 45.5%
40.8%
0
200
400
600
800
1,000
1,200
1,400
H1 02/03 H2 02/03 H1 03/04 H2 03/04EB
ITD
A (£
mill
ions
)
Proportionate EBITDA Proportionate EBITDA margin
Customer base costs Proportionate EBITDA(1)
(1) Before exceptional items

Vodafone Italy
• Good customer growth
• Higher ARPU
• Improved profitability
2004
£m2003
£mIncrease
Turnover
5,276 4,371 21%
Operating profit(1)
2,143 1,588 35%
EBITDA margin(2)
53.0% 49.3% 3.7pp
(1) Before goodwill amortisation and exceptional items(2) Proportionate EBITDA before exceptional items

Vodafone Italy
18,316
19,41219,982
21,137
17.2% 17.5%16.9% 16.6%
H1 02/03 H2 02/03 H1 03/04 H2 03/04
Total closing customers Annualised churn
Customers and churn
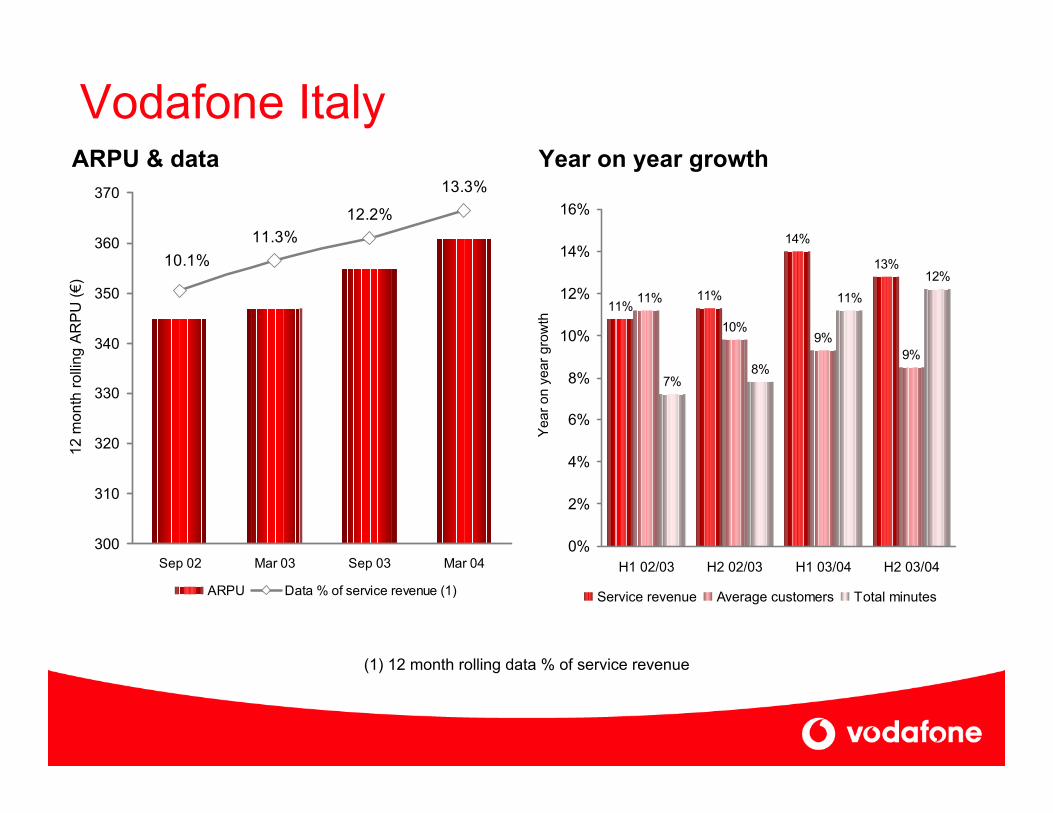
Vodafone Italy
11.3%12.2%
13.3%
10.1%
300
310
320
330
340
350
360
370
Sep 02 Mar 03 Sep 03 Mar 04
12 m
onth
rollin
g A
RP
U (€
)
ARPU Data % of service revenue (1)
11%11%
14%
13%
10%9%
9%
7%8%
11%12%
11%
0%
2%
4%
6%
8%
10%
12%
14%
16%
H1 02/03 H2 02/03 H1 03/04 H2 03/04
Yea
r on
year
gro
wth
Service revenue Average customers Total minutes
(1) 12 month rolling data % of service revenue
ARPU & data Year on year growth

Vodafone Italy
3.5%3.3%
2.6%
3.0%
0
20
40
60
80
100
120
140
160
H1 02/03 H2 02/03 H1 03/04 H2 03/04
Cus
tom
er b
ase
cost
s (€
milli
ons)
SRC SAC % Service revenue
49.4%
54.8%51.2%
49.3%
0
200
400
600
800
1,000
1,200
H1 02/03 H2 02/03 H1 03/04 H2 03/04
EB
ITD
A (£
mill
ions
)
Proportionate EBITDA Proportionate EBITDA margin
Customer base costs Proportionate EBITDA(1)
(1) Before exceptional items

Vodafone UK
• Intensified competition
• Investment in customers
• Continued customer growth
2004
£m2003
£mIncrease
Turnover
4,744 4,026 18%
Operating profit(1)
1,098 1,120 (2%)
EBITDA margin(2)
33.9% 38.3% (4.4pp)
(1) Before goodwill amortisation and exceptional items(2) Proportionate EBITDA before exceptional items

Vodafone UK
40.6%41.3%
40.1%
41.3%
(600)
(400)
(200)
0
200
400
600
800
H1 02/03 H2 02/03 H1 03/04 H2 03/04
('000
s)
Contract net additions Prepaid net additionsContract % of total base
12,95713,300
13,483
14,095
H1 02/03 H2 02/03 H1 03/04 H2 03/04
Net additions Customers

O222.5%
Orange26.6%
T-Mobile19.9% Vodafone
31.0%
Total revenue share (Mar 04) 1
1 Company published results (excluding 3 UK)
Vodafone UK – Market leader

Vodafone UK
13%
6%
8%8%
5%
2%
4%
1%
4%
6%
13%
9%
0%
2%
4%
6%
8%
10%
12%
14%
H1 02/03 H2 02/03 H1 03/04 H2 03/04
Year
on
year
gro
wth
Service revenue Singlepoint effect Average customers Total minutes
(1) 12 month rolling data % of service revenue
ARPU & data Year on year growth
13.2%14.4%
15.0%16.1%
200
220
240
260
280
300
320
Sep 02 Mar 03 Sep 03 Mar 04
12 m
onth
rolli
ng A
RP
U (£
)
ARPU Singlepoint effect Data % service revenue (1)

Vodafone UK
11.8% 12.0%13.1%
17.9%
0
50
100
150
200
250
300
350
400
450
H1 02/03 H2 02/03 H1 03/04 H2 03/04
Cus
tom
er b
ase
cost
s (£
milli
ons)
SRC SAC % Service revenue
Customer base costs EBITDA(1)
(1) Before exceptional items

Verizon Wireless
• Strong momentum
• Market share gain
• Profitable growth
2004
£m2003
£mIncrease
Proportionate turnover
6,111 5,686 7%
Proportionate EBITDA margin
35.9% 35.2% 0.7pp
Share of operating profit(1)
1,406 1,270 11%
(1) Before goodwill amortisation and exceptional items

Verizon Wireless
49% 50%53%
56%
0
500
1,000
1,500
2,000
2,500
3,000
3,500
H1 02/03 H2 02/03 H1 03/04 H2 03/04
('000
s)
Price Communications Wireless acquisitionNet additionsPenetration
Net additions and penetration Churn
0%
5%
10%
15%
20%
25%
30%
H1 02/03 H2 02/03 H1 03/04 H2 03/04
Annu
alis
ed h
alf y
ear c
hurn
%

Verizon Wireless
35.3% 35.1% 35.7% 36.1%
850
900
950
1,000
1,050
1,100
1,150
H1 02/03 H2 02/03 H1 03/04 H2 03/04
Pro
porti
onat
e E
BIT
DA
(£ m
illio
ns)
Proportionate EBITDA Proportionate EBITDA margin
ARPU & data Proportionate EBITDA(2)
0.8%1.1%
1.7%
2.7%
500
520
540
560
580
600
620
640
660
Sep 02 Mar 03 Sep 03 Mar 04
12 m
onth
rollin
g A
RP
U ($
)
ARPU Data % service revenue (1)
(1) 12 month rolling data % of service revenue
(2) Before exceptional items

Vodafone/Verizon Joint Initiatives
• Continued strong working relationship
• Dual mode global phone
• Vodafone dashboard to be used for data card offering
• SMS interoperability

Vodafone Japan
• Challenging market conditions
• Increasing focus on 3G
2004
£m2003
£mIncrease
Turnover
7,745 7,539 3%
Operating profit(1)
1,045 1,310 (20%)
EBITDA margin(2)
28.9% 31.3% (2.4pp)
(1) Before goodwill amortisation and exceptional items(2) Proportionate EBITDA before exceptional items

Vodafone Japan
14,951
14,540
13,912
12,949
18.0% 18.5% 18.6% 18.4%
H1 02/03 H2 02/03 H1 03/04 H2 03/04
Customers Market share
0
200
400
600
800
1,000
H1 02/03 H2 02/03 H1 03/04 H2 03/04
('000
s)
Contract net additions Prepaid net additions
Net additions Customers and market share

20.0%
23.7%
18.1%
23.9%
0
20
40
60
80
100
120
140
160
180
H1 02/03 H2 02/03 H1 03/04 H2 03/04
Cus
tom
er b
ase
cost
s (¥
billi
ons)
SRC SAC % Service revenue
32.4%
25.4%
32.0%
30.6%
0
200
400
600
800
1,000
H1 02/03 H2 02/03 H1 03/04 H2 03/04
EB
ITD
A (£
mill
ions
)
Proportionate EBITDA Proportionate EBITDA Margin
Customer base costs Proportionate EBITDA(1)
(1) Before exceptional items
Vodafone Japan

13%
10%
8%
0%
15%14%
11%
13%
9%
6%5%
20%
0%
5%
10%
15%
20%
25%
H1 02/03 H2 02/03 H1 03/04 H2 03/04
Year
on
year
gro
wth
Service revenue Average customers Total minutes
21.9%21.3%20.3%
18.1%
0
25,000
50,000
75,000
100,000
Sep 02 Mar 03 Sep 03 Mar 04
12 m
onth
rollin
g AR
PU (¥
)
ARPU Data % of service revenue (1)
(1) 12 month rolling data % of service revenue
ARPU & data Year on year growth
Vodafone Japan

Vodafone Japan
• Fundamental market shift from 2G to 3G• Wider 3G handset availability in Christmas quarter• High quality 3G network
Increasing 3G Focus
Competitive Position
Outlook
• Fundamental change required• Extensive transformation plan
• No significant benefits from transformation plan until FY06• FY05 margin slightly lower than 2H FY04

Business Transformation Plan• Improve integrated 3G offering• Focus on corporate segment• Targeted marketing initiatives
Commercial and Marketing Initiatives
Distribution
Cost Efficiency
Financial Tools and Processes
Organisational Structure
• Increase support to existing channels• Develop new outlets, some controlled• Efficient segment-driven system
• 9 into 1 integration• Benefits from Group scale
• Enhance business decision making
• Develop skills and capabilities• Strengthen management team

Vodafone Japan
• Far reaching change programme
• Good business with huge potential
• Building one integrated, national business
• Long term commitment to Japanese market
Summary

Vodafone Group
• Delighting our customers
• Continued investment in 3G services
• Drive scale and scope benefits
• Build on success as worldwide leader
Conclusion

Peter BamfordChief Marketing OfficerVodafone Group Plc© Vodafone Group 2004

Marketing Objectives
• Build Vodafone brand and delight our customers
• Drive revenue growth
– Co-ordinated marketing initiatives
– Focused end-to-end customer propositions

Group Marketing Organisation
• Aligned with customer segments
• High calibre
• Multi-national

Brand Awareness has grown strongly…..…focus on brand preference
50
100
Spo
ntan
eous
Aw
aren
ess%
*
0
39
Dec 2003
60
54%
63%
20%
Dec 2002
2420
Dec 2001Dec 2000
Prompted awareness* over 98%
* Vodafone subsidiary countries

Driving Brand Preference……through every element of the customer experience
Tarif
fs
Net
wor
k
Bill
ing
Han
dset
/ U
I
Cus
tom
er C
are
Set
up
Info
rmat
ion
Cha
nnel
Ser
vice
s
Actual Experience Perception

Driving Revenue through Segmentation
Teens Young, Active, Fun Adult Personal User Mature Basic User
Company PaidSelf Chooser for Work Int. Bus. Traveller

Segmented Propositions
Int. Bus. Traveller
Company Paid
Mature Basic User
Adult Personal User
Young, Active, Fun
Teens
Segment DataVoice & Text
Self Chooser for Work
Core Usage
Vodafone live!TM
Vodafone WirelessOffice
Pushe-mail
VodafoneMobile
Connect

Core Voice and Text Usage
Current OpCoBest Practices
Customer Insight and Pilot
Driving
- Usage
- Penetration
- Value
ARPU
7 Initiatives based on:
- Product
- Tariff
- Promotion

Vodafone live!TM Enhancements• Video messaging• Ringback tones• Games with 3D graphics and online high-scores
New ProductsLaunched
GlobalContent
Deals
Terminal Portfolio
Terminal Innovation
• Sony Pictures and Sony Music Entertainment• Walt Disney• Warner Bros.• THQ Wireless
• Extended range from 3-15• Includes lower-priced terminals
• Sharp GX30 – first mega pixel camera phone in Europe• Launching new Vodafone live!
TMterminal on average every 11
days

Vodafone live!TM Growth and Performance
Growth
Performance
• Available in 19 countries
• Mobilkom Austria first partner network to launch Vodafone live!TM today in Austria, Croatia & Slovenia
• 6.8 million customers in controlled subsidiaries
• 8.5% penetration of customer base
• 0.7 million customers in associates
• ARPU 65% higher than non live! customers
• Over 7% ARPU uplift when customers migrate
• 13.0 million customers in Japan

Vodafone live!TM with 3G

Vodafone Wireless Office
• Now launched in 8 countries

Vodafone Mobile ConnectTM

Vodafone Mobile Connect 3G Datacard
“Vodafone Mobile Connect saves our sales reps up to 5 hours a week unnecessary travel. This increased productivity is equivalent to an additional full-time employee.”
“The savings on my hotel phone charges alone have more than paid back the investment in the card. I am recommending the solution to my clients.”
“Where we had coverage the performance has been absolutely terrific, it’s lived up to its expectations; well over 300kbps, so it works really well.”
“Just recently I spent 2.5 half hours in a taxi on the way to Heathrow. I was able to use that time effectively, sending and receiving emails as easily as if I was at my desk.”

Push E-mail

Summary• Our brand is now well established
• Customer segmentation model provides clear focus and targeting capability
• Proven approach to developing, testing, rolling out and enhancing customer propositions
• Vodafone live!TM and Vodafone Mobile ConnectTM provide platforms for 3G

Thomas GeitnerChief Technology OfficerGroup Technology and Business IntegrationVodafone Group Plc© Vodafone Group 2004

Delivering the Benefits of Scale and Scope
3 70
Momentum– Branding
– Product & Services
– Supply Chain Management
One Vodafone

Speed to Market
Customer Experience
Strategic Cost Position
Growth for People
Benefits of One Vodafone……achieve sustainable competitive advantage

Marketing &Sales
CustomerOperations
Network IT OtherFunctions
Total Costs
Interconnect
Commissions &LoyaltyInternal Spend
External Spend
Total Cash Cost 03/0416 majority-owned OpCos


Focus on Six AreasNetwork Standardisation and supply chain management
Service Platforms Shared Service Centre
Terminals Standard process and supply chain management
Customer Management Common practice and IT consolidation
IT Common practice and IT consolidation
Roaming Leverage footprint


Arun SarinChief ExecutiveVodafone Group Plc© Vodafone Group 2004

Outlook for FY 04/05Average Organic Customer Growth* High single digit
Organic Mobile Revenue Growth* High single digit
Mobile EBITDA Margin* Broadly stable
Fixed Asset Additions Around £5bn
* Proportionate Basis
A year of transition

Free Cash FlowOutlook for FY 04/05
£8.5bn for FY 03/04 Included:
~£7bn for FY 04/05 Assumes:
• + £600m one off hedging gain
• + £200m free cash flow from JT fixed
• - £1,200m cash tax payment
• - £4,300m cash capex payments
• No hedging gain
• No free cash flow from JT - sold
• - ~£2,000m cash tax payments
• - ~£5,300m cash capex payments


Important information This presentation does not constitute, or form part of, any offer or invitation to sell, or any solicitation of any offer to purchaseany securities in any jurisdiction, nor shall it (or any part of it) or the fact of its distribution form the basis of or be relied on in connection with, any contract therefor. The offers for the shares which Venus and its subsidiaries do not already own in Venus Holdings K.K. (the “Venus Holdings K.K.Offer”) and in Venus K.K. (together with the Venus Holdings K.K. Offer, the “Offers”) will not be made, directly or indirectly, in orinto the United States, Canada or Australia, or by use of the mails, or by any means or instrumentality (including, withoutlimitation, facsimile transmission, telephone and the internet) of interstate or foreign commerce, or of any facility of a nationalsecurities exchange, of the United States, Canada or Australia and the Offers will not be capable of acceptance by any such use,means, instrumentality or facility or from within the United States, Canada or Australia. Copies of this presentation and anyfuture related materials are not being and may not be mailed or otherwise distributed or sent in or into the United States, Canadaor Australia. The Offers will furthermore not be directed to persons whose participation in the offer requires that further offer documents areissued or that registration or other measures are taken, other than those required under Japanese law. No document relating tothe Offers may be distributed in or into any country where such distribution or offer requires any of the aforementioned measuresto be taken or would be in conflict with any law or regulation of such a country. This presentation is not an offer of securities for sale into the United States, Canada, Australia or any other jurisdiction. VenusHoldings K.K. shares may not be offered or sold in the United States unless they are registered or exempt from registration.There will be no public offer of securities in the United States. This presentation has been prepared by Venus Group Plc and is the sole responsibility of Venus Group Plc. UBS is acting for Venus and Venus International and no one else and will not be responsible to anyone other than Venus and Venus International for providing the protections offered to clients of UBS or for providing advice in relation to the Offers or in relation to the contents of this presentation or any transaction or arrangement referred to herein.

This presentation contains “forward-looking statements” within the meaning of the US Private Securities Litigation Reform Act of 1995 with respect to the Group’s financial condition, results of operations and businesses and certain of the Group’s plans and objectives. In particular, such forward-looking statements include the statements with respect to Vodafone’s expectations for the year ending 31 March 2005 as to average proportionate mobile customer growth, full year proportionate organic mobile revenue growth, proportionate organic mobile EBITDA margins, capitalised fixed asset additions, and free cash flow and tax payments. These forward-looking statements are made on the basis of certain assumptions which Vodafone believes to be reasonable in light of Vodafone’s operating experience in recent years. The principal assumptions on which these statements are based relate to exchange rates, customer numbers, usage and pricing, take-up of new services, termination rates, customer acquisition and retention costs and the availability of handsets.
The presentation also contains other forward-looking statements including statements with respect to Vodafone’s expectations as to launch and roll-out dates for products and services, including, for example, 3G services, Vodafone live! ™, mobile data applications and Vodafone’s business offerings; intentions regarding the development of products and services; the ability to integrate our operations throughout the Group in the same format and on the same technical platform and the ability to be operationally efficient; the share purchase programme; the anticipated accretive effect of planned acquisitions; the rate of dividend growth and payout by the Group or its existing investments; expected effective tax rates and expected tax payments; mobile penetration and coverage rates; expectations with respect to long-term shareholder value growth; the anticipated effect on profitability of our One Vodafone global integration programme; our ability to be the mobile market leader; overall market trends and other trend projections. Forward-looking statements are sometimes, but not always, identified by their use of a date in the future or such words as “anticipates”, “aims”, “could”, “may”, “should”, “expects”, “believes”, “intends”, “plans” or “targets”.
By their nature, forward-looking statements are inherently predictive, speculative and involve risk and uncertainty because they relate to events and depend on circumstances that will occur in the future. There are a number of factors that could cause actual results and developments to differ materially from those expressed or implied by these forward-looking statements particularly the statements regarding our outlook; expenses and the other business developments and plans referred to above. These factors include, but are not limited to, the following: changes in economic or political conditions in markets served by operations of the Group that would adversely affect the level of demand for mobile services; greater than anticipated competitive activityrequiring changes in pricing models and/or new product offerings or resulting in higher costs of acquiring new customers or providing new services; the impact on capital spending from investment in network capacity and the deployment of new technologies, or the rapid obsolescence of existing technology; slower customer growth or reduced customer retention; the possibility that technologies, including mobile internet platforms, and services, including 3G services, will not perform according to expectations or that vendors’ performance will not meet the Group’s requirements; changes in the projected growth rates of the mobile telecommunications industry; the Group’s ability to realise expected synergies and benefits associated with 3G technologies, the integration of our operations and those of recently acquired companies; future revenue contributions of both voice and non-voice services offered by the Group; lower than expected impact of GPRS, 3G and Vodafone live! ™ and the Group’s business offerings on the Group’s future revenues, cost structure and capital expenditure outlays; the ability of the Group to harmonise mobile platforms and any delays, impediments or other problems associated with the roll-out and scope of 3G technology and services and Vodafone live! ™ and the Group’s business or service offerings in new markets; the ability of the Group to offer new services and secure the timely delivery of high-quality, reliable GPRS and 3G handsets, network equipment and other key products from suppliers; greater than anticipated prices of new mobile handsets; the ability to realise benefits from entering into partnerships for developing data and internet services and entering into service franchising and brand licensing; the possibility that the pursuit of new, unexpected strategic opportunities may have a negative impact on one or more of themeasurements of our financial performance; any unfavourable conditions, regulatory or otherwise, imposed in connection with pending or future acquisitions or dispositions; changes in the regulatory framework in which the Group operates, including possible action by regulators in markets which the Group operates or by the European Commission regulating rates the Group is permitted to charge; the Group’s ability to develop competitive data content and services which will attract new customers and increase average usage; the impact of legal or other proceedings against the Group or other companies in the mobile telecommunications industry; the possibility that new marketing campaigns or efforts are not an effective expenditure; the possibility that the Group’s integration efforts do not increase the speed-to-market of new products or improve the cost position; changes in exchange rates, including particularly the exchange rate of the pound to the euro, US dollar and the Japanese yen; the risk that, upon obtaining control of certain investments, the Group discovers additional information relating to the businesses of that investment leading to restructuring charges or write-offs or with other negative implications; changes in statutory tax rates and profit mix which would impact the weighted average tax rate; changes in tax legislation in the jurisdictions in which the Group operates; final resolution of open issues which might impact the effective tax rate; timing of tax payments relating to the resolution of open issues and loss of suppliers or disruption of supply chains.
Furthermore, a review of the reasons why actual results and developments may differ materially from the expectations disclosed or implied within forward-looking statements can be found in our Preliminary Announcement of Results for the year ended 31 March 2004 and under “Risk Factors” contained in our Annual Report & Accounts and Form 20-F with respect to the financial year ended 31 March 2003. All subsequent written or oral forward-looking statements attributable to the Company or any member of the Group or any persons acting on their behalf are expressly qualified in their entirety by the factors referred to above.
No assurance can be given that the forward-looking statements in this document will be realised. Neither Vodafone nor any of its affiliates intends to update these forward-looking statements.
Forward-Looking Statements