Embed Size (px)
Citation preview
TM

Prepared By: ICF International, Inc. Project Manager: Bruce A. Hedman Authors: Ken Darrow, Bruce Hedman, Anne Hampson Bellevue, WA 98005 Commission Contract No. 500-06-011 Commission Work Authorization No: WA-032-P-R
Prepared For:Public Interest Energy Research (PIER) California Energy Commission
Pramod Kulkarni Contract Manager Kenneth Koyama Office Manager Energy Generation Research Office
Thom Kelly, Ph.D. Deputy Director ENERGY RESEARCH AND DEVELOPMENT DIVISION
Melissa Jones Executive Director
DISCLAIMER
This report was prepared as the result of work sponsored by the California Energy Commission. It does not necessarily represent the views of the Energy Commission, its employees or the State of California. The Energy Commission, the State of California, its employees, contractors and subcontractors make no warrant, express or implied, and assume no legal liability for the information in this report; nor does any party represent that the uses of this information will not infringe upon privately owned rights. This report has not been approved or disapproved by the California Energy Commission nor has the California Energy Commission passed upon the accuracy or adequacy of the information in this report.


Preface
The California Energy Commission’s Public Interest Energy Research (PIER) Program supports public interest energy research and development that will help improve the quality of life in California by bringing environmentally safe, affordable, and reliable energy services and products to the marketplace.
The PIER Program conducts public interest research, development, and demonstration (RD&D) projects to benefit California.
The PIER Program strives to conduct the most promising public interest energy research by partnering with RD&D entities, including individuals, businesses, utilities, and public or private research institutions. PIER funding efforts are focused on the following RD&D program areas:
• Buildings End‐Use Energy Efficiency
• Energy Innovations Small Grants
• Energy‐Related Environmental Research
• Energy Systems Integration
• Environmentally Preferred Advanced Generation
• Industrial/Agricultural/Water End‐Use Energy Efficiency
• Renewable Energy Technologies
• Energy‐Related Transportation Research
Combined Heat and Power Market Assessment is the final report for the Combined Heat and Power Technical and Market Assessment project (Contract Number 500‐06‐011, Work Authorization number ICF‐06‐032‐P‐R) conducted by ICF International, Inc. The information from this project contributes to PIER’s Environmentally Preferred Advanced Generation Program.
For more information about the PIER Program, please visit the Energy Commission’s website at www.energy.ca.gov/research/ or contact the Energy Commission at 916‐654‐4878.
Please cite this report as follows: Darrow, Ken, Bruce Hedman, Anne Hampson. 2009. Combined Heat and Power Market Assessment. California Energy Commission, PIER Program. CEC‐500‐2009‐094‐D.
v

vi
Table of Contents
Executive Summary ................................................................................................................................... 1 1.0 Introduction ................................................................................................................................... 9 2.0 Project Approach ......................................................................................................................... 11
2.1. Existing CHP in California ..................................................................................................... 11 2.2. CHP Technology Characterization ........................................................................................ 17
2.2.1. Reciprocating Engines ..................................................................................................... 19 2.2.2. Natural Gas Turbines ...................................................................................................... 22 2.2.3. Microturbines ................................................................................................................... 24 2.2.4. Fuel Cells ........................................................................................................................... 26 2.2.5. Absorption Chillers .......................................................................................................... 28
2.3. Natural Gas and Electricity Price Trends ............................................................................. 29 2.3.1. Natural Gas Prices ............................................................................................................ 29 2.3.2. Electricity Prices ............................................................................................................... 31
2.4. CHP Technical Potential ......................................................................................................... 43 2.4.1. Technical Potential Methodology .................................................................................. 45 2.4.2. CHP Target Markets ........................................................................................................ 45 2.4.3. California Target CHP Facilities .................................................................................... 48 2.4.4. Quantify Electric and Thermal Loads for CHP Target Applications ........................ 49 2.4.5. Technical Potential Results ............................................................................................. 57
2.5. CHP Market Model .................................................................................................................. 65 2.5.1. Market Segmentation and Forecast Horizon ............................................................... 66 2.5.2. Market Model Input Assumptions ................................................................................ 68 2.5.3. Economic Competitiveness of CHP and Market Acceptance .................................... 70 2.5.4. CHP Output Variables .................................................................................................... 73
3.0 Project Results.............................................................................................................................. 75 3.1. Base Case ................................................................................................................................... 75
3.1.1. Base Case Input Assumptions ........................................................................................ 75 3.1.2. Base Case Results ............................................................................................................. 75
3.2. Incentive Cases ......................................................................................................................... 79 3.2.1. Incentive Case Input Assumptions ................................................................................ 79 3.2.2. Incentive Case Results ..................................................................................................... 81
3.3. Energy and Environmental Impacts ...................................................................................... 83 3.3.1. Energy Impacts ................................................................................................................. 83 3.3.2. GHG Emissions Impacts ................................................................................................. 84
4.0 Conclusions and Recommendations ........................................................................................ 87 Glossary ................................................................................................................................................. 91
APPENDIX A: Existing CHP Detailed Tables ................................................................................... A‐1 APPENDIX B: Electricity Consumption per Employee Estimates .................................................. B‐1 APPENDIX C: Scenario Results ........................................................................................................... C‐1 APPENDIX D: Comparison to 2005 Market Study ........................................................................... D‐1 APPENDIX E: Biogas and Waste Heat CHP Applications .............................................................. E‐1
vii
List of Figures
Figure ES‐1: Existing Combined Heat and Power Capacity in California ......................................... 2 Figure ES‐2: Base Case Cumulative Market Penetration by Market Type ........................................ 4 Figure ES‐3: Base Case and Incentive Cases Cumulative Market Penetration Results .................... 5 Figure 1: Existing CHP Capacity in California by Application Class ............................................... 12 Figure 2: Industrial CHP Capacity in California ................................................................................. 13 Figure 3: Commercial CHP Capacity in California ............................................................................. 13 Figure 4: Installed CHP in California by Utility Service Area ........................................................... 14 Figure 5: Existing CHP in California by Size Range ........................................................................... 15 Figure 6: Existing CHP in California by Fuel ....................................................................................... 15 Figure 7: Existing CHP in California by Prime Mover ....................................................................... 16 Figure 8: Existing CHP Installations in California by Year Installed ............................................... 17 Figure 9: Technology Size Coverage ..................................................................................................... 18 Figure 10: Reciprocating Engine CHP System ..................................................................................... 20 Figure 11: Simple‐Cycle Gas Turbine .................................................................................................... 22 Figure 12: Microturbine‐Based CHP System ........................................................................................ 25 Figure 13: Fuel Cell Electrochemical Process ....................................................................................... 26 Figure 14: Absorption Chiller Cost Fitting Curve ............................................................................... 29 Figure 15: Natural Gas Prices for Power Generation in California (2002‐2009) .............................. 30 Figure 16: California Natural Gas Price Forecast for Electric Power Generation ........................... 31 Figure 17: Average Retail Electric Prices by Load Factor, 50‐500 kW .............................................. 33 Figure 18: Average Retail Electric Prices by Load Factor, 500‐5,000 kW ......................................... 34 Figure 19: Average Retail Electric Prices by Load Factor, 5‐20 MW ................................................. 35 Figure 20: Average Retail Electric Prices by Load Factor, Greater Than 20 MW ............................ 36 Figure 21: Average Retail Rates and Avoided CHP Energy Costs for Continuous ....................... 37 Figure 22: Real Escalation in Marginal Electric Utility Generation .................................................. 39 Figure 23: Average Electricity Cost Savings High Load Factor CHP: 50‐500 kW .......................... 40 Figure 24: CHP Export Price Forecasts ................................................................................................. 43 Figure 25: Existing CHP and Total Remaining CHP Potential by Utility Territory ....................... 65 Figure 26: Share of the California Customers That Will Accept a Given Payback for a Proposed
CHP Project ...................................................................................................................................... 71 Figure 27: Market Acceptance of Different Payback Periods by Customer Interest in CHP ........ 72 Figure 28: Bass Diffusion Curves for 50‐500 kW Market for a Range of Market Growth Rates ... 73 Figure 29: Base Case Cumulative New CHP Market Penetration by Utility ................................... 76 Figure 30: Base Case Cumulative CHP Market Penetration by Size Category ............................... 76 Figure 31: Base Case Cumulative Market Penetration by Market Type .......................................... 77 Figure 32: Cumulative Base Case CHP Market Penetration Added to Existing 2009 CHP .......... 78 Figure 33: Cumulative Base Case Market Penetration if Existing QF CHP Is Eliminated by 2014.
............................................................................................................................................................ 78 Figure 34: Cumulative Market Penetration Forecasts for All Scenarios .......................................... 81 Figure 35: Impact of Assumptions on Large Export Market Penetration ........................................ 82
viii
Figure 36: GHG Emissions Savings by Scenario Using ARB Avoided Central Station Emissions Estimate ............................................................................................................................................ 85
List of Tables
Table ES‐1: Existing Facility and New Technical Market Potential by Size and Market Segment . 3 Table ES‐2: Scenario Comparison of Capacity, Outputs, Efficiency, and Load Factor .................... 6 Table ES‐3: Comparison of Study Results GHG Savings to ARB Target Estimate ........................... 7 Table ES‐4: Large vs. Small Combined Heat and Power Existing Market and Market Outlook
(Generation Only, Avoided AC Not Included) ............................................................................. 7 Table 1: Reciprocating Engine Technology in the 50–500 kW Size Range ....................................... 20 Table 2: Reciprocating Engine Technology in the 500 kW–5 MW Size Range ................................ 21 Table 3: Gas Turbine Technology in the 1–5 MW Size Range ........................................................... 23 Table 4: Gas Turbine Technology in the 5–20 MW Size Range ......................................................... 23 Table 5: Gas Turbine Technology in the >20 MW Size Range ........................................................... 24 Table 6: Microturbine Technology in the 50–500 kW Size Range ..................................................... 25 Table 7: Microturbine Technology in the 500 kW–1 MW Size Range ............................................... 26 Table 8: Fuel Cell Technology in the 50–500 kW Size Range ............................................................. 27 Table 9: Fuel Cell Technology in the 500 kW–1 MW Size Range ...................................................... 28 Table 10: Fuel Cell Technology in the 1–5 MW Size Range ............................................................... 28 Table 11: Range of Absorption Chiller Costs by CHP Size ................................................................ 29 Table 12: CHP Avoided Electric Costs by Size and Utility ................................................................ 38 Table 13: High Load Factor, Average CHP Effective Avoided Rate, 2009 $/kWh .......................... 40 Table 14: Low Load Factor, Average CHP Effective Avoided Rate, 2009 $/kWh ........................... 41 Table 15: Air Conditioning, Average CHP Effective Avoided Rate, 2009 $/kWh .......................... 41 Table 16: Traditional CHP Target Applications .................................................................................. 47 Table 17: Combined Cooling Heating and Power Target Applications ........................................... 48 Table 18: Breakdown of California Facilities Included in Market Assessment ............................... 50 Table 19: Industrial Power‐to‐Heat Ratios From Various Data Sources .......................................... 52 Table 20: CEUS Commercial Application Energy Data ...................................................................... 53 Table 21: Commercial Power‐to‐Heat Ratio Estimates ....................................................................... 54 Table 22: Industrial Thermal Factors ..................................................................................................... 55 Table 23: Commercial Thermal Factors ................................................................................................. 56 Table 24: CHP System Power‐to‐Heat Ratio by Size Range ............................................................... 56 Table 25: On‐Site CHP Technical Potential at Existing Industrial Facilities in 2009 ...................... 57 Table 26: On‐Site CHP Technical Potential at Existing Commercial Facilities in 2009 .................. 58 Table 27: Export CHP Technical Potential at Existing Industrial Facilities in 2009 ........................ 59 Table 28: Total CHP Technical Potential at Existing Facilities – Commercial and Industrial – in
2009 by CHP Market Sector ........................................................................................................... 59 Table 29: Total CHP Technical Potential at Existing Facilities – Commercial and Industrial – in
2009 by Utility Territory ................................................................................................................. 60 Table 30: Industrial Application Growth Projections ......................................................................... 60
ix
Table 31: Commercial Application Growth Projections ..................................................................... 61 Table 32: Total CHP Technical Potential Growth Between 2009 and 2029 by CHP Market Sector
............................................................................................................................................................ 61 Table 33: CHP Technical Potential Growth Between 2009 and 2029 by Utility Territory ............. 62 Table 34: Total Industrial CHP Technical Potential in 2029 ............................................................... 62 Table 35: Total Commercial CHP Technical Potential in 2029........................................................... 63 Table 36: Total Export CHP Technical Potential in 2029 .................................................................... 64 Table 37: Total CHP Technical Potential in 2029 by Utility Territory .............................................. 64 Table 38: ICF CHP Market Model .......................................................................................................... 66 Table 39: Electric Load, Thermal Utilization, and Technology Assumptions by Size Bin ............. 67 Table 40: Existing Facility and New Technical Market Potential by System Size and Market
Segment ............................................................................................................................................ 69 Table 41: Capital Cost Multipliers ......................................................................................................... 70 Table 42: 2029 Cumulative Market Penetration by Market Type ...................................................... 81 Table 43: Scenario Comparison of Capacity, Outputs, Efficiency, and Load Factor for 2029 ....... 83 Table 44: All‐In Case Output Summary by Submarket Type for 2029 ............................................. 84 Table 45: Comparison of Study Results GHG Savings to ARB Target Goal .................................... 86 Table 46: Large vs. Small CHP Existing Market and Market Outlook (Generation Only,
Avoided AC Not Included) ........................................................................................................... 88
x
Abstract
This report analyzes the potential market penetration of combined heat and power systems in California from 2009 to 2029. This analysis evaluates the potential contribution of new combined heat and power to the reduction in emissions of greenhouse gases as required by the California Global Warming Solutions Act (Assembly Bill 32, Núñez, Chapter 488, Statutes of 2006) in 2006. The analysis characterizes the markets, applications, technologies, and economic competition for combined heat and power over the forecast period. A base case of future combined heat and power market penetration is developed that assumes a continuation of current trends and energy policies. The analysis then defines the market impacts of restoring the Self‐Generation Incentive Program, providing payments to combined heat and power operators for carbon dioxide savings and providing a mechanism for the export of combined heat and power from systems larger than 20 megawatts that are not covered by current legislation to promote combined heat and power export.
Keywords: Public Interest Energy Research Program, PIER, combined heat and power, CHP, industrial market, commercial market, steam, gas turbine, reciprocating engine, fuel cell, microturbine, heat recovery, thermally activated cooling, greenhouse gases
xi

xii
Executive Summary
This report quantifies the long‐term market penetration potential for combined heat and power and the degree to which combined heat and power can reduce potential greenhouse gas1 emissions in support of the California Global Warming Solutions Act of 2006 (Assembly Bill 32, Núñez, Chapter 488, Statutes of 2006). The report also examines how implementing or restoring combined heat and power incentives would affect future combined heat and power market penetration. The analysis covered five task areas:
• Characteristics of existing combined heat and power in California
• Estimate of technical potential for combined heat and power in California
• Base case market analysis
• Market potential analysis under alternative scenarios
• Recommendations
This study represents an update of a similar analysis conducted, in part, by the same study team in 2004‐2005.2
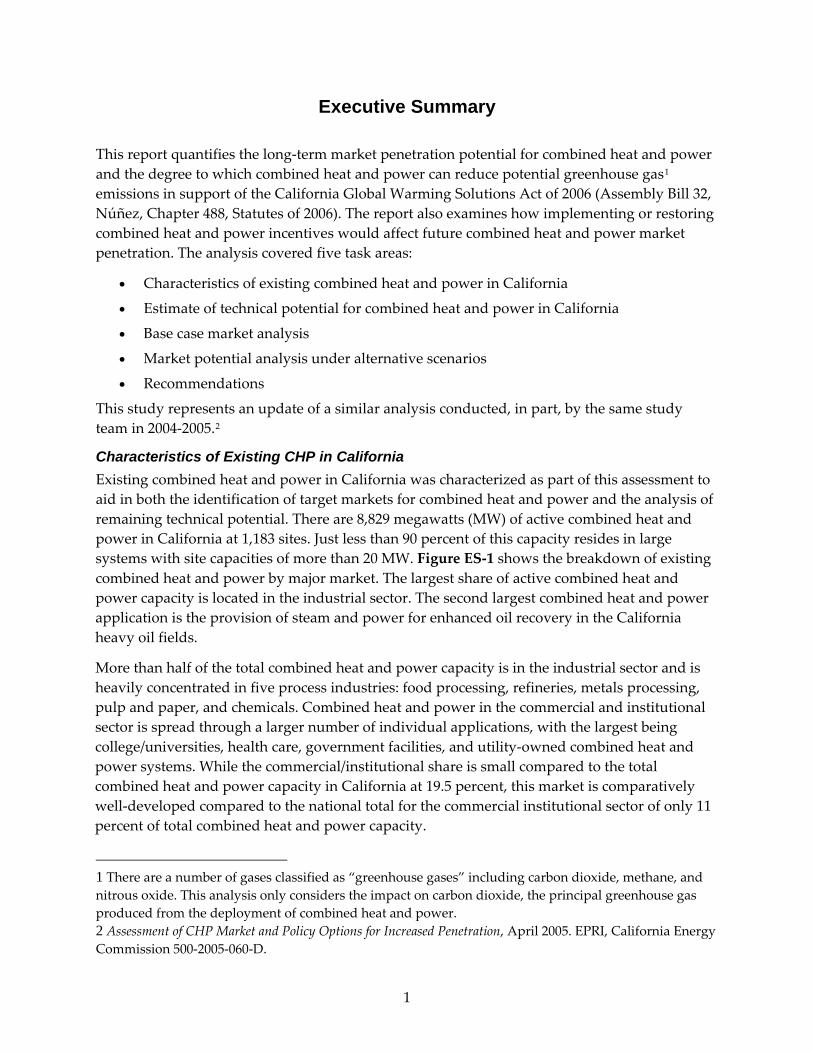
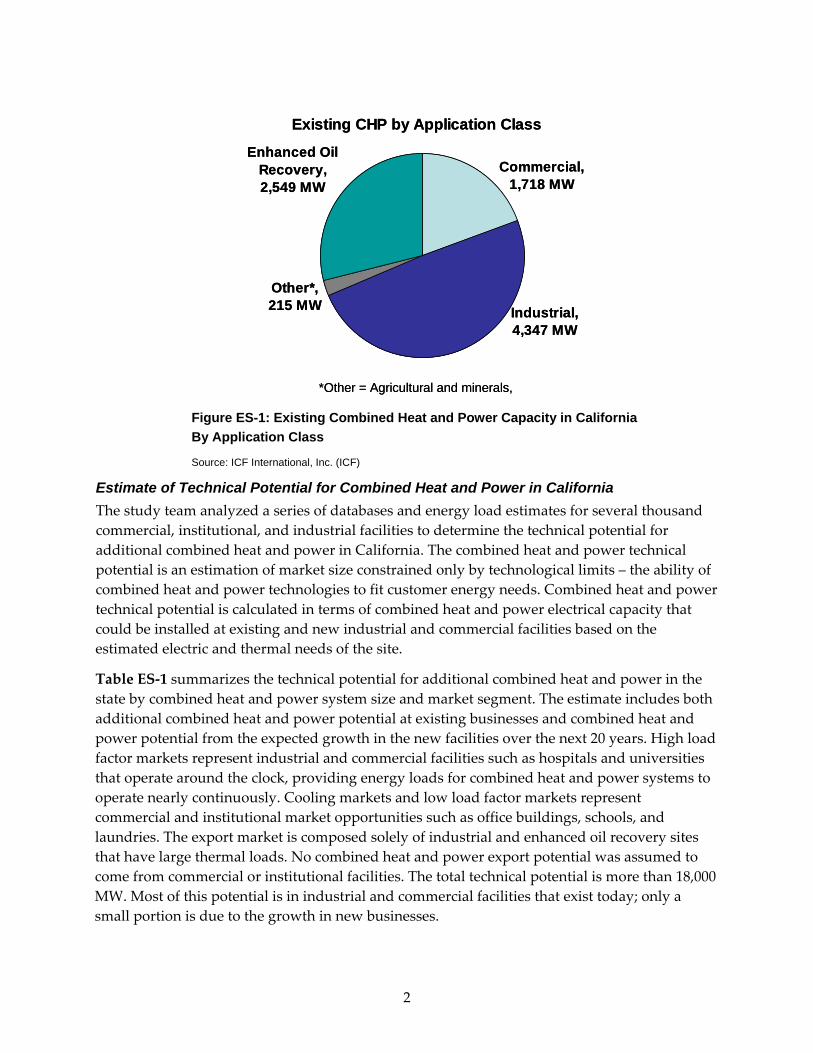
Characteristics of Existing CHP in California Existing combined heat and power in California was characterized as part of this assessment to aid in both the identification of target markets for combined heat and power and the analysis of remaining technical potential. There are 8,829 megawatts (MW) of active combined heat and power in California at 1,183 sites. Just less than 90 percent of this capacity resides in large systems with site capacities of more than 20 MW. Figure ES‐1 shows the breakdown of existing combined heat and power by major market. The largest share of active combined heat and power capacity is located in the industrial sector. The second largest combined heat and power application is the provision of steam and power for enhanced oil recovery in the California heavy oil fields.
More than half of the total combined heat and power capacity is in the industrial sector and is heavily concentrated in five process industries: food processing, refineries, metals processing, pulp and paper, and chemicals. Combined heat and power in the commercial and institutional sector is spread through a larger number of individual applications, with the largest being college/universities, health care, government facilities, and utility‐owned combined heat and power systems. While the commercial/institutional share is small compared to the total combined heat and power capacity in California at 19.5 percent, this market is comparatively well‐developed compared to the national total for the commercial institutional sector of only 11 percent of total combined heat and power capacity.
1 There are a number of gases classified as “greenhouse gases” including carbon dioxide, methane, and nitrous oxide. This analysis only considers the impact on carbon dioxide, the principal greenhouse gas produced from the deployment of combined heat and power. 2 Assessment of CHP Market and Policy Options for Increased Penetration, April 2005. EPRI, California Energy Commission 500‐2005‐060‐D.
1
Existing CHP by Application Class
Enhanced Oil Recovery, 2,549 MW
Industrial, 4,347 MW
Other*, 215 MW
Commercial, 1,718 MW
*Other = Agricultural and minerals,
Existing CHP by Application Class
Enhanced Oil Recovery, 2,549 MW
Industrial, 4,347 MW
Other*, 215 MW
Commercial, 1,718 MW
*Other = Agricultural and minerals, Figure ES-1: Existing Combined Heat and Power Capacity in California By Application Class
Source: ICF International, Inc. (ICF)
Estimate of Technical Potential for Combined Heat and Power in California The study team analyzed a series of databases and energy load estimates for several thousand commercial, institutional, and industrial facilities to determine the technical potential for additional combined heat and power in California. The combined heat and power technical potential is an estimation of market size constrained only by technological limits – the ability of combined heat and power technologies to fit customer energy needs. Combined heat and power technical potential is calculated in terms of combined heat and power electrical capacity that could be installed at existing and new industrial and commercial facilities based on the estimated electric and thermal needs of the site.
Table ES‐1 summarizes the technical potential for additional combined heat and power in the state by combined heat and power system size and market segment. The estimate includes both additional combined heat and power potential at existing businesses and combined heat and power potential from the expected growth in the new facilities over the next 20 years. High load factor markets represent industrial and commercial facilities such as hospitals and universities that operate around the clock, providing energy loads for combined heat and power systems to operate nearly continuously. Cooling markets and low load factor markets represent commercial and institutional market opportunities such as office buildings, schools, and laundries. The export market is composed solely of industrial and enhanced oil recovery sites that have large thermal loads. No combined heat and power export potential was assumed to come from commercial or institutional facilities. The total technical potential is more than 18,000 MW. Most of this potential is in industrial and commercial facilities that exist today; only a small portion is due to the growth in new businesses.
2
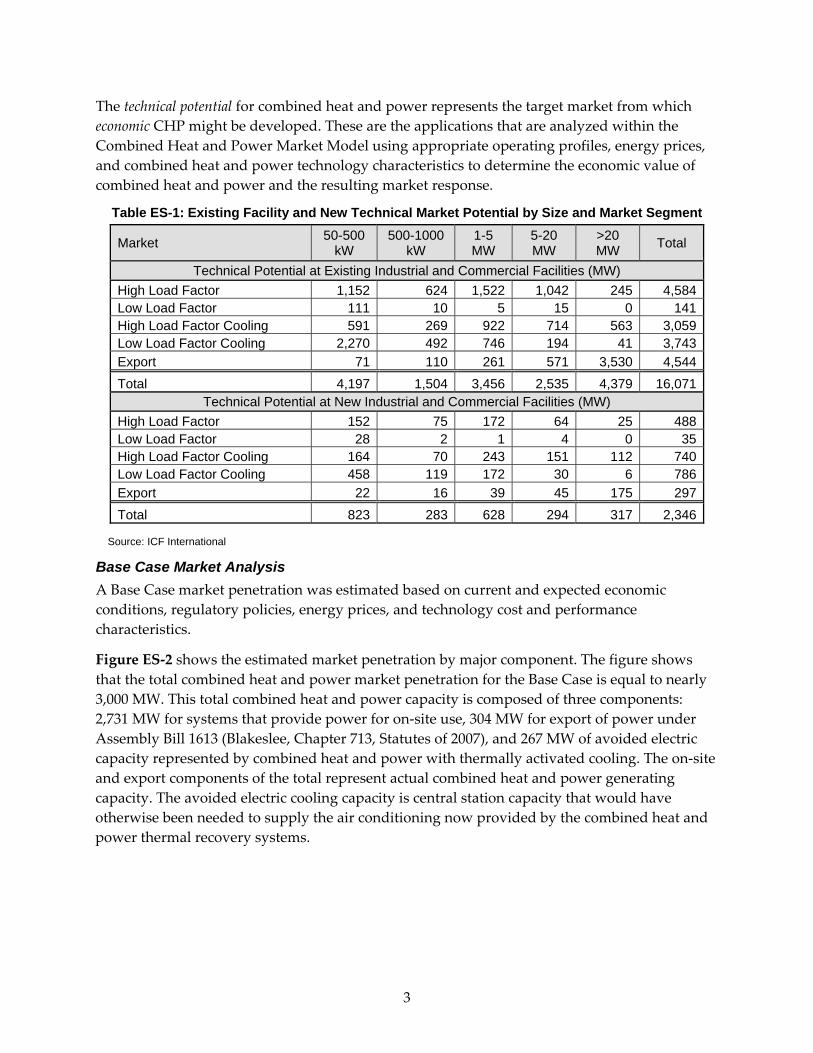
The technical potential for combined heat and power represents the target market from which economic CHP might be developed. These are the applications that are analyzed within the Combined Heat and Power Market Model using appropriate operating profiles, energy prices, and combined heat and power technology characteristics to determine the economic value of combined heat and power and the resulting market response.
Table ES-1: Existing Facility and New Technical Market Potential by Size and Market Segment
Market 50-500 kW
500-1000 kW
1-5 MW
5-20 MW
>20 MW Total
Technical Potential at Existing Industrial and Commercial Facilities (MW) High Load Factor 1,152 624 1,522 1,042 245 4,584Low Load Factor 111 10 5 15 0 141High Load Factor Cooling 591 269 922 714 563 3,059Low Load Factor Cooling 2,270 492 746 194 41 3,743Export 71 110 261 571 3,530 4,544Total 4,197 1,504 3,456 2,535 4,379 16,071
Technical Potential at New Industrial and Commercial Facilities (MW) High Load Factor 152 75 172 64 25 488Low Load Factor 28 2 1 4 0 35High Load Factor Cooling 164 70 243 151 112 740Low Load Factor Cooling 458 119 172 30 6 786Export 22 16 39 45 175 297Total 823 283 628 294 317 2,346
Source: ICF International
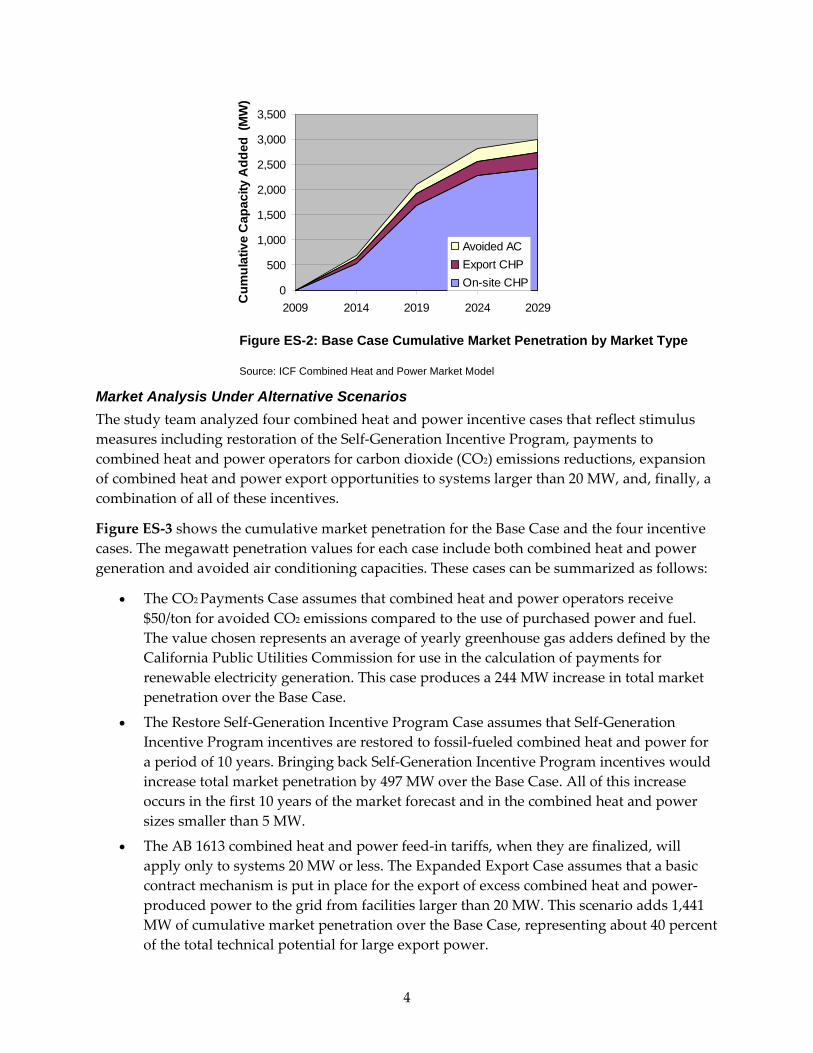
Base Case Market Analysis A Base Case market penetration was estimated based on current and expected economic conditions, regulatory policies, energy prices, and technology cost and performance characteristics.
Figure ES‐2 shows the estimated market penetration by major component. The figure shows that the total combined heat and power market penetration for the Base Case is equal to nearly 3,000 MW. This total combined heat and power capacity is composed of three components: 2,731 MW for systems that provide power for on‐site use, 304 MW for export of power under Assembly Bill 1613 (Blakeslee, Chapter 713, Statutes of 2007), and 267 MW of avoided electric capacity represented by combined heat and power with thermally activated cooling. The on‐site and export components of the total represent actual combined heat and power generating capacity. The avoided electric cooling capacity is central station capacity that would have otherwise been needed to supply the air conditioning now provided by the combined heat and power thermal recovery systems.
3
0
500
1,000
1,500
2,000
2,500
3,000
3,500
2009 2014 2019 2024 2029
Cum
ulat
ive
Cap
acity
Add
ed (
MW
)Avoided ACExport CHPOn-site CHP
Figure ES-2: Base Case Cumulative Market Penetration by Market Type
Source: ICF Combined Heat and Power Market Model
Market Analysis Under Alternative Scenarios The study team analyzed four combined heat and power incentive cases that reflect stimulus measures including restoration of the Self‐Generation Incentive Program, payments to combined heat and power operators for carbon dioxide (CO2) emissions reductions, expansion of combined heat and power export opportunities to systems larger than 20 MW, and, finally, a combination of all of these incentives.
Figure ES‐3 shows the cumulative market penetration for the Base Case and the four incentive cases. The megawatt penetration values for each case include both combined heat and power generation and avoided air conditioning capacities. These cases can be summarized as follows:
• The CO2 Payments Case assumes that combined heat and power operators receive $50/ton for avoided CO2 emissions compared to the use of purchased power and fuel. The value chosen represents an average of yearly greenhouse gas adders defined by the California Public Utilities Commission for use in the calculation of payments for renewable electricity generation. This case produces a 244 MW increase in total market penetration over the Base Case.
• The Restore Self‐Generation Incentive Program Case assumes that Self‐Generation Incentive Program incentives are restored to fossil‐fueled combined heat and power for a period of 10 years. Bringing back Self‐Generation Incentive Program incentives would increase total market penetration by 497 MW over the Base Case. All of this increase occurs in the first 10 years of the market forecast and in the combined heat and power sizes smaller than 5 MW.
• The AB 1613 combined heat and power feed‐in tariffs, when they are finalized, will apply only to systems 20 MW or less. The Expanded Export Case assumes that a basic contract mechanism is put in place for the export of excess combined heat and power‐produced power to the grid from facilities larger than 20 MW. This scenario adds 1,441 MW of cumulative market penetration over the Base Case, representing about 40 percent of the total technical potential for large export power.
4
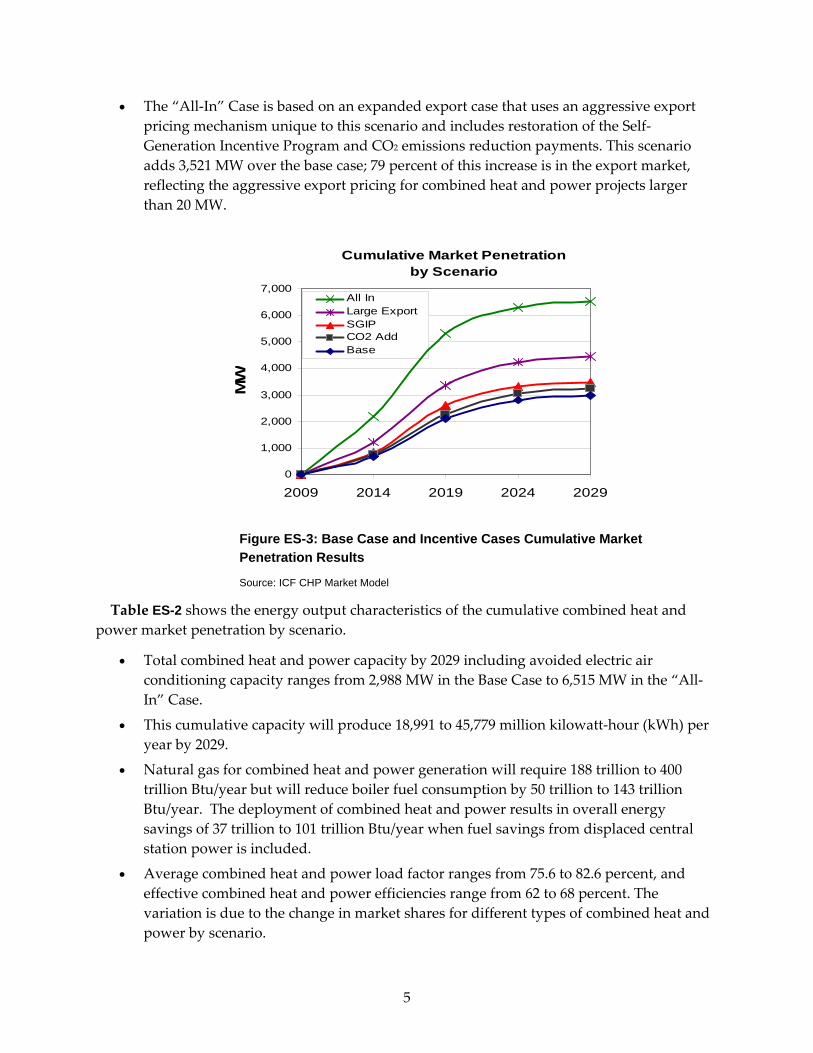
• The “All‐In” Case is based on an expanded export case that uses an aggressive export pricing mechanism unique to this scenario and includes restoration of the Self‐Generation Incentive Program and CO2 emissions reduction payments. This scenario adds 3,521 MW over the base case; 79 percent of this increase is in the export market, reflecting the aggressive export pricing for combined heat and power projects larger than 20 MW.
Cumulative Market Penetration by Scenario
0
1,000
2,000
3,000
4,000
5,000
6,000
7,000
2009 2014 2019 2024 2029
MW
All InLarge ExportSGIPCO2 AddBase
Figure ES-3: Base Case and Incentive Cases Cumulative Market Penetration Results
Source: ICF CHP Market Model
Table ES-2 shows the energy output characteristics of the cumulative combined heat and power market penetration by scenario.
• Total combined heat and power capacity by 2029 including avoided electric air conditioning capacity ranges from 2,988 MW in the Base Case to 6,515 MW in the “All‐In” Case.
• This cumulative capacity will produce 18,991 to 45,779 million kilowatt‐hour (kWh) per year by 2029.
• Natural gas for combined heat and power generation will require 188 trillion to 400 trillion Btu/year but will reduce boiler fuel consumption by 50 trillion to 143 trillion Btu/year. The deployment of combined heat and power results in overall energy savings of 37 trillion to 101 trillion Btu/year when fuel savings from displaced central station power is included.
• Average combined heat and power load factor ranges from 75.6 to 82.6 percent, and effective combined heat and power efficiencies range from 62 to 68 percent. The variation is due to the change in market shares for different types of combined heat and power by scenario.
5
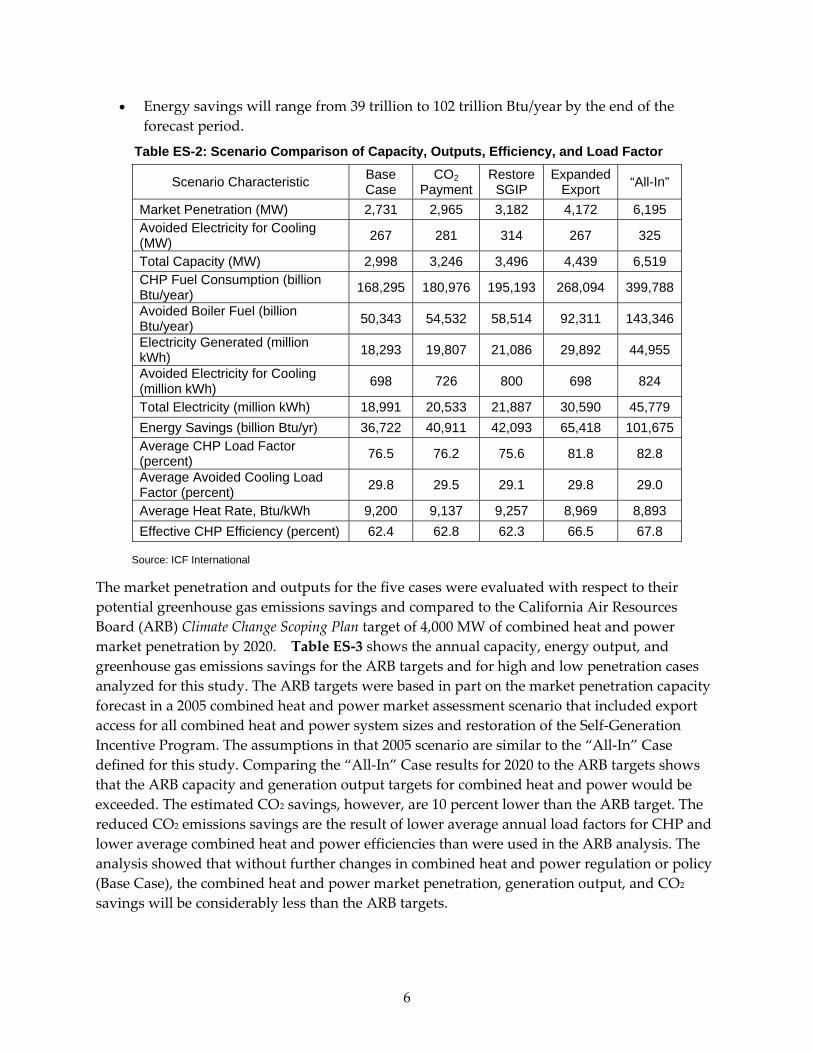
• Energy savings will range from 39 trillion to 102 trillion Btu/year by the end of the forecast period.
Table ES-2: Scenario Comparison of Capacity, Outputs, Efficiency, and Load Factor
Scenario Characteristic Base Case
CO2 Payment
Restore SGIP
Expanded Export “All-In”
Market Penetration (MW) 2,731 2,965 3,182 4,172 6,195 Avoided Electricity for Cooling (MW) 267 281 314 267 325
Total Capacity (MW) 2,998 3,246 3,496 4,439 6,519 CHP Fuel Consumption (billion Btu/year) 168,295 180,976 195,193 268,094 399,788
Avoided Boiler Fuel (billion Btu/year) 50,343 54,532 58,514 92,311 143,346
Electricity Generated (million kWh) 18,293 19,807 21,086 29,892 44,955
Avoided Electricity for Cooling (million kWh) 698 726 800 698 824
Total Electricity (million kWh) 18,991 20,533 21,887 30,590 45,779 Energy Savings (billion Btu/yr) 36,722 40,911 42,093 65,418 101,675 Average CHP Load Factor (percent) 76.5 76.2 75.6 81.8 82.8
Average Avoided Cooling Load Factor (percent) 29.8 29.5 29.1 29.8 29.0
Average Heat Rate, Btu/kWh 9,200 9,137 9,257 8,969 8,893 Effective CHP Efficiency (percent) 62.4 62.8 62.3 66.5 67.8
Source: ICF International
The market penetration and outputs for the five cases were evaluated with respect to their potential greenhouse gas emissions savings and compared to the California Air Resources Board (ARB) Climate Change Scoping Plan target of 4,000 MW of combined heat and power market penetration by 2020. Table ES‐3 shows the annual capacity, energy output, and greenhouse gas emissions savings for the ARB targets and for high and low penetration cases analyzed for this study. The ARB targets were based in part on the market penetration capacity forecast in a 2005 combined heat and power market assessment scenario that included export access for all combined heat and power system sizes and restoration of the Self‐Generation Incentive Program. The assumptions in that 2005 scenario are similar to the “All‐In” Case defined for this study. Comparing the “All‐In” Case results for 2020 to the ARB targets shows that the ARB capacity and generation output targets for combined heat and power would be exceeded. The estimated CO2 savings, however, are 10 percent lower than the ARB target. The reduced CO2 emissions savings are the result of lower average annual load factors for CHP and lower average combined heat and power efficiencies than were used in the ARB analysis. The analysis showed that without further changes in combined heat and power regulation or policy (Base Case), the combined heat and power market penetration, generation output, and CO2
savings will be considerably less than the ARB targets.
6
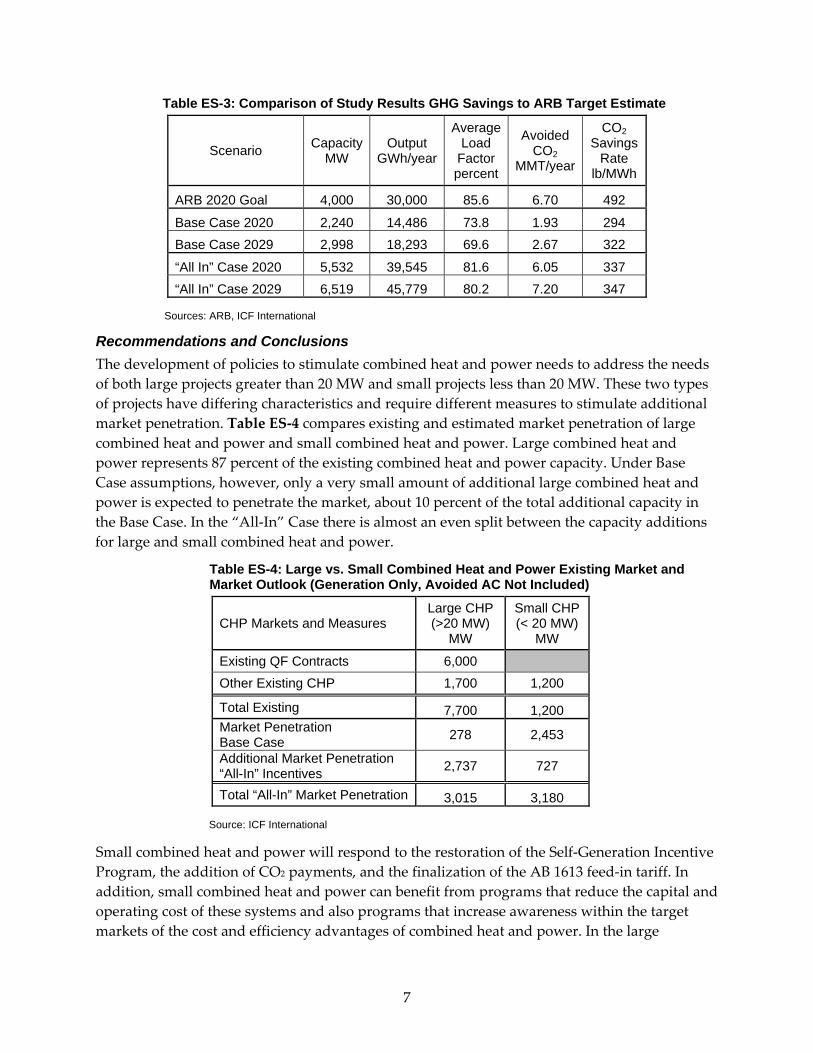
Table ES-3: Comparison of Study Results GHG Savings to ARB Target Estimate
Scenario Capacity MW
Output GWh/year
Average Load
Factor percent
Avoided CO2
MMT/year
CO2 Savings
Rate lb/MWh
ARB 2020 Goal 4,000 30,000 85.6 6.70 492
Base Case 2020 2,240 14,486 73.8 1.93 294 Base Case 2029 2,998 18,293 69.6 2.67 322
“All In” Case 2020 5,532 39,545 81.6 6.05 337 “All In” Case 2029 6,519 45,779 80.2 7.20 347
Sources: ARB, ICF International
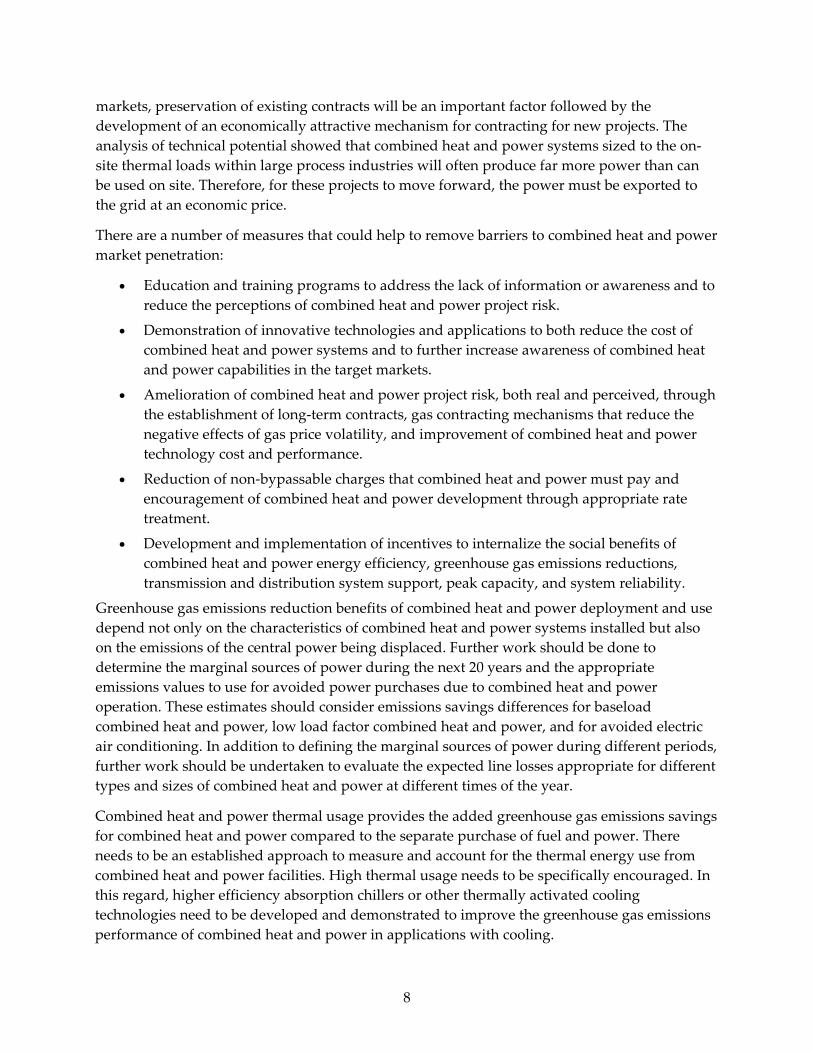
Recommendations and Conclusions The development of policies to stimulate combined heat and power needs to address the needs of both large projects greater than 20 MW and small projects less than 20 MW. These two types of projects have differing characteristics and require different measures to stimulate additional market penetration. Table ES‐4 compares existing and estimated market penetration of large combined heat and power and small combined heat and power. Large combined heat and power represents 87 percent of the existing combined heat and power capacity. Under Base Case assumptions, however, only a very small amount of additional large combined heat and power is expected to penetrate the market, about 10 percent of the total additional capacity in the Base Case. In the “All‐In” Case there is almost an even split between the capacity additions for large and small combined heat and power.
Table ES-4: Large vs. Small Combined Heat and Power Existing Market and Market Outlook (Generation Only, Avoided AC Not Included)
CHP Markets and Measures Large CHP (>20 MW)
MW
Small CHP (< 20 MW)
MW
Existing QF Contracts 6,000 Other Existing CHP 1,700 1,200
Total Existing 7,700 1,200 Market Penetration Base Case 278 2,453
Additional Market Penetration “All-In” Incentives 2,737 727
Total “All-In” Market Penetration 3,015 3,180
Source: ICF International
Small combined heat and power will respond to the restoration of the Self‐Generation Incentive Program, the addition of CO2 payments, and the finalization of the AB 1613 feed‐in tariff. In addition, small combined heat and power can benefit from programs that reduce the capital and operating cost of these systems and also programs that increase awareness within the target markets of the cost and efficiency advantages of combined heat and power. In the large
7
markets, preservation of existing contracts will be an important factor followed by the development of an economically attractive mechanism for contracting for new projects. The analysis of technical potential showed that combined heat and power systems sized to the on‐site thermal loads within large process industries will often produce far more power than can be used on site. Therefore, for these projects to move forward, the power must be exported to the grid at an economic price.
There are a number of measures that could help to remove barriers to combined heat and power market penetration:
• Education and training programs to address the lack of information or awareness and to reduce the perceptions of combined heat and power project risk.
• Demonstration of innovative technologies and applications to both reduce the cost of combined heat and power systems and to further increase awareness of combined heat and power capabilities in the target markets.
• Amelioration of combined heat and power project risk, both real and perceived, through the establishment of long‐term contracts, gas contracting mechanisms that reduce the negative effects of gas price volatility, and improvement of combined heat and power technology cost and performance.
• Reduction of non‐bypassable charges that combined heat and power must pay and encouragement of combined heat and power development through appropriate rate treatment.
• Development and implementation of incentives to internalize the social benefits of combined heat and power energy efficiency, greenhouse gas emissions reductions, transmission and distribution system support, peak capacity, and system reliability.
Greenhouse gas emissions reduction benefits of combined heat and power deployment and use depend not only on the characteristics of combined heat and power systems installed but also on the emissions of the central power being displaced. Further work should be done to determine the marginal sources of power during the next 20 years and the appropriate emissions values to use for avoided power purchases due to combined heat and power operation. These estimates should consider emissions savings differences for baseload combined heat and power, low load factor combined heat and power, and for avoided electric air conditioning. In addition to defining the marginal sources of power during different periods, further work should be undertaken to evaluate the expected line losses appropriate for different types and sizes of combined heat and power at different times of the year.
Combined heat and power thermal usage provides the added greenhouse gas emissions savings for combined heat and power compared to the separate purchase of fuel and power. There needs to be an established approach to measure and account for the thermal energy use from combined heat and power facilities. High thermal usage needs to be specifically encouraged. In this regard, higher efficiency absorption chillers or other thermally activated cooling technologies need to be developed and demonstrated to improve the greenhouse gas emissions performance of combined heat and power in applications with cooling.
8
1.0 Introduction In early 2005 in support of the Integrated Energy Policy Report (IEPR) development process, the Energy Commission sponsored a comprehensive report on the market outlook for combined heat and power (CHP).3 The passage of the California Global Warming Solutions Act4 (Assembly Bill 32, Núñez, Chapter 488, Statutes of 2006) (AB 32) in 2006 has created renewed interest in energy‐efficient technologies such as CHP and a need for a more up‐to‐date evaluation of CHP market opportunities and drivers in the current energy and economic climate.
The focus of this report is to quantify the long‐term market penetration for CHP, using a revised and expanded version of the CHP market model developed for the 2005 study, and to show how CHP market penetration could be affected by implementing or restoring CHP incentives and by possible changes in exogenous market conditions.
This report is part of a larger project whose objective is to provide information in support of California Energy Commission energy policy planning. Specific project objectives include:
• Develop and update the inventory of combined heat and power (CHP) and combined cooling, heating, and power (CCHP) capacity in the state.
• Evaluate the effects of changes in California business activities, policies, and natural gas and retail electric rates since 2005 on CHP market potential.
• Develop new estimates of the technical and economic market potential for CHP and CCHP and provide an updated analysis of various incentive options to promote the development of the CHP and CCHP market opportunity.
The report analysis consists of five tasks:
• Characterize existing CHP in California.
• Develop an estimate of technical potential for CHP in California.
• Conduct a Base Case market analysis.
• Conduct market potential analyses under alternative scenarios.
• Make suggestions for clarifying analyses and additional scenarios.
This report provides the final results of these tasks.
3 Assessment of CHP Market and Policy Options for Increased Penetration, EPRI, CEC‐500‐2005‐060‐D, April 2005. 4 AB 32 requires the California Air Resources Board (ARB) to develop regulations and market mechanisms that will ultimately reduce Californiaʹs greenhouse gas (GHG) emissions by 25 percent by 2020. Mandatory caps will begin in 2012 for significant sources and ratchet down to meet the 2020 goals. There are a number of gases classified as “greenhouse gases” including CO2, methane and Nitrogen Oxide (N2O). This analysis only considers the impact on CO2 emissions, the principal GHG that is reduced from the deployment of CHP. The terms GHG and CO2 emissions will be used interchangeably in this report.
9

10
2.0 Project Approach The CHP market assessment presented in this report is based on the ICF International, Inc. (ICF) CHP Market Model that estimates cumulative CHP market penetration as a function of competing CHP system specifications, current and future energy prices, and electric and thermal load characteristics for target markets. The CHP analysis includes the following four steps:
• Estimate of CHP Technical Market Potential – An estimate of the technically suitable CHP applications by size and by industry. This estimate is derived from the screening of customer data based on application and size characteristics that are used to estimate groups of facilities with appropriate electric and thermal load characteristics conducive to CHP.
• Estimate CHP Technology Cost and Performance – For each market size range, a set of applicable CHP technologies is selected for evaluation. These technologies are characterized in terms of their capital cost, heat rate, non‐fuel operating and maintenance costs, and available thermal energy for process use on‐site.
• Estimate of Energy Price Projections – Present and future fuel and electricity prices are estimated to provide inputs into the CHP net cost calculation.
• Estimate Market Penetration – Within each market size, the competition among applicable CHP technologies is evaluated. Based on this competition, the economic market potential is estimated and shared among competing CHP technologies. The rate of market penetration by technology is then estimated using a market diffusion model.
The project team analyzed and compiled a variety of information and data that was used in the ICF CHP Market Model to determine the future market penetration of CHP under a variety of input assumptions. The analysis is described in the following sections:
• Analysis of existing CHP in California.
• Evaluation of CHP cost and performance by technology and application size.
• Determination of current and future gas and electric prices.
• Evaluation of CHP technical potential from data on customer characteristics.
• Economic analysis of CHP by size and market and estimation of market penetration using the ICF CHP Market Model.
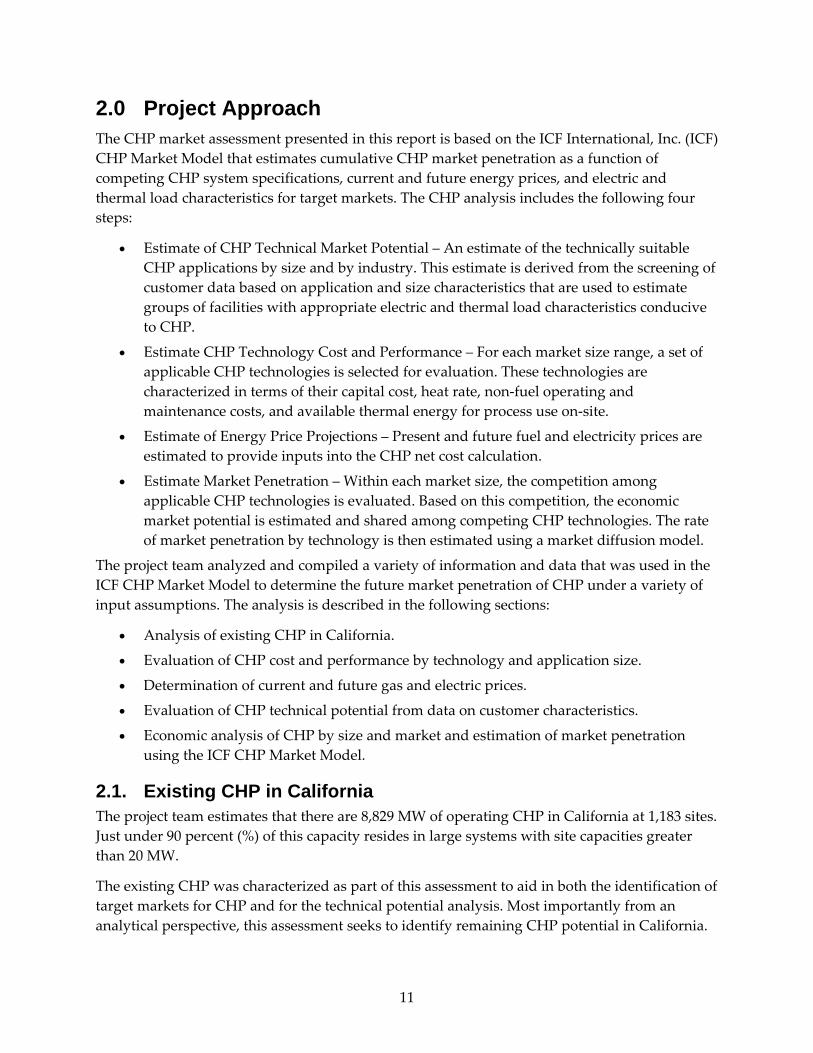
2.1. Existing CHP in California The project team estimates that there are 8,829 MW of operating CHP in California at 1,183 sites. Just under 90 percent (%) of this capacity resides in large systems with site capacities greater than 20 MW.
The existing CHP was characterized as part of this assessment to aid in both the identification of target markets for CHP and for the technical potential analysis. Most importantly from an analytical perspective, this assessment seeks to identify remaining CHP potential in California.
11
Therefore, the existing stock of active CHP installations has been subtracted from the technical market potential used in this assessment.
As shown in Figure 1, the largest share of active CHP capacity is located in the industrial sector, with the largest single application being the provision of steam in oil fields for enhanced oil recovery (EOR). The figure below shows a breakdown of the existing CHP capacity in California by application class.
Existing CHP by Application Class
Enhanced Oil Recovery, 2,549 MW
Industrial, 4,347 MW
Other*, 215 MW
Commercial, 1,718 MW
*Other = Agricultural and minerals,
Existing CHP by Application Class
Enhanced Oil Recovery, 2,549 MW
Industrial, 4,347 MW
Other*, 215 MW
Commercial, 1,718 MW
*Other = Agricultural and minerals, Figure 1: Existing CHP Capacity in California by Application Class
Source: ICF CHP Installation Database
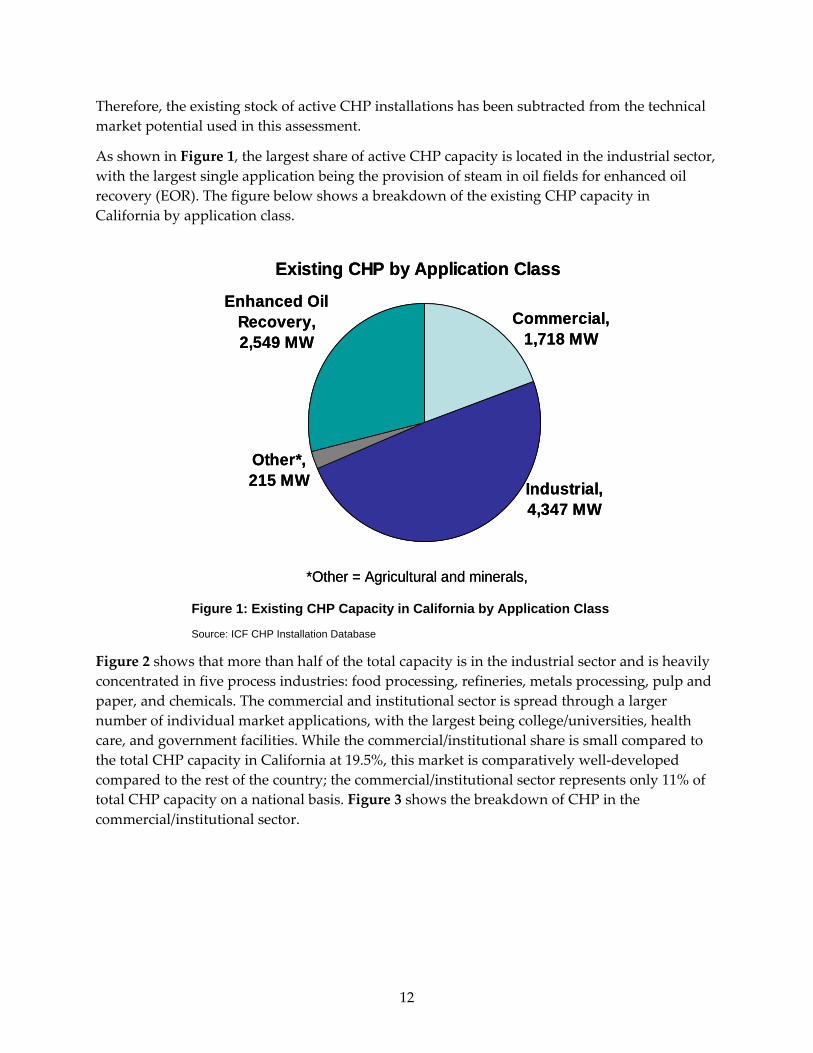
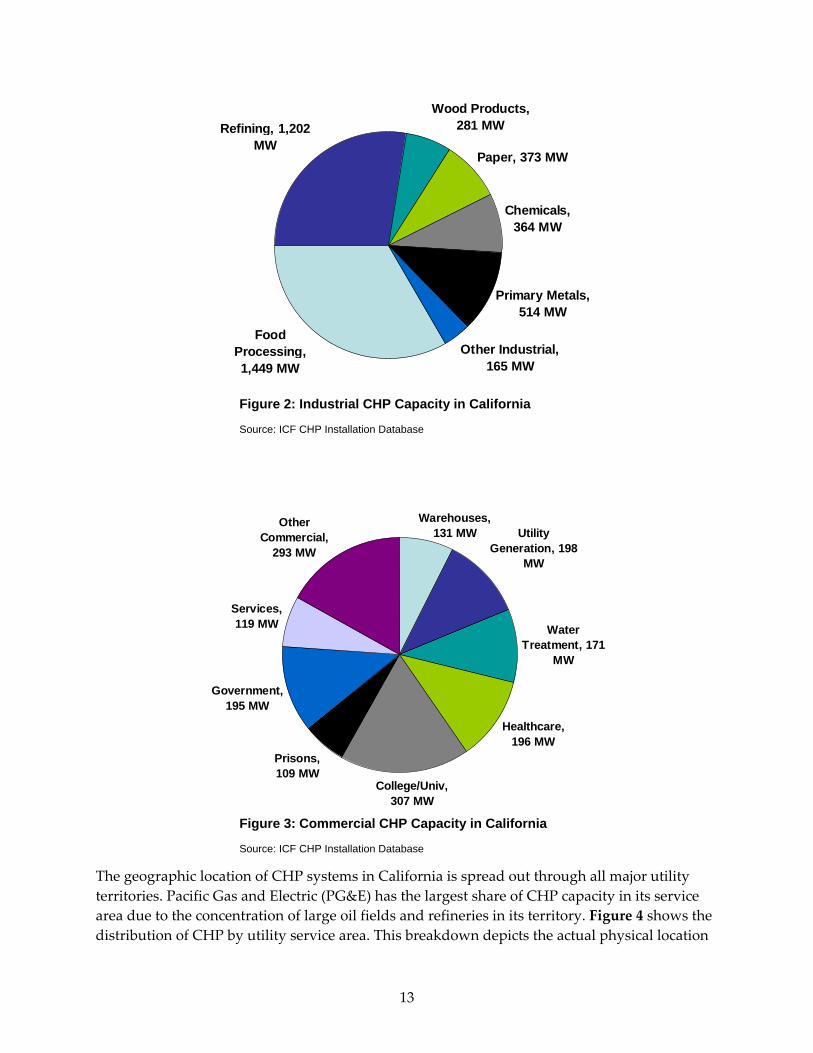
Figure 2 shows that more than half of the total capacity is in the industrial sector and is heavily concentrated in five process industries: food processing, refineries, metals processing, pulp and paper, and chemicals. The commercial and institutional sector is spread through a larger number of individual market applications, with the largest being college/universities, health care, and government facilities. While the commercial/institutional share is small compared to the total CHP capacity in California at 19.5%, this market is comparatively well‐developed compared to the rest of the country; the commercial/institutional sector represents only 11% of total CHP capacity on a national basis. Figure 3 shows the breakdown of CHP in the commercial/institutional sector.
12
Other Industrial, 165 MW
Primary Metals, 514 MW
Chemicals, 364 MW
Paper, 373 MW
Wood Products, 281 MW
Food Processing, 1,449 MW
Refining, 1,202 MW
Figure 2: Industrial CHP Capacity in California
Source: ICF CHP Installation Database
Warehouses, 131 MW Utility
Generation, 198 MW
Water Treatment, 171
MW
Healthcare, 196 MW
College/Univ, 307 MW
Prisons, 109 MW
Government, 195 MW
Services, 119 MW
Other Commercial,
293 MW
Figure 3: Commercial CHP Capacity in California
Source: ICF CHP Installation Database
The geographic location of CHP systems in California is spread out through all major utility territories. Pacific Gas and Electric (PG&E) has the largest share of CHP capacity in its service area due to the concentration of large oil fields and refineries in its territory. Figure 4 shows the distribution of CHP by utility service area. This breakdown depicts the actual physical location
13
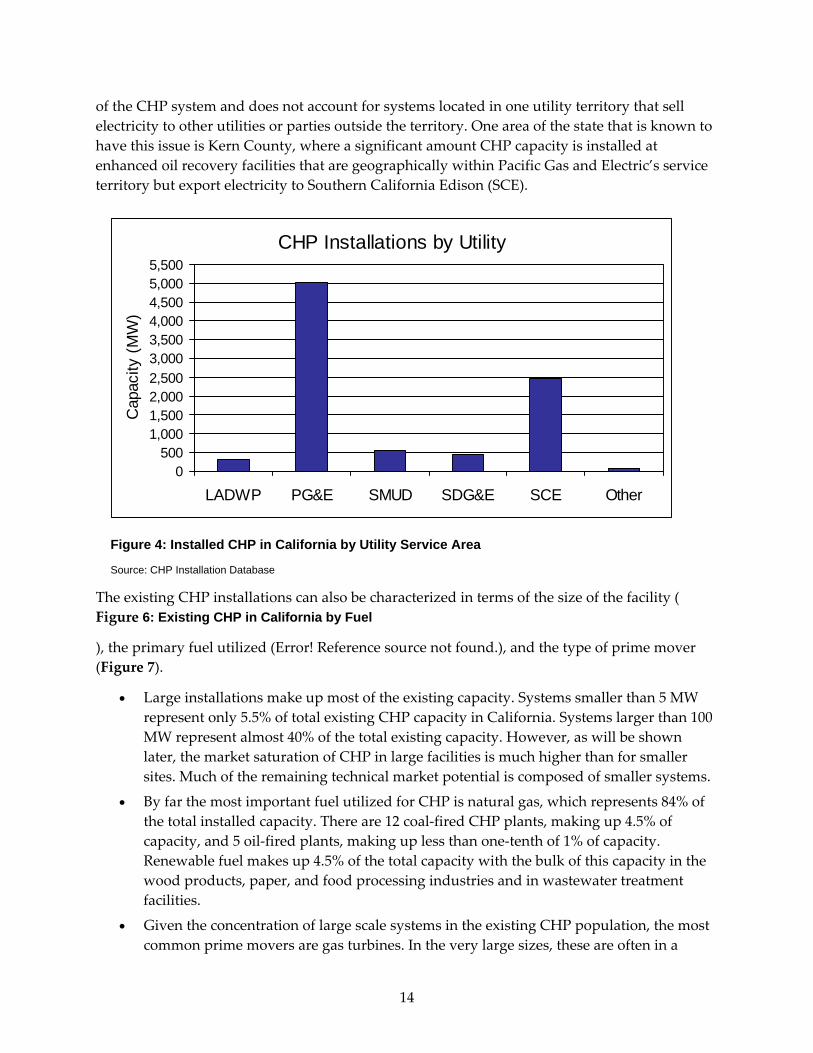
of the CHP system and does not account for systems located in one utility territory that sell electricity to other utilities or parties outside the territory. One area of the state that is known to have this issue is Kern County, where a significant amount CHP capacity is installed at enhanced oil recovery facilities that are geographically within Pacific Gas and Electric’s service territory but export electricity to Southern California Edison (SCE).
CHP Installations by Utility
0500
1,0001,5002,0002,5003,0003,5004,0004,5005,0005,500
LADWP PG&E SMUD SDG&E SCE Other
Cap
acity
(MW
)
Figure 4: Installed CHP in California by Utility Service Area
Source: CHP Installation Database
The existing CHP installations can also be characterized in terms of the size of the facility ( Figure 6: Existing CHP in California by Fuel
), the primary fuel utilized (Error! Reference source not found.), and the type of prime mover (Figure 7).
• Large installations make up most of the existing capacity. Systems smaller than 5 MW represent only 5.5% of total existing CHP capacity in California. Systems larger than 100 MW represent almost 40% of the total existing capacity. However, as will be shown later, the market saturation of CHP in large facilities is much higher than for smaller sites. Much of the remaining technical market potential is composed of smaller systems.
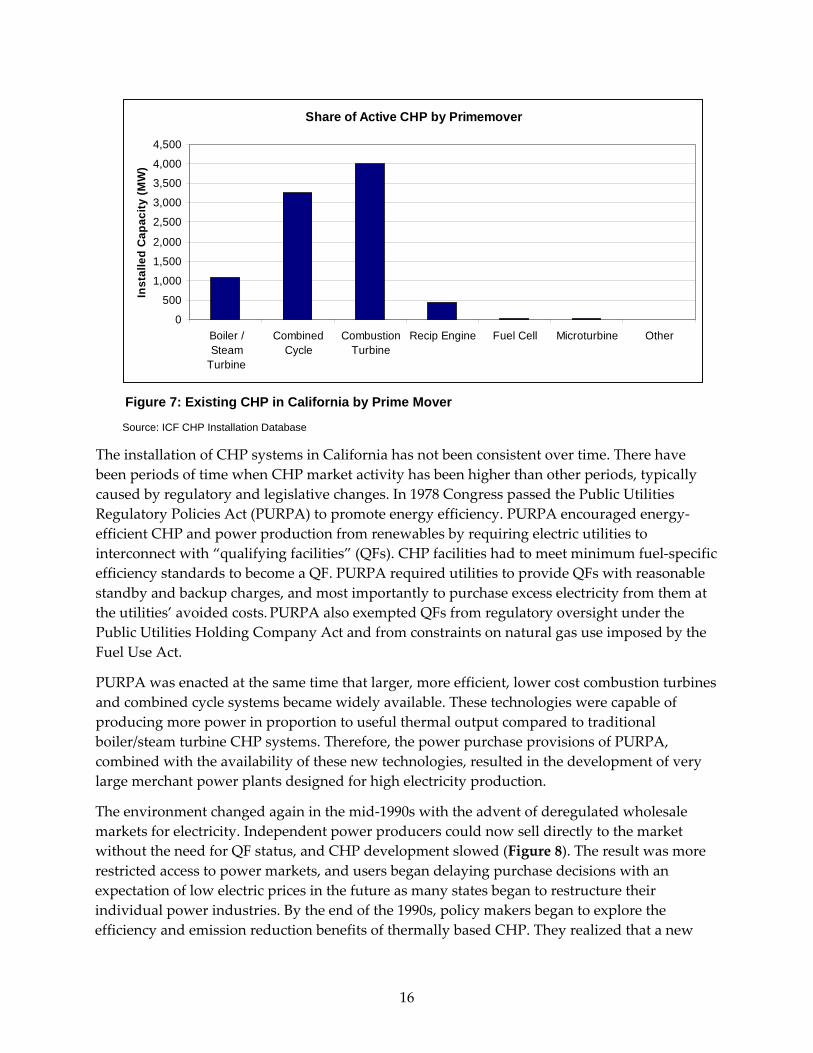
• By far the most important fuel utilized for CHP is natural gas, which represents 84% of the total installed capacity. There are 12 coal‐fired CHP plants, making up 4.5% of capacity, and 5 oil‐fired plants, making up less than one‐tenth of 1% of capacity. Renewable fuel makes up 4.5% of the total capacity with the bulk of this capacity in the wood products, paper, and food processing industries and in wastewater treatment facilities.
• Given the concentration of large scale systems in the existing CHP population, the most common prime movers are gas turbines. In the very large sizes, these are often in a
14
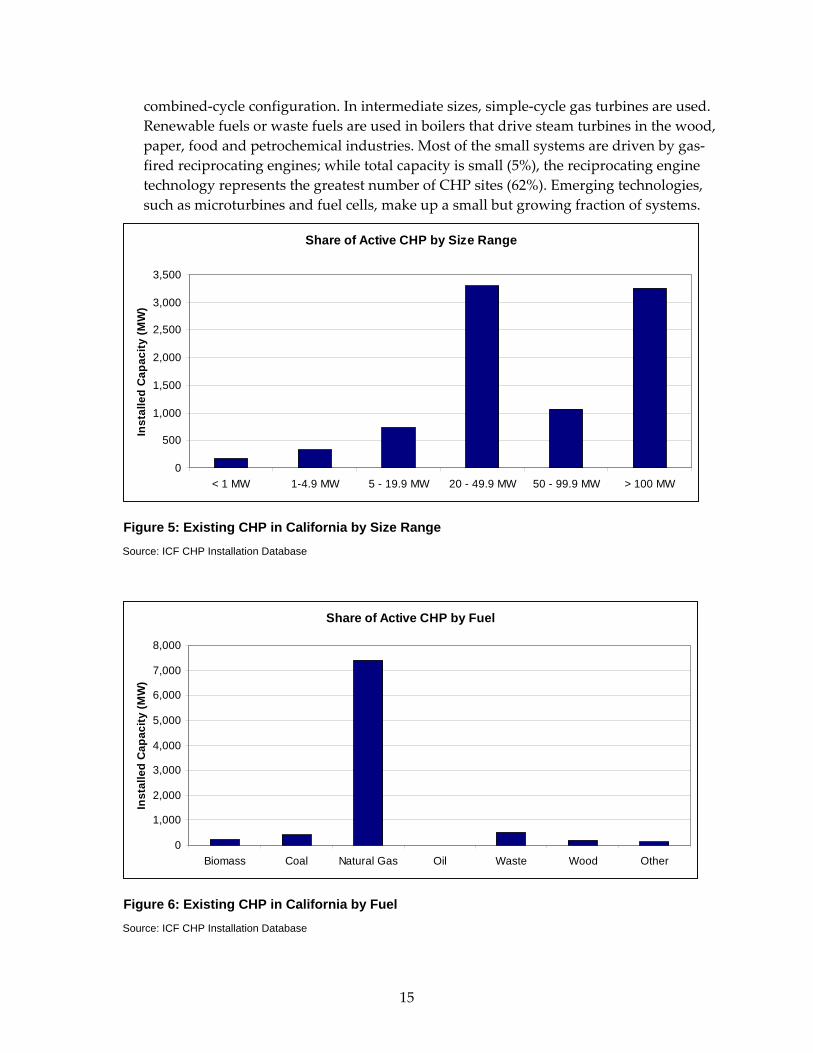
combined‐cycle configuration. In intermediate sizes, simple‐cycle gas turbines are used. Renewable fuels or waste fuels are used in boilers that drive steam turbines in the wood, paper, food and petrochemical industries. Most of the small systems are driven by gas‐fired reciprocating engines; while total capacity is small (5%), the reciprocating engine technology represents the greatest number of CHP sites (62%). Emerging technologies, such as microturbines and fuel cells, make up a small but growing fraction of systems.
Share of Active CHP by Size Range
0
500
1,000
1,500
2,000
2,500
3,000
3,500
< 1 MW 1-4.9 MW 5 - 19.9 MW 20 - 49.9 MW 50 - 99.9 MW > 100 MW
Inst
alle
d C
apac
ity (M
W)
Figure 5: Existing CHP in California by Size Range Source: ICF CHP Installation Database
Share of Active CHP by Fuel
0
1,000
2,000
3,000
4,000
5,000
6,000
7,000
8,000
Biomass Coal Natural Gas Oil Waste Wood Other
Inst
alle
d C
apac
ity (M
W)
Figure 6: Existing CHP in California by Fuel Source: ICF CHP Installation Database
15
Share of Active CHP by Primemover
0
500
1,000
1,500
2,000
2,500
3,000
3,500
4,000
4,500
Boiler /Steam
Turbine
CombinedCycle
CombustionTurbine
Recip Engine Fuel Cell Microturbine Other
Inst
alle
d C
apac
ity (M
W)
Figure 7: Existing CHP in California by Prime Mover
Source: ICF CHP Installation Database
The installation of CHP systems in California has not been consistent over time. There have been periods of time when CHP market activity has been higher than other periods, typically caused by regulatory and legislative changes. In 1978 Congress passed the Public Utilities Regulatory Policies Act (PURPA) to promote energy efficiency. PURPA encouraged energy‐efficient CHP and power production from renewables by requiring electric utilities to interconnect with “qualifying facilities” (QFs). CHP facilities had to meet minimum fuel‐specific efficiency standards to become a QF. PURPA required utilities to provide QFs with reasonable standby and backup charges, and most importantly to purchase excess electricity from them at the utilities’ avoided costs. PURPA also exempted QFs from regulatory oversight under the Public Utilities Holding Company Act and from constraints on natural gas use imposed by the Fuel Use Act.
PURPA was enacted at the same time that larger, more efficient, lower cost combustion turbines and combined cycle systems became widely available. These technologies were capable of producing more power in proportion to useful thermal output compared to traditional boiler/steam turbine CHP systems. Therefore, the power purchase provisions of PURPA, combined with the availability of these new technologies, resulted in the development of very large merchant power plants designed for high electricity production.
The environment changed again in the mid‐1990s with the advent of deregulated wholesale markets for electricity. Independent power producers could now sell directly to the market without the need for QF status, and CHP development slowed (Figure 8). The result was more restricted access to power markets, and users began delaying purchase decisions with an expectation of low electric prices in the future as many states began to restructure their individual power industries. By the end of the 1990s, policy makers began to explore the efficiency and emission reduction benefits of thermally based CHP. They realized that a new
16
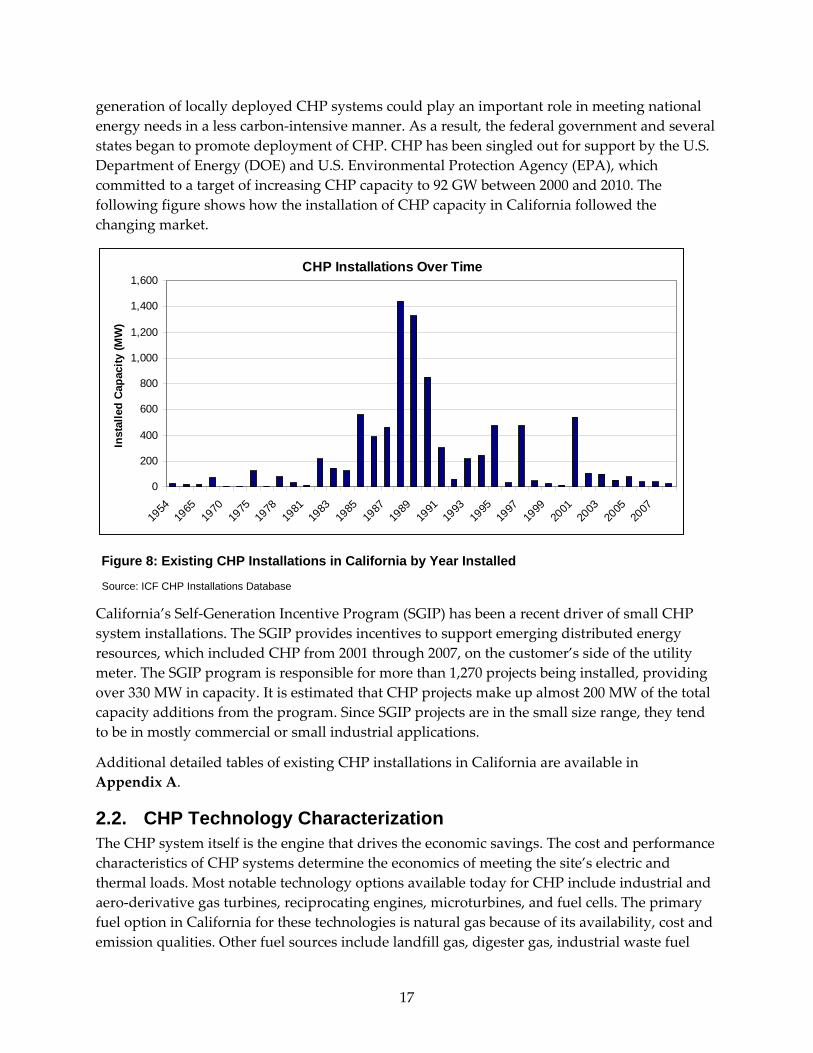
generation of locally deployed CHP systems could play an important role in meeting national energy needs in a less carbon‐intensive manner. As a result, the federal government and several states began to promote deployment of CHP. CHP has been singled out for support by the U.S. Department of Energy (DOE) and U.S. Environmental Protection Agency (EPA), which committed to a target of increasing CHP capacity to 92 GW between 2000 and 2010. The following figure shows how the installation of CHP capacity in California followed the changing market.
CHP Installations Over Time
0
200
400
600
800
1,000
1,200
1,400
1,600
1954
1965
1970
1975
1978
1981
1983
1985
1987
1989
1991
1993
1995
1997
1999
2001
2003
2005
2007
Inst
alle
d Ca
paci
ty (M
W)
Figure 8: Existing CHP Installations in California by Year Installed
Source: ICF CHP Installations Database
California’s Self‐Generation Incentive Program (SGIP) has been a recent driver of small CHP system installations. The SGIP provides incentives to support emerging distributed energy resources, which included CHP from 2001 through 2007, on the customer’s side of the utility meter. The SGIP program is responsible for more than 1,270 projects being installed, providing over 330 MW in capacity. It is estimated that CHP projects make up almost 200 MW of the total capacity additions from the program. Since SGIP projects are in the small size range, they tend to be in mostly commercial or small industrial applications.
Additional detailed tables of existing CHP installations in California are available in Appendix A.
2.2. CHP Technology Characterization The CHP system itself is the engine that drives the economic savings. The cost and performance characteristics of CHP systems determine the economics of meeting the site’s electric and thermal loads. Most notable technology options available today for CHP include industrial and aero‐derivative gas turbines, reciprocating engines, microturbines, and fuel cells. The primary fuel option in California for these technologies is natural gas because of its availability, cost and emission qualities. Other fuel sources include landfill gas, digester gas, industrial waste fuel
17
streams, propane, and diesel fuel. However, diesel fuel and propane can be prohibitively expensive for CHP. Furthermore, diesel engine generation sets can rarely be permitted in California as a prime power or as part of a CHP project. Landfill and digester gas, in sufficient quantities, are generally economical with or without heat recovery (CHP).
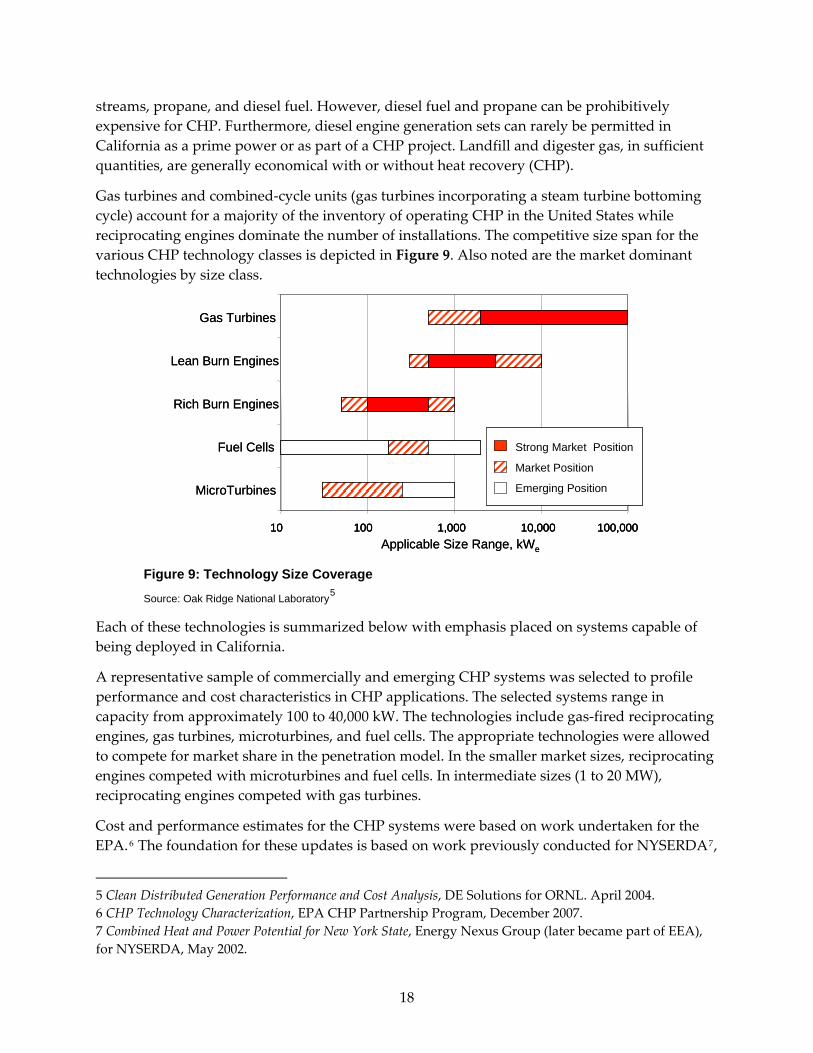
Gas turbines and combined‐cycle units (gas turbines incorporating a steam turbine bottoming cycle) account for a majority of the inventory of operating CHP in the United States while reciprocating engines dominate the number of installations. The competitive size span for the various CHP technology classes is depicted in Figure 9. Also noted are the market dominant technologies by size class.
10 100 1,000 10,000 100,000
MicroTurbines
Fuel Cells
Rich Burn Engines
Lean Burn Engines
Gas Turbines
Applicable Size Range, kWe
Strong Market Position
Market Position
Emerging Position
10 100 1,000 10,000 100,00010 100 1,000 10,000 100,000
MicroTurbines
Fuel Cells
Rich Burn Engines
Lean Burn Engines
Gas Turbines
Applicable Size Range, kWe
Strong Market Position
Market Position
Emerging Position
Figure 9: Technology Size Coverage
Source: Oak Ridge National Laboratory5
Each of these technologies is summarized below with emphasis placed on systems capable of being deployed in California.
A representative sample of commercially and emerging CHP systems was selected to profile performance and cost characteristics in CHP applications. The selected systems range in capacity from approximately 100 to 40,000 kW. The technologies include gas‐fired reciprocating engines, gas turbines, microturbines, and fuel cells. The appropriate technologies were allowed to compete for market share in the penetration model. In the smaller market sizes, reciprocating engines competed with microturbines and fuel cells. In intermediate sizes (1 to 20 MW), reciprocating engines competed with gas turbines.
Cost and performance estimates for the CHP systems were based on work undertaken for the EPA.6 The foundation for these updates is based on work previously conducted for NYSERDA7,
5 Clean Distributed Generation Performance and Cost Analysis, DE Solutions for ORNL. April 2004. 6 CHP Technology Characterization, EPA CHP Partnership Program, December 2007. 7 Combined Heat and Power Potential for New York State, Energy Nexus Group (later became part of EEA), for NYSERDA, May 2002.
18
on peer‐reviewed technology characterizations that Energy and Environmental Analysis (EEA) developed for the National Renewable Energy Laboratory8 and on follow‐up work conducted by DE Solutions for Oak Ridge National Laboratory.9 Additional emissions characteristics and cost and performance estimates for emissions control technologies were based on work ICF conducted for EPRI.10 Data are presented for a range of sizes that include basic electrical performance characteristics, CHP performance characteristics (power to heat ratio), equipment cost estimates, maintenance cost estimates, emission profiles with and without after‐treatment control, and emissions control cost estimates. The technology characteristics are presented for three years: 2009, 2014, and 2019. The 2009 estimates are based on current commercially available technologies. The cost and performance estimates for 2014 and 2019 reflect current technology development paths and currently planned government and industry funding. These projections were based on estimates included in the references listed above. NOx emissions estimates in lb/MWh are presented for each technology both with and without after‐treatment control (AT). For this analysis, all technologies were required to meet a NOx emissions requirement of 0.07 lb/MWh including a CHP thermal credit. After‐treatment costs were included in the technology model if after‐treatment was needed to meet this required emission level.
2.2.1. Reciprocating Engines Natural gas‐fueled reciprocating engines (engines) offer low first cost, easy start‐up, proven reliability when properly maintained, and good load‐following characteristics. Engines are well suited for packaged CHP in commercial and light industrial applications that require less than 5 MW. Natural gas engines for power generation currently rely on spark ignition (SI) to combust the fuel. Historically, there have been two types of SI engines: rich‐burn and lean‐burn.
Rich‐burn engines operate near stoichiometric combustion conditions as do automotive engines. Detonation constraints limit the electric efficiency of rich burn engines to the 28‐30% (HHV) range. Rich burn engines emit high levels of oxides of nitrogen (NOx) that are readily treated with passive three‐way catalysts similar to that used in automobiles. With a properly sized and controlled system, these catalysts can achieve emission reductions greater than 99% and can meet the ARB 2007 NOx guidelines.
Lean‐burn engines are inherently more efficient, more powerful, less maintenance intensive, and produce considerably fewer engine‐out pollutants than rich‐burn engines.11 However, in order to meet current emission requirements in stringent environmental regions such as California, a relatively expensive selective catalytic reduction (SCR) system and oxidation
8 Gas‐Fired Distributed Energy Resource Technology Characterizations, NREL, November 2003, http://www.osti.gov/bridge. 9 Clean Distributed Generation Performance and Cost Analysis, DE Solutions for ORNL. April 2004. 10 Assessment of Emerging Low‐Emissions Technologies for Distributed Resource Generators, EPRI, January 2005. 11 Engine Manufacturers Association, Gaseous‐Fueled Reciprocating Engines and the Distributed Energy Market, June 2003.
19
catalyst is required. Advanced SCR systems can remove greater than 95% of NOx emissions allowing lean burn engines to meet the ARB 2007 requirements with the CHP thermal credit.
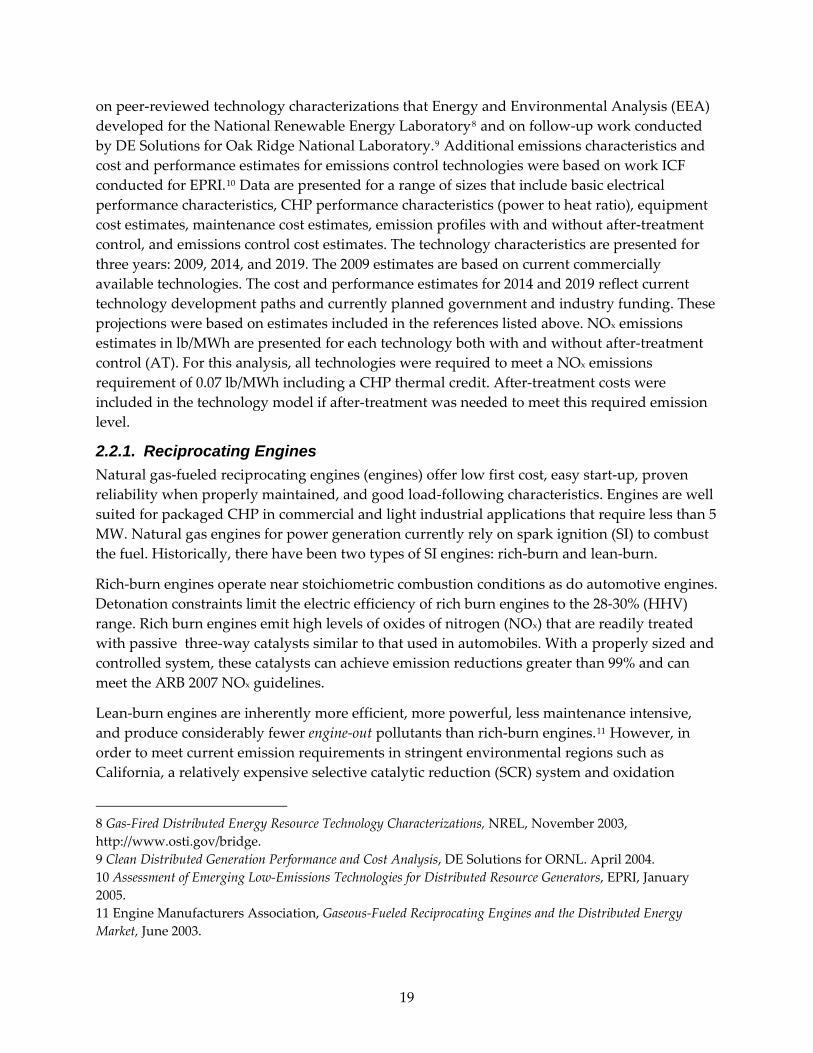
The schematic in Figure 10 illustrates a reciprocating engine equipped with heat recovery.
Exhaust HeatRecovery System
Engine
Oil Cooler
Jacket Water
Heat Exchanger
Heat
Exhaust
Generator
Figure 10: Reciprocating Engine CHP System
Source: DE Solutions
In reciprocating engines, the recovered heat is typically split between the exhaust at temperatures between 900°F and 1,000°F, and the jacket coolant, which is usually kept below 220°F. Heat is also available in some engines from the lube oil cooler. Engines can provide most of the available heat at hot water temperatures between 215°F and 230°F, or they can provide high‐grade steam using only the exhaust heat.
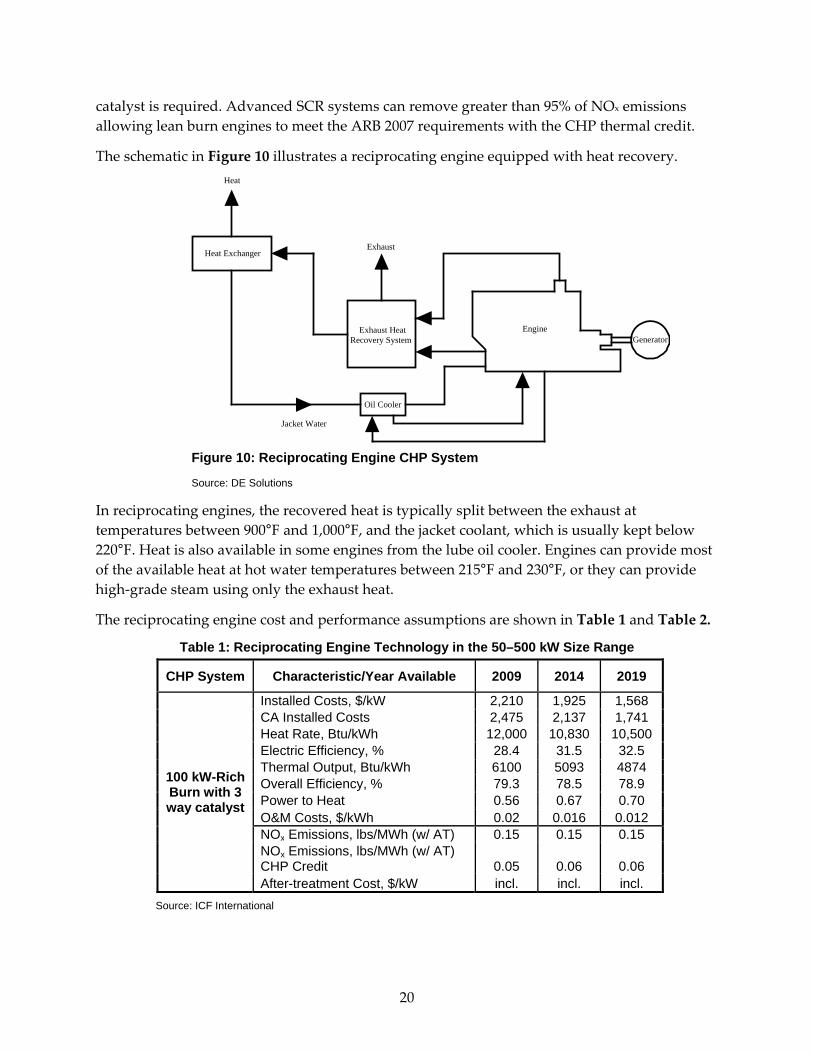
The reciprocating engine cost and performance assumptions are shown in Table 1 and Table 2.
Table 1: Reciprocating Engine Technology in the 50–500 kW Size Range
CHP System Characteristic/Year Available 2009 2014 2019
100 kW-Rich Burn with 3 way catalyst
Installed Costs, $/kW 2,210 1,925 1,568 CA Installed Costs 2,475 2,137 1,741 Heat Rate, Btu/kWh 12,000 10,830 10,500 Electric Efficiency, % 28.4 31.5 32.5 Thermal Output, Btu/kWh 6100 5093 4874 Overall Efficiency, % 79.3 78.5 78.9 Power to Heat 0.56 0.67 0.70 O&M Costs, $/kWh 0.02 0.016 0.012 NOx Emissions, lbs/MWh (w/ AT) 0.15 0.15 0.15 NOx Emissions, lbs/MWh (w/ AT) CHP Credit 0.05 0.06 0.06 After-treatment Cost, $/kW incl. incl. incl.
Source: ICF International
20
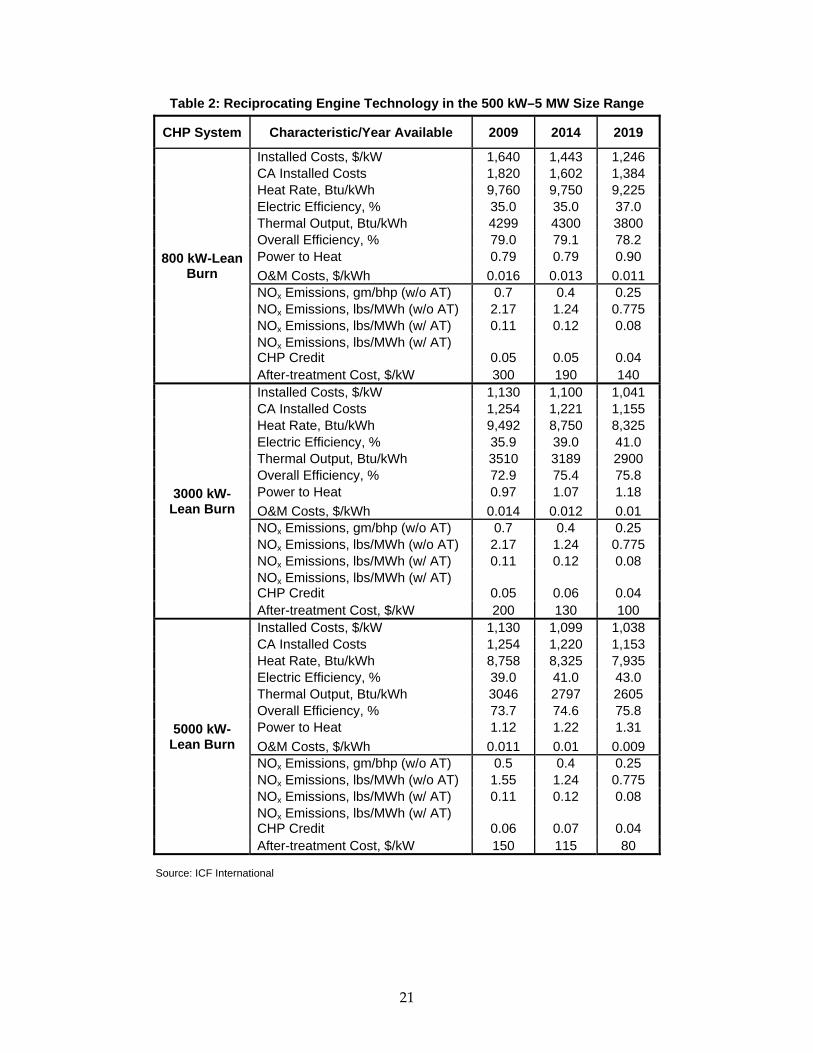
Table 2: Reciprocating Engine Technology in the 500 kW–5 MW Size Range
CHP System Characteristic/Year Available 2009 2014 2019
800 kW-Lean Burn
Installed Costs, $/kW 1,640 1,443 1,246 CA Installed Costs 1,820 1,602 1,384 Heat Rate, Btu/kWh 9,760 9,750 9,225 Electric Efficiency, % 35.0 35.0 37.0 Thermal Output, Btu/kWh 4299 4300 3800 Overall Efficiency, % 79.0 79.1 78.2 Power to Heat 0.79 0.79 0.90 O&M Costs, $/kWh 0.016 0.013 0.011 NOx Emissions, gm/bhp (w/o AT) 0.7 0.4 0.25 NOx Emissions, lbs/MWh (w/o AT) 2.17 1.24 0.775 NOx Emissions, lbs/MWh (w/ AT) 0.11 0.12 0.08 NOx Emissions, lbs/MWh (w/ AT) CHP Credit 0.05 0.05 0.04 After-treatment Cost, $/kW 300 190 140
3000 kW-Lean Burn
Installed Costs, $/kW 1,130 1,100 1,041 CA Installed Costs 1,254 1,221 1,155 Heat Rate, Btu/kWh 9,492 8,750 8,325 Electric Efficiency, % 35.9 39.0 41.0 Thermal Output, Btu/kWh 3510 3189 2900 Overall Efficiency, % 72.9 75.4 75.8 Power to Heat 0.97 1.07 1.18 O&M Costs, $/kWh 0.014 0.012 0.01 NOx Emissions, gm/bhp (w/o AT) 0.7 0.4 0.25 NOx Emissions, lbs/MWh (w/o AT) 2.17 1.24 0.775 NOx Emissions, lbs/MWh (w/ AT) 0.11 0.12 0.08 NOx Emissions, lbs/MWh (w/ AT) CHP Credit 0.05 0.06 0.04 After-treatment Cost, $/kW 200 130 100
5000 kW-Lean Burn
Installed Costs, $/kW 1,130 1,099 1,038 CA Installed Costs 1,254 1,220 1,153 Heat Rate, Btu/kWh 8,758 8,325 7,935 Electric Efficiency, % 39.0 41.0 43.0 Thermal Output, Btu/kWh 3046 2797 2605 Overall Efficiency, % 73.7 74.6 75.8 Power to Heat 1.12 1.22 1.31 O&M Costs, $/kWh 0.011 0.01 0.009 NOx Emissions, gm/bhp (w/o AT) 0.5 0.4 0.25 NOx Emissions, lbs/MWh (w/o AT) 1.55 1.24 0.775 NOx Emissions, lbs/MWh (w/ AT) 0.11 0.12 0.08 NOx Emissions, lbs/MWh (w/ AT) CHP Credit 0.06 0.07 0.04 After-treatment Cost, $/kW 150 115 80
Source: ICF International
21
2.2.2. Natural Gas Turbines Industrial gas turbines are an established technology used for a variety of on‐site generation and mechanical drive applications. Gas turbines are most competitive in sizes larger than 3 MW in CHP applications. Gas turbines have moderate electric efficiencies and excel in applications with high heat requirements.
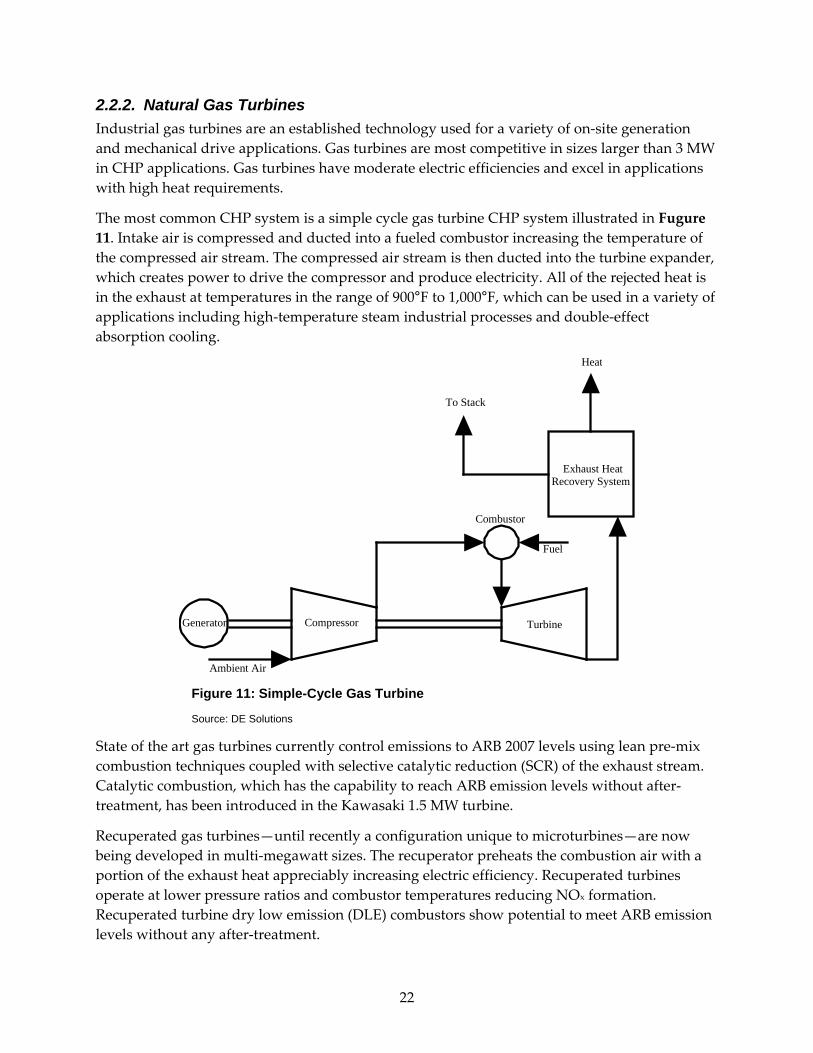
The most common CHP system is a simple cycle gas turbine CHP system illustrated in Fugure 11. Intake air is compressed and ducted into a fueled combustor increasing the temperature of the compressed air stream. The compressed air stream is then ducted into the turbine expander, which creates power to drive the compressor and produce electricity. All of the rejected heat is in the exhaust at temperatures in the range of 900°F to 1,000°F, which can be used in a variety of applications including high‐temperature steam industrial processes and double‐effect absorption cooling.
Exhaust HeatRecovery System
Compressor Turbine
Combustor
Fuel
To Stack
Heat
Ambient Air
Generator
Figure 11: Simple-Cycle Gas Turbine
Source: DE Solutions
State of the art gas turbines currently control emissions to ARB 2007 levels using lean pre‐mix combustion techniques coupled with selective catalytic reduction (SCR) of the exhaust stream. Catalytic combustion, which has the capability to reach ARB emission levels without after‐treatment, has been introduced in the Kawasaki 1.5 MW turbine.
Recuperated gas turbines—until recently a configuration unique to microturbines—are now being developed in multi‐megawatt sizes. The recuperator preheats the combustion air with a portion of the exhaust heat appreciably increasing electric efficiency. Recuperated turbines operate at lower pressure ratios and combustor temperatures reducing NOx formation. Recuperated turbine dry low emission (DLE) combustors show potential to meet ARB emission levels without any after‐treatment.
22
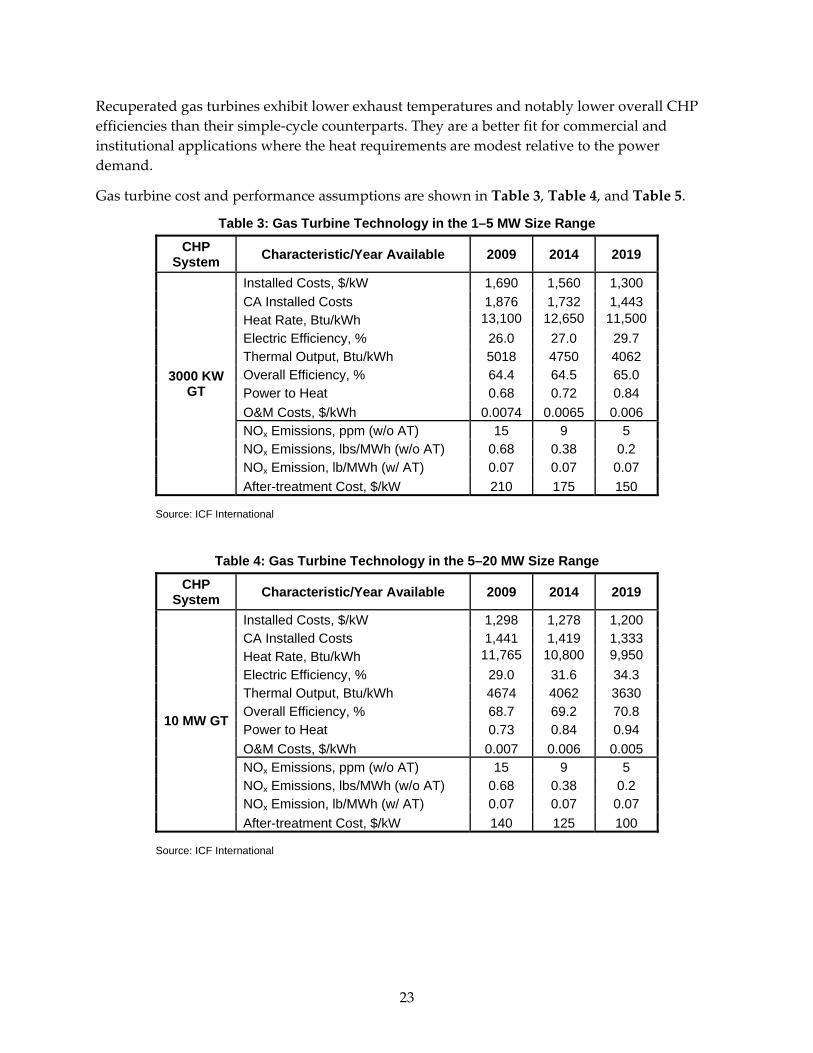
Recuperated gas turbines exhibit lower exhaust temperatures and notably lower overall CHP efficiencies than their simple‐cycle counterparts. They are a better fit for commercial and institutional applications where the heat requirements are modest relative to the power demand.
Gas turbine cost and performance assumptions are shown in Table 3, Table 4, and Table 5.
Table 3: Gas Turbine Technology in the 1–5 MW Size Range
CHP System Characteristic/Year Available 2009 2014 2019
3000 KW GT
Installed Costs, $/kW 1,690 1,560 1,300 CA Installed Costs 1,876 1,732 1,443 Heat Rate, Btu/kWh 13,100 12,650 11,500 Electric Efficiency, % 26.0 27.0 29.7 Thermal Output, Btu/kWh 5018 4750 4062 Overall Efficiency, % 64.4 64.5 65.0 Power to Heat 0.68 0.72 0.84 O&M Costs, $/kWh 0.0074 0.0065 0.006 NOx Emissions, ppm (w/o AT) 15 9 5 NOx Emissions, lbs/MWh (w/o AT) 0.68 0.38 0.2 NOx Emission, lb/MWh (w/ AT) 0.07 0.07 0.07 After-treatment Cost, $/kW 210 175 150
Source: ICF International
Table 4: Gas Turbine Technology in the 5–20 MW Size Range
CHP System Characteristic/Year Available 2009 2014 2019
10 MW GT
Installed Costs, $/kW 1,298 1,278 1,200 CA Installed Costs 1,441 1,419 1,333 Heat Rate, Btu/kWh 11,765 10,800 9,950 Electric Efficiency, % 29.0 31.6 34.3 Thermal Output, Btu/kWh 4674 4062 3630 Overall Efficiency, % 68.7 69.2 70.8 Power to Heat 0.73 0.84 0.94 O&M Costs, $/kWh 0.007 0.006 0.005 NOx Emissions, ppm (w/o AT) 15 9 5 NOx Emissions, lbs/MWh (w/o AT) 0.68 0.38 0.2 NOx Emission, lb/MWh (w/ AT) 0.07 0.07 0.07 After-treatment Cost, $/kW 140 125 100
Source: ICF International
23
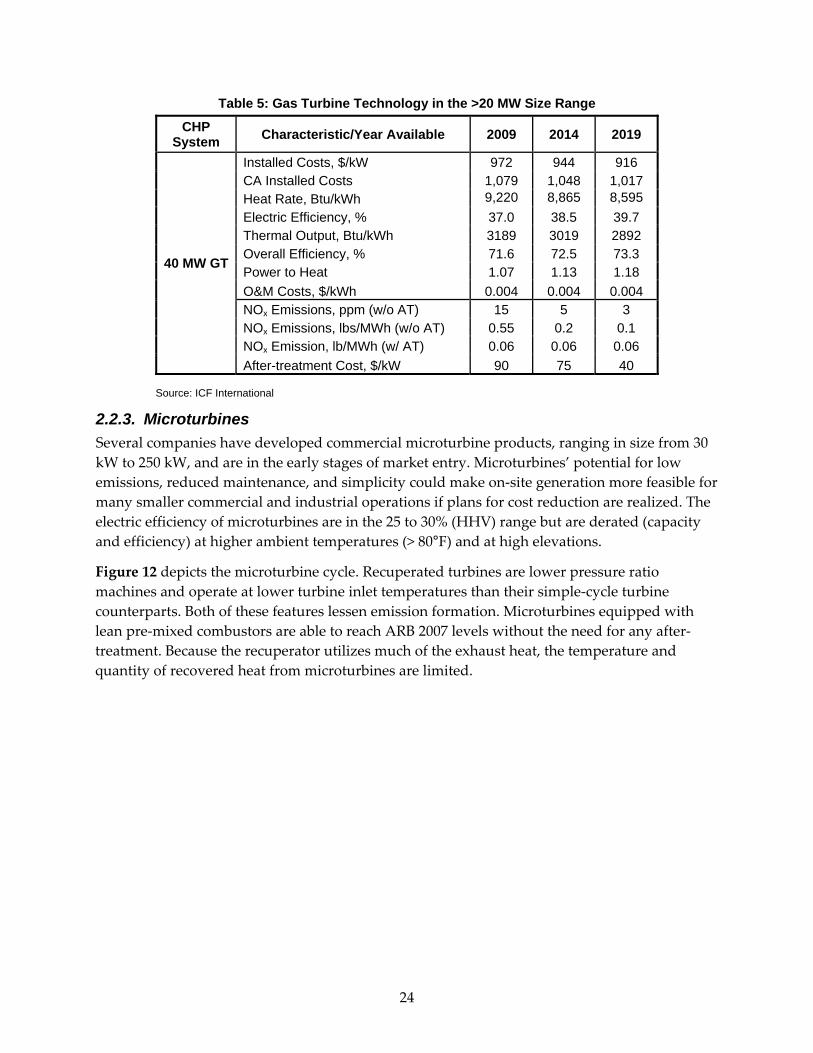
Table 5: Gas Turbine Technology in the >20 MW Size Range
CHP System Characteristic/Year Available 2009 2014 2019
40 MW GT
Installed Costs, $/kW 972 944 916 CA Installed Costs 1,079 1,048 1,017 Heat Rate, Btu/kWh 9,220 8,865 8,595 Electric Efficiency, % 37.0 38.5 39.7 Thermal Output, Btu/kWh 3189 3019 2892 Overall Efficiency, % 71.6 72.5 73.3 Power to Heat 1.07 1.13 1.18 O&M Costs, $/kWh 0.004 0.004 0.004 NOx Emissions, ppm (w/o AT) 15 5 3 NOx Emissions, lbs/MWh (w/o AT) 0.55 0.2 0.1 NOx Emission, lb/MWh (w/ AT) 0.06 0.06 0.06 After-treatment Cost, $/kW 90 75 40
Source: ICF International
2.2.3. Microturbines Several companies have developed commercial microturbine products, ranging in size from 30 kW to 250 kW, and are in the early stages of market entry. Microturbines’ potential for low emissions, reduced maintenance, and simplicity could make on‐site generation more feasible for many smaller commercial and industrial operations if plans for cost reduction are realized. The electric efficiency of microturbines are in the 25 to 30% (HHV) range but are derated (capacity and efficiency) at higher ambient temperatures (> 80°F) and at high elevations.
Figure 12 depicts the microturbine cycle. Recuperated turbines are lower pressure ratio machines and operate at lower turbine inlet temperatures than their simple‐cycle turbine counterparts. Both of these features lessen emission formation. Microturbines equipped with lean pre‐mixed combustors are able to reach ARB 2007 levels without the need for any after‐treatment. Because the recuperator utilizes much of the exhaust heat, the temperature and quantity of recovered heat from microturbines are limited.
24

RecuperatorExhaust HeatRecovery System
Inverter Rectifier
High FrequencyGenerator
Compressor
Ambient Air
Turbine
Exhaust
CombustorFuel
To Stack
Heat
CompressedAir
60 Hz ACElectricity
Exhaust
Figure 12: Microturbine-Based CHP System
Source: NREL
The microturbine cost and performance assumptions are shown in
Table 6 and Table 7.
Table 6: Microturbine Technology in the 50–500 kW Size Range
CHP System Characteristic/Year Available 2009 2014 2019
65 kW
Installed Costs, $/kW 2,739 2,037 1,743 CA Installed Costs 3,040 2,261 1,935 Heat Rate, Btu/kWh 13,542 12,500 11,375 Electric Efficiency, % 25.2 27.3 30.0 Thermal Output, Btu/kWh 6277 5350 4500 Overall Efficiency, % 71.5 70.1 69.6 Power to Heat 0.54 0.64 0.76 O&M Costs, $/kWh 0.022 0.016 0.012 NOx Emissions, lbs/MWh (w/o AT) 0.17 0.14 0.13 NOx Emissions, lbs/MWh (w/o AT) CHP Credit 0.06 0.05 0.06 After-treatment Cost, $/kW
Source: ICF International
25
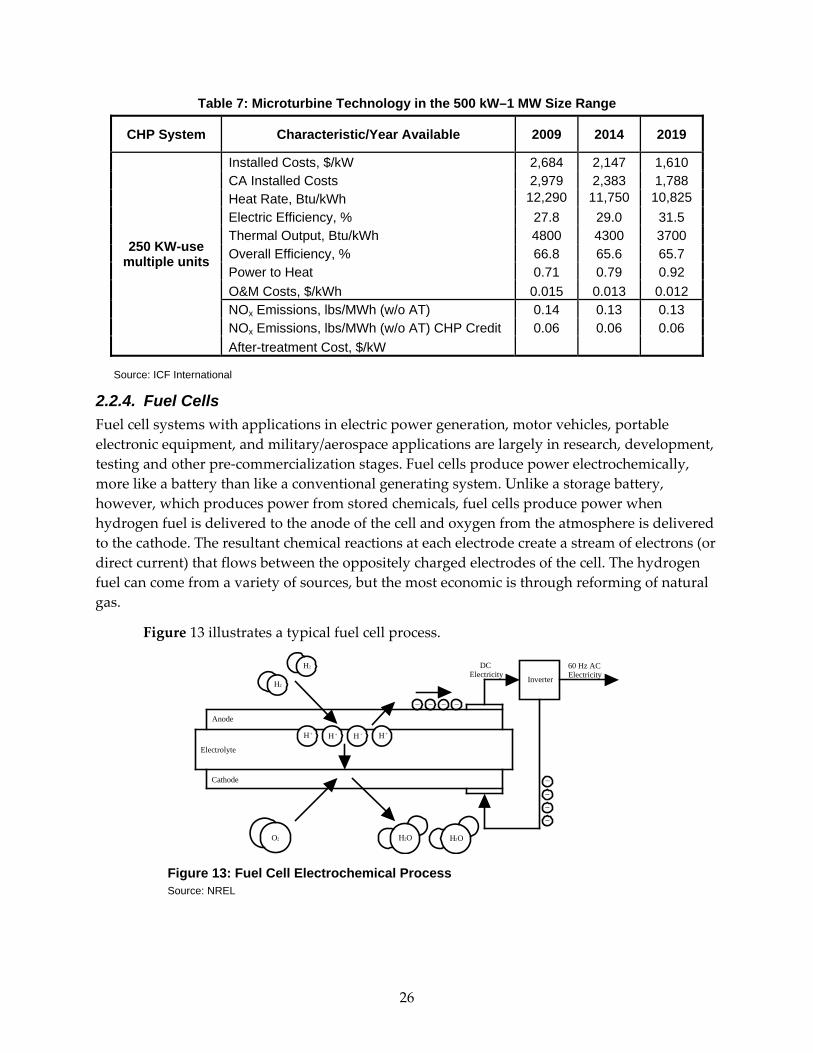
Table 7: Microturbine Technology in the 500 kW–1 MW Size Range
CHP System Characteristic/Year Available 2009 2014 2019
250 KW-use multiple units
Installed Costs, $/kW 2,684 2,147 1,610 CA Installed Costs 2,979 2,383 1,788 Heat Rate, Btu/kWh 12,290 11,750 10,825 Electric Efficiency, % 27.8 29.0 31.5 Thermal Output, Btu/kWh 4800 4300 3700 Overall Efficiency, % 66.8 65.6 65.7 Power to Heat 0.71 0.79 0.92 O&M Costs, $/kWh 0.015 0.013 0.012 NOx Emissions, lbs/MWh (w/o AT) 0.14 0.13 0.13 NOx Emissions, lbs/MWh (w/o AT) CHP Credit 0.06 0.06 0.06 After-treatment Cost, $/kW
Source: ICF International
2.2.4. Fuel Cells Fuel cell systems with applications in electric power generation, motor vehicles, portable electronic equipment, and military/aerospace applications are largely in research, development, testing and other pre‐commercialization stages. Fuel cells produce power electrochemically, more like a battery than like a conventional generating system. Unlike a storage battery, however, which produces power from stored chemicals, fuel cells produce power when hydrogen fuel is delivered to the anode of the cell and oxygen from the atmosphere is delivered to the cathode. The resultant chemical reactions at each electrode create a stream of electrons (or direct current) that flows between the oppositely charged electrodes of the cell. The hydrogen fuel can come from a variety of sources, but the most economic is through reforming of natural gas.
Figure 13 illustrates a typical fuel cell process.
Anode
Cathode
Electrolyte
H2
H2
H + H + H + H +
O2 H2O H2O
Inverter
_ _ _ _
_
__
_
DCElectricity
60 Hz ACElectricity
Figure 13: Fuel Cell Electrochemical Process Source: NREL
26
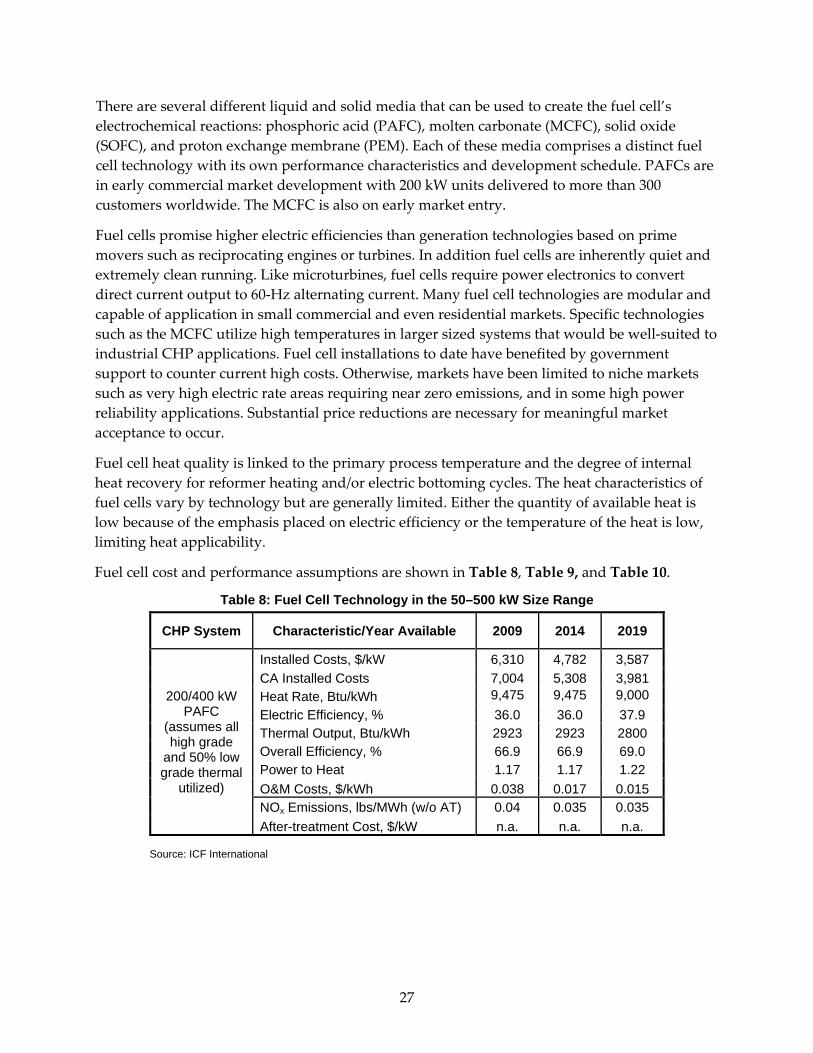
There are several different liquid and solid media that can be used to create the fuel cell’s electrochemical reactions: phosphoric acid (PAFC), molten carbonate (MCFC), solid oxide (SOFC), and proton exchange membrane (PEM). Each of these media comprises a distinct fuel cell technology with its own performance characteristics and development schedule. PAFCs are in early commercial market development with 200 kW units delivered to more than 300 customers worldwide. The MCFC is also on early market entry.
Fuel cells promise higher electric efficiencies than generation technologies based on prime movers such as reciprocating engines or turbines. In addition fuel cells are inherently quiet and extremely clean running. Like microturbines, fuel cells require power electronics to convert direct current output to 60‐Hz alternating current. Many fuel cell technologies are modular and capable of application in small commercial and even residential markets. Specific technologies such as the MCFC utilize high temperatures in larger sized systems that would be well‐suited to industrial CHP applications. Fuel cell installations to date have benefited by government support to counter current high costs. Otherwise, markets have been limited to niche markets such as very high electric rate areas requiring near zero emissions, and in some high power reliability applications. Substantial price reductions are necessary for meaningful market acceptance to occur.
Fuel cell heat quality is linked to the primary process temperature and the degree of internal heat recovery for reformer heating and/or electric bottoming cycles. The heat characteristics of fuel cells vary by technology but are generally limited. Either the quantity of available heat is low because of the emphasis placed on electric efficiency or the temperature of the heat is low, limiting heat applicability.
Fuel cell cost and performance assumptions are shown in Table 8, Table 9, and Table 10.
Table 8: Fuel Cell Technology in the 50–500 kW Size Range
CHP System Characteristic/Year Available 2009 2014 2019
200/400 kW PAFC
(assumes all high grade
and 50% low grade thermal
utilized)
Installed Costs, $/kW 6,310 4,782 3,587 CA Installed Costs 7,004 5,308 3,981 Heat Rate, Btu/kWh 9,475 9,475 9,000 Electric Efficiency, % 36.0 36.0 37.9 Thermal Output, Btu/kWh 2923 2923 2800 Overall Efficiency, % 66.9 66.9 69.0 Power to Heat 1.17 1.17 1.22 O&M Costs, $/kWh 0.038 0.017 0.015 NOx Emissions, lbs/MWh (w/o AT) 0.04 0.035 0.035 After-treatment Cost, $/kW n.a. n.a. n.a.
Source: ICF International
27
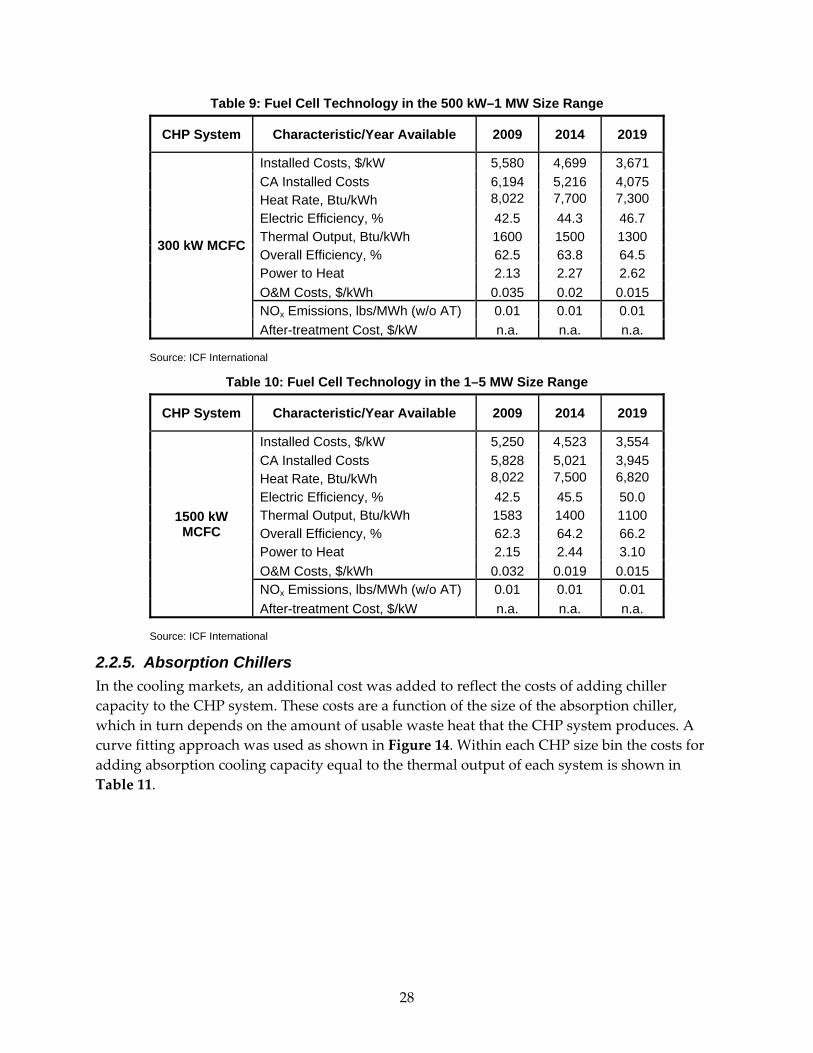
Table 9: Fuel Cell Technology in the 500 kW–1 MW Size Range
CHP System Characteristic/Year Available 2009 2014 2019
300 kW MCFC
Installed Costs, $/kW 5,580 4,699 3,671 CA Installed Costs 6,194 5,216 4,075 Heat Rate, Btu/kWh 8,022 7,700 7,300 Electric Efficiency, % 42.5 44.3 46.7 Thermal Output, Btu/kWh 1600 1500 1300 Overall Efficiency, % 62.5 63.8 64.5 Power to Heat 2.13 2.27 2.62 O&M Costs, $/kWh 0.035 0.02 0.015 NOx Emissions, lbs/MWh (w/o AT) 0.01 0.01 0.01 After-treatment Cost, $/kW n.a. n.a. n.a.
Source: ICF International
Table 10: Fuel Cell Technology in the 1–5 MW Size Range
CHP System Characteristic/Year Available 2009 2014 2019
1500 kW MCFC
Installed Costs, $/kW 5,250 4,523 3,554 CA Installed Costs 5,828 5,021 3,945 Heat Rate, Btu/kWh 8,022 7,500 6,820 Electric Efficiency, % 42.5 45.5 50.0 Thermal Output, Btu/kWh 1583 1400 1100 Overall Efficiency, % 62.3 64.2 66.2 Power to Heat 2.15 2.44 3.10 O&M Costs, $/kWh 0.032 0.019 0.015 NOx Emissions, lbs/MWh (w/o AT) 0.01 0.01 0.01 After-treatment Cost, $/kW n.a. n.a. n.a.
Source: ICF International
2.2.5. Absorption Chillers In the cooling markets, an additional cost was added to reflect the costs of adding chiller capacity to the CHP system. These costs are a function of the size of the absorption chiller, which in turn depends on the amount of usable waste heat that the CHP system produces. A curve fitting approach was used as shown in Figure 14. Within each CHP size bin the costs for adding absorption cooling capacity equal to the thermal output of each system is shown in Table 11.
28
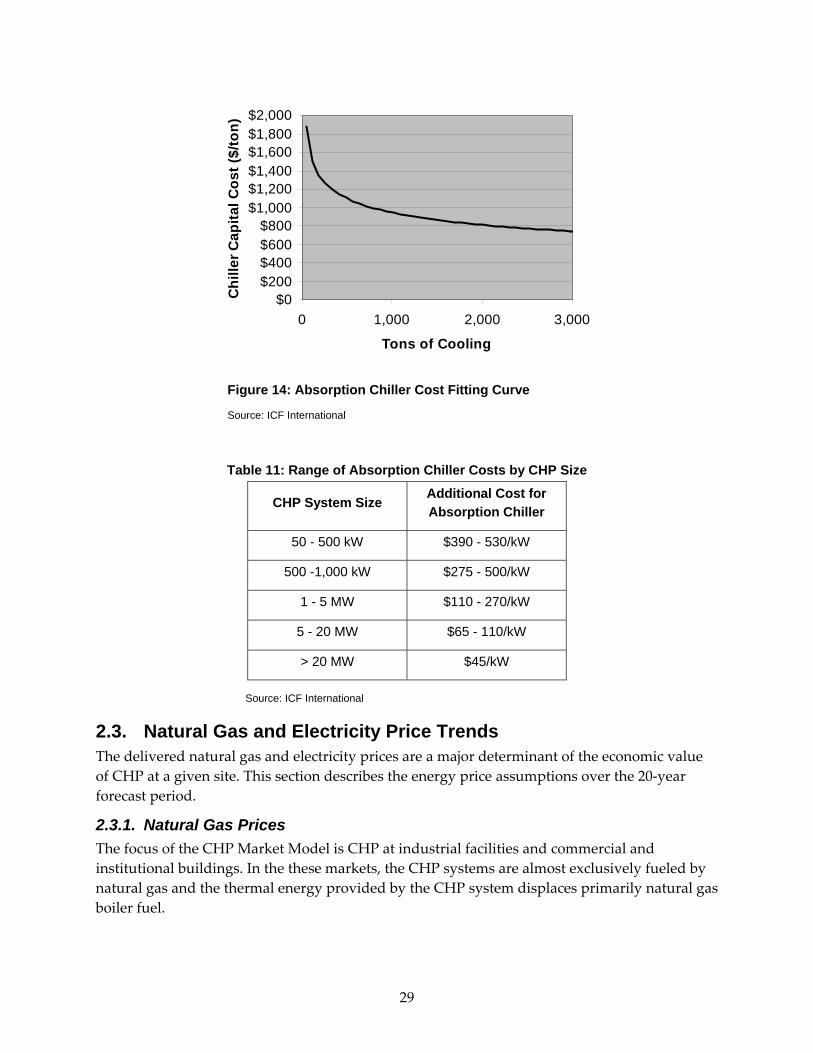
$0$200$400$600$800
$1,000$1,200$1,400$1,600$1,800$2,000
0 1,000 2,000 3,000
Tons of Cooling
Chi
ller C
apita
l Cos
t ($/
ton)
Figure 14: Absorption Chiller Cost Fitting Curve
Source: ICF International
Table 11: Range of Absorption Chiller Costs by CHP Size
CHP System Size Additional Cost for Absorption Chiller
50 - 500 kW $390 - 530/kW
500 -1,000 kW $275 - 500/kW
1 - 5 MW $110 - 270/kW
5 - 20 MW $65 - 110/kW
> 20 MW $45/kW
Source: ICF International
2.3. Natural Gas and Electricity Price Trends The delivered natural gas and electricity prices are a major determinant of the economic value of CHP at a given site. This section describes the energy price assumptions over the 20‐year forecast period.
2.3.1. Natural Gas Prices The focus of the CHP Market Model is CHP at industrial facilities and commercial and institutional buildings. In the these markets, the CHP systems are almost exclusively fueled by natural gas and the thermal energy provided by the CHP system displaces primarily natural gas boiler fuel.
29
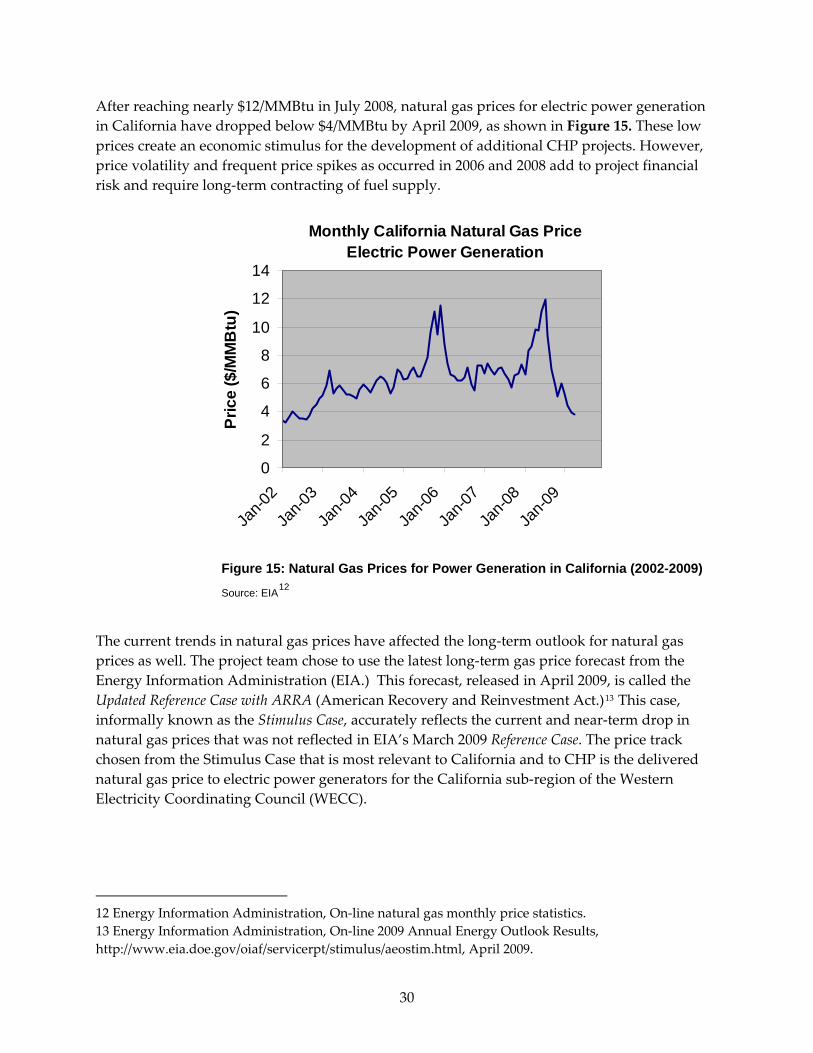
After reaching nearly $12/MMBtu in July 2008, natural gas prices for electric power generation in California have dropped below $4/MMBtu by April 2009, as shown in Figure 15. These low prices create an economic stimulus for the development of additional CHP projects. However, price volatility and frequent price spikes as occurred in 2006 and 2008 add to project financial risk and require long‐term contracting of fuel supply.
Monthly California Natural Gas PriceElectric Power Generation
0
2
4
6
8
10
12
14
Jan-0
2
Jan-0
3
Jan-0
4
Jan-0
5
Jan-0
6
Jan-0
7
Jan-0
8
Jan-0
9
Pric
e ($
/MM
Btu
)
Figure 15: Natural Gas Prices for Power Generation in California (2002-2009)
Source: EIA12
The current trends in natural gas prices have affected the long‐term outlook for natural gas prices as well. The project team chose to use the latest long‐term gas price forecast from the Energy Information Administration (EIA.) This forecast, released in April 2009, is called the Updated Reference Case with ARRA (American Recovery and Reinvestment Act.)13 This case, informally known as the Stimulus Case, accurately reflects the current and near‐term drop in natural gas prices that was not reflected in EIA’s March 2009 Reference Case. The price track chosen from the Stimulus Case that is most relevant to California and to CHP is the delivered natural gas price to electric power generators for the California sub‐region of the Western Electricity Coordinating Council (WECC).
12 Energy Information Administration, On‐line natural gas monthly price statistics. 13 Energy Information Administration, On‐line 2009 Annual Energy Outlook Results, http://www.eia.doe.gov/oiaf/servicerpt/stimulus/aeostim.html, April 2009.
30
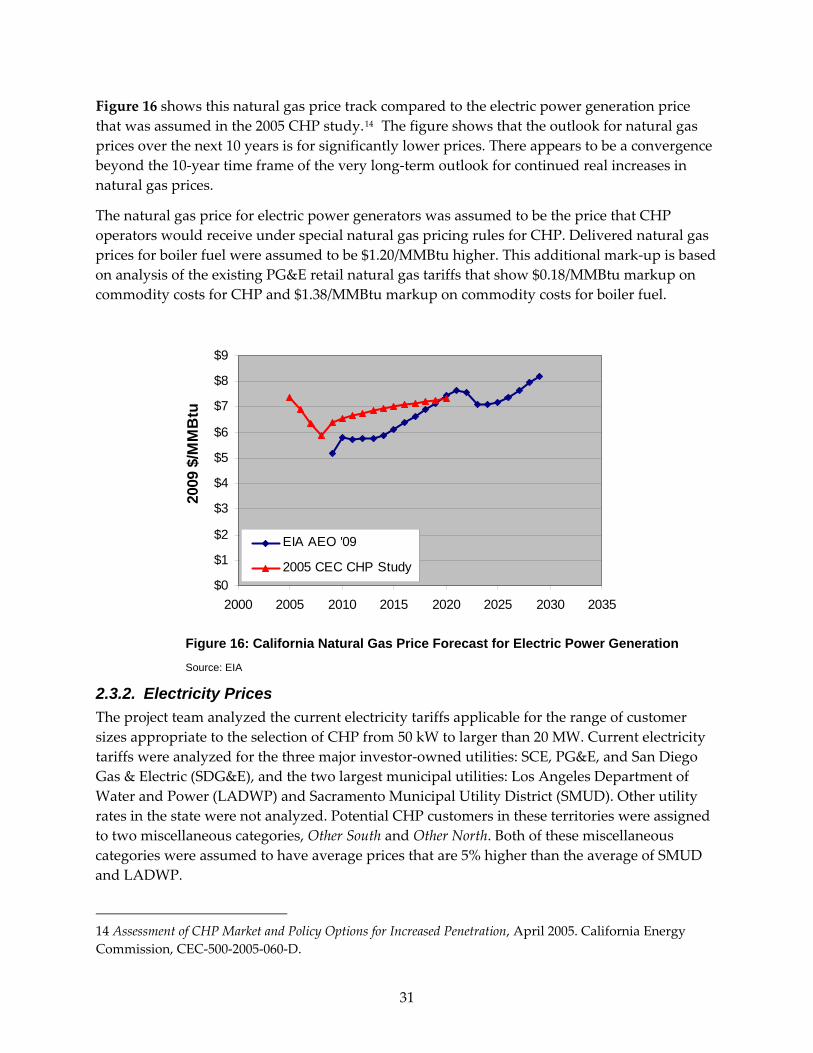
Figure 16 shows this natural gas price track compared to the electric power generation price that was assumed in the 2005 CHP study.14 The figure shows that the outlook for natural gas prices over the next 10 years is for significantly lower prices. There appears to be a convergence beyond the 10‐year time frame of the very long‐term outlook for continued real increases in natural gas prices.
The natural gas price for electric power generators was assumed to be the price that CHP operators would receive under special natural gas pricing rules for CHP. Delivered natural gas prices for boiler fuel were assumed to be $1.20/MMBtu higher. This additional mark‐up is based on analysis of the existing PG&E retail natural gas tariffs that show $0.18/MMBtu markup on commodity costs for CHP and $1.38/MMBtu markup on commodity costs for boiler fuel.
$0
$1
$2
$3
$4
$5
$6
$7
$8
$9
2000 2005 2010 2015 2020 2025 2030 2035
2009
$/M
MB
tu
EIA AEO '09
2005 CEC CHP Study
Figure 16: California Natural Gas Price Forecast for Electric Power Generation
Source: EIA
2.3.2. Electricity Prices The project team analyzed the current electricity tariffs applicable for the range of customer sizes appropriate to the selection of CHP from 50 kW to larger than 20 MW. Current electricity tariffs were analyzed for the three major investor‐owned utilities: SCE, PG&E, and San Diego Gas & Electric (SDG&E), and the two largest municipal utilities: Los Angeles Department of Water and Power (LADWP) and Sacramento Municipal Utility District (SMUD). Other utility rates in the state were not analyzed. Potential CHP customers in these territories were assigned to two miscellaneous categories, Other South and Other North. Both of these miscellaneous categories were assumed to have average prices that are 5% higher than the average of SMUD and LADWP.
14 Assessment of CHP Market and Policy Options for Increased Penetration, April 2005. California Energy Commission, CEC‐500‐2005‐060‐D.
31
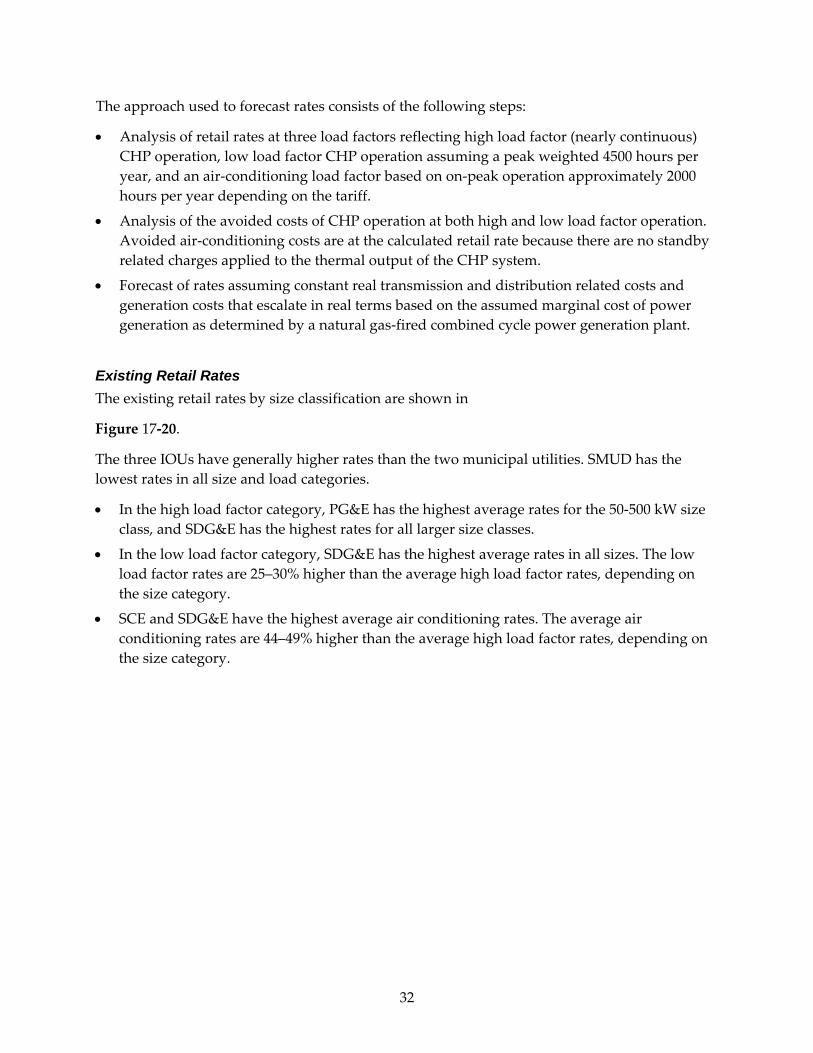
The approach used to forecast rates consists of the following steps:
• Analysis of retail rates at three load factors reflecting high load factor (nearly continuous) CHP operation, low load factor CHP operation assuming a peak weighted 4500 hours per year, and an air‐conditioning load factor based on on‐peak operation approximately 2000 hours per year depending on the tariff.
• Analysis of the avoided costs of CHP operation at both high and low load factor operation. Avoided air‐conditioning costs are at the calculated retail rate because there are no standby related charges applied to the thermal output of the CHP system.
• Forecast of rates assuming constant real transmission and distribution related costs and generation costs that escalate in real terms based on the assumed marginal cost of power generation as determined by a natural gas‐fired combined cycle power generation plant.
Existing Retail Rates The existing retail rates by size classification are shown in
Figure 17‐20.
The three IOUs have generally higher rates than the two municipal utilities. SMUD has the lowest rates in all size and load categories.
• In the high load factor category, PG&E has the highest average rates for the 50‐500 kW size class, and SDG&E has the highest rates for all larger size classes.
• In the low load factor category, SDG&E has the highest average rates in all sizes. The low load factor rates are 25–30% higher than the average high load factor rates, depending on the size category.
• SCE and SDG&E have the highest average air conditioning rates. The average air conditioning rates are 44–49% higher than the average high load factor rates, depending on the size category.
32
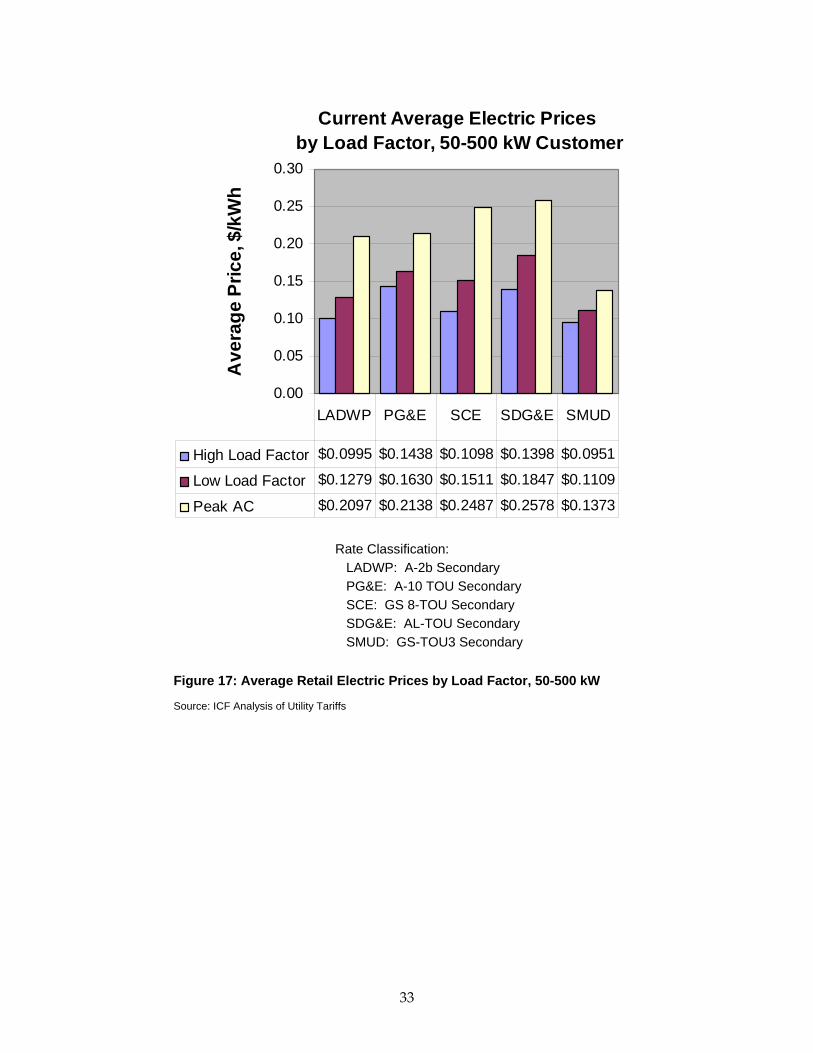
Current Average Electric Prices by Load Factor, 50-500 kW Customer
0.00
0.05
0.10
0.15
0.20
0.25
0.30
Ave
rage
Pric
e, $
/kW
h
High Load Factor $0.0995 $0.1438 $0.1098 $0.1398 $0.0951
Low Load Factor $0.1279 $0.1630 $0.1511 $0.1847 $0.1109
Peak AC $0.2097 $0.2138 $0.2487 $0.2578 $0.1373
LADWP PG&E SCE SDG&E SMUD
Rate Classification: LADWP: A-2b Secondary PG&E: A-10 TOU Secondary SCE: GS 8-TOU Secondary SDG&E: AL-TOU Secondary SMUD: GS-TOU3 Secondary
Figure 17: Average Retail Electric Prices by Load Factor, 50-500 kW
Source: ICF Analysis of Utility Tariffs
33
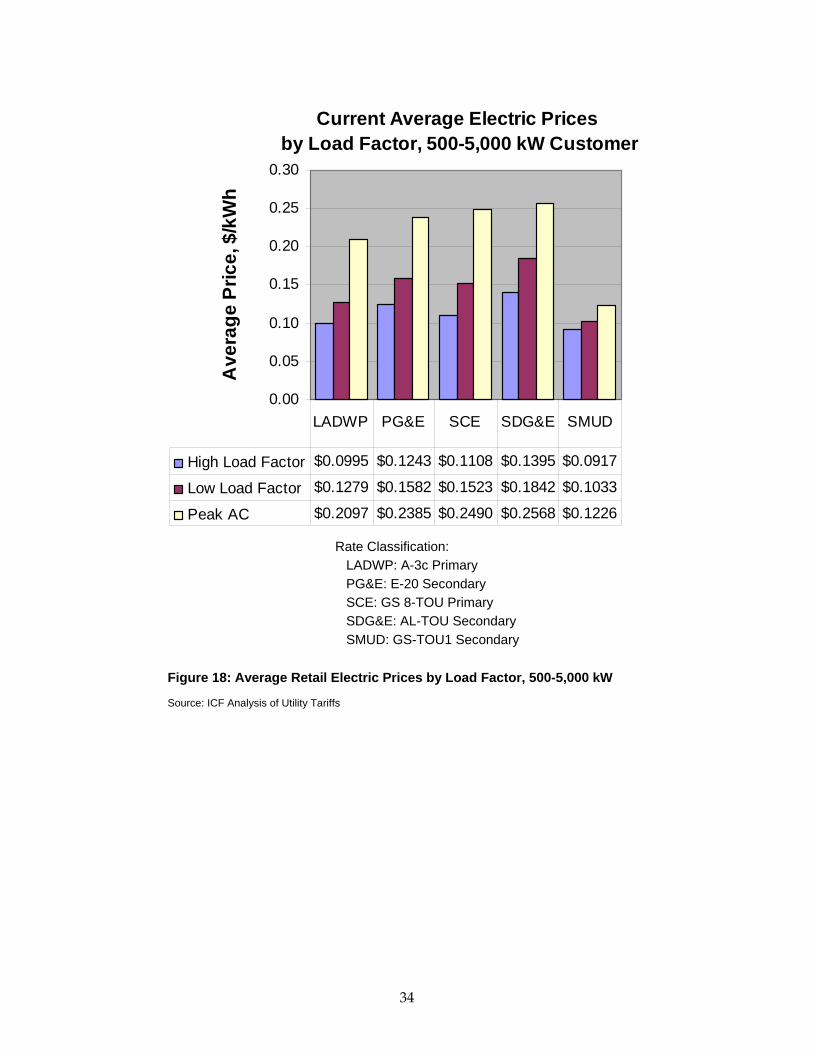
Current Average Electric Prices by Load Factor, 500-5,000 kW Customer
0.00
0.05
0.10
0.15
0.20
0.25
0.30
Ave
rage
Pric
e, $
/kW
h
High Load Factor $0.0995 $0.1243 $0.1108 $0.1395 $0.0917
Low Load Factor $0.1279 $0.1582 $0.1523 $0.1842 $0.1033
Peak AC $0.2097 $0.2385 $0.2490 $0.2568 $0.1226
LADWP PG&E SCE SDG&E SMUD
Rate Classification:
LADWP: A-3c Primary PG&E: E-20 Secondary SCE: GS 8-TOU Primary SDG&E: AL-TOU Secondary SMUD: GS-TOU1 Secondary
Figure 18: Average Retail Electric Prices by Load Factor, 500-5,000 kW
Source: ICF Analysis of Utility Tariffs
34
Current Average Electric Prices by Load Factor, 5-20 MW Customer
0.00
0.05
0.10
0.15
0.20
0.25
0.30
Ave
rage
Pric
e, $
/kW
h
High Load Factor $0.0964 $0.1202 $0.0827 $0.1366 $0.0847
Low Load Factor $0.1224 $0.1522 $0.1363 $0.1805 $0.0952
Peak AC $0.1976 $0.2281 $0.2353 $0.2517 $0.1127
LADWP PG&E SCE SDG&E SMUD
Rate Classification: LADWP: A-3a Subtransmission PG&E: E-20 Primary SCE: GS 8-TOU Transmission SDG&E: AL-TOU Primary SMUD: GS-TOU1 Primary
Figure 19: Average Retail Electric Prices by Load Factor, 5-20 MW
Source: ICF Analysis of Utility Tariffs
35
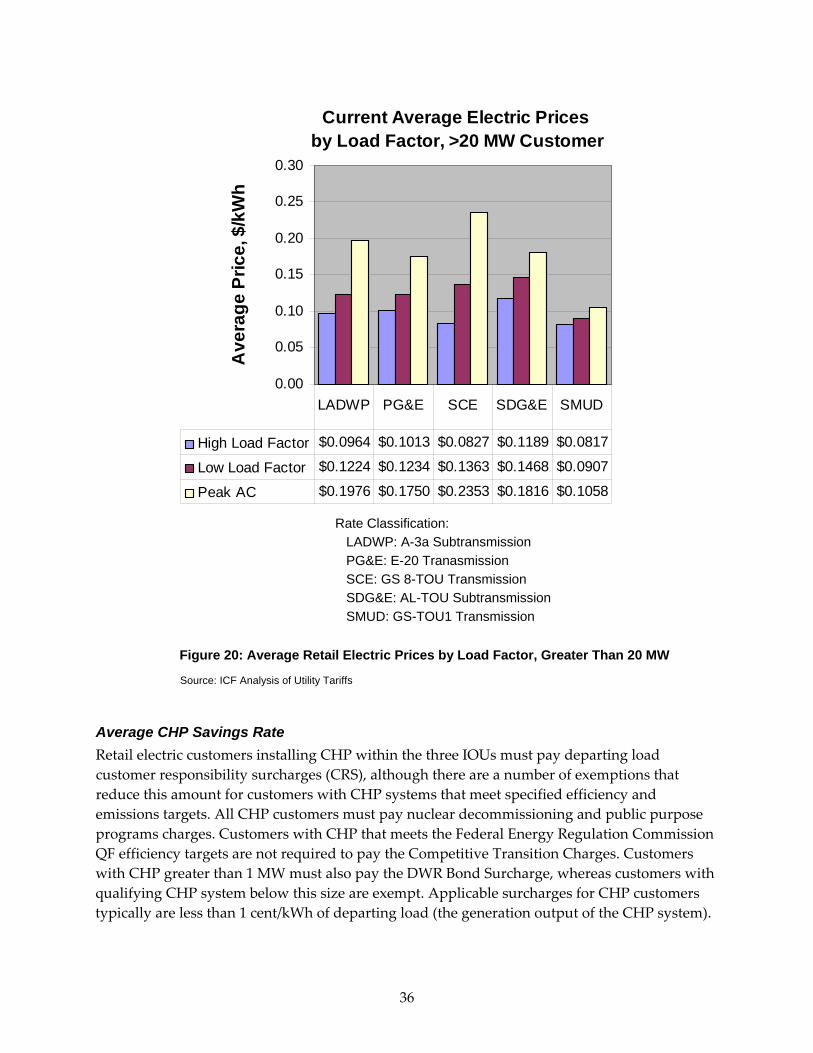
Current Average Electric Prices by Load Factor, >20 MW Customer
0.00
0.05
0.10
0.15
0.20
0.25
0.30
Ave
rage
Pric
e, $
/kW
h
High Load Factor $0.0964 $0.1013 $0.0827 $0.1189 $0.0817
Low Load Factor $0.1224 $0.1234 $0.1363 $0.1468 $0.0907
Peak AC $0.1976 $0.1750 $0.2353 $0.1816 $0.1058
LADWP PG&E SCE SDG&E SMUD
Rate Classification: LADWP: A-3a Subtransmission PG&E: E-20 Tranasmission SCE: GS 8-TOU Transmission SDG&E: AL-TOU Subtransmission SMUD: GS-TOU1 Transmission
Figure 20: Average Retail Electric Prices by Load Factor, Greater Than 20 MW
Source: ICF Analysis of Utility Tariffs
Average CHP Savings Rate Retail electric customers installing CHP within the three IOUs must pay departing load customer responsibility surcharges (CRS), although there are a number of exemptions that reduce this amount for customers with CHP systems that meet specified efficiency and emissions targets. All CHP customers must pay nuclear decommissioning and public purpose programs charges. Customers with CHP that meets the Federal Energy Regulation Commission QF efficiency targets are not required to pay the Competitive Transition Charges. Customers with CHP greater than 1 MW must also pay the DWR Bond Surcharge, whereas customers with qualifying CHP system below this size are exempt. Applicable surcharges for CHP customers typically are less than 1 cent/kWh of departing load (the generation output of the CHP system).
36
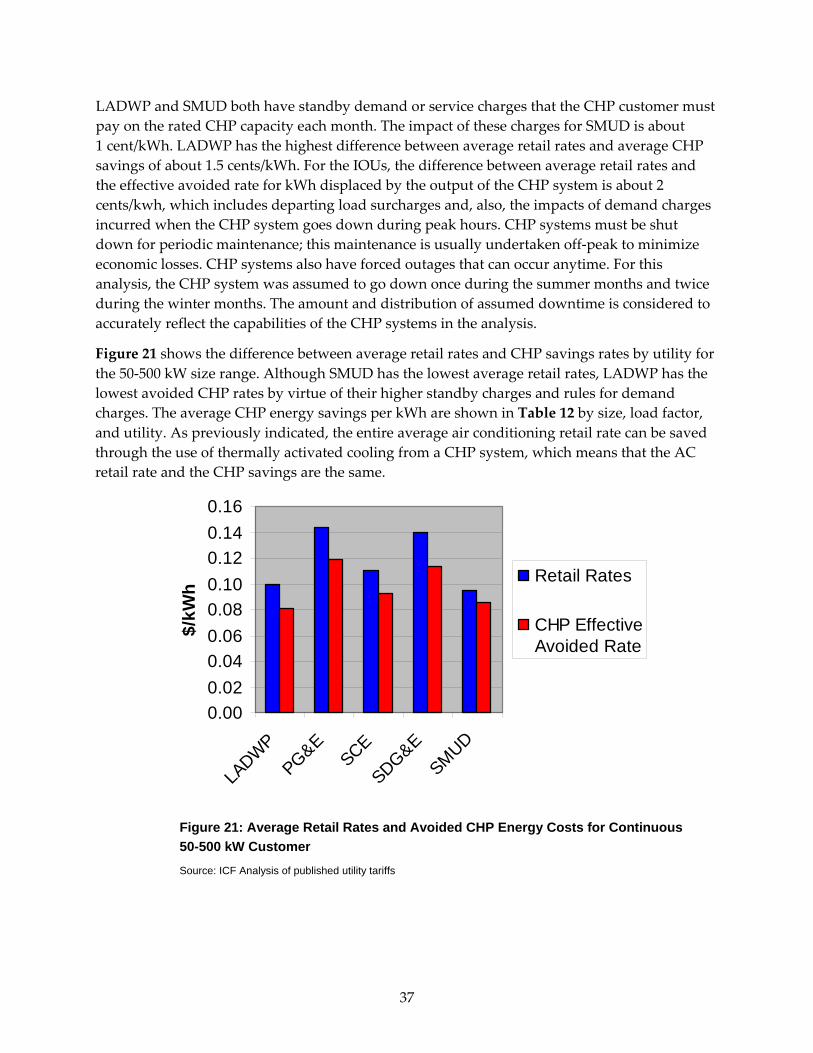
LADWP and SMUD both have standby demand or service charges that the CHP customer must pay on the rated CHP capacity each month. The impact of these charges for SMUD is about 1 cent/kWh. LADWP has the highest difference between average retail rates and average CHP savings of about 1.5 cents/kWh. For the IOUs, the difference between average retail rates and the effective avoided rate for kWh displaced by the output of the CHP system is about 2 cents/kwh, which includes departing load surcharges and, also, the impacts of demand charges incurred when the CHP system goes down during peak hours. CHP systems must be shut down for periodic maintenance; this maintenance is usually undertaken off‐peak to minimize economic losses. CHP systems also have forced outages that can occur anytime. For this analysis, the CHP system was assumed to go down once during the summer months and twice during the winter months. The amount and distribution of assumed downtime is considered to accurately reflect the capabilities of the CHP systems in the analysis.
Figure 21 shows the difference between average retail rates and CHP savings rates by utility for the 50‐500 kW size range. Although SMUD has the lowest average retail rates, LADWP has the lowest avoided CHP rates by virtue of their higher standby charges and rules for demand charges. The average CHP energy savings per kWh are shown in Table 12 by size, load factor, and utility. As previously indicated, the entire average air conditioning retail rate can be saved through the use of thermally activated cooling from a CHP system, which means that the AC retail rate and the CHP savings are the same.
0.000.020.040.060.080.100.120.140.16
LADWP
PG&ESCE
SDG&ESMUD
$/kW
h
Retail Rates
CHP EffectiveAvoided Rate
Figure 21: Average Retail Rates and Avoided CHP Energy Costs for Continuous 50-500 kW Customer
Source: ICF Analysis of published utility tariffs
37
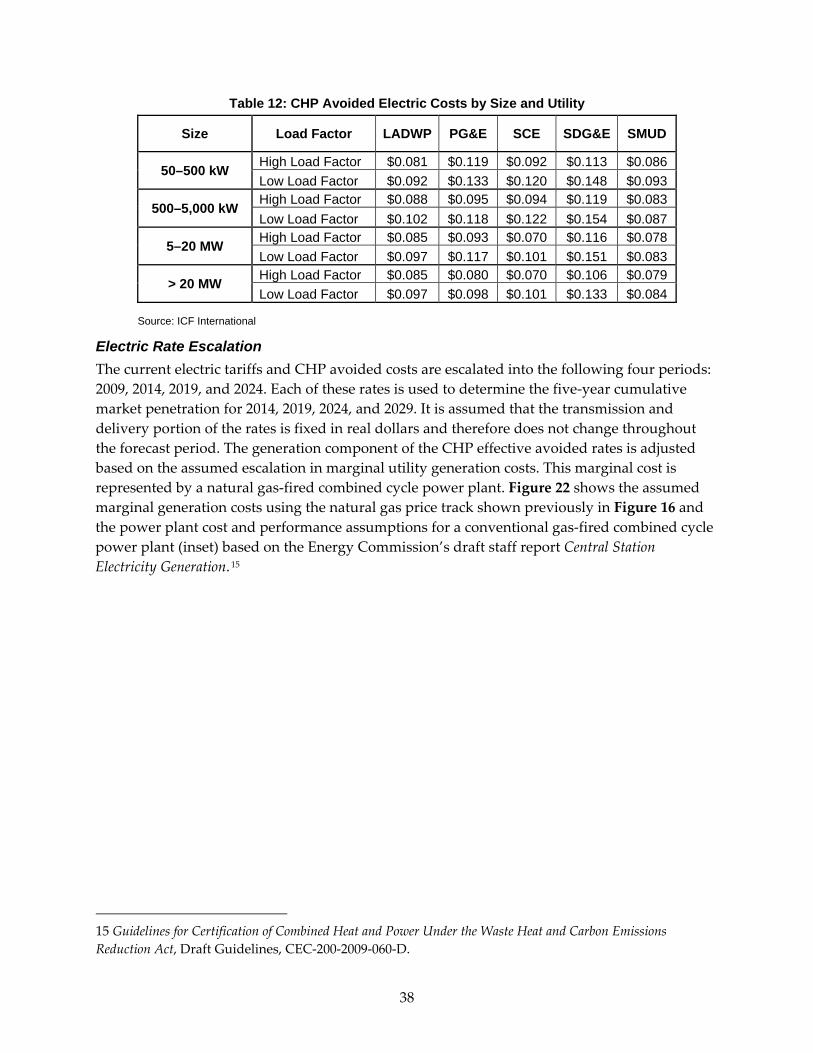
Table 12: CHP Avoided Electric Costs by Size and Utility
Size Load Factor LADWP PG&E SCE SDG&E SMUD
50–500 kW High Load Factor $0.081 $0.119 $0.092 $0.113 $0.086 Low Load Factor $0.092 $0.133 $0.120 $0.148 $0.093
500–5,000 kW High Load Factor $0.088 $0.095 $0.094 $0.119 $0.083 Low Load Factor $0.102 $0.118 $0.122 $0.154 $0.087
5–20 MW High Load Factor $0.085 $0.093 $0.070 $0.116 $0.078 Low Load Factor $0.097 $0.117 $0.101 $0.151 $0.083
> 20 MW High Load Factor $0.085 $0.080 $0.070 $0.106 $0.079 Low Load Factor $0.097 $0.098 $0.101 $0.133 $0.084
Source: ICF International
Electric Rate Escalation The current electric tariffs and CHP avoided costs are escalated into the following four periods: 2009, 2014, 2019, and 2024. Each of these rates is used to determine the five‐year cumulative market penetration for 2014, 2019, 2024, and 2029. It is assumed that the transmission and delivery portion of the rates is fixed in real dollars and therefore does not change throughout the forecast period. The generation component of the CHP effective avoided rates is adjusted based on the assumed escalation in marginal utility generation costs. This marginal cost is represented by a natural gas‐fired combined cycle power plant. Figure 22 shows the assumed marginal generation costs using the natural gas price track shown previously in Figure 16 and the power plant cost and performance assumptions for a conventional gas‐fired combined cycle power plant (inset) based on the Energy Commission’s draft staff report Central Station Electricity Generation. 15
15 Guidelines for Certification of Combined Heat and Power Under the Waste Heat and Carbon Emissions Reduction Act, Draft Guidelines, CEC‐200‐2009‐060‐D.
38
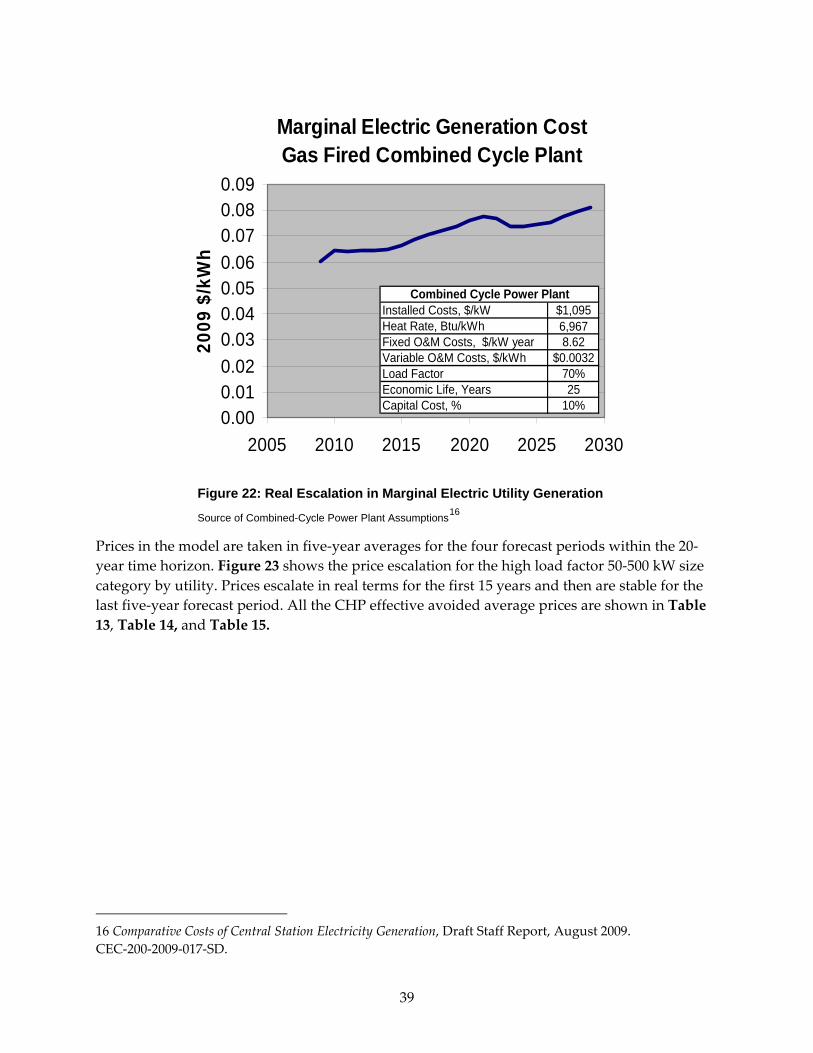
Marginal Electric Generation CostGas Fired Combined Cycle Plant
0.000.010.020.030.040.050.060.070.080.09
2005 2010 2015 2020 2025 2030
2009
$/k
Wh
Installed Costs, $/kW $1,095Heat Rate, Btu/kWh 6,967Fixed O&M Costs, $/kW year 8.62Variable O&M Costs, $/kWh $0.0032Load Factor 70%Economic Life, Years 25Capital Cost, % 10%
Combined Cycle Power Plant
Figure 22: Real Escalation in Marginal Electric Utility Generation
Source of Combined-Cycle Power Plant Assumptions16
Prices in the model are taken in five‐year averages for the four forecast periods within the 20‐year time horizon. Figure 23 shows the price escalation for the high load factor 50‐500 kW size category by utility. Prices escalate in real terms for the first 15 years and then are stable for the last five‐year forecast period. All the CHP effective avoided average prices are shown in Table 13, Table 14, and Table 15.
16 Comparative Costs of Central Station Electricity Generation, Draft Staff Report, August 2009. CEC‐200‐2009‐017‐SD.
39
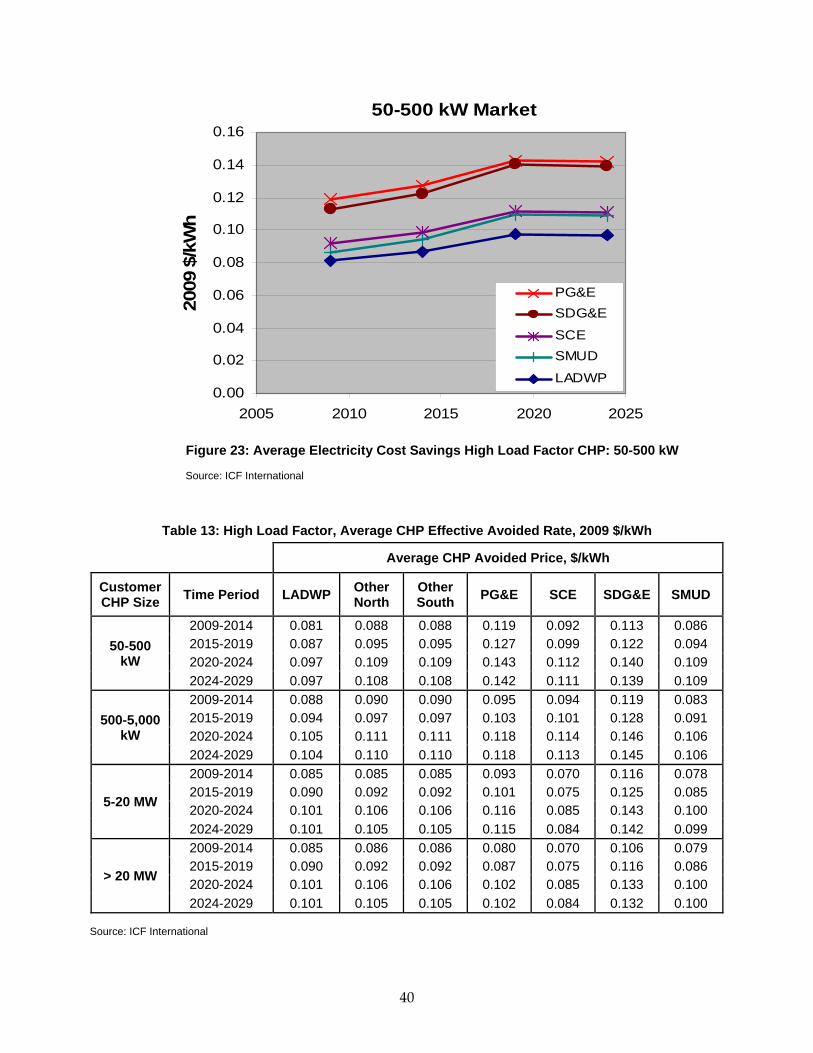
50-500 kW Market
0.00
0.02
0.04
0.06
0.08
0.10
0.12
0.14
0.16
2005 2010 2015 2020 2025
2009
$/k
Wh
PG&ESDG&E
SCESMUD
LADWP
Figure 23: Average Electricity Cost Savings High Load Factor CHP: 50-500 kW
Source: ICF International
Table 13: High Load Factor, Average CHP Effective Avoided Rate, 2009 $/kWh
Average CHP Avoided Price, $/kWh
Customer CHP Size Time Period LADWP Other
North Other South PG&E SCE SDG&E SMUD
50-500 kW
2009-2014 0.081 0.088 0.088 0.119 0.092 0.113 0.086 2015-2019 0.087 0.095 0.095 0.127 0.099 0.122 0.094 2020-2024 0.097 0.109 0.109 0.143 0.112 0.140 0.109 2024-2029 0.097 0.108 0.108 0.142 0.111 0.139 0.109
500-5,000 kW
2009-2014 0.088 0.090 0.090 0.095 0.094 0.119 0.083 2015-2019 0.094 0.097 0.097 0.103 0.101 0.128 0.091 2020-2024 0.105 0.111 0.111 0.118 0.114 0.146 0.106 2024-2029 0.104 0.110 0.110 0.118 0.113 0.145 0.106
5-20 MW
2009-2014 0.085 0.085 0.085 0.093 0.070 0.116 0.078 2015-2019 0.090 0.092 0.092 0.101 0.075 0.125 0.085 2020-2024 0.101 0.106 0.106 0.116 0.085 0.143 0.100 2024-2029 0.101 0.105 0.105 0.115 0.084 0.142 0.099
> 20 MW
2009-2014 0.085 0.086 0.086 0.080 0.070 0.106 0.079 2015-2019 0.090 0.092 0.092 0.087 0.075 0.116 0.086 2020-2024 0.101 0.106 0.106 0.102 0.085 0.133 0.100 2024-2029 0.101 0.105 0.105 0.102 0.084 0.132 0.100
Source: ICF International
40
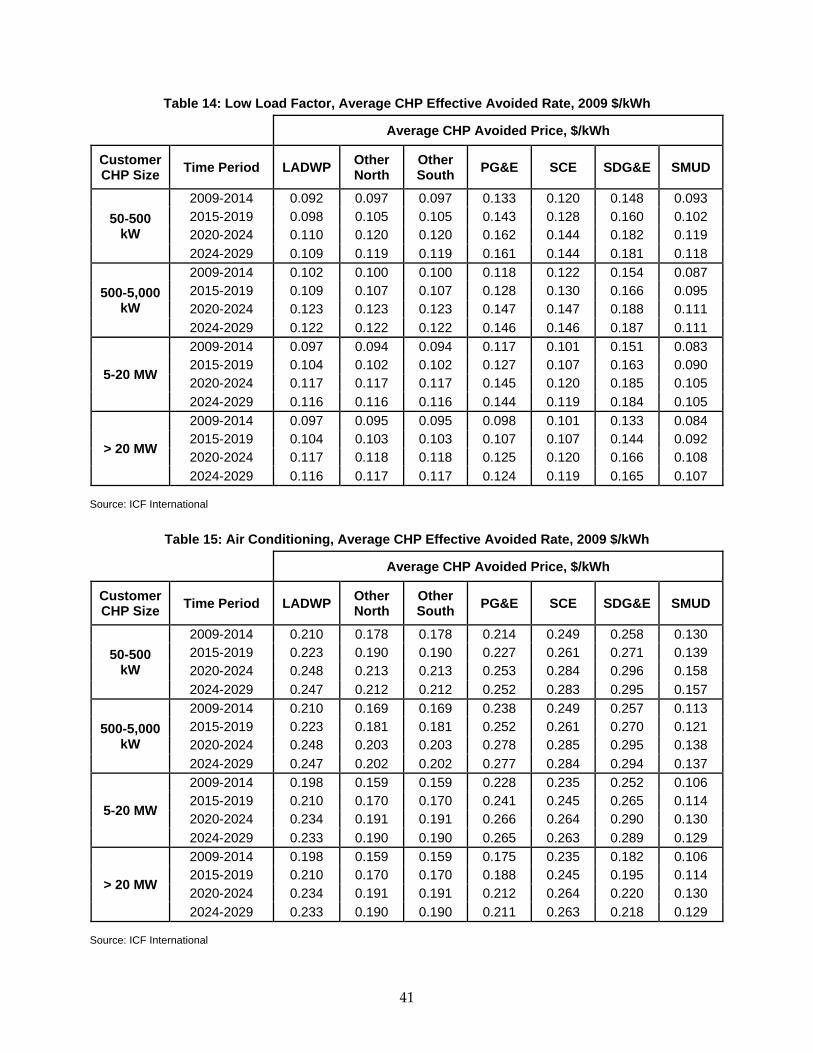
Table 14: Low Load Factor, Average CHP Effective Avoided Rate, 2009 $/kWh
Average CHP Avoided Price, $/kWh
Customer CHP Size Time Period LADWP Other
North Other South PG&E SCE SDG&E SMUD
50-500 kW
2009-2014 0.092 0.097 0.097 0.133 0.120 0.148 0.093 2015-2019 0.098 0.105 0.105 0.143 0.128 0.160 0.102 2020-2024 0.110 0.120 0.120 0.162 0.144 0.182 0.119 2024-2029 0.109 0.119 0.119 0.161 0.144 0.181 0.118
500-5,000 kW
2009-2014 0.102 0.100 0.100 0.118 0.122 0.154 0.087 2015-2019 0.109 0.107 0.107 0.128 0.130 0.166 0.095 2020-2024 0.123 0.123 0.123 0.147 0.147 0.188 0.111 2024-2029 0.122 0.122 0.122 0.146 0.146 0.187 0.111
5-20 MW
2009-2014 0.097 0.094 0.094 0.117 0.101 0.151 0.083 2015-2019 0.104 0.102 0.102 0.127 0.107 0.163 0.090 2020-2024 0.117 0.117 0.117 0.145 0.120 0.185 0.105 2024-2029 0.116 0.116 0.116 0.144 0.119 0.184 0.105
> 20 MW
2009-2014 0.097 0.095 0.095 0.098 0.101 0.133 0.084 2015-2019 0.104 0.103 0.103 0.107 0.107 0.144 0.092 2020-2024 0.117 0.118 0.118 0.125 0.120 0.166 0.108 2024-2029 0.116 0.117 0.117 0.124 0.119 0.165 0.107
Source: ICF International
Table 15: Air Conditioning, Average CHP Effective Avoided Rate, 2009 $/kWh
Average CHP Avoided Price, $/kWh
Customer CHP Size Time Period LADWP Other
North Other South PG&E SCE SDG&E SMUD
50-500 kW
2009-2014 0.210 0.178 0.178 0.214 0.249 0.258 0.130 2015-2019 0.223 0.190 0.190 0.227 0.261 0.271 0.139 2020-2024 0.248 0.213 0.213 0.253 0.284 0.296 0.158 2024-2029 0.247 0.212 0.212 0.252 0.283 0.295 0.157
500-5,000 kW
2009-2014 0.210 0.169 0.169 0.238 0.249 0.257 0.113 2015-2019 0.223 0.181 0.181 0.252 0.261 0.270 0.121 2020-2024 0.248 0.203 0.203 0.278 0.285 0.295 0.138 2024-2029 0.247 0.202 0.202 0.277 0.284 0.294 0.137
5-20 MW
2009-2014 0.198 0.159 0.159 0.228 0.235 0.252 0.106 2015-2019 0.210 0.170 0.170 0.241 0.245 0.265 0.114 2020-2024 0.234 0.191 0.191 0.266 0.264 0.290 0.130 2024-2029 0.233 0.190 0.190 0.265 0.263 0.289 0.129
> 20 MW
2009-2014 0.198 0.159 0.159 0.175 0.235 0.182 0.106 2015-2019 0.210 0.170 0.170 0.188 0.245 0.195 0.114 2020-2024 0.234 0.191 0.191 0.212 0.264 0.220 0.130 2024-2029 0.233 0.190 0.190 0.211 0.263 0.218 0.129
Source: ICF International
41
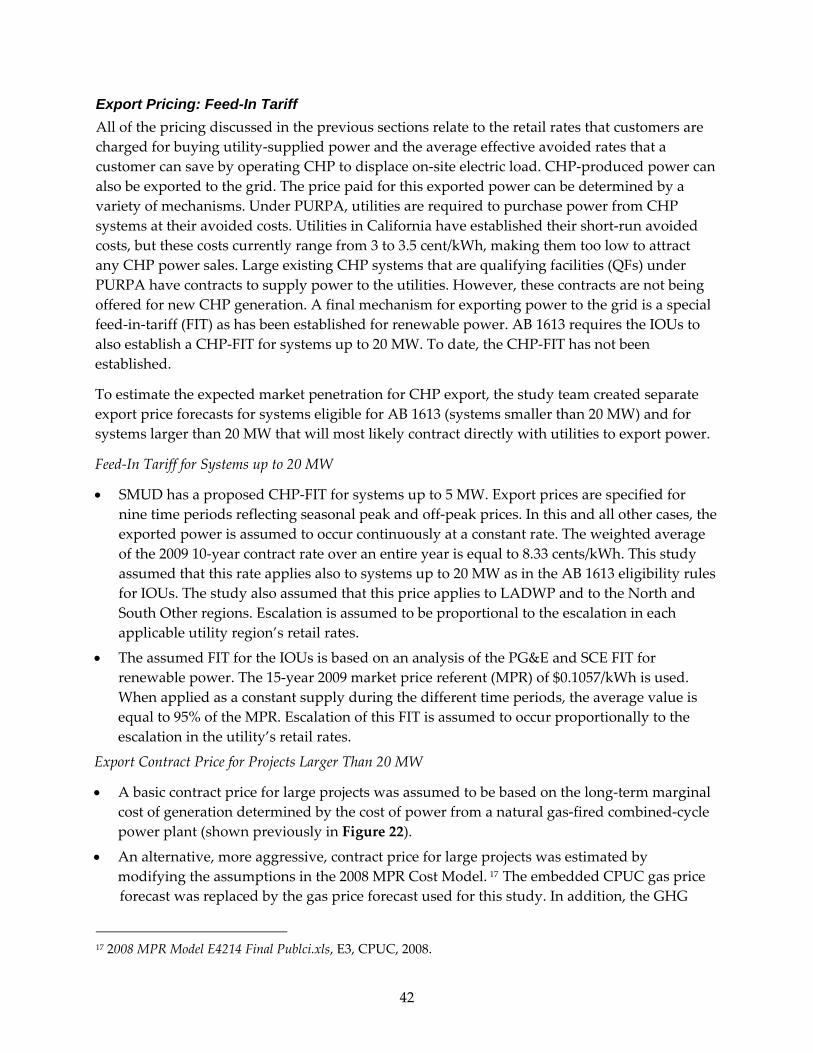
Export Pricing: Feed-In Tariff All of the pricing discussed in the previous sections relate to the retail rates that customers are charged for buying utility‐supplied power and the average effective avoided rates that a customer can save by operating CHP to displace on‐site electric load. CHP‐produced power can also be exported to the grid. The price paid for this exported power can be determined by a variety of mechanisms. Under PURPA, utilities are required to purchase power from CHP systems at their avoided costs. Utilities in California have established their short‐run avoided costs, but these costs currently range from 3 to 3.5 cent/kWh, making them too low to attract any CHP power sales. Large existing CHP systems that are qualifying facilities (QFs) under PURPA have contracts to supply power to the utilities. However, these contracts are not being offered for new CHP generation. A final mechanism for exporting power to the grid is a special feed‐in‐tariff (FIT) as has been established for renewable power. AB 1613 requires the IOUs to also establish a CHP‐FIT for systems up to 20 MW. To date, the CHP‐FIT has not been established.
To estimate the expected market penetration for CHP export, the study team created separate export price forecasts for systems eligible for AB 1613 (systems smaller than 20 MW) and for systems larger than 20 MW that will most likely contract directly with utilities to export power.
Feed‐In Tariff for Systems up to 20 MW
• SMUD has a proposed CHP‐FIT for systems up to 5 MW. Export prices are specified for nine time periods reflecting seasonal peak and off‐peak prices. In this and all other cases, the exported power is assumed to occur continuously at a constant rate. The weighted average of the 2009 10‐year contract rate over an entire year is equal to 8.33 cents/kWh. This study assumed that this rate applies also to systems up to 20 MW as in the AB 1613 eligibility rules for IOUs. The study also assumed that this price applies to LADWP and to the North and South Other regions. Escalation is assumed to be proportional to the escalation in each applicable utility region’s retail rates.
• The assumed FIT for the IOUs is based on an analysis of the PG&E and SCE FIT for renewable power. The 15‐year 2009 market price referent (MPR) of $0.1057/kWh is used. When applied as a constant supply during the different time periods, the average value is equal to 95% of the MPR. Escalation of this FIT is assumed to occur proportionally to the escalation in the utility’s retail rates.
Export Contract Price for Projects Larger Than 20 MW
• A basic contract price for large projects was assumed to be based on the long‐term marginal cost of generation determined by the cost of power from a natural gas‐fired combined‐cycle power plant (shown previously in Figure 22).
• An alternative, more aggressive, contract price for large projects was estimated by modifying the assumptions in the 2008 MPR Cost Model. 17 The embedded CPUC gas price forecast was replaced by the gas price forecast used for this study. In addition, the GHG
17 2008 MPR Model E4214 Final Publci.xls, E3, CPUC, 2008.
42
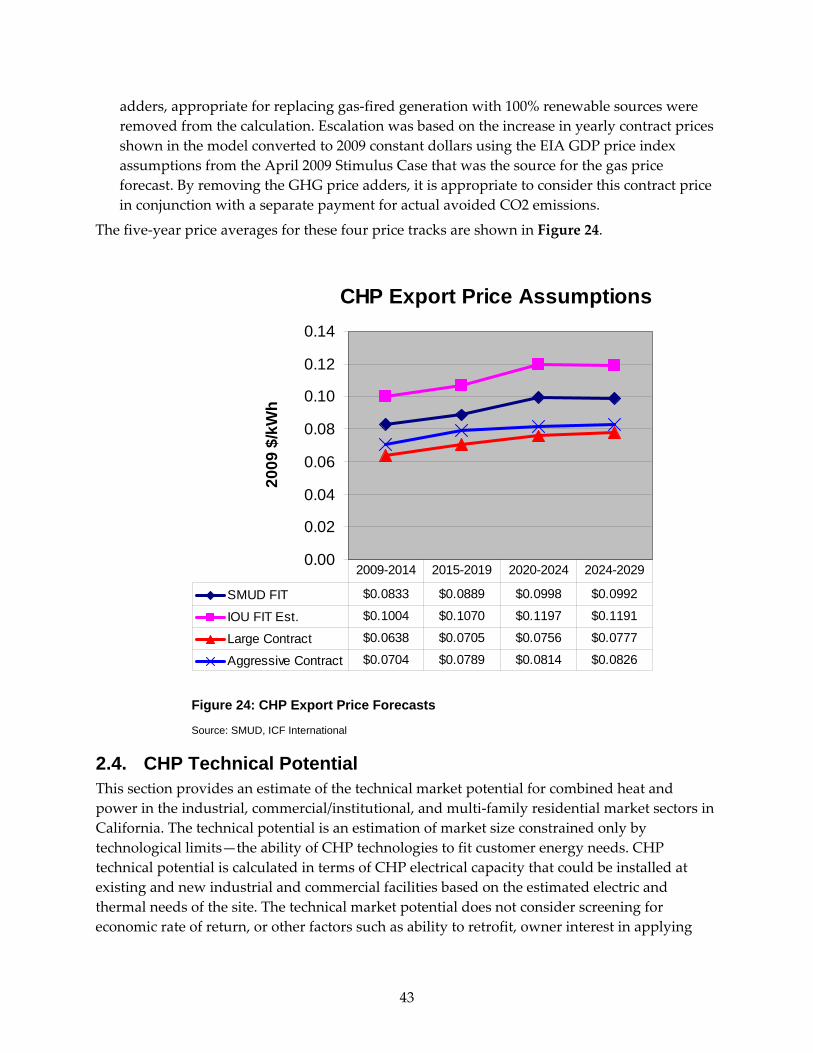
adders, appropriate for replacing gas‐fired generation with 100% renewable sources were removed from the calculation. Escalation was based on the increase in yearly contract prices shown in the model converted to 2009 constant dollars using the EIA GDP price index assumptions from the April 2009 Stimulus Case that was the source for the gas price forecast. By removing the GHG price adders, it is appropriate to consider this contract price in conjunction with a separate payment for actual avoided CO2 emissions.
The five‐year price averages for these four price tracks are shown in Figure 24.
CHP Export Price Assumptions
0.00
0.02
0.04
0.06
0.08
0.10
0.12
0.14
2009
$/k
Wh
SMUD FIT $0.0833 $0.0889 $0.0998 $0.0992
IOU FIT Est. $0.1004 $0.1070 $0.1197 $0.1191
Large Contract $0.0638 $0.0705 $0.0756 $0.0777
Aggressive Contract $0.0704 $0.0789 $0.0814 $0.0826
2009-2014 2015-2019 2020-2024 2024-2029
Figure 24: CHP Export Price Forecasts
Source: SMUD, ICF International
2.4. CHP Technical Potential This section provides an estimate of the technical market potential for combined heat and power in the industrial, commercial/institutional, and multi‐family residential market sectors in California. The technical potential is an estimation of market size constrained only by technological limits—the ability of CHP technologies to fit customer energy needs. CHP technical potential is calculated in terms of CHP electrical capacity that could be installed at existing and new industrial and commercial facilities based on the estimated electric and thermal needs of the site. The technical market potential does not consider screening for economic rate of return, or other factors such as ability to retrofit, owner interest in applying
43
CHP, capital availability, natural gas availability, or variation of energy consumption within customer application/size class.
The technical potential is useful in understanding the potential size and distribution of the target CHP market in the region. Identifying the technical market potential is a preliminary step in the assessment of actual economic market size and ultimate market penetration.
CHP is best applied at facilities that have significant and concurrent electric and thermal demands. In the industrial sector, CHP thermal output has traditionally been in the form of steam used for process heating and for space heating. For commercial and institutional users, thermal output has traditionally been steam or hot water for space heating and potable hot water heating. More recently, CHP has included the provision of space cooling through the use of absorption chillers.
Three different types of CHP markets were included in the evaluation of technical potential:
• Traditional power and heat CHP
• Combined cooling, heating and power (CCHP)
• Export of power produced by CHP
These first two markets were further disaggregated by high load factor and low load factor applications resulting in the analysis of five distinct market segments.
Traditional CHP This market represents CHP applications where the electrical output is used to meet all or a portion of the base load for a facility and the thermal energy is used to provide steam or hot water. The most efficient sizing for CHP is to match thermal output to baseload thermal demand at the site. Depending on the type of facility, the appropriate sizing could be either electric or thermal limited. Industrial facilities often have “excess” thermal load compared to their on‐site electric load, which means the CHP system will generate more power than can be used on‐site if sized to match the thermal load. Commercial facilities almost always have excess electric load compared to their thermal load. Two sub‐categories were considered:
• High load factor applications: This market provides for continuous or nearly continuous operation of the CHP system. It includes all industrial applications and round‐the‐clock commercial/institutional operations such colleges, hospitals, and prisons.
• Low load factor applications: Some commercial and institutional markets provide an opportunity for coincident electric/thermal loads for a period of 3,500 to 5,000 hours per year. This sector includes applications such as office buildings, health clubs, and laundries.
Combined Cooling Heating and Power (CCHP) All or a portion of the thermal output of a CHP system can be converted to air conditioning or refrigeration with the addition of a thermally activated cooling system. This type of system can potentially open up the benefits of CHP to facilities that do not have the year‐round heating load to support a traditional CHP system. A typical CHP system in these applications would
44
provide the annual hot water load, a portion of the space heating load in the winter months and a portion of the cooling load during the summer months. Two sub‐categories were considered:
• Incremental high load factor applications: These markets represent round‐the‐clock commercial/institutional facilities such as hospitals, nursing homes, and hotels that could support traditional CHP, but, with consideration of cooling as an output, could support additional CHP capacity while maintaining a high level of utilization of the thermal energy from the CHP system.
• Low load factor applications. These represent markets such as big box retail, restaurants, and food sales that otherwise could not support traditional CHP due to a lack of thermal load.
CHP Export Market The previous two categories are based on the constraint that all of the thermal and electric energy must be utilized on‐site. Within many large industrial process facilities, there is often enough steam demand such that thermally sized CHP systems produce excess electricity above the facilities’ internal needs, electricity that could be exported to the wholesale power market. The incremental export potential of electrical power from these facilities was quantified and evaluated as a separate market.
2.4.1. Technical Potential Methodology The determination of technical market potential consists of the following elements:
• Identify applications where CHP provides a reasonable fit to the electric and thermal needs of the user. Target applications are identified based on reviewing the electric and thermal energy consumption data for various building types and industrial facilities.
• Quantify the number and size distribution of target applications. Various regional data sources are used to identify the number of target application facilities by sector and by size (electric demand) that meet the thermal and electric load requirements for CHP.
• Estimate CHP potential in terms of megawatt (MW) electric capacity. Total CHP potential is derived for each target application based on the number of target facilities in each size category and CHP sizing criteria appropriate for each application sector.
• Subtract existing CHP from the identified sites to determine the remaining technical market potential.
2.4.2. CHP Target Markets In general, the most efficient and economic CHP operation is achieved when: 1) the system operates at full‐load most of the time (high load factor application), 2) the thermal output can be fully utilized by the site, and 3) the recovered heat displaces fuel or electricity purchases.
There are a number of commercial and industrial applications that characteristically have sufficient and coincident thermal and electric loads for CHP. Examples of these applications include food processing, pulp and paper plants, laundries, and health clubs. Most commercial and light industrial applications have low base thermal loads relative to the electric load, but
45
have high thermal loads in the cooler months for heating. Such applications include hotels, hospitals, nursing homes, college campuses, correctional facilities, and light manufacturing.
In order to identify applications where CHP provides a reasonable fit to the electric and thermal needs of the user, this study reviewed electric and thermal energy (heating and cooling) consumption data for various building types and industrial facilities. Data sources included the DOE EIA Commercial Buildings Energy Consumption Survey (CBECS), the DOE Manufacturing Energy Consumption Survey (MECS), the Major Industrial Plant Database (MIPD), and Commercial Energy Profile Database (CEPD)18, and various market summaries developed by DOE, Gas Technology Institute (GTI), and the American Gas Association. Existing CHP installations in the commercial/institutional and industrial sectors were also reviewed to understand the required profile for CHP applications and to identify target applications.
National level data was analyzed to develop national average electric and thermal demand profiles by application. It is also recognized that regional climate and operating factors can impact both electric and thermal load profiles. This is not as critical an issue for industrial applications because they tend to be more uniform in their operation nationwide than commercial and institutional facilities. Commercial facilities use a high proportion of their purchased energy on heating and cooling, which is highly affected by local weather conditions. Therefore, sources of electric and thermal load data specific to California were also reviewed. The MIPD and CEPD facilities in California were analyzed, along with the existing CHP fleet in California. A key data source for the commercial sector is the California Commercial End‐Use Survey (CEUS), which was used to further refine the commercial sector’s electricity and thermal demand estimates to be more indicative of a California climate.
CHP system sizing for the three markets previously identified is based on matching to appropriate thermal loads:
• Traditional CHP – Size the CHP system for the base thermal load (domestic hot water, pool heating, showers, laundries, kitchens), which usually results in a system sized below the base electric load for commercial facilities. For many industrial facilities, the CHP system is sized to the process steam or hat water load but may be capped by the electric demand at the site (i.e., thermal demand could support a larger CHP system).
• Combined Cooling Heating and Power (CCHP) – Size the CHP system to include thermally activated cooling to create additional thermal use during the cooling months that when combined with space heating justifies a larger CHP system that better matches the electric demand in certain commercial and institutional applications.
• Export CHP – Size the CHP system to meet the entire thermal load at an industrial facility, with excess electricity generation being exported to the grid. The previous two categories are based on the assumption that all of the thermal and electric energy is utilized on‐site. Within large industrial process facilities, there is often excess steam demand that could
18 The Major Industrial Plant Database (IMIPD) and Commercial Energy Profile Database (CEPD) are private databases that contain site‐specific energy estimates for industrial and commercial facilities. Both are offered by HIS Inc.
46
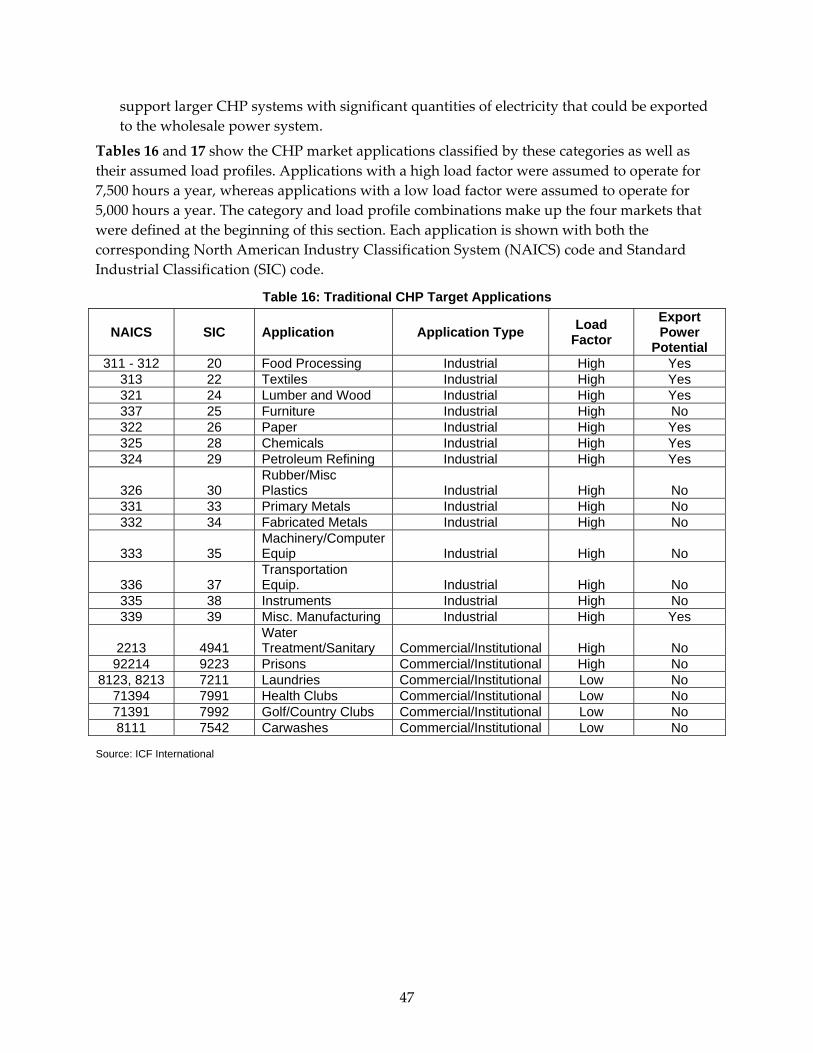
support larger CHP systems with significant quantities of electricity that could be exported to the wholesale power system.
Tables 16 and 17 show the CHP market applications classified by these categories as well as their assumed load profiles. Applications with a high load factor were assumed to operate for 7,500 hours a year, whereas applications with a low load factor were assumed to operate for 5,000 hours a year. The category and load profile combinations make up the four markets that were defined at the beginning of this section. Each application is shown with both the corresponding North American Industry Classification System (NAICS) code and Standard Industrial Classification (SIC) code.
Table 16: Traditional CHP Target Applications
NAICS SIC Application Application Type Load Factor
Export Power
Potential 311 - 312 20 Food Processing Industrial High Yes
313 22 Textiles Industrial High Yes 321 24 Lumber and Wood Industrial High Yes 337 25 Furniture Industrial High No 322 26 Paper Industrial High Yes 325 28 Chemicals Industrial High Yes 324 29 Petroleum Refining Industrial High Yes
326 30 Rubber/Misc Plastics Industrial High No
331 33 Primary Metals Industrial High No 332 34 Fabricated Metals Industrial High No
333 35 Machinery/Computer Equip Industrial High No
336 37 Transportation Equip. Industrial High No
335 38 Instruments Industrial High No 339 39 Misc. Manufacturing Industrial High Yes
2213 4941 Water Treatment/Sanitary Commercial/Institutional High No
92214 9223 Prisons Commercial/Institutional High No 8123, 8213 7211 Laundries Commercial/Institutional Low No
71394 7991 Health Clubs Commercial/Institutional Low No 71391 7992 Golf/Country Clubs Commercial/Institutional Low No 8111 7542 Carwashes Commercial/Institutional Low No
Source: ICF International
47
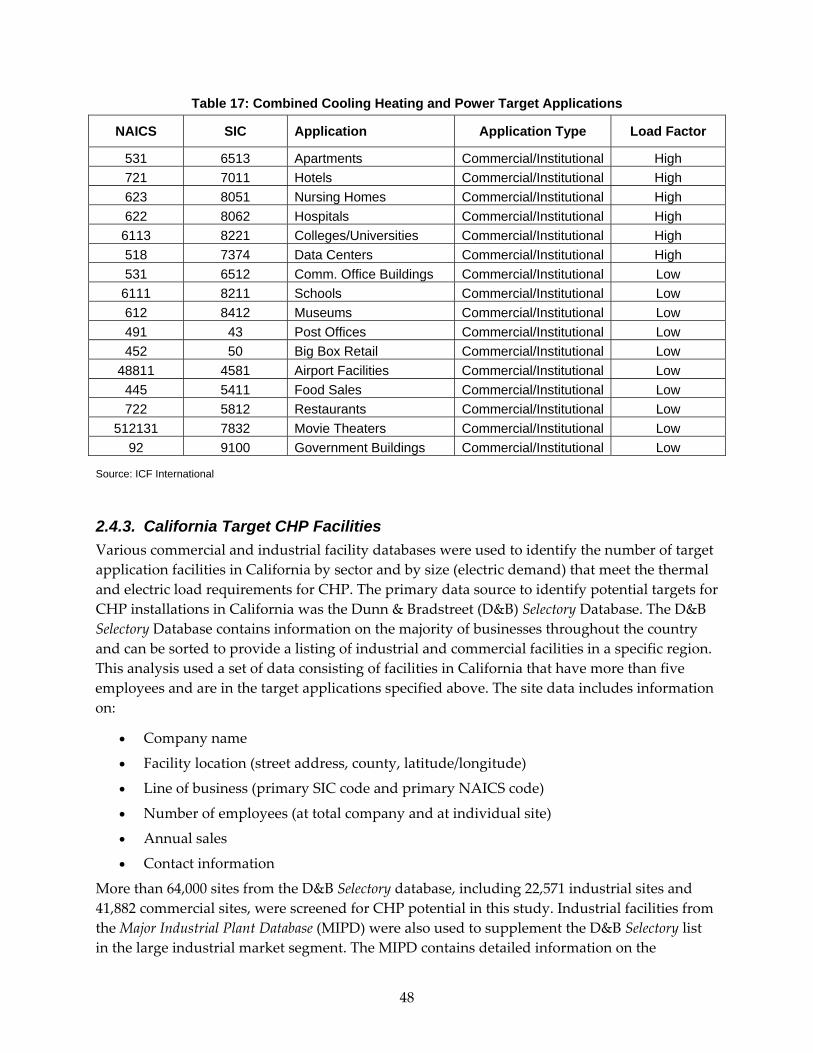
Table 17: Combined Cooling Heating and Power Target Applications
NAICS SIC Application Application Type Load Factor
531 6513 Apartments Commercial/Institutional High 721 7011 Hotels Commercial/Institutional High 623 8051 Nursing Homes Commercial/Institutional High 622 8062 Hospitals Commercial/Institutional High
6113 8221 Colleges/Universities Commercial/Institutional High 518 7374 Data Centers Commercial/Institutional High 531 6512 Comm. Office Buildings Commercial/Institutional Low
6111 8211 Schools Commercial/Institutional Low 612 8412 Museums Commercial/Institutional Low 491 43 Post Offices Commercial/Institutional Low 452 50 Big Box Retail Commercial/Institutional Low
48811 4581 Airport Facilities Commercial/Institutional Low 445 5411 Food Sales Commercial/Institutional Low 722 5812 Restaurants Commercial/Institutional Low
512131 7832 Movie Theaters Commercial/Institutional Low 92 9100 Government Buildings Commercial/Institutional Low
Source: ICF International
2.4.3. California Target CHP Facilities Various commercial and industrial facility databases were used to identify the number of target application facilities in California by sector and by size (electric demand) that meet the thermal and electric load requirements for CHP. The primary data source to identify potential targets for CHP installations in California was the Dunn & Bradstreet (D&B) Selectory Database. The D&B Selectory Database contains information on the majority of businesses throughout the country and can be sorted to provide a listing of industrial and commercial facilities in a specific region. This analysis used a set of data consisting of facilities in California that have more than five employees and are in the target applications specified above. The site data includes information on:
• Company name
• Facility location (street address, county, latitude/longitude)
• Line of business (primary SIC code and primary NAICS code)
• Number of employees (at total company and at individual site)
• Annual sales
• Contact information
More than 64,000 sites from the D&B Selectory database, including 22,571 industrial sites and 41,882 commercial sites, were screened for CHP potential in this study. Industrial facilities from the Major Industrial Plant Database (MIPD) were also used to supplement the D&B Selectory list in the large industrial market segment. The MIPD contains detailed information on the
48
electricity use and boiler fuel use profiles of 4,964 industrial facilities in California. These two data sources were combined by matching the site names and locations and directly using the MIPD energy data where there was a match. This process resulted in about 100 of the largest industrial plants in the state using detailed electric and steam data from MIPD. The largest 40 industrial plants in the combined list were also independently checked to corroborate the electric and boiler fuel data contained in MIPD and the estimated values calculated through the methodology detailed below. Special attention was also paid to the large refineries to make sure that the estimates for additional CHP potential were consistent with current refining industry assumptions.
2.4.4. Quantify Electric and Thermal Loads for CHP Target Applications In order to estimate the total technical potential for CHP in California, each of the target facilities needs to have a hypothetical CHP system sized to its electrical and thermal loads. The sum of all the individual CHP system capacities would then result in the overall total CHP potential for the state.
Electric Load Estimation The electric requirements for each of the approximately 64,000 facilities in California were estimated based on either electricity consumption factors applied to the number of employees for each site identified through the D&B databases, or the specific electric consumption estimates for sites identified through MIPD. To estimate the electric consumption based on number of employees, an algorithm was used to assign an annual kWh consumption figure per employee for each NAICS code. This algorithm, originally developed for a previous national market assessment of distributed energy potential, was modified to reflect California‐specific conditions based on information contained in the California Commercial End‐Use Survey (CEUS) and the California Energy Consumption Data Managements System (ECDMS).
The national level electricity consumption per employee estimates were developed from several sources. For mining industry NAICS codes, total annual electricity consumption and total number of employees by six‐digit NAICS code were obtained from the 2002 Census of Mining.19 For manufacturing industry NAICS codes, total annual electricity consumption and total number of employees by six‐digit NAICS code were obtained from the 2002 Census of Manufacturing.20 Industrial facility NAICS codes were further modified by the percent of energy used for HVAC uses by three‐digit NAICS code from EIA’s Manufacturing Energy Consumption Survey (MECS).21
For the commercial NAICS codes, a private dataset, the D&B Sales & Marketing Solutions’ 2003 MarketPlace database, was utilized. The MarketPlace database included estimates of total annual electricity consumption and number of employees by four‐digit SIC code for most of the commercial sector. (These four‐digit SIC codes were converted to three‐, four‐, and six‐digit NAICS codes.) This data was used to assign kWh per employee estimates for each application.
19 2002 US Census of Mining: http://www.census.gov/econ/census02/guide/INDRPT21.HTM 20 2002 US Census of Manufacturing: http://www.census.gov/econ/census02/guide/INDRPT31.HTM 21 EIA MECS: http://www.eia.doe.gov/emeu/mecs/contents.html
49
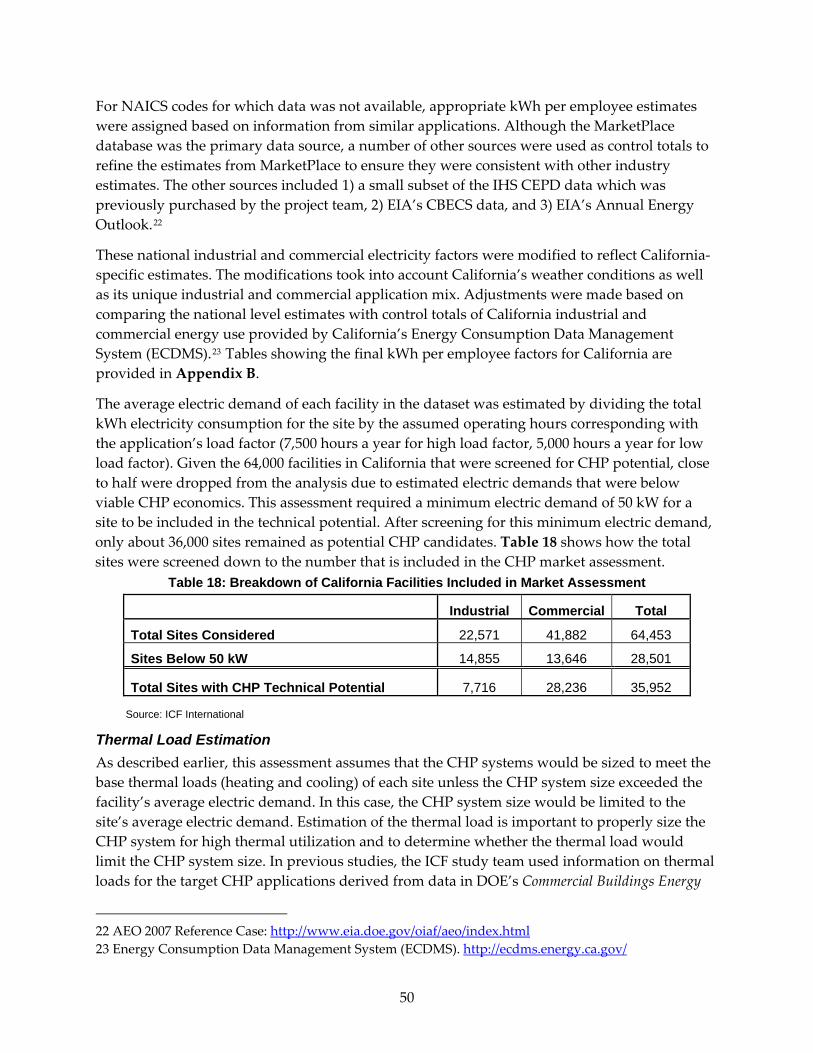
For NAICS codes for which data was not available, appropriate kWh per employee estimates were assigned based on information from similar applications. Although the MarketPlace database was the primary data source, a number of other sources were used as control totals to refine the estimates from MarketPlace to ensure they were consistent with other industry estimates. The other sources included 1) a small subset of the IHS CEPD data which was previously purchased by the project team, 2) EIA’s CBECS data, and 3) EIA’s Annual Energy Outlook.22
These national industrial and commercial electricity factors were modified to reflect California‐specific estimates. The modifications took into account California’s weather conditions as well as its unique industrial and commercial application mix. Adjustments were made based on comparing the national level estimates with control totals of California industrial and commercial energy use provided by California’s Energy Consumption Data Management System (ECDMS).23 Tables showing the final kWh per employee factors for California are provided in Appendix B.
The average electric demand of each facility in the dataset was estimated by dividing the total kWh electricity consumption for the site by the assumed operating hours corresponding with the application’s load factor (7,500 hours a year for high load factor, 5,000 hours a year for low load factor). Given the 64,000 facilities in California that were screened for CHP potential, close to half were dropped from the analysis due to estimated electric demands that were below viable CHP economics. This assessment required a minimum electric demand of 50 kW for a site to be included in the technical potential. After screening for this minimum electric demand, only about 36,000 sites remained as potential CHP candidates. Table 18 shows how the total sites were screened down to the number that is included in the CHP market assessment.
Table 18: Breakdown of California Facilities Included in Market Assessment
Industrial Commercial Total
Total Sites Considered 22,571 41,882 64,453
Sites Below 50 kW 14,855 13,646 28,501
Total Sites with CHP Technical Potential 7,716 28,236 35,952
Source: ICF International
Thermal Load Estimation As described earlier, this assessment assumes that the CHP systems would be sized to meet the base thermal loads (heating and cooling) of each site unless the CHP system size exceeded the facility’s average electric demand. In this case, the CHP system size would be limited to the site’s average electric demand. Estimation of the thermal load is important to properly size the CHP system for high thermal utilization and to determine whether the thermal load would limit the CHP system size. In previous studies, the ICF study team used information on thermal loads for the target CHP applications derived from data in DOE’s Commercial Buildings Energy
22 AEO 2007 Reference Case: http://www.eia.doe.gov/oiaf/aeo/index.html 23 Energy Consumption Data Management System (ECDMS). http://ecdms.energy.ca.gov/
50

Consumption Survey (CBECS), and Manufacturing Energy Consumption Survey (MECS), the Major Industrial Plant Database (MIPD), and Commercial Energy Profile Database (CEPD), as well as studies of industrial electric and thermal profiles developed by DOE, Gas Technology Institute (GTI), and the American Gas Association. These data sources provided sufficient information on the end‐use energy consumption in commercial and industrial facilities such that average power‐to‐heat ratio factors for each target application could be developed. Application specific power‐to‐heat ratios are applied to the electricity consumption estimates developed for each potential CHP target site to quantify the thermal load at each site.
National level data gives a national average power‐to‐heat ratio by application rate and does not account for regional factors. This is not a critical issue for industrial applications because most of the thermal use by industrial facilities goes to process demands and is not as greatly impacted by local conditions. However, commercial facilities use a high proportion of their thermal energy on heating and cooling, which is highly affected by local weather conditions. Therefore, sources of electric and thermal load data specific to California businesses were also reviewed. The MIPD and CEPD data for California were analyzed, along with the existing CHP fleet in California. A key data source for the commercial sector is the California Commercial End‐Use Survey (CEUS)24, which was used to modify the commercial application power‐to‐heat ratios to be more indicative of a California climate. CEUS is a survey of commercial sector energy use that captures detailed building systems data, electricity and gas usage, thermal shell characteristics, equipment inventories, operating schedules, and other commercial building characteristics. The survey covered approximately 2,800 commercial facilities located within the service areas of PG&E, SDG&E, SCE, Southern California Gas Company and SMUD. Specialized software used the survey data to create end‐use load profiles and electricity and natural gas consumption estimates by end use for commercial market segments. CEUS provides energy intensity data on the amount of electricity and natural gas that commercial facilities use per square foot of building space by end use. CEUS includes detailed data on the electric and natural gas usage patterns for:
• Small office buildings
• Large office buildings
• Restaurants
• Retail establishments
• Food stores
• Refrigerated warehouses
• Unrefrigerated warehouses
• Schools
• Colleges
• Health care facilities
• Lodging 24 California Commercial End‐Use Survey (CEUS). http://www.energy.ca.gov/ceus/
51
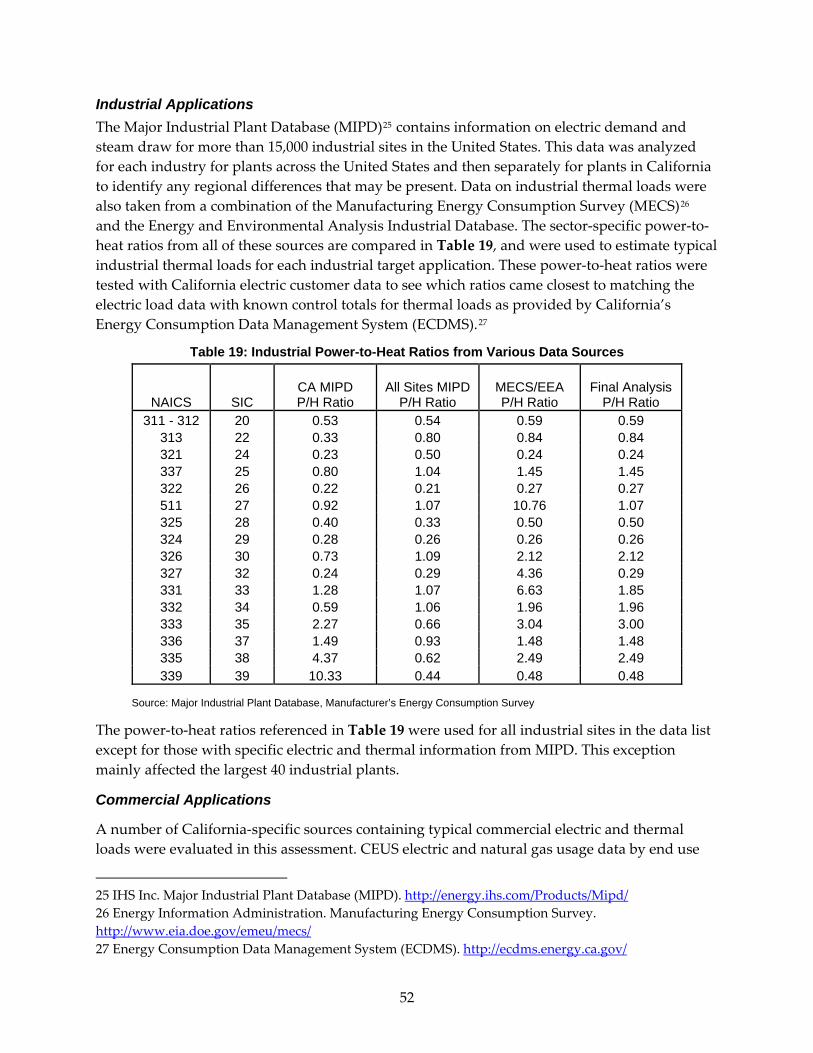
Industrial Applications The Major Industrial Plant Database (MIPD)25 contains information on electric demand and steam draw for more than 15,000 industrial sites in the United States. This data was analyzed for each industry for plants across the United States and then separately for plants in California to identify any regional differences that may be present. Data on industrial thermal loads were also taken from a combination of the Manufacturing Energy Consumption Survey (MECS)26 and the Energy and Environmental Analysis Industrial Database. The sector‐specific power‐to‐heat ratios from all of these sources are compared in Table 19, and were used to estimate typindustrial thermal loads for each industrial target application. These power‐to‐heat ratios were tested with California electric customer data to see which ratios came closest to matching the electric load data with known control totals for thermal loads as provided by California’s Energy Consumption Data Management System (ECDMS).
ical
27
Table 19: Industrial Power-to-Heat Ratios from Various Data Sources
NAICS SIC CA MIPD P/H Ratio
All Sites MIPD P/H Ratio
MECS/EEA P/H Ratio
Final Analysis P/H Ratio
311 - 312 20 0.53 0.54 0.59 0.59 313 22 0.33 0.80 0.84 0.84 321 24 0.23 0.50 0.24 0.24 337 25 0.80 1.04 1.45 1.45 322 26 0.22 0.21 0.27 0.27 511 27 0.92 1.07 10.76 1.07 325 28 0.40 0.33 0.50 0.50 324 29 0.28 0.26 0.26 0.26 326 30 0.73 1.09 2.12 2.12 327 32 0.24 0.29 4.36 0.29 331 33 1.28 1.07 6.63 1.85 332 34 0.59 1.06 1.96 1.96 333 35 2.27 0.66 3.04 3.00 336 37 1.49 0.93 1.48 1.48 335 38 4.37 0.62 2.49 2.49 339 39 10.33 0.44 0.48 0.48
Source: Major Industrial Plant Database, Manufacturer’s Energy Consumption Survey
The power‐to‐heat ratios referenced in Table 19 were used for all industrial sites in the data list except for those with specific electric and thermal information from MIPD. This exception mainly affected the largest 40 industrial plants.
Commercial Applications
A number of California‐specific sources containing typical commercial electric and thermal loads were evaluated in this assessment. CEUS electric and natural gas usage data by end use
25 IHS Inc. Major Industrial Plant Database (MIPD). http://energy.ihs.com/Products/Mipd/ 26 Energy Information Administration. Manufacturing Energy Consumption Survey. http://www.eia.doe.gov/emeu/mecs/ 27 Energy Consumption Data Management System (ECDMS). http://ecdms.energy.ca.gov/
52
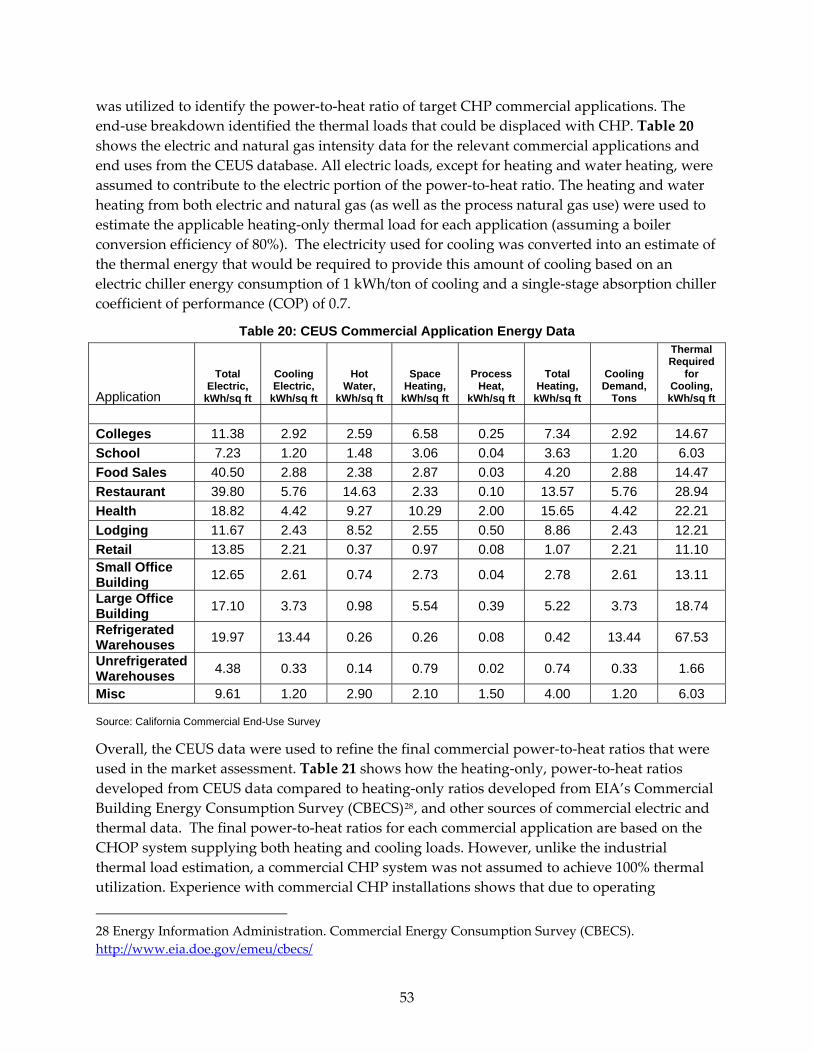
was utilized to identify the power‐to‐heat ratio of target CHP commercial applications. The end‐use breakdown identified the thermal loads that could be displaced with CHP. Table 20 shows the electric and natural gas intensity data for the relevant commercial applications and end uses from the CEUS database. All electric loads, except for heating and water heating, were assumed to contribute to the electric portion of the power‐to‐heat ratio. The heating and water heating from both electric and natural gas (as well as the process natural gas use) were used to estimate the applicable heating‐only thermal load for each application (assuming a boiler conversion efficiency of 80%). The electricity used for cooling was converted into an estimate of the thermal energy that would be required to provide this amount of cooling based on an electric chiller energy consumption of 1 kWh/ton of cooling and a single‐stage absorption chiller coefficient of performance (COP) of 0.7.
Table 20: CEUS Commercial Application Energy Data
Application
Total Electric,
kWh/sq ft
Cooling Electric,
kWh/sq ft
Hot Water,
kWh/sq ft
Space Heating,
kWh/sq ft
Process Heat,
kWh/sq ft
Total Heating,
kWh/sq ft
Cooling Demand,
Tons
Thermal Required
for Cooling, kWh/sq ft
Colleges 11.38 2.92 2.59 6.58 0.25 7.34 2.92 14.67 School 7.23 1.20 1.48 3.06 0.04 3.63 1.20 6.03 Food Sales 40.50 2.88 2.38 2.87 0.03 4.20 2.88 14.47 Restaurant 39.80 5.76 14.63 2.33 0.10 13.57 5.76 28.94 Health 18.82 4.42 9.27 10.29 2.00 15.65 4.42 22.21 Lodging 11.67 2.43 8.52 2.55 0.50 8.86 2.43 12.21 Retail 13.85 2.21 0.37 0.97 0.08 1.07 2.21 11.10 Small Office Building 12.65 2.61 0.74 2.73 0.04 2.78 2.61 13.11
Large Office Building 17.10 3.73 0.98 5.54 0.39 5.22 3.73 18.74
Refrigerated Warehouses 19.97 13.44 0.26 0.26 0.08 0.42 13.44 67.53
Unrefrigerated Warehouses 4.38 0.33 0.14 0.79 0.02 0.74 0.33 1.66
Misc 9.61 1.20 2.90 2.10 1.50 4.00 1.20 6.03
Source: California Commercial End-Use Survey
Overall, the CEUS data were used to refine the final commercial power‐to‐heat ratios that were used in the market assessment. Table 21 shows how the heating‐only, power‐to‐heat ratios developed from CEUS data compared to heating‐only ratios developed from EIA’s Commercial Building Energy Consumption Survey (CBECS)28, and other sources of commercial electric and thermal data. The final power‐to‐heat ratios for each commercial application are based on the CHOP system supplying both heating and cooling loads. However, unlike the industrial thermal load estimation, a commercial CHP system was not assumed to achieve 100% thermal utilization. Experience with commercial CHP installations shows that due to operating
28 Energy Information Administration. Commercial Energy Consumption Survey (CBECS). http://www.eia.doe.gov/emeu/cbecs/
53
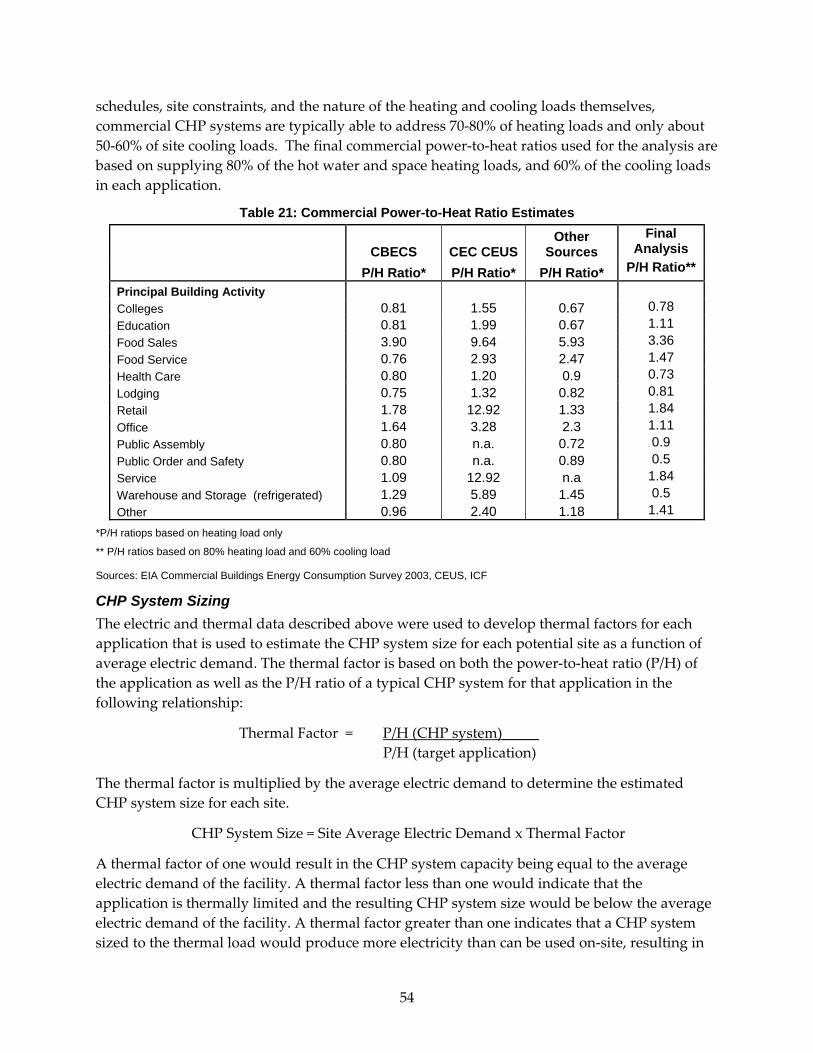
schedules, site constraints, and the nature of the heating and cooling loads themselves, commercial CHP systems are typically able to address 70‐80% of heating loads and only about 50‐60% of site cooling loads. The final commercial power‐to‐heat ratios used for the analysis are based on supplying 80% of the hot water and space heating loads, and 60% of the cooling loads in each application.
Table 21: Commercial Power-to-Heat Ratio Estimates
CBECS CEC CEUSOther
Sources Final
Analysis
P/H Ratio* P/H Ratio* P/H Ratio* P/H Ratio**
Principal Building Activity Colleges 0.81 1.55 0.67 0.78 Education 0.81 1.99 0.67 1.11 Food Sales 3.90 9.64 5.93 3.36 Food Service 0.76 2.93 2.47 1.47 Health Care 0.80 1.20 0.9 0.73 Lodging 0.75 1.32 0.82 0.81 Retail 1.78 12.92 1.33 1.84 Office 1.64 3.28 2.3 1.11 Public Assembly 0.80 n.a. 0.72 0.9 Public Order and Safety 0.80 n.a. 0.89 0.5 Service 1.09 12.92 n.a 1.84 Warehouse and Storage (refrigerated) 1.29 5.89 1.45 0.5 Other 0.96 2.40 1.18 1.41
*P/H ratiops based on heating load only
** P/H ratios based on 80% heating load and 60% cooling load
Sources: EIA Commercial Buildings Energy Consumption Survey 2003, CEUS, ICF
CHP System Sizing The electric and thermal data described above were used to develop thermal factors for each application that is used to estimate the CHP system size for each potential site as a function of average electric demand. The thermal factor is based on both the power‐to‐heat ratio (P/H) of the application as well as the P/H ratio of a typical CHP system for that application in the following relationship:
Thermal Factor = P/H (CHP system)_____ P/H (target application)
The thermal factor is multiplied by the average electric demand to determine the estimated CHP system size for each site.
CHP System Size = Site Average Electric Demand x Thermal Factor
A thermal factor of one would result in the CHP system capacity being equal to the average electric demand of the facility. A thermal factor less than one would indicate that the application is thermally limited and the resulting CHP system size would be below the average electric demand of the facility. A thermal factor greater than one indicates that a CHP system sized to the thermal load would produce more electricity than can be used on‐site, resulting in
54
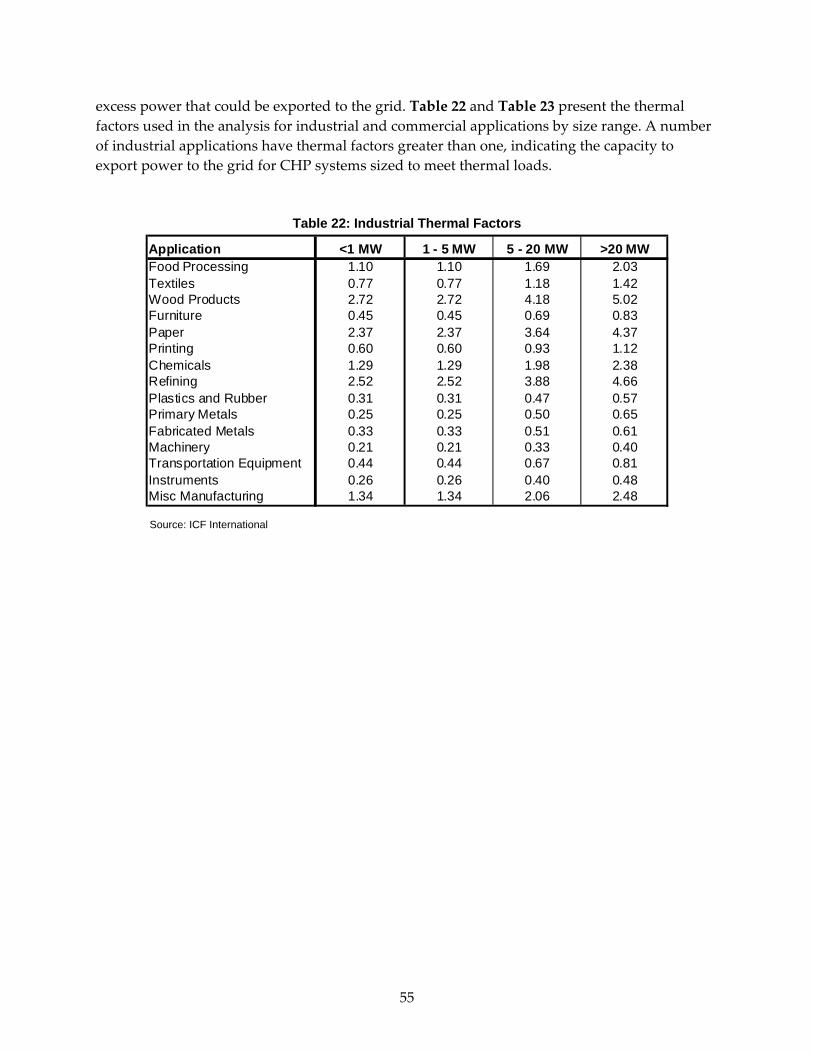
excess power that could be exported to the grid. Table 22 and Table 23 present the thermal factors used in the analysis for industrial and commercial applications by size range. A number of industrial applications have thermal factors greater than one, indicating the capacity to export power to the grid for CHP systems sized to meet thermal loads.
Table 22: Industrial Thermal Factors
Application <1 MW 1 - 5 MW 5 - 20 MW >20 MWFood Processing 1.10 1.10 1.69 2.03Textiles 0.77 0.77 1.18 1.42Wood Products 2.72 2.72 4.18 5.02Furniture 0.45 0.45 0.69 0.83Paper 2.37 2.37 3.64 4.37Printing 0.60 0.60 0.93 1.12Chemicals 1.29 1.29 1.98 2.38Refining 2.52 2.52 3.88 4.66Plastics and Rubber 0.31 0.31 0.47 0.57Primary Metals 0.25 0.25 0.50 0.65Fabricated Metals 0.33 0.33 0.51 0.61Machinery 0.21 0.21 0.33 0.40Transportation Equipment 0.44 0.44 0.67 0.81Instruments 0.26 0.26 0.40 0.48Misc Manufacturing 1.34 1.34 2.06 2.48 Source: ICF International
55
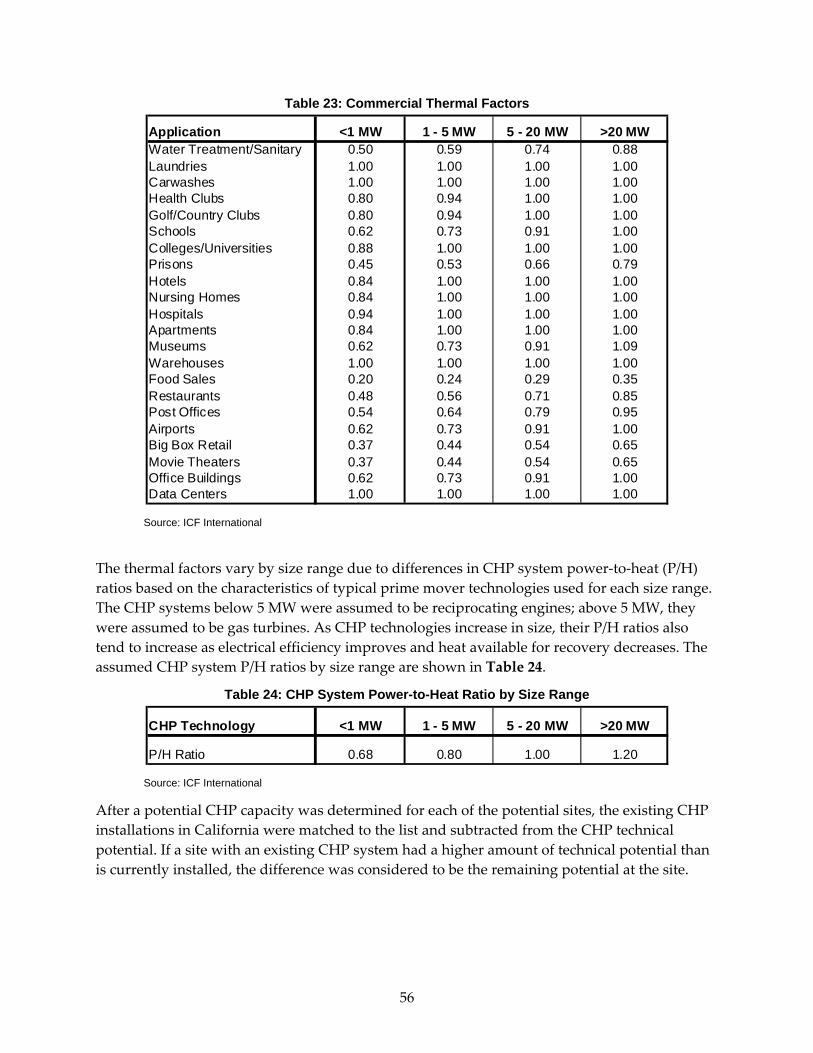
Table 23: Commercial Thermal Factors
Application <1 MW 1 - 5 MW 5 - 20 MW >20 MWWater Treatment/Sanitary 0.50 0.59 0.74 0.88Laundries 1.00 1.00 1.00 1.00Carwashes 1.00 1.00 1.00 1.00Health Clubs 0.80 0.94 1.00 1.00Golf/Country Clubs 0.80 0.94 1.00 1.00Schools 0.62 0.73 0.91 1.00Colleges/Universities 0.88 1.00 1.00 1.00Prisons 0.45 0.53 0.66 0.79Hotels 0.84 1.00 1.00 1.00Nursing Homes 0.84 1.00 1.00 1.00Hospitals 0.94 1.00 1.00 1.00Apartments 0.84 1.00 1.00 1.00Museums 0.62 0.73 0.91 1.09Warehouses 1.00 1.00 1.00 1.00Food Sales 0.20 0.24 0.29 0.35Restaurants 0.48 0.56 0.71 0.85Post Offices 0.54 0.64 0.79 0.95Airports 0.62 0.73 0.91 1.00Big Box Retail 0.37 0.44 0.54 0.65Movie Theaters 0.37 0.44 0.54 0.65Office Buildings 0.62 0.73 0.91 1.00Data Centers 1.00 1.00 1.00 1.00
Source: ICF International
The thermal factors vary by size range due to differences in CHP system power‐to‐heat (P/H) ratios based on the characteristics of typical prime mover technologies used for each size range. The CHP systems below 5 MW were assumed to be reciprocating engines; above 5 MW, they were assumed to be gas turbines. As CHP technologies increase in size, their P/H ratios also tend to increase as electrical efficiency improves and heat available for recovery decreases. The assumed CHP system P/H ratios by size range are shown in Table 24.
Table 24: CHP System Power-to-Heat Ratio by Size Range
CHP Technology <1 MW 1 - 5 MW 5 - 20 MW >20 MW
P/H Ratio 0.68 0.80 1.00 1.20 Source: ICF International
After a potential CHP capacity was determined for each of the potential sites, the existing CHP installations in California were matched to the list and subtracted from the CHP technical potential. If a site with an existing CHP system had a higher amount of technical potential than is currently installed, the difference was considered to be the remaining potential at the site.
56
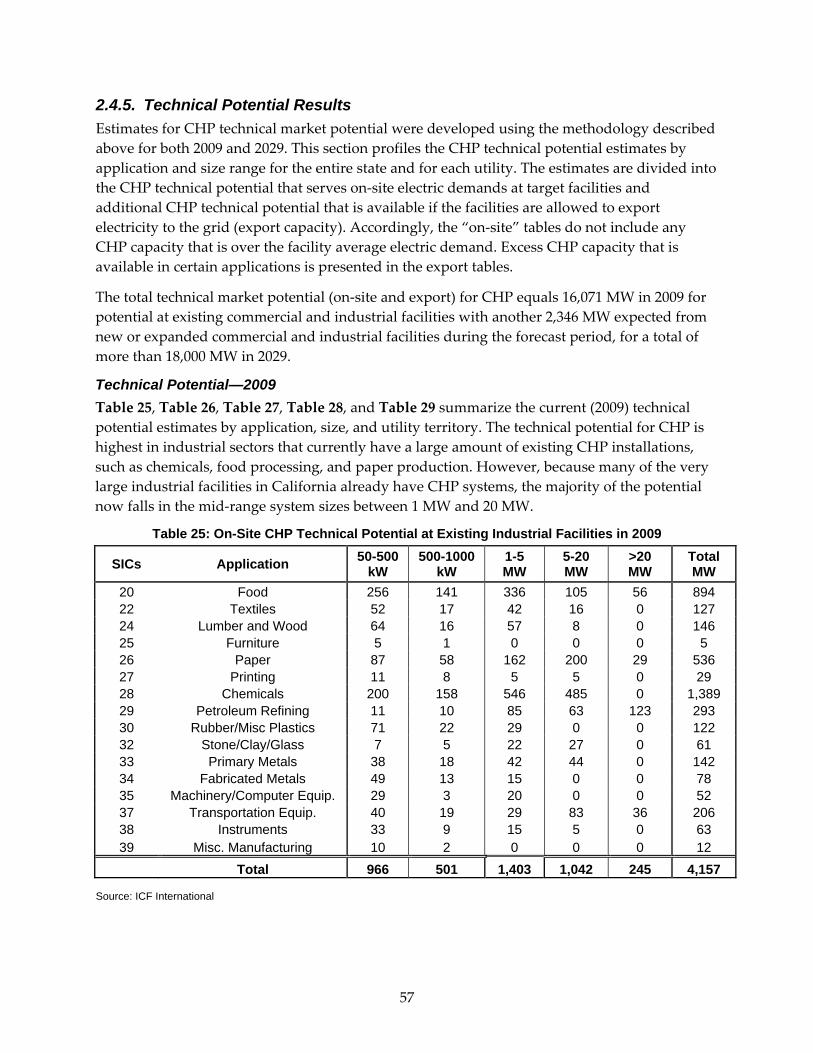
2.4.5. Technical Potential Results Estimates for CHP technical market potential were developed using the methodology described above for both 2009 and 2029. This section profiles the CHP technical potential estimates by application and size range for the entire state and for each utility. The estimates are divided into the CHP technical potential that serves on‐site electric demands at target facilities and additional CHP technical potential that is available if the facilities are allowed to export electricity to the grid (export capacity). Accordingly, the “on‐site” tables do not include any CHP capacity that is over the facility average electric demand. Excess CHP capacity that is available in certain applications is presented in the export tables.
The total technical market potential (on‐site and export) for CHP equals 16,071 MW in 2009 for potential at existing commercial and industrial facilities with another 2,346 MW expected from new or expanded commercial and industrial facilities during the forecast period, for a total of more than 18,000 MW in 2029.
Technical Potential—2009 Table 25, Table 26, Table 27, Table 28, and Table 29 summarize the current (2009) technical potential estimates by application, size, and utility territory. The technical potential for CHP is highest in industrial sectors that currently have a large amount of existing CHP installations, such as chemicals, food processing, and paper production. However, because many of the very large industrial facilities in California already have CHP systems, the majority of the potential now falls in the mid‐range system sizes between 1 MW and 20 MW.
Table 25: On-Site CHP Technical Potential at Existing Industrial Facilities in 2009
SICs Application 50-500 kW
500-1000 kW
1-5 MW
5-20 MW
>20 MW
Total MW
20 Food 256 141 336 105 56 894 22 Textiles 52 17 42 16 0 127 24 Lumber and Wood 64 16 57 8 0 146 25 Furniture 5 1 0 0 0 5 26 Paper 87 58 162 200 29 536 27 Printing 11 8 5 5 0 29 28 Chemicals 200 158 546 485 0 1,389 29 Petroleum Refining 11 10 85 63 123 293 30 Rubber/Misc Plastics 71 22 29 0 0 122 32 Stone/Clay/Glass 7 5 22 27 0 61 33 Primary Metals 38 18 42 44 0 142 34 Fabricated Metals 49 13 15 0 0 78 35 Machinery/Computer Equip. 29 3 20 0 0 52 37 Transportation Equip. 40 19 29 83 36 206 38 Instruments 33 9 15 5 0 63 39 Misc. Manufacturing 10 2 0 0 0 12
Total 966 501 1,403 1,042 245 4,157
Source: ICF International
57
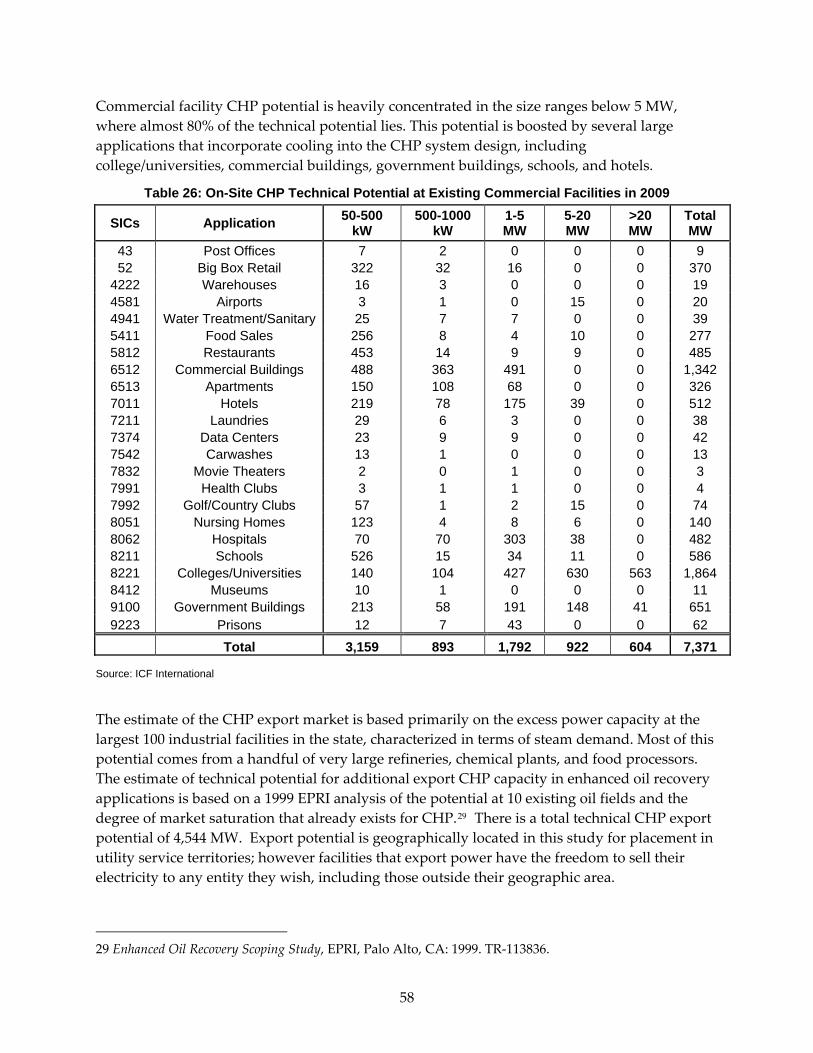
Commercial facility CHP potential is heavily concentrated in the size ranges below 5 MW, where almost 80% of the technical potential lies. This potential is boosted by several large applications that incorporate cooling into the CHP system design, including college/universities, commercial buildings, government buildings, schools, and hotels.
Table 26: On-Site CHP Technical Potential at Existing Commercial Facilities in 2009
SICs Application 50-500 kW
500-1000 kW
1-5 MW
5-20 MW
>20 MW
Total MW
43 Post Offices 7 2 0 0 0 9 52 Big Box Retail 322 32 16 0 0 370
4222 Warehouses 16 3 0 0 0 19 4581 Airports 3 1 0 15 0 20 4941 Water Treatment/Sanitary 25 7 7 0 0 39 5411 Food Sales 256 8 4 10 0 277 5812 Restaurants 453 14 9 9 0 485 6512 Commercial Buildings 488 363 491 0 0 1,342 6513 Apartments 150 108 68 0 0 326 7011 Hotels 219 78 175 39 0 512 7211 Laundries 29 6 3 0 0 38 7374 Data Centers 23 9 9 0 0 42 7542 Carwashes 13 1 0 0 0 13 7832 Movie Theaters 2 0 1 0 0 3 7991 Health Clubs 3 1 1 0 0 4 7992 Golf/Country Clubs 57 1 2 15 0 74 8051 Nursing Homes 123 4 8 6 0 140 8062 Hospitals 70 70 303 38 0 482 8211 Schools 526 15 34 11 0 586 8221 Colleges/Universities 140 104 427 630 563 1,864 8412 Museums 10 1 0 0 0 11 9100 Government Buildings 213 58 191 148 41 651 9223 Prisons 12 7 43 0 0 62
Total 3,159 893 1,792 922 604 7,371
Source: ICF International
The estimate of the CHP export market is based primarily on the excess power capacity at the largest 100 industrial facilities in the state, characterized in terms of steam demand. Most of this potential comes from a handful of very large refineries, chemical plants, and food processors. The estimate of technical potential for additional export CHP capacity in enhanced oil recovery applications is based on a 1999 EPRI analysis of the potential at 10 existing oil fields and the degree of market saturation that already exists for CHP.29 There is a total technical CHP export potential of 4,544 MW. Export potential is geographically located in this study for placement in utility service territories; however facilities that export power have the freedom to sell their electricity to any entity they wish, including those outside their geographic area.
29 Enhanced Oil Recovery Scoping Study, EPRI, Palo Alto, CA: 1999. TR‐113836.
58
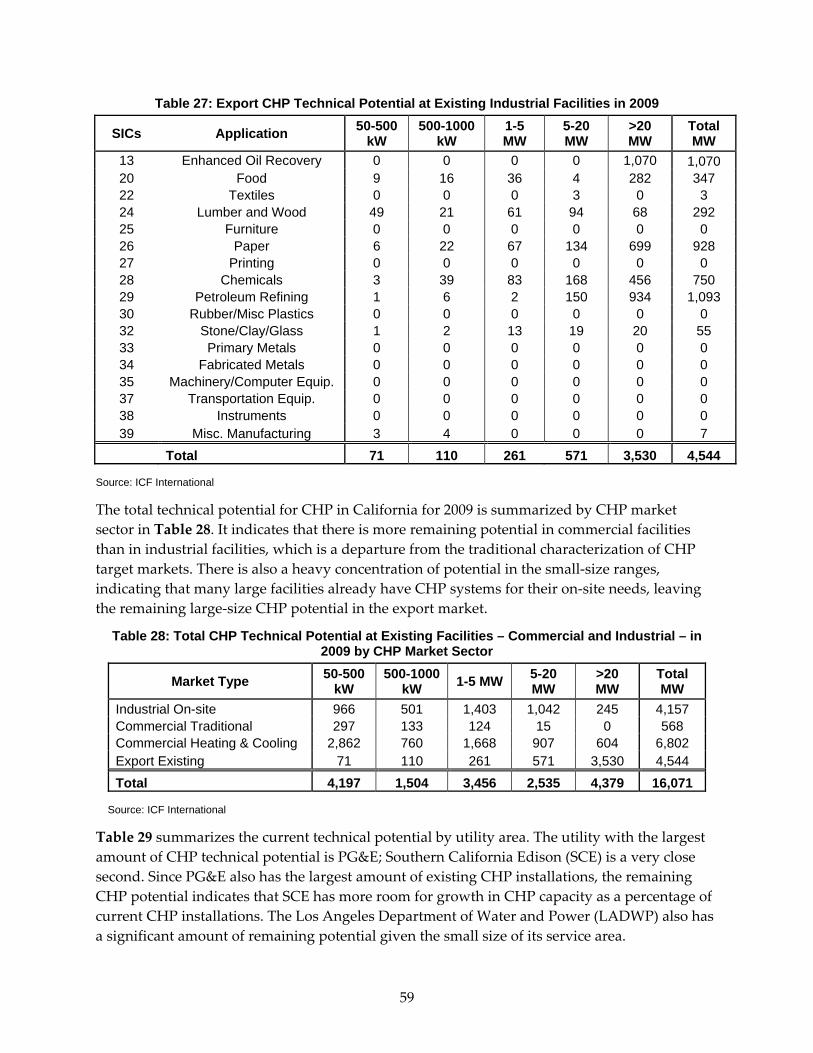
Table 27: Export CHP Technical Potential at Existing Industrial Facilities in 2009
SICs Application 50-500 kW
500-1000 kW
1-5 MW
5-20 MW
>20 MW
Total MW
13 Enhanced Oil Recovery 0 0 0 0 1,070 1,070 20 Food 9 16 36 4 282 347 22 Textiles 0 0 0 3 0 3 24 Lumber and Wood 49 21 61 94 68 292 25 Furniture 0 0 0 0 0 0 26 Paper 6 22 67 134 699 928 27 Printing 0 0 0 0 0 0 28 Chemicals 3 39 83 168 456 750 29 Petroleum Refining 1 6 2 150 934 1,093 30 Rubber/Misc Plastics 0 0 0 0 0 0 32 Stone/Clay/Glass 1 2 13 19 20 55 33 Primary Metals 0 0 0 0 0 0 34 Fabricated Metals 0 0 0 0 0 0 35 Machinery/Computer Equip. 0 0 0 0 0 0 37 Transportation Equip. 0 0 0 0 0 0 38 Instruments 0 0 0 0 0 0 39 Misc. Manufacturing 3 4 0 0 0 7
Total 71 110 261 571 3,530 4,544
Source: ICF International
The total technical potential for CHP in California for 2009 is summarized by CHP market sector in Table 28. It indicates that there is more remaining potential in commercial facilities than in industrial facilities, which is a departure from the traditional characterization of CHP target markets. There is also a heavy concentration of potential in the small‐size ranges, indicating that many large facilities already have CHP systems for their on‐site needs, leaving the remaining large‐size CHP potential in the export market.
Table 28: Total CHP Technical Potential at Existing Facilities – Commercial and Industrial – in 2009 by CHP Market Sector
Market Type 50-500 kW
500-1000 kW 1-5 MW 5-20
MW >20 MW
Total MW
Industrial On-site 966 501 1,403 1,042 245 4,157 Commercial Traditional 297 133 124 15 0 568 Commercial Heating & Cooling 2,862 760 1,668 907 604 6,802 Export Existing 71 110 261 571 3,530 4,544 Total 4,197 1,504 3,456 2,535 4,379 16,071
Source: ICF International
Table 29 summarizes the current technical potential by utility area. The utility with the largest amount of CHP technical potential is PG&E; Southern California Edison (SCE) is a very close second. Since PG&E also has the largest amount of existing CHP installations, the remaining CHP potential indicates that SCE has more room for growth in CHP capacity as a percentage of current CHP installations. The Los Angeles Department of Water and Power (LADWP) also has a significant amount of remaining potential given the small size of its service area.
59
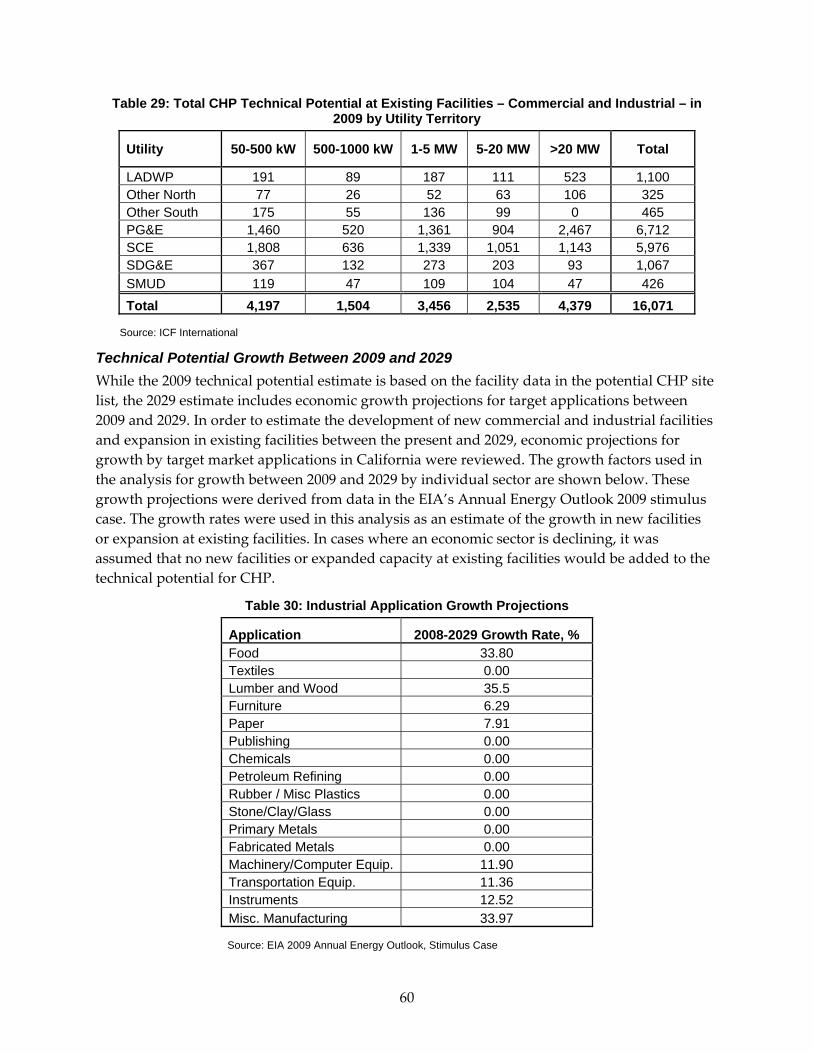
Table 29: Total CHP Technical Potential at Existing Facilities – Commercial and Industrial – in 2009 by Utility Territory
Utility 50-500 kW 500-1000 kW 1-5 MW 5-20 MW >20 MW Total
LADWP 191 89 187 111 523 1,100 Other North 77 26 52 63 106 325 Other South 175 55 136 99 0 465 PG&E 1,460 520 1,361 904 2,467 6,712 SCE 1,808 636 1,339 1,051 1,143 5,976 SDG&E 367 132 273 203 93 1,067 SMUD 119 47 109 104 47 426 Total 4,197 1,504 3,456 2,535 4,379 16,071
Source: ICF International
Technical Potential Growth Between 2009 and 2029 While the 2009 technical potential estimate is based on the facility data in the potential CHP site list, the 2029 estimate includes economic growth projections for target applications between 2009 and 2029. In order to estimate the development of new commercial and industrial facilities and expansion in existing facilities between the present and 2029, economic projections for growth by target market applications in California were reviewed. The growth factors used in the analysis for growth between 2009 and 2029 by individual sector are shown below. These growth projections were derived from data in the EIA’s Annual Energy Outlook 2009 stimulus case. The growth rates were used in this analysis as an estimate of the growth in new facilities or expansion at existing facilities. In cases where an economic sector is declining, it was assumed that no new facilities or expanded capacity at existing facilities would be added to the technical potential for CHP.
Table 30: Industrial Application Growth Projections
Application 2008-2029 Growth Rate, % Food 33.80 Textiles 0.00 Lumber and Wood 35.5 Furniture 6.29 Paper 7.91 Publishing 0.00 Chemicals 0.00 Petroleum Refining 0.00 Rubber / Misc Plastics 0.00 Stone/Clay/Glass 0.00 Primary Metals 0.00 Fabricated Metals 0.00 Machinery/Computer Equip. 11.90 Transportation Equip. 11.36 Instruments 12.52 Misc. Manufacturing 33.97
Source: EIA 2009 Annual Energy Outlook, Stimulus Case
60
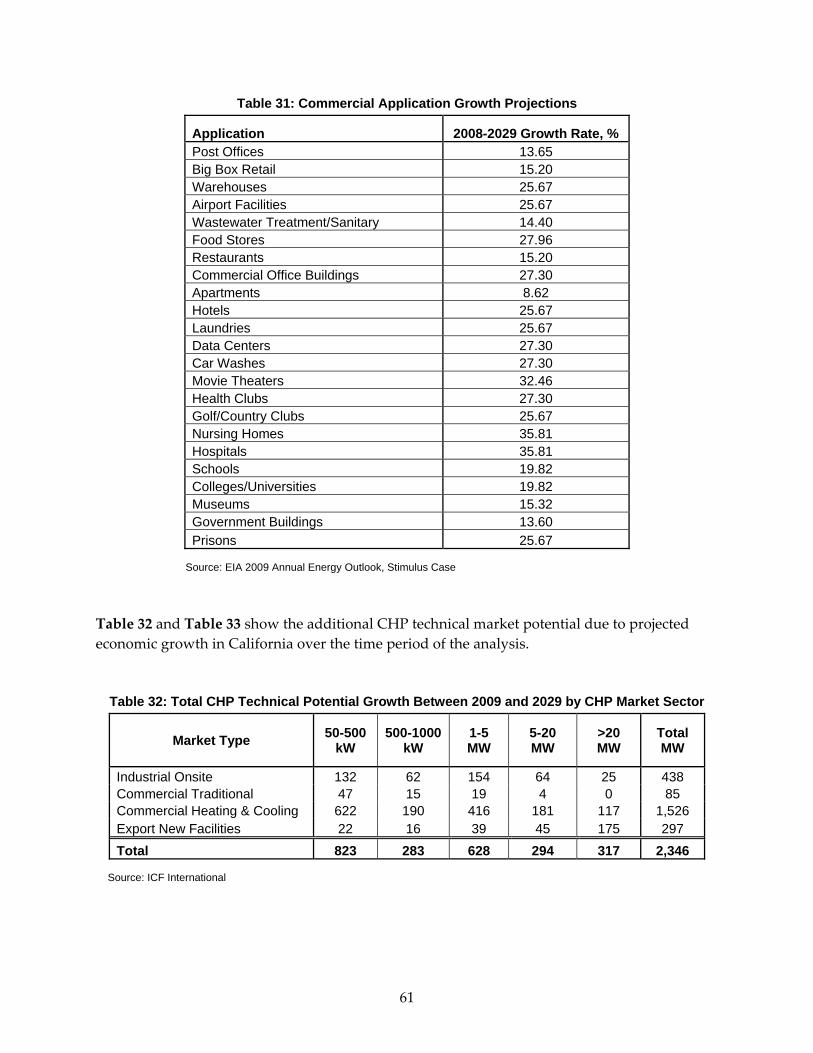
Table 31: Commercial Application Growth Projections
Application 2008-2029 Growth Rate, % Post Offices 13.65 Big Box Retail 15.20 Warehouses 25.67 Airport Facilities 25.67 Wastewater Treatment/Sanitary 14.40 Food Stores 27.96 Restaurants 15.20 Commercial Office Buildings 27.30 Apartments 8.62 Hotels 25.67 Laundries 25.67 Data Centers 27.30 Car Washes 27.30 Movie Theaters 32.46 Health Clubs 27.30 Golf/Country Clubs 25.67 Nursing Homes 35.81 Hospitals 35.81 Schools 19.82 Colleges/Universities 19.82 Museums 15.32 Government Buildings 13.60 Prisons 25.67
Source: EIA 2009 Annual Energy Outlook, Stimulus Case
Table 32 and Table 33 show the additional CHP technical market potential due to projected economic growth in California over the time period of the analysis.
Table 32: Total CHP Technical Potential Growth Between 2009 and 2029 by CHP Market Sector
Market Type 50-500 kW
500-1000 kW
1-5 MW
5-20 MW
>20 MW
Total MW
Industrial Onsite 132 62 154 64 25 438 Commercial Traditional 47 15 19 4 0 85 Commercial Heating & Cooling 622 190 416 181 117 1,526 Export New Facilities 22 16 39 45 175 297 Total 823 283 628 294 317 2,346
Source: ICF International
61
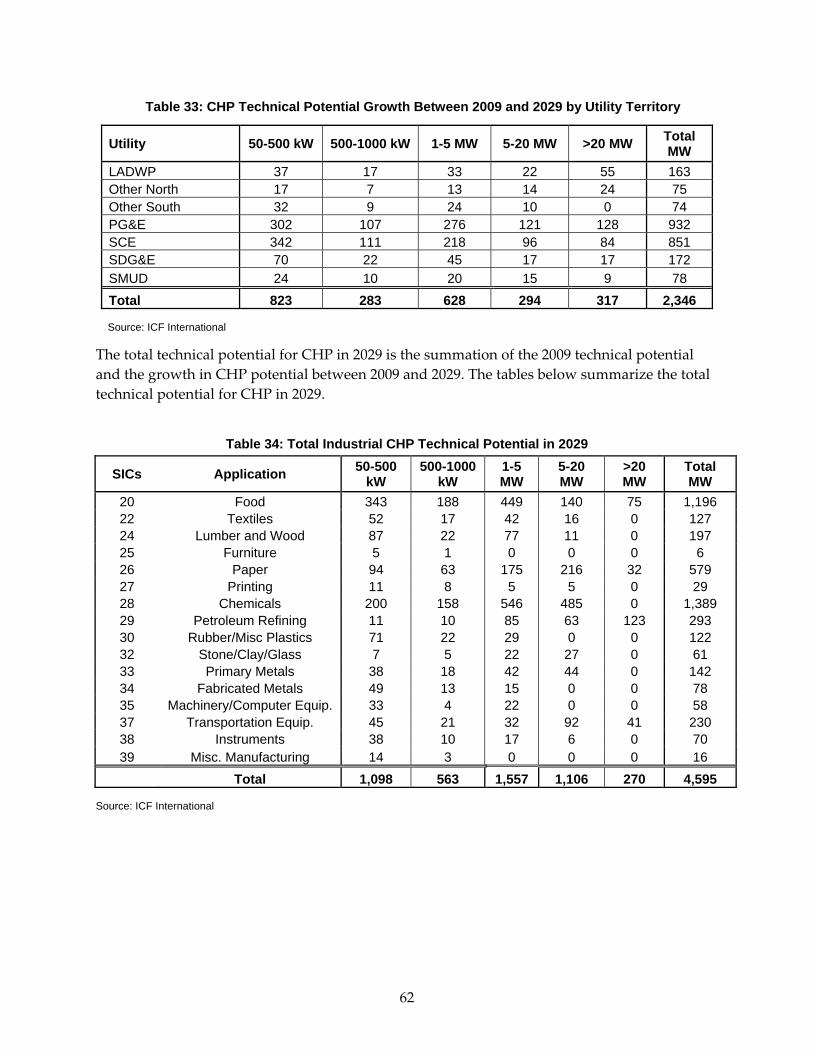
Table 33: CHP Technical Potential Growth Between 2009 and 2029 by Utility Territory
Utility 50-500 kW 500-1000 kW 1-5 MW 5-20 MW >20 MW Total MW
LADWP 37 17 33 22 55 163 Other North 17 7 13 14 24 75 Other South 32 9 24 10 0 74 PG&E 302 107 276 121 128 932 SCE 342 111 218 96 84 851 SDG&E 70 22 45 17 17 172 SMUD 24 10 20 15 9 78 Total 823 283 628 294 317 2,346
Source: ICF International
The total technical potential for CHP in 2029 is the summation of the 2009 technical potential and the growth in CHP potential between 2009 and 2029. The tables below summarize the total technical potential for CHP in 2029.
Table 34: Total Industrial CHP Technical Potential in 2029
SICs Application 50-500 kW
500-1000 kW
1-5 MW
5-20 MW
>20 MW
Total MW
20 Food 343 188 449 140 75 1,196 22 Textiles 52 17 42 16 0 127 24 Lumber and Wood 87 22 77 11 0 197 25 Furniture 5 1 0 0 0 6 26 Paper 94 63 175 216 32 579 27 Printing 11 8 5 5 0 29 28 Chemicals 200 158 546 485 0 1,389 29 Petroleum Refining 11 10 85 63 123 293 30 Rubber/Misc Plastics 71 22 29 0 0 122 32 Stone/Clay/Glass 7 5 22 27 0 61 33 Primary Metals 38 18 42 44 0 142 34 Fabricated Metals 49 13 15 0 0 78 35 Machinery/Computer Equip. 33 4 22 0 0 58 37 Transportation Equip. 45 21 32 92 41 230 38 Instruments 38 10 17 6 0 70 39 Misc. Manufacturing 14 3 0 0 0 16
Total 1,098 563 1,557 1,106 270 4,595
Source: ICF International
62
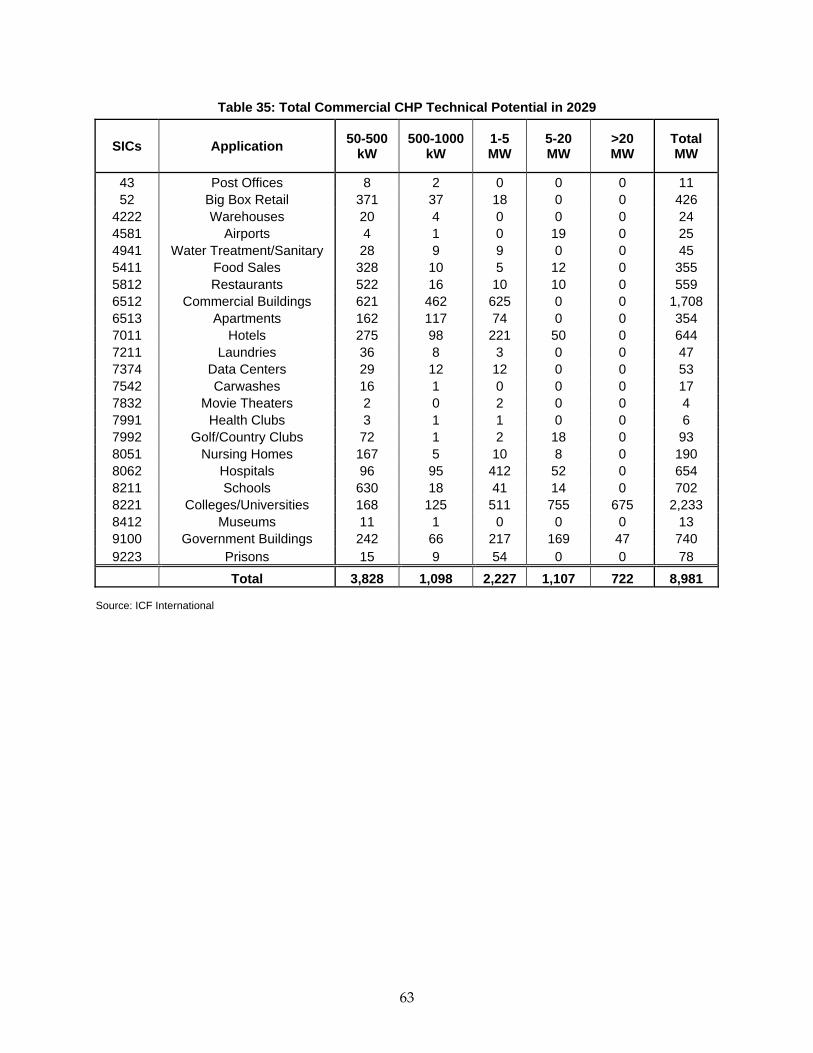
Table 35: Total Commercial CHP Technical Potential in 2029
SICs Application 50-500 kW
500-1000 kW
1-5 MW
5-20 MW
>20 MW
Total MW
43 Post Offices 8 2 0 0 0 11 52 Big Box Retail 371 37 18 0 0 426
4222 Warehouses 20 4 0 0 0 24 4581 Airports 4 1 0 19 0 25 4941 Water Treatment/Sanitary 28 9 9 0 0 45 5411 Food Sales 328 10 5 12 0 355 5812 Restaurants 522 16 10 10 0 559 6512 Commercial Buildings 621 462 625 0 0 1,708 6513 Apartments 162 117 74 0 0 354 7011 Hotels 275 98 221 50 0 644 7211 Laundries 36 8 3 0 0 47 7374 Data Centers 29 12 12 0 0 53 7542 Carwashes 16 1 0 0 0 17 7832 Movie Theaters 2 0 2 0 0 4 7991 Health Clubs 3 1 1 0 0 6 7992 Golf/Country Clubs 72 1 2 18 0 93 8051 Nursing Homes 167 5 10 8 0 190 8062 Hospitals 96 95 412 52 0 654 8211 Schools 630 18 41 14 0 702 8221 Colleges/Universities 168 125 511 755 675 2,233 8412 Museums 11 1 0 0 0 13 9100 Government Buildings 242 66 217 169 47 740 9223 Prisons 15 9 54 0 0 78
Total 3,828 1,098 2,227 1,107 722 8,981
Source: ICF International
63
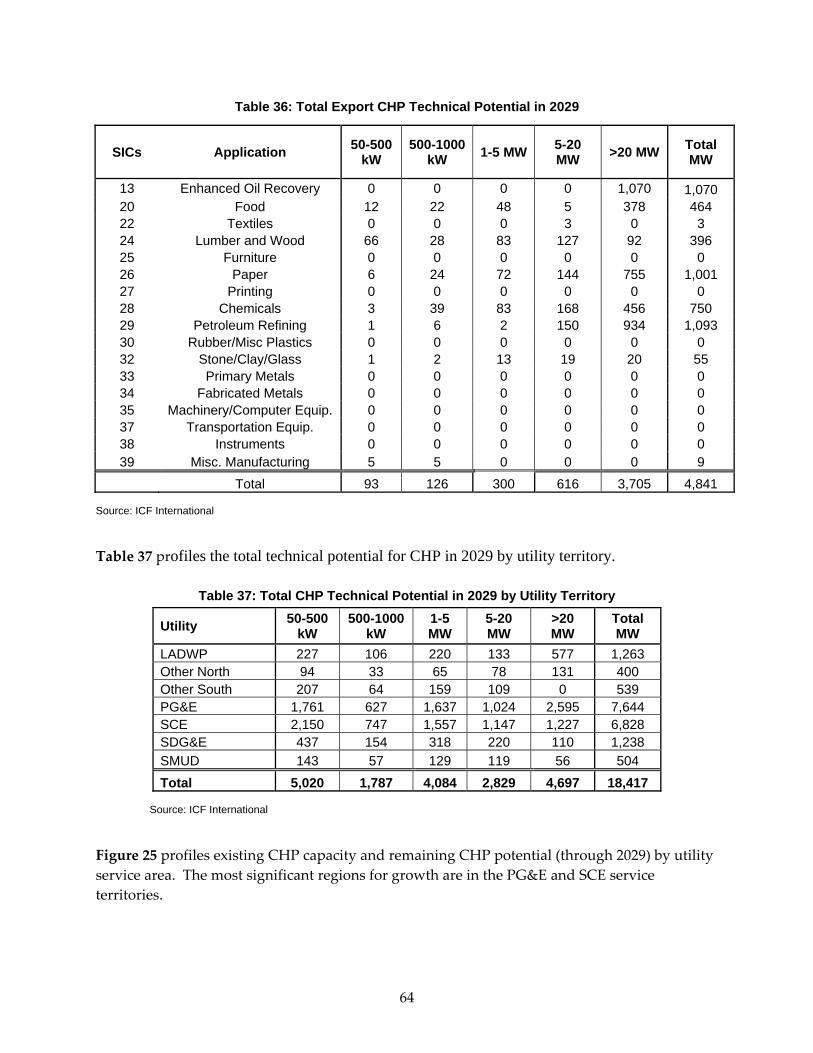
Table 36: Total Export CHP Technical Potential in 2029
SICs Application 50-500 kW
500-1000 kW 1-5 MW 5-20
MW >20 MW Total MW
13 Enhanced Oil Recovery 0 0 0 0 1,070 1,070 20 Food 12 22 48 5 378 464 22 Textiles 0 0 0 3 0 3 24 Lumber and Wood 66 28 83 127 92 396 25 Furniture 0 0 0 0 0 0 26 Paper 6 24 72 144 755 1,001 27 Printing 0 0 0 0 0 0 28 Chemicals 3 39 83 168 456 750 29 Petroleum Refining 1 6 2 150 934 1,093 30 Rubber/Misc Plastics 0 0 0 0 0 0 32 Stone/Clay/Glass 1 2 13 19 20 55 33 Primary Metals 0 0 0 0 0 0 34 Fabricated Metals 0 0 0 0 0 0 35 Machinery/Computer Equip. 0 0 0 0 0 0 37 Transportation Equip. 0 0 0 0 0 0 38 Instruments 0 0 0 0 0 0 39 Misc. Manufacturing 5 5 0 0 0 9
Total 93 126 300 616 3,705 4,841
Source: ICF International
Table 37 profiles the total technical potential for CHP in 2029 by utility territory.
Table 37: Total CHP Technical Potential in 2029 by Utility Territory
Utility 50-500 kW
500-1000 kW
1-5 MW
5-20 MW
>20 MW
Total MW
LADWP 227 106 220 133 577 1,263 Other North 94 33 65 78 131 400 Other South 207 64 159 109 0 539 PG&E 1,761 627 1,637 1,024 2,595 7,644 SCE 2,150 747 1,557 1,147 1,227 6,828 SDG&E 437 154 318 220 110 1,238 SMUD 143 57 129 119 56 504 Total 5,020 1,787 4,084 2,829 4,697 18,417
Source: ICF International
Figure 25 profiles existing CHP capacity and remaining CHP potential (through 2029) by utility service area. The most significant regions for growth are in the PG&E and SCE service territories.
64
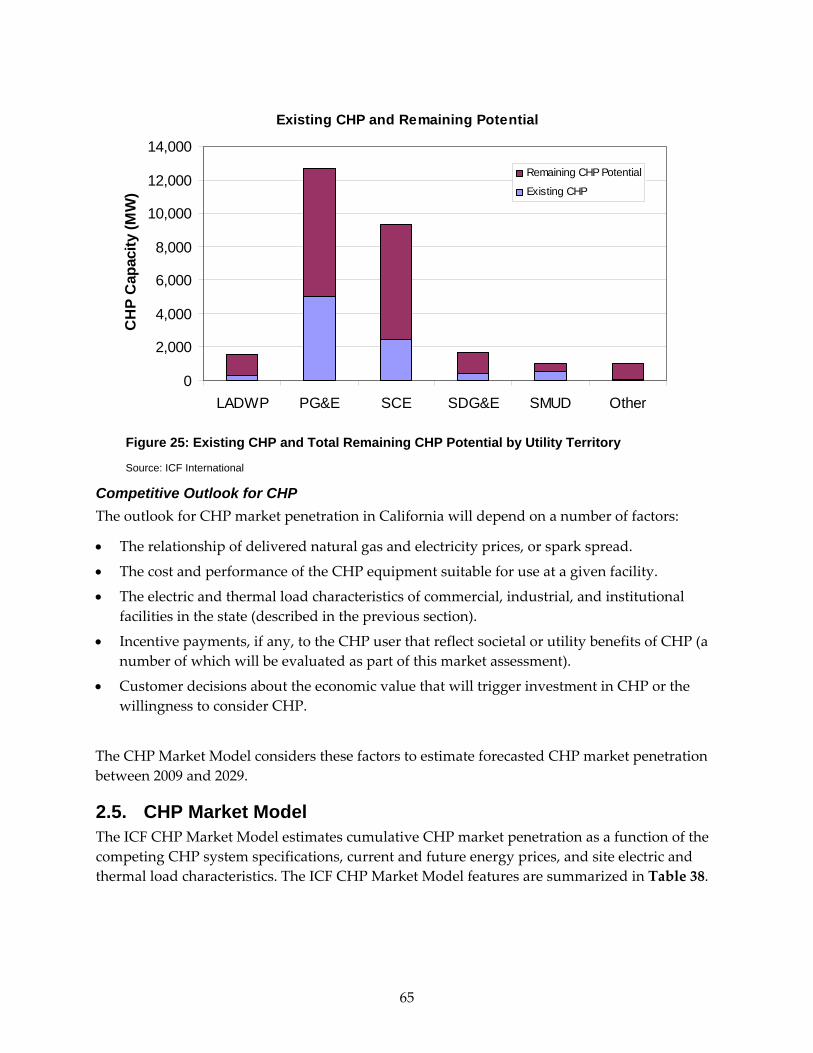
Existing CHP and Remaining Potential
0
2,000
4,000
6,000
8,000
10,000
12,000
14,000
LADWP PG&E SCE SDG&E SMUD Other
CH
P C
apac
ity (M
W)
Remaining CHP Potential
Existing CHP
Figure 25: Existing CHP and Total Remaining CHP Potential by Utility Territory
Source: ICF International
Competitive Outlook for CHP The outlook for CHP market penetration in California will depend on a number of factors:
• The relationship of delivered natural gas and electricity prices, or spark spread.
• The cost and performance of the CHP equipment suitable for use at a given facility.
• The electric and thermal load characteristics of commercial, industrial, and institutional facilities in the state (described in the previous section).
• Incentive payments, if any, to the CHP user that reflect societal or utility benefits of CHP (a number of which will be evaluated as part of this market assessment).
• Customer decisions about the economic value that will trigger investment in CHP or the willingness to consider CHP.
The CHP Market Model considers these factors to estimate forecasted CHP market penetration between 2009 and 2029.
2.5. CHP Market Model The ICF CHP Market Model estimates cumulative CHP market penetration as a function of the competing CHP system specifications, current and future energy prices, and site electric and thermal load characteristics. The ICF CHP Market Model features are summarized in Table 38.
65
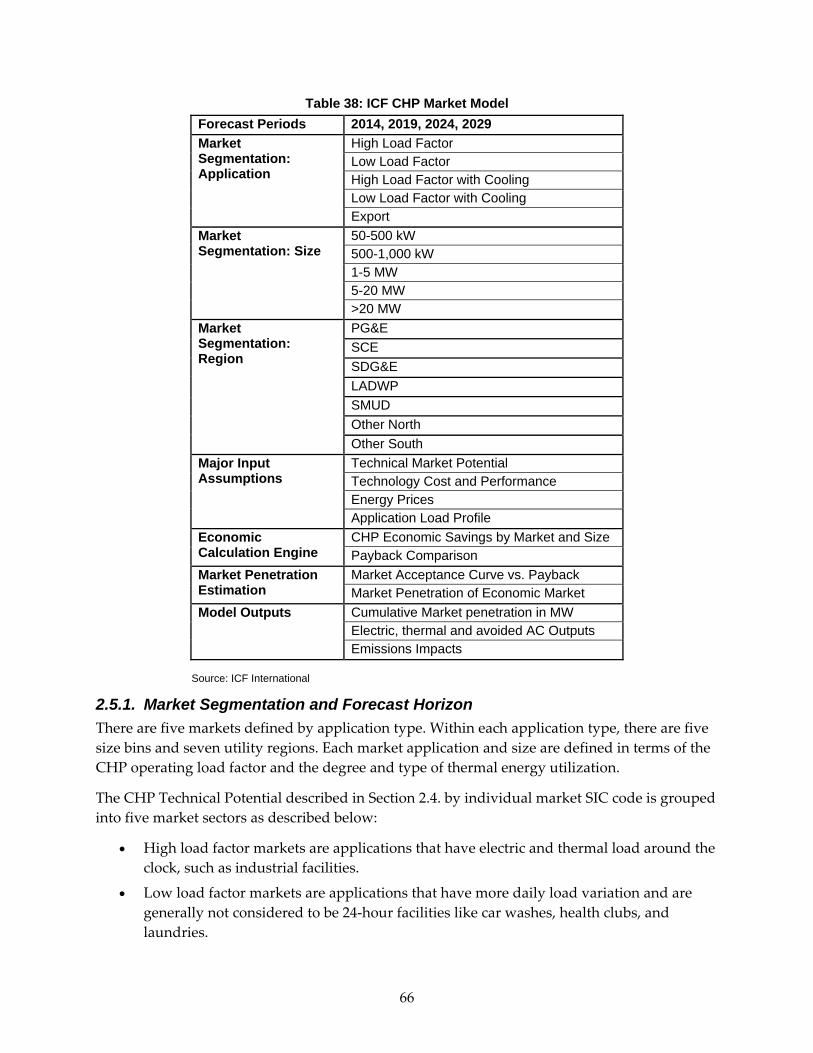
Table 38: ICF CHP Market Model Forecast Periods 2014, 2019, 2024, 2029 Market Segmentation: Application
High Load Factor Low Load Factor High Load Factor with Cooling Low Load Factor with Cooling Export
Market Segmentation: Size
50-500 kW 500-1,000 kW 1-5 MW 5-20 MW >20 MW
Market Segmentation: Region
PG&E SCE SDG&E LADWP SMUD Other North Other South
Major Input Assumptions
Technical Market Potential Technology Cost and Performance Energy Prices Application Load Profile
Economic Calculation Engine
CHP Economic Savings by Market and Size Payback Comparison
Market Penetration Estimation
Market Acceptance Curve vs. Payback Market Penetration of Economic Market
Model Outputs Cumulative Market penetration in MW Electric, thermal and avoided AC Outputs Emissions Impacts
Source: ICF International
2.5.1. Market Segmentation and Forecast Horizon There are five markets defined by application type. Within each application type, there are five size bins and seven utility regions. Each market application and size are defined in terms of the CHP operating load factor and the degree and type of thermal energy utilization.
The CHP Technical Potential described in Section 2.4. by individual market SIC code is grouped into five market sectors as described below:
• High load factor markets are applications that have electric and thermal load around the clock, such as industrial facilities.
• Low load factor markets are applications that have more daily load variation and are generally not considered to be 24‐hour facilities like car washes, health clubs, and laundries.
66
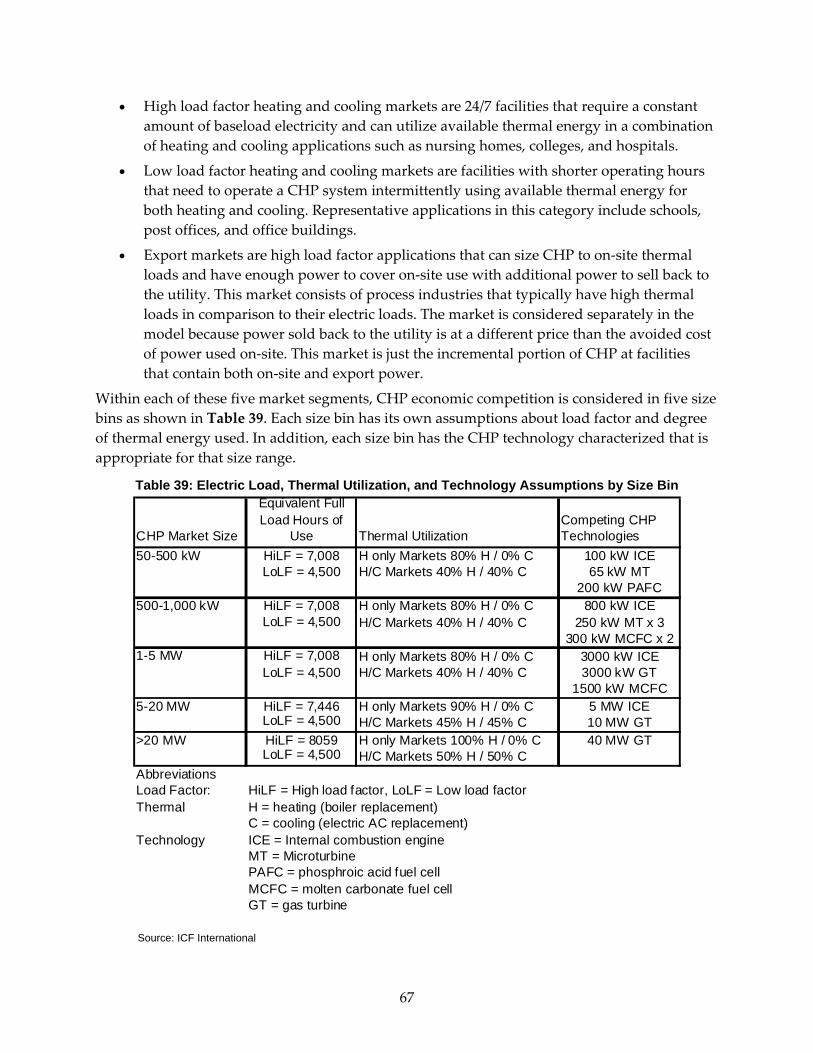
• High load factor heating and cooling markets are 24/7 facilities that require a constant amount of baseload electricity and can utilize available thermal energy in a combination of heating and cooling applications such as nursing homes, colleges, and hospitals.
• Low load factor heating and cooling markets are facilities with shorter operating hours that need to operate a CHP system intermittently using available thermal energy for both heating and cooling. Representative applications in this category include schools, post offices, and office buildings.
• Export markets are high load factor applications that can size CHP to on‐site thermal loads and have enough power to cover on‐site use with additional power to sell back to the utility. This market consists of process industries that typically have high thermal loads in comparison to their electric loads. The market is considered separately in the model because power sold back to the utility is at a different price than the avoided cost of power used on‐site. This market is just the incremental portion of CHP at facilities that contain both on‐site and export power.
Within each of these five market segments, CHP economic competition is considered in five size bins as shown in Table 39. Each size bin has its own assumptions about load factor and degree of thermal energy used. In addition, each size bin has the CHP technology characterized that is appropriate for that size range.
Table 39: Electric Load, Thermal Utilization, and Technology Assumptions by Size Bin
CHP Market Size
Equivalent Full Load Hours of
Use Thermal UtilizationCompeting CHP Technologies
50-500 kW HiLF = 7,008 H only Markets 80% H / 0% C 100 kW ICELoLF = 4,500 H/C Markets 40% H / 40% C 65 kW MT
200 kW PAFC500-1,000 kW HiLF = 7,008 H only Markets 80% H / 0% C 800 kW ICE
LoLF = 4,500 H/C Markets 40% H / 40% C 250 kW MT x 3300 kW MCFC x 2
1-5 MW HiLF = 7,008 H only Markets 80% H / 0% C 3000 kW ICELoLF = 4,500 H/C Markets 40% H / 40% C 3000 kW GT
1500 kW MCFC5-20 MW HiLF = 7,446 H only Markets 90% H / 0% C 5 MW ICE
LoLF = 4,500 H/C Markets 45% H / 45% C 10 MW GT>20 MW HiLF = 8059 H only Markets 100% H / 0% C 40 MW GT
LoLF = 4,500 H/C Markets 50% H / 50% CAbbreviationsLoad Factor:Thermal
Technology
GT = gas turbine
ICE = Internal combustion engineMT = MicroturbinePAFC = phosphroic acid fuel cellMCFC = molten carbonate fuel cell
HiLF = High load factor, LoLF = Low load factorH = heating (boiler replacement)C = cooling (electric AC replacement)
Source: ICF International
67

The seven utility regions consist of the three major investor owned utilities: SCE, PG&E, and SDG&E. Two large municipal utilities are also represented: LADWP and SMUD. All other utilities are represented in two categories as Other South and Other North. These regions are used to determine the retail electric prices and to define the CHP technical potential. The regions are determined approximately, primarily at the county level with an allocation within Los Angeles County reflecting the SCE, LADWP, and other municipal utilities share of electricity sales. Retail prices are analyzed for the named utilities. The two “Other” categories are assumed to be dominated by smaller municipal utilities. These categories are given the average of the two municipal rates.
The cumulative market penetration is forecast in five year increments. For this analysis, the forecast periods are 2014, 2019, 2024, and 2029.
2.5.2. Market Model Input Assumptions The major inputs to the ICF CHP Market Model are as follows:
• CHP technical market potential
• CHP technology cost and performance figures
• Energy prices
• Application profiles
Technical Market Potential Inputs The target market is composed of the facilities that make up the technical market potential as defined previously in Section 2.4. This potential is analyzed application by application, but the results are aggregated into the five market sectors and seven utility regions described previously. Facilities of like load factor, size, and thermal characteristics are assumed to offer the same economic opportunity for CHP. A summary of the technical market potential is shown in Table 40.
68
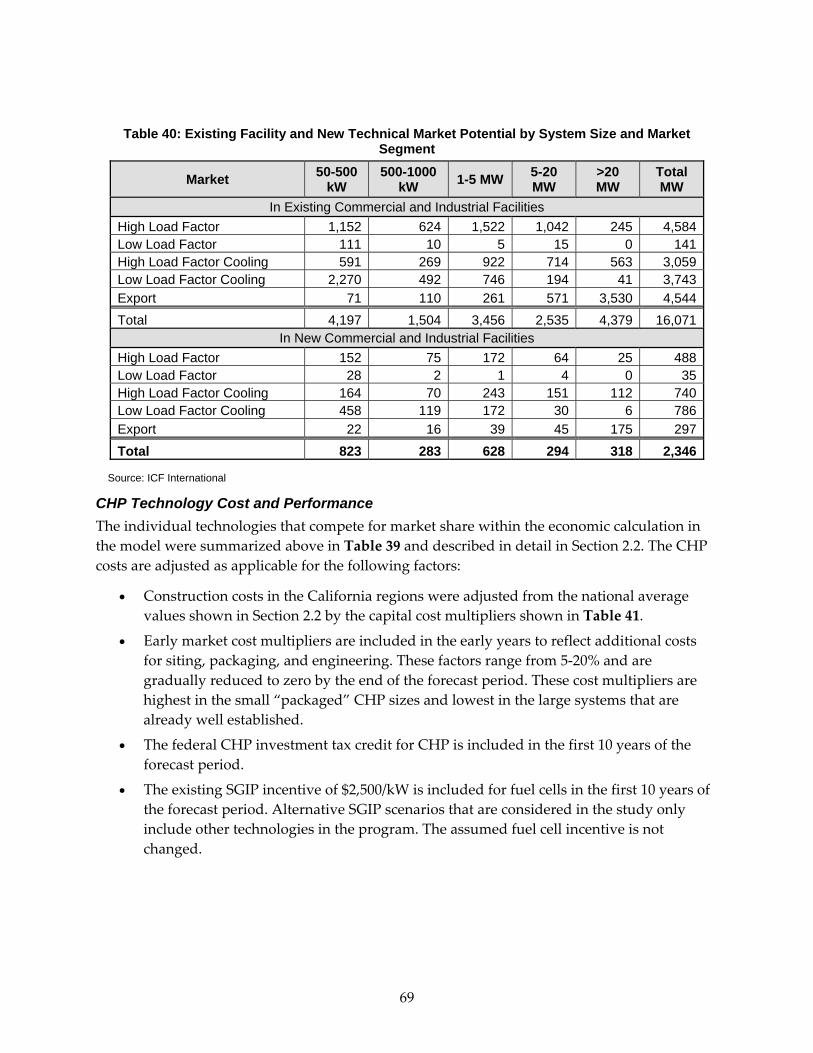
Table 40: Existing Facility and New Technical Market Potential by System Size and Market Segment
Market 50-500 kW
500-1000 kW 1-5 MW 5-20
MW >20 MW
Total MW
In Existing Commercial and Industrial Facilities High Load Factor 1,152 624 1,522 1,042 245 4,584Low Load Factor 111 10 5 15 0 141High Load Factor Cooling 591 269 922 714 563 3,059Low Load Factor Cooling 2,270 492 746 194 41 3,743Export 71 110 261 571 3,530 4,544Total 4,197 1,504 3,456 2,535 4,379 16,071
In New Commercial and Industrial Facilities High Load Factor 152 75 172 64 25 488Low Load Factor 28 2 1 4 0 35High Load Factor Cooling 164 70 243 151 112 740Low Load Factor Cooling 458 119 172 30 6 786Export 22 16 39 45 175 297Total 823 283 628 294 318 2,346
Source: ICF International
CHP Technology Cost and Performance The individual technologies that compete for market share within the economic calculation in the model were summarized above in Table 39 and described in detail in Section 2.2. The CHP costs are adjusted as applicable for the following factors:
• Construction costs in the California regions were adjusted from the national average values shown in Section 2.2 by the capital cost multipliers shown in Table 41.
• Early market cost multipliers are included in the early years to reflect additional costs for siting, packaging, and engineering. These factors range from 5‐20% and are gradually reduced to zero by the end of the forecast period. These cost multipliers are highest in the small “packaged” CHP sizes and lowest in the large systems that are already well established.
• The federal CHP investment tax credit for CHP is included in the first 10 years of the forecast period.
• The existing SGIP incentive of $2,500/kW is included for fuel cells in the first 10 years of the forecast period. Alternative SGIP scenarios that are considered in the study only include other technologies in the program. The assumed fuel cell incentive is not changed.
69
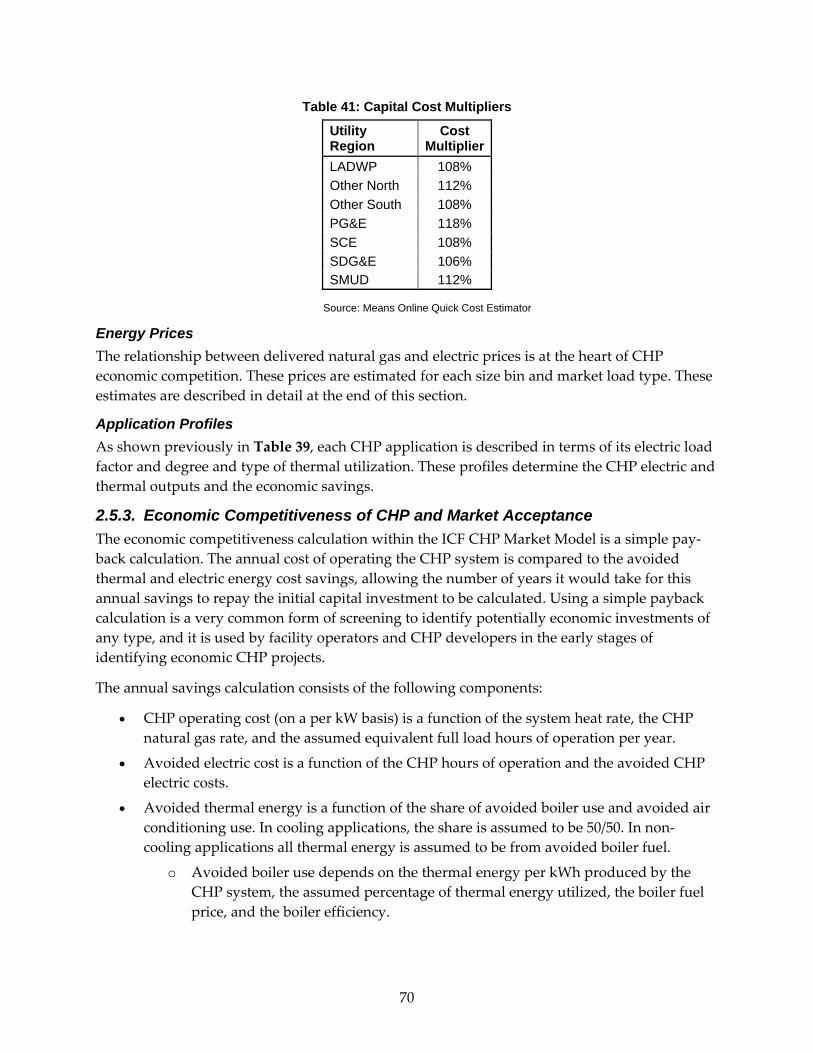
Table 41: Capital Cost Multipliers
Utility Region
Cost Multiplier
LADWP 108% Other North 112% Other South 108% PG&E 118% SCE 108% SDG&E 106% SMUD 112%
Source: Means Online Quick Cost Estimator
Energy Prices The relationship between delivered natural gas and electric prices is at the heart of CHP economic competition. These prices are estimated for each size bin and market load type. These estimates are described in detail at the end of this section.
Application Profiles As shown previously in Table 39, each CHP application is described in terms of its electric load factor and degree and type of thermal utilization. These profiles determine the CHP electric and thermal outputs and the economic savings.
2.5.3. Economic Competitiveness of CHP and Market Acceptance The economic competitiveness calculation within the ICF CHP Market Model is a simple pay‐back calculation. The annual cost of operating the CHP system is compared to the avoided thermal and electric energy cost savings, allowing the number of years it would take for this annual savings to repay the initial capital investment to be calculated. Using a simple payback calculation is a very common form of screening to identify potentially economic investments of any type, and it is used by facility operators and CHP developers in the early stages of identifying economic CHP projects.
The annual savings calculation consists of the following components:
• CHP operating cost (on a per kW basis) is a function of the system heat rate, the CHP natural gas rate, and the assumed equivalent full load hours of operation per year.
• Avoided electric cost is a function of the CHP hours of operation and the avoided CHP electric costs.
• Avoided thermal energy is a function of the share of avoided boiler use and avoided air conditioning use. In cooling applications, the share is assumed to be 50/50. In non‐cooling applications all thermal energy is assumed to be from avoided boiler fuel.
o Avoided boiler use depends on the thermal energy per kWh produced by the CHP system, the assumed percentage of thermal energy utilized, the boiler fuel price, and the boiler efficiency.
70
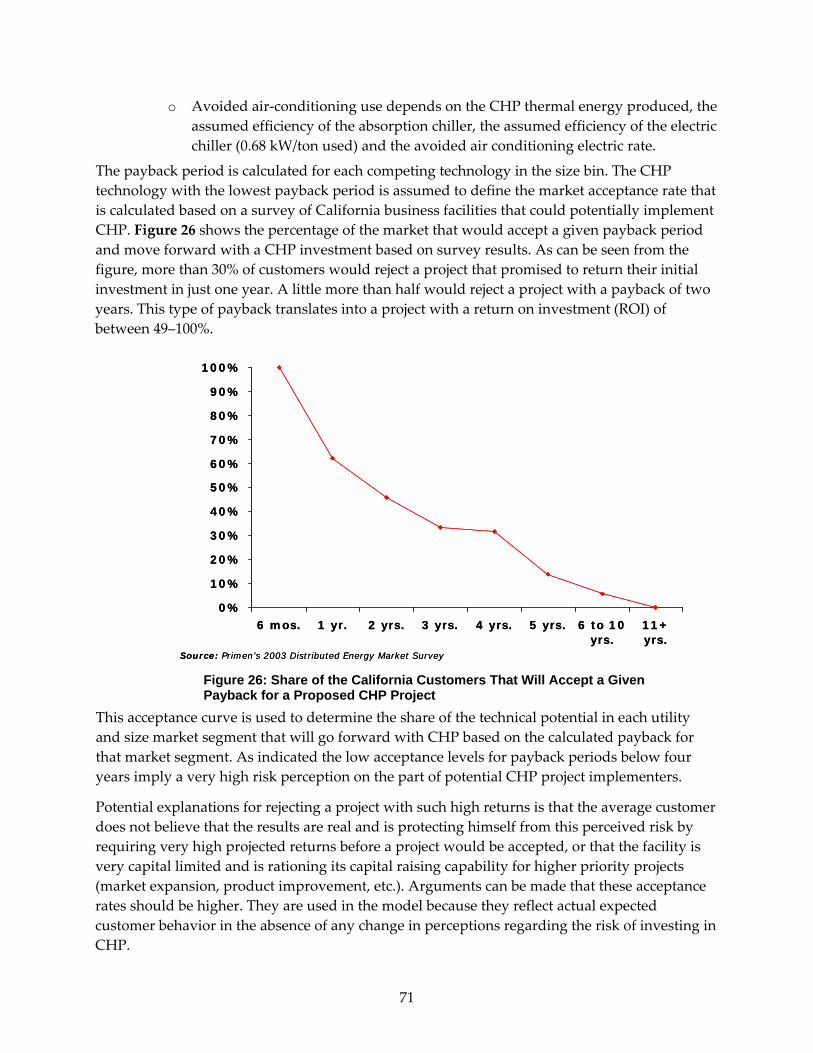
o Avoided air‐conditioning use depends on the CHP thermal energy produced, the assumed efficiency of the absorption chiller, the assumed efficiency of the electric chiller (0.68 kW/ton used) and the avoided air conditioning electric rate.
The payback period is calculated for each competing technology in the size bin. The CHP technology with the lowest payback period is assumed to define the market acceptance rate that is calculated based on a survey of California business facilities that could potentially implement CHP. Figure 26 shows the percentage of the market that would accept a given payback period and move forward with a CHP investment based on survey results. As can be seen from the figure, more than 30% of customers would reject a project that promised to return their initial investment in just one year. A little more than half would reject a project with a payback of two years. This type of payback translates into a project with a return on investment (ROI) of between 49–100%.
0%
10%
20%
30%
40%
50%
60%
70%
80%
90%
100%
6 mos. 1 yr. 2 yrs. 3 yrs. 4 yrs. 5 yrs. 6 to 10yrs.
11+yrs.
Source: Primen’s 2003 Distributed Energy Market Survey
0%
10%
20%
30%
40%
50%
60%
70%
80%
90%
100%
6 mos. 1 yr. 2 yrs. 3 yrs. 4 yrs. 5 yrs. 6 to 10yrs.
11+yrs.
Source: Primen’s 2003 Distributed Energy Market Survey
Figure 26: Share of the California Customers That Will Accept a Given Payback for a Proposed CHP Project
This acceptance curve is used to determine the share of the technical potential in each utility and size market segment that will go forward with CHP based on the calculated payback for that market segment. As indicated the low acceptance levels for payback periods below four years imply a very high risk perception on the part of potential CHP project implementers.
Potential explanations for rejecting a project with such high returns is that the average customer does not believe that the results are real and is protecting himself from this perceived risk by requiring very high projected returns before a project would be accepted, or that the facility is very capital limited and is rationing its capital raising capability for higher priority projects (market expansion, product improvement, etc.). Arguments can be made that these acceptance rates should be higher. They are used in the model because they reflect actual expected customer behavior in the absence of any change in perceptions regarding the risk of investing in CHP.
71
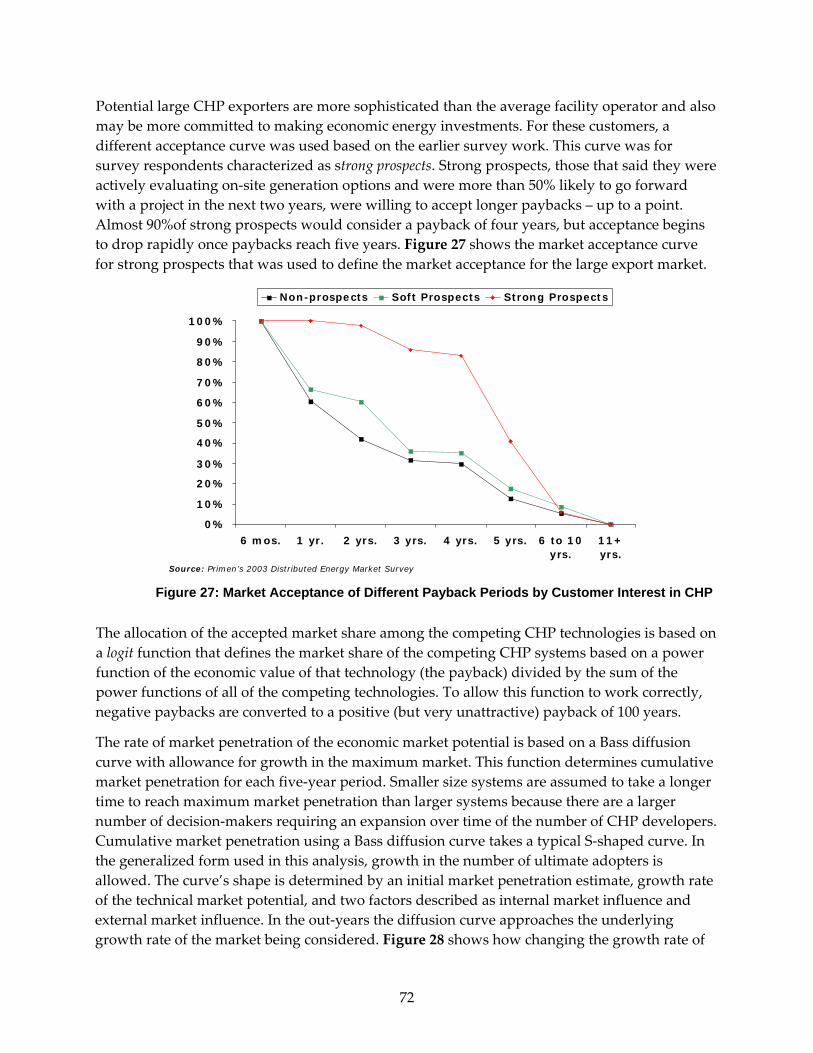
Potential large CHP exporters are more sophisticated than the average facility operator and also may be more committed to making economic energy investments. For these customers, a different acceptance curve was used based on the earlier survey work. This curve was for survey respondents characterized as strong prospects. Strong prospects, those that said they were actively evaluating on‐site generation options and were more than 50% likely to go forward with a project in the next two years, were willing to accept longer paybacks – up to a point. Almost 90%of strong prospects would consider a payback of four years, but acceptance begins to drop rapidly once paybacks reach five years. Figure 27 shows the market acceptance curve for strong prospects that was used to define the market acceptance for the large export market.
0%
10%
20%
30%
40%
50%
60%
70%
80%
90%
100%
6 mos. 1 yr. 2 yrs. 3 yrs. 4 yrs. 5 yrs. 6 to 10yrs.
11+yrs.
Non-prospects Soft Prospects Strong Prospects
Source: Primen’s 2003 Distributed Energy Market Survey Figure 27: Market Acceptance of Different Payback Periods by Customer Interest in CHP
The allocation of the accepted market share among the competing CHP technologies is based on a logit function that defines the market share of the competing CHP systems based on a power function of the economic value of that technology (the payback) divided by the sum of the power functions of all of the competing technologies. To allow this function to work correctly, negative paybacks are converted to a positive (but very unattractive) payback of 100 years.
The rate of market penetration of the economic market potential is based on a Bass diffusion curve with allowance for growth in the maximum market. This function determines cumulative market penetration for each five‐year period. Smaller size systems are assumed to take a longer time to reach maximum market penetration than larger systems because there are a larger number of decision‐makers requiring an expansion over time of the number of CHP developers. Cumulative market penetration using a Bass diffusion curve takes a typical S‐shaped curve. In the generalized form used in this analysis, growth in the number of ultimate adopters is allowed. The curve’s shape is determined by an initial market penetration estimate, growth rate of the technical market potential, and two factors described as internal market influence and external market influence. In the out‐years the diffusion curve approaches the underlying growth rate of the market being considered. Figure 28 shows how changing the growth rate of
72
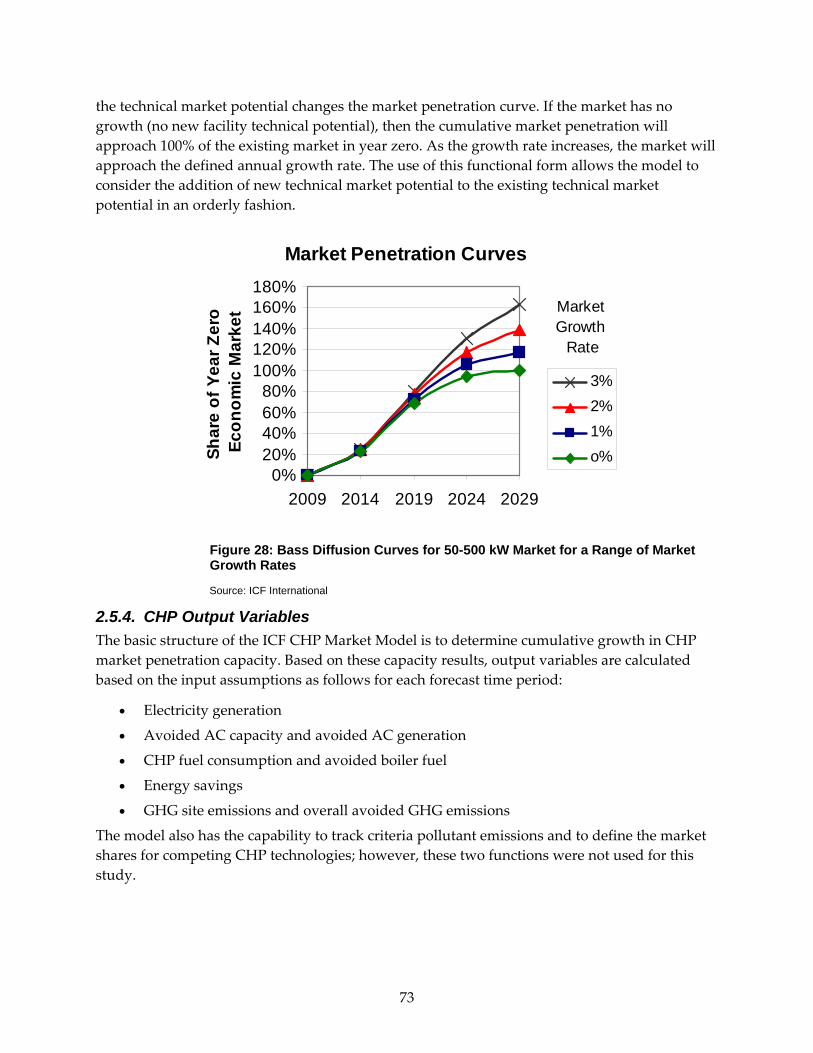
the technical market potential changes the market penetration curve. If the market has no growth (no new facility technical potential), then the cumulative market penetration will approach 100% of the existing market in year zero. As the growth rate increases, the market will approach the defined annual growth rate. The use of this functional form allows the model to consider the addition of new technical market potential to the existing technical market potential in an orderly fashion.
Market Penetration Curves
0%20%40%60%80%
100%120%140%160%180%
2009 2014 2019 2024 2029
Shar
e of
Yea
r Zer
o Ec
onom
ic M
arke
t
3%2%1%o%
MarketGrowth Rate
Figure 28: Bass Diffusion Curves for 50-500 kW Market for a Range of Market Growth Rates
Source: ICF International
2.5.4. CHP Output Variables The basic structure of the ICF CHP Market Model is to determine cumulative growth in CHP market penetration capacity. Based on these capacity results, output variables are calculated based on the input assumptions as follows for each forecast time period:
• Electricity generation
• Avoided AC capacity and avoided AC generation
• CHP fuel consumption and avoided boiler fuel
• Energy savings
• GHG site emissions and overall avoided GHG emissions
The model also has the capability to track criteria pollutant emissions and to define the market shares for competing CHP technologies; however, these two functions were not used for this study.
73

74
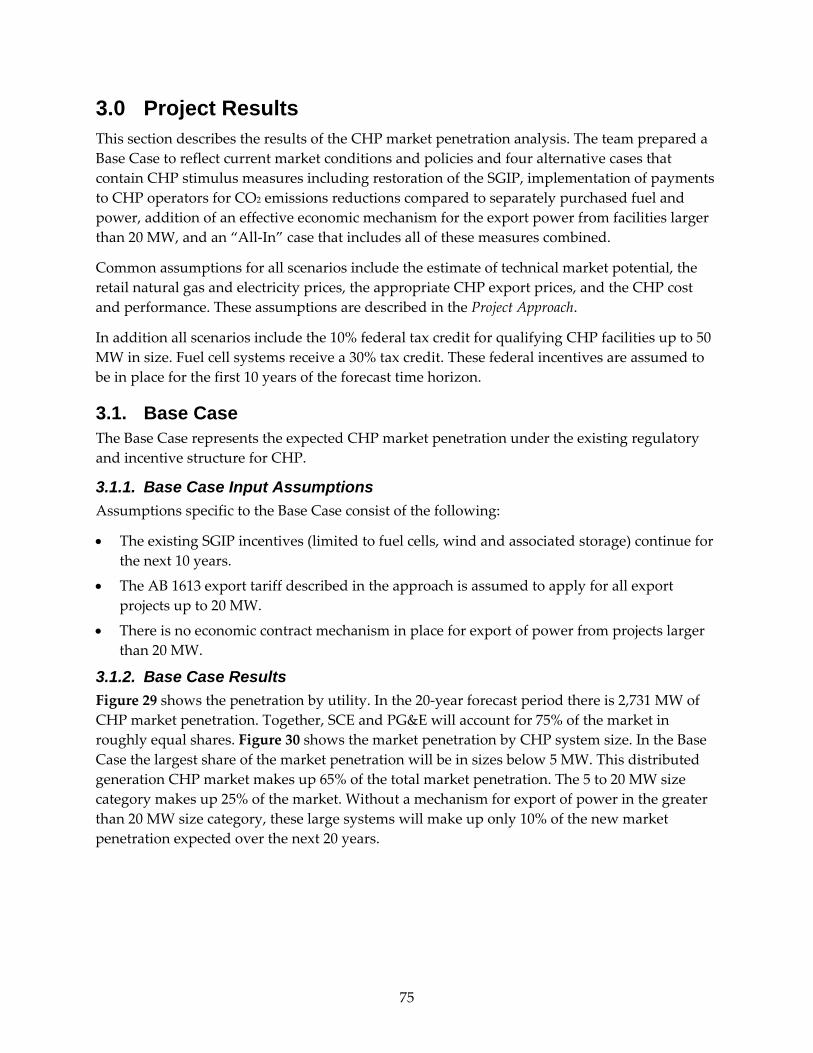
3.0 Project Results This section describes the results of the CHP market penetration analysis. The team prepared a Base Case to reflect current market conditions and policies and four alternative cases that contain CHP stimulus measures including restoration of the SGIP, implementation of payments to CHP operators for CO2 emissions reductions compared to separately purchased fuel and power, addition of an effective economic mechanism for the export power from facilities larger than 20 MW, and an “All‐In” case that includes all of these measures combined.
Common assumptions for all scenarios include the estimate of technical market potential, the retail natural gas and electricity prices, the appropriate CHP export prices, and the CHP cost and performance. These assumptions are described in the Project Approach.
In addition all scenarios include the 10% federal tax credit for qualifying CHP facilities up to 50 MW in size. Fuel cell systems receive a 30% tax credit. These federal incentives are assumed to be in place for the first 10 years of the forecast time horizon.
3.1. Base Case The Base Case represents the expected CHP market penetration under the existing regulatory and incentive structure for CHP.
3.1.1. Base Case Input Assumptions Assumptions specific to the Base Case consist of the following:
• The existing SGIP incentives (limited to fuel cells, wind and associated storage) continue for the next 10 years.
• The AB 1613 export tariff described in the approach is assumed to apply for all export projects up to 20 MW.
• There is no economic contract mechanism in place for export of power from projects larger than 20 MW.
3.1.2. Base Case Results Figure 29 shows the penetration by utility. In the 20‐year forecast period there is 2,731 MW of CHP market penetration. Together, SCE and PG&E will account for 75% of the market in roughly equal shares. Figure 30 shows the market penetration by CHP system size. In the Base Case the largest share of the market penetration will be in sizes below 5 MW. This distributed generation CHP market makes up 65% of the total market penetration. The 5 to 20 MW size category makes up 25% of the market. Without a mechanism for export of power in the greater than 20 MW size category, these large systems will make up only 10% of the new market penetration expected over the next 20 years.
75
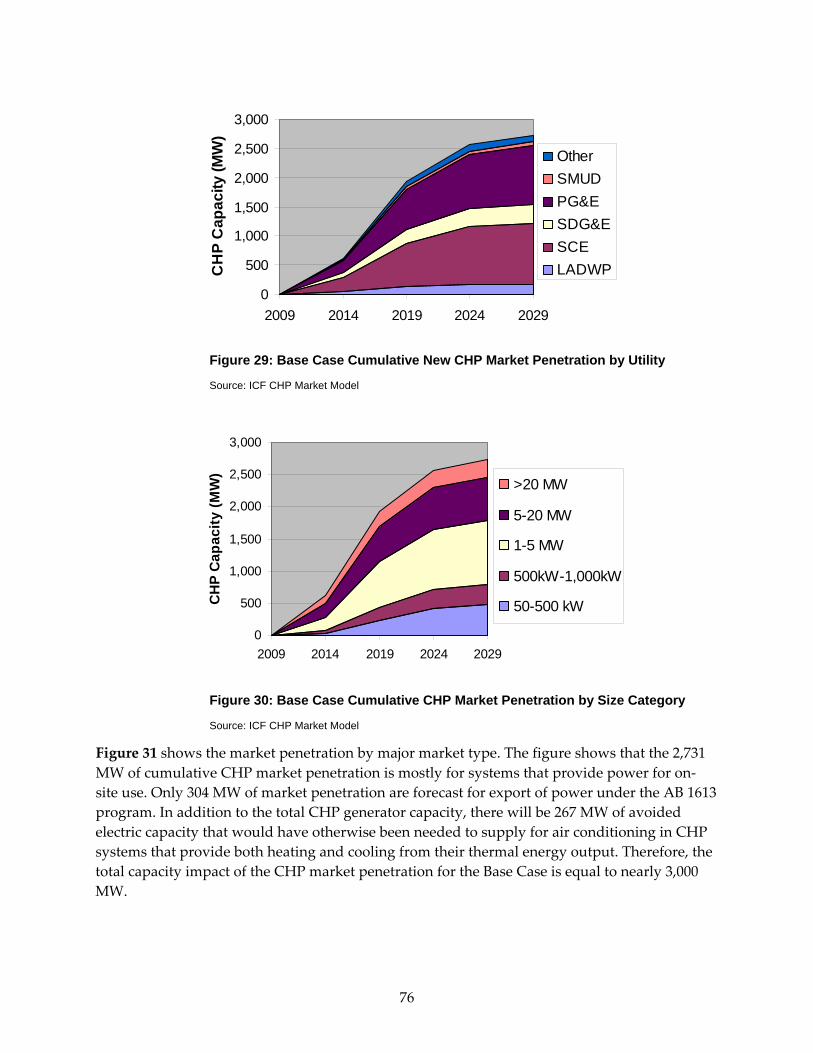
0
500
1,000
1,500
2,000
2,500
3,000
2009 2014 2019 2024 2029
CH
P C
apac
ity (M
W)
OtherSMUDPG&ESDG&ESCELADWP
Figure 29: Base Case Cumulative New CHP Market Penetration by Utility
Source: ICF CHP Market Model
0
500
1,000
1,500
2,000
2,500
3,000
2009 2014 2019 2024 2029
CH
P C
apac
ity (M
W)
>20 MW
5-20 MW
1-5 MW
500kW-1,000kW
50-500 kW
Figure 30: Base Case Cumulative CHP Market Penetration by Size Category
Source: ICF CHP Market Model
Figure 31 shows the market penetration by major market type. The figure shows that the 2,731 MW of cumulative CHP market penetration is mostly for systems that provide power for on‐site use. Only 304 MW of market penetration are forecast for export of power under the AB 1613 program. In addition to the total CHP generator capacity, there will be 267 MW of avoided electric capacity that would have otherwise been needed to supply for air conditioning in CHP systems that provide both heating and cooling from their thermal energy output. Therefore, the total capacity impact of the CHP market penetration for the Base Case is equal to nearly 3,000 MW.
76
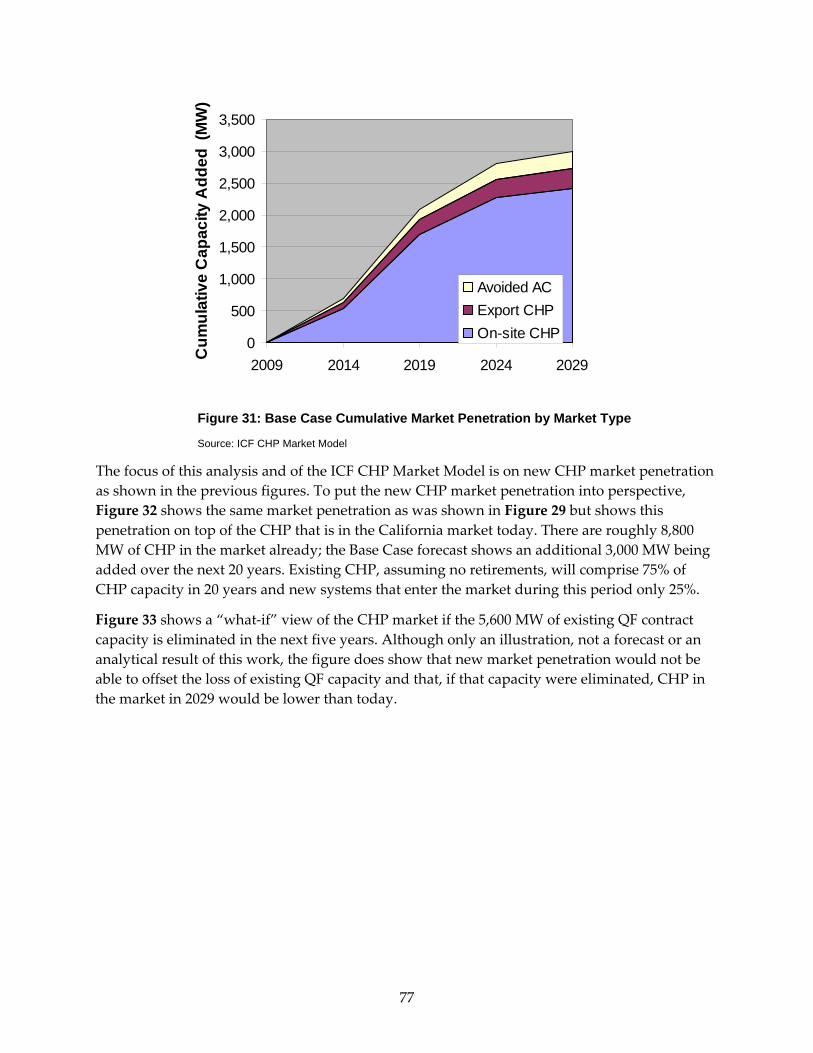
0
500
1,000
1,500
2,000
2,500
3,000
3,500
2009 2014 2019 2024 2029
Cum
ulat
ive
Cap
acity
Add
ed (
MW
)
Avoided ACExport CHPOn-site CHP
Figure 31: Base Case Cumulative Market Penetration by Market Type
Source: ICF CHP Market Model
The focus of this analysis and of the ICF CHP Market Model is on new CHP market penetration as shown in the previous figures. To put the new CHP market penetration into perspective, Figure 32 shows the same market penetration as was shown in Figure 29 but shows this penetration on top of the CHP that is in the California market today. There are roughly 8,800 MW of CHP in the market already; the Base Case forecast shows an additional 3,000 MW being added over the next 20 years. Existing CHP, assuming no retirements, will comprise 75% of CHP capacity in 20 years and new systems that enter the market during this period only 25%.
Figure 33 shows a “what‐if” view of the CHP market if the 5,600 MW of existing QF contract capacity is eliminated in the next five years. Although only an illustration, not a forecast or an analytical result of this work, the figure does show that new market penetration would not be able to offset the loss of existing QF capacity and that, if that capacity were eliminated, CHP in the market in 2029 would be lower than today.
77
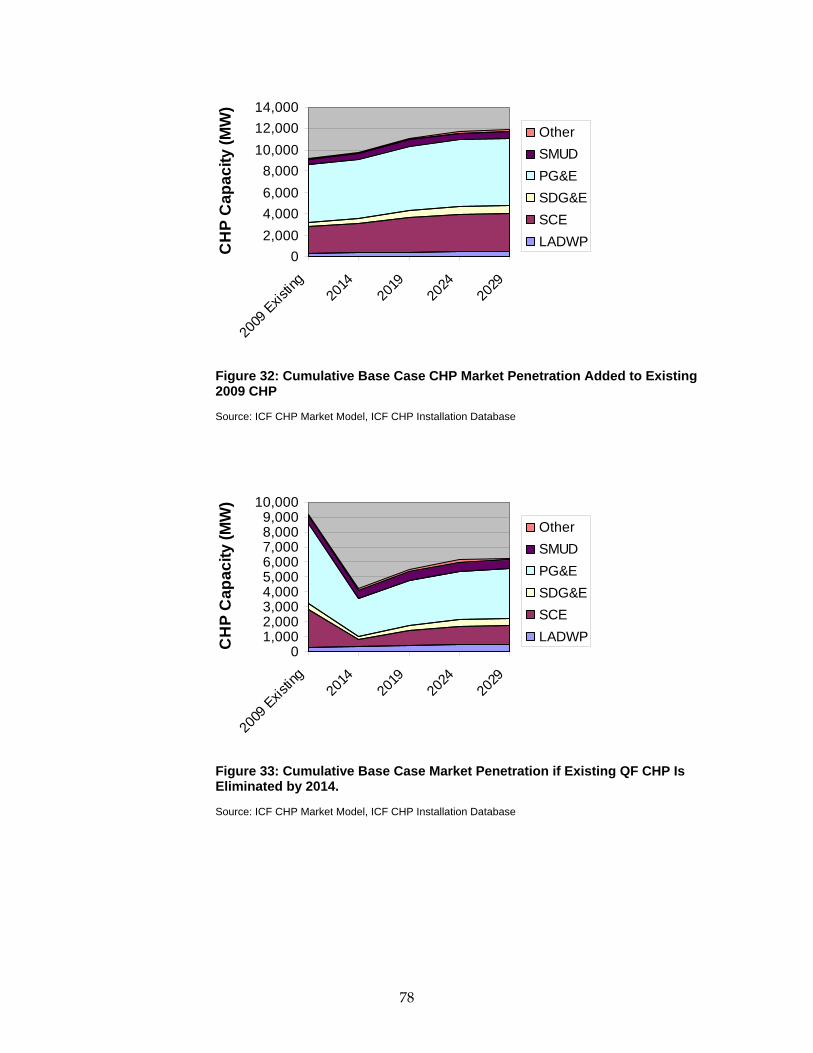
02,0004,0006,0008,000
10,00012,00014,000
2009
Existin
g20
1420
1920
2420
29
CH
P C
apac
ity (M
W)
OtherSMUDPG&ESDG&ESCELADWP
Figure 32: Cumulative Base Case CHP Market Penetration Added to Existing 2009 CHP
Source: ICF CHP Market Model, ICF CHP Installation Database
01,0002,0003,0004,0005,0006,0007,0008,0009,000
10,000
2009
Existin
g20
1420
1920
2420
29
CH
P C
apac
ity (M
W)
OtherSMUDPG&ESDG&ESCELADWP
Figure 33: Cumulative Base Case Market Penetration if Existing QF CHP Is Eliminated by 2014.
Source: ICF CHP Market Model, ICF CHP Installation Database
78
3.2. Incentive Cases In the incentive cases, three separate CHP incentive measures are evaluated separately to determine their impact on future CHP market penetration. Finally, these incentives are all combined in an “All‐In” Case to show the impact of an aggressive set of policy measures to promote CHP in the California market.
3.2.1. Incentive Case Input Assumptions This section describes the assumptions for the incentive cases analyzed.
CO2 Payments Case CHP is a more efficient use of energy than is separately purchasing boiler fuel and electricity. The CHP operator does not gain any special benefit from this fact, only from the reduction in operating costs at the site. Benefits of CHP that contribute to State or federal policy goals such as increased efficiency or CO2 emissions reduction are external to the decisions to build and operate CHP. Providing CHP operators with a payment for reducing overall CO2 emissions would internalize this benefit into the CHP deployment decision and stimulate the CHP market based on the social value of emissions reduction that is provided.
In the calculation of the Market Price Referent30 (MPR) for the renewable feed‐in tariff, there is a component to add in the cost to utilities of emitting GHGs from their fossil generation. These costs begin in 2015 at $23/ton of CO2 and grow to $88/ton by 2029. Unlike renewable power sources, CHP does not eliminate 100% of the GHG emissions associated with the power generation provided, but CHP systems do provide savings compared to central station power generation, as will be shown in Section 3.3.2. The benefit for CHP provided GHG emissions reductions should be included in the economic decision to own and operate CHP in the form of annual payments for GHG reductions according to the value of these emissions reductions—$23/ton in 2015 increasing to $88/ton by 2029.
Due to limitations of the model, an annually changing price track for CO2 reductions could not be modeled. Instead, an average value of $50/ton of CO2 emissions reduction is provided for all CHP electric output and for avoided electricity generation due to CHP supplied air conditioning.
CO2 payments are not applied to AB 1613 eligible export power because the price track used for this power is the MPR value that already includes the GHG adders.
When all incentive measures are considered together (in the “All‐In” Case), the CO2 payment is provided for large export projects (greater than 20 MW) using the estimated contract prices shown in the approach, because these contract price tracks do not include any CO2 adjustment.
Restore SGIP Case Restoration of the SGIP is included in Senate Bill 412 (Kehoe, Chapter 182, Statutes of 2009), passed by the California Legislature and signed into law by the Governor on October 11, 2009. Under this bill, the CPUC is required to re‐implement SGIP using their discretion about 30 2008 MPR Model E4214 Final Publci.xls, E3, CPUC, 2008.
79
program details. For this analysis we assumed that all SGIP payments would be restored as they existed before they were suspended in 2007 and that the current phased expansion of benefits for projects up to 5 MW would be included as well.
The SGIP payments are made as an upfront incentive to offset some of the capital costs of the CHP system. The payments vary by fuel use and technology. For fossil‐fueled systems, representing the focus of this analysis, the payments are $600/kW for reciprocating engines, $800/kW for microturbines, and $2,500/kW for fuel cells. The full SGIP incentive payment is applied to the first MW for qualifying systems under 5 MW of capacity. A partial payment of 50% is applied to the second MW of capacity and 25% incentive for the third MW of capacity for systems with a total size of 5 MW or less.
The analysis is based on the assumption that the SGIP will be in place for the first 10 years of the forecast time horizon.
Basic Large Export Case The AB 1613 CHP feed‐in tariffs, apply only to systems 20 MW or less. In the Base Case, no mechanism for exporting power from larger facilities (greater than 20 MW) is assumed. In this first of two expanded export scenarios, export of power from large facilities is assumed to be at a contract price reflecting the cost of power generation from a combined cycle power plant using the plant cost and performance characteristics given in an Energy Commission staff report. 31
Facilities in the large export market were assumed to be strong prospects, meaning their acceptance curve for project paybacks is much stronger than the average market acceptance curve used for the other markets.
The contract pricing assumptions for this case were shown previously in Figure 22 (marginal electric generation cost) and Figure 24 (large contract price). The special market acceptance curve used for these large projects is shown in Figure 27 (strong prospects).
“All In” Incentives Case The “All‐In” Case represents a combination of all the previous incentive cases (including restoration of SGIP, addition of CO2 emissions reduction payments of $50/ton, and expanding export contracting to facilities larger than 20 MW) and an additional inclusion of an aggressive contract pricing mechanism and accompanying CO2 payments. This more aggressive contract price track for large export CHP projects is evaluated as shown in Figure 24 (aggressive contract price) and described in the accompanying text as a modification of the existing MPR calculation methodology. As previously described, it is appropriate to use this price with an accompanying CO2 emissions reduction payment. Therefore, this price track is used in the “All‐In” Case in place of the basic large export case assumptions just described.
31 Comparative Costs of Central Station Electricity Generation, Draft Staff Report, CEC‐200‐2009‐017‐SD, August 2009.
80
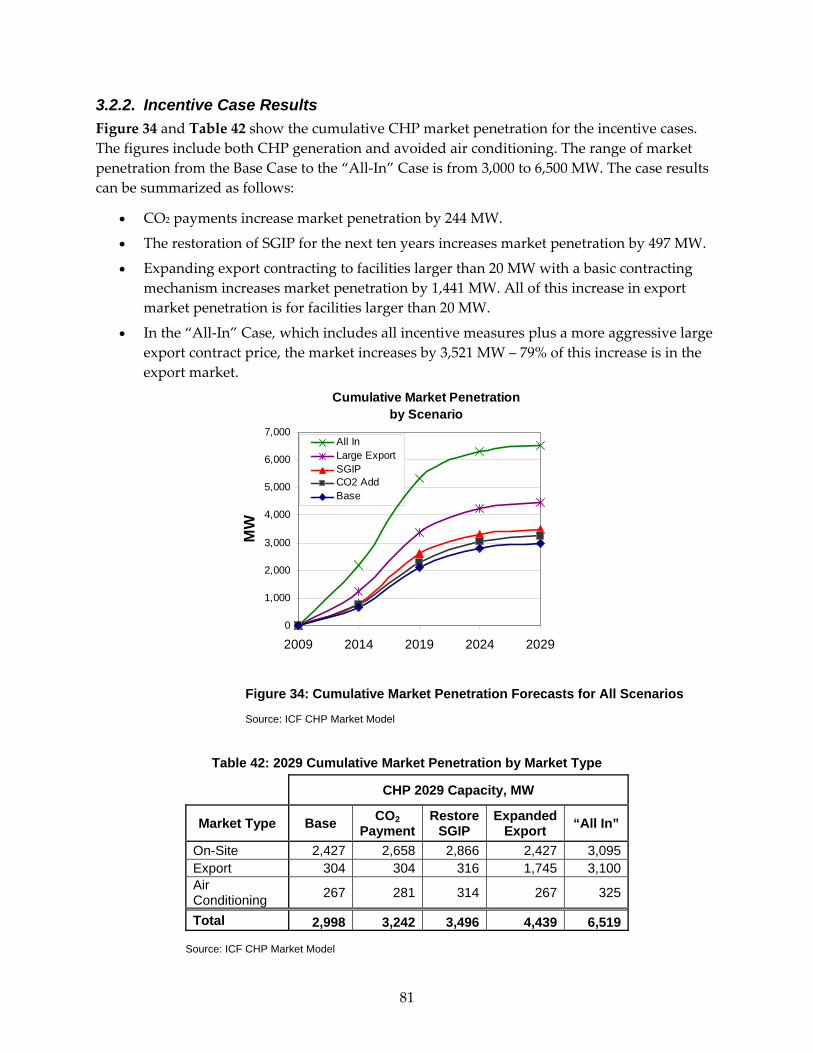
3.2.2. Incentive Case Results Figure 34 and Table 42 show the cumulative CHP market penetration for the incentive cases. The figures include both CHP generation and avoided air conditioning. The range of market penetration from the Base Case to the “All‐In” Case is from 3,000 to 6,500 MW. The case results can be summarized as follows:
• CO2 payments increase market penetration by 244 MW.
• The restoration of SGIP for the next ten years increases market penetration by 497 MW.
• Expanding export contracting to facilities larger than 20 MW with a basic contracting mechanism increases market penetration by 1,441 MW. All of this increase in export market penetration is for facilities larger than 20 MW.
• In the “All‐In” Case, which includes all incentive measures plus a more aggressive large export contract price, the market increases by 3,521 MW – 79% of this increase is in the export market.
Cumulative Market Penetration by Scenario
0
1,000
2,000
3,000
4,000
5,000
6,000
7,000
2009 2014 2019 2024 2029
MW
All InLarge ExportSGIPCO2 AddBase
Figure 34: Cumulative Market Penetration Forecasts for All Scenarios
Source: ICF CHP Market Model
Table 42: 2029 Cumulative Market Penetration by Market Type
CHP 2029 Capacity, MW
Market Type Base CO2 Payment
Restore SGIP
Expanded Export “All In”
On-Site 2,427 2,658 2,866 2,427 3,095 Export 304 304 316 1,745 3,100 Air Conditioning 267 281 314 267 325
Total 2,998 3,242 3,496 4,439 6,519
Source: ICF CHP Market Model
81
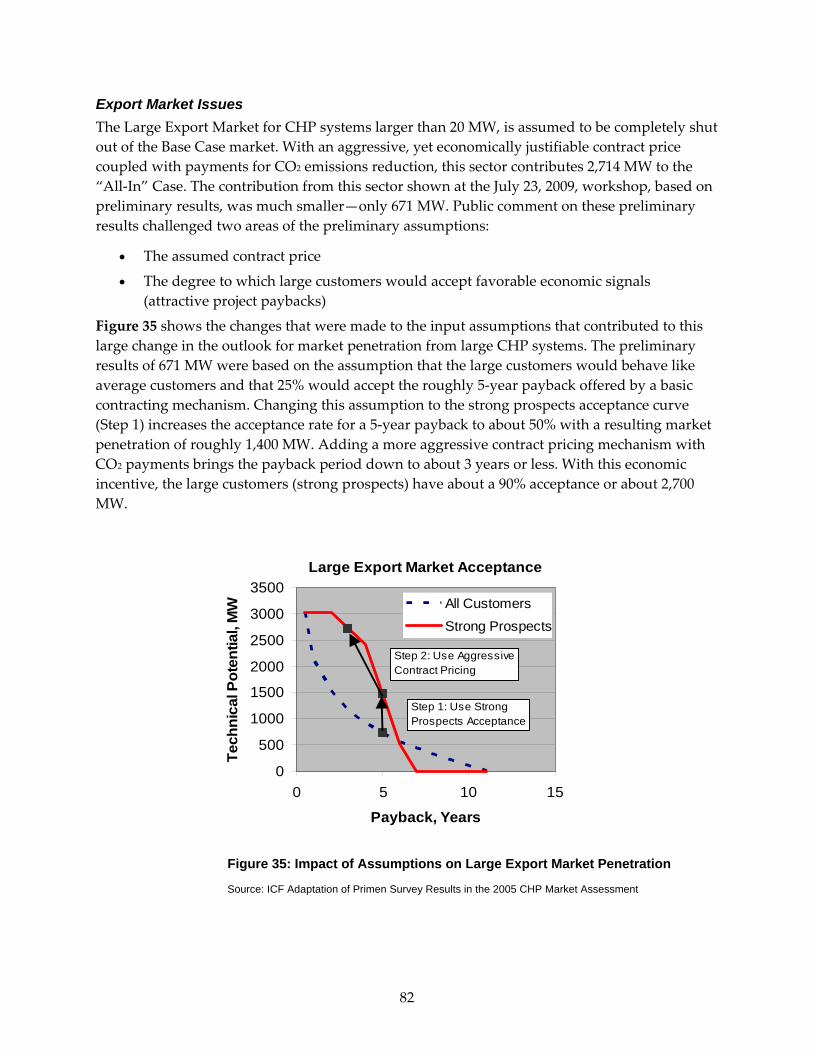
Export Market Issues The Large Export Market for CHP systems larger than 20 MW, is assumed to be completely shut out of the Base Case market. With an aggressive, yet economically justifiable contract price coupled with payments for CO2 emissions reduction, this sector contributes 2,714 MW to the “All‐In” Case. The contribution from this sector shown at the July 23, 2009, workshop, based on preliminary results, was much smaller—only 671 MW. Public comment on these preliminary results challenged two areas of the preliminary assumptions:
• The assumed contract price
• The degree to which large customers would accept favorable economic signals (attractive project paybacks)
Figure 35 shows the changes that were made to the input assumptions that contributed to this large change in the outlook for market penetration from large CHP systems. The preliminary results of 671 MW were based on the assumption that the large customers would behave like average customers and that 25% would accept the roughly 5‐year payback offered by a basic contracting mechanism. Changing this assumption to the strong prospects acceptance curve (Step 1) increases the acceptance rate for a 5‐year payback to about 50% with a resulting market penetration of roughly 1,400 MW. Adding a more aggressive contract pricing mechanism with CO2 payments brings the payback period down to about 3 years or less. With this economic incentive, the large customers (strong prospects) have about a 90% acceptance or about 2,700 MW.
Large Export Market Acceptance
0
500
1000
1500
2000
2500
3000
3500
0 5 10 15
Payback, Years
Tech
nica
l Pot
entia
l, M
W All Customers
Strong Prospects
Step 1: Use Strong Prospects Acceptance
Step 2: Use AggressiveContract Pricing
Figure 35: Impact of Assumptions on Large Export Market Penetration
Source: ICF Adaptation of Primen Survey Results in the 2005 CHP Market Assessment
82
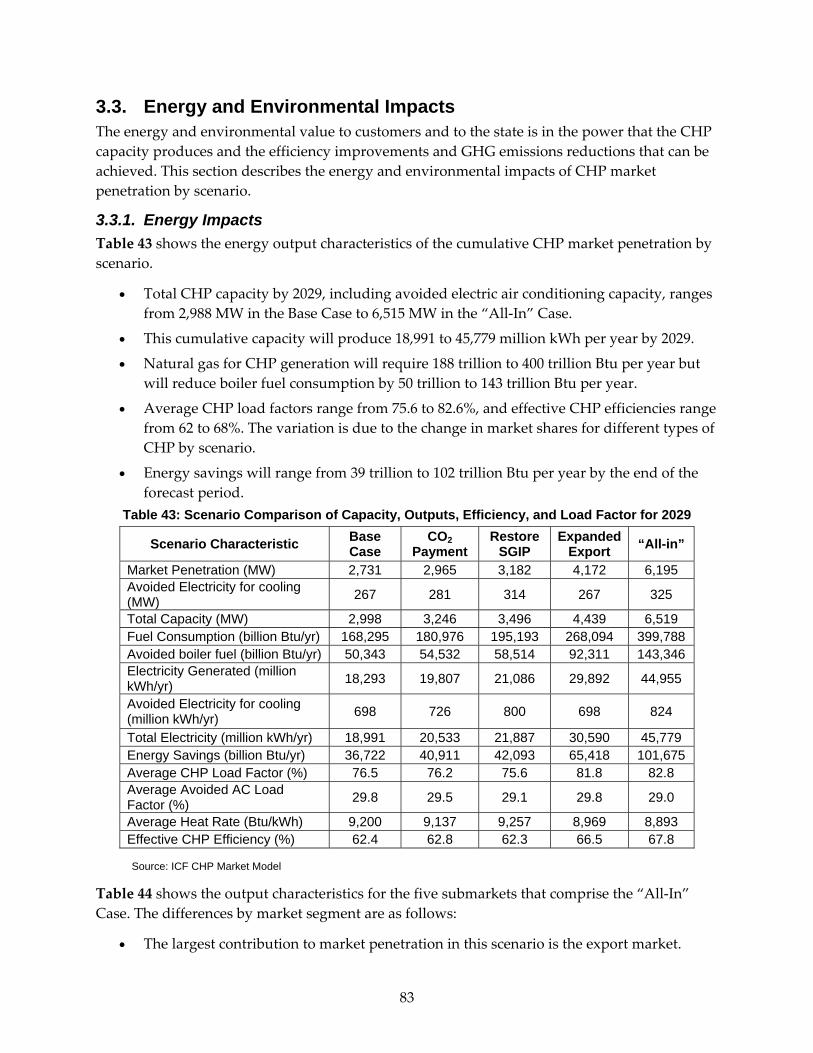
3.3. Energy and Environmental Impacts The energy and environmental value to customers and to the state is in the power that the CHP capacity produces and the efficiency improvements and GHG emissions reductions that can be achieved. This section describes the energy and environmental impacts of CHP market penetration by scenario.
3.3.1. Energy Impacts Table 43 shows the energy output characteristics of the cumulative CHP market penetration by scenario.
• Total CHP capacity by 2029, including avoided electric air conditioning capacity, ranges from 2,988 MW in the Base Case to 6,515 MW in the “All‐In” Case.
• This cumulative capacity will produce 18,991 to 45,779 million kWh per year by 2029.
• Natural gas for CHP generation will require 188 trillion to 400 trillion Btu per year but will reduce boiler fuel consumption by 50 trillion to 143 trillion Btu per year.
• Average CHP load factors range from 75.6 to 82.6%, and effective CHP efficiencies range from 62 to 68%. The variation is due to the change in market shares for different types of CHP by scenario.
• Energy savings will range from 39 trillion to 102 trillion Btu per year by the end of the forecast period.
Table 43: Scenario Comparison of Capacity, Outputs, Efficiency, and Load Factor for 2029
Scenario Characteristic Base Case
CO2 Payment
Restore SGIP
Expanded Export “All-in”
Market Penetration (MW) 2,731 2,965 3,182 4,172 6,195 Avoided Electricity for cooling (MW) 267 281 314 267 325
Total Capacity (MW) 2,998 3,246 3,496 4,439 6,519 Fuel Consumption (billion Btu/yr) 168,295 180,976 195,193 268,094 399,788 Avoided boiler fuel (billion Btu/yr) 50,343 54,532 58,514 92,311 143,346 Electricity Generated (million kWh/yr) 18,293 19,807 21,086 29,892 44,955
Avoided Electricity for cooling (million kWh/yr) 698 726 800 698 824
Total Electricity (million kWh/yr) 18,991 20,533 21,887 30,590 45,779 Energy Savings (billion Btu/yr) 36,722 40,911 42,093 65,418 101,675 Average CHP Load Factor (%) 76.5 76.2 75.6 81.8 82.8 Average Avoided AC Load Factor (%) 29.8 29.5 29.1 29.8 29.0
Average Heat Rate (Btu/kWh) 9,200 9,137 9,257 8,969 8,893 Effective CHP Efficiency (%) 62.4 62.8 62.3 66.5 67.8
Source: ICF CHP Market Model
Table 44 shows the output characteristics for the five submarkets that comprise the “All‐In” Case. The differences by market segment are as follows:
• The largest contribution to market penetration in this scenario is the export market.
83
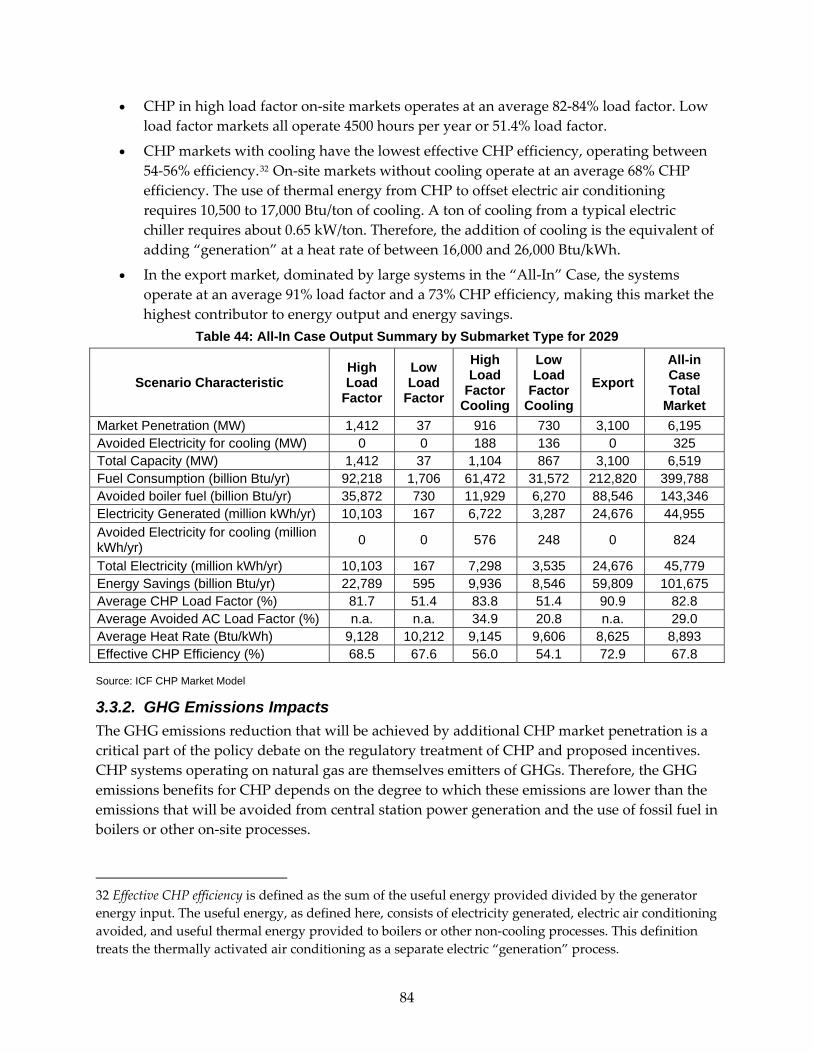
• CHP in high load factor on‐site markets operates at an average 82‐84% load factor. Low load factor markets all operate 4500 hours per year or 51.4% load factor.
• CHP markets with cooling have the lowest effective CHP efficiency, operating between 54‐56% efficiency.32 On‐site markets without cooling operate at an average 68% CHP efficiency. The use of thermal energy from CHP to offset electric air conditioning requires 10,500 to 17,000 Btu/ton of cooling. A ton of cooling from a typical electric chiller requires about 0.65 kW/ton. Therefore, the addition of cooling is the equivalent of adding “generation” at a heat rate of between 16,000 and 26,000 Btu/kWh.
• In the export market, dominated by large systems in the “All‐In” Case, the systems operate at an average 91% load factor and a 73% CHP efficiency, making this market the highest contributor to energy output and energy savings.
Table 44: All-In Case Output Summary by Submarket Type for 2029
Scenario Characteristic High Load
Factor
Low Load
Factor
High Load
Factor Cooling
Low Load
Factor Cooling
Export All-in Case Total
Market Market Penetration (MW) 1,412 37 916 730 3,100 6,195 Avoided Electricity for cooling (MW) 0 0 188 136 0 325 Total Capacity (MW) 1,412 37 1,104 867 3,100 6,519 Fuel Consumption (billion Btu/yr) 92,218 1,706 61,472 31,572 212,820 399,788 Avoided boiler fuel (billion Btu/yr) 35,872 730 11,929 6,270 88,546 143,346 Electricity Generated (million kWh/yr) 10,103 167 6,722 3,287 24,676 44,955 Avoided Electricity for cooling (million kWh/yr) 0 0 576 248 0 824
Total Electricity (million kWh/yr) 10,103 167 7,298 3,535 24,676 45,779 Energy Savings (billion Btu/yr) 22,789 595 9,936 8,546 59,809 101,675 Average CHP Load Factor (%) 81.7 51.4 83.8 51.4 90.9 82.8 Average Avoided AC Load Factor (%) n.a. n.a. 34.9 20.8 n.a. 29.0 Average Heat Rate (Btu/kWh) 9,128 10,212 9,145 9,606 8,625 8,893 Effective CHP Efficiency (%) 68.5 67.6 56.0 54.1 72.9 67.8
Source: ICF CHP Market Model
3.3.2. GHG Emissions Impacts The GHG emissions reduction that will be achieved by additional CHP market penetration is a critical part of the policy debate on the regulatory treatment of CHP and proposed incentives. CHP systems operating on natural gas are themselves emitters of GHGs. Therefore, the GHG emissions benefits for CHP depends on the degree to which these emissions are lower than the emissions that will be avoided from central station power generation and the use of fossil fuel in boilers or other on‐site processes.
32 Effective CHP efficiency is defined as the sum of the useful energy provided divided by the generator energy input. The useful energy, as defined here, consists of electricity generated, electric air conditioning avoided, and useful thermal energy provided to boilers or other non‐cooling processes. This definition treats the thermally activated air conditioning as a separate electric “generation” process.
84
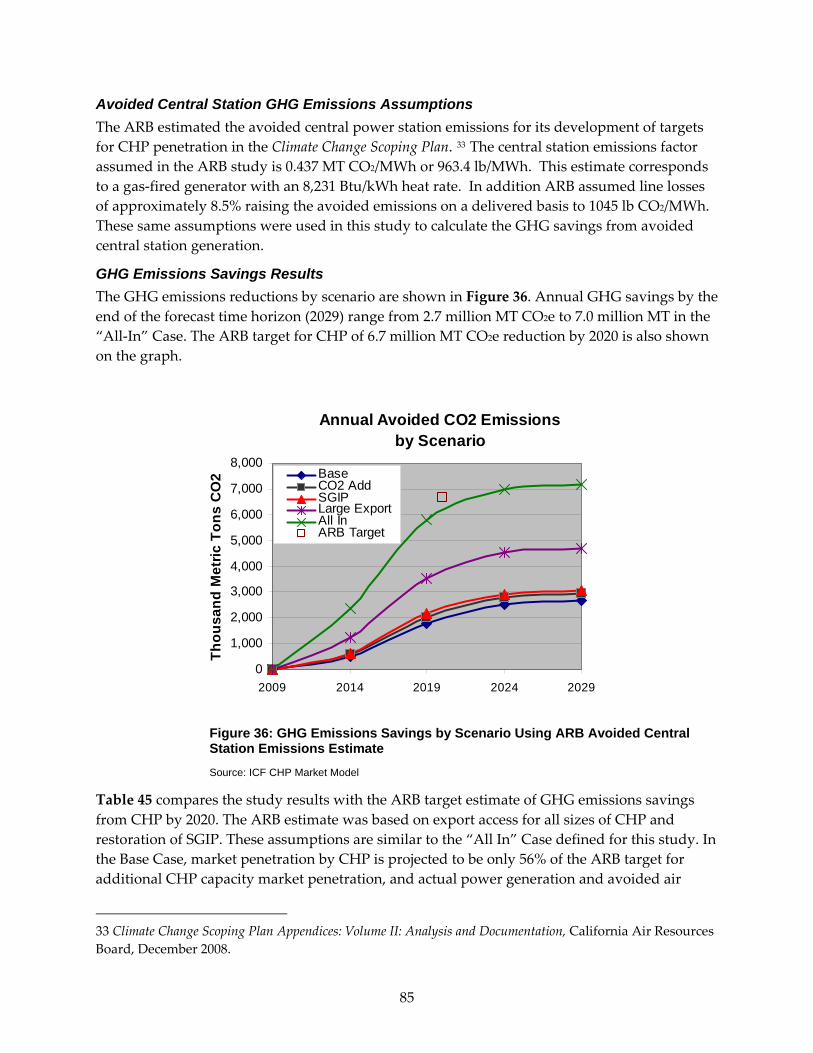
Avoided Central Station GHG Emissions Assumptions The ARB estimated the avoided central power station emissions for its development of targets for CHP penetration in the Climate Change Scoping Plan. 33 The central station emissions factor assumed in the ARB study is 0.437 MT CO2/MWh or 963.4 lb/MWh. This estimate corresponds to a gas‐fired generator with an 8,231 Btu/kWh heat rate. In addition ARB assumed line losses of approximately 8.5% raising the avoided emissions on a delivered basis to 1045 lb CO2/MWh. These same assumptions were used in this study to calculate the GHG savings from avoided central station generation.
GHG Emissions Savings Results The GHG emissions reductions by scenario are shown in Figure 36. Annual GHG savings by the end of the forecast time horizon (2029) range from 2.7 million MT CO2e to 7.0 million MT in the “All‐In” Case. The ARB target for CHP of 6.7 million MT CO2e reduction by 2020 is also shown on the graph.
Annual Avoided CO2 Emissions by Scenario
0
1,000
2,000
3,000
4,000
5,000
6,000
7,000
8,000
2009 2014 2019 2024 2029
Thou
sand
Met
ric T
ons
CO
2 BaseCO2 AddSGIPLarge ExportAll InARB Target
Figure 36: GHG Emissions Savings by Scenario Using ARB Avoided Central Station Emissions Estimate
Source: ICF CHP Market Model
Table 45 compares the study results with the ARB target estimate of GHG emissions savings from CHP by 2020. The ARB estimate was based on export access for all sizes of CHP and restoration of SGIP. These assumptions are similar to the “All In” Case defined for this study. In the Base Case, market penetration by CHP is projected to be only 56% of the ARB target for additional CHP capacity market penetration, and actual power generation and avoided air
33 Climate Change Scoping Plan Appendices: Volume II: Analysis and Documentation, California Air Resources Board, December 2008.
85
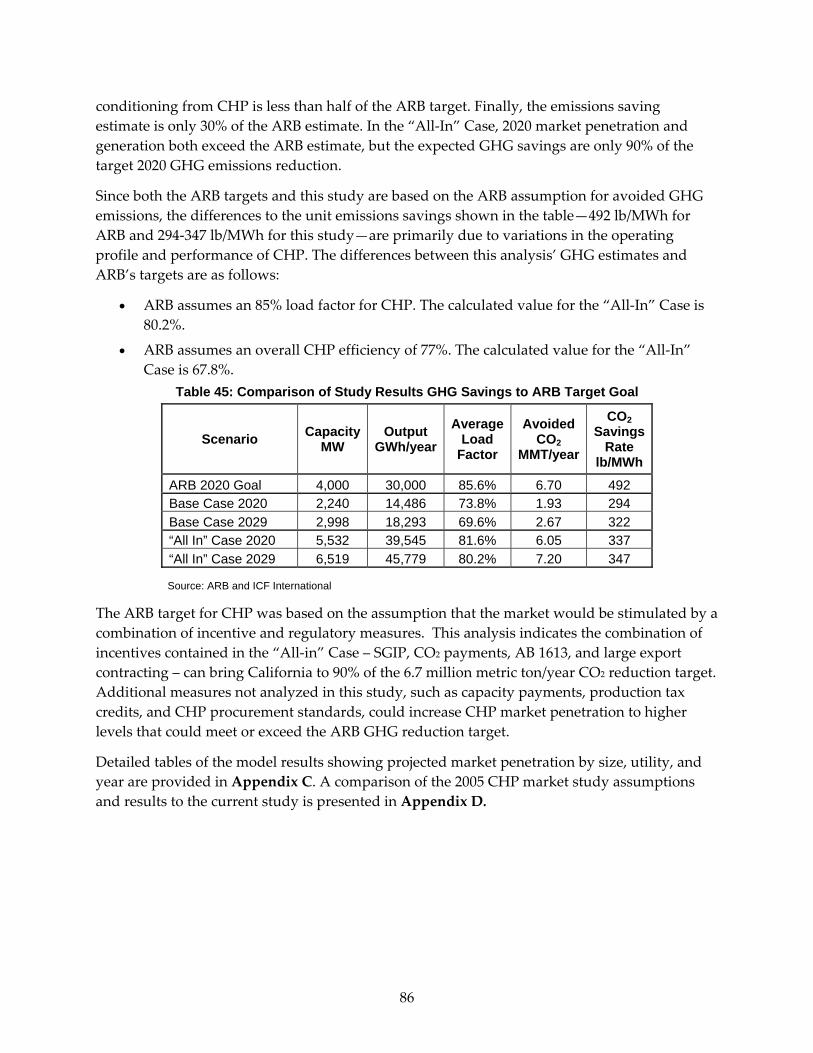
conditioning from CHP is less than half of the ARB target. Finally, the emissions saving estimate is only 30% of the ARB estimate. In the “All‐In” Case, 2020 market penetration and generation both exceed the ARB estimate, but the expected GHG savings are only 90% of the target 2020 GHG emissions reduction.
Since both the ARB targets and this study are based on the ARB assumption for avoided GHG emissions, the differences to the unit emissions savings shown in the table—492 lb/MWh for ARB and 294‐347 lb/MWh for this study—are primarily due to variations in the operating profile and performance of CHP. The differences between this analysis’ GHG estimates and ARB’s targets are as follows:
• ARB assumes an 85% load factor for CHP. The calculated value for the “All‐In” Case is 80.2%.
• ARB assumes an overall CHP efficiency of 77%. The calculated value for the “All‐In” Case is 67.8%.
Table 45: Comparison of Study Results GHG Savings to ARB Target Goal
Scenario Capacity MW
Output GWh/year
Average Load
Factor
Avoided CO2
MMT/year
CO2 Savings
Rate lb/MWh
ARB 2020 Goal 4,000 30,000 85.6% 6.70 492 Base Case 2020 2,240 14,486 73.8% 1.93 294 Base Case 2029 2,998 18,293 69.6% 2.67 322 “All In” Case 2020 5,532 39,545 81.6% 6.05 337 “All In” Case 2029 6,519 45,779 80.2% 7.20 347
Source: ARB and ICF International
The ARB target for CHP was based on the assumption that the market would be stimulated by a combination of incentive and regulatory measures. This analysis indicates the combination of incentives contained in the “All‐in” Case – SGIP, CO2 payments, AB 1613, and large export contracting – can bring California to 90% of the 6.7 million metric ton/year CO2 reduction target. Additional measures not analyzed in this study, such as capacity payments, production tax credits, and CHP procurement standards, could increase CHP market penetration to higher levels that could meet or exceed the ARB GHG reduction target.
Detailed tables of the model results showing projected market penetration by size, utility, and year are provided in Appendix C. A comparison of the 2005 CHP market study assumptions and results to the current study is presented in Appendix D.
86
4.0 Conclusions and Recommendations Without further changes in CHP regulation or policy (Base Case), about 3,000 MW of CHP capacity (both generation and avoided air conditioning) will penetrate the market over the next 20 years. This forecast is considerably below the ARB AB 32 Scoping Plan target of 4,000 MW over the next 11 years.
An aggressive set of policy measures to stimulate CHP can more than double this market penetration to over 6,500 MW in the next 20 years (“All‐In” Case). The policy measures assumed to be implemented to achieve these market results are the restoration of the SGIP program, the addition of payments to CO2 operators of $50/ton for their effective reductions in CO2 emissions compared to the separate purchase of grid power and fuel for boiler use, and the creation of an export market for large facilities, not currently covered by AB 1613.
The estimated GHG emissions reductions that will be achieved in each of these alternative futures range from 2.9 million to 7.2 million MT of CO2 by 2029–1.9 million to 6.0 million MT of CO2 by 2020.
While the analysis in this study focused on new CHP market penetration, close to 8,800 MW of existing CHP was identified. A large percentage of this CHP, about 5600 MW, is providing power to utilities under existing QF contracts. Existing CHP is larger than the expected growth of new CHP under any scenario in the next 20 years. Therefore, it is important to define regulatory policies that contribute to the preservation of the existing CHP capacity.
During the analysis of existing CHP and the development of estimates for technical potential and market penetration for new CHP, it became clear that there are essentially two types of CHP – projects larger than 20 MW and projects smaller than 20 MW. These two types of projects have differing characteristics and require different measures to stimulate additional market penetration. Table 46 shows the comparison between large CHP and small CHP. Large CHP has 87% of the existing market penetration. In the Base Case, only a very small amount of large CHP penetrates the market, about 10% of the total penetration for the Base Case. In the “All‐In” Case, there is a roughly even split in the market penetration for large and small CHP.
87
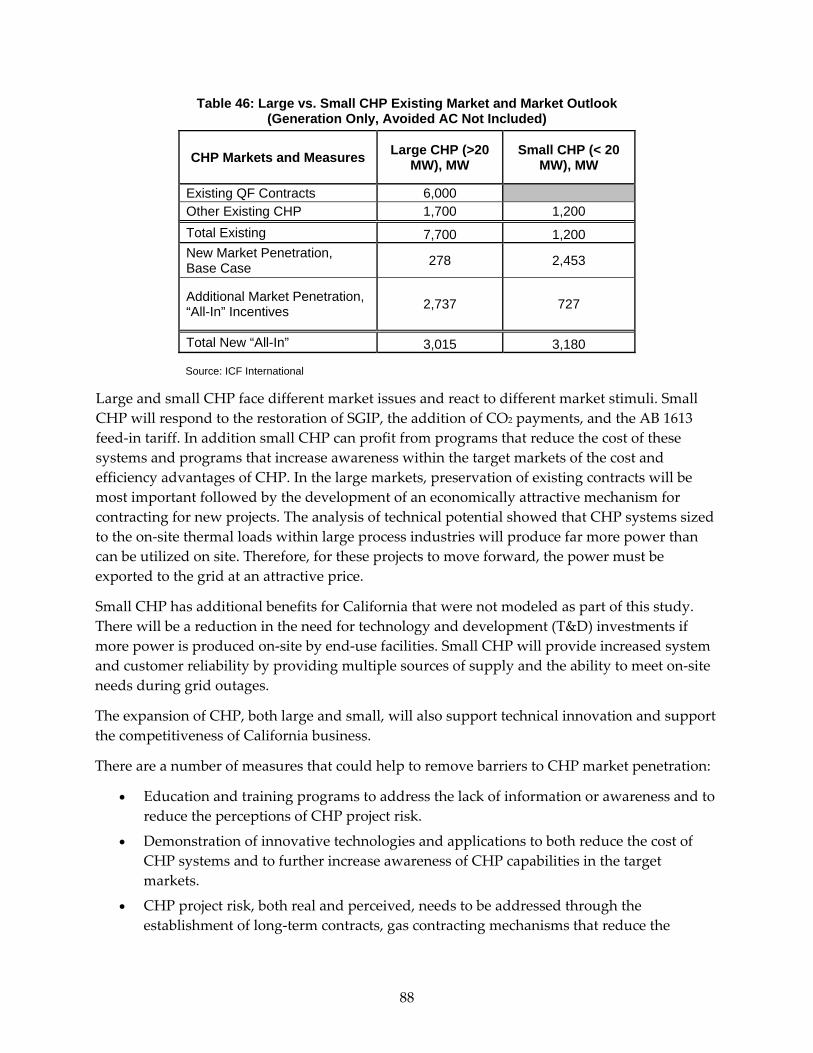
Table 46: Large vs. Small CHP Existing Market and Market Outlook (Generation Only, Avoided AC Not Included)
CHP Markets and Measures Large CHP (>20 MW), MW
Small CHP (< 20 MW), MW
Existing QF Contracts 6,000 Other Existing CHP 1,700 1,200 Total Existing 7,700 1,200 New Market Penetration, Base Case 278 2,453
Additional Market Penetration, “All-In” Incentives 2,737 727
Total New “All-In” 3,015 3,180
Source: ICF International
Large and small CHP face different market issues and react to different market stimuli. Small CHP will respond to the restoration of SGIP, the addition of CO2 payments, and the AB 1613 feed‐in tariff. In addition small CHP can profit from programs that reduce the cost of these systems and programs that increase awareness within the target markets of the cost and efficiency advantages of CHP. In the large markets, preservation of existing contracts will be most important followed by the development of an economically attractive mechanism for contracting for new projects. The analysis of technical potential showed that CHP systems sized to the on‐site thermal loads within large process industries will produce far more power than can be utilized on site. Therefore, for these projects to move forward, the power must be exported to the grid at an attractive price.
Small CHP has additional benefits for California that were not modeled as part of this study. There will be a reduction in the need for technology and development (T&D) investments if more power is produced on‐site by end‐use facilities. Small CHP will provide increased system and customer reliability by providing multiple sources of supply and the ability to meet on‐site needs during grid outages.
The expansion of CHP, both large and small, will also support technical innovation and support the competitiveness of California business.
There are a number of measures that could help to remove barriers to CHP market penetration:
• Education and training programs to address the lack of information or awareness and to reduce the perceptions of CHP project risk.
• Demonstration of innovative technologies and applications to both reduce the cost of CHP systems and to further increase awareness of CHP capabilities in the target markets.
• CHP project risk, both real and perceived, needs to be addressed through the establishment of long‐term contracts, gas contracting mechanisms that reduce the
88
negative effects of gas price volatility, and improvement of CHP technology cost and performance.
• Reduction in the degree of non‐bypassable charges that CHP must pay and encouraging economic treatment for CHP.
• Provision of incentives to internalize the social benefits of CHP energy efficiency, GHG emissions reductions, T&D support, peak capacity, and system reliability.
The quantification of the GHG emissions reduction benefits due to CHP deployment and use depends on the emissions of the central power being displaced. Further work should be done to determine what the marginal source of power will be over the next 20 years and what are the appropriate values to use when comparing to baseload CHP, low load factor CHP, and for avoided electric air conditioning. In addition to defining the marginal sources of power during different time periods, it is also important to evaluate the expected line losses appropriate for different types and sizes of CHP at different times of the year.
Improved methods for measuring and accounting for the thermal energy utilization need to be developed and deployed because the utilization of thermal energy provides the added benefits for CHP compared to the separate purchase of fuel and power. High thermal utilization needs to be specifically encouraged. In this regard, higher efficiency absorption chillers or other thermally activated cooling technologies need to be developed and demonstrated to improve the GHG emissions performance of CHP in applications with cooling.
89

90
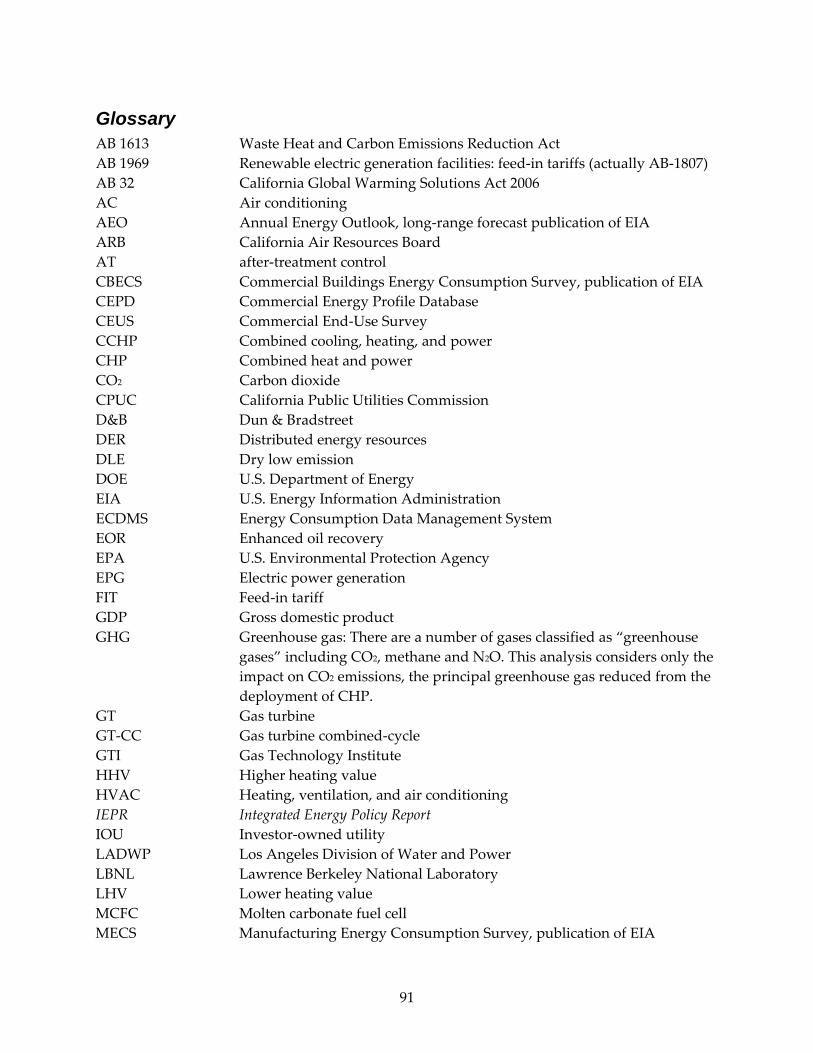
Glossary AB 1613 Waste Heat and Carbon Emissions Reduction Act AB 1969 Renewable electric generation facilities: feed‐in tariffs (actually AB‐1807) AB 32 California Global Warming Solutions Act 2006 AC Air conditioning AEO Annual Energy Outlook, long‐range forecast publication of EIA ARB California Air Resources Board AT after‐treatment control CBECS Commercial Buildings Energy Consumption Survey, publication of EIA CEPD Commercial Energy Profile Database CEUS Commercial End‐Use Survey CCHP Combined cooling, heating, and power CHP Combined heat and power CO2 Carbon dioxide CPUC California Public Utilities Commission D&B Dun & Bradstreet DER Distributed energy resources DLE Dry low emission DOE U.S. Department of Energy EIA U.S. Energy Information Administration ECDMS Energy Consumption Data Management System EOR Enhanced oil recovery EPA U.S. Environmental Protection Agency EPG Electric power generation FIT Feed‐in tariff GDP Gross domestic product GHG Greenhouse gas: There are a number of gases classified as “greenhouse
gases” including CO2, methane and N2O. This analysis considers only the impact on CO2 emissions, the principal greenhouse gas reduced from the deployment of CHP.
GT Gas turbine GT‐CC Gas turbine combined‐cycle GTI Gas Technology Institute HHV Higher heating value HVAC Heating, ventilation, and air conditioning IEPR Integrated Energy Policy Report IOU Investor‐owned utility LADWP Los Angeles Division of Water and Power LBNL Lawrence Berkeley National Laboratory LHV Lower heating value MCFC Molten carbonate fuel cell MECS Manufacturing Energy Consumption Survey, publication of EIA
91
92
MIPD Major Industrial Plant Database MPR Market price referent MT Metric ton, equal to 2,205 pounds NAICS North American Industry Classification System NOx Nitrogen oxides NREL National Renewable Energy Laboratory NYSERDA New York State Energy Research and Development Agency ORNL Oak Ridge National Laboratory, U.S. Department of Energy PAFC Phosphoric acid fuel cell PEM Proton exchange membrane P/H Power‐to‐heat ratio PG&E Pacific Gas and Electric Company PURPA Public Utility Regulatory Policies Act of 1978 QF Qualifying facility, legal designation of CHP under PURPA SB 412 Requires CPUC to continue SGIP SCE Southern California Edison Company SCR Selective catalytic reduction SDG&E San Diego Gas & Electric Company SGIP Self‐Generation Incentive Program SI Spark ignition SIC Standard Industrial Classification SMUD Sacramento Municipal Utility District SOFC Solid oxide fuel cell T&D Transmission and distribution WECC Western Electric Coordinating Council
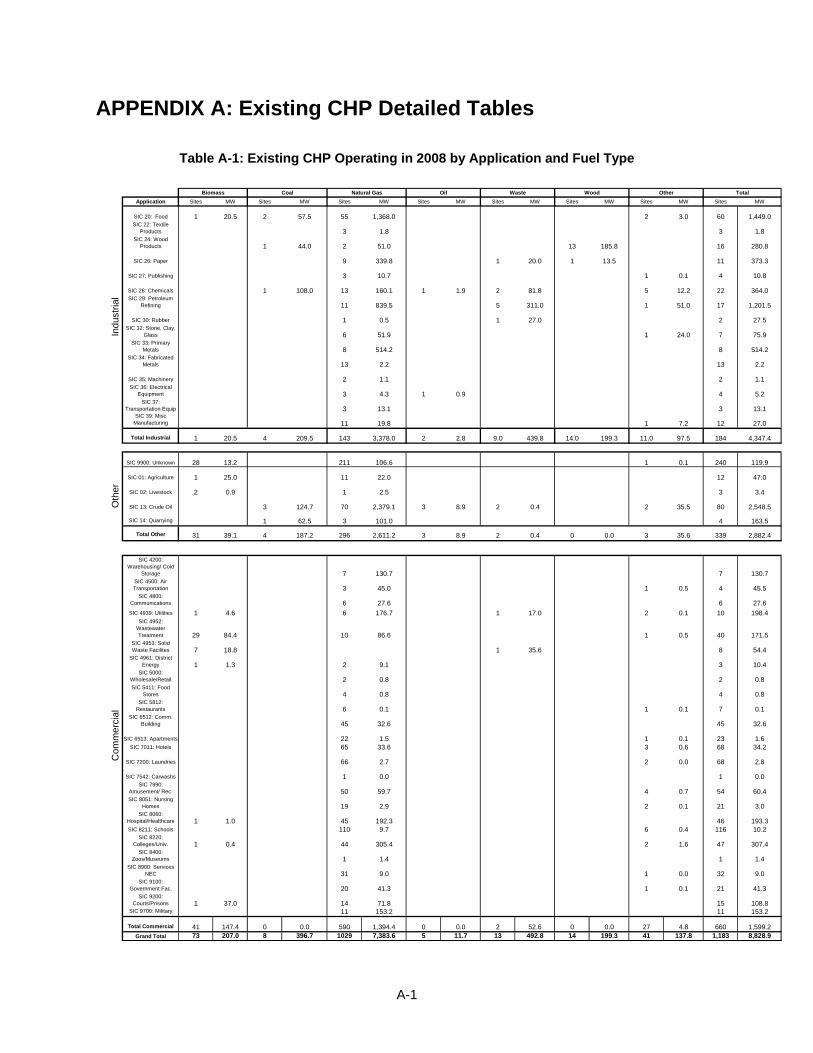
APPENDIX A: Existing CHP Detailed Tables
Table A-1: Existing CHP Operating in 2008 by Application and Fuel Type
Application Sites MW Sites MW Sites MW Sites MW Sites MW Sites MW Sites MW Sites MW
SIC 20: Food 1 20.5 2 57.5 55 1,368.0 2 3.0 60 1,449.0SIC 22: Textile
Products 3 1.8 3 1.8SIC 24: Wood
Products 1 44.0 2 51.0 13 185.8 16 280.8
SIC 26: Paper 9 339.8 1 20.0 1 13.5 11 373.3
SIC 27: Publishing 3 10.7 1 0.1 4 10.8
SIC 28: Chemicals 1 108.0 13 160.1 1 1.9 2 81.8 5 12.2 22 364.0SIC 29: Petroleum
Refining 11 839.5 5 311.0 1 51.0 17 1,201.5
SIC 30: Rubber 1 0.5 1 27.0 2 27.5SIC 32: Stone, Clay,
Glass 6 51.9 1 24.0 7 75.9SIC 33: Primary
Metals 8 514.2 8 514.2SIC 34: Fabricated
Metals 13 2.2 13 2.2
SIC 35: Machinery 2 1.1 2 1.1SIC 36: Electrical
Equipment 3 4.3 1 0.9 4 5.2SIC 37:
Transportation Equip 3 13.1 3 13.1SIC 39: Misc
Manufacturing 11 19.8 1 7.2 12 27.0
Total Industrial 1 20.5 4 209.5 143 3,378.0 2 2.8 9.0 439.8 14.0 199.3 11.0 97.5 184 4,347.4
SIC 9900: Unknown 28 13.2 211 106.6 1 0.1 240 119.9
SIC 01: Agriculture 1 25.0 11 22.0 12 47.0
SIC 02: Livestock 2 0.9 1 2.5 3 3.4
SIC 13: Crude Oil 3 124.7 70 2,379.1 3 8.9 2 0.4 2 35.5 80 2,548.5
SIC 14: Quarrying 1 62.5 3 101.0 4 163.5
Total Other 31 39.1 4 187.2 296 2,611.2 3 8.9 2 0.4 0 0.0 3 35.6 339 2,882.4
SIC 4200: Warehousing/ Cold
Storage 7 130.7 7 130.7SIC 4500: Air Transportation 3 45.0 1 0.5 4 45.5
SIC 4800: Communications 6 27.6 6 27.6SIC 4939: Utilities 1 4.6 6 176.7 1 17.0 2 0.1 10 198.4
SIC 4952: Wastewater Treatment 29 84.4 10 86.6 1 0.5 40 171.5
SIC 4953: Solid Waste Facilites 7 18.8 1 35.6 8 54.4
SIC 4961: District Energy 1 1.3 2 9.1 3 10.4
SIC 5000: Wholesale/Retail 2 0.8 2 0.8SIC 5411: Food
Stores 4 0.8 4 0.8SIC 5812:
Restaurants 6 0.1 1 0.1 7 0.1SIC 6512: Comm.
Building 45 32.6 45 32.6
SIC 6513: Apartments 22 1.5 1 0.1 23 1.6SIC 7011: Hotels 65 33.6 3 0.6 68 34.2
SIC 7200: Laundries 66 2.7 2 0.0 68 2.8
SIC 7542: Carwashs 1 0.0 1 0.0SIC 7990:
Amusement/ Rec. 50 59.7 4 0.7 54 60.4SIC 8051: Nursing
Homes 19 2.9 2 0.1 21 3.0SIC 8060:
Hospital/Healthcare 1 1.0 45 192.3 46 193.3SIC 8211: Schools 110 9.7 6 0.4 116 10.2
SIC 8220: Colleges/Univ. 1 0.4 44 305.4 2 1.6 47 307.4
SIC 8400: Zoos/Museums 1 1.4 1 1.4
SIC 8900: Services NEC 31 9.0 1 0.0 32 9.0
SIC 9100: Government Fac. 20 41.3 1 0.1 21 41.3
SIC 9200: Courts/Prisons 1 37.0 14 71.8 15 108.8
SIC 9700: Military 11 153.2 11 153.2
Total Commercial 41 147.4 0 0.0 590 1,394.4 0 0.0 2 52.6 0 0.0 27 4.8 660 1,599.2Grand Total 73 207.0 8 396.7 1029 7,383.6 5 11.7 13 492.8 14 199.3 41 137.8 1,183 8,828.9
Total
Com
mer
cial
Oth
erIn
dust
rial
Waste Wood OtherBiomass Coal Natural Gas Oil
A-1
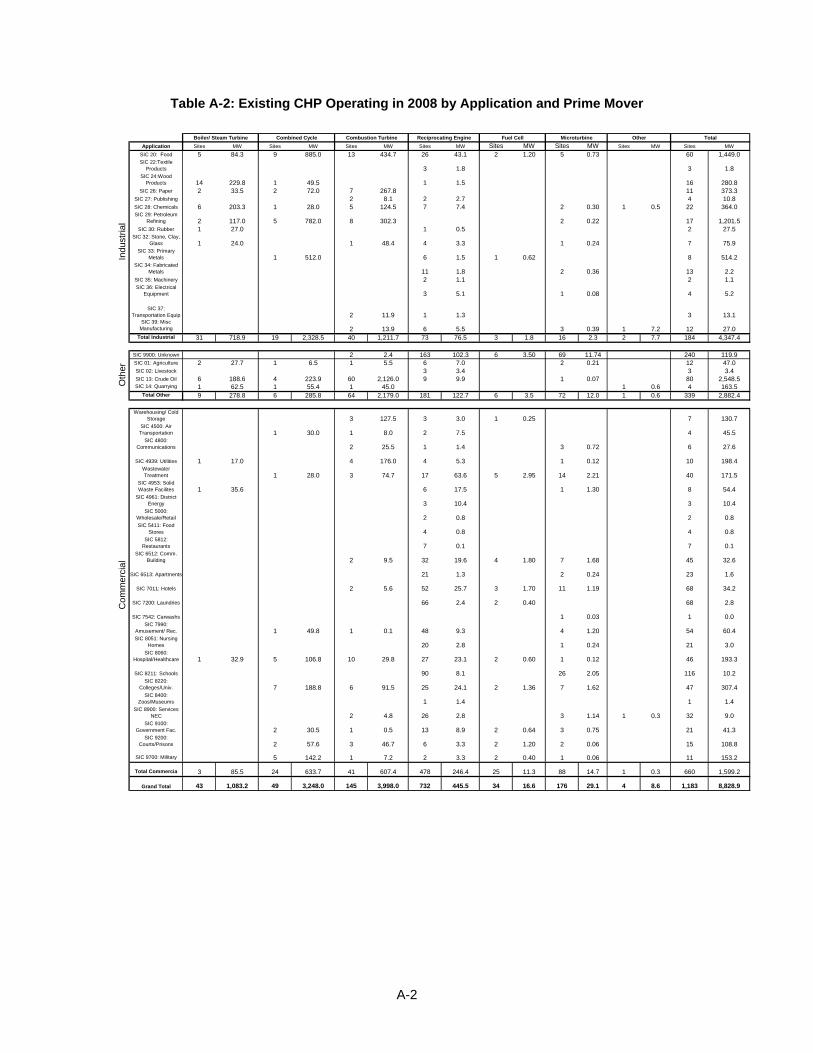
Table A-2: Existing CHP Operating in 2008 by Application and Prime Mover
Application Sites MW Sites MW Sites MW Sites MW Sites MW Sites MW Sites MW Sites MWSIC 20: Food 5 84.3 9 885.0 13 434.7 26 43.1 2 1.20 5 0.73 60 1,449.0SIC 22:Textile
Products 3 1.8 3 1.8SIC 24:Wood
Products 14 229.8 1 49.5 1 1.5 16 280.8SIC 26: Paper 2 33.5 2 72.0 7 267.8 11 373.3
SIC 27: Publishing 2 8.1 2 2.7 4 10.8SIC 28: Chemicals 6 203.3 1 28.0 5 124.5 7 7.4 2 0.30 1 0.5 22 364.0SIC 29: Petroleum
Refining 2 117.0 5 782.0 8 302.3 2 0.22 17 1,201.5SIC 30: Rubber 1 27.0 1 0.5 2 27.5
SIC 32: Stone, Clay, Glass 1 24.0 1 48.4 4 3.3 1 0.24 7 75.9
SIC 33: Primary Metals 1 512.0 6 1.5 1 0.62 8 514.2
SIC 34: Fabricated Metals 11 1.8 2 0.36 13 2.2
SIC 35: Machinery 2 1.1 2 1.1SIC 36: Electrical
Equipment 3 5.1 1 0.08 4 5.2
SIC 37: Transportation Equip 2 11.9 1 1.3 3 13.1
SIC 39: Misc Manufacturing 2 13.9 6 5.5 3 0.39 1 7.2 12 27.0
Total Industrial 31 718.9 19 2,328.5 40 1,211.7 73 76.5 3 1.8 16 2.3 2 7.7 184 4,347.4
SIC 9900: Unknown 2 2.4 163 102.3 6 3.50 69 11.74 240 119.9SIC 01: Agriculture 2 27.7 1 6.5 1 5.5 6 7.0 2 0.21 12 47.0SIC 02: Livestock 3 3.4 3 3.4SIC 13: Crude Oil 6 188.6 4 223.9 60 2,126.0 9 9.9 1 0.07 80 2,548.5SIC 14: Quarrying 1 62.5 1 55.4 1 45.0 1 0.6 4 163.5
Total Other 9 278.8 6 285.8 64 2,179.0 181 122.7 6 3.5 72 12.0 1 0.6 339 2,882.4
Warehousing/ Cold Storage 3 127.5 3 3.0 1 0.25 7 130.7
SIC 4500: Air Transportation 1 30.0 1 8.0 2 7.5 4 45.5
SIC 4800: Communications 2 25.5 1 1.4 3 0.72 6 27.6
SIC 4939: Utilities 1 17.0 4 176.0 4 5.3 1 0.12 10 198.4Wastewater Treatment 1 28.0 3 74.7 17 63.6 5 2.95 14 2.21 40 171.5
SIC 4953: Solid Waste Facilites 1 35.6 6 17.5 1 1.30 8 54.4
SIC 4961: District Energy 3 10.4 3 10.4
SIC 5000: Wholesale/Retail 2 0.8 2 0.8SIC 5411: Food
Stores 4 0.8 4 0.8SIC 5812:
Restaurants 7 0.1 7 0.1SIC 6512: Comm.
Building 2 9.5 32 19.6 4 1.80 7 1.68 45 32.6
SIC 6513: Apartments 21 1.3 2 0.24 23 1.6
SIC 7011: Hotels 2 5.6 52 25.7 3 1.70 11 1.19 68 34.2
SIC 7200: Laundries 66 2.4 2 0.40 68 2.8
SIC 7542: Carwashs 1 0.03 1 0.0SIC 7990:
Amusement/ Rec. 1 49.8 1 0.1 48 9.3 4 1.20 54 60.4SIC 8051: Nursing
Homes 20 2.8 1 0.24 21 3.0SIC 8060:
Hospital/Healthcare 1 32.9 5 106.8 10 29.8 27 23.1 2 0.60 1 0.12 46 193.3
SIC 8211: Schools 90 8.1 26 2.05 116 10.2SIC 8220:
Colleges/Univ. 7 188.8 6 91.5 25 24.1 2 1.36 7 1.62 47 307.4SIC 8400:
Zoos/Museums 1 1.4 1 1.4SIC 8900: Services
NEC 2 4.8 26 2.8 3 1.14 1 0.3 32 9.0SIC 9100:
Government Fac. 2 30.5 1 0.5 13 8.9 2 0.64 3 0.75 21 41.3SIC 9200:
Courts/Prisons 2 57.6 3 46.7 6 3.3 2 1.20 2 0.06 15 108.8
SIC 9700: Military 5 142.2 1 7.2 2 3.3 2 0.40 1 0.06 11 153.2
Total Commercia 3 85.5 24 633.7 41 607.4 478 246.4 25 11.3 88 14.7 1 0.3 660 1,599.2
Grand Total 43 1,083.2 49 3,248.0 145 3,998.0 732 445.5 34 16.6 176 29.1 4 8.6 1,183 8,828.9
OtherReciprocating Engine TotalFuel Cell
Com
mer
cial
Oth
erMicroturbine
Indu
stria
lBoiler/ Steam Turbine Combined Cycle Combustion Turbine
A-2

APPENDIX B: Electricity Consumption per Employee Estimates
Industrial Information on industrial energy use by employee was derived from the 2002 U.S. Census of Manufacturing, available at: http://www.census.gov/econ/census02/guide/INDRPT31.HTM The Census of Manufacturing has information at the six‐digit NAICS level of number of establishments, number of employees, and amount of electricity used in kWh. This data was used to calculate the MWh per employee for each industrial application.
B-1
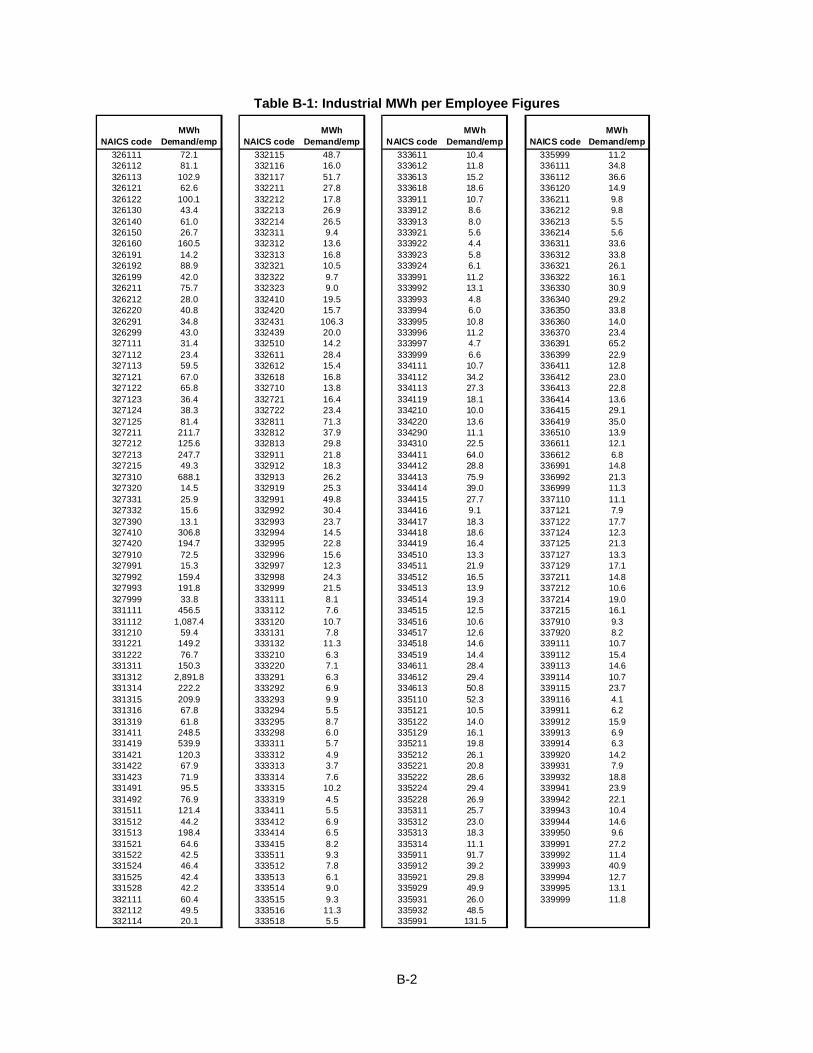
Table B-1: Industrial MWh per Employee Figures
NAICS codeMWh
Demand/emp NAICS codeMWh
Demand/emp NAICS codeMWh
Demand/emp NAICS codeMWh
Demand/emp326111 72.1 332115 48.7 333611 10.4 335999 11.2326112 81.1 332116 16.0 333612 11.8 336111 34.8326113 102.9 332117 51.7 333613 15.2 336112 36.6326121 62.6 332211 27.8 333618 18.6 336120 14.9326122 100.1 332212 17.8 333911 10.7 336211 9.8326130 43.4 332213 26.9 333912 8.6 336212 9.8326140 61.0 332214 26.5 333913 8.0 336213 5.5326150 26.7 332311 9.4 333921 5.6 336214 5.6326160 160.5 332312 13.6 333922 4.4 336311 33.6326191 14.2 332313 16.8 333923 5.8 336312 33.8326192 88.9 332321 10.5 333924 6.1 336321 26.1326199 42.0 332322 9.7 333991 11.2 336322 16.1326211 75.7 332323 9.0 333992 13.1 336330 30.9326212 28.0 332410 19.5 333993 4.8 336340 29.2326220 40.8 332420 15.7 333994 6.0 336350 33.8326291 34.8 332431 106.3 333995 10.8 336360 14.0326299 43.0 332439 20.0 333996 11.2 336370 23.4327111 31.4 332510 14.2 333997 4.7 336391 65.2327112 23.4 332611 28.4 333999 6.6 336399 22.9327113 59.5 332612 15.4 334111 10.7 336411 12.8327121 67.0 332618 16.8 334112 34.2 336412 23.0327122 65.8 332710 13.8 334113 27.3 336413 22.8327123 36.4 332721 16.4 334119 18.1 336414 13.6327124 38.3 332722 23.4 334210 10.0 336415 29.1327125 81.4 332811 71.3 334220 13.6 336419 35.0327211 211.7 332812 37.9 334290 11.1 336510 13.9327212 125.6 332813 29.8 334310 22.5 336611 12.1327213 247.7 332911 21.8 334411 64.0 336612 6.8327215 49.3 332912 18.3 334412 28.8 336991 14.8327310 688.1 332913 26.2 334413 75.9 336992 21.3327320 14.5 332919 25.3 334414 39.0 336999 11.3327331 25.9 332991 49.8 334415 27.7 337110 11.1327332 15.6 332992 30.4 334416 9.1 337121 7.9327390 13.1 332993 23.7 334417 18.3 337122 17.7327410 306.8 332994 14.5 334418 18.6 337124 12.3327420 194.7 332995 22.8 334419 16.4 337125 21.3327910 72.5 332996 15.6 334510 13.3 337127 13.3327991 15.3 332997 12.3 334511 21.9 337129 17.1327992 159.4 332998 24.3 334512 16.5 337211 14.8327993 191.8 332999 21.5 334513 13.9 337212 10.6327999 33.8 333111 8.1 334514 19.3 337214 19.0331111 456.5 333112 7.6 334515 12.5 337215 16.1331112 1,087.4 333120 10.7 334516 10.6 337910 9.3331210 59.4 333131 7.8 334517 12.6 337920 8.2331221 149.2 333132 11.3 334518 14.6 339111 10.7331222 76.7 333210 6.3 334519 14.4 339112 15.4331311 150.3 333220 7.1 334611 28.4 339113 14.6331312 2,891.8 333291 6.3 334612 29.4 339114 10.7331314 222.2 333292 6.9 334613 50.8 339115 23.7331315 209.9 333293 9.9 335110 52.3 339116 4.1331316 67.8 333294 5.5 335121 10.5 339911 6.2331319 61.8 333295 8.7 335122 14.0 339912 15.9331411 248.5 333298 6.0 335129 16.1 339913 6.9331419 539.9 333311 5.7 335211 19.8 339914 6.3331421 120.3 333312 4.9 335212 26.1 339920 14.2331422 67.9 333313 3.7 335221 20.8 339931 7.9331423 71.9 333314 7.6 335222 28.6 339932 18.8331491 95.5 333315 10.2 335224 29.4 339941 23.9331492 76.9 333319 4.5 335228 26.9 339942 22.1331511 121.4 333411 5.5 335311 25.7 339943 10.4331512 44.2 333412 6.9 335312 23.0 339944 14.6331513 198.4 333414 6.5 335313 18.3 339950 9.6331521 64.6 333415 8.2 335314 11.1 339991 27.2331522 42.5 333511 9.3 335911 91.7 339992 11.4331524 46.4 333512 7.8 335912 39.2 339993 40.9331525 42.4 333513 6.1 335921 29.8 339994 12.7331528 42.2 333514 9.0 335929 49.9 339995 13.1332111 60.4 333515 9.3 335931 26.0 339999 11.8332112 49.5 333516 11.3 335932 48.5332114 20.1 333518 5.5 335991 131.5
B-2
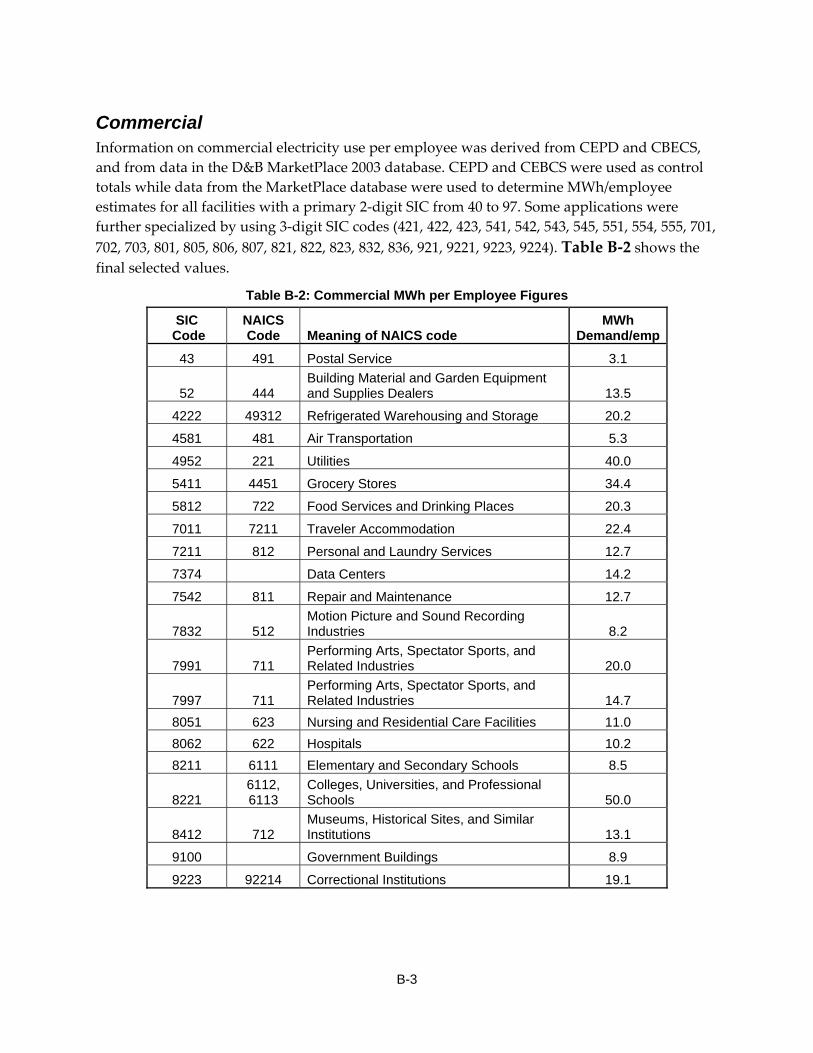
Commercial Information on commercial electricity use per employee was derived from CEPD and CBECS, and from data in the D&B MarketPlace 2003 database. CEPD and CEBCS were used as control totals while data from the MarketPlace database were used to determine MWh/employee estimates for all facilities with a primary 2‐digit SIC from 40 to 97. Some applications were further specialized by using 3‐digit SIC codes (421, 422, 423, 541, 542, 543, 545, 551, 554, 555, 701, 702, 703, 801, 805, 806, 807, 821, 822, 823, 832, 836, 921, 9221, 9223, 9224). Table B‐2 shows the final selected values.
Table B-2: Commercial MWh per Employee Figures
SIC Code
NAICS Code Meaning of NAICS code
MWh Demand/emp
43 491 Postal Service 3.1
52 444 Building Material and Garden Equipment and Supplies Dealers 13.5
4222 49312 Refrigerated Warehousing and Storage 20.2
4581 481 Air Transportation 5.3
4952 221 Utilities 40.0
5411 4451 Grocery Stores 34.4
5812 722 Food Services and Drinking Places 20.3
7011 7211 Traveler Accommodation 22.4
7211 812 Personal and Laundry Services 12.7
7374 Data Centers 14.2
7542 811 Repair and Maintenance 12.7
7832 512 Motion Picture and Sound Recording Industries 8.2
7991 711 Performing Arts, Spectator Sports, and Related Industries 20.0
7997 711 Performing Arts, Spectator Sports, and Related Industries 14.7
8051 623 Nursing and Residential Care Facilities 11.0 8062 622 Hospitals 10.2 8211 6111 Elementary and Secondary Schools 8.5
8221 6112, 6113
Colleges, Universities, and Professional Schools 50.0
8412 712 Museums, Historical Sites, and Similar Institutions 13.1
9100 Government Buildings 8.9
9223 92214 Correctional Institutions 19.1
B-3

B-4
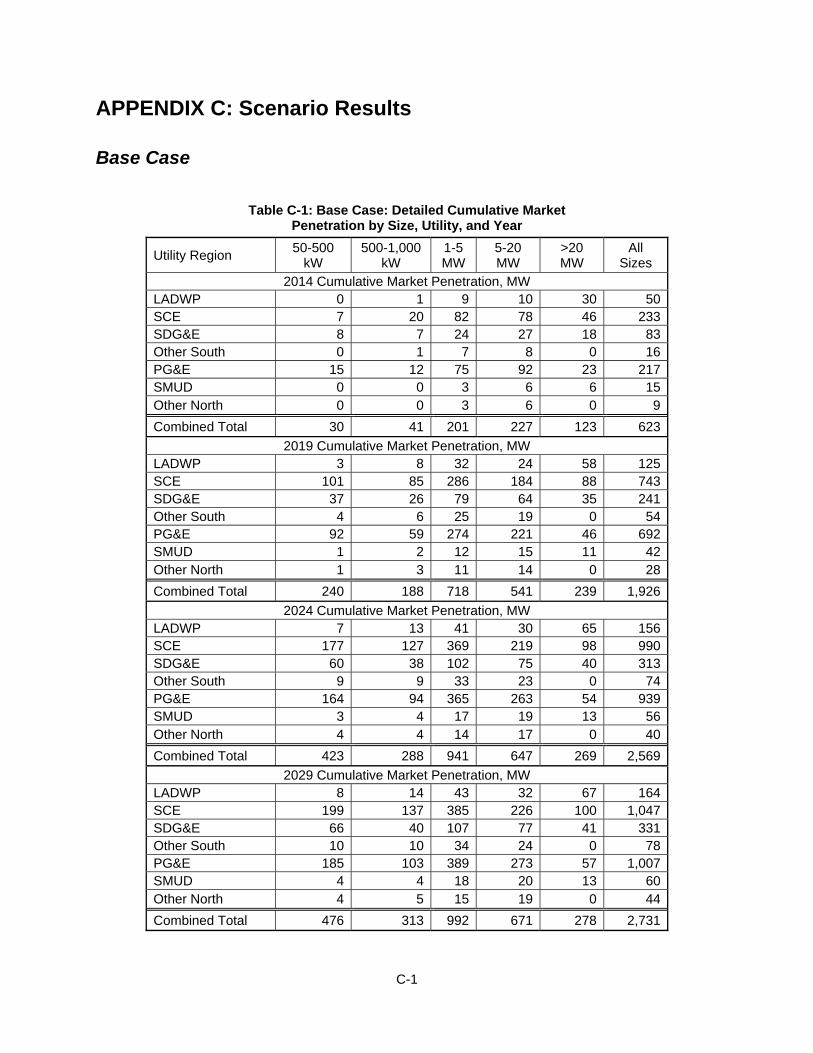
APPENDIX C: Scenario Results
Base Case
Table C-1: Base Case: Detailed Cumulative Market Penetration by Size, Utility, and Year
Utility Region 50-500 kW
500-1,000 kW
1-5 MW
5-20 MW
>20 MW
All Sizes
2014 Cumulative Market Penetration, MW LADWP 0 1 9 10 30 50SCE 7 20 82 78 46 233SDG&E 8 7 24 27 18 83Other South 0 1 7 8 0 16PG&E 15 12 75 92 23 217SMUD 0 0 3 6 6 15Other North 0 0 3 6 0 9Combined Total 30 41 201 227 123 623
2019 Cumulative Market Penetration, MW LADWP 3 8 32 24 58 125SCE 101 85 286 184 88 743SDG&E 37 26 79 64 35 241Other South 4 6 25 19 0 54PG&E 92 59 274 221 46 692SMUD 1 2 12 15 11 42Other North 1 3 11 14 0 28Combined Total 240 188 718 541 239 1,926
2024 Cumulative Market Penetration, MW LADWP 7 13 41 30 65 156SCE 177 127 369 219 98 990SDG&E 60 38 102 75 40 313Other South 9 9 33 23 0 74PG&E 164 94 365 263 54 939SMUD 3 4 17 19 13 56Other North 4 4 14 17 0 40Combined Total 423 288 941 647 269 2,569
2029 Cumulative Market Penetration, MW LADWP 8 14 43 32 67 164SCE 199 137 385 226 100 1,047SDG&E 66 40 107 77 41 331Other South 10 10 34 24 0 78PG&E 185 103 389 273 57 1,007SMUD 4 4 18 20 13 60Other North 4 5 15 19 0 44Combined Total 476 313 992 671 278 2,731
C-1
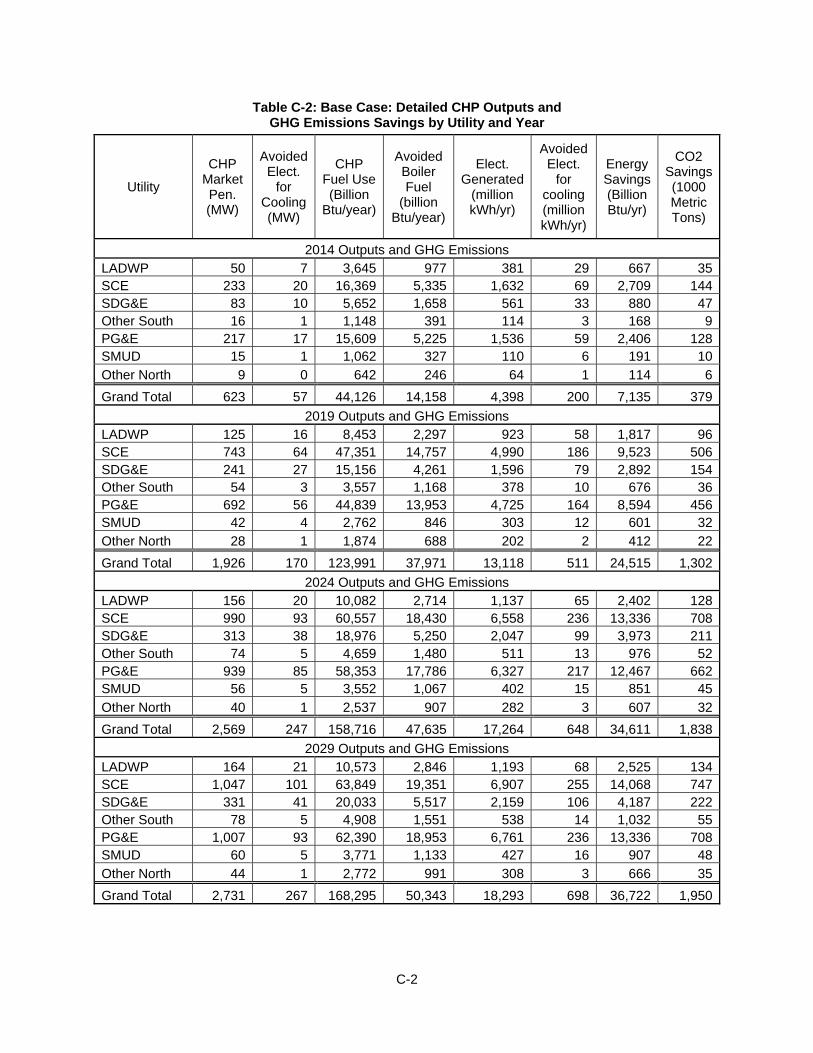
Table C-2: Base Case: Detailed CHP Outputs and GHG Emissions Savings by Utility and Year
Utility
CHP Market Pen. (MW)
Avoided Elect.
for Cooling (MW)
CHP Fuel Use (Billion
Btu/year)
Avoided Boiler Fuel
(billion Btu/year)
Elect. Generated
(million kWh/yr)
Avoided Elect.
for cooling (million kWh/yr)
Energy Savings (Billion Btu/yr)
CO2 Savings (1000 Metric Tons)
2014 Outputs and GHG Emissions LADWP 50 7 3,645 977 381 29 667 35SCE 233 20 16,369 5,335 1,632 69 2,709 144SDG&E 83 10 5,652 1,658 561 33 880 47Other South 16 1 1,148 391 114 3 168 9PG&E 217 17 15,609 5,225 1,536 59 2,406 128SMUD 15 1 1,062 327 110 6 191 10Other North 9 0 642 246 64 1 114 6Grand Total 623 57 44,126 14,158 4,398 200 7,135 379
2019 Outputs and GHG Emissions LADWP 125 16 8,453 2,297 923 58 1,817 96SCE 743 64 47,351 14,757 4,990 186 9,523 506SDG&E 241 27 15,156 4,261 1,596 79 2,892 154Other South 54 3 3,557 1,168 378 10 676 36PG&E 692 56 44,839 13,953 4,725 164 8,594 456SMUD 42 4 2,762 846 303 12 601 32Other North 28 1 1,874 688 202 2 412 22Grand Total 1,926 170 123,991 37,971 13,118 511 24,515 1,302
2024 Outputs and GHG Emissions LADWP 156 20 10,082 2,714 1,137 65 2,402 128SCE 990 93 60,557 18,430 6,558 236 13,336 708SDG&E 313 38 18,976 5,250 2,047 99 3,973 211Other South 74 5 4,659 1,480 511 13 976 52PG&E 939 85 58,353 17,786 6,327 217 12,467 662SMUD 56 5 3,552 1,067 402 15 851 45Other North 40 1 2,537 907 282 3 607 32Grand Total 2,569 247 158,716 47,635 17,264 648 34,611 1,838
2029 Outputs and GHG Emissions LADWP 164 21 10,573 2,846 1,193 68 2,525 134SCE 1,047 101 63,849 19,351 6,907 255 14,068 747SDG&E 331 41 20,033 5,517 2,159 106 4,187 222Other South 78 5 4,908 1,551 538 14 1,032 55PG&E 1,007 93 62,390 18,953 6,761 236 13,336 708SMUD 60 5 3,771 1,133 427 16 907 48Other North 44 1 2,772 991 308 3 666 35Grand Total 2,731 267 168,295 50,343 18,293 698 36,722 1,950
C-2
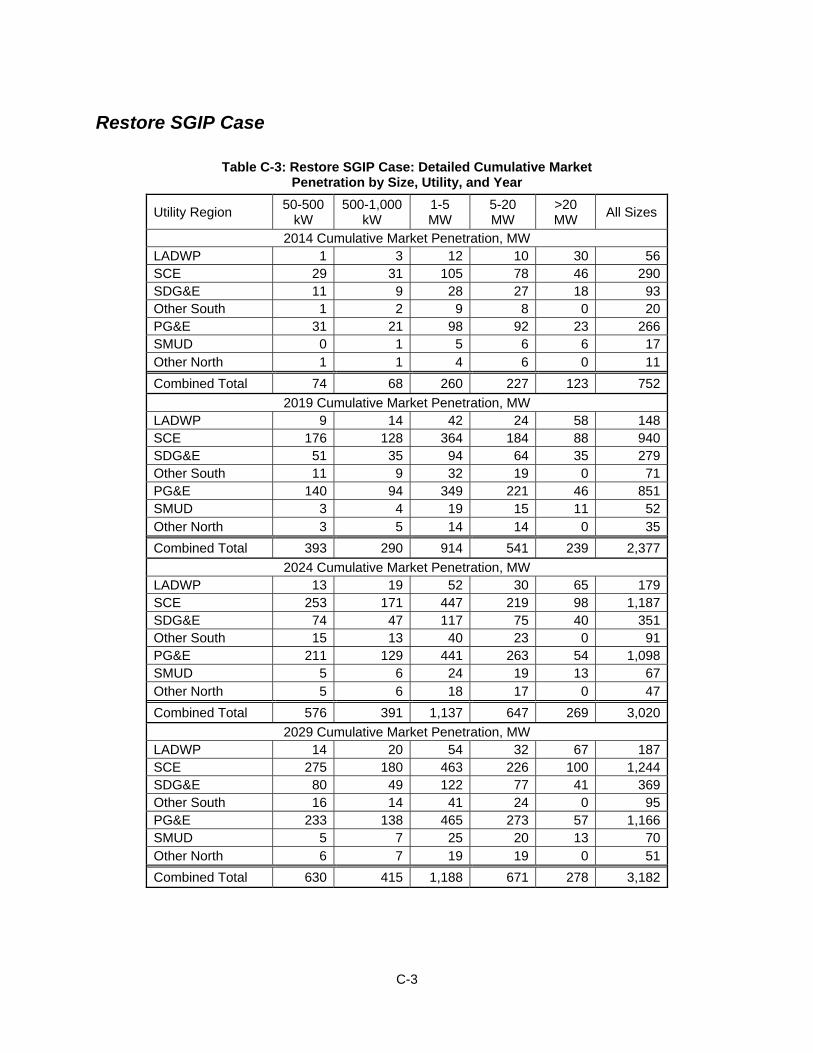
Restore SGIP Case
Table C-3: Restore SGIP Case: Detailed Cumulative Market Penetration by Size, Utility, and Year
Utility Region 50-500 kW
500-1,000 kW
1-5 MW
5-20 MW
>20 MW All Sizes
2014 Cumulative Market Penetration, MW LADWP 1 3 12 10 30 56SCE 29 31 105 78 46 290SDG&E 11 9 28 27 18 93Other South 1 2 9 8 0 20PG&E 31 21 98 92 23 266SMUD 0 1 5 6 6 17Other North 1 1 4 6 0 11Combined Total 74 68 260 227 123 752
2019 Cumulative Market Penetration, MW LADWP 9 14 42 24 58 148SCE 176 128 364 184 88 940SDG&E 51 35 94 64 35 279Other South 11 9 32 19 0 71PG&E 140 94 349 221 46 851SMUD 3 4 19 15 11 52Other North 3 5 14 14 0 35Combined Total 393 290 914 541 239 2,377
2024 Cumulative Market Penetration, MW LADWP 13 19 52 30 65 179SCE 253 171 447 219 98 1,187SDG&E 74 47 117 75 40 351Other South 15 13 40 23 0 91PG&E 211 129 441 263 54 1,098SMUD 5 6 24 19 13 67Other North 5 6 18 17 0 47Combined Total 576 391 1,137 647 269 3,020
2029 Cumulative Market Penetration, MW LADWP 14 20 54 32 67 187SCE 275 180 463 226 100 1,244SDG&E 80 49 122 77 41 369Other South 16 14 41 24 0 95PG&E 233 138 465 273 57 1,166SMUD 5 7 25 20 13 70Other North 6 7 19 19 0 51Combined Total 630 415 1,188 671 278 3,182
C-3
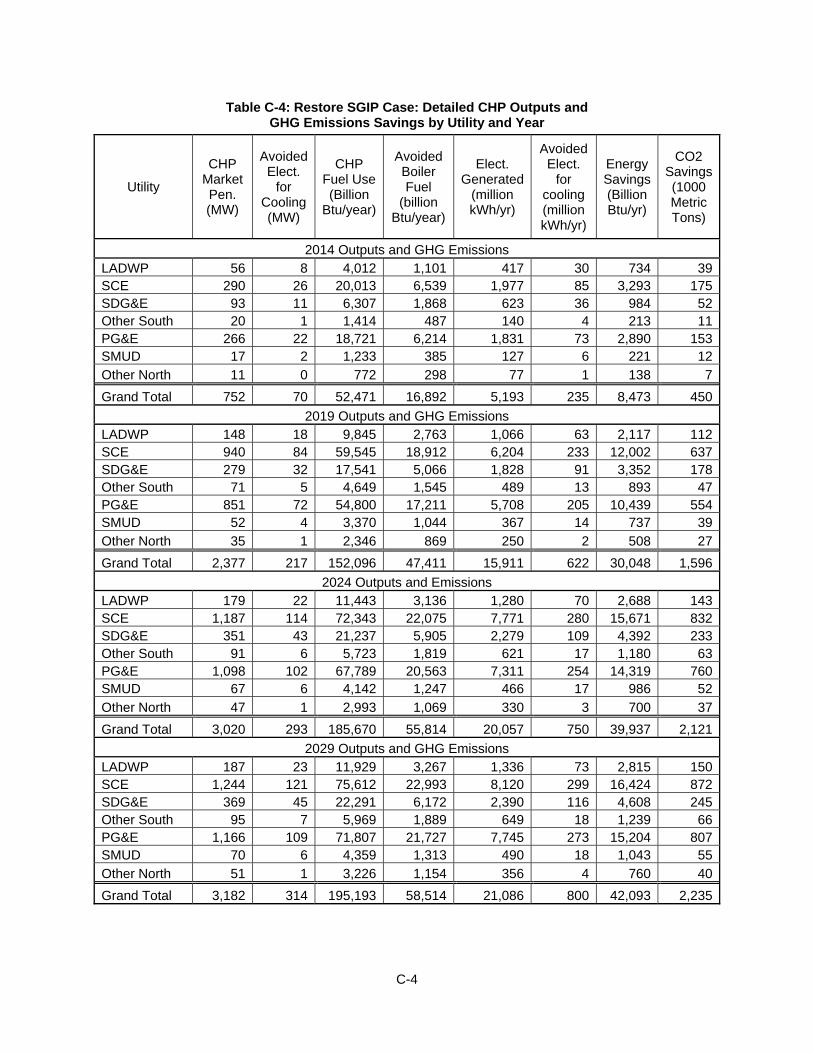
Table C-4: Restore SGIP Case: Detailed CHP Outputs and GHG Emissions Savings by Utility and Year
Utility
CHP Market Pen. (MW)
Avoided Elect.
for Cooling (MW)
CHP Fuel Use (Billion
Btu/year)
Avoided Boiler Fuel
(billion Btu/year)
Elect. Generated
(million kWh/yr)
Avoided Elect.
for cooling (million kWh/yr)
Energy Savings (Billion Btu/yr)
CO2 Savings (1000 Metric Tons)
2014 Outputs and GHG Emissions LADWP 56 8 4,012 1,101 417 30 734 39SCE 290 26 20,013 6,539 1,977 85 3,293 175SDG&E 93 11 6,307 1,868 623 36 984 52Other South 20 1 1,414 487 140 4 213 11PG&E 266 22 18,721 6,214 1,831 73 2,890 153SMUD 17 2 1,233 385 127 6 221 12Other North 11 0 772 298 77 1 138 7Grand Total 752 70 52,471 16,892 5,193 235 8,473 450
2019 Outputs and GHG Emissions LADWP 148 18 9,845 2,763 1,066 63 2,117 112SCE 940 84 59,545 18,912 6,204 233 12,002 637SDG&E 279 32 17,541 5,066 1,828 91 3,352 178Other South 71 5 4,649 1,545 489 13 893 47PG&E 851 72 54,800 17,211 5,708 205 10,439 554SMUD 52 4 3,370 1,044 367 14 737 39Other North 35 1 2,346 869 250 2 508 27Grand Total 2,377 217 152,096 47,411 15,911 622 30,048 1,596
2024 Outputs and Emissions LADWP 179 22 11,443 3,136 1,280 70 2,688 143SCE 1,187 114 72,343 22,075 7,771 280 15,671 832SDG&E 351 43 21,237 5,905 2,279 109 4,392 233Other South 91 6 5,723 1,819 621 17 1,180 63PG&E 1,098 102 67,789 20,563 7,311 254 14,319 760SMUD 67 6 4,142 1,247 466 17 986 52Other North 47 1 2,993 1,069 330 3 700 37Grand Total 3,020 293 185,670 55,814 20,057 750 39,937 2,121
2029 Outputs and GHG Emissions LADWP 187 23 11,929 3,267 1,336 73 2,815 150SCE 1,244 121 75,612 22,993 8,120 299 16,424 872SDG&E 369 45 22,291 6,172 2,390 116 4,608 245Other South 95 7 5,969 1,889 649 18 1,239 66PG&E 1,166 109 71,807 21,727 7,745 273 15,204 807SMUD 70 6 4,359 1,313 490 18 1,043 55Other North 51 1 3,226 1,154 356 4 760 40Grand Total 3,182 314 195,193 58,514 21,086 800 42,093 2,235
C-4

CO2 Payments Case
Table C-5: CO2 Payments Case: Detailed Cumulative Market Penetration by Size, Utility, and Year
Utility Region 50-500 kW
500-1,000 kW
1-5 MW
5-20 MW
>20 MW All Sizes
2014 Cumulative Market Penetration, MW LADWP 0 2 10 11 32 54SCE 16 23 89 89 51 267SDG&E 8 7 24 27 19 86Other South 1 1 7 9 0 18PG&E 21 15 81 97 26 240SMUD 0 0 4 7 6 17Other North 0 1 3 6 0 10Combined Total 46 49 218 246 133 693
2019 Cumulative Market Penetration, MW LADWP 4 10 35 27 61 137SCE 120 94 308 208 98 829SDG&E 39 27 82 65 36 250Other South 6 7 27 21 0 61PG&E 105 67 295 233 51 751SMUD 2 2 15 18 12 49Other North 2 3 12 15 0 32Combined Total 278 211 774 587 259 2,109
2024 Cumulative Market Penetration, MW LADWP 9 15 46 33 68 171SCE 202 140 396 247 109 1,094SDG&E 62 39 105 76 41 324Other South 12 10 35 25 0 82PG&E 180 104 391 277 59 1,012SMUD 4 4 21 22 14 65Other North 4 5 16 19 0 44Combined Total 474 318 1,010 699 291 2,792
2029 Cumulative Market Penetration, MW LADWP 10 17 48 35 70 180SCE 226 150 413 254 112 1,155SDG&E 69 42 110 79 42 343Other South 13 11 37 26 0 86PG&E 203 114 417 288 62 1,083SMUD 5 5 22 23 14 70Other North 5 6 17 21 0 49Combined Total 532 344 1,064 725 301 2,965
C-5
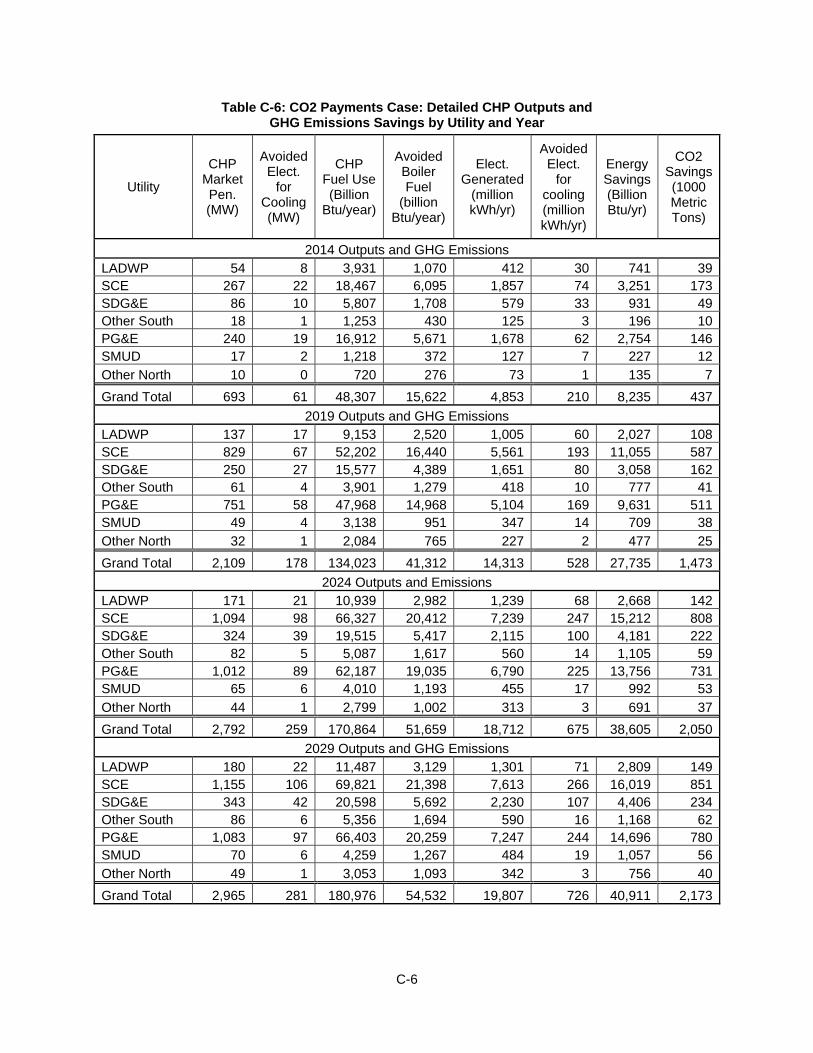
Table C-6: CO2 Payments Case: Detailed CHP Outputs and GHG Emissions Savings by Utility and Year
Utility
CHP Market Pen. (MW)
Avoided Elect.
for Cooling (MW)
CHP Fuel Use (Billion
Btu/year)
Avoided Boiler Fuel
(billion Btu/year)
Elect. Generated
(million kWh/yr)
Avoided Elect.
for cooling (million kWh/yr)
Energy Savings (Billion Btu/yr)
CO2 Savings (1000 Metric Tons)
2014 Outputs and GHG Emissions LADWP 54 8 3,931 1,070 412 30 741 39SCE 267 22 18,467 6,095 1,857 74 3,251 173SDG&E 86 10 5,807 1,708 579 33 931 49Other South 18 1 1,253 430 125 3 196 10PG&E 240 19 16,912 5,671 1,678 62 2,754 146SMUD 17 2 1,218 372 127 7 227 12Other North 10 0 720 276 73 1 135 7Grand Total 693 61 48,307 15,622 4,853 210 8,235 437
2019 Outputs and GHG Emissions LADWP 137 17 9,153 2,520 1,005 60 2,027 108SCE 829 67 52,202 16,440 5,561 193 11,055 587SDG&E 250 27 15,577 4,389 1,651 80 3,058 162Other South 61 4 3,901 1,279 418 10 777 41PG&E 751 58 47,968 14,968 5,104 169 9,631 511SMUD 49 4 3,138 951 347 14 709 38Other North 32 1 2,084 765 227 2 477 25Grand Total 2,109 178 134,023 41,312 14,313 528 27,735 1,473
2024 Outputs and Emissions LADWP 171 21 10,939 2,982 1,239 68 2,668 142SCE 1,094 98 66,327 20,412 7,239 247 15,212 808SDG&E 324 39 19,515 5,417 2,115 100 4,181 222Other South 82 5 5,087 1,617 560 14 1,105 59PG&E 1,012 89 62,187 19,035 6,790 225 13,756 731SMUD 65 6 4,010 1,193 455 17 992 53Other North 44 1 2,799 1,002 313 3 691 37Grand Total 2,792 259 170,864 51,659 18,712 675 38,605 2,050
2029 Outputs and GHG Emissions LADWP 180 22 11,487 3,129 1,301 71 2,809 149SCE 1,155 106 69,821 21,398 7,613 266 16,019 851SDG&E 343 42 20,598 5,692 2,230 107 4,406 234Other South 86 6 5,356 1,694 590 16 1,168 62PG&E 1,083 97 66,403 20,259 7,247 244 14,696 780SMUD 70 6 4,259 1,267 484 19 1,057 56Other North 49 1 3,053 1,093 342 3 756 40Grand Total 2,965 281 180,976 54,532 19,807 726 40,911 2,173
C-6
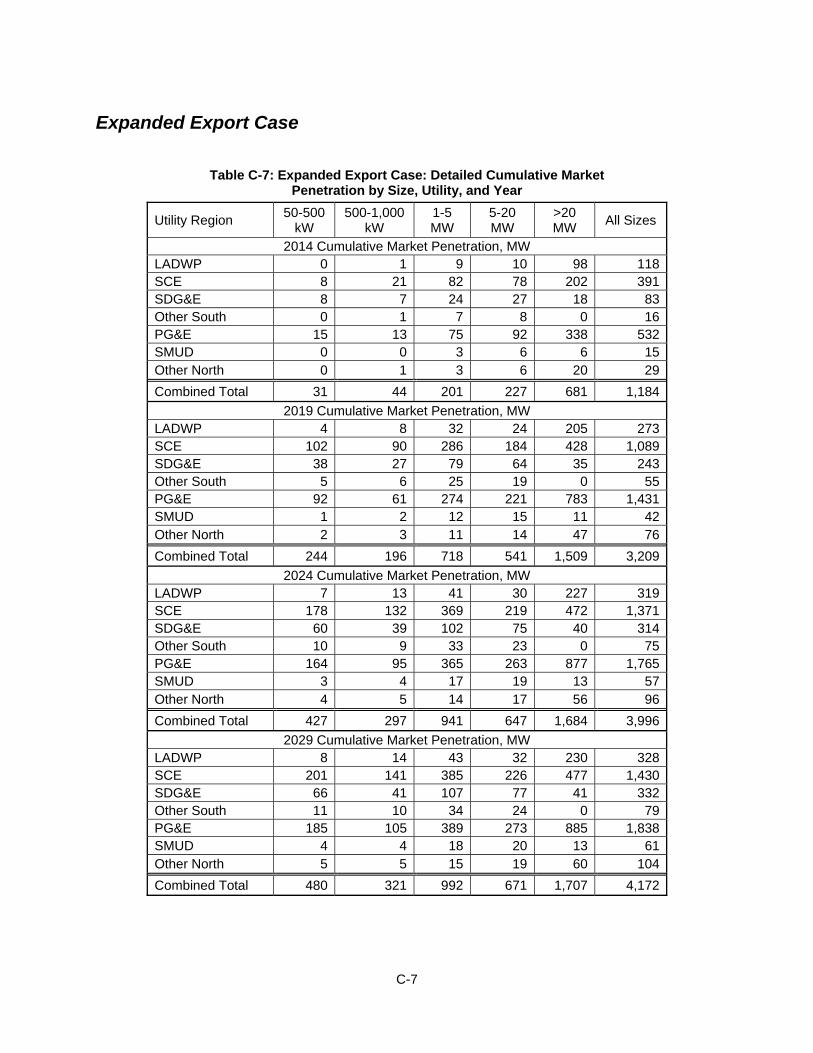
Expanded Export Case
Table C-7: Expanded Export Case: Detailed Cumulative Market Penetration by Size, Utility, and Year
Utility Region 50-500 kW
500-1,000 kW
1-5 MW
5-20 MW
>20 MW All Sizes
2014 Cumulative Market Penetration, MW LADWP 0 1 9 10 98 118SCE 8 21 82 78 202 391SDG&E 8 7 24 27 18 83Other South 0 1 7 8 0 16PG&E 15 13 75 92 338 532SMUD 0 0 3 6 6 15Other North 0 1 3 6 20 29Combined Total 31 44 201 227 681 1,184
2019 Cumulative Market Penetration, MW LADWP 4 8 32 24 205 273SCE 102 90 286 184 428 1,089SDG&E 38 27 79 64 35 243Other South 5 6 25 19 0 55PG&E 92 61 274 221 783 1,431SMUD 1 2 12 15 11 42Other North 2 3 11 14 47 76Combined Total 244 196 718 541 1,509 3,209
2024 Cumulative Market Penetration, MW LADWP 7 13 41 30 227 319SCE 178 132 369 219 472 1,371SDG&E 60 39 102 75 40 314Other South 10 9 33 23 0 75PG&E 164 95 365 263 877 1,765SMUD 3 4 17 19 13 57Other North 4 5 14 17 56 96Combined Total 427 297 941 647 1,684 3,996
2029 Cumulative Market Penetration, MW LADWP 8 14 43 32 230 328SCE 201 141 385 226 477 1,430SDG&E 66 41 107 77 41 332Other South 11 10 34 24 0 79PG&E 185 105 389 273 885 1,838SMUD 4 4 18 20 13 61Other North 5 5 15 19 60 104Combined Total 480 321 992 671 1,707 4,172
C-7
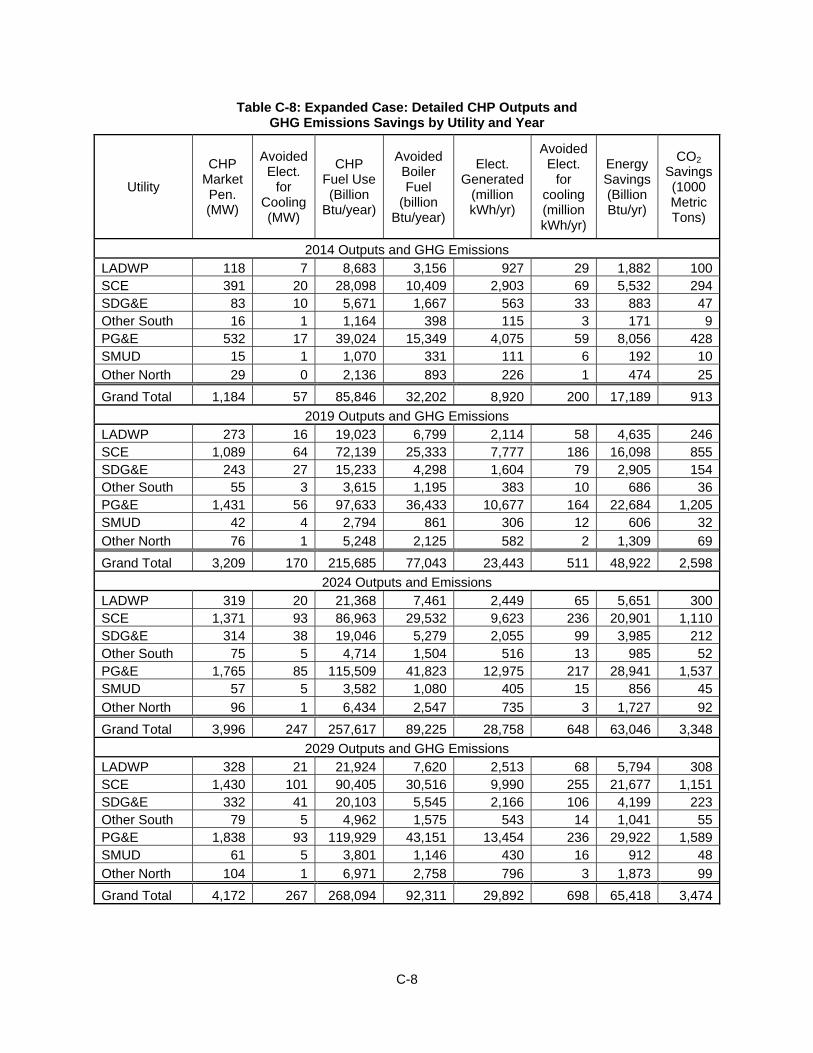
Table C-8: Expanded Case: Detailed CHP Outputs and GHG Emissions Savings by Utility and Year
Utility
CHP Market Pen. (MW)
Avoided Elect.
for Cooling (MW)
CHP Fuel Use (Billion
Btu/year)
Avoided Boiler Fuel
(billion Btu/year)
Elect. Generated
(million kWh/yr)
Avoided Elect.
for cooling (million kWh/yr)
Energy Savings (Billion Btu/yr)
CO2 Savings (1000 Metric Tons)
2014 Outputs and GHG Emissions LADWP 118 7 8,683 3,156 927 29 1,882 100SCE 391 20 28,098 10,409 2,903 69 5,532 294SDG&E 83 10 5,671 1,667 563 33 883 47Other South 16 1 1,164 398 115 3 171 9PG&E 532 17 39,024 15,349 4,075 59 8,056 428SMUD 15 1 1,070 331 111 6 192 10Other North 29 0 2,136 893 226 1 474 25Grand Total 1,184 57 85,846 32,202 8,920 200 17,189 913
2019 Outputs and GHG Emissions LADWP 273 16 19,023 6,799 2,114 58 4,635 246SCE 1,089 64 72,139 25,333 7,777 186 16,098 855SDG&E 243 27 15,233 4,298 1,604 79 2,905 154Other South 55 3 3,615 1,195 383 10 686 36PG&E 1,431 56 97,633 36,433 10,677 164 22,684 1,205SMUD 42 4 2,794 861 306 12 606 32Other North 76 1 5,248 2,125 582 2 1,309 69Grand Total 3,209 170 215,685 77,043 23,443 511 48,922 2,598
2024 Outputs and Emissions LADWP 319 20 21,368 7,461 2,449 65 5,651 300SCE 1,371 93 86,963 29,532 9,623 236 20,901 1,110SDG&E 314 38 19,046 5,279 2,055 99 3,985 212Other South 75 5 4,714 1,504 516 13 985 52PG&E 1,765 85 115,509 41,823 12,975 217 28,941 1,537SMUD 57 5 3,582 1,080 405 15 856 45Other North 96 1 6,434 2,547 735 3 1,727 92Grand Total 3,996 247 257,617 89,225 28,758 648 63,046 3,348
2029 Outputs and GHG Emissions LADWP 328 21 21,924 7,620 2,513 68 5,794 308SCE 1,430 101 90,405 30,516 9,990 255 21,677 1,151SDG&E 332 41 20,103 5,545 2,166 106 4,199 223Other South 79 5 4,962 1,575 543 14 1,041 55PG&E 1,838 93 119,929 43,151 13,454 236 29,922 1,589SMUD 61 5 3,801 1,146 430 16 912 48Other North 104 1 6,971 2,758 796 3 1,873 99Grand Total 4,172 267 268,094 92,311 29,892 698 65,418 3,474
C-8
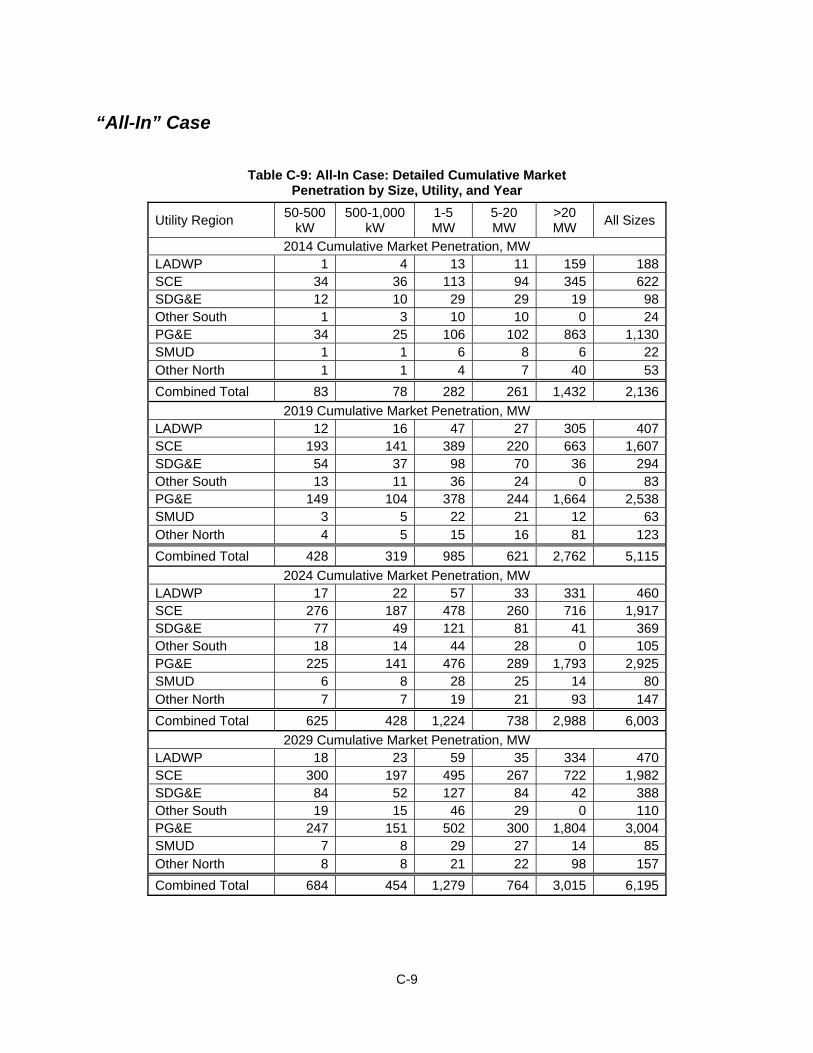
“All-In” Case
Table C-9: All-In Case: Detailed Cumulative Market Penetration by Size, Utility, and Year
Utility Region 50-500 kW
500-1,000 kW
1-5 MW
5-20 MW
>20 MW All Sizes
2014 Cumulative Market Penetration, MW LADWP 1 4 13 11 159 188SCE 34 36 113 94 345 622SDG&E 12 10 29 29 19 98Other South 1 3 10 10 0 24PG&E 34 25 106 102 863 1,130SMUD 1 1 6 8 6 22Other North 1 1 4 7 40 53Combined Total 83 78 282 261 1,432 2,136
2019 Cumulative Market Penetration, MW LADWP 12 16 47 27 305 407SCE 193 141 389 220 663 1,607SDG&E 54 37 98 70 36 294Other South 13 11 36 24 0 83PG&E 149 104 378 244 1,664 2,538SMUD 3 5 22 21 12 63Other North 4 5 15 16 81 123Combined Total 428 319 985 621 2,762 5,115
2024 Cumulative Market Penetration, MW LADWP 17 22 57 33 331 460SCE 276 187 478 260 716 1,917SDG&E 77 49 121 81 41 369Other South 18 14 44 28 0 105PG&E 225 141 476 289 1,793 2,925SMUD 6 8 28 25 14 80Other North 7 7 19 21 93 147Combined Total 625 428 1,224 738 2,988 6,003
2029 Cumulative Market Penetration, MW LADWP 18 23 59 35 334 470SCE 300 197 495 267 722 1,982SDG&E 84 52 127 84 42 388Other South 19 15 46 29 0 110PG&E 247 151 502 300 1,804 3,004SMUD 7 8 29 27 14 85Other North 8 8 21 22 98 157Combined Total 684 454 1,279 764 3,015 6,195
C-9
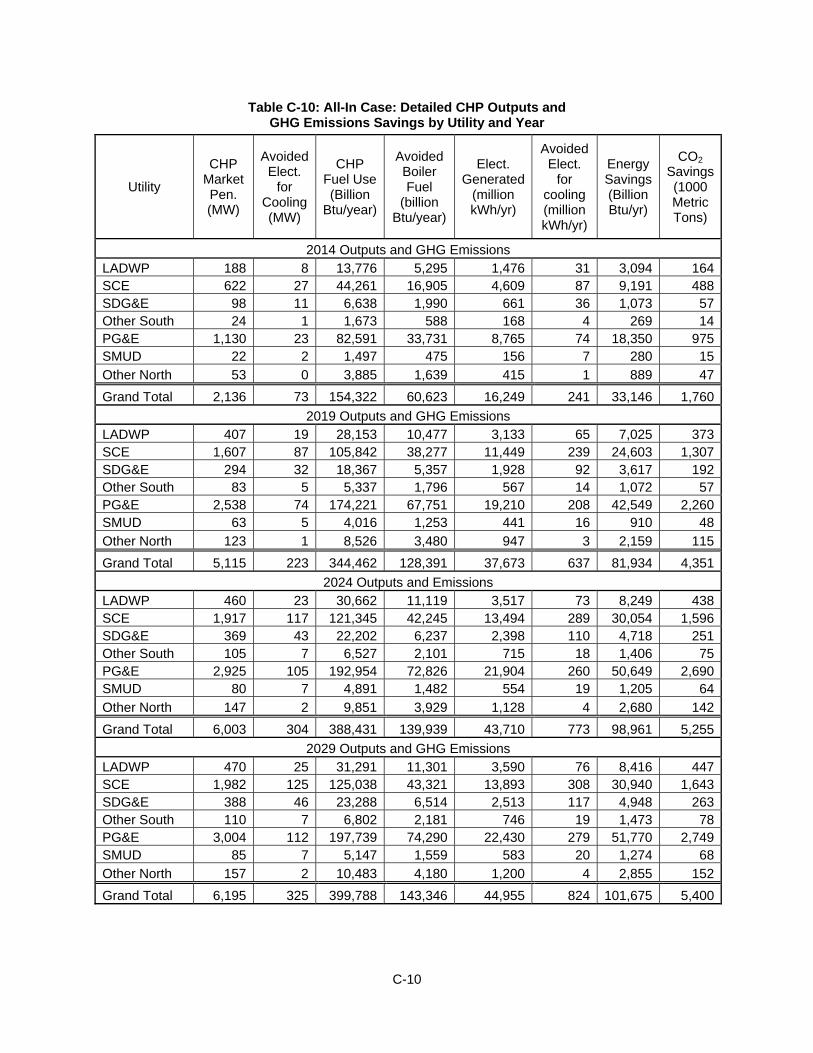
C-10
Table C-10: All-In Case: Detailed CHP Outputs and GHG Emissions Savings by Utility and Year
Utility
CHP Market Pen. (MW)
Avoided Elect.
for Cooling (MW)
CHP Fuel Use (Billion
Btu/year)
Avoided Boiler Fuel
(billion Btu/year)
Elect. Generated
(million kWh/yr)
Avoided Elect.
for cooling (million kWh/yr)
Energy Savings (Billion Btu/yr)
CO2 Savings (1000 Metric Tons)
2014 Outputs and GHG Emissions LADWP 188 8 13,776 5,295 1,476 31 3,094 164SCE 622 27 44,261 16,905 4,609 87 9,191 488SDG&E 98 11 6,638 1,990 661 36 1,073 57Other South 24 1 1,673 588 168 4 269 14PG&E 1,130 23 82,591 33,731 8,765 74 18,350 975SMUD 22 2 1,497 475 156 7 280 15Other North 53 0 3,885 1,639 415 1 889 47Grand Total 2,136 73 154,322 60,623 16,249 241 33,146 1,760
2019 Outputs and GHG Emissions LADWP 407 19 28,153 10,477 3,133 65 7,025 373SCE 1,607 87 105,842 38,277 11,449 239 24,603 1,307SDG&E 294 32 18,367 5,357 1,928 92 3,617 192Other South 83 5 5,337 1,796 567 14 1,072 57PG&E 2,538 74 174,221 67,751 19,210 208 42,549 2,260SMUD 63 5 4,016 1,253 441 16 910 48Other North 123 1 8,526 3,480 947 3 2,159 115Grand Total 5,115 223 344,462 128,391 37,673 637 81,934 4,351
2024 Outputs and Emissions LADWP 460 23 30,662 11,119 3,517 73 8,249 438SCE 1,917 117 121,345 42,245 13,494 289 30,054 1,596SDG&E 369 43 22,202 6,237 2,398 110 4,718 251Other South 105 7 6,527 2,101 715 18 1,406 75PG&E 2,925 105 192,954 72,826 21,904 260 50,649 2,690SMUD 80 7 4,891 1,482 554 19 1,205 64Other North 147 2 9,851 3,929 1,128 4 2,680 142Grand Total 6,003 304 388,431 139,939 43,710 773 98,961 5,255
2029 Outputs and GHG Emissions LADWP 470 25 31,291 11,301 3,590 76 8,416 447SCE 1,982 125 125,038 43,321 13,893 308 30,940 1,643SDG&E 388 46 23,288 6,514 2,513 117 4,948 263Other South 110 7 6,802 2,181 746 19 1,473 78PG&E 3,004 112 197,739 74,290 22,430 279 51,770 2,749SMUD 85 7 5,147 1,559 583 20 1,274 68Other North 157 2 10,483 4,180 1,200 4 2,855 152Grand Total 6,195 325 399,788 143,346 44,955 824 101,675 5,400
APPENDIX D: Comparison to 2005 Market Study
This CHP market assessment is based on a framework developed in two previous studies for the Energy Commission. These previous studies and the current study were all conducted by the same project team. The first study conducted in 199934 identified the CHP market opportunity to be over 12,000 MW of technical potential and an estimated 4,000 MW of economic market potential over the 2002‐2020 forecast period. The second study conducted in 200535 identified 28,000 MW of CHP technical potential and contained market scenarios with from 1,900 MW to 7,300 MW of market penetration by 2020.
Similar to the current study, the 2005 study was undertaken to provide input to the Integrated Energy Policy Report (IEPR 2005). The focus of the 2005 study was to:
• Quantify and update the technical and economic potential for CHP in California, last undertaken in 1999.
• Assess the end‐user adoption barriers to CHP.
• Develop approaches for incentives and other options to realize the CHP opportunity.
• Assess the technology gaps and R&D needs to move the CHP market opportunity forward.
The 2005 study was referenced in the development of the AB 1613 CHP export program and in the development of CHP market targets for the Climate Scoping Plan. In undertaking the 2009 study, the study team used the same approach to developing technical potential and market penetration; however several of the input data elements were refined to provide for a more accurate analysis.
Comparison of Technical Market Potential For 2009, the study team substantially revised its approach to the quantification of technical market potential, as shown in Table D‐1. The changes included:
• Use of a more detailed database of California industrial and commercial facilities, which contains business information, such as number of employees, in exact figures rather than ranges.
• A more detailed approach to developing site electric and thermal loads that can be met by CHP, including an evaluation of load estimates specific to California.
• A reduction in the application‐specific growth rates for new and expanded facilities over the forecast period, due to changes in economic conditions.
34 Market Assessment of Combined Heat and Power in the State of California, prepared by Onsite Sycom Energy Corporation, California Energy Commission Report P700‐00‐009, July 1999 (released October 2000.) 35 Assessment of CHP Market and Policy Options for Increased Penetration, April 2005. EPRI, CEC‐500‐2005‐060‐D.
D-1
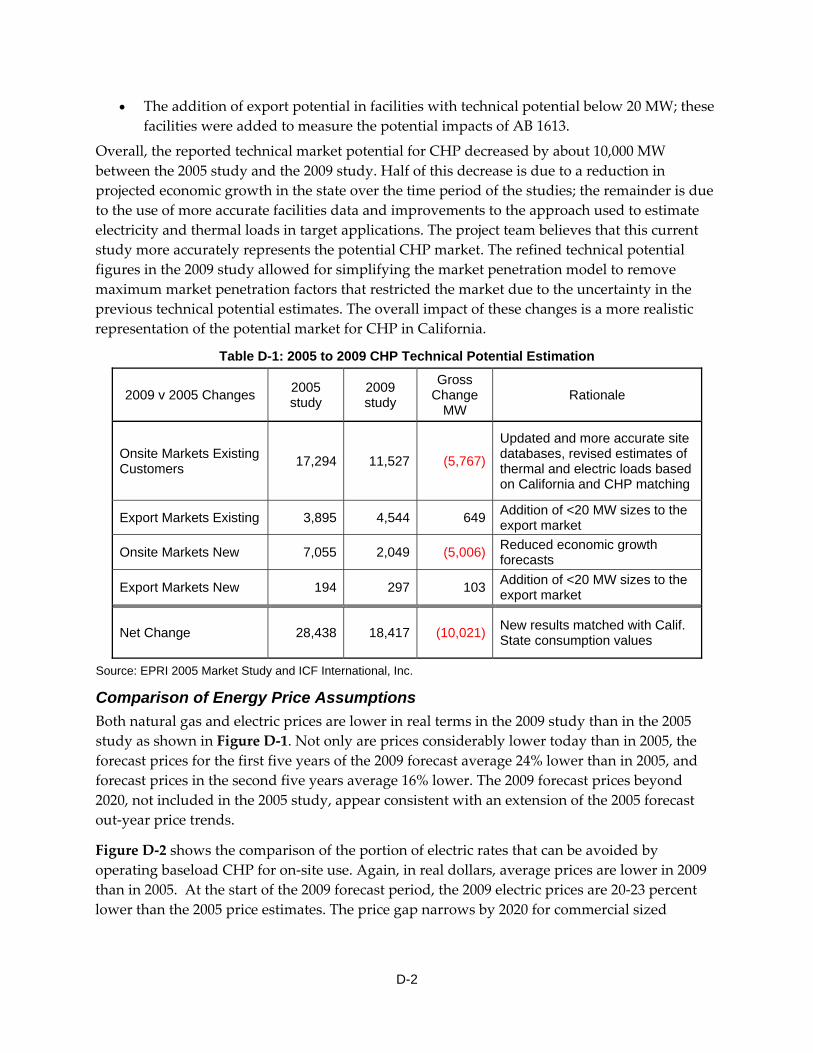
• The addition of export potential in facilities with technical potential below 20 MW; these facilities were added to measure the potential impacts of AB 1613.
Overall, the reported technical market potential for CHP decreased by about 10,000 MW between the 2005 study and the 2009 study. Half of this decrease is due to a reduction in projected economic growth in the state over the time period of the studies; the remainder is due to the use of more accurate facilities data and improvements to the approach used to estimate electricity and thermal loads in target applications. The project team believes that this current study more accurately represents the potential CHP market. The refined technical potential figures in the 2009 study allowed for simplifying the market penetration model to remove maximum market penetration factors that restricted the market due to the uncertainty in the previous technical potential estimates. The overall impact of these changes is a more realistic representation of the potential market for CHP in California.
Table D-1: 2005 to 2009 CHP Technical Potential Estimation
2009 v 2005 Changes 2005 study
2009 study
Gross Change
MW Rationale
Onsite Markets Existing Customers 17,294 11,527 (5,767)
Updated and more accurate site databases, revised estimates of thermal and electric loads based on California and CHP matching
Export Markets Existing 3,895 4,544 649 Addition of <20 MW sizes to the export market
Onsite Markets New 7,055 2,049 (5,006) Reduced economic growth forecasts
Export Markets New 194 297 103 Addition of <20 MW sizes to the export market
Net Change 28,438 18,417 (10,021) New results matched with Calif. State consumption values
Source: EPRI 2005 Market Study and ICF International, Inc.
Comparison of Energy Price Assumptions Both natural gas and electric prices are lower in real terms in the 2009 study than in the 2005 study as shown in Figure D‐1. Not only are prices considerably lower today than in 2005, the forecast prices for the first five years of the 2009 forecast average 24% lower than in 2005, and forecast prices in the second five years average 16% lower. The 2009 forecast prices beyond 2020, not included in the 2005 study, appear consistent with an extension of the 2005 forecast out‐year price trends.
Figure D‐2 shows the comparison of the portion of electric rates that can be avoided by operating baseload CHP for on‐site use. Again, in real dollars, average prices are lower in 2009 than in 2005. At the start of the 2009 forecast period, the 2009 electric prices are 20‐23 percent lower than the 2005 price estimates. The price gap narrows by 2020 for commercial sized
D-2
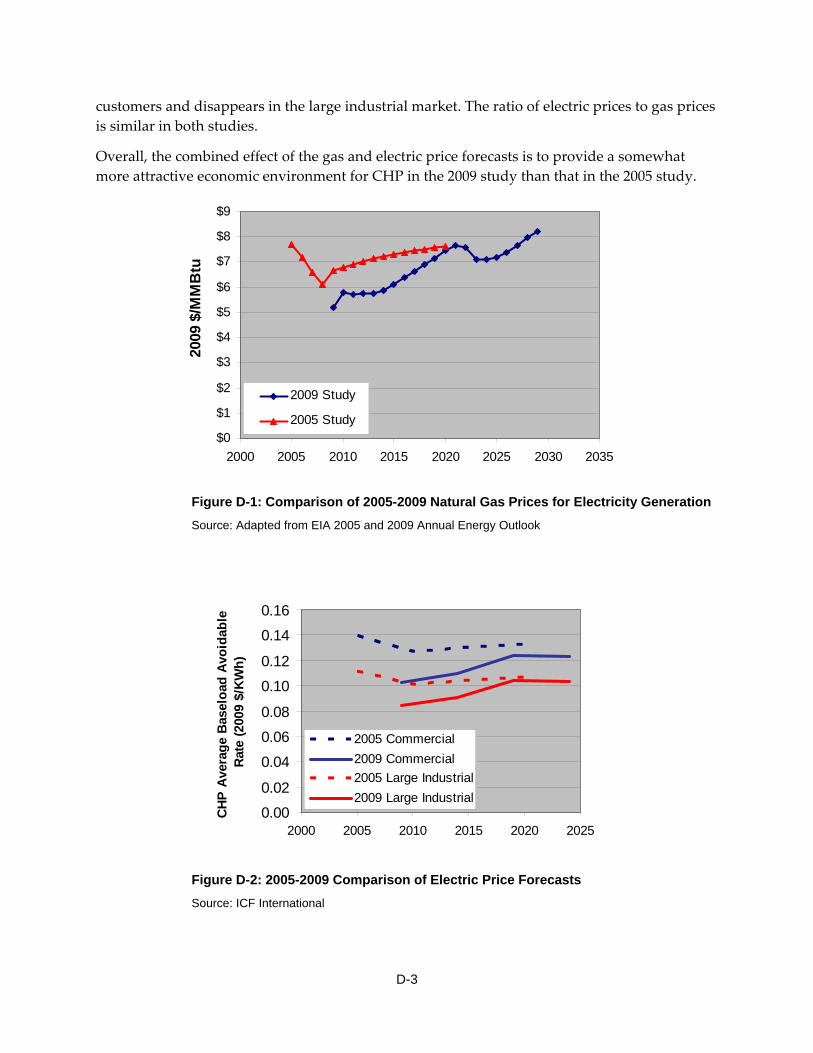
customers and disappears in the large industrial market. The ratio of electric prices to gas prices is similar in both studies.
Overall, the combined effect of the gas and electric price forecasts is to provide a somewhat more attractive economic environment for CHP in the 2009 study than that in the 2005 study.
$0
$1
$2
$3
$4
$5
$6
$7
$8
$9
2000 2005 2010 2015 2020 2025 2030 2035
2009
$/M
MB
tu
2009 Study
2005 Study
Figure D-1: Comparison of 2005-2009 Natural Gas Prices for Electricity Generation Source: Adapted from EIA 2005 and 2009 Annual Energy Outlook
0.00
0.02
0.04
0.06
0.08
0.10
0.12
0.14
0.16
2000 2005 2010 2015 2020 2025
CHP
Aver
age
Bas
eloa
d Av
oida
ble
Rate
(200
9 $/
KWh)
2005 Commercial2009 Commercial2005 Large Industrial2009 Large Industrial
Figure D-2: 2005-2009 Comparison of Electric Price Forecasts Source: ICF International
D-3
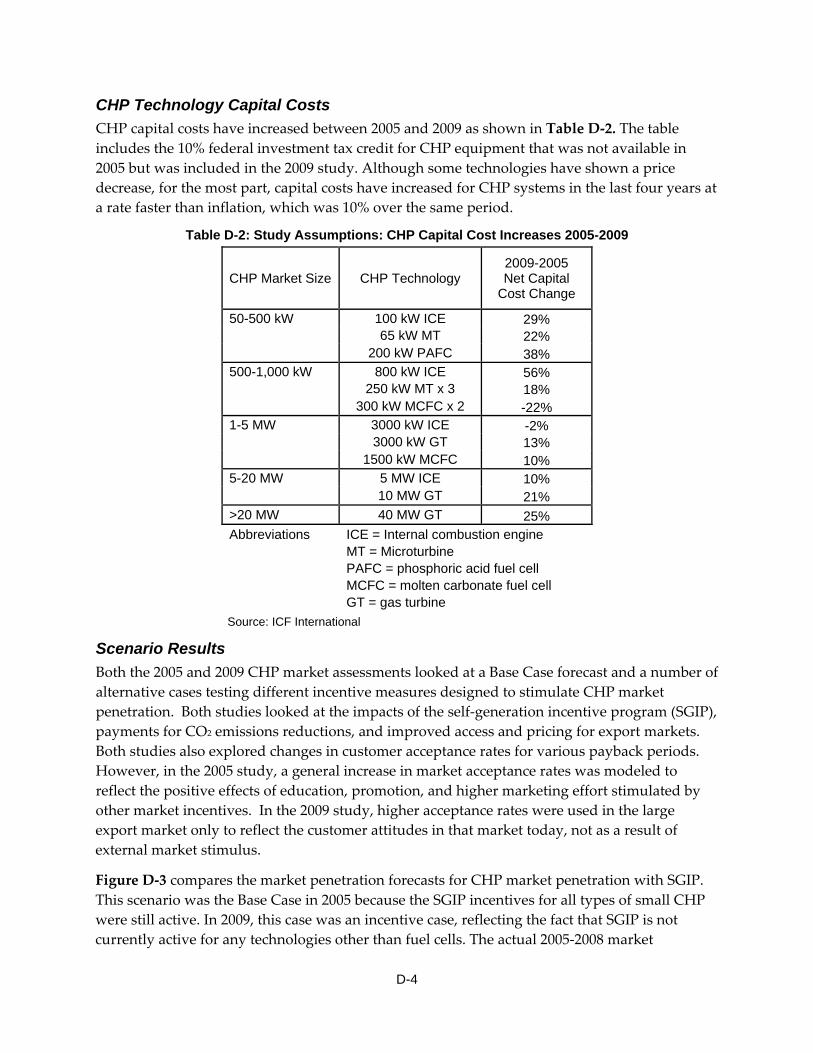
CHP Technology Capital Costs CHP capital costs have increased between 2005 and 2009 as shown in Table D‐2. The table includes the 10% federal investment tax credit for CHP equipment that was not available in 2005 but was included in the 2009 study. Although some technologies have shown a price decrease, for the most part, capital costs have increased for CHP systems in the last four years at a rate faster than inflation, which was 10% over the same period.
Table D-2: Study Assumptions: CHP Capital Cost Increases 2005-2009
CHP Market Size CHP Technology 2009-2005 Net Capital
Cost Change
50-500 kW 100 kW ICE 29% 65 kW MT 22% 200 kW PAFC 38% 500-1,000 kW 800 kW ICE 56% 250 kW MT x 3 18% 300 kW MCFC x 2 -22% 1-5 MW 3000 kW ICE -2% 3000 kW GT 13% 1500 kW MCFC 10% 5-20 MW 5 MW ICE 10% 10 MW GT 21% >20 MW 40 MW GT 25% Abbreviations ICE = Internal combustion engine MT = Microturbine PAFC = phosphoric acid fuel cell MCFC = molten carbonate fuel cell GT = gas turbine Source: ICF International
Scenario Results Both the 2005 and 2009 CHP market assessments looked at a Base Case forecast and a number of alternative cases testing different incentive measures designed to stimulate CHP market penetration. Both studies looked at the impacts of the self‐generation incentive program (SGIP), payments for CO2 emissions reductions, and improved access and pricing for export markets. Both studies also explored changes in customer acceptance rates for various payback periods. However, in the 2005 study, a general increase in market acceptance rates was modeled to reflect the positive effects of education, promotion, and higher marketing effort stimulated by other market incentives. In the 2009 study, higher acceptance rates were used in the large export market only to reflect the customer attitudes in that market today, not as a result of external market stimulus.
Figure D‐3 compares the market penetration forecasts for CHP market penetration with SGIP. This scenario was the Base Case in 2005 because the SGIP incentives for all types of small CHP were still active. In 2009, this case was an incentive case, reflecting the fact that SGIP is not currently active for any technologies other than fuel cells. The actual 2005‐2008 market
D-4
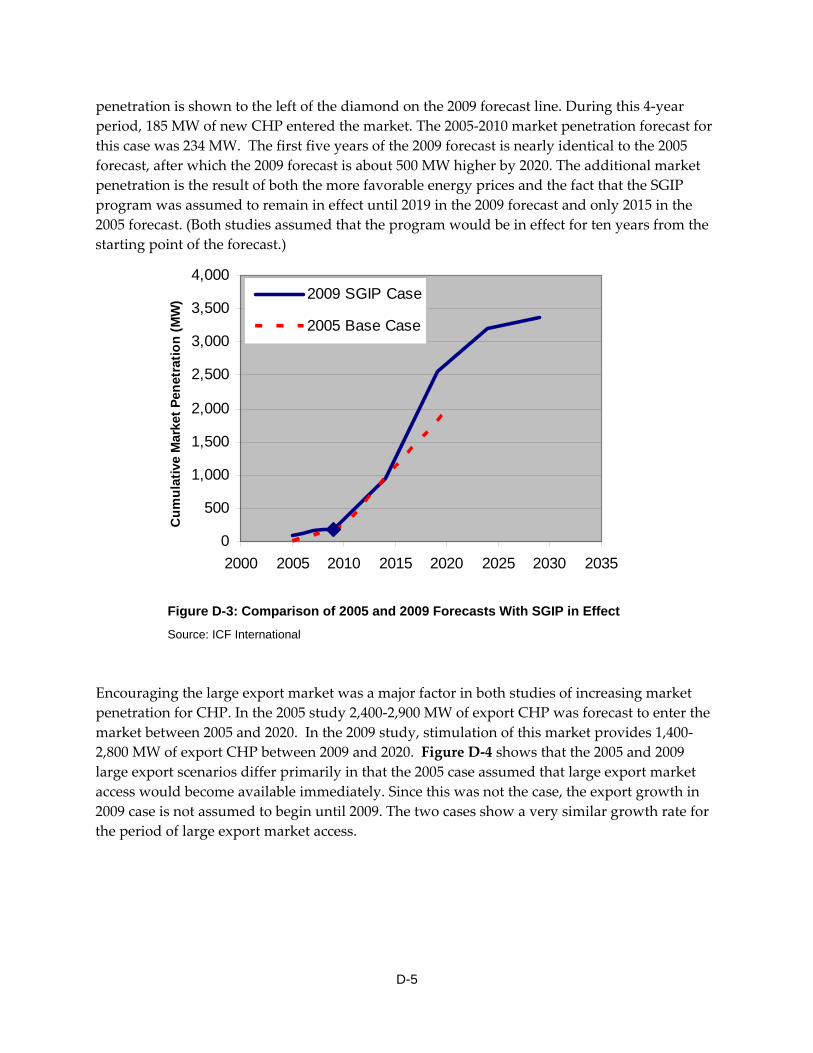
penetration is shown to the left of the diamond on the 2009 forecast line. During this 4‐year period, 185 MW of new CHP entered the market. The 2005‐2010 market penetration forecast for this case was 234 MW. The first five years of the 2009 forecast is nearly identical to the 2005 forecast, after which the 2009 forecast is about 500 MW higher by 2020. The additional market penetration is the result of both the more favorable energy prices and the fact that the SGIP program was assumed to remain in effect until 2019 in the 2009 forecast and only 2015 in the 2005 forecast. (Both studies assumed that the program would be in effect for ten years from the starting point of the forecast.)
0
500
1,000
1,500
2,000
2,500
3,000
3,500
4,000
2000 2005 2010 2015 2020 2025 2030 2035
Cum
ulat
ive
Mar
ket P
enet
ratio
n (M
W) 2009 SGIP Case
2005 Base Case
Figure D-3: Comparison of 2005 and 2009 Forecasts With SGIP in Effect Source: ICF International
Encouraging the large export market was a major factor in both studies of increasing market penetration for CHP. In the 2005 study 2,400‐2,900 MW of export CHP was forecast to enter the market between 2005 and 2020. In the 2009 study, stimulation of this market provides 1,400‐2,800 MW of export CHP between 2009 and 2020. Figure D‐4 shows that the 2005 and 2009 large export scenarios differ primarily in that the 2005 case assumed that large export market access would become available immediately. Since this was not the case, the export growth in 2009 case is not assumed to begin until 2009. The two cases show a very similar growth rate for the period of large export market access.
D-5
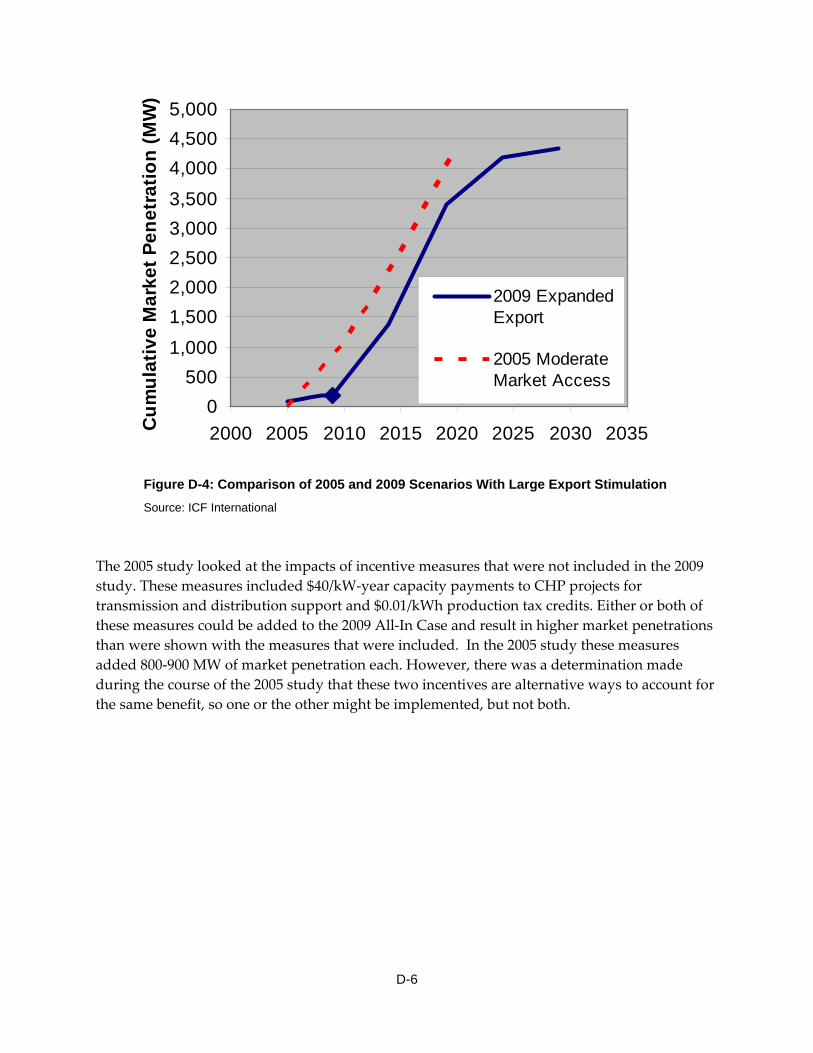
0500
1,0001,5002,0002,5003,0003,5004,0004,5005,000
2000 2005 2010 2015 2020 2025 2030 2035Cum
ulat
ive
Mar
ket P
enet
ratio
n (M
W)
2009 ExpandedExport
2005 ModerateMarket Access
Figure D-4: Comparison of 2005 and 2009 Scenarios With Large Export Stimulation Source: ICF International
The 2005 study looked at the impacts of incentive measures that were not included in the 2009 study. These measures included $40/kW‐year capacity payments to CHP projects for transmission and distribution support and $0.01/kWh production tax credits. Either or both of these measures could be added to the 2009 All‐In Case and result in higher market penetrations than were shown with the measures that were included. In the 2005 study these measures added 800‐900 MW of market penetration each. However, there was a determination made during the course of the 2005 study that these two incentives are alternative ways to account for the same benefit, so one or the other might be implemented, but not both.
D-6
APPENDIX E: Biogas and Waste Heat CHP Applications
This report describes the market size and potential market penetration of natural gas fueled CHP in California. Natural gas‐based CHP systems are primarily topping cycles in which the input fuel, natural gas, is used in a prime mover such as a gas turbine, reciprocating engine, microturbine, or fuel cell, for electricity production and a portion of the heat normally wasted is recovered to supply thermal needs such as process steam or space cooling at the site. Natural gas is by far the predominant fuel used for CHP in California, representing 84% of the 8,829 MW of installed CHP capacity in the state. Natural gas is the fuel of choice for most CHP applications because of its competitive price, ease of use, reliability of supply, relatively low criteria pollutant emissions, and, increasingly, its low carbon content in comparison to coal and oil. If properly designed and operated, natural gas CHP can provide significant benefits to California in terms of energy efficiency and reduced CO2 emissions.
Many policy makers are also interested in promoting CHP fueled by renewable fuels or waste heat. Renewable‐fueled CHP is often based on topping cycles in which fuels such as anaerobic digester gas are used in place of natural gas to fuel the prime mover. Waste heat CHP systems are bottoming cycles in which fuel is first used to produce useful thermal energy for a process and energy is recovered from the hot exhaust for electricity production. Both approaches provide additional CO2 reduction benefits. Biogas is generally considered to be a carbon‐ neutral source of energy because the carbon emitted during combustion is atmospheric carbon that was recently fixed by plants or other organisms, as opposed to the combustion of fossil fuels where carbon sequestered for millions of years is released into the atmosphere. Waste heat CHP provides electricity with essentially zero carbon emissions as long as there is no supplemental fuel used in the conversion process. This section provides a description and preliminary estimates of market potential in California for three low‐carbon CHP options.
Anaerobic Digestion – Municipal Wastewater Treatment36 Wastewater treatment plants are an essential and integral part of all urban communities in the Unites States. These plants routinely process residential, commercial, and industrial wastes for conversion into benign liquid and solid waste streams. Many wastewater treatment facilities employ anaerobic digesters to break down sewage sludge and eliminate pathogens in wastewater. During the wastewater treatment process, solids from primary and secondary treatment are collected and further processed, via digestion, to stabilize and reduce the volume of the sludge. The digestion is typically performed anaerobically in which bacteria break down the organic matter in an oxygen‐free environment. Most anaerobic digesters are heated to accelerate the digestion process. The process produces a biogas consisting of 65‐70% methane, 30% carbon dioxide, and other inert gases such as nitrogen. Most wastewater treatment plants that utilize anaerobic digestion collect and use their biogas on‐site to provide heating for the digester itself and space heating for the facility. Some municipalities have begun to divert food
36 Wastewater Treatment analysis based on California Energy Commission Staff Paper, Combined Heat and Power at California’s Wastewater Treatment Plants, Pramod Kulkani, September 2009.
E-1
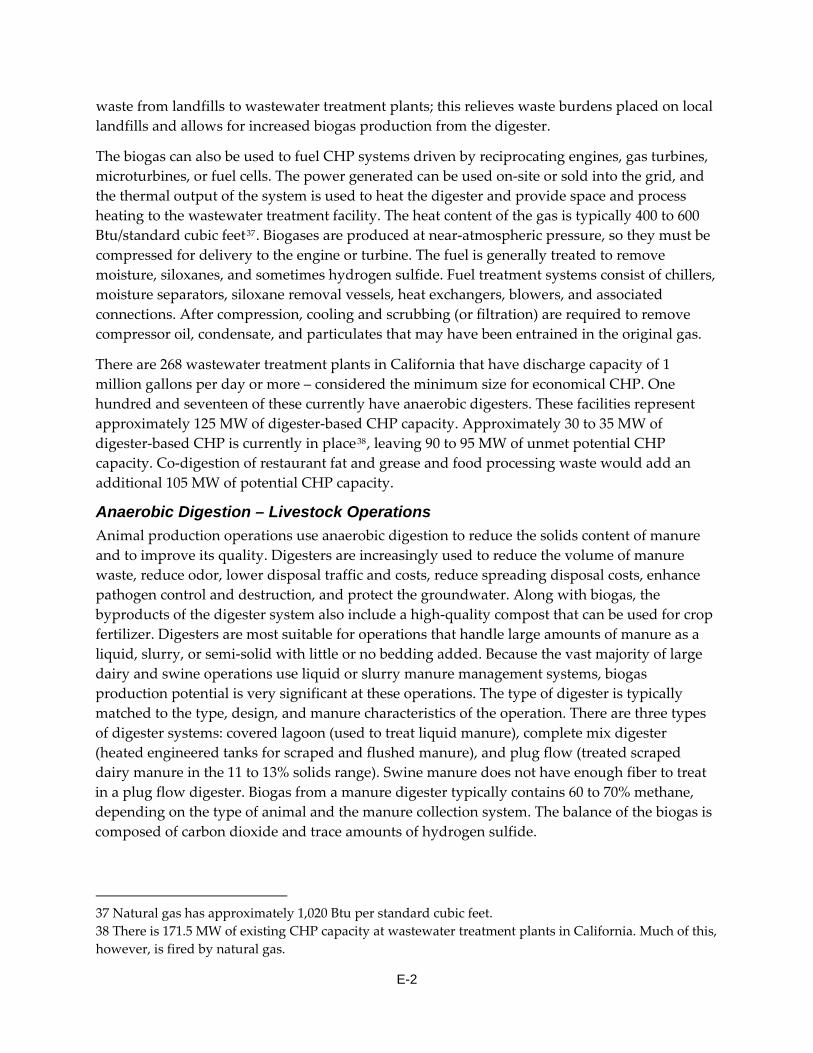
waste from landfills to wastewater treatment plants; this relieves waste burdens placed on local landfills and allows for increased biogas production from the digester.
The biogas can also be used to fuel CHP systems driven by reciprocating engines, gas turbines, microturbines, or fuel cells. The power generated can be used on‐site or sold into the grid, and the thermal output of the system is used to heat the digester and provide space and process heating to the wastewater treatment facility. The heat content of the gas is typically 400 to 600 Btu/standard cubic feet37. Biogases are produced at near‐atmospheric pressure, so they must be compressed for delivery to the engine or turbine. The fuel is generally treated to remove moisture, siloxanes, and sometimes hydrogen sulfide. Fuel treatment systems consist of chillers, moisture separators, siloxane removal vessels, heat exchangers, blowers, and associated connections. After compression, cooling and scrubbing (or filtration) are required to remove compressor oil, condensate, and particulates that may have been entrained in the original gas.
There are 268 wastewater treatment plants in California that have discharge capacity of 1 million gallons per day or more – considered the minimum size for economical CHP. One hundred and seventeen of these currently have anaerobic digesters. These facilities represent approximately 125 MW of digester‐based CHP capacity. Approximately 30 to 35 MW of digester‐based CHP is currently in place38, leaving 90 to 95 MW of unmet potential CHP capacity. Co‐digestion of restaurant fat and grease and food processing waste would add an additional 105 MW of potential CHP capacity.
Anaerobic Digestion – Livestock Operations Animal production operations use anaerobic digestion to reduce the solids content of manure and to improve its quality. Digesters are increasingly used to reduce the volume of manure waste, reduce odor, lower disposal traffic and costs, reduce spreading disposal costs, enhance pathogen control and destruction, and protect the groundwater. Along with biogas, the byproducts of the digester system also include a high‐quality compost that can be used for crop fertilizer. Digesters are most suitable for operations that handle large amounts of manure as a liquid, slurry, or semi‐solid with little or no bedding added. Because the vast majority of large dairy and swine operations use liquid or slurry manure management systems, biogas production potential is very significant at these operations. The type of digester is typically matched to the type, design, and manure characteristics of the operation. There are three types of digester systems: covered lagoon (used to treat liquid manure), complete mix digester (heated engineered tanks for scraped and flushed manure), and plug flow (treated scraped dairy manure in the 11 to 13% solids range). Swine manure does not have enough fiber to treat in a plug flow digester. Biogas from a manure digester typically contains 60 to 70% methane, depending on the type of animal and the manure collection system. The balance of the biogas is composed of carbon dioxide and trace amounts of hydrogen sulfide.
37 Natural gas has approximately 1,020 Btu per standard cubic feet. 38 There is 171.5 MW of existing CHP capacity at wastewater treatment plants in California. Much of this, however, is fired by natural gas.
E-2
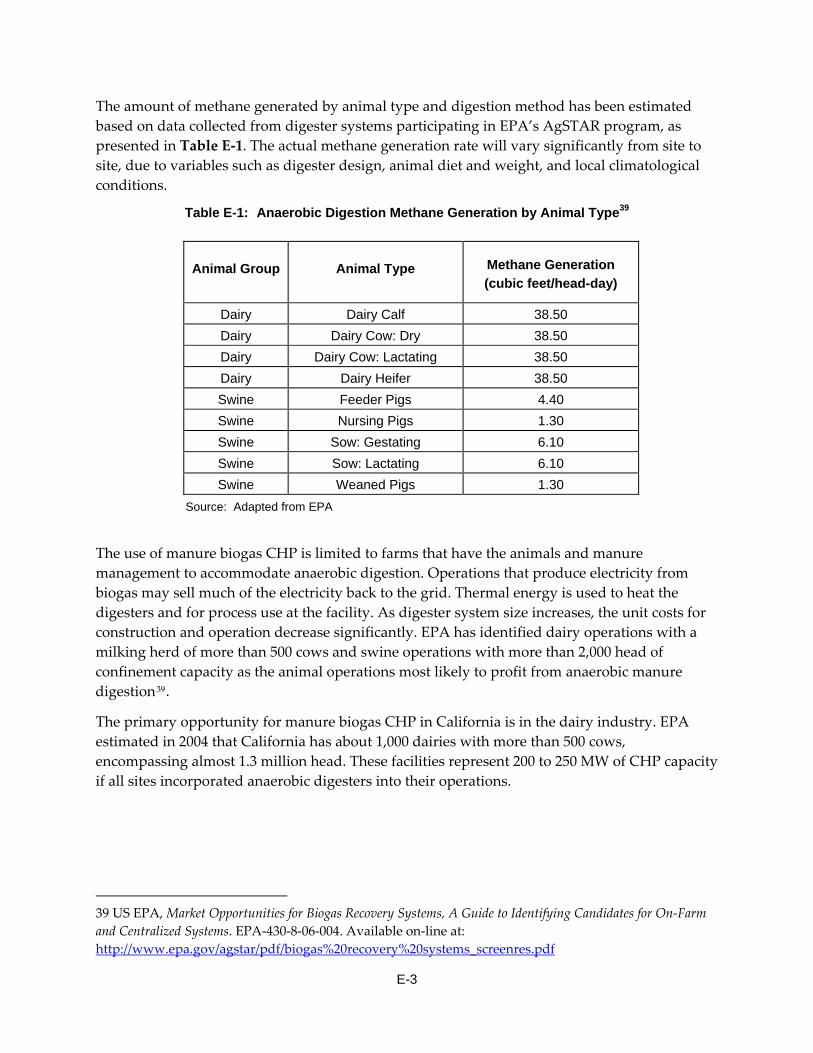
The amount of methane generated by animal type and digestion method has been estimated based on data collected from digester systems participating in EPA’s AgSTAR program, as presented in Table E‐1. The actual methane generation rate will vary significantly from site to site, due to variables such as digester design, animal diet and weight, and local climatological conditions.
Table E-1: Anaerobic Digestion Methane Generation by Animal Type39
Animal Group Animal Type Methane Generation (cubic feet/head-day)
Dairy Dairy Calf 38.50 Dairy Dairy Cow: Dry 38.50 Dairy Dairy Cow: Lactating 38.50 Dairy Dairy Heifer 38.50 Swine Feeder Pigs 4.40 Swine Nursing Pigs 1.30 Swine Sow: Gestating 6.10 Swine Sow: Lactating 6.10 Swine Weaned Pigs 1.30
Source: Adapted from EPA
The use of manure biogas CHP is limited to farms that have the animals and manure management to accommodate anaerobic digestion. Operations that produce electricity from biogas may sell much of the electricity back to the grid. Thermal energy is used to heat the digesters and for process use at the facility. As digester system size increases, the unit costs for construction and operation decrease significantly. EPA has identified dairy operations with a milking herd of more than 500 cows and swine operations with more than 2,000 head of confinement capacity as the animal operations most likely to profit from anaerobic manure digestion39.
The primary opportunity for manure biogas CHP in California is in the dairy industry. EPA estimated in 2004 that California has about 1,000 dairies with more than 500 cows, encompassing almost 1.3 million head. These facilities represent 200 to 250 MW of CHP capacity if all sites incorporated anaerobic digesters into their operations.
39 US EPA, Market Opportunities for Biogas Recovery Systems, A Guide to Identifying Candidates for On‐Farm and Centralized Systems. EPA‐430‐8‐06‐004. Available on‐line at: http://www.epa.gov/agstar/pdf/biogas%20recovery%20systems_screenres.pdf
E-3
Waste Heat to Power Roughly a third of the energy consumed by the U.S. manufacturing industry is discharged as thermal losses to the atmosphere or to cooling systems40. These discharges are the result of process inefficiencies and the inability of the manufacturer to utilize the excess energy streams. Nationally, this waste energy is estimated to be over 10 quads per year (1 quad = 1015 Btu)40. Most of this waste energy, however, is low quality (i.e., below 500° F) and not practical or economical to recover. Estimates of the amount of the waste heat considered high enough in temperature and quality to represent an opportunity for waste heat recovery for power range from 0.5 to 1.8 quads on a national basis (4,000 to 14,000 MW electric capacity assuming 20% conversion efficiency and 7,500 hours per year operation)41,42.
Waste heat CHP systems are bottoming cycles in which energy recovered from the hot exhaust is converted to electricity through a Rankine power cycle as shown in Figure E‐1. Power produced by such a heat recovery system could be used internally at the site and any excess sold into the electric grid.
Condenser
ExhaustHeat In
Working Fluid
Heat Recovery Boiler
PowerTurbine
Pump
Power Out
Heat Out
Condenser
ExhaustHeat In
Working Fluid
Heat Recovery Boiler
PowerTurbine
Pump
Power Out
Heat Out
Figure E-1: Waste Heat Recovery Power Cycle Source: ICF International
In a heat recovery Rankine cycle, a working fluid is first pumped to elevated pressure before entering a heat recovery boiler. The pressurized fluid is vaporized by the hot exhaust, and then expanded to lower pressure in a turbine, generating mechanical power that can drive an electric generator. The low‐pressure vapor is then exhausted to a condenser at vacuum conditions
40 Engineering Scoping Study of Thermoelectric Generator Systems for Industrial Waste Heat Recovery, Terry Hendricks, Pacific Northwest National Laboratory, William Choate, BCS Incorporated, Report to U.S. DOE Industrial Technologies Program, November 2006. 41 Inventory of Industrial Waste Heat Opportunities and Opportunities for Thermally Activated Technologies, United Technologies Research Center, Draft report to Oak Ridge National Laboratory, April 2004. 42 Energy Use, Loss and Opportunity Analysis: U.S. Manufacturing and Mining, Energetics, Inc., E3M, Incorporated, Report to U.S. DOE Industrial Technologies Program, December 2004
E-4
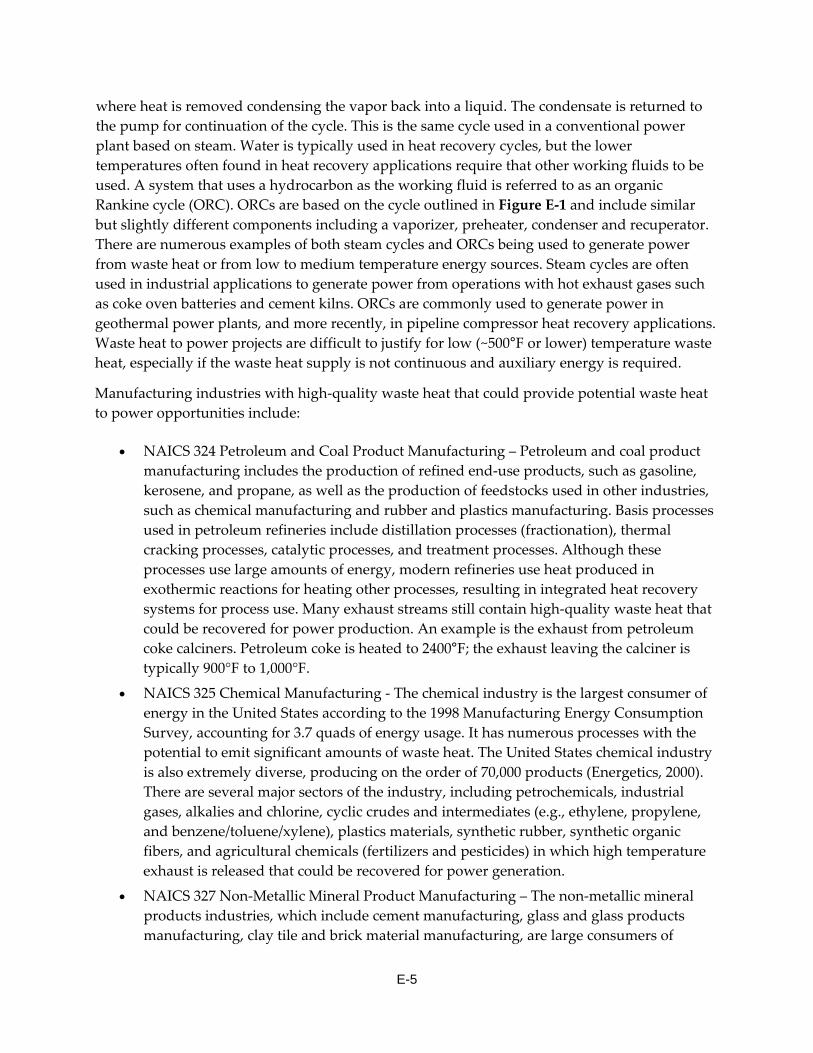
where heat is removed condensing the vapor back into a liquid. The condensate is returned to the pump for continuation of the cycle. This is the same cycle used in a conventional power plant based on steam. Water is typically used in heat recovery cycles, but the lower temperatures often found in heat recovery applications require that other working fluids to be used. A system that uses a hydrocarbon as the working fluid is referred to as an organic Rankine cycle (ORC). ORCs are based on the cycle outlined in Figure E‐1 and include similar but slightly different components including a vaporizer, preheater, condenser and recuperator. There are numerous examples of both steam cycles and ORCs being used to generate power from waste heat or from low to medium temperature energy sources. Steam cycles are often used in industrial applications to generate power from operations with hot exhaust gases such as coke oven batteries and cement kilns. ORCs are commonly used to generate power in geothermal power plants, and more recently, in pipeline compressor heat recovery applications. Waste heat to power projects are difficult to justify for low (~500°F or lower) temperature waste heat, especially if the waste heat supply is not continuous and auxiliary energy is required.
Manufacturing industries with high‐quality waste heat that could provide potential waste heat to power opportunities include:
• NAICS 324 Petroleum and Coal Product Manufacturing – Petroleum and coal product manufacturing includes the production of refined end‐use products, such as gasoline, kerosene, and propane, as well as the production of feedstocks used in other industries, such as chemical manufacturing and rubber and plastics manufacturing. Basis processes used in petroleum refineries include distillation processes (fractionation), thermal cracking processes, catalytic processes, and treatment processes. Although these processes use large amounts of energy, modern refineries use heat produced in exothermic reactions for heating other processes, resulting in integrated heat recovery systems for process use. Many exhaust streams still contain high‐quality waste heat that could be recovered for power production. An example is the exhaust from petroleum coke calciners. Petroleum coke is heated to 2400°F; the exhaust leaving the calciner is typically 900°F to 1,000°F.
• NAICS 325 Chemical Manufacturing ‐ The chemical industry is the largest consumer of energy in the United States according to the 1998 Manufacturing Energy Consumption Survey, accounting for 3.7 quads of energy usage. It has numerous processes with the potential to emit significant amounts of waste heat. The United States chemical industry is also extremely diverse, producing on the order of 70,000 products (Energetics, 2000). There are several major sectors of the industry, including petrochemicals, industrial gases, alkalies and chlorine, cyclic crudes and intermediates (e.g., ethylene, propylene, and benzene/toluene/xylene), plastics materials, synthetic rubber, synthetic organic fibers, and agricultural chemicals (fertilizers and pesticides) in which high temperature exhaust is released that could be recovered for power generation.
• NAICS 327 Non‐Metallic Mineral Product Manufacturing – The non‐metallic mineral products industries, which include cement manufacturing, glass and glass products manufacturing, clay tile and brick material manufacturing, are large consumers of
E-5
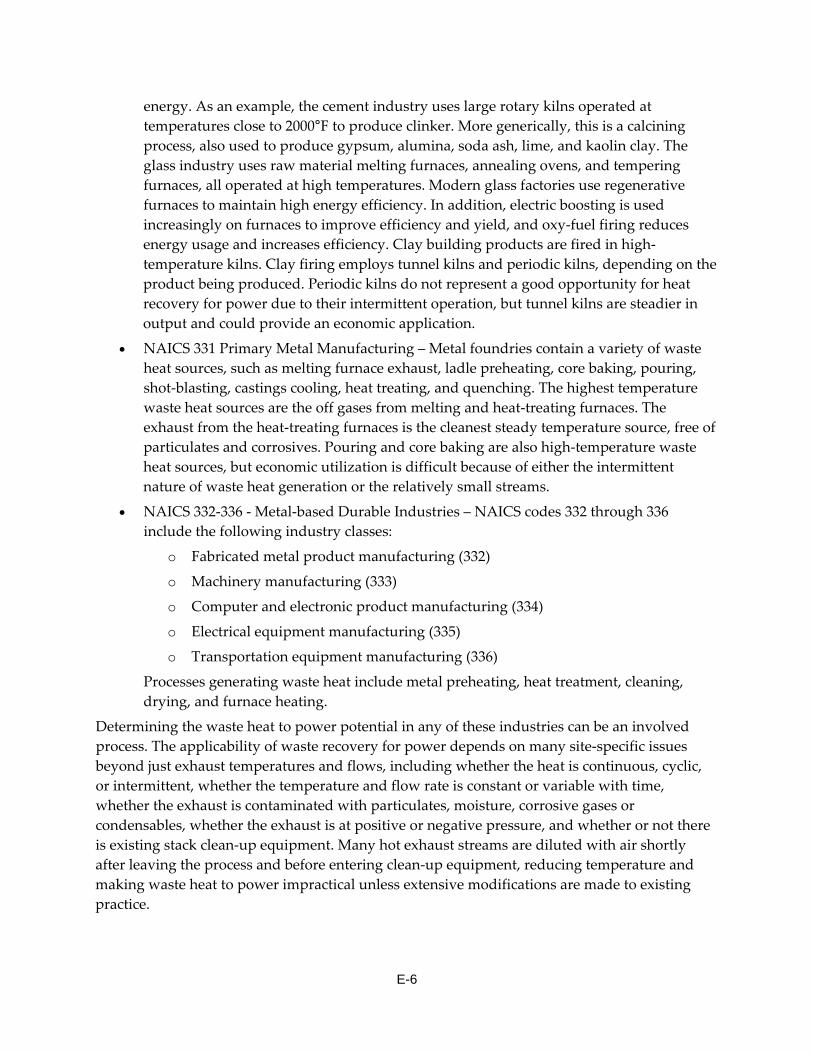
energy. As an example, the cement industry uses large rotary kilns operated at temperatures close to 2000°F to produce clinker. More generically, this is a calcining process, also used to produce gypsum, alumina, soda ash, lime, and kaolin clay. The glass industry uses raw material melting furnaces, annealing ovens, and tempering furnaces, all operated at high temperatures. Modern glass factories use regenerative furnaces to maintain high energy efficiency. In addition, electric boosting is used increasingly on furnaces to improve efficiency and yield, and oxy‐fuel firing reduces energy usage and increases efficiency. Clay building products are fired in high‐temperature kilns. Clay firing employs tunnel kilns and periodic kilns, depending on the product being produced. Periodic kilns do not represent a good opportunity for heat recovery for power due to their intermittent operation, but tunnel kilns are steadier in output and could provide an economic application.
• NAICS 331 Primary Metal Manufacturing – Metal foundries contain a variety of waste heat sources, such as melting furnace exhaust, ladle preheating, core baking, pouring, shot‐blasting, castings cooling, heat treating, and quenching. The highest temperature waste heat sources are the off gases from melting and heat‐treating furnaces. The exhaust from the heat‐treating furnaces is the cleanest steady temperature source, free of particulates and corrosives. Pouring and core baking are also high‐temperature waste heat sources, but economic utilization is difficult because of either the intermittent nature of waste heat generation or the relatively small streams.
• NAICS 332‐336 ‐ Metal‐based Durable Industries – NAICS codes 332 through 336 include the following industry classes:
o Fabricated metal product manufacturing (332)
o Machinery manufacturing (333)
o Computer and electronic product manufacturing (334)
o Electrical equipment manufacturing (335)
o Transportation equipment manufacturing (336)
Processes generating waste heat include metal preheating, heat treatment, cleaning, drying, and furnace heating.
Determining the waste heat to power potential in any of these industries can be an involved process. The applicability of waste recovery for power depends on many site‐specific issues beyond just exhaust temperatures and flows, including whether the heat is continuous, cyclic, or intermittent, whether the temperature and flow rate is constant or variable with time, whether the exhaust is contaminated with particulates, moisture, corrosive gases or condensables, whether the exhaust is at positive or negative pressure, and whether or not there is existing stack clean‐up equipment. Many hot exhaust streams are diluted with air shortly after leaving the process and before entering clean‐up equipment, reducing temperature and making waste heat to power impractical unless extensive modifications are made to existing practice.
E-6
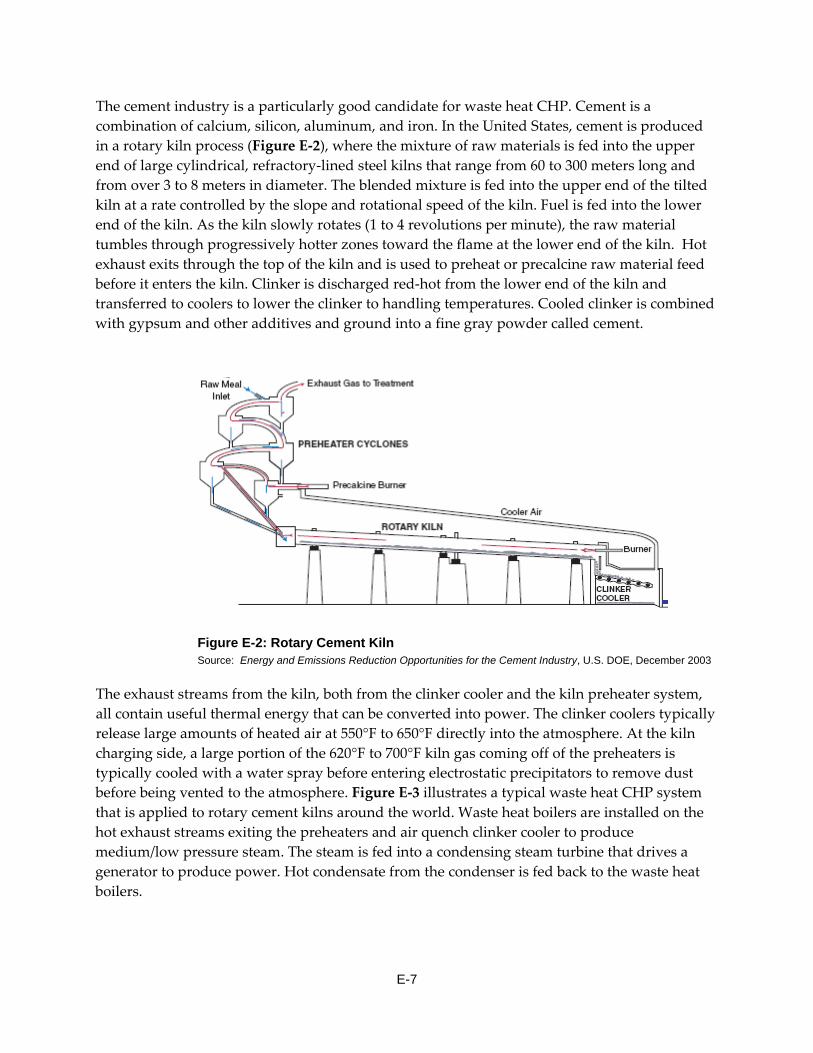
The cement industry is a particularly good candidate for waste heat CHP. Cement is a combination of calcium, silicon, aluminum, and iron. In the United States, cement is produced in a rotary kiln process (Figure E‐2), where the mixture of raw materials is fed into the upper end of large cylindrical, refractory‐lined steel kilns that range from 60 to 300 meters long and from over 3 to 8 meters in diameter. The blended mixture is fed into the upper end of the tilted kiln at a rate controlled by the slope and rotational speed of the kiln. Fuel is fed into the lower end of the kiln. As the kiln slowly rotates (1 to 4 revolutions per minute), the raw material tumbles through progressively hotter zones toward the flame at the lower end of the kiln. Hot exhaust exits through the top of the kiln and is used to preheat or precalcine raw material feed before it enters the kiln. Clinker is discharged red‐hot from the lower end of the kiln and transferred to coolers to lower the clinker to handling temperatures. Cooled clinker is combined with gypsum and other additives and ground into a fine gray powder called cement.
Figure E-2: Rotary Cement Kiln Source: Energy and Emissions Reduction Opportunities for the Cement Industry, U.S. DOE, December 2003
The exhaust streams from the kiln, both from the clinker cooler and the kiln preheater system, all contain useful thermal energy that can be converted into power. The clinker coolers typically release large amounts of heated air at 550°F to 650°F directly into the atmosphere. At the kiln charging side, a large portion of the 620°F to 700°F kiln gas coming off of the preheaters is typically cooled with a water spray before entering electrostatic precipitators to remove dust before being vented to the atmosphere. Figure E‐3 illustrates a typical waste heat CHP system that is applied to rotary cement kilns around the world. Waste heat boilers are installed on the hot exhaust streams exiting the preheaters and air quench clinker cooler to produce medium/low pressure steam. The steam is fed into a condensing steam turbine that drives a generator to produce power. Hot condensate from the condenser is fed back to the waste heat boilers.
E-7
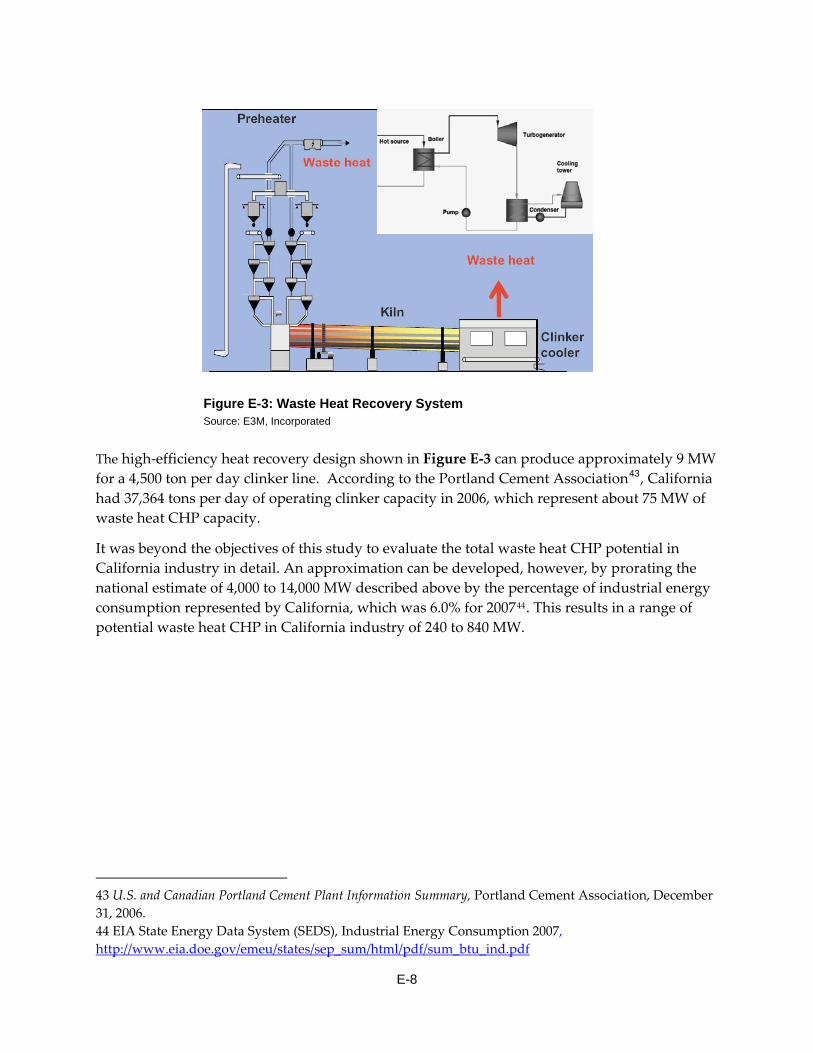
Figure E-3: Waste Heat Recovery System Source: E3M, Incorporated
The high‐efficiency heat recovery design shown in Figure E‐3 can produce approximately 9 MW for a 4,500 ton per day clinker line. According to the Portland Cement Association43, California had 37,364 tons per day of operating clinker capacity in 2006, which represent about 75 MW of waste heat CHP capacity.
It was beyond the objectives of this study to evaluate the total waste heat CHP potential in California industry in detail. An approximation can be developed, however, by prorating the national estimate of 4,000 to 14,000 MW described above by the percentage of industrial energy consumption represented by California, which was 6.0% for 200744. This results in a range of potential waste heat CHP in California industry of 240 to 840 MW.
43 U.S. and Canadian Portland Cement Plant Information Summary, Portland Cement Association, December 31, 2006. 44 EIA State Energy Data System (SEDS), Industrial Energy Consumption 2007, http://www.eia.doe.gov/emeu/states/sep_sum/html/pdf/sum_btu_ind.pdf
E-8
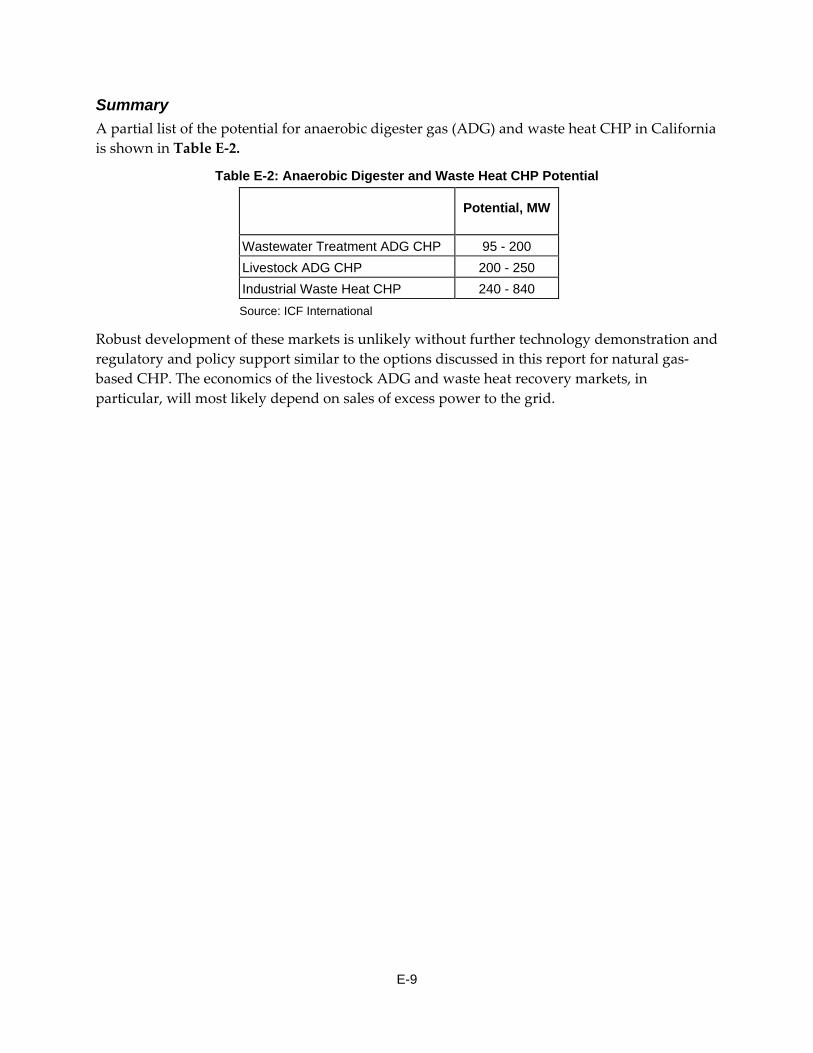
E-9
Summary A partial list of the potential for anaerobic digester gas (ADG) and waste heat CHP in California is shown in Table E‐2.
Table E-2: Anaerobic Digester and Waste Heat CHP Potential
Potential, MW
Wastewater Treatment ADG CHP 95 - 200 Livestock ADG CHP 200 - 250 Industrial Waste Heat CHP 240 - 840 Source: ICF International
Robust development of these markets is unlikely without further technology demonstration and regulatory and policy support similar to the options discussed in this report for natural gas‐based CHP. The economics of the livestock ADG and waste heat recovery markets, in particular, will most likely depend on sales of excess power to the grid.