Embed Size (px)
Citation preview
www.midwestcleanenergy.org
Combined Heat and Power as aBoiler MACT Compliance Strategy
Midwest Energy Efficiency Alliance Webinar Series
Wednesday, January 30th, 2013
John Cuttica
Director, Energy Resources Center
University of Illinois at Chicago
US DOE Midwest Clean Energy Application Center
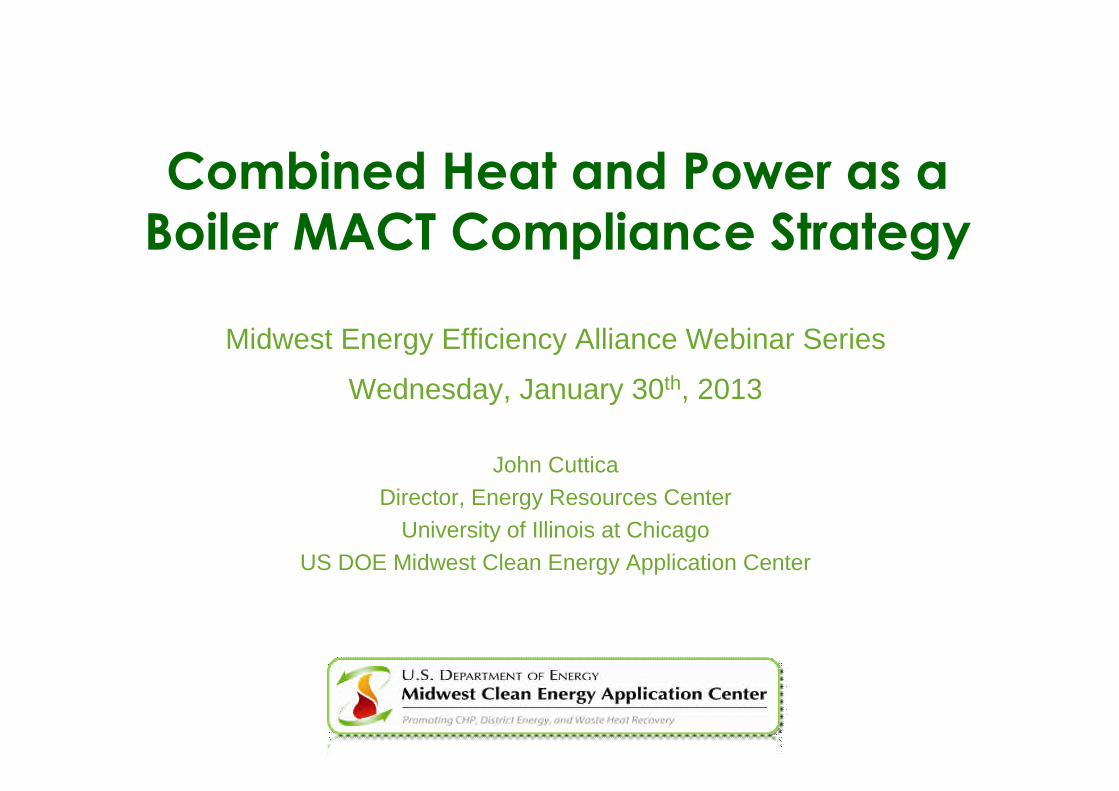
o Katrina Pielli --- DOE Headquarters
o Patti Garland --- Oak Ridge National Laboratory
o Bruce Hedman & Anne Hampson --- ICF International
o John Cuttica & Cliff Haefke --- Midwest CEAC
o Jim Freihaut --- Mid Atlantic CEAC
o Beka Kosanovic--- Northeast CEAC
o Isaac Panzarella --- Southeast CEAC
DOE Boiler MACT Technical AssistanceTeam
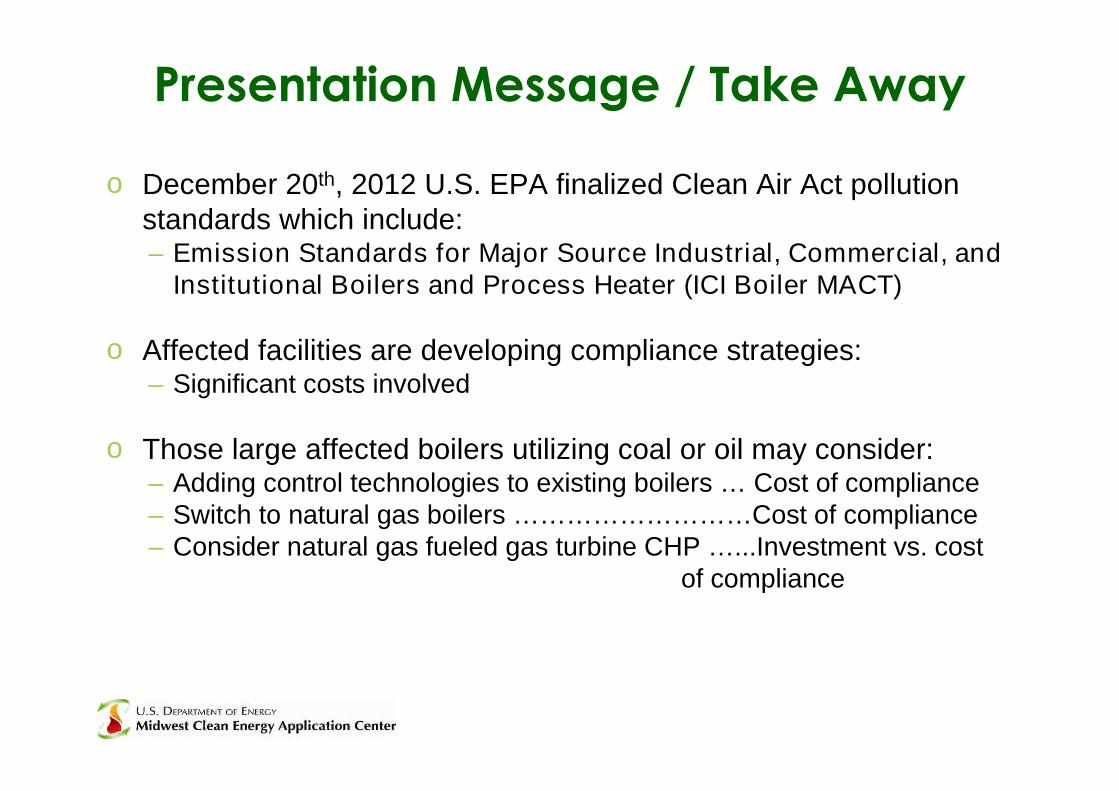
o December 20th, 2012 U.S. EPA finalized Clean Air Act pollutionstandards which include:– Emission Standards for Major Source Industrial, Commercial, and
Institutional Boilers and Process Heater (ICI Boiler MACT)
o Affected facilities are developing compliance strategies:– Significant costs involved
o Those large affected boilers utilizing coal or oil may consider:– Adding control technologies to existing boilers … Cost of compliance– Switch to natural gas boilers ………………………Cost of compliance– Consider natural gas fueled gas turbine CHP …...Investment vs. cost
of compliance
Presentation Message / Take Away
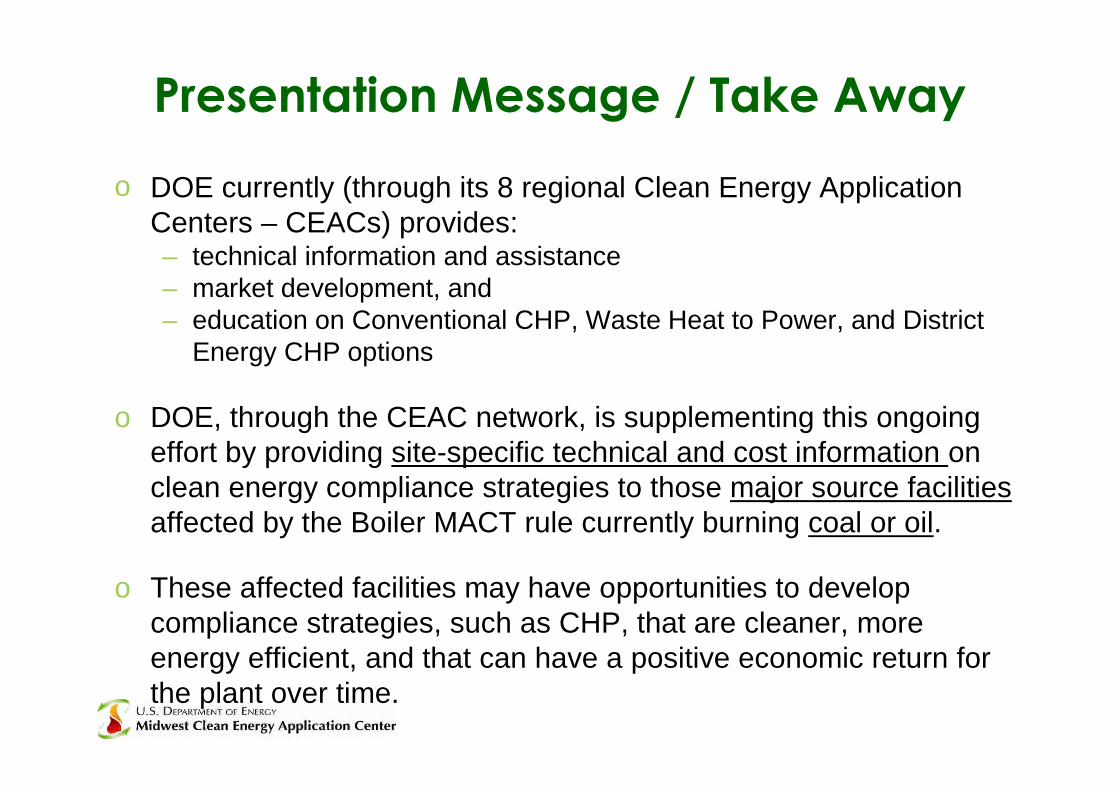
o DOE currently (through its 8 regional Clean Energy ApplicationCenters – CEACs) provides:– technical information and assistance– market development, and– education on Conventional CHP, Waste Heat to Power, and District
Energy CHP options
o DOE, through the CEAC network, is supplementing this ongoingeffort by providing site-specific technical and cost information onclean energy compliance strategies to those major source facilitiesaffected by the Boiler MACT rule currently burning coal or oil.
o These affected facilities may have opportunities to developcompliance strategies, such as CHP, that are cleaner, moreenergy efficient, and that can have a positive economic return forthe plant over time.
Presentation Message / Take Away
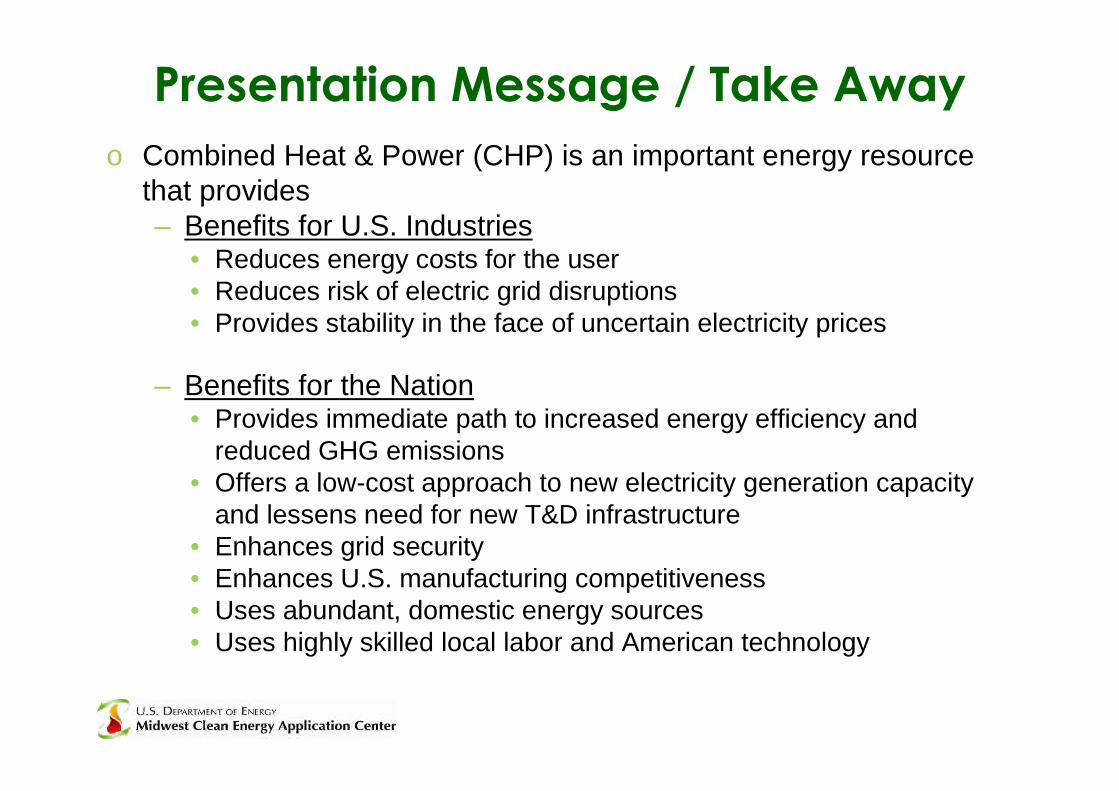
o Combined Heat & Power (CHP) is an important energy resourcethat provides– Benefits for U.S. Industries
• Reduces energy costs for the user• Reduces risk of electric grid disruptions• Provides stability in the face of uncertain electricity prices
– Benefits for the Nation• Provides immediate path to increased energy efficiency and
reduced GHG emissions• Offers a low-cost approach to new electricity generation capacity
and lessens need for new T&D infrastructure• Enhances grid security• Enhances U.S. manufacturing competitiveness• Uses abundant, domestic energy sources• Uses highly skilled local labor and American technology
Presentation Message / Take Away
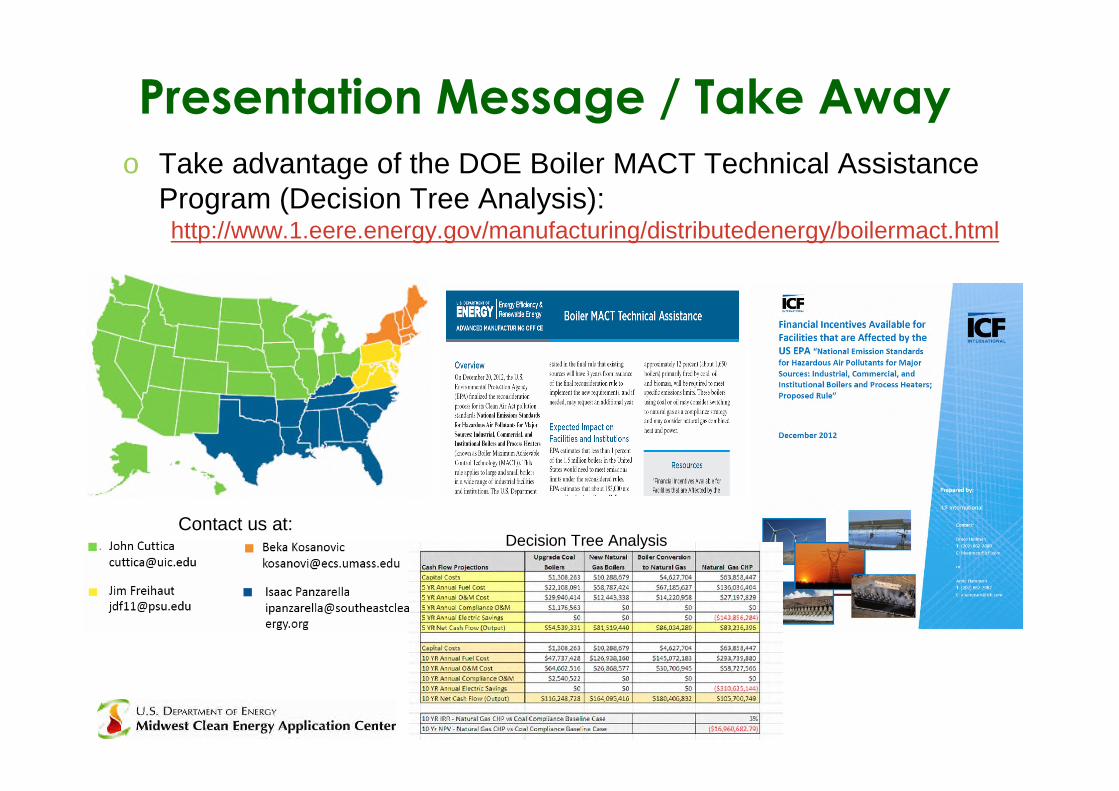
o Take advantage of the DOE Boiler MACT Technical AssistanceProgram (Decision Tree Analysis):http://www.1.eere.energy.gov/manufacturing/distributedenergy/boilermact.html
Presentation Message / Take Away
Contact us at:Decision Tree Analysis
National Emission Standards for HazardousAir Pollutants for Major Sources:
Industrial, Commercial, and InstitutionalBoilers and Process Heaters
(Boiler Maximum Achievable ControlTechnology – Boiler MACT)
EPA ICI Boiler MACT
o DOE efforts are focused on Major Source Boiler MACT
o Standards for hazardous air pollutants from major sources:industrial, commercial and institutional boilers and processheaters (excludes any unit combusting solid waste)
o Major source is a facility that emits:
– 10 tpy or more of any single Hazardous Air Pollutant, or 25 tpy or moreof total Hazardous Air Pollutants (HAPs)
o Emissions limits applicable to new and existing units > 10MMBtu/hr
– Mercury (Hg)
– Filterable Particulate Matter (PM) or Total Selective Metals (TSM) as asurrogate for non-mercury HAP metals
– Hydrogen Chloride (HCl) as a surrogate for acid gas HAP
– Carbon Monoxide (CO) as a surrogate for non-dioxin/furan organics8
EPA ICI Boiler MACT (cont’d)
o For new and existing units < 10 MMBtu/hr – the rule establishes awork practice standard instead of numeric emission limits(periodic tune-ups)
o Rule significantly impacts oil, coal, biomass, and process gasboilers
– Emission limits must be met at all times except for start-up andshutdown periods
– Controls are potentially required for Hg, PM, HCI, and CO
– Also includes monitoring and reporting requirements
– Limits are difficult (technically and economically) for oil and coalboilers (especially older units)
9
EPA ICI Boiler MACT (cont’d)
o Existing major source facilities are required to conduct a one-timeenergy assessment to identify cost-effective energy conservationmeasures
o Compliance must be met within 3 years from the publication ofthe final rule ---existing boilers may request an additional year iftechnology cannot be installed in time.
10
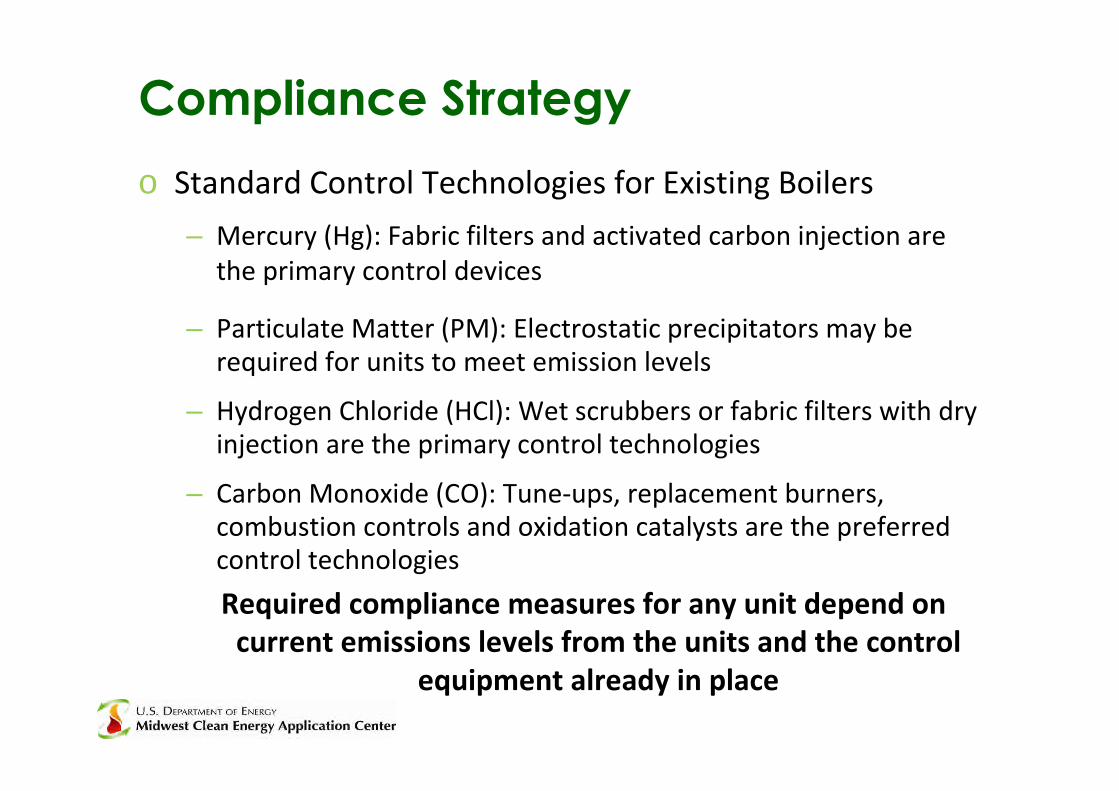
o Standard Control Technologies for Existing Boilers
– Mercury (Hg): Fabric filters and activated carbon injection arethe primary control devices
– Particulate Matter (PM): Electrostatic precipitators may berequired for units to meet emission levels
– Hydrogen Chloride (HCl): Wet scrubbers or fabric filters with dryinjection are the primary control technologies
– Carbon Monoxide (CO): Tune-ups, replacement burners,combustion controls and oxidation catalysts are the preferredcontrol technologies
Required compliance measures for any unit depend oncurrent emissions levels from the units and the control
equipment already in place
Compliance Strategy
o Convert boilers to burn natural gas (refinery & blast furnacegases are treated as natural gas in the rule)
– Replace burners in existing boilers with natural gas burners(lose efficiency)
– Replace boiler with natural gas boiler
– Compliance becomes straight forward (tune-ups in lieu ofmore rigorous control options)
Compliance Strategy
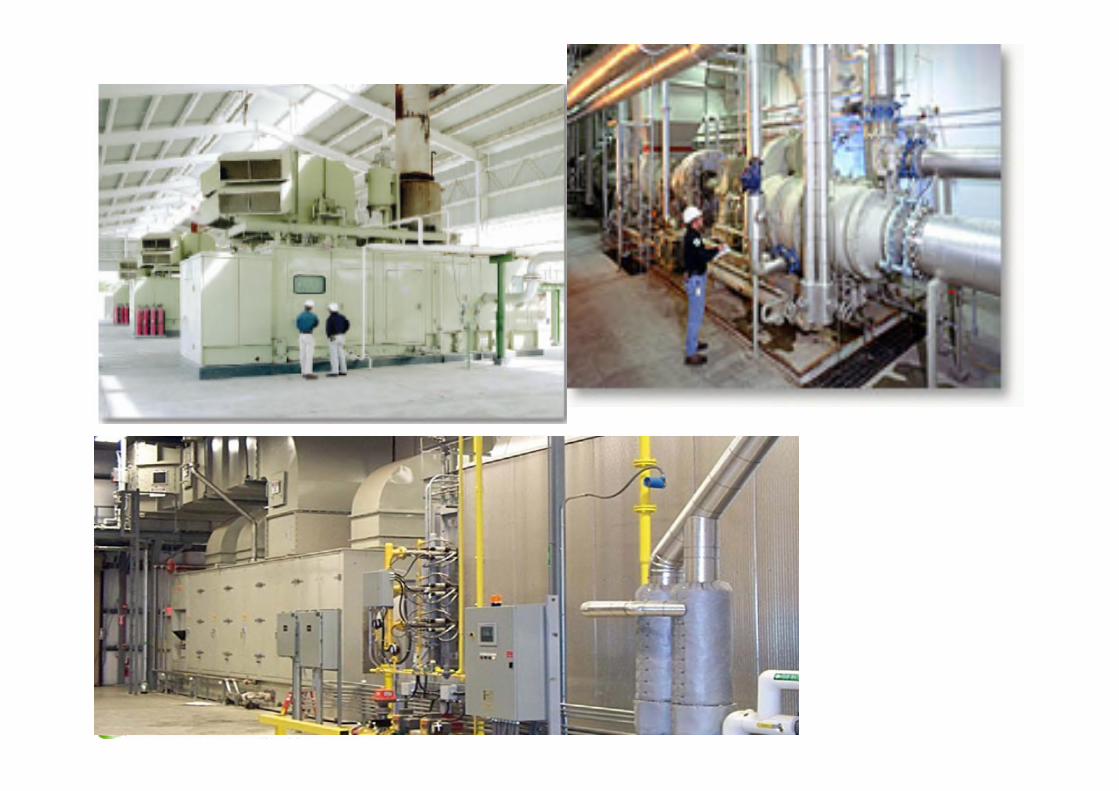
o Install a natural gas fueled Conventional CHP system
– Gas turbine/generator produces electricity
– Turbine waste heat generates steam through a HRSG
o Represents a tradeoff of benefits versus additional costs
– Represents a productive investment
– Potential for lower steam costs due to generating ownpower
– Higher overall efficiency and reduced emissions
– Higher capital costs, but partially offset by requiredcompliance costs or new gas boiler costs
Compliance Strategy
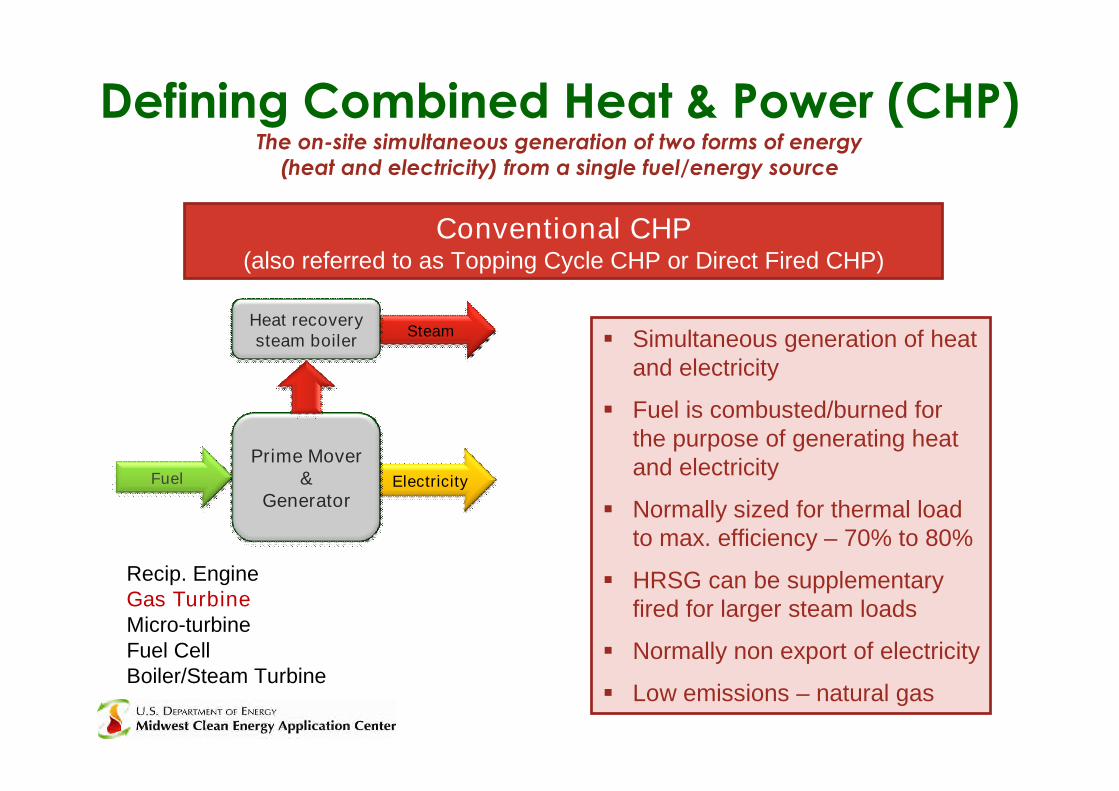
Defining Combined Heat & Power (CHP)The on-site simultaneous generation of two forms of energy
(heat and electricity) from a single fuel/energy source
Fuel Electricity
Steam
Prime Mover&
Generator
Conventional CHP(also referred to as Topping Cycle CHP or Direct Fired CHP)
Simultaneous generation of heatand electricity
Fuel is combusted/burned forthe purpose of generating heatand electricity
Normally sized for thermal loadto max. efficiency – 70% to 80%
HRSG can be supplementaryfired for larger steam loads
Normally non export of electricity
Low emissions – natural gas
Heat recoverysteam boiler
Recip. EngineGas TurbineMicro-turbineFuel CellBoiler/Steam Turbine
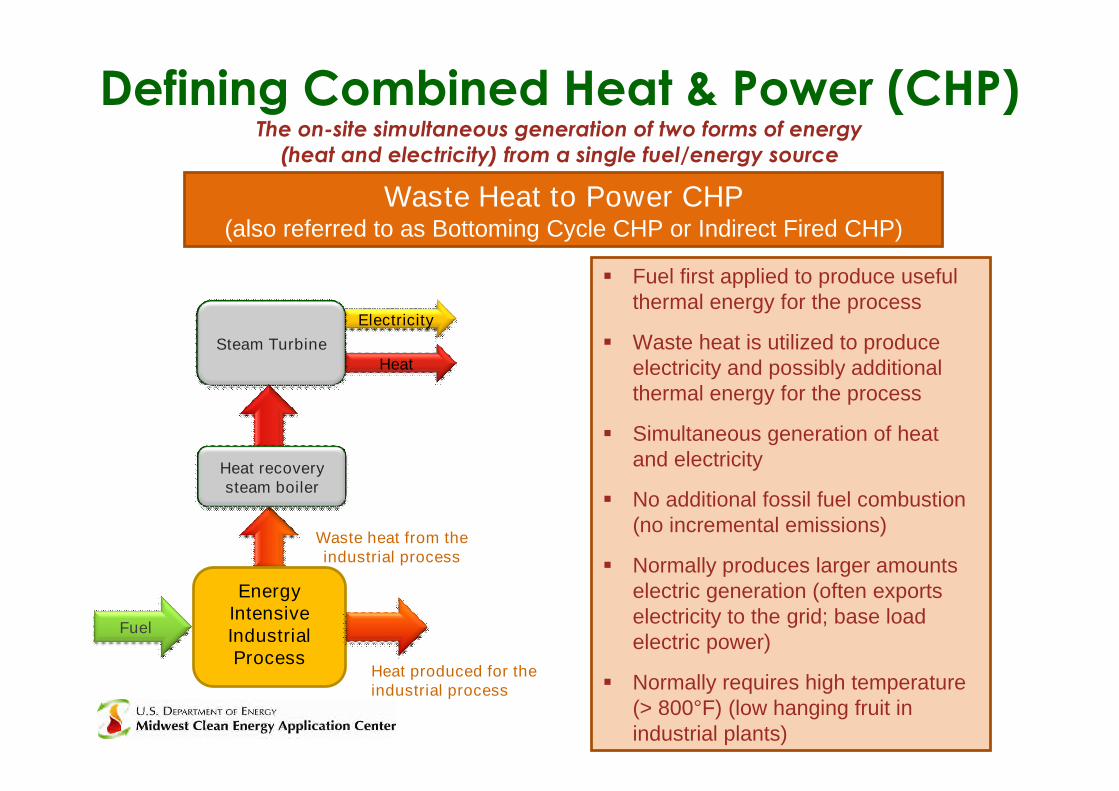
Defining Combined Heat & Power (CHP)The on-site simultaneous generation of two forms of energy
(heat and electricity) from a single fuel/energy source
Waste Heat to Power CHP(also referred to as Bottoming Cycle CHP or Indirect Fired CHP)
Fuel first applied to produce usefulthermal energy for the process
Waste heat is utilized to produceelectricity and possibly additionalthermal energy for the process
Simultaneous generation of heatand electricity
No additional fossil fuel combustion(no incremental emissions)
Normally produces larger amountselectric generation (often exportselectricity to the grid; base loadelectric power)
Normally requires high temperature(> 800°F) (low hanging fruit inindustrial plants)
Fuel
Electricity
EnergyIntensiveIndustrialProcess
Heat produced for theindustrial process
Waste heat from theindustrial process
HeatSteam Turbine
Heat recoverysteam boiler
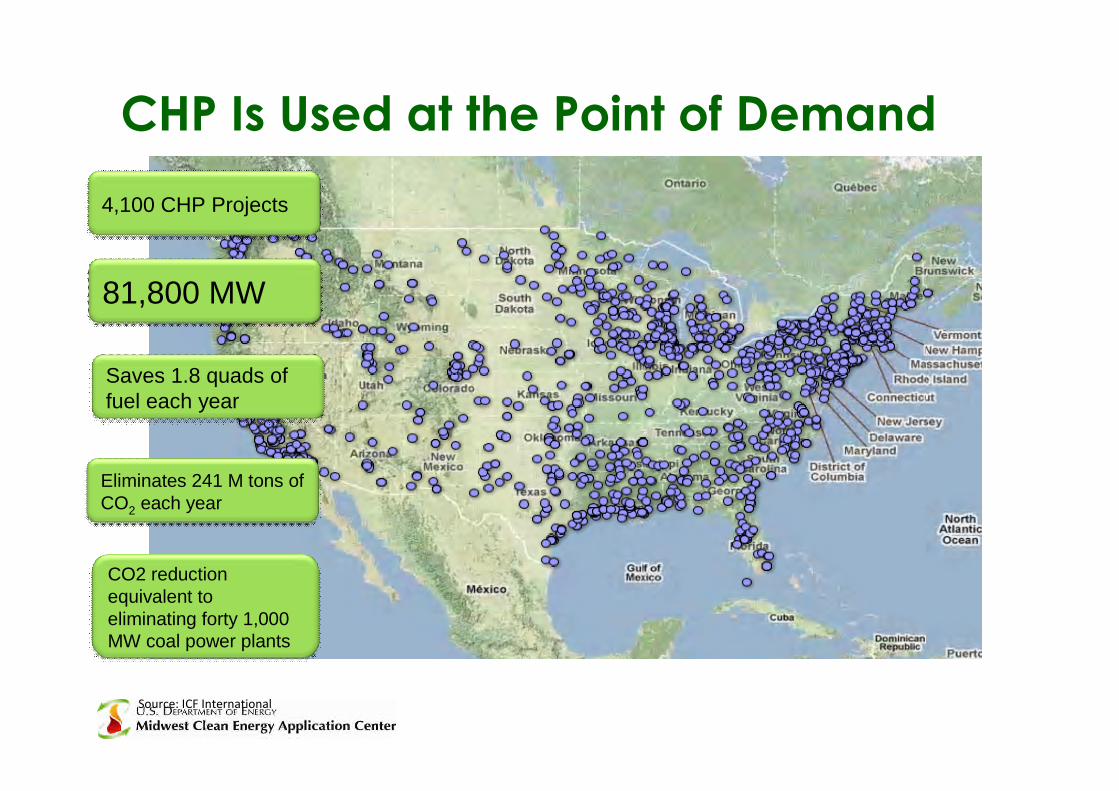
CHP Is Used at the Point of Demand
81,800 MW
4,100 CHP Projects
Saves 1.8 quads offuel each year
Eliminates 241 M tons ofCO2 each year
CO2 reductionequivalent toeliminating forty 1,000MW coal power plants
Source: ICF International
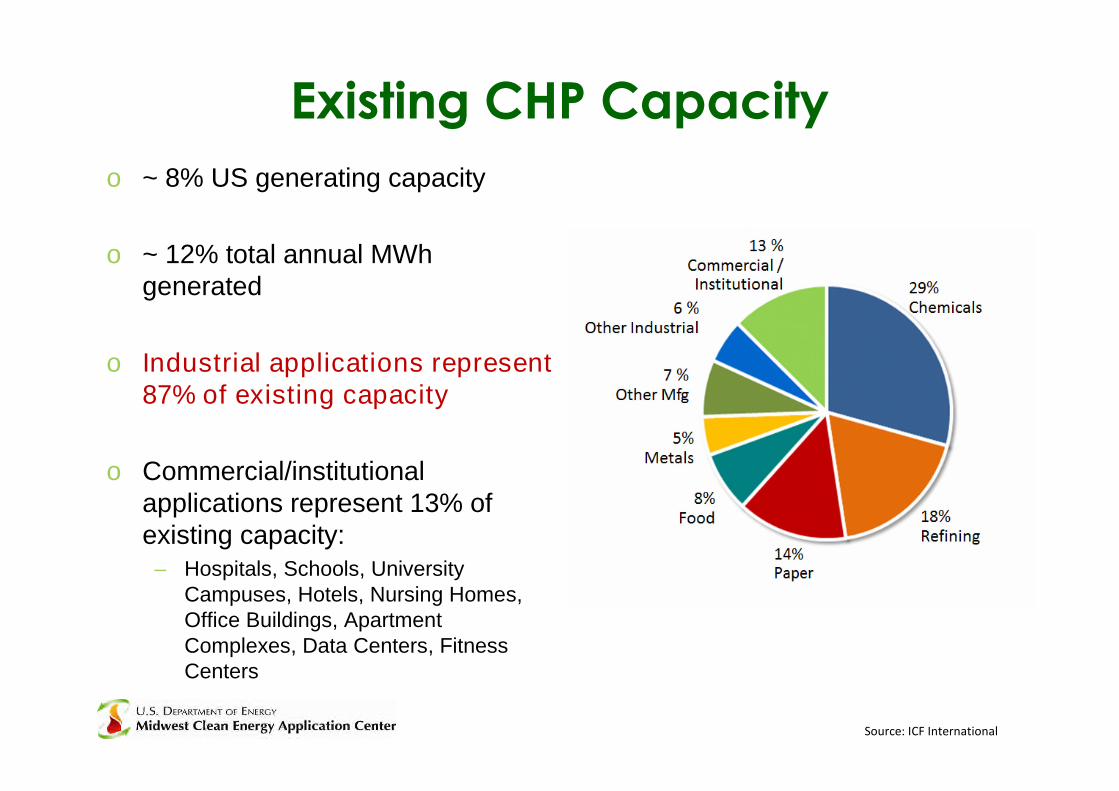
Existing CHP Capacity
o ~ 8% US generating capacity
o ~ 12% total annual MWhgenerated
o Industrial applications represent87% of existing capacity
o Commercial/institutionalapplications represent 13% ofexisting capacity:
– Hospitals, Schools, UniversityCampuses, Hotels, Nursing Homes,Office Buildings, ApartmentComplexes, Data Centers, FitnessCenters
Source: ICF International
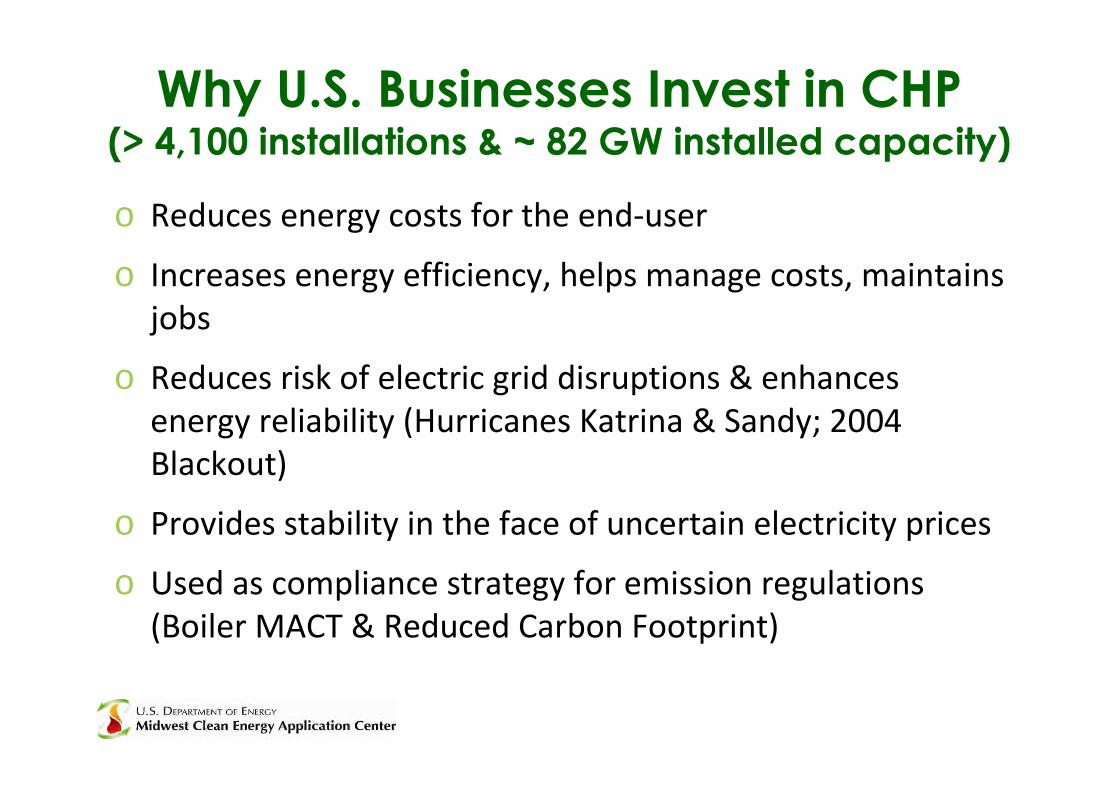
o Reduces energy costs for the end-user
o Increases energy efficiency, helps manage costs, maintainsjobs
o Reduces risk of electric grid disruptions & enhancesenergy reliability (Hurricanes Katrina & Sandy; 2004Blackout)
o Provides stability in the face of uncertain electricity prices
o Used as compliance strategy for emission regulations(Boiler MACT & Reduced Carbon Footprint)
Why U.S. Businesses Invest in CHP(> 4,100 installations & ~ 82 GW installed capacity)
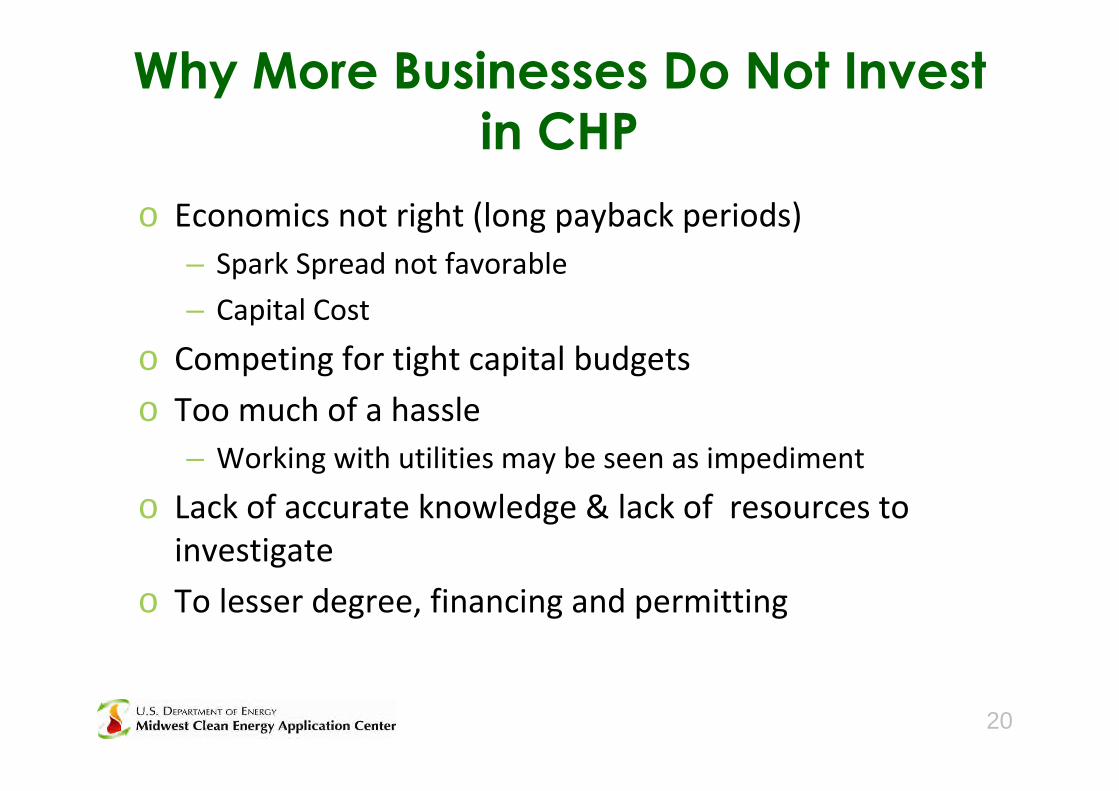
o Economics not right (long payback periods)
– Spark Spread not favorable
– Capital Cost
o Competing for tight capital budgets
o Too much of a hassle
– Working with utilities may be seen as impediment
o Lack of accurate knowledge & lack of resources toinvestigate
o To lesser degree, financing and permitting
Why More Businesses Do Not Investin CHP
20
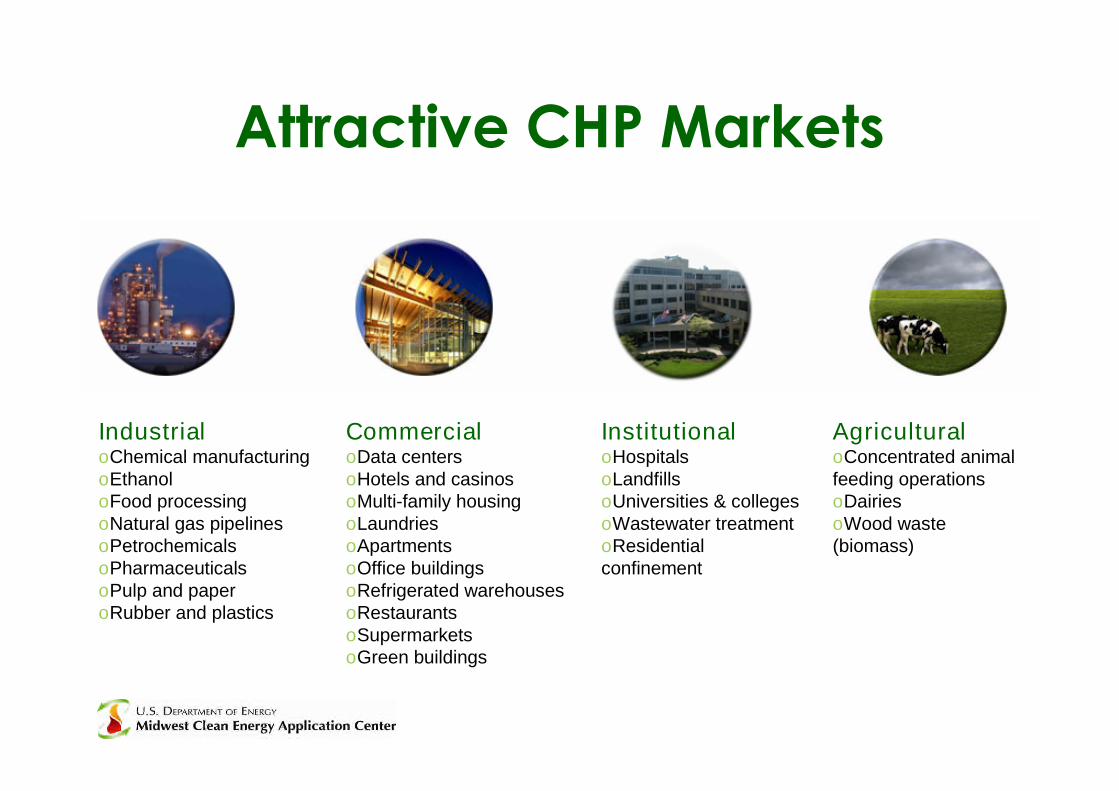
Attractive CHP Markets
IndustrialoChemical manufacturingoEthanoloFood processingoNatural gas pipelinesoPetrochemicalsoPharmaceuticalsoPulp and paperoRubber and plastics
CommercialoData centersoHotels and casinosoMulti-family housingoLaundriesoApartmentsoOffice buildingsoRefrigerated warehousesoRestaurantsoSupermarketsoGreen buildings
InstitutionaloHospitalsoLandfillsoUniversities & collegesoWastewater treatmentoResidentialconfinement
AgriculturaloConcentrated animalfeeding operationsoDairiesoWood waste(biomass)
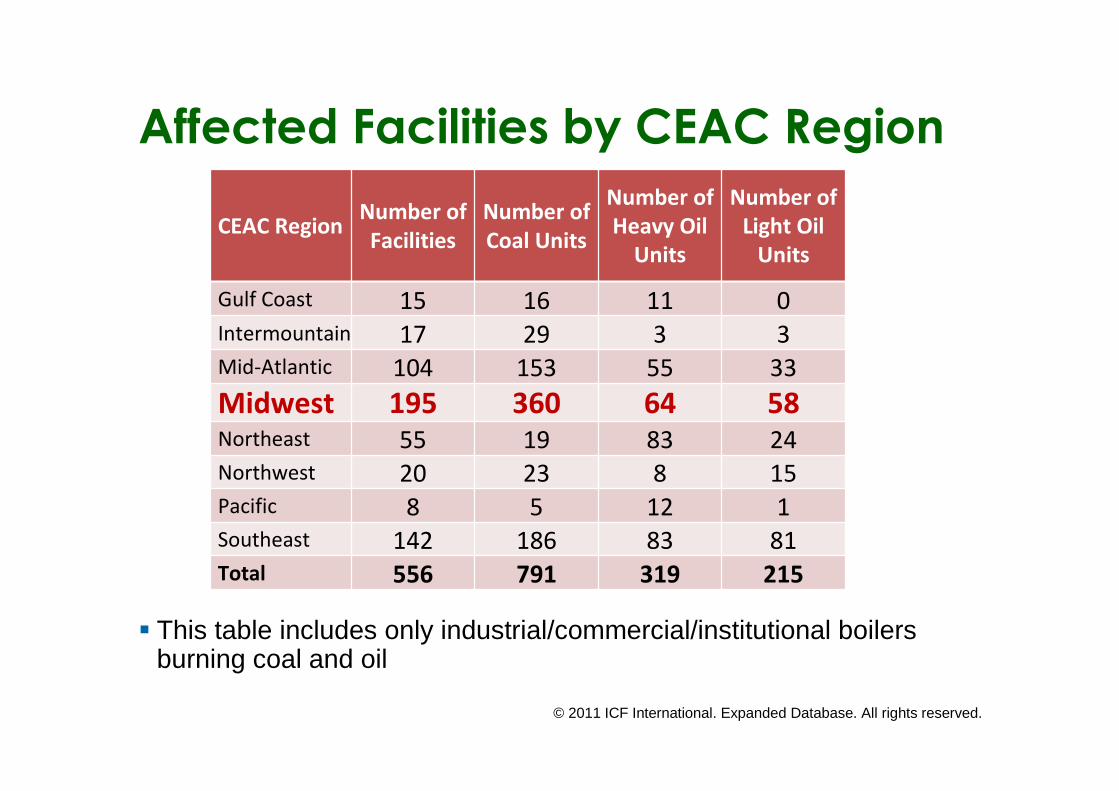
Affected Facilities by CEAC Region
© 2011 ICF International. Expanded Database. All rights reserved.
This table includes only industrial/commercial/institutional boilersburning coal and oil
CEAC RegionNumber ofFacilities
Number ofCoal Units
Number ofHeavy Oil
Units
Number ofLight Oil
Units
Gulf Coast 15 16 11 0Intermountain 17 29 3 3Mid-Atlantic 104 153 55 33
Midwest 195 360 64 58Northeast 55 19 83 24Northwest 20 23 8 15Pacific 8 5 12 1Southeast 142 186 83 81Total 556 791 319 215
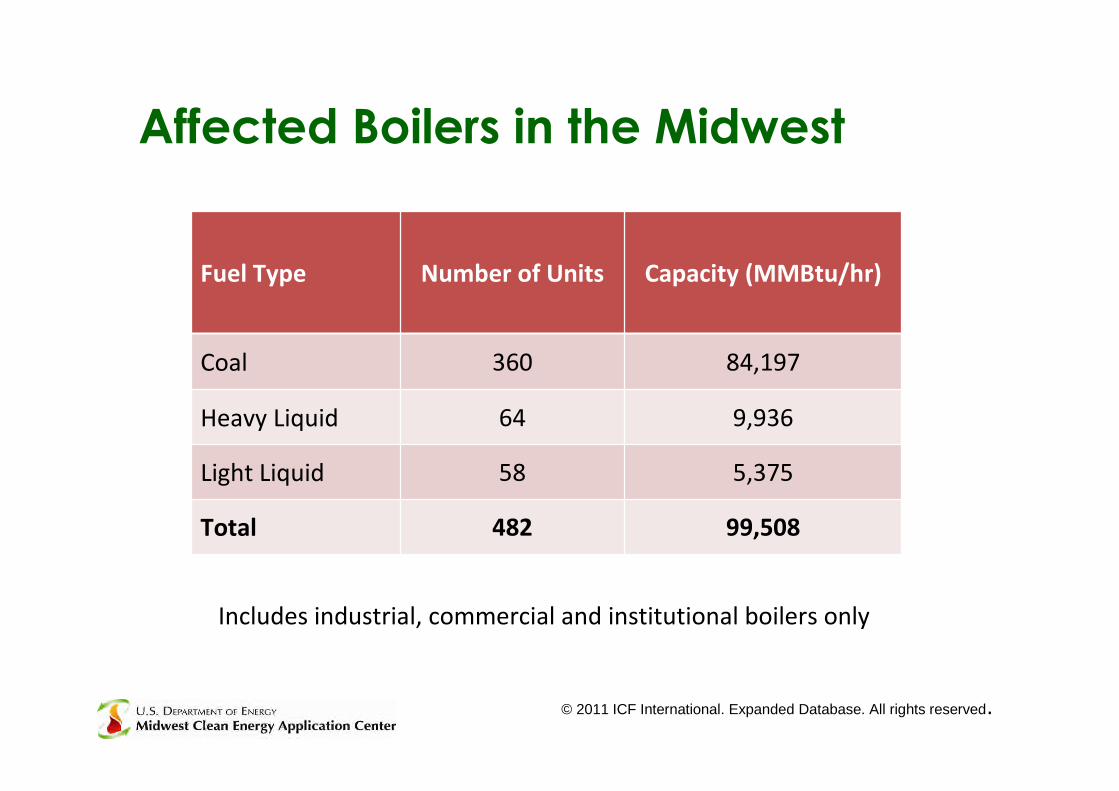
Affected Boilers in the Midwest
Includes industrial, commercial and institutional boilers only
Fuel Type Number of Units Capacity (MMBtu/hr)
Coal 360 84,197
Heavy Liquid 64 9,936
Light Liquid 58 5,375
Total 482 99,508
© 2011 ICF International. Expanded Database. All rights reserved.
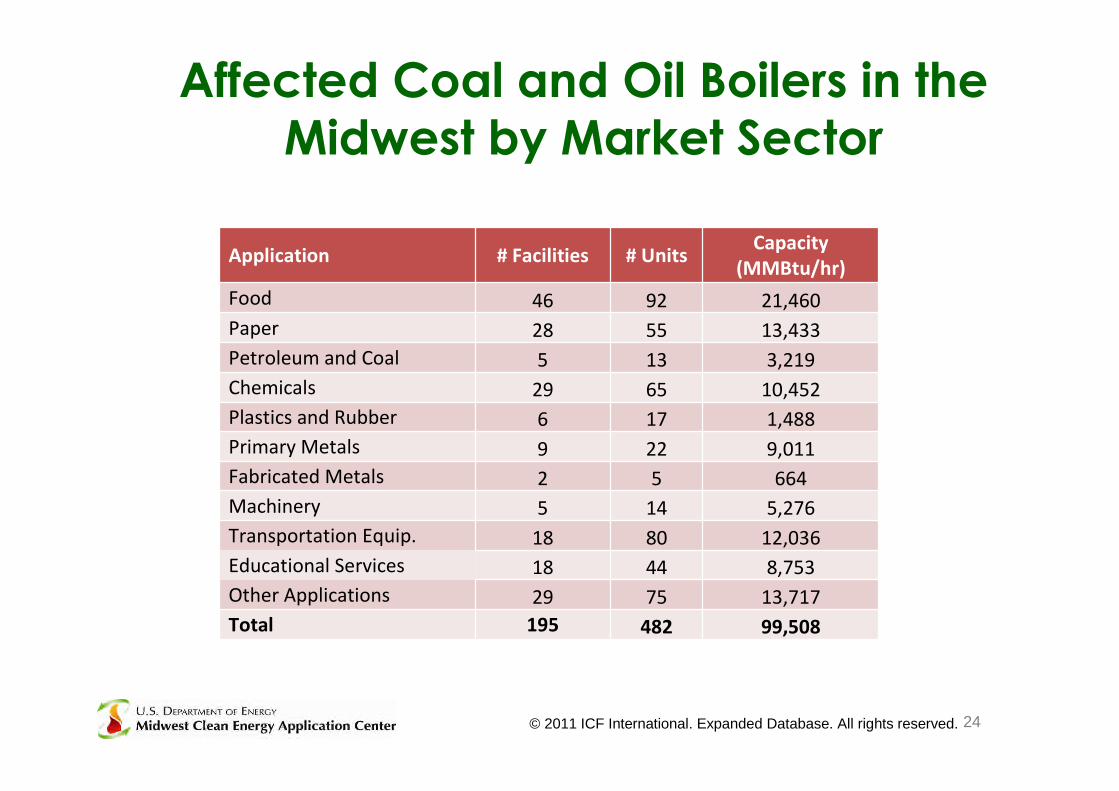
Affected Coal and Oil Boilers in theMidwest by Market Sector
24
Application # Facilities # UnitsCapacity
(MMBtu/hr)
Food 46 92 21,460
Paper 28 55 13,433
Petroleum and Coal 5 13 3,219
Chemicals 29 65 10,452
Plastics and Rubber 6 17 1,488
Primary Metals 9 22 9,011
Fabricated Metals 2 5 664
Machinery 5 14 5,276
Transportation Equip. 18 80 12,036
Educational Services 18 44 8,753
Other Applications 29 75 13,717
Total 195 482 99,508
© 2011 ICF International. Expanded Database. All rights reserved.
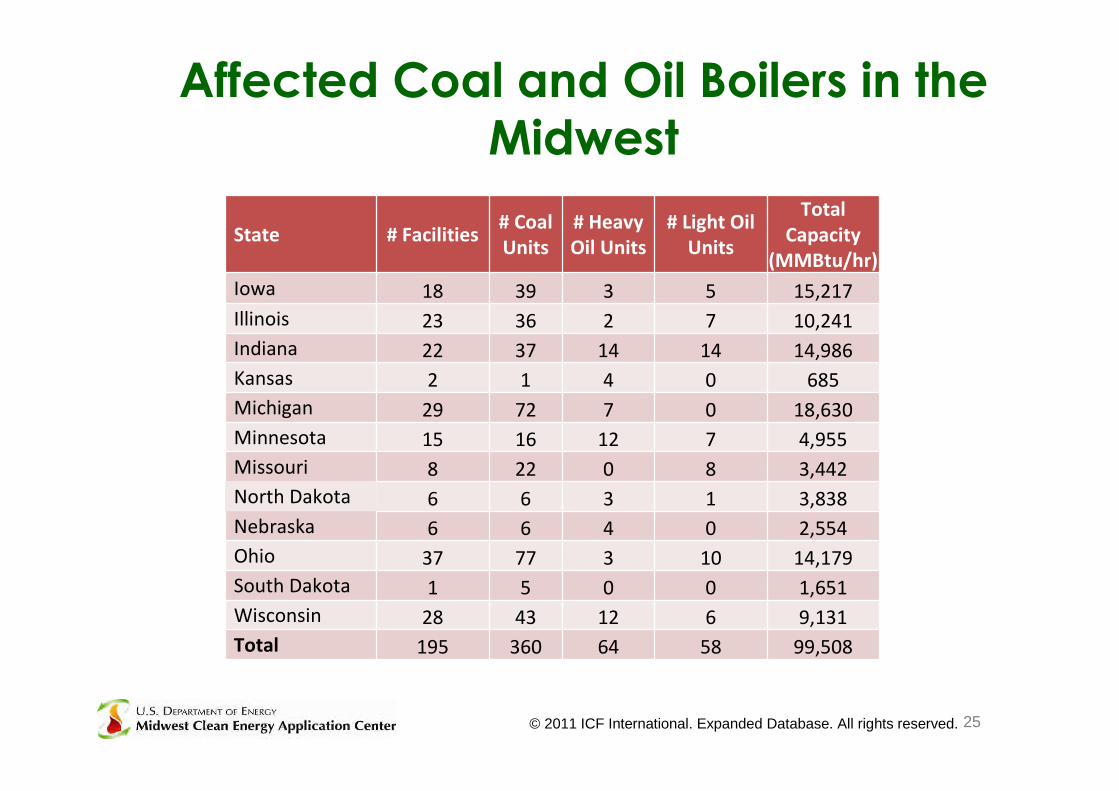
Affected Coal and Oil Boilers in theMidwest
25
State # Facilities# CoalUnits
# HeavyOil Units
# Light OilUnits
TotalCapacity
(MMBtu/hr)
Iowa 18 39 3 5 15,217
Illinois 23 36 2 7 10,241
Indiana 22 37 14 14 14,986
Kansas 2 1 4 0 685
Michigan 29 72 7 0 18,630
Minnesota 15 16 12 7 4,955
Missouri 8 22 0 8 3,442
North Dakota 6 6 3 1 3,838
Nebraska 6 6 4 0 2,554
Ohio 37 77 3 10 14,179
South Dakota 1 5 0 0 1,651
Wisconsin 28 43 12 6 9,131
Total 195 360 64 58 99,508
© 2011 ICF International. Expanded Database. All rights reserved.
The U.S. DOE Midwest CEAC is supplementing its normalCHP services by:
Providing site specific technical and cost information to the195+ major source facilities (~ 480 boilers) in 12 states currentlyburning coal or oil (Decision Tree Analysis)
Meeting with willing individual facility management to discuss“Clean Energy Compliance Strategies” including potentialfunding and financial opportunities.
Assisting interested facilities in the implementation of CHP as acompliance strategy
DOE Boiler MACTTechnical Assistance Program
(Midwest)
o Contact each facility explaining the program and theanalysis being offered (Decision Tree Analysis)
o “Soft Sell” – not attempting to sell a CHP system,rather providing information on an alternativeapproach that you should consider as you develop yourcompliance strategy!
o Verify the specific site assumptions being used in theanalysis
o Conduct the decision tree analysis (simple spreadsheet) comparing strategy options.
Technical Assistance Approach
o Provides comparative cost of compliance options forcoal and/or oil fired boilers:
– Installing control technologies on existing boilers
– Replacing existing boilers with new natural gas boilers
– Converting existing boilers for operation on natural gas
– Replacing existing boiler with a natural gas fueledcombustion turbine CHP system
Decision Tree Analysis
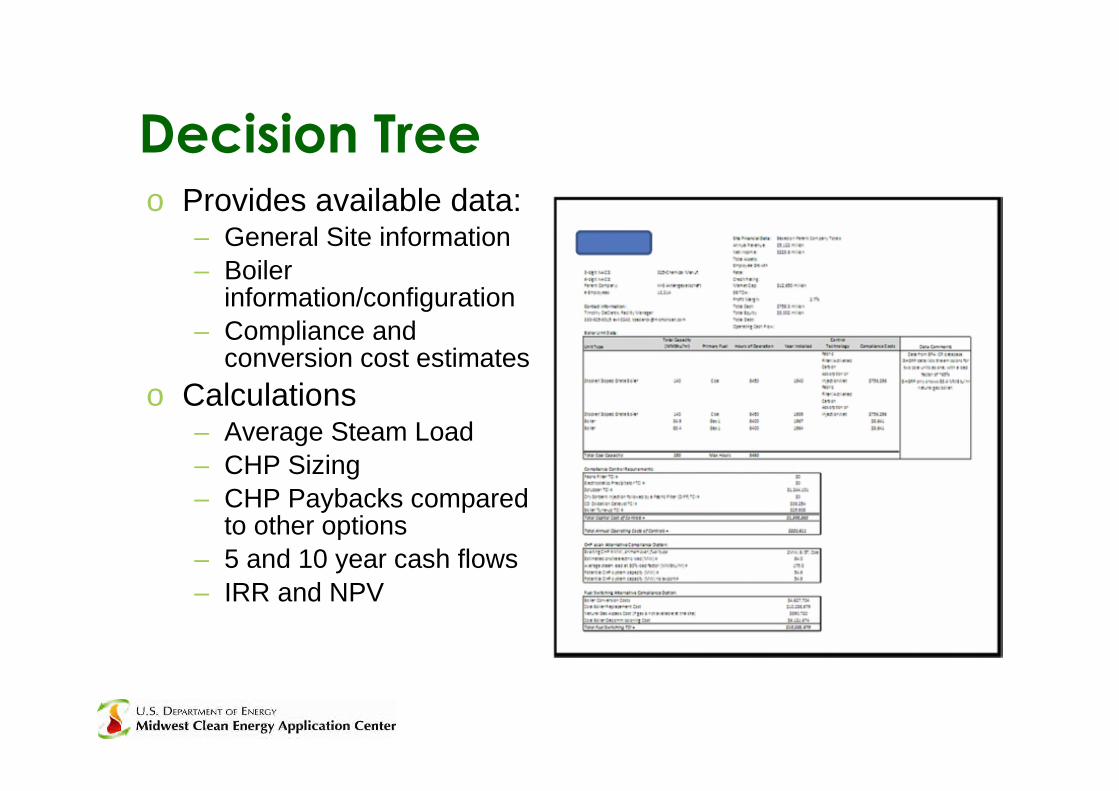
Decision Treeo Provides available data:
– General Site information
– Boilerinformation/configuration
– Compliance andconversion cost estimates
o Calculations– Average Steam Load
– CHP Sizing
– CHP Paybacks comparedto other options
– 5 and 10 year cash flows
– IRR and NPV
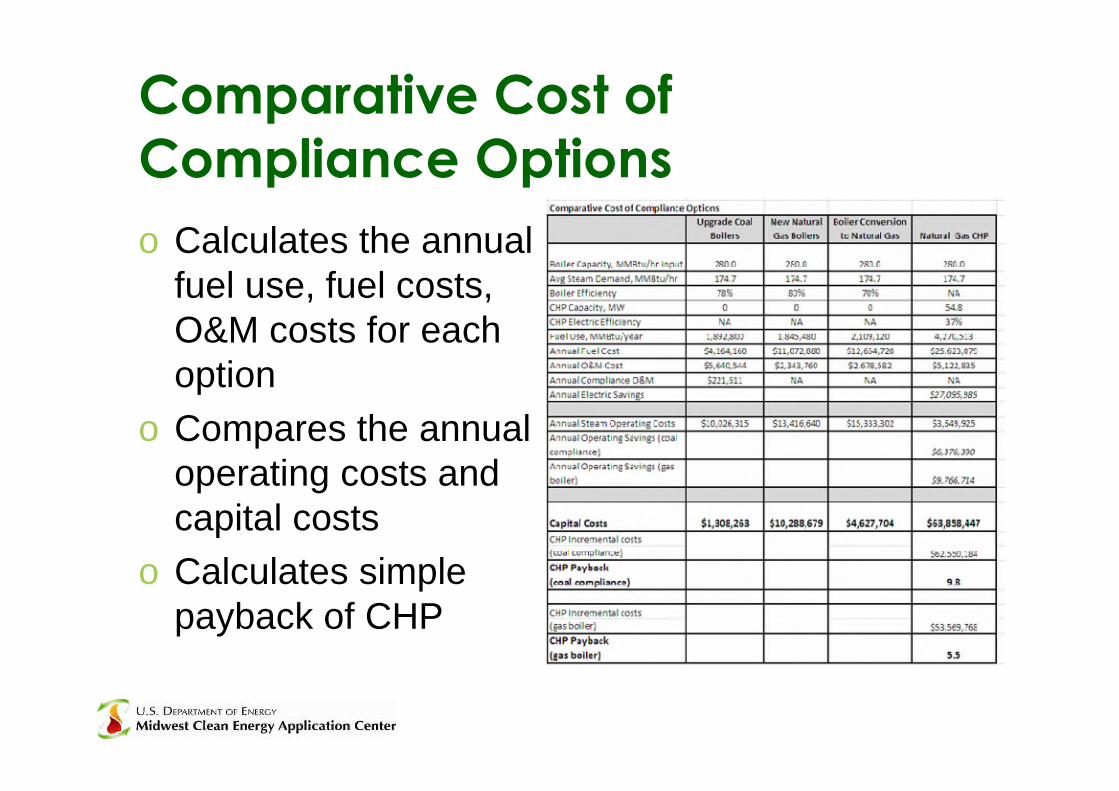
Comparative Cost ofCompliance Options
o Calculates the annualfuel use, fuel costs,O&M costs for eachoption
o Compares the annualoperating costs andcapital costs
o Calculates simplepayback of CHP
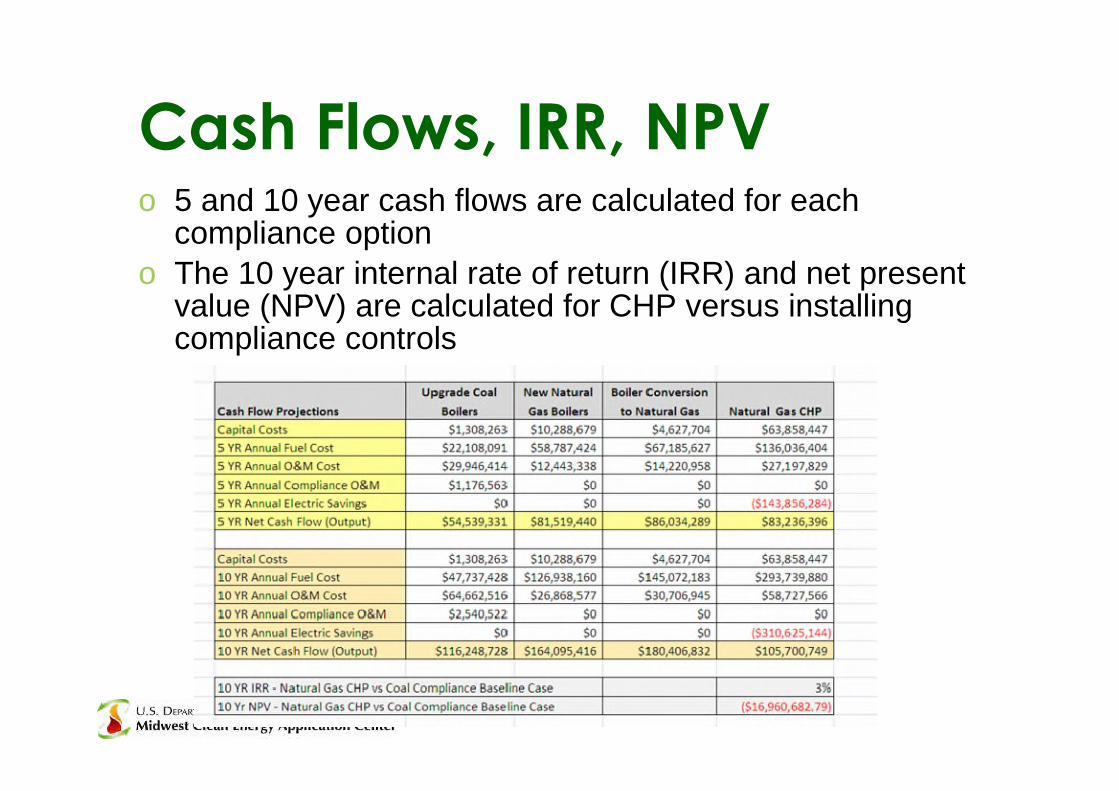
Cash Flows, IRR, NPVo 5 and 10 year cash flows are calculated for each
compliance option
o The 10 year internal rate of return (IRR) and net presentvalue (NPV) are calculated for CHP versus installingcompliance controls
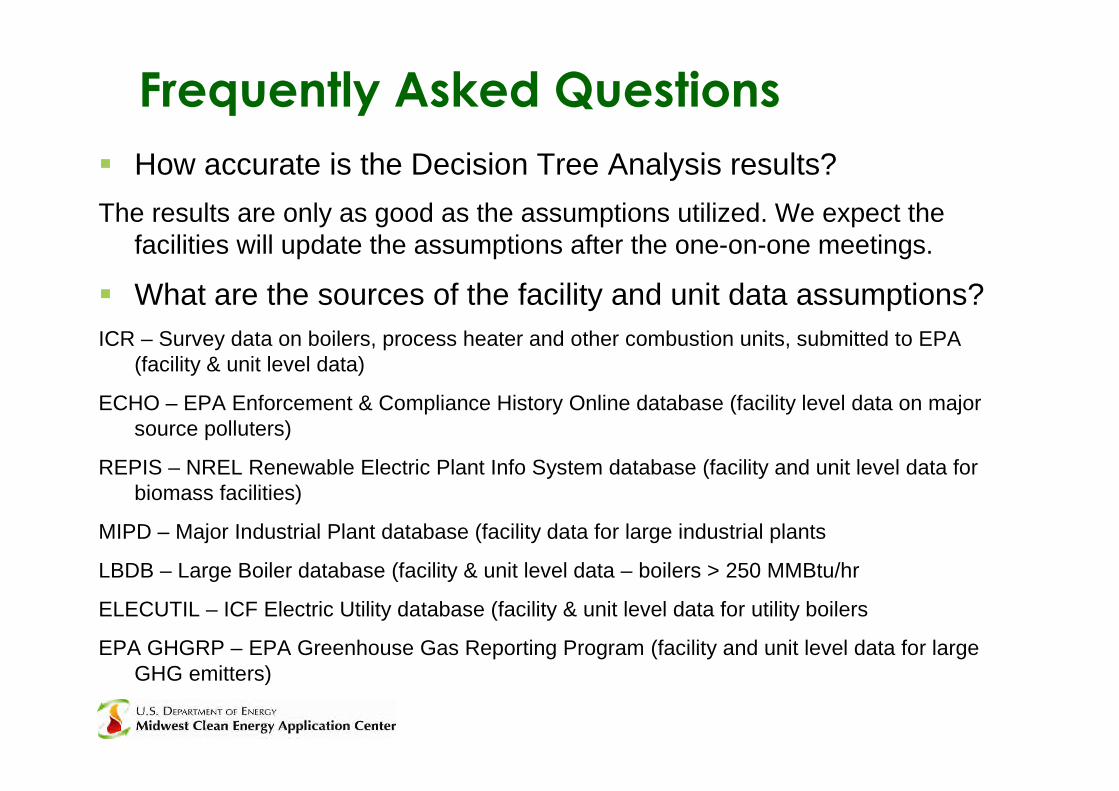
How accurate is the Decision Tree Analysis results?
The results are only as good as the assumptions utilized. We expect thefacilities will update the assumptions after the one-on-one meetings.
What are the sources of the facility and unit data assumptions?
ICR – Survey data on boilers, process heater and other combustion units, submitted to EPA(facility & unit level data)
ECHO – EPA Enforcement & Compliance History Online database (facility level data on majorsource polluters)
REPIS – NREL Renewable Electric Plant Info System database (facility and unit level data forbiomass facilities)
MIPD – Major Industrial Plant database (facility data for large industrial plants
LBDB – Large Boiler database (facility & unit level data – boilers > 250 MMBtu/hr
ELECUTIL – ICF Electric Utility database (facility & unit level data for utility boilers
EPA GHGRP – EPA Greenhouse Gas Reporting Program (facility and unit level data for largeGHG emitters)
Frequently Asked Questions
What is the value of an option that has such a significantly largerfirst cost?
Investment (with payback) versus a cost - higher efficiencies & loweremissions – potential for lower steam costs
As a “rule of thumb,” which boilers are most favorable for a CHPcontrol strategy?
Older coal and oil boilers where installing standard control technologiesis very expensive and/or converting the existing boiler to natural gasis an option.
If the facility wants to further explore CHP, what specific servicescan the CEAC provide?
Assist in scoping the project (level 1 sizing, costs, design options);assist in securing needed engineering, financial and installationsupport
Frequently Asked Questions
o Midwest CEAC will send letters to all affected facilities (coal and oil)explaining the technical assistance program, and follow up withphone calls to establish contacts and obtain permission to continuewith analysis
– If decision tree analysis is favorable, site visits will be made to discussanalysis results. Report will be provided to facility.
o Continue technical assistance as appropriate
o Looking to work with in-state trade associations, utilities and othersto spread the word and verify facility contacts
o Midwest Prioritization:
– Ohio pilot winding down
– Illinois, Iowa, Michigan, Indiana next up (~ 92 sites)
– Minnesota, Wisconsin, Kansas, Missouri, N. Dakota, S. Dakota,Nebraska to follow (~ 66 sites)
Next Steps – Midwest
DOE Headquarters
Katrina PielliSenior Policy Advisor
Office of the Deputy AssistantSecretary for Energy Efficiency
U.S. Department of EnergyWashington DC
http://www1.eere.energy.gov/manufacturing/distributedenergy/ceacs.html
DOE Headquarters
Katrina PielliSenior Policy Advisor
Office of the Deputy AssistantSecretary for Energy Efficiency
U.S. Department of EnergyWashington DC
http://www1.eere.energy.gov/manufacturing/distributedenergy/ceacs.html
DOE & Midwest CEAC Contacts
Midwest CEAC
Co-Directors: John Cuttica;312/996-4382; [email protected]
Cliff Haefke; 312/355-3476;[email protected]
www.midwestcleanenergy.org
States Covered: Illinois, Indiana, Iowa,Kansas, Michigan, Minnesota, Missouri,Nebraska, North Dakota, Ohio, South
Dakota, Wisconsin
Midwest CEAC
Co-Directors: John Cuttica;312/996-4382; [email protected]
Cliff Haefke; 312/355-3476;[email protected]
www.midwestcleanenergy.org
States Covered: Illinois, Indiana, Iowa,Kansas, Michigan, Minnesota, Missouri,Nebraska, North Dakota, Ohio, South
Dakota, Wisconsin