Embed Size (px)
Citation preview
ILASS Americas 26th Annual Conference on Liquid Atomization and Spray Systems, Portland, OR, May 2014
Combined Elastic Light Scattering and Two-Scale Shadowgraphy ofNear-Critical Fuel Jets
S. Baab∗, G. Lamanna, and B. WeigandInstitute of Aerospace Thermodynamics
University of StuttgartPfaffenwaldring 31, 70569 Stuttgart
AbstractN-hexane jets in proximity of the critical point are investigated. Using a double-diaphragm shock tube, thefuel temperature prior to injection as well as the test gas pressure are varied systematically from sub- tosupercritical values (with respect to the fuel properties). Along with laser-illuminated Shadowgraphy, 90◦
Mie imaging is employed simultaneously to detect the presence of liquid phase within the jet. It is shownthat for injection temperatures of 0.96 percent of the critical temperature, a liquid phase is still presenteven for supercritical pressures of 1.15 times the critical value. In combination with microscopic images ofthe jet border, a concentrated liquid phase within the inner dark core (not resolvable by Shadowgraphy) isimplied for the near-nozzle region up to maximum 15 nozzle diameters. The effect of an increasing initial fueltemperature on the disintegration process is shown for injections with far supercritical temperature of 1.18times the critical temperature. The jet now resembles that of an underexpanded gaseous jet with specificshock structures due to a choked outflow condition. A theoretical analysis of the injection process basedon isentropic flow assumption corroborates the experimental findings for sub- and supercritical injectiontemperatures.
∗Corresponding Author: [email protected]
Introduction
The injection of fuel into an environment, whosethermodynamic state is close to or even exceeds thefuels critical values occurs in several applications.Besides modern diesel engines and gas turbines, liq-uid propellant rockets feature such extreme condi-tions in particular. Therefore, it is mandatory tofully understand the characteristic behavior of pre-heated fuel jets injected into high pressure and tem-perature environments for those applications. Espe-cially in terms of numerical simulations the devel-opment of sound physical models for the differentdisintegration processes is required.
In proximity of the thermodynamic criticalpoint (CP), drastic changes of a fluid’s (i.e. fuel’s)thermodynamic and transport properties take place.For a liquid approaching it’s CP, the viscosity de-creases rapidly with a simultaneous rise in isother-mal compressibility and heat capacity. Along withthis, surface tension and heat of vaporization van-ish. As the gradients are generally very large nearCP, small changes in e.g. temperature can causemajor variations in the fluid behavior. Especiallyin terms of near-critical fuel injections this leads tomanifold jet characteristics. Depending on the ex-act injection configuration, the disintegration phe-nomenology reaches from subcritically atomized jetswith possible flash boiling influence (at low ambientpressures) to fully supercritical jet mixing (Lamannaet al. [1]). Here, injection and ambient temperatureand pressure define the particular jet characteristic.A further important parameter affecting the transi-tion from sub- to supercritical behavior is the dis-solving of ambient gas into the (liquid) fuel phaseand the accompanioned dynamic change of criticalproperties depending on local mixture composition.This effect can lead to a significant rise in the criticalpressure for the mixture and, hence, may have im-pact on the jet disintegration behavior (Mayer andSchik [2], Seebald and Sojka [3], Oldenhof et al. [4]).
The present study focuses on the transition pro-cess of a fuel jet from sub- to supercritical behav-ior. Specifically, injections with initially near- butsubcritical injection temperature into either sub- orsupercritical environment are investigated. This isoften also refered to as transcritical injection as CPis passed during the injection process (Seebald andSojka [3]). In particular, these surroundings usuallyexist in high-pressure combustion chambers of liq-uid rocket engines. Highly preheated injections withequal ambient conditions are conducted. This illus-trates the possible crucial difference between sub-and far supercritical temperature injections.
In our recent study [1], we already applied high-
speed shadowgraphy in combination with elasticlight scattering for similar conditions. In this studywe extend the experimental range by microscopicimages of the near-nozzle region and downstreamjet border. Mie imaging is performed with camerasof higher dynamic range. In addition, shadowgraphimages are homogeneously illuminated by diffusedlaser light with very short pulses. Both improve-ments assure a more detailed view on the particularcharacteristics of injected fuel jets.
Test Facility
A specialized double diaphragm shock tube, de-veloped at Institute of Aerospace Thermodynamics(ITLR), is utilized for fuel jet investigations. Here,the highly compressed gas behind the reflected shockwave serves as (inert) ambient, simulating the ther-modynamic state within a combustion chamber. For2 − 5 ms a constant test condition can be main-tained with pressures up to 60 bar and tempera-tures of 2000 K. The single straight-hole injectorwith nozzle diameter D = 0.236 mm and lengthL = 1.0 mm (L/D = 4.2) is flush mounted on theend wall of the shock tube. The fuel can be heatedup to 650 K (∆Taccuracy = 2 − 5 K) by two highperformance tubular cartridges attached to the in-jector body. Due to a common-rail system suppliedby a radial piston pump, high injection pressures ofpf,inj > 1000 bar can be achieved. The lower limitof pf,inj is approx. 180 bar. A more comprehensivedescription of the shock tube facility can be foundin Stotz et al. [5].
Measurement Techniques
In order to capture visual characteristics of afluid flow (i.e. fuel jet or spray), parallel-light directshadowgraphy provides a simple and robust mea-surement technique. It is sensitive to the first spa-tial derivative of a medium’s refractive index and,hence, can be used to visualize densitiy gradients(Settles [6]). However, as it is a line-in-sight in-tegrating optical technique, the capturing of par-ticular features within very dense objects such asthe inner core of an atomized spray is not possibledue to strong path length attenuation (Smallwoodand Gulder [7]). Furthermore, only little informa-tion about the thermodynamic state of the observedmedium (e.g. liquid, gaseous) is provided by thismethod. By combining Shadowgraphy with an ap-propriate light scattering method, this lack of infor-mation can be overcome.
These methods are based on capturing elasti-cally scattered laser light on arbitrary objects. Incase of small particles serving as scatterer with sizessignificantly smaller than the wavelength of inci-
2

dent light, the process is termed Rayleigh scattering.This is true for gaseous media in particular. Liquiddroplets or ligaments, however, are typically muchlarger than the incident wavelength, the scatteringphenomenon is then called Mie scattering. In gen-eral, the intensity of Mie scattered light is of muchhigher magnitude compared to Rayleigh signals scat-tered from gaseous media (Lamanna et al. [1], Adamet al. [8]). Choosing the laser intensity low enoughsuch that Rayleigh scattering is negligible enablesthe detection of liquid phase within a fluid flow as itis applied in many spray investigations (Smallwoodand Gulder [7]). According to Lee and Mtrovic[9],appropriate tomographic Mie imaging, where a thinplanar laser sheet is applied, was found to be bestto resolve internal structures of dense sprays. How-ever, especially the influence of multiple scatteringevents, occuring in dense liquid spray regions, haveto be taken carefully into account for quantitativeanalysis.
Optical Setup
For all jet investigations shown here, shadow-graph and Mie images are taken simultaneously.The entire experimental setup including light signalpaths is illustrated in Figure 1.
Two CMOS cameras from LaVision are usedwith 2560 x 2160 pixels and 6.5 µm size, resultingin a sensor chip size of 16.6x14 mm2. The high dy-namic range of 16 bit allows to distinguish a widesignal intensity range, advantageous for Mie imagesin particular. To aquire simultaneous images withdifferent spatial resolutions, two different objectivelenses are mounted to the CMOS cameras. The highresolution images are taken with a long distance mi-croscope (LDM) Questar QM-100 with working dis-tance between 150 mm and 350 mm. In context ofthis paper, the working distance of the LDM is fixedto 250 mm. With the use of a barlow lens mountedbetween camera and LDM, the spatial resolution canbe further increased. For the presented experiments,a barlow lens with 1.5 magnification factor is usedfor near-nozzle microscopic images. Shadowgraphimages taken further downstream (i.e. x/D = 15 &x/D = 60) are magnified with a 2.0 barlow lens.
The second CMOS camera is equipped with aSILL TZM 1365/1.0 telecentric measuring lens formacroscopic imaging. The optical properties for thespecific lens configurations are summarized in Table1.
Both Shadowgraphy and Mie measurements aresupplied by one single-pulsed, frequency-doubled,Nd:YAG Laser Continuum Powerlite 8010 (λ =532 nm, maximum energy 800 mJ, pulse duration
Nd:YAG90%
10%
Solid State Diffuser
Beam
Dump
Energy Head
60%
40%
30%
70%
Upper Layer
Lower Layer
Laser Sheet
InputShadowgraph
Illumination
Mie SignalShadowgraph
Signal
Shock Tube
Injector
Beam Splitter Cube
CMOSCMOS
Long Distance
Microscope (LDM)Macro Lens
Mirror
&
FilterFilter
Quartz Window
Quartz Window
Op
tica
l F
iber
look at
sideview for
details
Optical Fiber
Fresnel Lens
Shadowgraph
Illumination
Shock Tube
Jet
Jet Mie &
Shadowgraph
Signal
Upper Layer
Lower Layer
Mirror
Window
Win
dow
Win
dow
Lens ArrangementLaser Sheet
Figure 1: Experimental setup.
7 ns). For shadowgraph illumination, about 90 per-cent of the incident laser intensity is led into a solid-state fluorescence diffuser system by LaVision via90/10 (Transmission/Reflection) broad-band beamsplitter. Within the diffuser body, a red-shifted lightsignal output is generated with a wavelength rangebetween 574 nm - 580 nm and a peak duration of20 ns (@ 5 ns excitation pulse). Especially for shad-owgraphic microscopy investigations of high-velocityjets, this short illumination duration is strongly re-quired to minimize motion blur effects. For the firstconfiguration shown in Table 1, the maximum ve-locity of an object within the object plane resultingin a shift less than 1 pixel is 197 m s−1 (@ 20 ns il-lumination), for the second configuration it can be
3
Lens Image Size Res. Magn.[mm x mm] [µm/Pixel] [1]
Sill TZM 1365 10.06 x 8.49 3.93 1.65QM-100/1.5x 1.84 x 1.55 0.72 9.03QM-100/2.0x 1.24 x 1.04 0.48 13.42
Table 1: Image size (object plane), image resolutionand magnification factor for each objective lens.
estimated with 36 m s−1. The exiting light from thediffuser body is guided via optical fiber into the enddiffuser with fresnel lens and is introduced into thetest chamber of the shock tube. Compared to thehigh diffuser input intensity, Mie imaging requiresonly a small fraction of laser intensity. Since thesignals scattered from a potential liquid phase aretypically very strong, the camera chip can easily sat-urate at too high illumination intensities. Hence, theseparated laser beam from the first beam splitter isfurther attenuated by two additional beam splitters.To account for the inevitable shot-to-shot variabil-ity of laser intensity, an energy measurement headcaptures the reflected beam of the last splitter. Themean laser intensity for the Mie experiments pre-sented here is calculated to 17.29 mJ with a standarddeviation of 0.86 mJ. The beam is first expanded bya plano-concave cylindrical lense with focal lengthf = 300 mm and focused with a biconvex cylindricallense (f = 500 mm). A mirror deflects the resultinglaser sheet in 90◦ direction into the test chamber.The focal point coincides with the nozzle center axis.
Both CMOS cameras are arranged perpendicu-lar to the jet axis, for Mie measurements a 90◦ anglebetween incident light sheet and camera is main-tained. A 2-inch beam splitter cube (50/50) sepa-rates the signals from both Shadowgraphy and Miescattering into 0◦ and 90◦ direction. The CMOSequipped with the LDM captures the 0◦ signal, thereflected part of light is further deflected by a mirrorinto the camera with macroscopic lens.
By applying a notch filter for λ = 532 nm, elas-tically scattered laser light is filtered for Shadowgra-phy. Accordingly, a bandpass filter for λ = 532 nmprovides a clean Mie signal capturing. Both filtersare applied alternating for the two objective lenses,which leads to either macroscopic Mie and micro-scopic shadowgraph or mircoscopic Mie and macro-scopic shadowgraph images.
Experimental Conditions & TheoreticalAnalysis
N-hexane injections into a pure quiescent argonenvironment are investigated. The critical tempera-
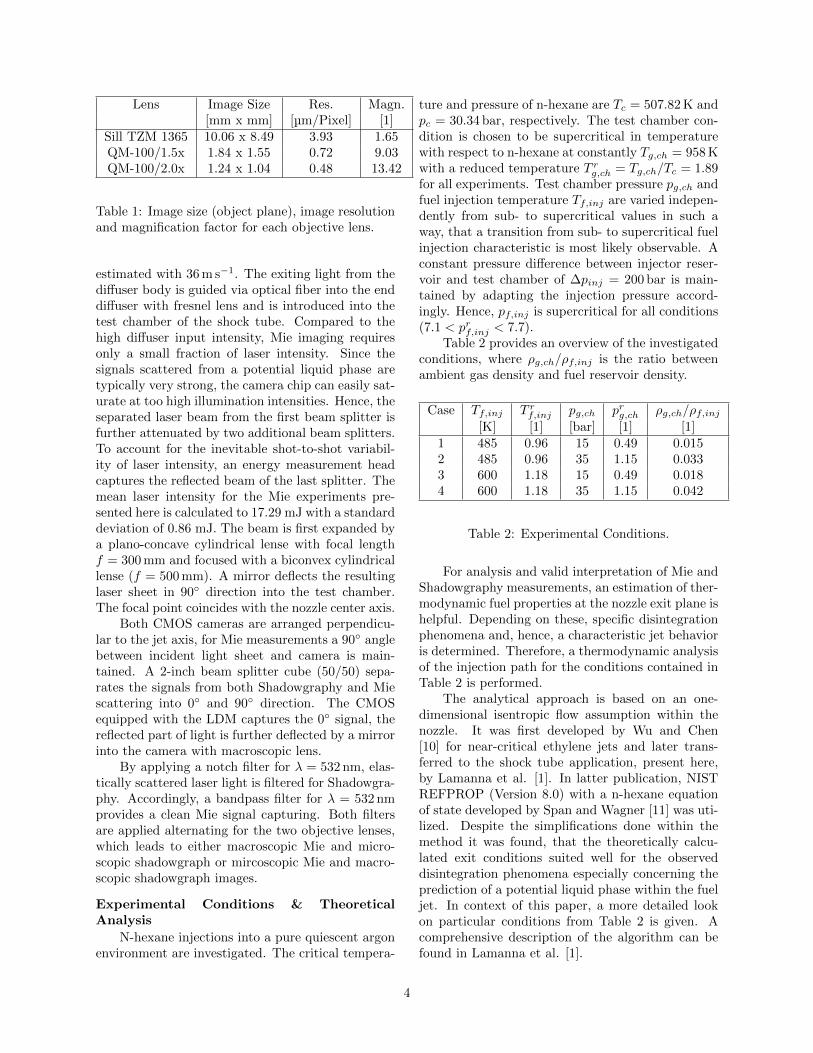
ture and pressure of n-hexane are Tc = 507.82 K andpc = 30.34 bar, respectively. The test chamber con-dition is chosen to be supercritical in temperaturewith respect to n-hexane at constantly Tg,ch = 958 Kwith a reduced temperature T r
g,ch = Tg,ch/Tc = 1.89for all experiments. Test chamber pressure pg,ch andfuel injection temperature Tf,inj are varied indepen-dently from sub- to supercritical values in such away, that a transition from sub- to supercritical fuelinjection characteristic is most likely observable. Aconstant pressure difference between injector reser-voir and test chamber of ∆pinj = 200 bar is main-tained by adapting the injection pressure accord-ingly. Hence, pf,inj is supercritical for all conditions(7.1 < prf,inj < 7.7).
Table 2 provides an overview of the investigatedconditions, where ρg,ch/ρf,inj is the ratio betweenambient gas density and fuel reservoir density.
Case Tf,inj T rf,inj pg,ch prg,ch ρg,ch/ρf,inj
[K] [1] [bar] [1] [1]1 485 0.96 15 0.49 0.0152 485 0.96 35 1.15 0.0333 600 1.18 15 0.49 0.0184 600 1.18 35 1.15 0.042
Table 2: Experimental Conditions.
For analysis and valid interpretation of Mie andShadowgraphy measurements, an estimation of ther-modynamic fuel properties at the nozzle exit plane ishelpful. Depending on these, specific disintegrationphenomena and, hence, a characteristic jet behavioris determined. Therefore, a thermodynamic analysisof the injection path for the conditions contained inTable 2 is performed.
The analytical approach is based on an one-dimensional isentropic flow assumption within thenozzle. It was first developed by Wu and Chen[10] for near-critical ethylene jets and later trans-ferred to the shock tube application, present here,by Lamanna et al. [1]. In latter publication, NISTREFPROP (Version 8.0) with a n-hexane equationof state developed by Span and Wagner [11] was uti-lized. Despite the simplifications done within themethod it was found, that the theoretically calcu-lated exit conditions suited well for the observeddisintegration phenomena especially concerning theprediction of a potential liquid phase within the fueljet. In context of this paper, a more detailed lookon particular conditions from Table 2 is given. Acomprehensive description of the algorithm can befound in Lamanna et al. [1].
4
0,0 0,5 1 1,5 2 2,51,0
10
100
p = 15 bar
p = 35 bar
T = 600 K
T = 485 K
Liquid / Vapor
Liquid
Vapor
Supercritical
Fluid
Tf,in
j = 4
85
K
Tf,in
j = 6
00
K
Critical Point
s [kJ/(kg K)]
p [
ba
r]
Calculated Isentropic Choking Points (pam=20 bar)
Injector Reservoir Conditions
Transition to Two-phase Region
Calculated Isentropic Choking Points (pam=15 bar)
Injector Reservoir Conditions
Transition to Two-phase Region
Tc = 507.82 K
Figure 2: Pressure vs. specific entropy plot for n-hexane.
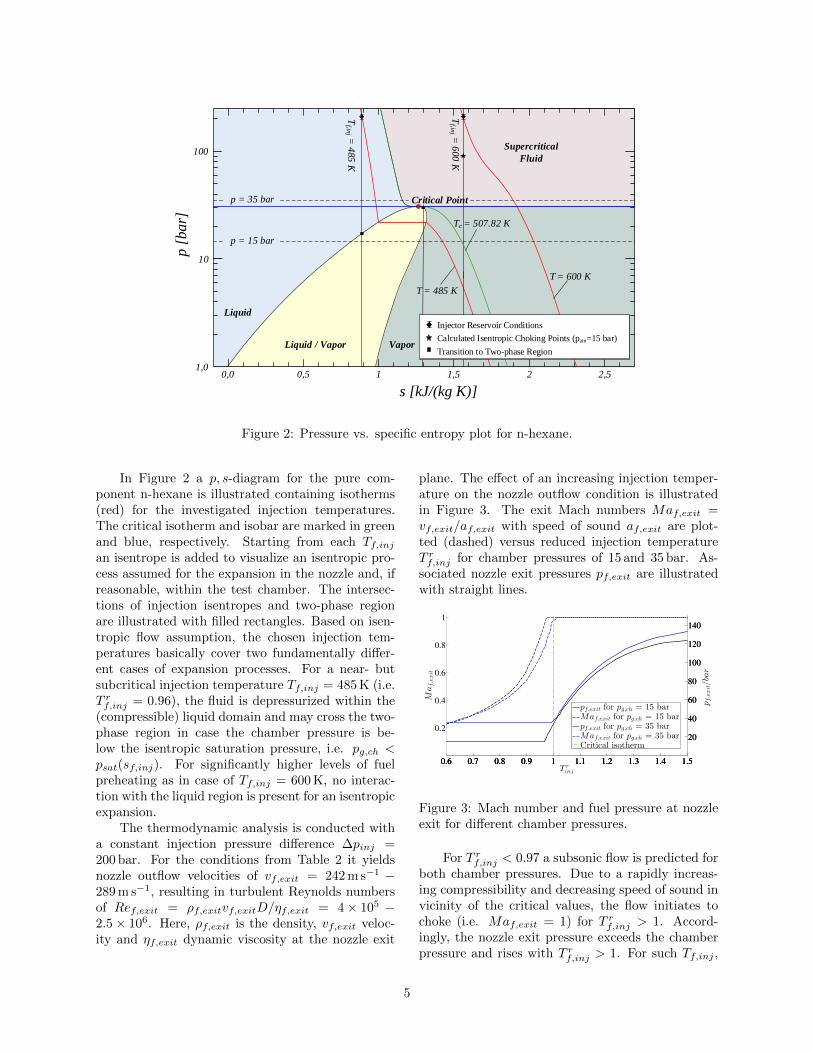
In Figure 2 a p, s-diagram for the pure com-ponent n-hexane is illustrated containing isotherms(red) for the investigated injection temperatures.The critical isotherm and isobar are marked in greenand blue, respectively. Starting from each Tf,injan isentrope is added to visualize an isentropic pro-cess assumed for the expansion in the nozzle and, ifreasonable, within the test chamber. The intersec-tions of injection isentropes and two-phase regionare illustrated with filled rectangles. Based on isen-tropic flow assumption, the chosen injection tem-peratures basically cover two fundamentally differ-ent cases of expansion processes. For a near- butsubcritical injection temperature Tf,inj = 485 K (i.e.T rf,inj = 0.96), the fluid is depressurized within the
(compressible) liquid domain and may cross the two-phase region in case the chamber pressure is be-low the isentropic saturation pressure, i.e. pg,ch <psat(sf,inj). For significantly higher levels of fuelpreheating as in case of Tf,inj = 600 K, no interac-tion with the liquid region is present for an isentropicexpansion.
The thermodynamic analysis is conducted witha constant injection pressure difference ∆pinj =200 bar. For the conditions from Table 2 it yieldsnozzle outflow velocities of vf,exit = 242 m s−1 −289 m s−1, resulting in turbulent Reynolds numbersof Ref,exit = ρf,exitvf,exitD/ηf,exit = 4 × 10⁵ −2.5 × 10⁶. Here, ρf,exit is the density, vf,exit veloc-ity and ηf,exit dynamic viscosity at the nozzle exit
plane. The effect of an increasing injection temper-ature on the nozzle outflow condition is illustratedin Figure 3. The exit Mach numbers Maf,exit =vf,exit/af,exit with speed of sound af,exit are plot-ted (dashed) versus reduced injection temperatureT rf,inj for chamber pressures of 15 and 35 bar. As-
sociated nozzle exit pressures pf,exit are illustratedwith straight lines.
0.6 0.7 0.8 0.9 1 1.1 1.2 1.3 1.4 1.5
0.2
0.4
0.6
0.8
1
T rinj
Maf,exit
0.6 0.7 0.8 0.9 1 1.1 1.2 1.3 1.4 1.5
20
40
60
80
100
120
140
pf,exit/bar
0.6 0.7 0.8 0.9 1 1.1 1.2 1.3 1.4 1.5
20
40
60
80
100
120
140
pf,exit for pg,ch = 15 bar
Maf,exit for pg,ch = 15 bar
pf,exit for pg,ch = 35 bar
Maf,exit for pg,ch = 35 bar
Critical isotherm
Figure 3: Mach number and fuel pressure at nozzleexit for different chamber pressures.
For T rf,inj < 0.97 a subsonic flow is predicted for
both chamber pressures. Due to a rapidly increas-ing compressibility and decreasing speed of sound invicinity of the critical values, the flow initiates tochoke (i.e. Maf,exit = 1) for T r
f,inj > 1. Accord-ingly, the nozzle exit pressure exceeds the chamberpressure and rises with T r
f,inj > 1. For such Tf,inj ,
5
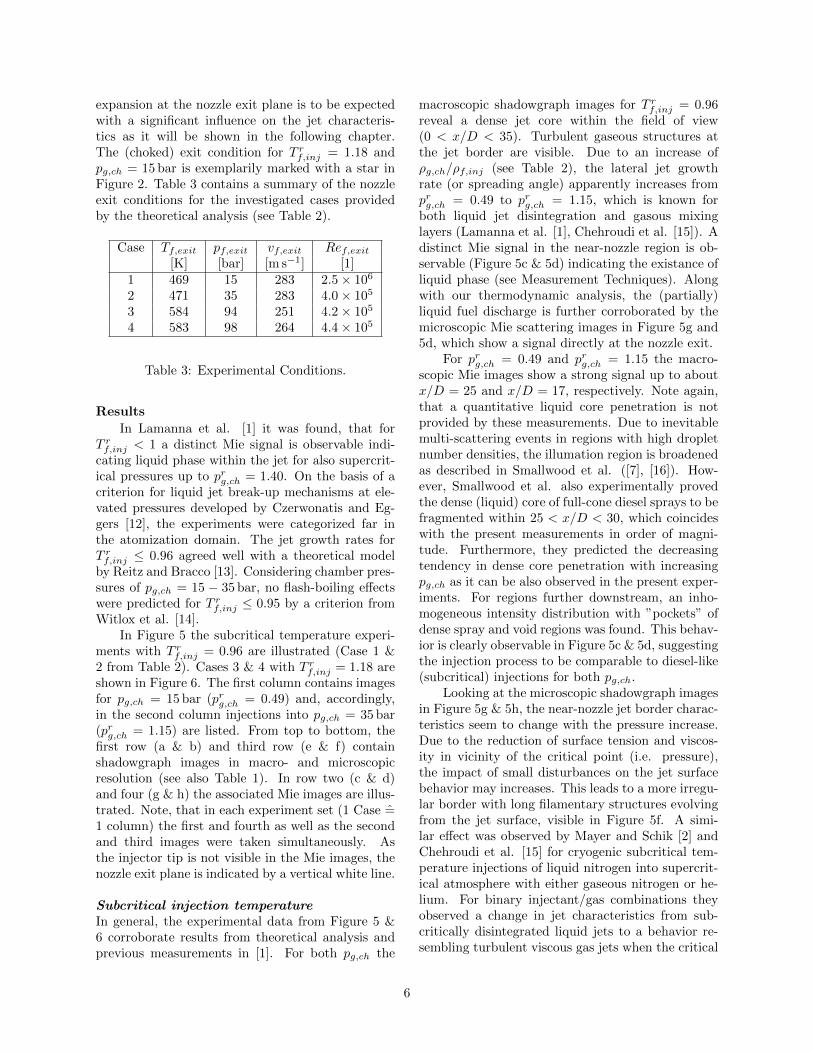
expansion at the nozzle exit plane is to be expectedwith a significant influence on the jet characteris-tics as it will be shown in the following chapter.The (choked) exit condition for T r
f,inj = 1.18 andpg,ch = 15 bar is exemplarily marked with a star inFigure 2. Table 3 contains a summary of the nozzleexit conditions for the investigated cases providedby the theoretical analysis (see Table 2).
Case Tf,exit pf,exit vf,exit Ref,exit[K] [bar] [m s−1] [1]
1 469 15 283 2.5 × 10⁶
2 471 35 283 4.0 × 10⁵
3 584 94 251 4.2 × 10⁵
4 583 98 264 4.4 × 10⁵
Table 3: Experimental Conditions.
Results
In Lamanna et al. [1] it was found, that forT rf,inj < 1 a distinct Mie signal is observable indi-
cating liquid phase within the jet for also supercrit-ical pressures up to prg,ch = 1.40. On the basis of acriterion for liquid jet break-up mechanisms at ele-vated pressures developed by Czerwonatis and Eg-gers [12], the experiments were categorized far inthe atomization domain. The jet growth rates forT rf,inj ≤ 0.96 agreed well with a theoretical model
by Reitz and Bracco [13]. Considering chamber pres-sures of pg,ch = 15 − 35 bar, no flash-boiling effectswere predicted for T r
f,inj ≤ 0.95 by a criterion fromWitlox et al. [14].
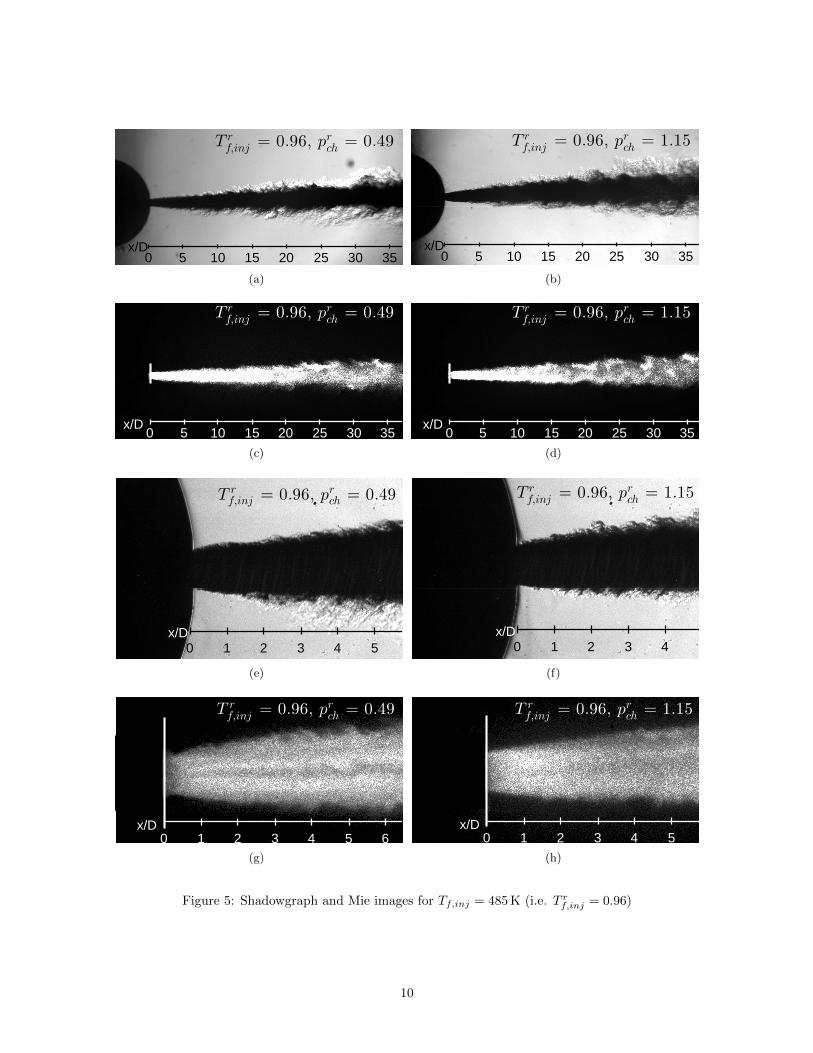
In Figure 5 the subcritical temperature experi-ments with T r
f,inj = 0.96 are illustrated (Case 1 &2 from Table 2). Cases 3 & 4 with T r
f,inj = 1.18 areshown in Figure 6. The first column contains imagesfor pg,ch = 15 bar (prg,ch = 0.49) and, accordingly,in the second column injections into pg,ch = 35 bar(prg,ch = 1.15) are listed. From top to bottom, thefirst row (a & b) and third row (e & f) containshadowgraph images in macro- and microscopicresolution (see also Table 1). In row two (c & d)and four (g & h) the associated Mie images are illus-trated. Note, that in each experiment set (1 Case =1 column) the first and fourth as well as the secondand third images were taken simultaneously. Asthe injector tip is not visible in the Mie images, thenozzle exit plane is indicated by a vertical white line.
Subcritical injection temperatureIn general, the experimental data from Figure 5 &6 corroborate results from theoretical analysis andprevious measurements in [1]. For both pg,ch the
macroscopic shadowgraph images for T rf,inj = 0.96
reveal a dense jet core within the field of view(0 < x/D < 35). Turbulent gaseous structures atthe jet border are visible. Due to an increase ofρg,ch/ρf,inj (see Table 2), the lateral jet growthrate (or spreading angle) apparently increases fromprg,ch = 0.49 to prg,ch = 1.15, which is known forboth liquid jet disintegration and gasous mixinglayers (Lamanna et al. [1], Chehroudi et al. [15]). Adistinct Mie signal in the near-nozzle region is ob-servable (Figure 5c & 5d) indicating the existance ofliquid phase (see Measurement Techniques). Alongwith our thermodynamic analysis, the (partially)liquid fuel discharge is further corroborated by themicroscopic Mie scattering images in Figure 5g and5d, which show a signal directly at the nozzle exit.
For prg,ch = 0.49 and prg,ch = 1.15 the macro-scopic Mie images show a strong signal up to aboutx/D = 25 and x/D = 17, respectively. Note again,that a quantitative liquid core penetration is notprovided by these measurements. Due to inevitablemulti-scattering events in regions with high dropletnumber densities, the illumation region is broadenedas described in Smallwood et al. ([7], [16]). How-ever, Smallwood et al. also experimentally provedthe dense (liquid) core of full-cone diesel sprays to befragmented within 25 < x/D < 30, which coincideswith the present measurements in order of magni-tude. Furthermore, they predicted the decreasingtendency in dense core penetration with increasingpg,ch as it can be also observed in the present exper-iments. For regions further downstream, an inho-mogeneous intensity distribution with ”pockets” ofdense spray and void regions was found. This behav-ior is clearly observable in Figure 5c & 5d, suggestingthe injection process to be comparable to diesel-like(subcritical) injections for both pg,ch.
Looking at the microscopic shadowgraph imagesin Figure 5g & 5h, the near-nozzle jet border charac-teristics seem to change with the pressure increase.Due to the reduction of surface tension and viscos-ity in vicinity of the critical point (i.e. pressure),the impact of small disturbances on the jet surfacebehavior may increases. This leads to a more irregu-lar border with long filamentary structures evolvingfrom the jet surface, visible in Figure 5f. A simi-lar effect was observed by Mayer and Schik [2] andChehroudi et al. [15] for cryogenic subcritical tem-perature injections of liquid nitrogen into supercrit-ical atmosphere with either gaseous nitrogen or he-lium. For binary injectant/gas combinations theyobserved a change in jet characteristics from sub-critically disintegrated liquid jets to a behavior re-sembling turbulent viscous gas jets when the critical
6

pressure is significantly exceeded. Clearly, due to theexistance of liquid phase within the jets, this transi-tion is not achieved within the near-nozzle region inFigure 5 indicating subcritical fuel jets.
A consequental question that arises from the ex-periments shown in Figure 5 is the origin of observedMie signal (i.e. scattered laser light). Directly con-nected to this is the location of droplets or liquidcore within the jet. Therefore, microscopic imagesof the jet boundary are taken at x/D = 15 & 60 forT rf,inj = 0.96 and pg,ch = 0.49 & 1.15 in order to
detect liquid droplets or ligaments. The results areillustrated in Figure 4. In the first row the jet surfacefor T r
f,inj = 0.96 and prg,ch = 0.49 is depicted, wherethe second row contains images for prg,ch = 1.15.
In general, no signs of liquid phase can be ob-served in Figure 4a - 4d. At x/D = 15 in fact, forboth pressures a dense core is apparent with gaseousfluid structures surrounding it at the outer region(Figure 4a & 4c). For prg,ch = 1.15, the dense core isshaped slightly more irregular with a broader bandof gaseous medium around it. Further downstreamat x/D = 60, the dense core is already dissolved intoan inhomogeneous flow structure with dense and dil-luted regions. This characteristic is more distinctfor prg,ch = 1.15. Note, that these particular featuresare not representative for the whole duration of in-jection due to the unsteady flow behavior. However,the described tendency was observed in multiple in-depentent experiments.
As reference for the presented injections intohot ambient gas (see Experimental Conditions), thespray border for a cold environment (Tg,ch = 293 K)with T r
f,inj = 0.96 and pg,ch = 0.49 at x/D =15 & 60 is illustrated (Figure 4e & 4f). Note,that for these images the spatial resolution is low(0.98µm/Pixel) in comparison to the hot gas cases@ 0.48µm/Pixel. Nevertheless, clouds of dropletscan be identified for both axial distances. A Parti-cle Tracking analysis provided a diameter of around10 µm for the smallest clearly visible droplets.
Considering this fact in combination with thepresent Mie signal from Figure 5c & 5d, the scat-tered light at x/D ≤ 15 must origin from dropletsmuch smaller than 10 µm or a concentrated liquidphase within the inner jet. Due to the high Tg,ch,it is rather unlikely that a droplet of such small sizepersists in the border up to this axial distance. Espe-cially the reduction of vaporization heat approach-ing the critical point leads to fast evaporation rates,which could also explain the more distinct gaseous(i.e supercritical) phase for prg,ch = 1.15. Consider-ing all these facts, the assumption of a liquid phaseat the inner jet surrounded by evaporated fuel seems
x/D15 16 17 18 19 20
T rf,inj
= 0.96, prch
= 0.49
(a)
x/D60 61 62 63 64 65
(b)
x/D15 16 17 18 19 20
T rf,inj = 0.96, prch = 1.15
(c)
x/D60 61 62 63 64 65
(d)
x/D15 16 17 18 19 20 21 22 23 24 25
T rf,inj
= 0.96, prch
= 1.15
(e)
x/D60 61 62 63 64 65 66 67 68 69 70
T rf,inj
= 0.96, prch
= 1.15
(f)
Figure 4: Microscopic images with T rf,inj = 0.96 for
(a) prg,ch = 0.49, x/D = 15; (b) prg,ch = 0.49, x/D =60; (c) prg,ch = 1.15, x/D = 15; (d) prg,ch = 1.15,x/D = 60; (e) Cold case for prg,ch = 0.49, x/D = 15;Cold case for prg,ch = 0.49, x/D = 60 )
valid for x/D ≤ 15 and up to supercritical pressuresof prg,ch = 1.15.
The macroscopic Mie images in Figure 5c &5d only cover distances up to around x/D = 35.However, when extrapolating the signal decay forx/D ≥ 60, almost no scattered light might appearin this region. This indicates the non-existance ofliquid phase beyond this distance and the transitioninto a gaseous or in case of prg,ch = 1.15 possiblysupercritical state.
Supercritical injection temperatureBesides the magnitude of pg,ch, a strong impact onthe transition to a supercritical injection mode canbe attributed to the initial injection temperature
7
Tf,inj . Especially in proximity of Tc, small varia-tions in Tf,inj can result in an altering disintegrationbehavior (i.e. regime) as described in Wu et al.[10][17], Doungthip et al. [18] and Lamanna et al.[1].
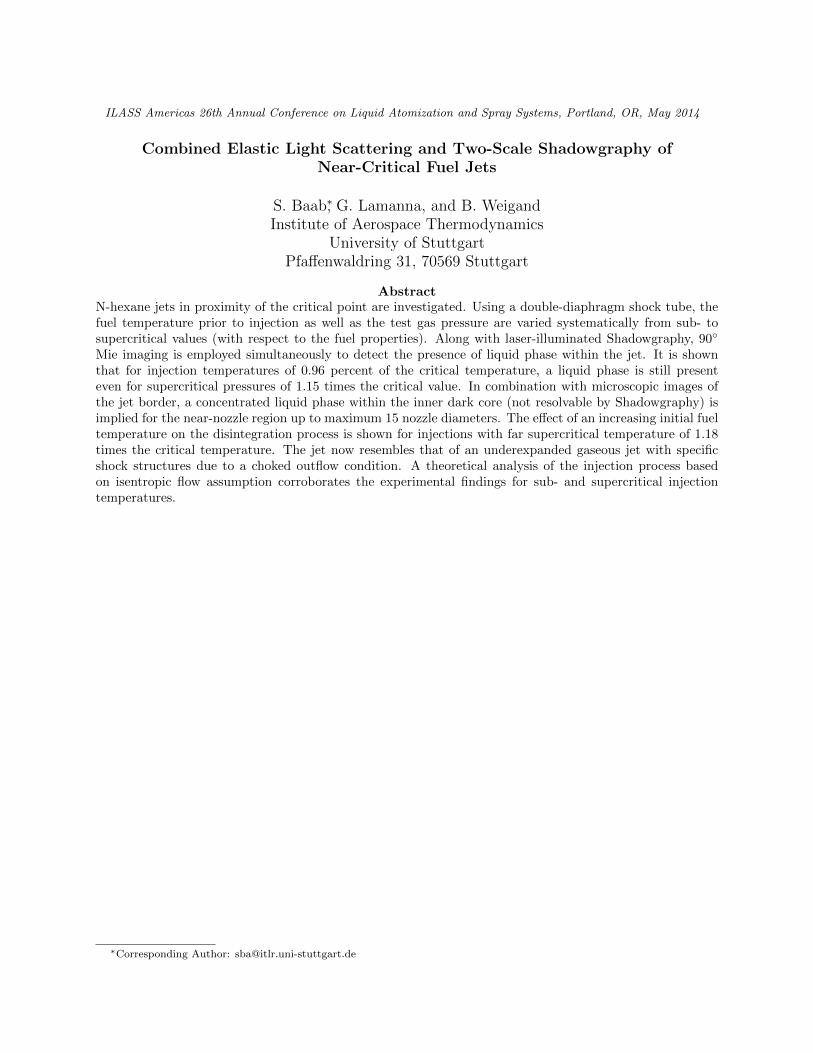
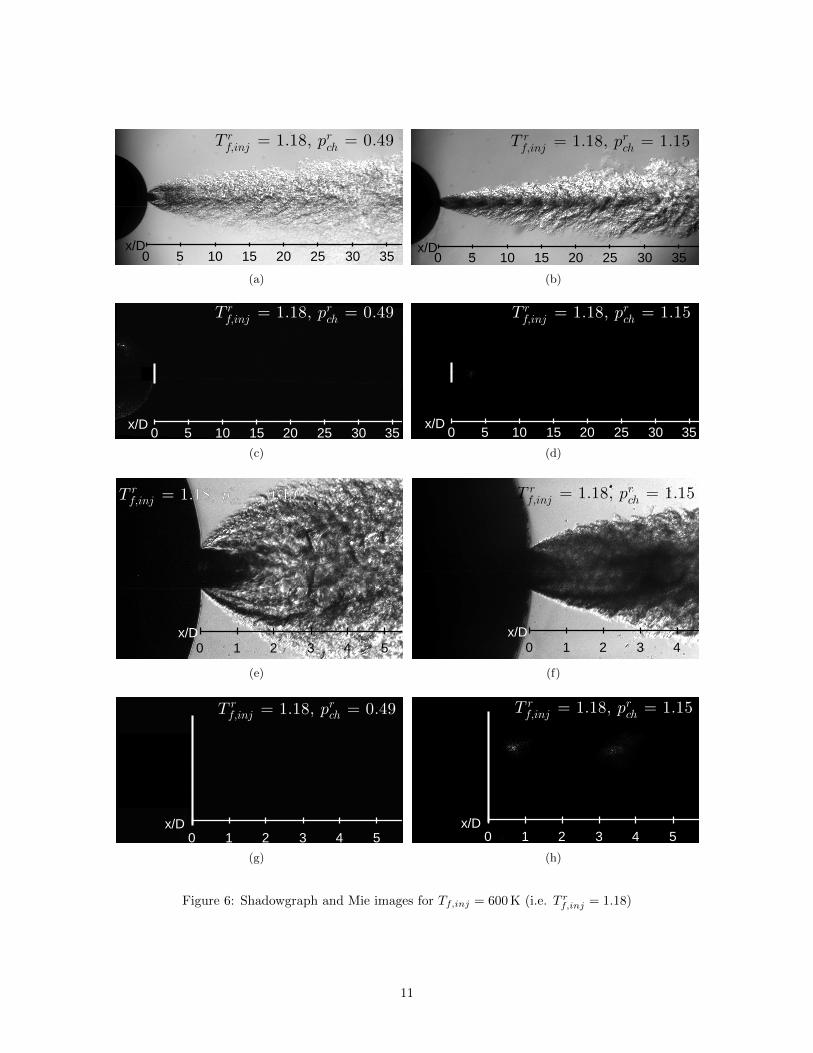
As an exemplaric condition for supercritical out-flow, injections with T r
f,inj = 1.18 are illustrated inFigure 6. For these conditions (Case 3 & 4 fromTable 2), our thermodynamic analysis predicts anentirely supercritical fluid at the nozzle exit withno expansion into the two-phase region (isentropicflow assumed). As an experimental evidence of thisassumption, the Mie images in Figure 6 can be con-sulted. Here, no scattered light is observable imply-ing that no liquid phase as scatterer is present. Thisobservation also corroborates the at least partiallysubcritical behavior for T r
f,inj = 0.96 & prg,ch = 1.15,since a distinct Mie signal is detected for this condi-tion (Figure 5d).
As can be derived from Figure 3 and Table 3, theanalysis also predicts the achievement of the criticalpressure ratio and, therefore, a choked outflow con-dition. As the exit pressure then exceeds the cham-ber pressure, the flow expands from the nozzle exit.Looking at the shadowgraph images in Figure 6, thiseffect can be clearly seen by the formation of distinctshock structures within x/D ≤ 5 resembling specificfeatures of underexpanded gaseous jets (e.g. Figure6e). The same phenomenon for comparable injectionconditions was observed by Wu and Chen [10]. Forprg,ch = 0.49, one single large barrel shock is visible,which results in a turbulent mixing zone with largegrowth rate compared to the Tf,inj < 1 injections.When increasing prg,ch from 0.49 to 1.15, the analy-sis yields a decrease of expansion ratio pf,exit/pg,chfrom 6.3 to 2.8 (see Table 3). This leads to a reduc-tion of lateral spreading of the barrel shock structureas visible in Figure 6f. In particular for prg,ch = 1.15,the low expansion ratio causes shock diamonds toform in the downstream region. These structues arevisible in Figure 6b between 5 ≤ x/D ≤ 25 and aretypical for slightly underexpanded gaseous jets.
Conclusions
The injection of n-hexane into quiescent argonis investigated. Here, Tf,inj and pg,ch are variedfrom sub-to supercritical values (with respect to n-hexane), where both pf,inj and Tg,ch are fixed tosupercritical values.
For T rf,inj = 0.96 and pressures up to prg,ch =
1.15, a liquid phase is detected by Mie imagingwithin the near-nozzle region. This is corroboratedby a thermodynamic analysis of the injection pathbased on an isentropic nozzle flow. Microscopic
shadowgraph images of the jet surface are presentedfor axial distances of x/D = 15 & 60, revealing no(resolvable) liquid phase in form of droplets or liga-ments. On basis of this, the existance of liquid struc-tures greater than 10 µm in the outer region of the jetis excluded. This leads to the assumption of a liquidphase concentrated only within the inner jet regionfor x/D ≤ 15. The findings also show the incapa-bility of exclusive Shadowgraphy measurements toproper determine the fluid’s thermodynamic state.In fact, only combined measurement techniques ofappropriate principles seem to provide an evaluationof the transition processes.
The significant influence of Tf,inj on the jetcharacteristics is shown exemplarily for Tf,inj =1.18. Here, a supercritical fluid is predicted by thetheoretical analysis with choked outflow condition.Indeed, the flow shows typical features of underex-panded gaseous jets. The transition to a fully super-critical state is shown by means of lacking scatteredlaser light within the Mie images.
Nomenclature
D nozzle diameter [mm]η dynamic viscosity [Pa s]f focal length [mm]λ wavelength [nm]L nozzle length [mm]Ma Mach number [1]p pressure [bar]ρ density [kg m−3]Re Reynolds number [1]s specific entropy [kJ kg−1 K−1]T temperature [K]v velocity [m s−1]x axial distance [µm]
Subscriptsc criticalch chamberf fuelg gasinj injectionsat saturation
Superscriptsr reduced
Acknowledgments
This work was performed within the Collabo-rative Research Centres ”Technological foundationsfor the design of thermally and mechanically highly
8
loaded components of future space transportationsystems (SFB-TR40)”. The authors would like tothank the German Research Foundation (DeutscheForschungsgemeinschaft) for the financial supportof this work. Furthermore, the author would like tothank Christoph Wenzel and Lukas Muser for theproductive collaboration in performing this work.
References
[1] G. Lamanna, E. Oldenhof, S. Baab, I. Stotz,and B. Weigand. 18th AIAA/3AF Interna-tion Space Planes and Hypersonic Systems andTechnologies Conference, 2012.
[2] W. Mayer and A. Schik. Journal of Propulsionand Power, 14, 1998.
[3] P. Seebald and P. E. Sojka. Handbook of At-omization and Sprays: Theory and Application,pp. 255–261, 2011.
[4] E. Oldenhof, F. Weckenmann, G. Lamanna,B. Weigand, B. Bork, and A. Dreizler. EucassBook Series, 4, 2011.
[5] I. Stotz, G. Lamanna, H. Hettrich, B. Weigand,and J. Steelant. Review of Scientific Instru-ments, 79:125106 (9 pp.), 2008.
[6] G. S. Settles. Schlieren and ShadowgraphyTechniques. Springer, 2001.
[7] G. J. Smallwood and O. L. Gulder. Atomizationand Sprays, 10:355–386, 2000.
[8] A. Adam, P. Leick, and G. Bittlinger. Experi-ments in Fluids, 47:439–449, 2009.
[9] T. W. Lee and A. Mtrovic. SAE Paper, 920577,1992.
[10] P. K. Wu and T. H.Chen. Journal of Propulsionand Power, 12:770–777, 1996.
[11] R. Span and W. Wagner. International Journalof Thermophysics, 24:41–109, 2003.
[12] N. Czerwonatis and R. Eggers. Chemical Engi-neering & Technology, 24:619–624, 2001.
[13] R.D. Reitz and F.V. Bracco. Phys. Fluids,25:1730–1741, 1982.
[14] H. Witlox, M. Harper, P. Bowen, and V. Cleary.Journal of Hazardous Materials, 142:797–809,2007.
[15] B. Chehroudi, R. Cohn, and D. Talley. Interna-tional Journal of Heat and Fluid Flow, 23:554–563, 2002.
[16] G. J. Smallwood, O. L. Gulder, and D. R.Snelling. Twenty-Fifth Symposium (Interna-tional) on Combustion, 25:371–379, 1994.
[17] P. Wu, M. Shahnam, and K. A. Kirkendall.Journal of Propulsion and Power, 15, 1999.
[18] T. Doungthip, J. S. Ervin, T. F. Williams, andJ. Bento. Ind. Eng. Chem. Res, 41:5856–5866,2002.
9
x/D0 5 10 15 20 25 30 35
T rf,inj
= 0.96, prch
= 0.49
(a)
x/D0 5 10 15 20 25 30 35
T rf,inj
= 0.96, prch
= 1.15
(b)
x/D0 5 10 15 20 25 30 35
T rf,inj
= 0.96, prch
= 0.49
(c)
x/D0 5 10 15 20 25 30 35
T rf,inj
= 0.96, prch
= 1.15
(d)
x/D0 1 2 3 4 5
T rf,inj = 0.96, prch = 0.49
(e)
x/D0 1 2 3 4
T rf,inj
= 0.96, prch
= 1.15
(f)
x/D0 1 2 3 4 5 6
T rf,inj
= 0.96, prch
= 0.49
(g)
x/D0 1 2 3 4 5
T rf,inj
= 0.96, prch
= 1.15
(h)
Figure 5: Shadowgraph and Mie images for Tf,inj = 485 K (i.e. T rf,inj = 0.96)
10
x/D0 5 10 15 20 25 30 35
T rf,inj
= 1.18, prch
= 0.49
(a)
x/D0 5 10 15 20 25 30 35
T rf,inj
= 1.18, prch
= 1.15
(b)
x/D0 5 10 15 20 25 30 35
T rf,inj
= 1.18, prch
= 0.49
(c)
x/D0 5 10 15 20 25 30 35
T rf,inj
= 1.18, prch
= 1.15
(d)
x/D0 1 2 3 4 5
T rf,inj = 1.18, prch = 0.49T rf,inj = 1.18, prch = 0.49
(e)
x/D0 1 2 3 4
T rf,inj
= 1.18, prch
= 1.15
(f)
x/D0 1 2 3 4 5
T rf,inj = 1.18, prch = 0.49
(g)
x/D0 1 2 3 4 5
T rf,inj
= 1.18, prch
= 1.15
(h)
Figure 6: Shadowgraph and Mie images for Tf,inj = 600 K (i.e. T rf,inj = 1.18)
11