Embed Size (px)
Citation preview

Combined effects and
synergies between agricultural
and social protection
interventions:
What is the evidence so far?


Combined effects and
synergies between agricultural
and social protection
interventions:
What is the evidence so far?
Fabio Veras Soares
Institute for Applied Economic Research (IPEA) and International
Policy Centre for Inclusive Growth (IPC-IG)
Marco Knowles, Silvio Daidone
Food and Agriculture Organization of the United Nations (FAO)
Nyasha Tirivayi
UNU-MERIT (United Nations University)
FOOD AND AGRICULTURE ORGANIZATION OF THE UNITED NATIONS
ROME, 2017
FAO, together with its partners, is generating evidence on the impacts of
social protection on poverty reduction, food security, nutrition and resilience
and is using this to provide related policy, programming and capacity
development support to governments and other actors. Countries include
Kyrgyzstan, Lebanon, Lesotho, Malawi, Rwanda, Senegal, Zambia, and
Zimbabwe.
The designations employed and the presentation of material in this information product do not imply the expression of any
opinion whatsoever on the part of the Food and Agriculture Organization of the United Nations (FAO) concerning the legal
or development status of any country, territory, city or area or of its authorities, or concerning the delimitation of its frontiers
or boundaries. The mention of specific companies or products of manufacturers, whether or not these have been patented,
does not imply that these have been endorsed or recommended by FAO in preference to others of a similar nature that
are not mentioned.
The views expressed in this information product are those of the author(s) and do not necessarily reflect the views or
policies of FAO.
ISBN 978-92-5-109553-9
© FAO, 2017
FAO encourages the use, reproduction and dissemination of material in this information product. Except where otherwise
indicated, material may be copied, downloaded and printed for private study, research and teaching purposes, or for use
in non-commercial products or services, provided that appropriate acknowledgement of FAO as the source and copyright
holder is given and that FAO’s endorsement of users’ views, products or services is not implied in any way.
All requests for translation and adaptation rights, and for resale and other commercial use rights should be made via
www.fao.org/contact-us/licence-request or addressed to [email protected].
FAO information products are available on the FAO website (www.fao.org/publications) and can be purchased through
This publication has been printed using selected products and processes so as to ensure minimal environmental impact
and to promote sustainable forest management.

iii
Contents
Acknowledgements ......................................................................................................... v
Acronyms ........................................................................................................................ vi
Executive Summary ..................................................................................................... viii
1. Introduction ............................................................................................................ 1
1.1 Objectives ........................................................................................................... 2
1.2 Definitions .......................................................................................................... 2
1.2.1 Agricultural and social protection interventions ............................................. 2
1.2.2 Coherence between agriculture and social protection ..................................... 2
1.2.3 Types of coordinated or combined programmes ............................................. 4
1.3 Conceptual framework: pathways of impact ...................................................... 7
1.4 Evaluation challenges and research gaps ......................................................... 10
1.5 Outline of the paper .......................................................................................... 13
2. Methodology of the literature review.................................................................. 14
2.1 Search strategy ................................................................................................. 14
2.2 Search findings ................................................................................................. 15
3. Which combined programmes have been evaluated? ....................................... 17
3.1 Geographical distribution of evaluations ......................................................... 17
3.2 Programmes that combine agricultural and social protection interventions in
Asia ................................................................................................................... 20
3.3 Programmes that combine agricultural and social protection interventions in
Latin America ................................................................................................... 25
3.4 Programmes that combine agricultural and social protection interventions in
Africa ................................................................................................................ 29
3.4 Concluding remarks ......................................................................................... 33
4. Main features of the selected evaluation papers and reports ........................... 34
4.1 Evaluation methods .......................................................................................... 34
4.2 Evaluation design: Sampling strategies and control groups ............................. 39
4.3 Outcomes of interest ......................................................................................... 45
5. Evidence from impact evaluations of combined social protection and
agricultural intervention programmes ....................................................................... 48
5.1 Supporting households in making productive investments .............................. 48
5.1.1 Investment in land: Owned land, rented land and cultivated land ............ 49
5.1.2 Investment in productive assets, sustainability and impacts
on production ............................................................................................. 52
5.2 Strengthening risk management ........................................................................... 63
5.2.1 Access to credit and savings .......................................................................... 64
5.2.2 Diversifying economic activities and sources of income .............................. 69

iv
5.2.3 Negative coping strategies ............................................................................. 72
5.3 Shifts in labour allocation................................................................................. 76
5.4 Impact on consumption, expenditure, income, poverty and food security ....... 83
5.5 Strengthening participation in community networks and stimulating local
economies ......................................................................................................... 94
5.5.1 Spillover impacts ....................................................................................... 94
5.5.2 Impacts on social and economic links with the community networks ...... 96
6. Conclusion: What has been learned so far ......................................................... 99
6.1 Findings and limitations by category of combined programmes ................... 100
6.2 Methodological gaps and areas for further investigation ............................... 104
References.................................................................................................................... 106
Appendix ..................................................................................................................... 113

v
Acknowledgements
The authors would like to acknowledge the support of the experts that helped to identify
papers and reports assessing the combined effect of agricultural interventions and social
protection programmes. These are John Hoddinott, Armando Barrientos, Rachel Sabates-
Wheeler, Steve Wiggins, Paul Winters, Karl Pauw, Jorge Maldonado, Ursula Aldana and
Wameq Raza. We would also like to thank Ana Paula de la O Campos, Noemi Pace,
Rachel Sabates-Wheeler, Natalia Winder-Rossi and Steve Wiggins for their comments
and suggestions on a draft version of this paper. A special thank you to Luca Pellerano
and Paul Quarles van Ufford who peer reviewed this paper. We also thank Ruth Raymond
and Chiara Gnetti for copy-editing the report. All remaining errors or inconsistencies are
our responsibility.

vi
Acronyms
CCT – Conditional Cash Transfers
CGAP – Consultative Group to Assist the Poor
CGE – Computable General Equilibrium
CGP – Child Grant Programme
CLP – Chars Livelihood Programme
CP – Complementary Programmes
CPFR – Challenging the Frontiers of Poverty Reduction
CSR – Comunidades Solidarias Rurales
ENHRUM – Encuesta National a Hogares Rurales de México
EP – Encadenamientos Productivos (Productive chains)
ER – Enhancing Resilience
FA – Familias en Acción
FAA - Framework for Analysis and Action
FAO – Food and Agriculture Organization of the United Nations
FISDL – Fondo de Inversión Social para el Desarrollo Local (Social Fund for Local
Development)
FISP – Farm Input Subsidy Programme
FOSIS – Fondo de Solidariedad e Inversión Social (Social Solidarity and Investment
Fund)
FSUP – Food Security for the Ultra Poor
HABP – Household Asset Building Programme
IDRC – International Development Research Centre
IDS – Institute of Development Studies
IEF – Ingreso Ético Familiar
IFAD – International Fund for Agriculture Development
IFPRI – International Food Policy Research Institute
IKP - Indira Kranti Patham
IPC-IG – International Policy Centre for Inclusive Growth
LEWIE – Local Economy-wide Impact Evaluation
LFSSP - Linking Food Security and Social Protection
J-PAL – The Abdul Latif Jameel Poverty Action Lab
MDS – Ministry of Social Development

vii
MKW – Malawian Kwacha (Malawian currency)
NREGA – National Rural Employment Guarantee Act
NSUP – Non-selected Ultra Poor
OFPS – Other Food Security Programme
ODI – Overseas Development Institute
OP – Overlapping Programmes
OPM – Oxford Policy Management
OR – Oportunidades Rurales
PtoP – From Protection to Production
PRONAF – Programa Nacional de Apoio à Agricultura Familiar
PSNP – Productive Safety Net Programme
SAN – Seguridad Alimentaria y Nutricional (Food Security and Nutrition)
SCTP – Social Cash Transfer Programme
SISBEN – Sistema de Idenficación de Potenciales Beneficiarios de Programas Sociales
(System for the Idenfication of Social Programme’s Potential Beneficiaries)
SKS/UPP - Swayam Krishi Sangam/Ultra Poor pilot programme
SLP – Sustainable Livelihoods Programmes
SUP – Selected Ultra Poor
3ie – International Initiative for Impact Evaluation
WFP – World Food Programme
WINGS – Women’s Income Generating Support

viii
Executive Summary
Introduction
Despite the progress made in reducing poverty and hunger over the past few decades,
there are still about a billion people who are poor and 800 million who are hungry. These
people are concentrated in sub-Saharan Africa, they live in rural areas and their
livelihoods depend largely on agriculture (FAO, 2015). These facts indicate the
importance of looking at the specificities and the context of both the agricultural sector
and public policies in relation to poor and vulnerable people, as well as their intersection
with social protection policies designed to fight poverty and vulnerability.
Small family farmers in developing countries are exposed to negative shocks, such as
illness, drought and animal pests, and face challenges in accessing input and output
markets (Gavrilovic et al., 2016). As a result, poor and vulnerable households quite often
adopt low-risk and low-return livelihoods strategies that reduce their income-earning
potential. Their production and consumption decisions are inseparable, such that risks and
challenges faced in their income-generating activities also affect their consumption
decisions. This means that they may have to take decisions that have detrimental long-
term effects on development outcomes (e.g. investing less in health and education, opting
for staple rather than cash crops, sending their children to work, etc. (Dorward et al.,
2006).
Coordinated and coherent agricultural and social protection policies and programmes
have the potential to help poor small family farmers break the cycle of disadvantage and
prevent the transmission of poverty across generations. Agricultural interventions address
constraints limiting access to natural resources, productive inputs, financial and advisory
services and markets. They include extension services, tenure reform, natural resource
management, subsidized credit, investment grants, access to improved seeds and fertilizer
subsidies. Social protection provides assets to smallholder farmers through cash transfers
and public works programmes; this allows them to invest more time and resources in
agriculture, increase their participation in social networks and better manage risks. Yet
despite the clear intersection between the two types of interventions, it is only recently
that some countries have started to experiment with combining or coordinating them.
This literature review has three main purposes. First, it seeks to gather and analyse
evidence from impact evaluations concerning the added value of coordinated agricultural
and social protection interventions in order to inform the design of future policies and
programmes. Second, based on the available evidence, it aims to determine which types
of combined interventions have had the greatest impacts in different contexts. Finally, the
review means to help define a future evidence-generation agenda by identifying critical
knowledge gaps.
To achieve these objectives, the review looks at the findings of robust impact evaluations
that focus on the interaction between agricultural interventions (including rural extension
services, rural development, natural resource management, access to market, subsidized
credit, investment grants, access to improved seeds and fertilizer subsidies), and social

ix
protection interventions, with a specific emphasis on social assistance such as cash
transfers and public works. The review focuses on outcomes related to hunger,
malnutrition and poverty and the factors that contribute to their achievement, particularly
labour market participation and productive activities.
The analytical framework used in the review draws from two main sources: the theory of
change on the relationship between agriculture and social protection developed by
Tirivayi, Knowles and Davis (2013) and the Framework for Analysis and Action (FAA)
for strengthening coherence between agriculture and social protection (Gavrilovic et al.,
2016). The theory of change looks at how social protection interventions aimed at
alleviating poverty and vulnerability can impact agriculture and how agricultural
interventions in return can affect risks, vulnerability and the income-generating capacities
of the poor and vulnerable, particularly in rural areas. Further, the theory of change allows
us to identify the key outcomes of interest that are affected by both types of interventions
and their causal links. The FAA looks at how coherence between agricultural and social
protection interventions can be strengthened.
This paper classifies agricultural and social protection interventions whose impact
evaluations are reviewed here as follows:
1. Sustainable livelihoods programmes (SLPs): Single programmes with multiple
components that include both agricultural and social protection interventions (e.g.
sustainable livelihoods interventions combining asset transfers or investment
grants, cash transfer for consumption support, business training, life skills, savings
incentives, etc.).
2. Complementary programmes (CPs): Programmes from the agricultural and social
protection sectors that are designed and/or implemented in a somewhat
coordinated and/or aligned manner. Even when there is no overlap at the
intervention level, some programmes implemented in the same location could also
be classified as CPs. This includes, for example, school feeding programmes that
procure from local smallholder farmers to whom they provide production support
(e.g. Purchase from Africans for Africa – PAA Africa) as well as food assistance
initiatives, such as Bangladesh’s Public Food Distribution System, that procure
from smallholders.
3. Overlapping programmes (OPs): These programmes happen to partly overlap at
the individual/household or geographical/community levels. Evidence from OPs
provides indications on how to improve coherence between the two types of
interventions through coordination and/or alignment. For example, evaluations of
the impact of rural credit and/or extension services in areas and communities
where the poor and vulnerable population also have access to social transfers but
these programmes are not coordinated, may offer some evidence of the added
value of doing so (e.g. PRONAF’s credit for family farmers and Bolsa Familia in
Brazil and Peru’s rural credit and Juntos social transfer programmes).

x
The key hypothesis is that the effects of bringing together agricultural and social
protection interventions are synergistic rather than just a sum of the positive impacts that
each programme has on its own. The distinction is important for this review, which
focuses on the empirical results of evaluations conducted using various experimental and
quasi-experimental methodologies and covering agricultural and social protection
interventions in very different environments in Asia, Africa and Latin America. In most
cases, however, evaluations did not try to measure the interaction effects of combined
programmes but focused simply on the cumulative or the additional impacts of
complementary programming. Thus, a major challenge was the lack of evaluations,
whose design allowed the review to disentangle and understand the multiplicative and
additive effects of agricultural and social protection interventions.
Methods
The literature search for the review blended three strategies: a snowball approach, a
bibliographic database search and a hand-search. To be selected, impact evaluations had
to be based on robust evaluation methodologies with an adequate identification strategy,
including the definition of a clear comparison group and the counterfactual. Acceptable
methodologies included both experimental (randomized control trials) and non-
experimental (e.g. difference-in-differences, propensity score matching, regression
discontinuity design, generalized propensity score and instrumental variables) designs.
The database search revealed only a few papers that looked specifically at the interaction
between agricultural and social protection interventions. Overall, the literature search
identified 37 evaluations, including academic papers, working papers, reports or book
chapters. More than 50 percent of the evaluation reports considered in this review dated
from 2015 or 2016; the oldest evaluation dated from 2009.
Feedback from experts familiar with evaluations of agricultural and social protection
interventions confirmed the review’s finding that the literature on the impact of combined
agricultural and social protection interventions is thin. Two main factors may explain this.
First, while agricultural and social protection programmes may have similar goals in
terms of reducing hunger and poverty, they tend to use different strategic approaches and
cover somewhat different target populations. Agricultural interventions tend to focus on
commercial farmers while social protection programmes focus on more vulnerable
subsistence farmers. Second, even when sectoral programmes are coordinated, impact
evaluation is rarely included in project design. Furthermore, challenges around the
implementation of combined programmes may jeopardize impact evaluation. A lack of
programme coordination between different sectoral implementing agencies could partly
explain the lack of solid evidence on the impact of combined programmes (mostly CP
and OP types) as well as the contribution of their components (particularly in the case of
SLPs) and estimates of the synergistic effect (interaction or multiplicative component).

xi
Combined programmes
The literature search revealed a strong prevalence of certain categories of combined
programmes in particular regions. In Asia, SLP seems to be the most prevalent category
whereas Latin America favours CPs with a focus on conditional cash transfer (CCT)
programmes and productive inclusion interventions. In Africa, a more balanced mix of
categories was noted with a smaller number of evaluations overall. About 46 percent of
the evaluations (17) reported on programmes implemented in Asia, 30 percent (11) in
Latin America and 24 percent in Africa (9).
The over-representation of Asian programmes in the literature can be largely explained
by the multiple evaluations of the SLP programme Challenging the Frontiers of Poverty
Reduction (CFPR), which is implemented by BRAC, an NGO founded in Bangladesh.
The CFPR’s key objective is to graduate rural families from extreme poverty and prepare
them to participate in the microfinance programmes implemented by BRAC. It merges
agricultural (e.g. productive asset distribution and training to manage that asset) and
social protection (e.g. cash transfers for consumption smoothing and access to health
services) interventions into a single programme. The CFPR has inspired similar
programmes in Bangladesh and has been adapted to other parts of the world, including
through two pilot projects in India, and one each in Pakistan, Ethiopia, Ghana, Honduras
and Peru. The review also studied evaluations of CPs, including the Indira Kranti Patham
(IKP) programme in Andhra Pradesh, a women’s empowerment and rural livelihoods
programme, and the P-135 II, a poverty reduction programme targeting ethnic minorities
and isolated areas in Vietnam.
Aside from two SLP pilots in Honduras and Peru, most evaluations from Latin America
are concerned with CPs and OPs. Of particular note is the IFAD-supported Sinergias
Rurales (Rural Synergies) project (http://www.sinergiasrurales.info/), which evaluated
synergies between CCT programmes (such as Juntos in Peru and Familias en Acción in
Colombia) and rural development programmes that target poor family farmers.
For Africa there is an over-representation of evaluations focusing on Ethiopia’s
Productive Safety Net Programme (PSNP) and its links with agricultural interventions
such as the Other Food Security Programme (OFSP) and the Household Asset Building
Programme (HABP). In addition to the four evaluations from Ethiopia, the other four
evaluations for Africa look at SLPs in Uganda and Ghana and an OP in Malawi involving
the Social Cash Transfer Programme (SCTP) and the Farm Input Subsidy Programme
(FISP).
Outcomes of interest
A total of 30 of the evaluation reports (81 percent) under review assessed the impact of
combined programmes on income, consumption and/or expenditures. Interestingly, only
five (13 percent) examined how programme impacts translated into poverty reduction.
Hunger and malnutrition indicators were often reported by a variety of food security
indicators such as a) perceived food security; b) standard food security scores; c) dietary
diversity; d) frequency of meals or missed meals (the most prevalent set of indicators);
and e) calorie intake. Overall, 23 papers (64 percent) looked at the impact of combined

xii
interventions on food security indicators. Only two evaluations looked at anthropometric
measurements for children.
Asset-related indicators were commonly assessed in the evaluations. In total, 28 reports
(76 percent) discussed the impact of the interventions on asset accumulation with a focus
on productive assets but also including durable goods (e.g. television, radio, refrigerator).
A large number of papers reported the impacts of the programmes in terms of direct
production and productivity indicators (e.g. total value of produce and/or value or amount
of produce per area) or indirect indicators, reporting different sources of household
income (and hours of work) dedicated to agriculture, livestock or non-farm enterprises.
Twenty evaluations (54 percent) include indicators that could be used to assess the impact
of the interventions on production and/or productivity. However, far less is known about
the impact of interventions on investments in agricultural and non-agricultural inputs.
This type of intervention tends to assess ownership of productive assets rather than
measuring direct expenditures on these inputs. Thus, fewer evaluations (only six out of
36) assessed, for instance, expenditures on the purchase of fertilizers or improved seeds.
Savings and access to credit indicators were assessed in 18 evaluations (50 percent).
The impacts of combined programmes on labour supply and occupation were reported in
about half (17) of the evaluations. Impacts on agricultural and non-agricultural self-
employment was the most commonly used indicator, consistent with the objectives of
many of the SLP and CP programmes to foster entrepreneurship. Finally, 13 evaluations
(37 percent) measured the impacts of the interventions on indicators related to community
participation. Some programmes aim to foster community participation through self-help
groups, women’s empowerment, productive associations or cooperatives and this set of
indicators is clearly related to those objectives, which are much more diverse in their
nature and less standardized than the sets of outcomes discussed in this review.
Main results
Supporting households in making productive investments
Investment in owned, rented and cultivated land
The impact evaluations show increases in access to and/or the use of land. For SLPs, the
evidence suggests that, in the case of Bangladesh (CFPR Phase 1 and 2 and Food Security
for the Ultra Poor – FSUP), part of the return yielded by the livestock-based income
generating activities was invested in the purchase or rent of more land. For CPs, there is
evidence of more land utilization in Lesotho as a result of the combined Linking Food
Security and Social Protection (LFSSPP) and Child Grants Programme (CGP), and in
Peru, due to the overlapping of the rural credit and Juntos programmes. In India, the IKP
programme led to an increase in the area of land cultivated by the poorest households.
Investment in productive assets, sustainability and impacts on production
The evaluations of SLPs carried out in Asia and Africa reveal positive impacts on the
accumulation of both productive and durable assets that go beyond the direct effect of the
asset transfers by the programmes. There is also evidence that these impacts, although
observed for all income quintiles, were higher for better-off beneficiaries. It is worth
xiii
noting that in Latin American, the SLP pilots in Honduras and Peru had much weaker
impacts, particularly on productive assets. Strong impacts on asset accumulation were
observed for the Ethiopia pilot, where the asset transfer was combined with the
consumption support of the PNSP.
Similar evidence was found in the evaluations of the Ethiopian CP intervention, which
brought together PSNP and OFSP/HABP. For other CPs and even some OPs, there is
evidence that agricultural interventions, such as extension services and access to better
technology, are likely to trigger some synergistic effects in terms of asset accumulation
and the adoption of new technologies when combined with cash transfers or public works
programmes. Positive impacts were observed for the IKP in India and the P-135 in
Vietnam as well as for the interactions between Sierra Sur and Juntos and a rural credit
programme and Juntos in Peru, the Comunidades Solidarias Rurales (CSR) and
Encadenamientos Productivos (EP) in El Salvador and Bolsa Familia and Programa
Nacional de Apoio à Agricultura Familiar (PRONAF) in Brazil. However, there is only
mixed evidence on the extent to which investments in productive assets translate to higher
production and business revenue such as in the case of Haku Wiñay in Peru and the Local
Education Assistance and Procurement (LEAP) project in Burkina Faso.
Strengthening risk management and resilience
Access to credit and savings
The evaluations of SLPs show positive impacts on savings and access to formal credit.
This result does not come as a surprise since mandatory or incentivized savings are key
components of many SLP interventions. However, these impacts seem to be attenuated
once the programme is phased out. The evaluations also reveal positive impacts on credit
access and/or a shift away from informal to formal loans. A note of caution refers to the
fact that positive impact on financial inclusion seems to be restricted to better-off
participants. Evaluations of CPs also show positive impacts on access to credit for
beneficiaries, as seen in the combined PSNP and the OFSP programmes in Ethiopia. Even
OPs have had some positive impacts: in El Salvador, participating or having participated
in the CCT programme seemed to have made it easier for food and nutritional security
project beneficiaries to gain access to credit, particularly formal credit.
Diversifying economic activities and sources of income
The evaluations of CPs show some diversification of economic activities in agriculture,
including homestead gardens and livestock raising, but also a shift to non-farm
businesses. In many of the SLPs, part of the livestock revenue was used to foster high-
return crop production, as seen in FSUP, but not necessarily to support non-farm
businesses. Diversification into non-farm businesses was more common in programmes
seeking to enable vulnerable households to have a non-farm source of income, such as in
Nicaragua (CCT+ investment grant) and Uganda (Women’s Income Generating Support
– WINGS). This type of impact was also found in the combined PSNP and OFSP
programmes in Ethiopia (as well the PSNP only) and in the Enhancing Resilience Plus
(ER+) in Bangladesh. In the case of some CPs and OPs, economic diversification for
smallholder farmers was part of the complementary agricultural programme - usually
xiv
extension services - and implied the introduction of new crops. In the case of Waku Winãy
in Peru, a typical CP, there has not only been increased diversification of crops (new fruits
and vegetables), but also increases in both agricultural income and non-agricultural
income and a fall in wage income (led by rural wage). Thus, as in the case of rural SLPs,
rural CPs may lead to a change in the sources of income of households favouring self-
employment sources.
Negative coping strategies
There is not much evidence on child work, particularly for SLPs. The impact of OPs and
CPs on child work seems to be mixed. Whereas Bolsa Familia in Brazil seems to be
associated with a decrease in child work, rural credit seems to go into the opposite
direction, with the interaction between the two tending to reduce child labour. In Lesotho,
the combination of an unconditional cash transfer (CGP) with homestead gardening
support seems to have led to an increase in child work, particularly for girls. The scarce
evidence for the Bangladesh CFPR shows no impact on child work, a result similar to
that found in Colombia for the combination of a CCT programme with a rural
intervention. Overall, these results suggest that contextual factors need to be considered
during project design to ensure that productive support to families lead to increases in
child labour. As for begging and other undesirable forms of occupation, the evaluation of
CFPR Phase 1 in Bangladesh shows reductions in their prevalence, but with attenuated
effects in the long term. Asset depletion seems to be minimal in SLPs, most likely due to
the consumption support component, although none of the evaluations disentangled this
effect.
Shifts in labour allocation
The SLP impact evaluations that looked at impacts on labour force allocation show
increases in the proportion of farm self-employment, particularly among women, who
were the main beneficiaries of the asset transfers. In some cases, increases in male self-
employment were also observed in both farm and non-farm self-employment. Most of the
increases in farm self-employment were at the expense of time spent on wage labour, but
the overall balance does not suggest a reduction in work intensity, just a reallocation in
line with programmes objectives. This was also observed for interventions seeking to
enable rural households to diversify their incomes by engaging in non-farm activities such
as Uganda (WINGS) and Nicaragua CCT plus investment grants for non-farm businesses.
However, even in these cases, some increases were seen in farm self-employment,
although to a far lesser extent than non-farm self-employment. Similar impacts were also
found for CPs such as the PSNP plus OFSP in Ethiopia and the combined LFSSPP and
CGP programmes in Lesotho. The overall evaluation results suggest that combined
agricultural and social protection programmes do not generate dependency but instead
tend to stimulate labour force participation among beneficiaries.
Impact on consumption, expenditure, income, poverty and food security
The impact evaluations show that combined agricultural and social protection
interventions are likely to have a positive impact on income, total expenditure and total
and per capita food expenditure. The latter seems linked to improvements in food security,

xv
as reported in many of the impact evaluations discussed here. SLPs and CPs, mainly in
Asia and in Africa, show very positive impacts in all of these dimensions. In Latin
America, the results seem more mixed, with some combinations failing to improve
incomes (Sierra Sur and Juntos) and/or food security indicators (Familias en Acción and
Oportunidades Rurales). Other combined interventions did have positive impacts on per
capita income (Bolsa Familia and PRONAF), total household income (Juntos and Haku
Wiñay) and food security indicators (CCT plus investment grant in Nicaragua, CCT plus
rural development in El Salvador and Haku Wiñay in Peru).
Strengthening participation in community networks and stimulating local economies
Spillover impacts
Only seven of the 37 evaluations looked at spillover effects. Of these, only the evaluation
of Sierra Sur plus Juntos in Peru and other two evaluations of CFPR Phase II in
Bangladesh showed spillover effects of the agricultural interventions for the non-eligible
in treated areas. The four other evaluations were undertaken in the context of small scale
pilots and did not find any evidence of spillover effects on the eligible, but non-treated
population in treated areas. Investigating spillover effects for larger scale programmes,
particularly on the non-eligible population, is a clear gap in the impact evaluation
literature of both individual and combined programmes.
Impacts on social and economic links with the community networks
Another important dimension of the community-level impacts of combined programmes
is how they change the way beneficiaries interact with their communities in terms of
reliance on, and support for, other community members and/or institutions. Various
indicators have been used to capture this dimension. Overall, the evaluations that looked
at this dimension found that SLPs and CPs that included components aiming to foster
self-help groups and associations were likely to increase interactions between
beneficiaries and their social networks, reducing social exclusion and increasing access
to public services and community support.
Conclusions
Findings
Despite the difficulty of isolating the synergistic impact of combined programmes as
presented in the impact evaluations, the evidence is rich enough to allow the assertion
that combined programmes can have positive impacts that go beyond the effect of an
individual intervention. Most evaluations, however, fail to assess whether the effects of
combining agricultural and social protection interventions are greater than the sum of the
parts.
The evidence also indicates the different roles that agricultural and social protection
interventions can play as well as the challenges involved in their implementation. Overall,
all three types of programmes have shown positive impacts on the following aspects of
development:

xvi
investments in productive assets;
savings and access to formal credit;
more stable, permanent and profitable sources of income;
self-employment, particularly for women, and/or more profitable and decent
employment;
food security;
income, consumption and expenditure levels; and
poverty reduction.
Some issues related to joint programmes with different objectives have not been
sufficiently investigated and/or evaluation results have revealed some trade-offs and
limitations:
Impact on child work;
Direction and scale of spillover effects on non-beneficiaries;
Sustainability of the positive results in the long term when programmes are scaled-
up;
Investment in productive assets and financial inclusion were either larger for or
restricted to the better-off beneficiaries. Reaching the poorest of the poor is still
challenging even within the context of SLPs;
The extent to which greater investment leads to long-term productivity and
income gains, particularly for CP programmes in Latin America;
Adequacy of standard agricultural extension services for the target population of
social assistance programmes; and
Over-reliance on self-employment alternatives, overlooking better quality wage
employment in the context of sustainable local development strategies;
Research gaps
Overall, it seems that identifying which combination works best is very context-specific
and requires a specific theory of change. Determining how to combine, align and/or
integrate different programmes can be informed by cost-benefit and cost-effectiveness
analyses, but priorities may differ across settings and across countries, including policy
preferences for specific types of programmes, which seem to have some regional patterns.
This review identifies three main gaps. The first relates to gaps in the analysis of
individual/household level outcomes. Solutions to such gaps include: a) using more
experimental evaluations and/or more robust quasi-experimental designs for CP
programmes; b) designing evaluations that are able to disentangle the impact of different
components of SLPs, particularly when they are scaled-up; and c) designing programmes
that allow to better investigate spillovers. The second gap refers to the lack of evaluations
looking at community level outcomes and the local economy. The gap refers to lacunae

xvii
in knowledge about the impact of programmes that combine food-based social protection
interventions with programmes that purchase goods from family farmers and support the
production from smallholder farmers as in some modalities of Home Grown School
Feeding programmes such as the Purchase from Africans for Africa.

1
1. Introduction
Despite the progress made in reducing poverty and hunger over the past few decades,
there are still about a billion people who are poor and 800 million who are hungry. These
people are concentrated in sub-Saharan Africa, live in rural areas and their livelihoods
depend largely on agriculture (FAO, 2015). These facts indicate the importance of
looking at the specificities and the context of both the agricultural sector and public
policies in relation to poor and vulnerable people, as well as their intersection with social
protection policies designed to fight poverty and vulnerability.
As highlighted in Gavrilovic et al. (2016), small family farmers in developing countries
are exposed to negative shocks, such as illness, drought and animal pests, and face
challenges in accessing input and output markets. As a result, poor and vulnerable
households quite often adopt low-risk and low-return livelihoods strategies that reduce
their income-earning potential. Their production and consumption decisions are
inseparable, such that risks and challenges faced in their income-generating activities also
affect their consumption decisions. This means that they may have to take decisions that
have detrimental long-term effects on development outcomes (e.g. investing less in health
and education, opting for staple rather than cash crops, sending their children to work,
etc. (Dorward et al., 2006).
Coordinated and coherent agricultural and social protection policies and programmes
have the potential to help poor small family farmers break the cycle of disadvantage and
prevent the transmission of poverty across generations. At least in the short and medium
term, increasing agricultural productivity among small family famers is key to combating
poverty within this population group. It is well accepted that agricultural interventions
are needed for this. Such interventions can address structural constraints that limit access
to land and water resources, inputs, financial services, advisory services and markets.
Emerging evidence points to a somewhat innovative approach: complementing
agricultural interventions with social protection. Social protection interventions can
provide liquidity and certainty for poor smallholder farmers, allowing them to invest more
in agriculture, reallocate labour to on-farm activities, foster human capital development,
increase participation in social networks - an important source of informal risk
management - and better manage risks, all of which may contribute to their engagement
in more profitable livelihoods and agricultural activities.
Synergies between agricultural interventions and social protection can also be achieved
within the local economy and at the community level. Social protection interventions
usually lead to increased demand for food and other goods and services; agricultural
interventions can increase local food supply to match that new demand and mitigate its
potential inflationary effects. In addition, agricultural growth can improve employment
opportunities in the agricultural sector, as well as increase food availability and keep
staple food prices low, which benefits poor net food buyers. Finally, agricultural
interventions can lead to more secure livelihoods and a movement out of poverty, which
are likely to affect both the nature and composition of the social protection system
(Devereux, 2009).

2
1.1 Objectives
This literature review has three main purposes. First, it intends to gather and systematize
evidence from robust impact evaluations to inform policy and programme design
concerning the value added of coordinated and coherent social protection and agricultural
interventions. Second, based on the available evidence, it aims to assess whether it is
possible to identify which combination of interventions have had the greatest impacts
within different contexts. Finally, the review seeks to help define a future evidence-
generation agenda by identifying critical knowledge gaps.
To achieve these objectives, the review analyses and summarizes findings of robust
impact evaluations that focus on the interaction between agricultural interventions
(including rural extension services, rural development, natural resource management,
access to markets, subsidized credit, investment grants, access to improved seeds and
fertilizer subsidies), and social protection interventions, with specific attention to social
assistance such as cash transfers and public works. The review focuses on outcomes
related to hunger, malnutrition and poverty and on factors that contribute to achieving
these outcomes, particularly those factors related to labour market participation and
productive activities.
1.2 Definitions
1.2.1 Agricultural and social protection interventions
This review focuses on the emerging empirical evidence provided by impact evaluations
of combined agricultural and social protection programmes rather than on the evidence
of isolated sectoral programmes. In this context, agricultural interventions, particularly
for small family farmers “focus on improving productivity in crops, fisheries, forestry and
livestock and improving access to markets” (Tirivayi, Knowles and Davis, 2013) and
encompass both supply and demand side interventions. Social protection is defined for
the purpose of this review as “all initiatives, both public and private, that: provide income
or consumption transfers to the poor; protect the vulnerable against livelihood risks; and
enhance the social status and rights of the excluded and marginalised” (Gavrilovic et al.,
2016, based on Devereux and Sabates-Wheeler [2004]).
1.2.2 Coherence between agriculture and social protection
There are many examples of how failing to coordinate the implementation of agricultural
and social protection programmes can generate undesirable impacts, particularly when
targeting the same beneficiaries. Devereux and Guenther (2007), for instance, describe
unintended negative interactions between public works programmes and agricultural
interventions in Ethiopia. Public works programmes (cash or food for work) were mostly
implemented during the lean season, which is also the peak of the farming season with
the preparation of the next harvest. As a result, farmers were diverted from working on
their own land (or as labourers) to take on temporary jobs under the cash or food for work
programmes. Such a diversion would jeopardize any agricultural intervention meant to
support farming. This does not mean that social protection interventions, such as public

3
works, always counter the productive objectives of agricultural interventions. Indeed, the
authors suggest that positive synergies can be created if payments for the public works or
other social transfers take place just before the farming season so that farmers can invest
part of their earnings in purchasing agricultural inputs (Devereux and Guenther, 2007).
Thus, the carefully timed implementation of agricultural and social protection
interventions can help minimize negative interactions and/or boost synergies, as seen in
this particular case.
Other challenges may occur when agricultural and social protection interventions are
implemented in the same location, but do not target the same population (i.e., the
overlapping occurs only at the geographical area). Social protection interventions may
target only the extreme poor, for example, while agricultural interventions tend to target
mostly more productive farmers who are not eligible for social protection interventions.
However, in many circumstances those better-off farmers who only benefit from
agricultural interventions are also affected by the simultaneous implementation of social
protection programmes in their community. For instance, a social protection programme
may increase the reservation wage of local daily workers – putting upward pressure on
production input costs – or increase demand for farmers’ produce triggered by the
liquidity injected through social transfers. In this case, the coherent implementation of
appropriate agricultural interventions (e.g. facilitating technological upgrades) could
compensate rural producers for any increase in labour costs and/or enable them to expand
their production to respond to higher local demand for their produce.
This review builds on some of the concepts developed in the Framework for Analysis and
Action (FAA) developed to strengthen coherence between agriculture and social
protection (Gavrilovic et al., 2016). The FAA defines coherence as “a systematic
promotion of complementary and consistent policies and programmes across sectors,
thereby creating synergies to combat rural poverty and food insecurity more effectively”
(Gavrilovic et al., 2016, p.1). Coordination consists of a set of actions that ensure that
interventions are implemented in a coherent manner to achieve a synergistic effect,1
defined for the purpose of this review as an additional (multiplicative) effect on top of the
sum of isolated impacts of both programmes (additive).
Although the FAA looks at both policy and programme issues, this review covers only
the programme level, largely due to the bias found in most impact evaluations, which
concentrate on programme rather than policy impacts. In addition, the ability to measure
synergistic effects is largely determined by the evaluation strategy adopted by evaluators.
Thus, as we will see later in the paper, it is always not possible to disentangle the
synergistic effect from the overall effect of combined programmes.
As discussed in Gavrilovic et al. (2016), there are three avenues for strengthening
coherence between agricultural and social protection interventions:
1 Coherence and synergistic effects may also happen by chance. Some of the evaluations reviewed here
show the synergistic effects of uncoordinated programmes that have some unplanned intersections in terms
of targeted populations, both at the individual/household or community levels.
4
Stand-alone agricultural interventions can be designed so that they are more
socially protective and stand-alone social protection interventions can be designed
to be consistent with the agricultural livelihoods of beneficiaries.
Multiple interventions can be combined into a single programme so that targeted
households participate in both agricultural and social protection interventions
either simultaneously or sequenced over time.
Potential synergies between different interventions can be exploited, even when
they have different objectives and target groups, different programmes can be
coordinated so that they involve the same households.
Recent attempts in Ethiopia to overcome the negative impacts of inconsistent agricultural
and social protection interventions – as described above – have resulted in a move to a
more coherent approach. This was done through the progressive alignment of
programmes that, despite having different priorities, might target the same vulnerable
populations in rural areas. Many of the changes in the design of agricultural interventions
in Ethiopia, such as the Other Food Security Programme (OFSP) and the more recent
Household Asset building Programme (HABP), particularly with regard to their coverage
of Productive Safety Net Programme (PSNP) beneficiaries, were intended to boost
synergies between the two types of intervention. Recent evaluations of the PNSP have
confirmed the existence and importance of these synergies by looking at the differential
impacts of the public works component of the PSNP programme when combined with
the OFSP/HASP interventions, as will be discussed later in this review (Hoddinott et al,.
2015).
1.2.3 Types of coordinated or combined programmes
Tirivayi, Knowles and Davis (2013) review the results of impact evaluations of stand-
alone agricultural interventions on poverty and vulnerability outcomes and show that a
wide range of agricultural interventions increase household income, consumption and
food security. The most effective programmes in terms of raising household income
include irrigation projects, land reform, microcredit and cash/investment grants for
farmers. Soil and water conservation interventions do not seem to have important impacts
on household income. Agricultural interventions are also linked to increases in household
labour supply and shifts in on-farm labour demand and between the agricultural and non-
agricultural sectors. As for effects on the local economy, the literature has also identified
some spillover effects on local consumption, prices and labour markets as well as notable
multiplier effects. Finally, agricultural interventions seem to have no effect on child
nutritional status.
Evaluations of stand-alone social protection interventions, such as social cash transfers,
have mostly assessed outcomes related to their core objectives, namely poverty reduction,
consumption smoothing and, in the case of conditional cash transfers (CCT), education,
health and nutrition outcomes. However, largely stemming from the concern that social
protection may create a disincentive to work, there has been increasing attention paid to
the impacts of cash transfers on productive activities, particularly among households in
5
rural areas and that depend on agriculture for their livelihoods. This is evident from the
empirical literature assessing the impact of Latin American cash transfers, which includes
studies such as Gertler, Martinez and Rubio-Codina (2012) on Mexico; Martinez (2004)
on Bolivia; and Soares, Ribas and Hirata (2010) on Paraguay, as well as recent
evaluations by FAO and UNICEF that have looked at sub-Saharan African countries:
Covarrubias, Davis and Winters (2012) on Malawi; Daidone et al. (2016) for seven
countries in sub-Saharan Africa. All of these evaluations have adopted rigorous
methodologies and have found strong evidence of the impact of cash transfer programmes
on productive activities. In particular, they have shown that cash transfers not only
provide social protection to vulnerable and poor people but also foster production gains
at the farm and household levels (Davis, 2015). However, they also show that more
attention should be paid to the potential synergies as well as risks involved when
combining or aligning agricultural and social protection interventions, as these may
conflict with the original social objectives of the programmes (e.g. by having a negative
or moot impact on child labour due to the higher demand for family labour).2
Few evaluations and thus minimal evidence exist on the interaction effects triggered by
bringing together agricultural and social protection programmes (Tirivayi, Knowles and
Davis, 2013). This review discusses the evidence that is currently available from
evaluations that focus on the interaction of agricultural and social protection
interventions. Based on the impact evaluation papers and reports reviewed in this paper,
the mix of agricultural and social protection programmes or interventions for which some
evidence exists can be roughly classified into three groups:3
sustainable livelihoods programmes (SLPs) are single programmes with multiple
components, including both agricultural and social protection interventions.4 This
category corresponds to type 2 under the FAA (i.e. single programmes with fully
integrated interventions that share the same beneficiaries).
complementary programmes (CPs) involving the two sectors are designed and/or
implemented in a somewhat coordinated and/or aligned manner.5 This category is
2 With the term “child labour”, organizations, such as the International Labour Organization, often define
work that deprives children of their childhood, their potential and their dignity, and that is harmful to
physical and mental development. Engagement of children in labour activities can be difficult and
demanding, hazardous and even morally reprehensible. With the survey instruments used to collect the
data for these evaluations, authors did not disentangle the many kinds of work children do and following
economists jargon, they use terms such as child labour child work or engagement of children in family
farming or wage labour interchangeably. Therefore, in this report we also adopt this “economic”
approach to the term child labour. 3 Evaluations of type 1 interventions, i.e., of sector-specific interventions are not included in this review.
For a thorough review of type 1 programmes see Tirivayi, Knowles and Davis, (2013). 4 The most straightforward social protection component of the majority of SLPs relies on the consumption
support component. However, other typical SLP components such as training, coaching and access to social
services can also be classified as classical social protection interventions (e.g. social assistance services)
adapted to the context of the typical SLP beneficiaries: the poorest of the poor with no or very weak links
to formal labour markets. 5 Levels of coordination and alignment are better represented by a continuum that can differ at the design
and implementation phases. Instruments used by governments to ensure coordination or alignment of social

6
a hard version of type 3, in which there is at least a partial (and
intended/coordinated6) overlap of the beneficiaries of both programmes with a
view to boosting synergies between them, such as the PSNP and the HABP in
Ethiopia. Even when there is no overlap at the individual level, some programmes
implemented in the same location could also be classified as CP. This includes,
for example, school feeding programmes that procure food from local smallholder
farmers and provide production support to these farmers (e.g. Purchase from
Africans for Africa and a similar programme in Brazil as well as Bangladesh’s
Public Food Distribution System7).
Overlapping programmes (OPs) partially overlap at the individual/household or
geographical/community level in an unplanned manner. This category is a soft
version of type 3. Evidence from these programmes may suggest ways to improve
coherence between the two types of interventions through coordination and/or
alignment. For instance, impact evaluations of rural credit and/or extension
services in areas/communities where poor and vulnerable people also have access
to social transfers, but not in a coordinated manner, may offer some evidence on
the added value of aligning and/or coordinating the interventions (e.g. PRONAF,
which provides credit for smallholder farmers, and Bolsa Familia in Brazil and
rural credit and Juntos’s social transfer in Peru).
The papers and reports reviewed in this report concern the impacts of programmes that:
(i) were intentionally combined, implying some degree of coordination or (ii) were
implemented in the same geographic area, sometimes covering the same beneficiaries,
but without any attempt at coordination. The first type includes the SLP category
described above, which brings together different components of agriculture and social
protection into a single intervention and the CP category, which attempts to coordinate
and/or align some aspects of different programmes without including them in a single
intervention. The second type – which falls into the OP category – comprises programmes
where there is no coordination regardless of the existence of some overlap among
beneficiaries or geographical areas covered by the interventions, which usually have
different objectives and target criteria.
protection and agricultural interventions vary considerably. In some cases, combined interventions may
include anti-poverty strategies and/or integrated packages that involve a large number of interventions in
the same geographical area implemented by different agencies and not necessarily covering the same
beneficiaries. In other cases, the CP may comprise a small set of rural development interventions that are
tailored - or made available - to beneficiaries from social protection programmes. Incentive-based designs
that earmark funds and/or give social protection beneficiaries preferential access to productive
complementary programmes are examples of a higher level of coordination/alignment. 6 Note that coordination can also occur at other levels as well. However, for the purpose of evaluations,
target group overlapping is a crucial requirement to provide empirical evidence of synergistic effects for
household-level outcomes, as will be discussed in further detail in the last part of this introduction. 7 Despite their policy relevance, there are no impact evaluations for aligned programmes such as PAA
Africa, PAA in Brazil and the two components of Bangladesh’s Public Food Distribution system. As will
be highlighted later, these are major gaps in terms of areas to be covered by robust impact evaluations.
Complementary programmes that bring together livelihood support plus classical supply-side agricultural
support – extension services, credit and access to improved seeds – are more likely to have robust
evaluations.

7
1.3 Conceptual framework: pathways of impact
This review draws on the theory of change on the relationship between agriculture and
social protection developed by Tirivayi, Knowles and Davis, (2013). This theory of
change looks at how social protection interventions aimed at alleviating poverty and
vulnerability can impact agriculture and how agricultural interventions affect risks,
vulnerability and the income-generating capacities of poor people, particularly in rural
areas. It is based on the agricultural household model (Singh, Squire and Strauss, 1986).
The central assumption of this model is that within the context of incomplete or poorly
functioning markets, consumption and production decisions are made jointly by rural
households. Exposure to risks leads them to opt for low-risk/low-return activities, while
market failures, liquidity and credit constraints hinder human capital investments and a
lack of skills and knowledge on agricultural technologies, inputs and factors of production
limits agricultural production. Agricultural and social protection interventions can play a
vital role in alleviating these constraints and mitigating these risks for rural households
through two key pathways.
As shown in Figure 1 and described below, agricultural and social protection
interventions may affect households by alleviating credit, savings and liquidity
constraints and providing certainty. A third pathway specific to agricultural interventions
enables access to technology, knowledge, inputs and factors of production.
Alleviation of credit, savings and liquidity constraints: Social protection
interventions, such as cash transfers, can improve savings and alleviate credit
constraints (Barrientos, 2012). They can also improve liquidity, which may
encourage risk-taking and productive investments such as the purchase of inputs
(Dercon, 1996). Agricultural interventions, such as microcredit and input
subsidies, may also alleviate credit constraints and enable investments that can
improve farm productivity and ultimately raise household welfare.
Certainty: Predictable social protection interventions can increase certainty and
security, acting as insurance against risks, particularly those related to weather
shocks in contexts where small family farmers lack formal insurance. Agricultural
interventions (e.g. irrigation, crop insurance) can also increase certainty and
security and allow rural households to invest in high-risk and high-return crops.
Increased access to technology, knowledge, inputs and factors of production:
Productivity-enhancing agricultural interventions, such as input subsidies and
grants, input technologies (e.g. seed varieties, fertilizer), natural resource
management techniques, land tenure reforms, marketing arrangements and
macroeconomic reforms (e.g. price liberalization), can all boost production and
income. Similar results can be achieved through investment in infrastructure. In
addition, institutional/government procurement can increase access to local
markets and market information, and farmer field schools and extension services

8
enhance access to agricultural knowledge and skills, which may also increase
production and income and reduce vulnerability.
Figure 1 also shows that the pathways of impact for agricultural and social protection
interventions trigger behavioural responses that determine the direction and magnitude of
impacts. These include spending behaviour, risk-taking behaviour and intra-household
resource allocation. First, households participating in agricultural and social protection
interventions that provide predictable income transfers will have the flexibility and
confidence to spend more on agricultural assets. Second, households may avoid taking
risky actions that undermine longer-term livelihoods sustainability, such as distress asset
sales, school dropout, child labour and food rationing. Finally, both agricultural and social
protection interventions trigger changes in intra-household resource allocation, for
example, either by decreasing adult labour supply (due to the income effect) or by
increasing it as a result of new investments in on-farm and non-farm ventures and better
nutrition.

9
Figure 1 Interactions between agriculture and social protection
Source: Tirivayi, Knowles and Davis (2013).
Social
protection
interventions:
Cash transfers;
Food for work;
Public works;
School Feeding.
Agricultural
programs:
Land reform;
Extension;
Irrigation;
NRM;
Input;
Technology;
Marketing;
Credit;
Investment
grant;
Infrastructure
Constraints to consumption:
Weak or missing credit and
insurance markets;
Inability to smooth consumption;
Savings, and liquidity constraints;
Risk aversion;
Poverty
Rural Household
Constraints to production: Lack of knowledge (farming,
markets);
Uncertainty from covariate risk;
Soil fertility, lack of inputs, factors
of production;
Weak or missing credit and
insurance markets;
Savings and liquidity constraints;
Risk aversion
Poverty
Access to technology,
knowledge, inputs and
factors of production
Certainty
Alleviation of credit,
liquidity, savings
constraints
Certainty
Multiplier effects:
Demand/trade of
goods/services,
Spillover effects to
ineligible rural
households;
Ag- lower food prices
SP- change in food
prices;
Boost in agric and non
agricultural labour
markets, ↑ wages;
Changes in social
networks
Social protection
Reduce vulnerability (risks,
shocks):
Income (revenues and labour);
Consumption, nutrition and food
security;
Durable asset accumulation;
↓ Negative risk coping strategies
Income generating capabilities:
High risk/return investments
Human capital accumulation
Labour allocation
Behavioural
response:
Spending;
Investment;
Risk taking; Intrahousehold
resource
allocation
Agricultural productivity:
Direct farm production
Agricultural asset accumulation;
Change in use of inputs and
techniques;
Labour allocation;
Crop and livestock output,
diversification
Indirect
Human capital accumulation;
Off farm investments;
↓ Negative risk coping strategies
Gender
Agroclimate
Economic context
(prices, infrastructure,
markets)
Social context
(community, culture)
Services
Programme design
Mediating Factors
Notes
Ag, Agric-agriculture SP-social protection
SCT – social cash transfers
NRM-Natural resources management
↓ decrease ↑ increase
Pathway
Outcomes Local economy effects

10
1.4 Evaluation challenges and research gaps
The synergistic effect of bringing together agricultural and social protection interventions is
multiplicative rather simply the sum of the positive impacts that each programme can have
in isolation. Thus, this effect can be thought of as an interaction terms of a linear regression
framework that makes a positive contribution to the outcome by either boosting positive
outcomes or by mitigating negative ones. This definition is important since this review
focuses on the results of quantitative impact evaluations of agricultural and social protection
interventions with very different evaluation designs. In most cases, despite assessing
combined interventions, the evaluations do not try to measure the interaction effects but
focus solely on the overall impact, as in the case of most SLP impact evaluations, or just
consider the additional impact of introducing a CP.8 Thus, a major challenge facing the
review team was the lack of evaluations whose design allowed disentangling and
understanding the multiplicative and additive effects of agricultural and social protection
interventions.
In the case of SLPs, where experimental designs9 have been more prevalent, the same clients
benefit from agricultural interventions and social protection transfers and almost none of the
evaluations considers the effect of each component (e.g. consumption support, asset
transfers, training, coaching, etc.) or assesses the existence of synergies between them. As
for CPs, the degree of individual/household overlap varies considerably depending on the
strategy used to implement them, e.g. concentrating complementary programmes in the same
geographic areas; giving the beneficiaries of one programme preferential access to the other,
etc.
Most evaluations of CPs tend to focus on the main sectoral programme, thus the outcome of
interest ends up being either the impact on social protection beneficiaries of participating in
an agricultural intervention or the impact of participating in a social protection programme
for beneficiaries of rural development or agriculture programmes. The capacity to capture
synergistic effects depends largely on the evaluation design allowing the identification of all
relevant treatment groups. In the absence of the conditions to implement an evaluation that
randomizes access to both types of interventions and their overlap, most rely on quasi-
experimental methods10 that sometimes are quite limited in their ability to identify credible
8 In this case, one would estimate the additional impact of the complementary programme on the existing
intervention, but not the impact of the complementary programme alone. Thus, one cannot be sure about the
existence of a multiplicative (synergistic) effect as opposed to simply an additive one. 9 Experimental design consists in randomly assigning eligible units for a programme or intervention into a
treated/beneficiary group that will receive the treatment immediately, and a control/comparison group that
will receive the programme at a later stage (after the end of the evaluation) or that will never receive the
treatment. This methodology, also known as randomized control trial (RCT), is the most robust evaluation
methodology as it generates treated and control groups that, on average, will have the same observed and
non-observed characteristics. This procedure solves the problem of selection bias that plagues most non-
experimental evaluations, allowing the evaluator to estimate the best counterfactual in the absence of the
programme and hence the actual effect of an intervention. 10 Quasi-experimental methods are used when it is impossible to randomize the eligible population into treated
and control groups. It intends to find a comparison group that is as similar as possible to the treated group and
uses econometric techniques (e.g. matching methods, difference-in-differences, fixed and random effects
models, instrumental variables, regression discontinuity design, etc.) to control for selection bias and estimates
a credible counterfactual to measure the impacts of a programme.
Notes Ag, Agric-agriculture
SP-social protection
SCT – social cash transfers NRM-Natural resources management
↓ decrease ↑ increase
Notes Ag, Agric-agriculture
SP-social protection
SCT – social cash transfers NRM-Natural resources management
↓ decrease ↑ increase
Notes Ag, Agric-agriculture
SP-social protection
SCT – social cash transfers NRM-Natural resources management
↓ decrease ↑ increase

11
control groups and to account for all treatment possibilities (e.g. social protection only,
agricultural intervention only, both social protection and agricultural interventions).
In order to identify control groups, evaluators oversample potential beneficiaries of both
programmes before conducting evaluation surveys with all households in treated areas. In
other cases, treated households are sampled from a list of actual beneficiaries and a
comparison group is identified among the non-treated in the same location or in similar
locations where the programmes have not been implemented using matching techniques.
Often, evaluators use the administrative records from the main sectoral programme to select
a sample of the treated group and the overlap with the complementary programme is
determined by the survey response of the sample. In a few fortunate cases, evaluators can
even merge administrative records of the different programmes, identifying all treated
groups (including the overlap) at the evaluation and sampling design phase, which greatly
enhances the quality of the evaluation.
Evaluations of OPs tend to be based on secondary data only (e.g. agricultural censuses or
other regular multipurpose surveys), which sometimes lack a proper baseline and, in most
cases, cover too limited a set of outcome indicators to be informative about the impacts of
agricultural and social protection programmes.
Another major issue is that the evaluations available to the review team tend to concentrate
mostly on agricultural and social protection interventions that overlap at the
household/individual level rather than at the community/geographical area. Thus,
community and/or local economy outcomes are rarely considered. The ability of evaluations
to look at these outcomes is further limited by a focus on the average treatment effect on the
treated (or on the intention to treat11), which means that in many cases the evaluation surveys
only collect data from a sample of eligible households (treated and control groups). When
data on non-eligible households is gathered, it is used to assess the targeting performance12
of the programmes rather than to evaluate spillover effects and/or externalities on non-
eligible households and/or in the local economy.
To our knowledge, there are no impact evaluations of CP or OP agricultural and social
protection programmes that target different populations in the same location. Designing and
implementing an evaluation of this nature seems far more challenging than the usual
assessment of combined programmes that target the same population. Such an approach
would require randomizing geographical areas that access (or not) some of the aligned
programmes and/or introducing the programmes in different areas, which might be difficult
to achieve when different sectoral ministries/organizations are involved. Moreover, it would
be necessary to collect detailed data on business activities in the communities with questions
that go beyond the standard household survey. Thus, the impacts of aligned programmes that
affect different target populations in the same community (e.g. agricultural interventions for
11 The intention to treat is based on the ex ante treatment group assignment, regardless of actual take-up or
compliance rates or ex post treatment status. 12 Usually non-eligible households are only part of the evaluation sampling in the baseline survey, since their
data will only be used to assess targeting performance. Given budget restrictions it would not make sense to
interview them in the follow-up surveys if the focus of the evaluation is the average effect of the programme
on the treated.

12
better-off farmers and public works and social cash transfers for the poorest) are mostly not
covered in the literature, leaving many questions unanswered about the local economic and
community-level impacts of SLP, CP and OP categories of intervention.
A methodological alternative to gauge the impact of CPs or even OPs is to link computable
general equilibrium models (CGE) with impact evaluation surveys in which it is possible to
establish the economic interaction between eligible (treated and control) and non-eligible
households in the intervention areas. Taylor et al. (2014a) explain how the Local Economy-
wide Impact Evaluation (LEWIE) methodology has been used to evaluate the local economic
impact of several social cash transfers programmes (single interventions) in sub-Saharan
Africa. This methodology uses the information collected through the baseline surveys for
impact evaluation. This provides the LEWIE with the micro-level focus necessary to
simulate the impacts of social transfers in the local economy. The results of these evaluations
show that most spillover benefits accrue to non-eligible households, which have more access
to productive assets and are better connected to markets, enabling them to benefit from the
multiplier effects of the injection of cash .13 Thome et al. (2016) argue that differences in the
nominal multiplier effect of social cash transfers across countries or even within a country
are largely due to targeting, expenditure patterns, business composition, production function
and market integration. Nevertheless, it is the local supply elasticity, (i.e., the capacity of the
local supply to respond to expansion in demand) that mostly determines whether inflationary
pressures will erode the real value of the transfers, minimizing the local-economy multiplier
effect in the short run.
These considerations highlight the importance of agricultural interventions that aim at
increasing the capacity of better-off farmers and traders (who are not eligible for social
protection programmes) to ensure a swift supply-side response to the increased demand
triggered by social cash transfers, without overlooking other interventions that could enable
worse-off beneficiary farmers and traders to accumulate productive assets so that they can
also profit from spillover effects of the social cash transfers.14
One of the few attempts to look at this issue used a macro-level CGE model for Cambodia
developed by Levy and Robinson (2014) to simulate the impact of a large social protection
intervention in a small economy with market imperfections and weak market integration
between rural and urban areas. They found that even if beneficiaries invest part of the transfer
in productive activities and assets, the cash transfer intervention would not be able to
overcome the distortion of domestic markets (e.g. price increases, particularly for agriculture
produce). However, combining large cash transfers with productive investments in
agriculture (e.g. rural infrastructure, irrigation and inputs) reduces the inflationary effects of
the cash transfer, as food-crop production increases and imports are reduced, suggesting
13 See Kagin et al. (2014) for Ethiopia; Thome et al. (2014) for Ghana; Taylor et al. (2013) for Kenya; Taylor
et al. (2014b) for Lesotho, Thome et al. (2015) for Malawi; and Taylor et al. (2014c) for Zimbabwe. 14 The implementation of SLPs in tandem with social cash transfers has become a recent trend largely inspired
by the positive evaluations of the Challenge the Frontiers of Poverty Reduction (CFPR) methodology
developed by the Bangladesh NGO BRAC. The idea is that social cash transfers work as the consumption
support component of the SLP, thus turning it into a CP type of combination. This approach has been piloted
in Ethiopia and Peru as will be discussed elsewhere in this paper.

13
strong complementarities between both approaches. Applying this type of analysis to
multiple interventions using a LEWIE model seems a promising avenue to evaluating CP
and OP interventions that do not (necessarily) target the same population and whose impact
would be more relevant (and visible) at the local economy than at the macro-level.15
1.5 Outline of the paper
The section that follows describes the methodology used to select the studies reviewed in
this paper. The third section of the paper assesses the main characteristics of the selected
studies with regard to their design and methodological details, including a discussion on the
outcomes that are relevant for this review. The fourth section discusses the main
characteristics of the programme combinations being assessed. The fifth section presents and
discusses the main results of the impact evaluations regarding the outcomes of interest. The
conclusion summarizes the main findings and proposes a research agenda that could help to
identify the synergistic effects of agricultural and social protection interventions.
15 This is particularly important in the African context, given the low levels of coverage of the social protection
programme, especially when compared to the LAC social transfers.

14
2. Methodology of the literature review
2.1 Search strategy
The literature search for this review blended three strategies: a snowball approach, a
bibliographic database search and a hand search. The snowball approach involved consulting
key experts with experience in evaluating agricultural and social protection interventions
and knowledgeable about papers or evaluation reports concerned with the combined effect
of both types of interventions. Further, we screened the reports suggested by these experts
to identify additional papers that would be helpful for the review. The bibliographic database
search involved applying pre-defined search strings and inclusion/exclusion criteria to
Google Scholar and the JSTOR academic journal database, as well as to selected journals,
namely the Journal of Development Effectiveness, Journal of Development Studies, and
Economic Development and Cultural Change. We used the same approach to search the
websites of relevant institutions in this field (e.g. FAO/PtoP, IFAD, WFP, IFPRI, ODI, IDS,
IPC-IG, World Bank, IDRC, J-PAL, 3ie, OPM and IDRC).
The search protocol allowed for the inclusion of papers and evaluation reports produced after
1990 and written in English, Spanish, Portuguese or French. However, no paper/report
written in Portuguese or French was selected after applying the other filters described below.
In order to be selected for review, impact evaluations had to be based on robust impact
evaluation methodologies with an adequate identification strategy, including the definition
of a clear comparison group and a counterfactual. Accepted methodologies included both
experimental (randomized control trials) and non-experimental (e.g. difference-in-
differences, propensity score matching, regression discontinuity design, generalized
propensity score and instrumental variables) designs.
The search strings were classified around the following categories:16
populations of interest: rural poor and vulnerable populations living in Latin America
and the Caribbean, Asia, Africa and Eastern Europe;17
agricultural and social protection interventions:
o agricultural interventions: rural development, access to markets, natural
resources management, distribution of improved seeds, fertilizer subsidies
(vouchers), extension services, subsidized credit, investment grants, asset
(livestock) transfers and homestead gardening;18
o social protection interventions: social cash transfers (including CCTs, CTs
and social pensions) and public works, as well as other broad categories that
are not always classified as social protection such as asset transfers,
16 Table A.0 lists the search strings per categories in the Appendix 17 No paper was identified for the Eastern European region. 18 Note that besides traditional agricultural interventions such as rural credit and extension services, we also
included components that are at the core of livelihoods and rural women empowerment interventions such as
homestead gardening and livestock transfers. For the purpose of this review these are classified as agricultural
interventions.

15
home-grown school feeding programmes, microfinance and weather-based
crop insurance;
outcomes of interest: income, expenditure/consumption, asset or wealth indices,
poverty, purchase and use of inputs such as fertilizers, investment in productive
assets including land and livestock, labour market participation and occupational
choices, hours of work, private transfers, sources of income, food security and
indicators for involvement in social networks and social participation.
2.2 Search findings
The snowball approach and the manual-search of selected Web sites yielded most of the
publications analysed here. The search revealed few papers that looked specifically at the
interaction between agricultural interventions and social protection programmes.
Moreover, as shown in Table A.1 in the appendix to this review, more than 50 percent of the
evaluation reports/papers considered in this review were conducted during 2015 or 2016.
The oldest evaluation dates from 2009. Thus, many of the papers reviewed are still in the
format of evaluation reports, working papers or forthcoming book chapters or papers in peer-
reviewed journals and/or chapters in recently launched books. It is also important to
highlight that this review does not claim to be exhaustive and some relevant papers may have
escaped the searches described above.
Expert feedback has confirmed the review team’s initial finding that literature on the impact
evaluation of combined agricultural and social protection interventions is thin. Two main
factors may explain why. First, while programmes in the agricultural and social protection
sectors have similar goals in terms of reducing hunger and poverty, they tend to use different
strategic approaches and to cover somewhat different target populations in rural areas.
Agricultural interventions tend to focus more on commercial farmers while social protection
programmes focus on vulnerable subsistence farmers. The institutional partners in these
sectors differ as well. Agricultural ministries are prone to coordinate their policies and
programmes with agencies responsible for trade, land and natural resources whereas
ministries responsible for social protection programmes are more likely to liaise with social
sector agencies in charge of health and education programmes (Slater et al., 2016).
Second, even when sectoral programmes are designed and implemented in a coordinated
manner, robust impact evaluations (particularly experimental ones) are rarely included at the
design phase. Moreover, challenges around the implementation of the combined programme
components may jeopardize the impact evaluation design. The risks of contamination of the
comparison group and low uptake and/or drop-out rates among beneficiaries may threaten
the internal and external validity of the evaluations. It is not surprising, therefore, that most
experimental and even some quasi-experimental evaluation strategies actually report
“intention-to-treat” estimates (ITT) rather than the “treatment-on-treated” estimates. A lack
of coordination at the programming level between different sectoral implementing agencies
can partially explain why there are fewer experimental evaluations to estimate the impact of
combined programmes (CP and OP types).

16
The literature search identified 35 papers, book chapter or reports that assess the impact of
combined agricultural and social protection interventions using acceptable identifying
assumptions and impact evaluation methodologies.19 However, the number of evaluations
covered in these products is actually larger, as one of the papers describes evaluation results
from pilot programmes that took place in six different countries across Asia, Africa and Latin
America. Treating each evaluation discussed there as an individual case yields 40
evaluations. At least one of the evaluations described in that paper was also reported in a
standalone working paper20 that was also identified in the search. In addition, there were
cases of two versions of the same paper found in the search: a final journal version and a
previous working paper version. In broad terms, the published papers differ slightly from the
working paper versions. The working papers tend to cover a larger set of indicators while
the journal articles report additional robustness checks based on the use of alternative
methodologies.21
19 An identifying assumption is an assumption made about the data generating process that allows the
researcher to draw causal inference. 20 Banerjee et al. (2011) discuss the main findings of the evaluation of the Targeting the Hard-Core Poor
programme implemented by the Bandhan NGO in West Bengal India. The results of the evaluation are also
included in Banerjee et al. (2015), thus the earlier paper is not included as a separate evaluation in this review.
Bandiera et al. (2016)’s evaluation of the CFPR in Bangladesh is not counted as an additional evaluation, but
as it looks at different outcomes in relation to Bandiera et al. (2013), it is counted as a different paper. For
example, it includes other dimensions such as spillover effects and reframes some outcomes, particularly with
a view to comparing their results with those reported in Banerjee et al. (2015). We will report on both papers
during the discussions, but will count them as a single evaluation as methodology and database are actually the
same. 21 Das and Misha (2010) and Raza, Das and Misha (2012) are basically the same evaluation, which differ with
regard to the outcomes covered – there is a more comprehensive set in the first paper – and the methodologies
used – difference-in-differences in the first paper and difference-in-differences with propensity score matching
in the second. Emran, Robano and Smith (2009) and Emran, Robano and Smith (2014) are also the same
evaluation reported in two different papers. Emran, Robano and Smith (2014) was published in the Economic
Development and Cultural Change Journal whereas Emran, Robano and Smith (2009) corresponds to its
working paper version (Department of Economics of George Washington University). The only major
difference is that the working paper version has a quantile analysis of the impact of the CFPR Phase 1 on
income, which is not reported in the journal version. Results for these papers will be reported jointly, hence
they will not be counted twice.

17
3. Which combined programmes have been evaluated?
In this section, we present the selected papers and reports and describe the main features of
the evaluated programmes based on the three categories presented in the introduction.
We have opted to use a regional classification to describe the programmes due to the strong
association between regions and certain categories of programmes and instruments. As per
the selected evidence, in Asia, SLPs seem to be most prevalent whereas in Latin America
and the Caribbean, CPs that focus on CCT programmes and productive inclusion
interventions seem to dominate. In Africa, there is a more balanced mix of programme
categories with a somewhat smaller number of evaluations.
3.1 Geographical distribution of evaluations
Details on the regional and country distribution of the 37 evaluations reviewed in this paper
can be found in Table 1. About 46 percent of the evaluations (17) are based on programmes
in Asia, 30 percent (11) in Latin America and 24 percent from Africa (9).
The overrepresentation of Asian programmes is largely explained by the numerous
evaluations of the Challenging the Frontiers of Poverty Reduction (CFPR) programme of
the Bangladeshi non-governmental organization BRAC. The key objective of CFPR is to
graduate rural families from extreme poverty and prepare them to participate in microfinance
programmes also implemented by BRAC. The CFPR merges agricultural (e.g. productive
asset distribution and training to manage that asset) and social protection interventions
(e.g. cash transfers for consumption-smoothing and access to health services) in a single
programme, making it a typical case for the SLP category.
During its Phase 1 and Phase 2, the CFPR programme had a strong impact evaluation
component largely led by the research division of BRAC.22 The positive results of these
evaluations inspired similar programmes in Bangladesh such as the Chars Livelihoods
Programme (CLP), Enhancing Resilience Plus (ER+) and Food Security for the Ultra Poor
(FSUP). All of these programmes have been included in this review.23 Finally, for this review
we selected the evaluation of the CARE Bangladesh’s SHOUHARDO project undertaken
by Smith et al. (2013). This project consists of multiple interventions targeting maternal
child health and nutrition, women’s empowerment, poverty and food insecurity alleviation,
disaster mitigation response and empowerment of the poor.
22 Evaluations of CFPR Phase 1 selected for this review include Ahmed et al. (2009), Emran, Robano and
Smith (2014) Raza, Das and Misha (2012), Krishna, Poghosyan and Das (2010) and Misha et al. (2014).
Evaluations of CFPR Phase 2 used in this review include Raza and Ara (2012) and Bandiera et al. (2013). 23 HTPSE Limited (2011), Hernandez et al. (2015) and BDI (2012) have evaluated CLP Phase 1, the ER+, and
the FSUP, respectively.
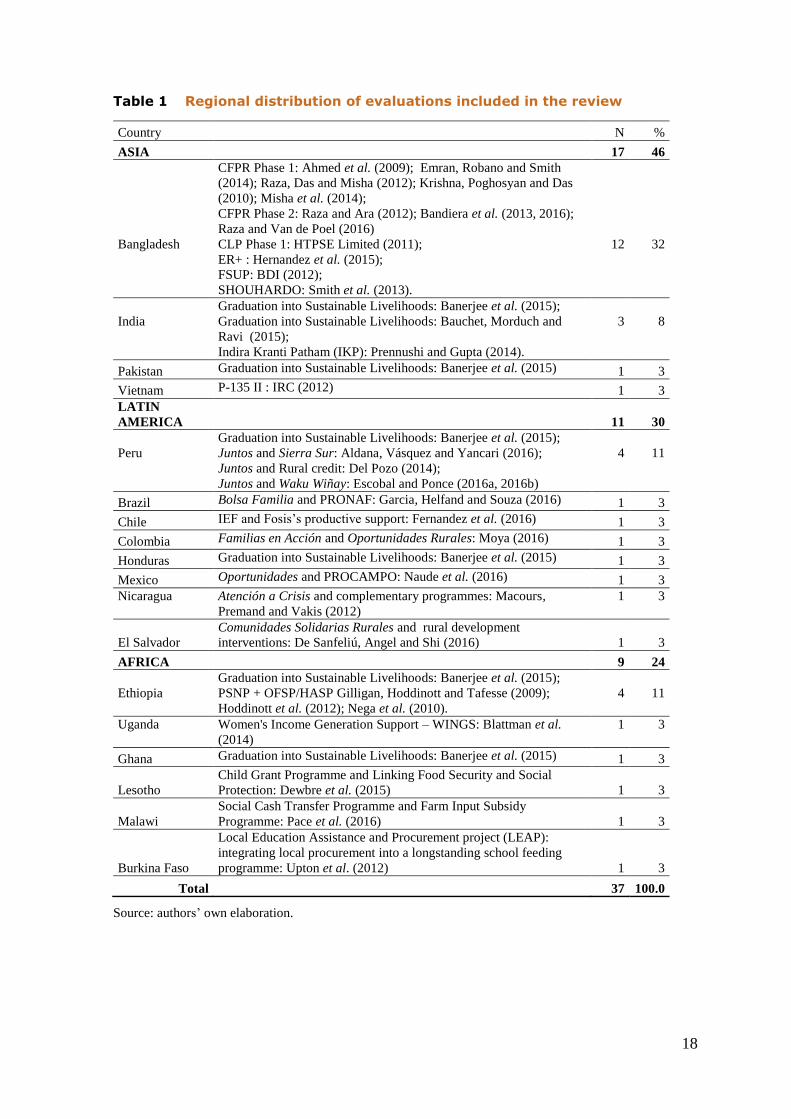
18
Table 1 Regional distribution of evaluations included in the review
Country N %
ASIA 17 46
Bangladesh
CFPR Phase 1: Ahmed et al. (2009); Emran, Robano and Smith
(2014); Raza, Das and Misha (2012); Krishna, Poghosyan and Das
(2010); Misha et al. (2014);
CFPR Phase 2: Raza and Ara (2012); Bandiera et al. (2013, 2016);
Raza and Van de Poel (2016)
CLP Phase 1: HTPSE Limited (2011);
ER+ : Hernandez et al. (2015);
FSUP: BDI (2012);
SHOUHARDO: Smith et al. (2013).
12
32
India
Graduation into Sustainable Livelihoods: Banerjee et al. (2015);
Graduation into Sustainable Livelihoods: Bauchet, Morduch and
Ravi (2015);
Indira Kranti Patham (IKP): Prennushi and Gupta (2014).
3
8
Pakistan Graduation into Sustainable Livelihoods: Banerjee et al. (2015) 1 3
Vietnam P-135 II : IRC (2012) 1 3
LATIN
AMERICA
11 30
Peru
Graduation into Sustainable Livelihoods: Banerjee et al. (2015);
Juntos and Sierra Sur: Aldana, Vásquez and Yancari (2016);
Juntos and Rural credit: Del Pozo (2014);
Juntos and Waku Wiñay: Escobal and Ponce (2016a, 2016b)
4
11
Brazil Bolsa Familia and PRONAF: Garcia, Helfand and Souza (2016) 1 3
Chile IEF and Fosis’s productive support: Fernandez et al. (2016) 1 3
Colombia Familias en Acción and Oportunidades Rurales: Moya (2016) 1 3
Honduras Graduation into Sustainable Livelihoods: Banerjee et al. (2015) 1 3
Mexico Oportunidades and PROCAMPO: Naude et al. (2016) 1 3
Nicaragua
Atención a Crisis and complementary programmes: Macours,
Premand and Vakis (2012)
1
3
El Salvador
Comunidades Solidarias Rurales and rural development
interventions: De Sanfeliú, Angel and Shi (2016) 1 3
AFRICA 9 24
Ethiopia
Graduation into Sustainable Livelihoods: Banerjee et al. (2015);
PSNP + OFSP/HASP Gilligan, Hoddinott and Tafesse (2009);
Hoddinott et al. (2012); Nega et al. (2010).
4
11
Uganda
Women's Income Generation Support – WINGS: Blattman et al.
(2014)
1
3
Ghana Graduation into Sustainable Livelihoods: Banerjee et al. (2015) 1 3
Lesotho
Child Grant Programme and Linking Food Security and Social
Protection: Dewbre et al. (2015) 1 3
Malawi
Social Cash Transfer Programme and Farm Input Subsidy
Programme: Pace et al. (2016) 1 3
Burkina Faso
Local Education Assistance and Procurement project (LEAP):
integrating local procurement into a longstanding school feeding
programme: Upton et al. (2012) 1 3
Total 37 100.0
Source: authors’ own elaboration.

19
The BRAC CFPR intervention has also influenced programmes in other parts of the world.
For the purposes of this review, the evaluation of the pilots of the Graduation into Sustainable
Livelihoods programme supported by CGAP and the Ford Foundation24 are particularly
relevant. Two out of three evaluations for India are based on these pilots, one of which is
reported in Banerjee et al. (2015) and the other in Bauchet, Morduch and Ravi (2015). The
third evaluation, Prennushi and Gupta (2014), concerns the impacts of the Indira Kranti
Patham (IKP) programme in Andhra Pradesh, a women’s empowerment and rural
livelihoods multiple intervention programme. IRC (2012) evaluates the P-135 II, a poverty
reduction programme that targeted ethnic minorities and isolated areas in Vietnam. Finally,
another pilot of the Graduation into Sustainable Livelihoods project in Pakistan has its results
discussed in Banerjee et al. (2015).
Four out of 11 evaluations set in Latin American and the Caribbean countries (LAC) are
concentrated on Peru.25 This is largely explained by the high priority given by the Peruvian
government to improving coordination between social protection programmes, in particular
its conditional cash transfer (CCT) programme, Juntos, which is only implemented in rural
districts, and a range of economic inclusion programmes with a strong focus on rural
development and entrepreneurship. Other evaluations of the combined effects of CCTs and
agricultural interventions are available for Brazil, Chile, Colombia, El Salvador, Mexico and
Nicaragua.
It is worth noting that six of the LAC evaluations relate to the IFAD-supported Sinergias
Rurales (Rural Synergies) project (http://www.sinergiasrurales.info/) whose research
component aims to evaluate synergies between CCT programmes and rural development
programmes that target poor family farmers.26 Two evaluations come from Nicaragua, where
Macours, Premand and Vakis (2012) studied the combination of a CCT programme
(Atención a Crisis) with two alternative “productive” interventions, namely, investment
grants and training, and one evaluation comes from the Honduras with another pilot of the
Graduation into Sustainable Livelihoods reported in Banerjee et al. (2015).
Finally, most available evaluations in Africa focus on Ethiopia’s Productive Safety Net
Programme (PSNP) and its links with agricultural interventions, such as the Other Food
Security Programme (OFSP) and Household Asset Building Programme (HABP). Besides
the four evaluations from Ethiopia,27 another five evaluations for African countries
24 For more information on these pilots, see http://www.microfinancegateway.org/topics/graduation-
sustainable-livelihoods. 25 Aldana, Vásquez and Yancari (2016) and Escobal and Ponce (2016b) assess CP combinations whereas Del
Pozo (2014) assesses an OP. The fourth evaluation is one of the pilots reported in Banerjee et al. (2015), thus
an SLP combination. All evaluations from Peru involved the CCT programme Juntos on the social protection
side. 26 Garcia, Helfand and Souza (2016) for Brazil, Naude et al. (2016) for Mexico and De Sanfeliú et al. (2016)
evaluate programme combinations that fall into the OP category, whereas Aldana, Vásquez and Yancari (2016)
for Peru; Moya (2016) for Colombia, and Fernandez et al. (2016) for Chile assess CP combinations. 27 Nega et al. (2010), Gilligan, Hoddinott and Tafesse (2009) and Hoddinott et al. (2012) looked at the impacts
of the public work components of the PSNP combined with agricultural interventions (OFSP/HABP). Banerjee
et al. (2015) reported on the results of the pilot Graduation into Sustainable Livelihoods project that in the case
of Ethiopia was implemented among PNSP beneficiaries.

20
were selected for review. Blattman et al. (2014) look at a sustainable livelihoods programme
in Uganda meant to diversify the sources of income of the young rural population, with a
focus on young women. Banerjee et al. (2015) report the results of the Ghana pilot of the
Graduation into Sustainable Livelihoods programme. Dewbre et al. (2015) present the
results of an evaluation of the joint implementation of the Linking Food Security and Social
Protection programme (LFSSP), which provided training on homestead gardening and free
vegetable inputs, and the Child Grants Programme (CGP), a social cash transfer, in Lesotho.
Pace et al. (2016) look at the synergies between the Social Cash Transfer Programme (SCTP)
and the Farm Input Subsidy Programme (FISP) in Malawi. Upton et al. (2012)28 look at the
impact of local food procurement from smallholder farmers linked to a long running school
feeding programme in Burkina Faso.
In the next section of the review, we offer an overview of the combined programmes assessed
in the 35 evaluation papers and reports, highlighting the agricultural and social protection
components of these programmes as well as the coherence of the programme design29.
3.2 Programmes that combine agricultural and social protection
interventions in Asia
Table 2 shows that the agricultural and social protection interventions in Asia selected for
this review are dominated by the SLP category. The CFPR model developed by BRAC30 to
support the livelihoods of the ultra-poor in rural Bangladesh can be singled out as the major
source of inspiration for combined programmes in the region. This model consists of a
24-month intervention targeted at extremely poor but able-bodied women, mostly from rural
areas. Beneficiaries are identified among the ultra-poor through a community-based
participatory process based on wealth rankings and further refined through clear inclusion
and exclusion criteria.31 The CFPR is a single programme with multiple components that
aims to prepare ultra-poor women to have sustainable livelihoods and, after graduating from
the programme, to benefit from microcredit interventions also developed by BRAC.
28 The results reported in this working paper (mimeo) have been published in Harou et al. (2013). The latter
also looks at local procurement in Guatemala but in an emergency context and not linked to a school feeding
programme, thus only the Burkina Faso case study is reported here and for that reason priority was given to
the working paper version. 29 Table A.2 in the appendix depicts the combined programmes, which include both agricultural and social
protection interventions, assessed through the 37 evaluations selected for this review. In addition to the
information presented in the main text, the table includes some key features such as the target population,
number of beneficiaries, implementers and government units involved in the programme. Note that the same
programme may be listed more than once when there is more than one combination assessed by different
evaluations. 30 The CFPR is also known as Targeting the Ultra Poor (TUP) due to the methodology it uses to target ultra-
poor households through participatory wealth ranking. For an overview of the programme and its methodology,
refer to its website: http://tup.brac.net/. 31 The exclusion criteria are: a) lack of able-bodied working age women in the household; b) participation in
microfinance projects; and c) recipient of government benefits; the inclusion criteria are a) ownership of less
than 10 decimals of land (1 decimal = 40.5 m2); b) the main source of income is female begging or working as
domestic servant; c) female-headed household, i.e. no active male adult in the household; d) school-age
children working; and e) no productive or income-generating asset in the household.

21
Table 2 Programmes that combine agricultural and social protection
interventions in Asia
Programme Country Agricultural
intervention
Social
protection
intervention
Category Coordination
CFPR
2002-2006
(Phase 1)
2007-2011
(Phase 2)
Bangladesh
Productive asset
transfer.
Cash transfer
SLP
Fully
coordinated
(single
programme)
Enhancing
Resistance (ER)+
(2011-2013)
Bangladesh
Investment grant
Public works
(ER) and cash
transfer in the
3rd year
SLP and CP
Fully
coordinated.
livelihoods
component as an
add-on to the
public works
programme that
existed before
(ER)
Food Security
for the Ultra
Poor (FSUP)
(2009-2012)
Bangladesh
Investment grant
Cash transfer
SLP
Fully
coordinated
(single
programme)
CLP (Phase 1)
(2004-2010).
Bangladesh
Investment grant
and promotion of
homestead
gardening
Cash transfers;
public works and
health
counseling
SLP and CP
Fully
coordinated
livelihoods
dimension
(plus
infrastructure
development at
community
level)
SHOUHARDO
Project Bangladesh
Homestead
development
(vegetable
production,
livestock, etc.)
and income-
generating
activity
(agriculture and
livestock)
Food assistance
(for pregnant
and nursing
mothers and
children 6-24
months) and
food and cash
for work
CP
High level of
coordination of
multiple and
separate
interventions in
targeted areas
and priority
households
Graduation into
Sustainable
Livelihoods
Pakistan
Asset transfer
Cash transfer
SLP
Fully
coordinated
(single
programme)
Graduation into
Sustainable
Livelihoods
India (Bradhan)
Asset transfer
Cash transfer
SLP
Fully
coordinated
(single
programme)
Graduation into
Sustainable
Livelihoods
India (SKS)
Asset transfer
Cash transfer
SLP
Fully
coordinated
(single
programme)
Intensive training sessions and coaching
Entrepreneurship training and coaching
Entrepreneurship, vocational and disaster
risk management trainings and
nutritional and life skills
training
training and coaching
training and coaching
training and coaching

22
Indira Kranti
Patham +
NREGA
(2004-2008 –
Phase 1)
India
Investment/seed
funds, access to
low-cost credit,
Access to
existing social
safety net
programmes
CP
Some
coordination (but
multiple
programmes for
multiple clients –
demand based)
P135-II Vietnam
Agricultural
support: skills
and training for
ethnic minorities.
It includes
extension
services,
demonstration
models and
distribution of
agricultural
inputs
Access to social
services
CP
Some
coordination
(multiple
interventions in
same
geographical
area)
Source: authors’ own elaboration.
The core components of the CFPR include an asset transfer - mostly of livestock - coupled
with training on how to make this asset a source of regular income and followed by intensive
coaching (frequent visits) to support beneficiaries. The training and coaching components
resemble rural extension services and have been adapted to the profile of the CFPR
beneficiaries, who have very low literacy rates. Training focuses on livestock rearing,
vegetable cultivation and horticulture nursery (See Table A.2 in the Appendix). As such, we
can consider this training an agricultural intervention. However, it can also be seen as
productive support in the form of an active labour market policy,32 a classic social protection
component as much as the temporary cash transfer provided by CFPR (known as
consumption support in the programme design). By giving cash in the hands of the women,
the transfers aim at avoiding the depletion of the assets, as well as promoting access to basic
health care. The CFPR Phase 1 reached around 100 000 beneficiary women from 2002 to
2004 and, during Phase 2, aimed to reach 370 300 women from 2007 to 2011.
The CFPR experience largely inspired three other programmes implemented in Bangladesh:
the Chars Livelihoods programmes (CLP),33 Food Security for the Ultra-Poor (FSUP)34 and
Enhancing Resilience Plus (ER+).35 Unlike CFPR, which did not involve government
institutions in implementation, the CLP and the ER+ involved the Ministry of Local
Government, Rural Development and Cooperatives. In the case of the ER+ and the FSUP,
the World Food Programme (WFP) was a key stakeholder in implementation. There were
32 Training can be seen as a component meant to protect the vulnerable against livelihood risks, and thus can
be also classified as social protection as per the definition presented in the Introduction. 33 For more information about the CLP, see the website: http://clp-bangladesh.org/work/overview/. 34 More information on Food Security for the Ultra-Poor can be found at: http://www.wfp.org/content/wfp-
food-security-ultra-poor-fsup-outcome-survey-report-bangladesh-2012. 35 For more information on the Enhancing Resilience+ programme, go to: http://www.mrfcj.org/pdf/case-
studies/2013-04-16-Bangladesh.pdf.
savings, training in social and economic
skills, as well as on livelihoods
training

23
also financial contributions from several bilateral cooperation agencies to support the
programmes, suggesting that the approach has become somewhat popular in the
development community. For instance, DFID funded the Chars Livelihoods Programme
(CLP) Phase 1, while DFAT (formerly AusAID) funded Phase 2. This review only discusses
the findings of CLP Phase 1, as the evaluation of Phase 2 did not meet the criteria used to
select evaluation papers/reports.
CLP Phase 1 covered 90 684 beneficiaries, only 55 000 of which received the whole
intervention package. Beneficiaries entered the programme in a staggered manner from 2006
to 2009, divided into four entry cohorts. CLP targeted poor and vulnerable families living in
the riverine areas of five districts of Northern Jamuna, Bangladesh. Women were the main
recipients of the 18-month intervention package. This included an investment grant of
around BDT36 13 000-17 000 for the purchase of productive assets, a monthly cash transfer
of BDT 350-600 to smooth consumption over a period of 12 months,37 promotion of
homestead gardening (lifting it above flood level), a public works component, health
counselling and community-level upgrading of water and sanitation.
The FSUP reached 30 000 women in eight upazilas38 in the districts of Sirajganj, Bogra and
Pabna from 2009 to 2012. Beneficiaries received a monthly cash transfer of BDT 500 over
a 24-month period and twice this value during the two months of the lean season. In addition
they also received a BDT 14 000 grant to cover the initial investment in an income-
generating activity such as bull fattening, crop cultivation, poultry or goat rearing.
Beneficiaries also received general training in entrepreneurship skills, followed by
specialized training on their chosen business activity as well as on disaster risk reduction and
nutrition and life skills.
The ER+ built on a previous two-year programme, Enhance Resilience (ER), whose major
components were public works (labour-based activities) and training sessions focusing on
disaster risk reduction. The ER+ component followed the CFPR model, targeting women
that participated in the ER or were wives of male ER beneficiaries. The ER+ consisted of a
12-month intervention that offered group-based entrepreneurial skills training after which
beneficiaries selected an income-generating activity. After their business plan was approved,
they were offered an investment grant of BDT 12 000 and received regular coaching visits.
Over 12 months, the beneficiaries also received a cash transfer of BDT 500 per month. The
ER+ reached 18 000 women from 2011 to 2012.
The influence of the CFPR model reached well beyond Bangladesh, largely due to the
CGAP/Ford Foundation Graduation into Sustainable Livelihoods project. The project
adapted the CFPR model to conduct pilot activities in two sites in India: West Bengal where
the activities were implemented by the NGO Bandhan and reached 512 households; and in
Andhra Pradesh, where they were carried out by SKS, another NGO, and reached 426
36 BDT – Bangladesh Taka (local currency). 37 The consumption support started after the asset transfer was made. 38 Districts in Bangladesh are composed of several upazilas, a smaller administrative unit.

24
households. Both pilots started in 2007.39 A third Asian pilot of the Graduation into
Sustainable Livelihoods project carried out by multiple local NGOs in Pakistan in 2007,
reaching 660 households.40 All of the Asian pilots included the typical components of the
CFPR model: asset transfer, training and coaching and cash transfers for consumption
support.41 One difference from the original model was the greater emphasis placed by the
Asian pilots on savings and financial literacy: a mandatory savings component was added to
the two Indian pilots, for example.42
The key social protection element of the CFPR and CFPR-type projects was consumption
support, in most cases implemented as temporary cash transfers to avoid depletion of the
assets distributed by the projects to beneficiaries. The prevalent components of agricultural
interventions were investment grants (or asset transfers), training and coaching. We note that
training and coaching may also be classified as social protection. For this reason, we have
displayed them as cross-sectoral interventions in in Tables 2, 3 and 4.
A network of 46 NGOs carried out the CARE SHOUHARDO project in four regions of
Bangladesh. The project sought to combine several interventions using a bottom-up method
that aimed at empowering the poorest and most marginalized segments of the population.
Besides agricultural and food security interventions, such as homestead development and
income-generating activities linked to agriculture or livestock, it also had a food assistance
component to meet the objectives of mother and child health nutrition. The food assistance
component also included a food for work and cash for work element. Other components of
the programme were early childhood development, sanitation and infrastructure and
participation in SHOUHARDO groups aimed at empowering beneficiaries. The programme
used both geographical and household targeting. National databases were harnessed to
identify the remote areas of the country most vulnerable to shocks and food insecurity. In
addition, participatory village-level household targeting was based on “well-being” analysis.
This process classified households into four categories: extreme poor, poor, middle class and
rich. The first two categories were eligible for programme interventions, yielding 400 000
households, about 75 percent of the households in the project villages.
The Indira Kranti Pathan (IKP) programme in India, a combined women’s empowerment
and rural livelihoods programme, was scaled-up from 2004 to 2008 by the Government of
Andhra Pradesh to all rural districts in the state and implemented by the Society for the
Elimination of Rural Poverty (SERP). The IKP programme includes a range of interventions
that mostly reach beneficiaries through women’s self-help groups (SHG) or other civil
society organizations that are established on a demand basis. Interventions include incentives
to foster savings, investment/seed funds, access to low-cost credit (linking SHGs to banks),
39 The Bandhan intervention reached 22 595 households (rural and urban) in 2013 while the SKS intervention
was scaled up to reach other 1 700 households in Andhra Pradesh and a similar model in Orissa involved 1 000
households. 40 The pilot was scaled up to cover 3 100 households in 2011; 40 000 households in 2012; and 80 000
households by 2014. 41 Details on the value of the consumptions support and the composition and value of the asset transfer can be
found in Table A.2 in the Appendix. 42
In the Pakistan pilot, beneficiary households were incentivized to save money at home or with Rotating
Savings and Credit Associations (ROSCAs).
25
and training in social and economic skills and livelihoods. Savings seem to have been the
most accessible element of IKP: with about 96 percent of IKP participants reportedly
benefiting, while livelihoods interventions had far lower levels of participation, e.g. input
market component reached only one percent and the output market component two percent
of the beneficiaries (Prennushi and Gupta, 2014).
The P-135 programme in Vietnam was a five-year poverty reduction programme of the
Government of Vietnam that ran from 2006-2010, targeting 1 644 poor and mountain
communes in 45 provinces where most of Vietnam’s ethnic minorities live. The State
Committee for Ethnic Minority Affairs (CEMA) was the lead agency assigned to coordinate
and oversee implementation of P-135, with several ministries participating in different
aspects of the programme. The programme comprised a package of interventions that
included infrastructure development, capacity development, improved access to social
services such as education and healthcare as well as water and sanitation, and agricultural
support. The agricultural support element involved skill building and training through
extension services, demonstration models and distribution of agricultural inputs and other
resources in the programme areas (IRC, 2012).
Compared to the Latin American CPs described in the next section, interventions such as the
IKP and the P-135 did not have classical social protection elements at their core, although
they did ensure access to social services for beneficiaries.43 Nevertheless, the training
component of these programmes have an aspect of social protection since they support the
productive engagement of beneficiaries by building entrepreneurship skills, a common
element of labour market and livelihoods interventions, which are a component of social
protection as discussed previously.
Most of the combined programmes in Asia covered in this review tend to be fully
coordinated, despite the challenges involved in reaching high numbers of beneficiaries
through multiple implementation agencies. Even the government-led CPs seem to have been
relatively successful in coordinating different programme components to benefit the same
population (or geographical area).
3.3 Programmes that combine agricultural and social protection
interventions in Latin America
As shown in Table 3, in almost all of the Latin American programmes selected for this
review, government-led CCTs were the prevalent form of social protection programme.44
CCT programmes have the twin objectives of alleviating poverty in the short term through
cash transfers and breaking the intergenerational cycle of poverty through health, nutrition
and education-related improvements over time. Despite having a common objective, the
implementation, design parameters and coverage of CCTs vary considerably across
43 In the case of IKP, although the integration with NREGA (employment guarantee schemes/public work-
based intervention) was not planned, Prennushi and Gupta (2014) assessed the heterogeneous impact of the
programme for NGREA beneficiaries. 44 The Honduras pilot of the Graduation into Sustainable Livelihoods programme was the only SLP that did
not have a cash transfer component. Its consumption smoothening component to avoid asset depletion consisted
of a one-time food transfer meant to cover the 6-month long lean season. This pilot started in 2009 and it was
implemented by the NGO ODEF.

26
countries. They tend to cover much larger populations and to endure a much longer time
than most of the SLPs reviewed in this review.
Peru and El Salvador’s CCTs do not have national coverage. Juntos in Peru started in 2005
and only covers rural districts, reaching 10 percent of the total population. El Salvador’s
Comunidades Solidaria Rurales (CSR) also began in 2005 and is only implemented in
municipalities with the highest poverty rates, reaching about seven percent of the population.
After peaking in 2010, no additional beneficiaries were incorporated into the CSR
programme. Más Familias en Acción (former Familias en Acción) started in 2001 in
Colombia and targets poor and vulnerable households as well as internally-displaced and
indigenous populations with children under 18 years of age. The programme reaches nine
percent of the Colombian population. Ingreso Etico Familiar (IEF) started in Chile in 2012
building on Chile Solidario, which was launched in 2002. The IEF only reaches the extreme
poor; in 2014 it covered four percent of the country’s population. Beneficiaries enter IEF in
a staggered manner.
Bolsa Familia in Brazil (2003) and Oportunidades (1996) in Mexico have national coverage.
The programmes reach about 25 percent of the total population in both countries.
The Atención a Crisis in Nicaragua was a one-year intervention with a CCT component and
covered only 3 000 families in selected districts, unlike other CCT programmes in the region
that have been continuously implemented, some for more than 15 years. The Nicaragua
programme sought to assist households to diversify their sources of income away from
agriculture, also as a means to make them more resilient to weather shocks.45
Agricultural interventions in the region that complement CCT programmes by design (CPs)
or simply overlap with them (OP) and that have been evaluated include: rural credit (in
Brazil and Peru), extension services and productive support packages based on natural
resources management and access to market interventions (in Colombia, Peru, El Salvador
and Chile) and compensatory unconditional cash transfers (in Mexico). In Nicaragua,
productive investment grants and vocational training served to complement the CCT pilot
programme. Finally there are two pilots of the Graduation into Sustainable Livelihoods
programme (SLP), one in Peru that is somewhat integrated with the Juntos CCT programme
and another in Honduras, that is not integrated with any CCT programme and whose
consumption support is based on food rather than cash transfers.
45 Detailed information about the different programme components, coverage, payment structure, duration, and
graduation rules can be found in the ECLAC database at: http://dds.cepal.org/bdptc/en/.

27
Table 3 Programmes that combine agricultural and social protection
interventions in Latin America
Source: authors’ own elaboration.
Programme Country Agricultural intervention
Social
protection
intervention
Typology Coordination
Juntos and Rural
Credit Peru Rural credit (different types) CCT OP
No coordination (evaluation
based on overlap)
Juntos and Sierra Sur Peru
- Natural resources
management and access to
markets;
- Productive technical
assistance for producer
associations and cooperatives
hired by the associations using
resources from the project.
CCT OP No coordination (evaluation
based on overlap)
Juntos and Haku
Wiñay Peru
- Productive and entrepreneurial
skills, including adoption of
simple and low-cost
technological innovations;
- Productive assets, technical
assistance and training;
- Support to organize and
prepare business plans to
pursue grants for technical
assistance and training.
CCT CP High level of coordination
Graduation into
Sustainable
Livelihoods Peru
Asset transfer
CCT or cash
support
SLP Fully coordinated
Bolsa Familia and
PRONAF Brazil Rural credit CCT OP
No coordination
(evaluation based on overlap)
Graduation into
Sustainable
Livelihoods
Honduras
Asset transfer
Food transfer
SLP Fully coordinated
Oportunidades and
PROCAMPO Mexico
Unconditional cash transfer as
financial compensation for
smallholder farmers for the
Free Trade Agreement of
North-America.
CCT OP No coordination (evaluation
based on overlap)
Comunidades
Solidarias Rurales
and rural development
interventions
El
Salvador
Extension services to improve
production, homestead gardens,
natural resources management
and access to markets.
CCT OP No coordination
(evaluation based on overlap)
Ingreso Etico
Familiar and
productive support
from FOSIS
programmes.
Chile Business support (credit and
training). CCT CP
Some coordination (incentives
to have priority access) – low
coverage though
Familias en Acción
and Oportunidades
Rurales
Colombia
Financial support to farmers’
organizations to purchase
extension services.
CCT CP
Some coordination (incentives
to have priority access) – low
coverage though
Atención a Crisis and
investiment granst and
vocational training
Nicaragua
Investment grant (different
groups received each
component).
CCT (one year
pilot)
CP Fully coordinated
Training and coaching
vocational training
Training and coaching

28
The evaluated LAC programmes show varying degrees of coordination or alignment
between agricultural and social protection interventions. Nicaragua’s one-year pilot
Atención a Crisis combined a CCT intervention with vocational training or an investment
grant in an experimental design in which the components were fully integrated.
Honduras’ and Peru’s Graduation into Sustainable Livelihoods pilots46 were fully
coordinated and implemented as part of an experimental project design.
Both Colombia’s Oportunidades Rurales (OR) and Chile’s entrepreneurship programmes
under FOSIS47 had design-based incentives to ensure the participation of CCT beneficiaries.
The CP programmes gave preferential – or facilitated – access to CCT beneficiaries,
although the complementary interventions were not exclusively targeted to them.48 The OR
started in 2007 with the objective of increasing the ownership of productive assets and social
capital and improving access to financial services among smallholder farmers.
The programme used resources transferred to farmers’ organization (cooperatives and
association) to hire technical assistance in the private sector and to gain access to financial
products (e.g. microinsurance) and information. To be eligible for the OR programme, at
least 20 farmers affiliated with farmer’s organization had to be classified as level 1 or 2 under
the SISBEN classification (SISBEN is a proxy means testing scale to target social
programmes). As Familias en Acción beneficiaries belonged to SISBEN level 1, this would
imply that some of the beneficiaries of the OR programme were very likely to have received
CCTs from FA. Indeed, administrative records show that 40 percent of the farmers that
benefited from OR between 2008 and 2013 were also beneficiaries of the FA CCT
programme (Moya, 2015).
In Chile, the Ministry of Social Development transferred an earmarked budget to FOSIS to
guarantee the supply of the capacity development programme Yo empreendo semilla to
beneficiaries of the IEF. The Yo empreendo semilla programme targeted the unemployed or
those in precarious occupations to help them create a microenterprise to increase their
income. About 80 percent of the beneficiaries of Yo Empreendo Semilla were also IEF
beneficiaries.
Evaluations of Juntos and rural credit programmes (Del Pozo, 2014) and of Juntos and Sierra
Sur (which provides support for natural resources management and access to markets in
target districts) as reported in Aldana, Vásquez and Yancari (2016), provide clear examples
of OPs in which the targeting and implementation strategies focus on similar rural
households or geographical areas. However, this is the result of fortuitous chance and not of
a concerted effort to coordinate or align the interventions. By contrast, the impact of Juntos
and the pilot Haku Wiñay, as reported by Escobal and Ponce (2015, 2016b), refers to the
intentional alignment of programmes, whose implementation agencies, despite being
different, both sit in the Ministry for Social Development and Inclusion. Moreover, the
46 Peru’s pilot was started in 2010 in Cusco by an NGO Asociación Arariwa covering 785 households. There
is no information on its scaling up. 47 FOSIS is the Chilean government agency responsible for financing training programmes, among other
productive support services to beneficiaries of targeted social policies in Chile. 48 This is one of the striking differences between aligned programmes and the single interventions that
characterize the programmes based on sustainable livelihood strategies.

29
financial literacy components49 of the Haku Wiñay are exclusively implemented for Juntos
beneficiaries.
Brazil’s Bolsa Familia and PRONAF (which provides subsidized rural credit for smallholder
farmers), Mexico’s Oportunidades and Procampo (compensatory cash transfers for family
farmers) and El Salvador’s CSR and rural development programmes50 are also typical cases
of OPs that target similar beneficiaries, mostly due to similar eligibility rules. These
programmes are structured without any clear coordination mechanism to facilitate access by
beneficiaries of one intervention to another and/or to align their objectives and operations.
The evaluations of the LAC programmes evinced a clear pattern whereby only pilot
interventions with experimental designs had high levels of coordination. Most of the
government-led agricultural and social protection interventions involving different
implementing agencies did not have a strong evaluation design, jeopardizing the quality of
the evidence that emerged. This illustrates the need for better-designed evaluations, planned
at the very early phases of the interventions and not seen as an ex-post activity. It is also
worth noting that many of the evaluations of the LAC programmes were implemented with
a view to assessing the potential synergies of OPs (e.g. Brazil, Peru - Sierra Sur and rural
credit, Mexico, El Salvador) rather than to evaluate a coherent intervention that combines
both sets of interventions.
3.4 Programmes that combine agricultural and social protection
interventions in Africa
In Africa, there are fewer combined programmes, therefore fewer evaluations were available
for this review. As discussed in the beginning of this section, the interaction between the
PSNP, particularly its public work component, and the agricultural interventions of the
OFSP/HABP in Ethiopia, dominates the African evidence presented in this paper.
The typical agricultural interventions of the HABP include access to credit, agricultural
extension services, technology transfer (e.g. advice on food crop production, cash cropping,
livestock production, and soil and water conservation) and irrigation and water harvesting
schemes. The Ethiopian case has an intermediary level of coordination following the
progressive alignment of the programmes (basically moving from an OP to a CP), somewhat
similar to the approaches adopted in Colombia and Chile where beneficiaries of social
protection programmes were supposed (by design) to have priority access to agricultural
interventions.
According to the survey used in Gilligan, Hoddinott and Tafesse (2009) to evaluate the PSNP
and OFSP, about 32.7 percent of PNSP beneficiaries also received OFSP transfers or
49 Other components include access and adoption of simple and low cost technologies (family production
system component); safe kitchens and safe water storage and management (healthy housing); competitive
grants to fund technical assistance; and training through farmer associations (inclusive rural business). 50 Rural development programmes in El Salvador include productive support (EP) and food and nutritional
security (SAN) interventions. These programmes include itinerant school fields, homestead garden support,
natural resources management, support to farmer associations and access to markets. These interventions are
managed by the Ministry of Agriculture and Livestock (RD).

30
services in 2006. However, the delivery of services was inconsistent and less than ten percent
have been involved in the public works scheme in all three years of the programme as well
as OFSP in both 2006 and 2008. This lack of consistency was largely due to an understaffing
of extension services at the Kebele level.51 The replacement of the OFSP by the HABP was
meant to address this issue by ensuring that each Kebele had at least one development agent
assigned to each area of extension services: crop science, animal husbandry and natural
resources management. In addition, the HABP was supposed to enforce the priority access
of PSNP beneficiaries to its services.
The HABP has delinked credit services from extension services. Credit would be available
through microfinance institutions and the Rural Savings and Credit Cooperative
(RUSACCO). As a result, access to the HABP in 2008 was higher than access to the OFSP
in 2006, particularly in regions with less access in 2006. Increases in access were observed
in virtually all services, including improved seeds (Tigray), credit (Amhara) and water
harvesting (Oromiya) (Hoddinott et al., 2012). Coverage by the PSNP is so high in Ethiopia
that the Graduation into Sustainable Livelihoods pilot project considered additional
consumption support unnecessary given the existence of the food-for-work component of
the PSNP, which covers both treated and control households. Note that no reference to the
OFSP is made in the evaluation of the SLP pilot. Thus, we keep the classification of this
pilot as a pure SLP as we will see later.
Blattman et al. (2014) report the case of the pilot WINGS52 in Uganda. Similar to
Nicaragua’s Atención a Crisis and its complementary interventions, the core objective of the
WINGS SLP interventions was to support young women by diversifying their sources of
income away from agriculture. The project provided an investment grant for non-farm
activities rather than livestock rearing, as per most CFPR-influenced programmes.
Association of Volunteers in International Service (AVSI) - an NGO - implemented WINGS
and fully coordinated all project components.
In Lesotho, the Child Grant Programme (CGP) – an unconditional cash transfer programme
for extremely poor families with children – was linked with a tailored agricultural
intervention, Linking Food Security with Social Protection (LFSSP). The LFSSP provided
training on homestead gardening and food preservation practices with the distribution of
vegetable seeds to households that were eligible for the CGP. The LFSSP was implemented
by FAO in partnership with NGOs and with very little government involvement. Unlike in
Ethiopia, the level of coordination between project components in Uganda and Lesotho was
high by design. As such, the programmes are more SLP than CP as they were designed
specifically for the beneficiaries of the CGP rather than adapting an existing programme in
51 A kebele is the smallest administrative unit in Ethiopia. Groups of neighbouring kebeles are organized into
woredas (or districts), which are further aggregated into zones and then into regions. 52 The Women's Income Generation Support – WINGS – implemented by an NGO in Uganda had a design
very similar to the CFPR. The major difference was in the use of investment grants (rather than asset transfers).
Similar to the evaluations of the Graduation into Sustainable Livelihoods project, the WINGS evaluation also
had an experimental design covering 1 800 beneficiaries in two cohort entries of 900. The late entry cohort was
randomized out for the evaluation of the programme.

31
the agriculture or livelihoods sector. For this reason, we have used both classifications
CP/SLP in Table 4.
In Malawi, the Social Cash Transfer Programme (SCTP) is an unconditional cash transfer
program aimed at reducing poverty and hunger among vulnerable households and increasing
school enrolment. It targets ultra-poor and labour-constrained households, with members
who are either elderly, chronically ill, orphaned or have disabilities. The programme started
in 2006 as a pilot and has been steadily scaled up, reaching 170 000 beneficiary households
by December 2015. The size of the transfer to each household is adjusted to the number of
household members and the number of members enrolled in primary and secondary schools.
The average transfers reaches MWK 4 500 per month, approximately US$6.50.53 Another
Malawi programme, the Farm Input Subsidy Programme (FISP) was created in 2005 with
the objective of improving food security and the income of smallholder farmers by
facilitating their access to improved agricultural inputs. Its target audience is somewhat loose
and targeting decisions are decentralized; community leaders choose “vulnerable
households” with access to land. There is no direct link or coordination between the SCTP
and the FISP, thus they fall under the category of OP. Survey data from the SCTP evaluation
suggest that many beneficiaries of the SCTP also receive the FISP voucher,54 which allows
for the assessment of complementarities between the two programmes undertaken in Pace et
al. (2016).
In Burkina Faso, a pilot called Local Education Assistance and Procurement project (LEAP)
aimed at integrating local procurement of food with a longstanding school feeding
programme, a Home Grown School Feeding modality. This pilot supplied food to 364
schools in eight departments in two provinces of Burkina Faso (Gnagna and Namentenga).
A total of 58 127 students received 20 daily rations per month from April to June 2011.
These two provinces suffer from generalized poverty and food insecurity, which justifies the
school feeding intervention. The program procured food from 22 local farmer’s associations
– ranging from 10 to 58 members. This pilot intervention was assessed against the
traditional US-sourced food and the result of this evaluation is reported in Upton et al.
(2012).
53 MWK – Malawian Kwachas, the currency of Malawi. 54 Although it has been reported that in some communities beneficiaries of the SCTP are excluded from the
FISP lists to avoid ‘double dipping’ and to allow different households to have access to another source of
subsidy support.

32
Table 4 Programmes that combine agricultural and social protection
interventions in Africa
Source: authors’ own elaboration.
Finally, the experimental evaluations of Graduation into Sustainable Livelihoods covered
pilot programmes in Ghana and Ethiopia. In Ghana, the programme included 666 beneficiary
households and distributed weekly cash transfers in the lean season, while in Ethiopia, where
the pilot reached 458 beneficiary households, both treated and control groups were able to
benefit from the PNSP public work programme for consumption support.55 The value of the
asset transfer in Ethiopia was the highest observed in all six pilots of Graduation into
Sustainable Livelihoods. This may have compensated for the lack of additional income
support beyond the PSNP transfers in that country, which constituted the core of the
intervention on the agricultural side similar to the other sustainable livelihoods strategies.
55 In Ghana, the pilot was implemented by Presbyterian Agricultural Services (an NGO) and in Ethiopia by the
Relief Society of Tigray (RST). Both pilots were implemented in 2010 and there is no information on possible
scaling up.
Programme Country Agricultural
intervention
Social protection
intervention Typology Coordination
Productive Safety Net
Programme (PSNP)
and Other Food
Security
Programme/Househol
d Asset Building
Programme
(OFSP/HABP)
Ethiopia
Agricultural extension
services, credit,
technology transfer
(advice on food crop
production, cash
cropping, livestock
production and soil and
water conservation),
and irrigation and water
harvesting schemes.
Public works (labour-
unconstrained
households) and cash
transfers (labour-
constrained households)
CP
Some
coordination
(HASP built on
OFSP but it was
intended to
improve
coordination
and access for
PSNP
beneficiaries)
Graduation into
Sustainable
Livelihoods
Ethiopia
Asset transfer
Food support through
food for work
programme (PSNP)
SLP Fully
coordinated
Graduation into
Sustainable
Livelihoods Ghana
Asset transfer
cash transfers
SLP
Fully
coordinated
Women's Income
Generation Support –
WINGS48
(2009-2011)
Uganda
Investment grant;
business skills training.
Cash support for
working capital (similar
non-depletion function
for assets).
SLP Fully
coordinated
Child Grant
Programme and
Linking Food Security
and Social Protection
Lesotho
Homestead gardening
(seeds) and food
preservation and
nutrition training.
UCT CP
Fully
coordinated
(agricultural
intervention was
tailored for the
UCT
programme)
Social Cash Transfer
Programme and Farm
Input Subsidy
Programme
Malawi Input subsidy
(vouchers) UCT OP No coordination
Local Education
Assistance and
Procurement project
(LEAP)
Burkina
Faso Local food procurement School Feeding CP
Fully
coordinated
Training and coaching
Training and coaching
33
3.4 Concluding remarks
The work of BRAC’s CFPR in Bangladesh,56 Peru’s efforts to improve coordination between
its conditional cash transfer programme and economic inclusion and rural development
initiatives and finally Ethiopia’s efforts to link the PSNP with the HABP Ethiopia are
responsible for most of the innovations. Evidence on the impacts of these is discussed in this
review. The CFPR is a prime example of an SLP whose adaptability to other contexts is
being tested, both in Bangladesh through the implementation of the CLP (Phase 1 and 2),
the ER+ and the FSUP, and abroad through the Graduation into Sustainable Livelihoods
project. In Ethiopia, the links between PSNP and OFSP/HABP give evidence of progressive
alignment and coordination of programmes that simply overlapped for quite some time.
The work in Peru reveals the challenges of aligning OP and CP categories as well as their
potential. It is also provides a primary source of evidence about combining CCTs with
agricultural interventions.
The experiences from these three countries clearly indicate some regional patterns in terms
of how different programme elements tend to be combined. Of course, this does not prevent
cross-fertilization across regions as the widespread implementation of the Graduation into
Sustainable Livelihoods pilots suggests. It does however reveal some clear preferences for
how agricultural interventions and social protection programmes are implemented in
different regions or subcontinents.
The positive results documented by the evaluations of these programmes, discussed in detail
in the next two sections, indicate that there is much to be learned from them about how to
effectively to combine different sectoral programmes. In addition, key aspects of programme
design require further evaluation to determine the true added value of coordinating
agricultural and social protection interventions.
56 The number of evaluations of the CFPR resembles the overwhelming number of evaluations of
Progresa/Oportunidades in Mexico.

34
4. Main features of the selected evaluation papers and
reports
This section presents and discusses the main features of the selected evaluation papers and
reports in detail. It will show the diverse approaches used to measure the overall impact
and/or the synergistic effects of combined programmes and will investigate whether there is
a relationship between successful combined programmes and evaluation design.
4.1 Evaluation methods
As shown in Table 5, about a third of the evaluations reviewed in this paper (12 out of 37)
had an experimental design – the gold standard of impact evaluations. The low proportion
of evaluations with an experimental design does not come as a surprise. Despite the growing
support of the international development community for the use of new ways (such as
Randomized Control Trials - RCT) to assess development programmes, implementing them
poses several challenges for both programme implementers and evaluators. As a result, non-
experimental designs are more likely to prevail.
Most of the experimental evaluations listed in Table 5 are concerned with combined
interventions under the SLP category. A major contributor to experimental evaluation design
is the CGAP/Ford Foundation Graduation into Sustainable Livelihoods project. This project
has assessed the adaptability of the BRAC’s CFPR model to different country contexts.
Banerjee et al. (2015) have reported both aggregated and country-specific results for six
Graduation into Sustainable Livelihoods-type pilots that took place in Ethiopia, Pakistan,
Honduras, Peru, Ghana and India (Mushibadad).57 Bauchet, Morduch and Ravi (2015)
reported on another pilot in their evaluation of the SKS Ultra Poor Programme (UPP)
implemented in Medak District in the Indian State of Andhra Pradesh. These pilots are
actually responsible for seven out of ten experimental evaluations reviewed in this paper.58
Likewise, Bandiera et al. (2013, 2016), and Raza and Van de Poel (2016) reported the results
of the experimental evaluation of CFPR Phase 2.
The other three experimental evaluations are Blattman et al. (2014) for Uganda, Macours,
Premand and Vakis (2012) for Nicaragua and Escobal and Ponce (2016a, 2016b) for Peru.
The former two evaluations look at interventions that use investment grants rather than asset
transfers in order to foster income diversification rather than by increasing rural incomes
while the latter paper assesses the impacts of a rural development project targeted at poor
and extreme poor households. All of the impact evaluations with experimental design come
57 Banerjee et al. (2015) and Raza and Van de Poel (2016) provided the only evaluations that took into account
the issue of testing many outcomes. Banerjee et al. grouped outcomes into families using index variables and
also calculated q-values to control for false discovery rates (FDR). Raza and Van de Poel adjusted p-values
using the Bonferroni correction procedure for multiple hypothesis testing. 58 Two other pilots, one in Yemen and another in Haiti, did not complete their evaluation processes. For
information on all seven pilots whose impact evaluations are part of this review see:
http://www.microfinancegateway.org/topics/graduation-sustainable-livelihoods.

35
from the SLP category, except for Macours, Premand and Vakis (2012) and Escobal and
Ponce (2016a), which look at the impact of CPs for CCT programmes.
Most experimental evaluations reviewed here focus on pilot programmes with a limited
number of beneficiaries and little or no government involvement. An exception is found in
the evaluations of combined programmes in Nicaragua as assessed by Bandiera et al. (2013,
2016) and Raza and Van de Poel’s (2016) evaluations of the CFPR Phase II. The latter is a
large-scale programme intervention but still with almost no government involvement,59
raising some concerns about the replicability of programme design and its impacts if the
interventions are brought to scale.
With regard to the non-experimental evaluations (26 out of 37), several challenges seem to
have limited the methodological options available to evaluators. For example, nine
evaluations did not include a proper baseline survey. About five evaluations based at least
part of their assessment on secondary data, relying on questionnaires and/or sampling
strategies meant for other purposes. Such features reveal the ex-post nature of many non-
experimental evaluations. This is largely due to the absence of impact evaluation planning
during the design phase, particularly in the case of CPs and OPs, where in most cases
programmes are already up and running when evaluations are finally envisaged.
Table 560 lists the different methodologies that the reviewed papers/reports have used in
order to produce robust estimates of the impacts of combined programmes.
Difference-in-differences and panel data methods, such as fixed-effect and random-effect
models, are the most commonly used methodologies when panel data surveys are available
(at least two waves). A total of 16 out of the 26 non-experimental evaluations either used
difference-in-differences or fixed-effect models to estimate the impact of combined
interventions. In many cases, these panel data techniques are used in combination with
different propensity score matching (PSM) methods. The evaluations of the CFPR model
implemented in Bangladesh used difference-in-differences methods or combined them with
PSM methods, in five evaluations for CFPR’s Phase 1 (2002-2004)61 and one for Phase 2
(2007-2009).
Evaluation designs that rely on difference-in-differences yield impact estimates that are
based on weaker assumptions than those applied when only ex post cross section data is
available and thus offer more credible results. The evaluations reviewed here that are based
59 Dewbre et al. (2010)’s evaluation of Lesotho’s Child Grant Programme (CGP) and the Linking Food Security
to Social Protection Programme (LFSSP) is not classified as an experimental evaluation despite building on an
experimental evaluation. The LFSSP allocation was not randomized and the programme did not have a pure
control group as the allocation was given to both treated and control groups in the two communities where it
was implemented. The impact estimate yields the result of receiving three years of CGP and one year of LFSSP
(treated) compared to only one year of the LFSSP (control). To understand the impact of LFSSP only, cross
section estimates of 2 years of CGP exposure are compared to the difference-in-differences results. 60 Table 2 lists the main methodology applied in the evaluation. Naude et al. (2016) also present some results
using a social accounting matrix and Del Pozo (2014) uses instrumental variable techniques as a robustness
check for the results of the difference-in-differences with propensity score matching methods adopted in the
text. 61 It is worth noting that the sample used in the different surveys of the evaluation of the CFPR Phase 1 is the
same. The papers reported here are based on the 2002 baseline survey and follow-up surveys in 2005, 2008,
and 2011. For more details see Table A.2 in the Appendix.

36
on a single cross section used the following methods to estimate programme impacts:
propensity score matching, time of exposure to the programme and new entry cohort as
controls. Aldana, Vásquez and Yancari (2016) and De Sanfeliú et al. (2016) use propensity
score matching based on time-invariant variables related to the selection into the programme.
Moya (2016) and HTPSE Limited (2011) use the delayed entry of new beneficiary cohorts
not yet affected by the programme to estimate the counterfactual for older treated cohorts.
Hoddinott et al. (2012) use the duration of the treatment-time of exposure to the programme
and Gilligan, Hoddinott and Tafesse (2009) and Upton et al. (2012) use retrospective
questions asked in the single ex post cross section to emulate a difference-in-differences
approach.
Some evaluations, despite having two-wave surveys, did not have a proper baseline as their
programmes were already underway at the time of the first survey. This was the case for
Naude et al. (2016) in Mexico, Fernandez et al. (2016) in Chile, Nega et al. (2010)
in Ethiopia and Pace et al. (2016) in Malawi. Naude et al. (2016) pooled the sample of the
2002 and 2007 surveys and applied a generalized propensity score to estimate the combined
and individual impact of Oportudidades and PROCAMPO in Mexico on a small set of
indicators. Fernandez et al. (2016) used fixed-effect models combined with propensity score
to estimate the interaction effects between IEF (CCT) and FOSIS (economic inclusion)
programmes in Chile. Nega et al. (2010) estimated the separate impact of participation in
public works programmes and in the Food Security and Nutrition (FSP) programme in
Ethiopia measured between 2004 and 2006. Pace et al. (2016) used a subsample of the SCTP
experimental evaluation where beneficiaries of the FISP at the baseline are dropped from the
sample used in the analysis. Such a procedure implies dropping roughly 50 percent of the
original sample. But in doing so, they guarantee that at baseline neither SCTP nor FISP
potential beneficiaries were receiving anything from the two programmes (or both in
combination).
Smith et al. (2013) is a special case among the selected papers. The authors use a difference-
in-differences approach based on the graphic inspection of the evolution of the outcome of
interest (stunting) over time in the project areas compared to the evolution of the outcome at
the national level measured by comparable household surveys. However, they do not run
any statistical test. In principle, this approach would not meet our criteria for robust
evaluation as discussed in Section 2, but it was included because they offer a good
explanation of why the comparison would be credible as well as their analysis of the
synergistic effects of different components by using propensity score matching.

37
Table 5 Methodologies used in the evaluations62
Methodology Papers Number of
evaluations
Randomized control trial (experimental evaluations) 6 - Banerjee et al. (2015); Raza and
Van de Poel (2016); Bandiera et al.
(2013, 2016); Bauchet, Morduch and
Ravi (2015); Blattman et al. (2014);
Macours, Premand and Vakis (2012);
Escobal and Ponce (2016b)
12
Difference-in-differences Krishna, Poghosyan and Das (2010);
BDI (2012) ; IRC (2012); Dewbre et al.
(2015) ; Garcia, Helfand and Souza
(2016)
5
Difference-in-differences with propensity score
matching
[non-parametric methods: e.g. nearest neighbor, kernel]
Ahmed et al. (2009); Prennushi and
Gupta (2014); Raza, Das and Misha
(2012); Raza and Ara (2012); Del Pozo
(2014) ; Smith et al. (2013)
6
Difference-in-differences with propensity score
matching (parametric method: inverse probability
weighting)
Misha et al. (2014); Pace et al. (2016)
2
Difference-in-differences with propensity score
matching (parametric and non-parametric methods) and
Klein-Vella Heteroscedasticity-based Identification.
Emran, Robano and Smith (2014)
1
Panel data: fixed effects and random effects
Hernandez et al. (2015)
1
Panel data: fixed effects with propensity score matching
Fernandez et al. (2016)
1
Single difference using generalized propensity score
(dosage)
Hoddinott et al. (2012)
1
Single difference and difference-in-differences based on
retrospective questions
Gilligan, Hoddinott and Tafesse (2009);
Upton et al. (2012)
2
Single difference with propensity score matching
HTPSE Limited (2011); Aldana,
Vásquez and Yancari (2016); De
Sanfeliú et al. (2016); Nega et al.
(2010);
4
Single difference (pooled data): generalized propensity
score matching (cross section) – inverse probability
Weighting (parametric)
Naude et al. (2016)
1
Single difference (treatment: different entry cohorts)
Moya (2016);
1
Total 37
Source: author’s own elaboration.
62 Detailed information on the methodology of the papers listed here is provided in Table A.2 in the appendix.

38
It is important to be aware that most evaluation designs, both experimental and quasi-
experimental, particularly those applied to the SLP category of combined programmes, do
not allow evaluators to either disentangle the effects of each of the components of the
intervention nor to assess the existence of synergies between agricultural and social
protection interventions. Impact estimates from most evaluations only show the overall
impact of the full intervention without looking at individual (or groups of) components.63
However, one of the key discussions around a sustainable livelihoods approach is precisely
which components are most cost-effective and which contextual factors allow them to be so.
For example, in Asia the coaching and training components that rely heavily on manpower
are relatively inexpensive compared to the pilot experiences in LAC countries (Banerjee et
al. 2015).
In almost all of the evaluations reviewed here, the unit of analysis and treatment is either the
individual or the household. The only exception is Garcia, Helfand and Souza (2016) that
uses an aggregated panel data at the municipality level to evaluate the synergies between the
CCT programme Bolsa Familia and the subsidized rural credit used for family farmers
(PRONAF). The treatment variables are coverage of the programmes at the municipal level,
hence estimates reported in that paper refer to the overall effect of the coverage of each
programme on indicators related to all family farmers at the municipal level. Thus, the results
include potential spillover effects over non-beneficiaries, without being able to disentangle
them.
Most evaluations either report the average treatment effect on the treated (ATT) or the
intention to treat (ITT)64 as their parameter of interest. In the case of evaluation papers that
look at spillovers, the average treatment effect on the untreated (ATU) (i.e. the impact of the
programme over untreated households in treated villages) is estimated using untreated
households/individuals in untreated villages/areas as control group. Estimates of the ATU
are reported in some of the SLP pilot evaluations presented in Banerjee et al. (2015) as well
as in Bandiera et al. (2016) and in Raza and Van de Poel (2016) for the experimental
evaluation of the CFPR Phase II in Bangladesh. Banerjee et al. (2015) estimate external
effects (ATU) on eligible (and untreated) households/individuals in intervention
villages/areas, whereas Bandiera et al. (2016) and Raza and Van de Poel (2016) estimate
external effects (ATU) on non-eligible (and untreated) households/individuals in
intervention villages/areas. Similarly, Aldana, Vásquez and Yancari (2016) use quasi-
experimental methods to estimate the effect of Sierra Sur on households that did not benefit
from the programme, but do reside in intervention areas.
Thus, aside from Garcia, Helfand and Souza (2016), Bandiera et al. (2016), Raza and Van
de Poel (2016) and Aldana, Vásquez and Yancari (2016), there is no evidence of impacts at
63 Blattman et al. (2014) is an exception as they randomized the intensity of the follow-up (coaching) visits in
the design of the evaluation of WINGS in Uganda. 64 ITT estimates define the treated group as the sample of households/individuals that were supposed to
participate in the programme in the initial allocation process. It is intended to reproduce the impact of the
programme on the target population, taking into account any difficulties with the implementation process,
which includes drop-outs from the treated group and contamination of the control group.

39
the aggregate community level or beyond the eligible population for the programme(s) of
interest. Such an exercise would require survey data on eligible and non-eligible populations
in both intervention65 and non-intervention areas. However, most impact evaluation surveys
rarely collect data beyond the eligible population.
4.2 Evaluation design: Sampling strategies and control groups
The evaluations vary considerably with regard to their sampling strategies. The evaluation
methodology and the strategy used to identify an appropriate control group largely drive this
observed variation.66 In this subsection, we discuss how the evaluations dealt with sampling
issues.
The experimental evaluations tend to have quite a straightforward sampling process as
almost all of them are based on SLPs with a single implementing agency. Any differences
among them usually relate to the level of randomization, whether at the household level or
at both the village and household level or whether evaluators aims at collecting information
on non-beneficiaries to assess spillover or external effects.67 In the case of the Graduation
into Sustainable Livelihoods pilots, the implementing partners, usually local NGOs, were
responsible for applying the targeting tool, a participatory wealth ranking to identify the
poorest people in villages with high prevalence of extreme poverty. In three cases, the
villages were randomly chosen to be part of the programme to assess spillover effects. Then,
half of the eligible participants were randomly assigned to treatment and the other half to
control. A baseline survey was conducted among all eligible participants and followed up by
two endline surveys, the first about 24 months after the end of the interventions and the
second about 12 months after the first endline survey.68
65 The fact that in many evaluations the control group comes from the same geographical area as the treatment
group raises the issue of possible contamination or external effects on the treated group. Banerjee et al. (2015)
did not find any evidence of externality effects (impacts on non-beneficiaries) in the pilots of the Graduation
into Sustainable Livelihoods project in Honduras, Peru and Ghana. They argue that the low coverage of these
programmes (which is partially due to its pilot nature) would prevent any externality effect (or general
equilibrium effects) and recommend scaling up the pilot by including other geographical areas rather than
including more people in the same geographical area. 66 Detailed information on the impact evaluation methodology, sampling design, choice of comparison group
and outcomes assessed in the evaluation is given in the Table A.3 in the appendix. 67 In some cases, such as Blattman et al. (2014), spillover effects are measured at the village level using distance
from the control villages as the proxy. 68 The combined sample of the six pilots evaluated in Banerjee et al. (2015) is 10 495 households. In Ethiopia,
the overall sample size was 925 households: 458 in the treatment group with a take-up rate of 100 percent and
a within-village (10) control group only. In Pakistan, the sample size was 1 299 households: 660 treated with
a take-up rate of 100 percent and a within-village (66) control group only. In India, the sample size was 978
households: 512 households with a very low take-up rate of 52 percent and a within-village (119) control group
only. In Honduras, the sample size was 2 403 households: 800 treated with a take-up rate of 100 percent and a
control group from both within the village (40) and control villages. In Peru, the sample size was 2,066
households: 785 treated with 100 percent take-up rate and control group from both within village (43) and
control villages. In Ghana, the sample size was 2 606 households: 606 treated and take-up rate of 100 percent
and control group from both within the village (155) and control villages. In Ghana there was a multiple
treatment arm with the randomization of a savings schemes to incentivize saving behaviour. In the other Indian
site of the project evaluated in Bauchet, Morduch and Ravi (2015) the sample size was 1 063 households: 575
treated and a take-up rate of 70 percent and a control group from control villages.
40
In rural Bangladesh, the evaluation samples used by Bandiera et al. (2013, 2016) and Raza
and Van de Poel (2016) to assess the impact of the CFPR Phase 2 covered 1 409 communities
in 40 regions.69 Half of these communities had a delayed entry into the programme to work
as a control group for the evaluation. The randomization process used the BRAC offices,
which cover 20 upazilas each. Using the BRAC offices rather than communities as the unit
of randomization was a strategy to avoid contaminating the control groups. The sample size
had 7 953 eligible households (4 045 from treatment communities and 2 687 from control
communities).
Blattman et al. (2014) reported on an experimental evaluation in which the 20 percent most
marginalized individuals from the ages of 14 to 30 years in 60 villages in Northern Uganda
and with a quota of 75 percent for women were included in a participatory targeting process.
A baseline survey was conducted among all 1 800 eligible participants, after which the
villages randomly assigned people either to immediate treatment, including training, cash
and follow-up (Phase 1) – a total of 896 individuals – or to the waitlist (Phase 2) – 904
individuals who would participate in the programme in roughly 20 months. In addition, half
of the 60 Phase 1 villages were randomly selected to receive group dynamics training to
support self-help groups. During Phase 2, participants were randomly assigned to receive an
unsupervised grant (318), one to two supervisory visits (300) or multiple visits, up to a
maximum of 5, to provide both supervision and business advice (286). It is important to note
that this SLP evaluation is one of the few that tries to disentangle the contribution of each
component of the programme from the overall result.
Marcours, Premand and Vakis (2012) took a similar approach in their evaluation of CCTs
combined with productive investment grants or vocational training for rural households in
six municipalities of Nicaragua. The communities were randomly assigned to treatment (56)
and control (50) groups. Then, the CCT-eligible households – selected through a proxy
means test formula – from the treatment communities were randomly placed into three
groups: a) CCTs only; b) CCTs plus investment grant; and c) CCTs plus vocational training.
The programme had an overall take up rate of 95 percent. The sample size was 3 002 eligible
households from the 56 treated communities and 1 019 eligible households from the 50
control communities.
Escobal and Ponce (2016a) used a sample of 428 households (207 treated and 221 control)
issued from 36 villages (centros poblados) from the department of Cajamarca, Huánuco and
Huancavelica in their analysis. The original sample used at the baseline survey was of 447
households (219 treated and 228 control) which gives an attrition rate of 4.3 percent. The
randomization intro treated and control groups took place at the village level (18 pairs) using
pairwise randomization in which the pairs were matched according to their similarity taking
into account their socioeconomic features. Due to the small sample size, the randomization
was not very successful and propensity score weights were calculated to balance the sample
of treated and control households. Although this evaluation only looked at the impacts of
Haku Wiñay, more than 80 percent of the sample were also beneficiaries of the Juntos CCT
69 The database for this evaluation actually contains only 1 309 communities because in 100 of the eligible
communities no household qualified for the programme.

41
programme. The sample of potential beneficiaries of Haku Wiñay had an uptake rate of 86
percent.
As for the non-experimental evaluations, control groups were either identified among the
non-eligible households in the participating communities or from eligible households in
villages that were not participating in the programme. As noted above, difference-in-
differences and propensity score matching methodologies were used to ensure that
unobserved time-invariant features and/or differences in observables that might affect
selection for the programme did not bias the results.
The non-experimental evaluations of CFPR Phase 1 in Bangladesh were largely based on
the selection of a control group in the intervention communities using administrative lists of
eligible and non-eligible participants as the sampling frame and successive surveys covering
the baseline sample. A baseline survey was conducted before the start of the programme
(from June to August 2002) in the three districts of Northern Bangladesh where it was
implemented. The sample comprised selected ultra-poor people (treatment group) and non-
selected ultra-poor people (control group). The latter, despite being ultra-poor as per the
wealth rank participatory targeting process, did not meet some of the exclusion or inclusion
criteria of the programme.70 The baseline sample included 5 626 households, of which 2 633
were treated and 2 993 were control households.
Follow-up surveys were conducted to assess the impact of CFPR Phase 1 in 2005, 2008 and
2011. Ahmed et al. (2009) and Emran, Robano and Smith (2014; 2009)71 assessed the short-
term impacts of the programme a year after its completion using the 2005 survey. Raza, Das
and Misha (2012), Das and Misha (2010) and Krishna, Poghosyan and Das (2010) used the
200872 survey to look at the medium term impacts of the programme and Misha et al. (2014)
used the 2011 survey to assess its long-term impact.73 Raza and Ara (2012) used a similar
strategy to identify a control group for evaluating CFPR Phase 2. The non-selected ultra-
poor from the intervention communities were used as the control group. The total sample
size for the baseline survey was 3 685 households (778 treated and 2 907 control).
The attrition rate found by the follow up survey implemented just after the completion of the
programme was 8 percent.
To evaluate the FSUP in Bangladesh, BDI (2012) used a panel survey sample of 1 260 ultra-
poor beneficiary households randomly selected from the 5 000 beneficiary households of the
programme’s first cycle and a control sample of 647 eligible households that were pre-
selected using the FSUP targeting methodology in non-participating villages. Similarly,
Hernandez et al. (2015) built a panel survey with a purposive sampling method based on a
list of eligible participant households from 14 upazilas (seven treated and seven control).
70 See Section 3 for a description of these criteria. 71 Emran, Robano and Smith (2009; 2014) used an additional control group based on eligible households
(matching all requirements) that did not receive the programme due to implementation failures. Unlike the non-
selected ultra poor, the eligible ultra-poor individuals not receiving the programme are more similar to the
treated group. 72 Sample attrition rates were reported as 6 percent in 2005-2002 and 14 percent in 2008-2005. 73 Sample attrition rate for the 2011 survey was 28 percent. However, the authors argue that none of the baseline
characteristics were good predictors of the attrition later in the panel, which suggests that the results were
unlikely to be biased by the loss of these cases.

42
An additional sample of control non-participants in ER comes from treated upazilas.
The final sample size was of 2 397 households split into 800 ER+ eligible participants in
treated areas, 797 ER households eligible for ER+ in control areas, and 800 non-ER
households from treated areas.
The evaluation of the SHOUHARDO project by Smith et al. (2013) relies on a baseline
survey of 3 300 children aged 6-24 months old from all four treated areas of the project and
on two follow-up surveys conducted later with 3 200 and 3 356 children, respectively.
The first follow-up included the same children, who were then aged 48-60 months,74 and the
last was comprised of a new cohort of 6-24 month-old children from the treated villages.
Secondary data for the calculation of a counterfactual evolution included the following
surveys: Bangladesh Demographic and Health Surveys (BDHS) conducted in 2004 and
2007; surveys conducted by the National Nutrition Surveillance Project of Helen Keller
International (HKI) in 2006 and 2010 and the Bangladesh Household Food Security and
Nutrition Assessment conducted by the World Food Program, UNICEF and Mitra and
Associates from November 2008 to January 2009.
For the HTPSE Limited (2011) evaluation of the CLP Phase 1 in Bangladesh, the control
group was identified as the late entry cohort and an ex post survey was used to assess
differences between this group and the group that had entered the programme in a previous
phase. Administrative data was used to assess the differences between treated and control
groups.
A similar approach was used in the evaluations of CPs. Aldana, Vásquez and Yancari (2016)
used a sample of Juntos beneficiaries from a district where the Sierra Sur programme was
implemented and from other districts where it was not. They compared the two groups,
taking into account income level and the willingness of the second group to participate in
Sierra Sur projects and/or their willingness to pay for some of the services provided.
The sample size after the matching process yielded 320 treated households and three control
groups of 374, 209 and 117 households.
De Sanfeliú et al. (2016) merged three databases of (potential) beneficiaries of a CCT
programme and rural development interventions: the FISDL census used to target
beneficiaries of the Comunidades Solidarias Rurales (CSR) – El Salvador’s CCT
programme – and the lists of beneficiaries of the SAN (Food and Nutritional Security) and
EP (Productive Chains) programmes. This process identified 14 184 households that were
both included in the FISDL census and benefited from the agricultural interventions
implemented by SAN and EP. The final sample used in the survey was determined by pairing
different group combinations of SAN and EP beneficiaries and CSR status (beneficiary,
former beneficiary, never beneficiary) to yield a final sample of 1 301 households.75
74 Children who were between 18-24 months in the baseline were not part of the endline survey as they were
above 60 months old. 75 Households that participated in SAN and EP projects were classified in A, AC and C groups depending on
whether they were benefiting from CSR at the time they participated in productive programmes, were former
CSR beneficiaries or never benefited from CSR, respectively. Those who did not benefit from CSR were
classified as B, BD, D as per their matching to the three groups of those who had participating excluding those

43
Moya (2016) used a survey based on a stratified sample of 59 farmers’ organizations that
participated in Oportunidades Rurales between 2008 and 2013. The stratification of the
sample used the following variables: entry year in the programme, activity, region and an
index for the quality of the organization. A second stage involved the random sampling of
729 households from these farmers’ organization. The analysis of the impact of
Oportunidades Rurales on Familias en Acción (CCT) beneficiaries was based on self-
reported information as to whether the household benefited from the programme retrieved
from the survey.
Some evaluations use the sampling process to identify beneficiary status during the process
of listing households from sampled enumeration areas, instead of gathering information on
programme participation from a list of eligible participants.
The IRC (2012) evaluation of P135 II in Vietnam built a panel survey with household - level
data from a sample of communities reached by multiple interventions and from control
communities selected using propensity score matching. The 266 sample communities –
randomly selected from a population of 1 632 treated communities – were matched to 134
control communities selected from 727 non-treated communities. Next, a sample of 6 000
households was randomly selected from the listing of households from the selected treated
and control communities.
Prennushi and Gupta (2014) also used a panel survey that was applied to five districts
covered by IKP interventions in Andhra Pradesh, India. Districts were selected to represent
five different agro climatic zones; then subdistricts, blocks and villages were randomly
selected and a final stratified sample of 4 250 households within villages was selected, using
poverty categories to stratify the sample. The survey questionnaire allowed to identify
participants of IKP Self Help Groups (and other social programmes). This was necessary
because unlike IRC (2012) the evaluation of IKP used a control group from treated
communities rather than from non-treated communities. The impact analysis matched IKP
participants and non-participants (using propensity score matching) and used poverty
category strata to explore the heterogeneous impact of the programme.
Gilligan, Hoddinott and Tafesse (2009) and Hoddinott et al. (2012) in their evaluations of
PSNP and the additional impact of OFSP/HASP interventions used a panel survey whose
sampling was based on a list of kebeles in 68 chronically food-insecure woredas. The
woredas were selected with probability proportional to size from a list of 153 across the four
major regions of Ethiopia. The sample of woredas was stratified by region and, within each
woreda, kebeles were randomly selected as enumeration areas. After households in the
selected kebeles were listed, a stratified sample of 15 randomly selected PSNP beneficiary
and ten non-beneficiary households was drawn. The final sample included 146 kebeles and
3 688 households. Nega et al. (2010) used a different panel survey but applied a very similar
sampling strategy, except that the survey did not identify beneficiaries of public work
outside the common support. The matching process yielded 6 176 households. A random sampling of that
population led to a sample size of 1 301 households divided into six groups: EP (A: CSR+EP=239; C: EP=152);
SAN (A: CSR+SAN=241; C: SAN=213; AC: former CSR+SAN=230; BD= former CSR=226).

44
programmes in the listing of the households. The control group was matched with the
treatment group. Their total sample size was 400 households (100 households in each
tabia).76 The beneficiary status was captured by the survey questionnaire.
In a few cases, evaluators have used on-going evaluations of cash transfer programmes to
assess their impacts when combined with productive programmes. Dewbre et al. (2015) used
the on-going experimental evaluation of the CGP in Lesotho to add specific questions related
to LFSSP implementation and impacts on two follow-up surveys of households in the two
communities where the programme was implemented.77 The final sample included 299
households. The LFSSP intervention started in the third year of CGP implementation. Since
a subsample of both the treated and control groups benefited from the CGP programme, it is
possible to estimate a counterfactual for the LFSSP without cash transfers. However, in order
to measure the additional impact of the LFSSP, one needs to compare the effect of receiving
three years of CGP plus one year of LFSSP with the effect of having received the CGP only
for two years.
Hernandez et al. (2015) used an evaluation survey designed to assess the impact of the
Ingreso Ético Familiar (IEF) using a panel of beneficiaries and non-beneficiaries. A survey
questionnaire was used to evaluate the interaction between the IEF and the FOSIS productive
support programmes among 2 308 households. Similarly, Pace et al. (2016) used the
experimental design database for evaluating the impact of the SCTP in Malawi to identify
beneficiaries of the FIPS. Through this procedure they were able to identify four groups: a
group that neither received FISP nor SCTP; two groups that received either SCTP or FISP
only; and a group that participated in both programmes. To clean the data from FISP
beneficiaries at the baseline, 3 492 out of 6 708 households were dropped from the initial
sample.
Upton et al. (2012) uses three different cross-section evaluation surveys with retrospective
questions to estimate the impact of local procurement for the school feeding programme
(LEAP) on both food recipient satisfaction and suppliers/farmers. For the latter, the survey
was restricted to cowpea producers focusing on personal and production characteristics. For
the food recipients the surveys covered the school head cook and then the school director.
Thus, no survey looked directly at school age children and/or their households.
As the identification strategy was based on a natural experiment in which the same
programme implementer (Catholic Relief Services) run a similar programme, MYAP, in
neighbouring area in which the food is not bought locally, the same survey instruments were
applied in a sample from producers and schools. The authors drew a sample of 20 farmers
from the list of all members of farmers’ associations in each of the eight LEAP departments,
yielding a sample of 160 farmers. Farmers association close to the MYAP (control) schools
yielded a random sample of 150 farmers. As for recipients, schools were stratified by
department and 15 of them were selected from each of the 8 departments, a total of 120
schools, and then the same number of schools from the MYAP four departments was
76 Tabia is the smallest administrative unit of Ethiopia, an alternative definition for kebele. 77 It is important to note that the LFSSP intervention was applied in only two communities in one of five
districts that were under the first phase of the CGP and that were part of its experimental evaluation. Thus the
sample size for this evaluation was much smaller than the one used to evaluate CGP.

45
matched to them. Sampling weights were used in the analysis for both producer and school
data.
Finally, four evaluations used secondary data from surveys that were either part of the
regular surveys implemented in a country or were designed for other purposes. Garcia,
Helfand and Souza (2016) and Del Pozo (2014) used the national agricultural censuses to
estimate the synergies between Bolsa Familia (CCT) and PRONAF in Brazil and Juntos
(CCT) and rural credit in Peru, respectively. Garcia, Helfand and Souza (2016) used
municipalities as the unit of observation (a sample of 4 251) and the coverage of both
programmes as the treatment variable. Del Pozo (2014) used propensity score matching to
build a pseudo- panel matching Juntos treated and non-treated districts, yielding a sample of
377 236 households – 108 971 Juntos households and 268 265 control households. Then
they compared households with credit and those without to analyse the synergies between
rural credit programmes and Juntos. Naude et al. (2016) used ENHRUM, a multipurpose
panel survey from small localities in Mexico, to identify beneficiaries of Oportunidades and
PROCAMPO and assess the interaction between the two programmes. The final sample used
in the evaluation was of 3 290 households pooling the 2002 and 2007 survey rounds.
4.3 Outcomes of interest
This review has focussed on outcomes that measure the impacts of interventions on hunger,
malnutrition and poverty. In addition, we have looked at indicators for intermediary
outcomes that contribute to the improvement of the final outcomes, particularly those related
to changes in the productive activities of beneficiary households, including asset
accumulation, investment in inputs, access to credit and changes in labour market
participation. Table A.3 provides a list of all outcome indicators covered by the selected
evaluations.
Table 6 shows the prevalence of different sets of outcomes that are relevant for this review.
The most common indicators relate to income, consumption and expenditures: 30 evaluation
papers/reports (81 percent) assess the impact of combined programmes based on these
outcomes. Interestingly, only five papers (14 percent) use poverty indicators to assess how
impacts on consumption, expenditures and income translates into poverty reduction.
Impacts on hunger and malnutrition indicators are often reported by a variety of food security
indicators such as: perceived food security, standard food security scores, and indicators of
dietary diversity, frequency of meals or whether household members have missed out a meal
in the day (the most prevalent set of indicators). Only Gilligan, Hoddinott and Tafesse (2009)
reported calorie-intake indicators. Overall, 23 papers (62 percent) assessed the impact of
combined interventions on food security indicators. It is striking that only two evaluations
looked at anthropometric measurements for children, namely Smith et al. (2013) and Raza
and Van de Poel (2016) and only the latter looked at similar indicators for adults or any
indicators for micronutrient consumption/in-take for children or adults. The relatively high
cost of collecting data on anthropometric measures largely explain the lack of such
indicators. In any case, the lack of assessment of impacts on these measures reveals a
relevant gap in the literature.
46
Asset-related indicators represent the second most common type of outcome assessed in the
impact evaluations. In total, 28 papers/reports (76 percent) discuss the impact of the
interventions on asset accumulation, with a focus on productive assets but also including
durable goods (e.g. television, radio, refrigerator). Most evaluations, particularly those from
the CFPR in Bangladesh, focus more on the ownership of assets than on the value of assets.
Land and livestock ownership are most commonly evaluated, largely because the
programmes were mostly implemented in rural areas and because livestock are highly
prevalent among the assets distributed in many SLPs. Moreover, in some regions, livestock
is used as a form of precautionary savings in the absence of accessible financial services.
The focus on rural areas also explains the relatively large number of papers that either discuss
programme impacts in terms of direct production and productivity indicators (e.g. total value
of produce and/or value or amount of produce per area) or in terms of indirect indicators.
The latter include different sources of household income (and hours of work) dedicated to
different economic activities, such as agriculture, livestock or non-farm enterprises.
Out of the 37 evaluations, 21 (57 percent) include indicators that could be used to assess the
impact of the interventions on production and/or productivity. However, much less is known
about the impact of interventions on investments in agricultural (and non-agricultural)
inputs. As seen before, this type of interventions tends to be assessed using ownership of
productive assets rather than by measuring direct expenditures on productive inputs.
Thus, only a few evaluations (7 out of 37) have assessed, for example, expenditures on the
purchase of fertilizers or improved seeds.
The impacts of combined programmes on labour supply and occupation are reported in about
half (17) of the evaluations. Impacts on agricultural and non-agricultural self-employment is
the most common indicator, in line with the entrepreneurship objectives of many of the SLP
and CP programmes. In most cases, evaluators disaggregate the results by sex or just report
the results for women – who are often the main or direct beneficiaries of the interventions.
In these evaluations it is also very common to assess indicators on savings and access to
credit. Many interventions had components to incentivise the use of financial services such
as financial literacy, mandatory savings and the formation of savings groups. Moreover, cash
transfer payments through formal financial institutions could also make financial services
more accessible for beneficiaries.
Finally, 13 evaluations (37 percent) assess indicators related to community participation.
Some of the interventions attempted to foster community participation through self-help
groups, women’s empowerment, productive associations or cooperatives so that these
indicators were clearly related to the objectives of the programmes. It important to bear in
mind that community participation outcomes are much more diverse and less standardized
than other outcomes discussed in this review. They will be more fully reported in the
discussion in Section 5.

47
Table 6 Prevalence of outcomes of interest in the reviewed evaluations
Source: authors’ own elaboration.
Number of reports %
Income, consumption or expenditures 30 81%
Assets (productive and durable goods) 28 76%
Productive assets 28 76%
Food security and nutrition 23 62%
Productivity 21 57%
Savings 18 49%
Occupation 17 46%
Credit 16 43%
Community participation 13 35%
Poverty 5 14%
Agricultural inputs 7 19%
48
5. Evidence from impact evaluations of combined
social protection and agricultural intervention programmes
This section discusses and summarizes evidence – following the FAA typology78 – of the
complementary roles that agricultural and social protection programmes can play in
contributing to poverty reduction and food security outcomes, based on a review of the
selected evaluations. We present evidence of the impacts of the joint implementation of these
interventions and, when available, of their synergies and present a brief summary –
highlighted in bold and italics – of the main findings as the introductory paragraph for each
subsection.
The use of the FAA typology helps us to highlight gaps in the literature. As discussed
previously, the focus of the evaluations selected for this review was on individual/household
level indicators. A missing dimension in the evaluation literature concerns the impact at
community and macro levels of combined interventions regardless of category of
combination, whether SLP, CP or OP.79 In this context, the evidence reviewed in this section
relates to supporting households in making productive investments; strengthening risk
management and resilience at the household level; improving the efficiency of labour
allocated to on-farm activities to increase income generation; and increasing household food
consumption and reducing poverty incidence and depth (Gavrilovic et al., 2016).
Due to the lack of studies concerned with the community/local economy level,80 this review
will also consider increased participation by beneficiaries in the social life and productive
chains of their communities as a means to reduce social and economic exclusion. Spillover
effects, i.e. effects of the combined interventions on non-beneficiaries will, also be
highlighted when available.
5.1 Supporting households in making productive investments
Table 7 summarizes the impacts of the combined agricultural and social protection
programmes on investment in land (owned land, rented land and/or cultivated land), on
productive assets, investment in inputs and how these investments may have translated into
higher yields. These impacts are detailed in the two subsections below.
78 See Gavrilovic et al. (2016) for more details on the typology. 79 The FAA also analyses the complementary role of combined agricultural and social protection interventions
at the community/local economy level in: 1) stimulating food markets; 2) supporting decent employment in
agricultural labour markets; 3) supporting the development of social networks; and 4) stimulating economic
diversification. 80 As mentioned above, Garcia, Helfand and Souza (2016) is the only evaluation whose results incorporate the
aggregate effect of the expansion of both Bolsa Familia (social protection) and subsidized rural credit for
family farmers in Brazil on municipal-level indicators. Thus the aggregate impact of the combined intervention
at the ‘community/local’ level is captured in this study.

49
5.1.1 Investment in land: Owned land, rented land and cultivated land
Overall, the results of the impact evaluation show increases in access to and/or utilization
of land. For SLPs, the evidence suggests that in the case of Bangladesh (e.g. CFPR Phase
1 and 2 and FSUP) part of the returns yielded by the livestock-based income-generating
activities was invested in using more land, either through purchasing or renting. For CPs,
there is evidence of more land utilization in Lesotho due to the combination of the
LFSSPP and the CGP and in Peru due to the overlap of rural credit and the CCT
programme Juntos. In India, the IKP programme led to an increase in the area of
cultivated land by the poorest people.
The evaluations of CFPR Phase 1 and 2 suggest that beneficiaries are investing in land.
Ahmed et al. (2009) looked at the impact of CFPR Phase 1 in the short term (just after the
end of the intervention) using a difference-in-differences with propensity score matching
methodology. The comparison group was a set of non-selected extremely poor people.
The authors found a positive and statistically significant impact on rented land of 1.77
decimals,81 which represents an increase of 13.5 percent in relation to the baseline indicator
for the comparison group. However, programme evaluators did not find any impact on the
ownership of cultivable land in the short run. Emran, Robano and Smith (2014) re-examined
the same dataset using a different treatment and comparison groups, redefined as per the
compliance and non-compliance with inclusion and exclusion criteria, and a series of
different estimation techniques, mostly difference-in-differences with alternative propensity
score matching methods. A year after the end of the intervention, they found very similar
results to those reported in Ahmed et al. (2009). There was no impact on total land owned,
but there was an increase in ownership of homestead land. Estimates of these impacts vary
between 12 and 22 percent of the baseline level of the overall sample depending on the
specification used and on the definition of treated and control group.
Krishna, Poghosyan and Das (2010), using the data as two previous studies but adding a new
wave of survey data (2009), applied simple difference-in-differences analysis to assess both
short and medium term (one and four years after the intervention respectively) and found
that land ownership increased in both periods. Das and Misha (2010)82 and Raza, Das and
Misha (2012) used difference-in-differences combined with propensity score matching
techniques and found that the positive impact on land holding in the medium term (2002-
2008) was higher than in the short term83 (2002-2005) and statistically significant. Similar
results were also found for cultivable land holdings. Positive and significant impacts on
mortgaged and shared land were found in both the short and medium terms, with larger
impacts for the latter. This suggests that early income gains from the income generation
81 Decimal is a common unit of measurement for land in Northern Bangladesh: 1 decimal= 0.01 acre = 40.5
m2. 82 The authors also investigate the impact of CFPR Phase 1 on the proportion of households that report owning
homestead land and the proportion of households that report owning cultivable land. They find short- and
medium-term positive impact for both indicators. 83 The short-term impact was not statistically significant, similar to the findings reported by Ahmed et al. (2009)
and Emran, Robano and Smith (2014).

50
activity supported by the CFPR Phase 1 were invested in land purchase, pointing to a
sustainable impact of the intervention.
Misha et al. (2014) looked at the long-term impact of CFPR Phase 1 adding the 2011 survey
data wave.84 The authors confirmed a 5 percentage point (pp) increase in the probability of
owning homestead85 land by 2005 and an additional increase of 4pp by 2008. However, in
2011 no additional effect was identified. For the ownership of cultivable land, there was a
positive significant effect of 4pp by 2008 but that was reverted by 2011. The authors partly
attributed the smaller effects observed in the long term to the fact that the comparison group
would eventually ‘catch up’ with the treated group,86 either through the proliferation of
NGOs implementing similar interventions or to spillover effects of the CFPR itself.
However, no robust evidence for these spillover effects are available at least for CFPR
Phase 1.
With regard to CFPR Phase 2, Raza and Ara (2012) found an increase of 0.09 decimals in
the amount of homestead land acquired (at a 10 percent level of significance), mostly rented
land, just after the end of the intervention period (2009). Given a baseline level of 0.87
decimals for the comparison group, this would represent an increase of 10 percent. The
authors also found an increase of 0.80 decimals for cultivable land owned, though this result
is not statistically significant.87
The randomized control trial documented in Bandiera et al. (2013, 2016) found that after
two and four years of the intervention, beneficiaries were 7pp and 11 percentage points more
likely to rent land and 0.5pp and 3pp more likely to own land, respectively.88 These increases
are very large relative to baseline levels: 188 percent for renting land and 38 percent for
owning land. Bandiera et al. (2016) also found that the value of land owned had increased
by an average of USD 327 four years after the intervention – a 187 percent increase over
baseline values. The authors argued that since land was not among the assets distributed by
the programme, these results confirm that the income generated by the livestock business
supported by CFPR Phase 2 was invested in other productive assets allowing beneficiaries
to have some long-term security. They conclude that easing capital and skills constraints
through CFPR Phase 2 has had a lasting impact on the economic lives of ultra-poor women
in the intervention sites.
BDI (2012) found similar results for the Food Security for the Ultra-Poor (FSUP)
programme. Despite not showing disaggregated difference-in-differences estimates for the
84 CFPR Phase 1 ended in 2004. 85 Note that previous studies have focused on the impact on the area (in decimals) owned or cultivated rather
than on the ownership (or not) of land. It is unclear why results for land ownership (in area) are not reported in
Misha et al. (2014). 86 This catching up by the comparison group is observed for many but not all outcomes, as will be seen later in
the review. According to the authors, the catching up is due to the comparison group having access to similar
SLPs. 87 In terms of percentage variation, if statistically significant, it would represent a 93 percent increase over the
baseline level of 0.87 decimal. 88 Unlike Raza and Ara (2012), no results for land owned or rented in terms of area are reported in Bandiera et
al. (2013, 2016). Similarly, Raza and Ara (2012) do not report on the impacts of CFPR Phase 2 on the
proportion of households who own land or rent land.

51
impact of the programme on land ownership or homestead land, the report does show that
homestead land increased remarkably between baseline and follow-up survey for the
beneficiary group, probably due to an increase in the proportion of beneficiary women that
moved away from bull-fattening towards crop production.89
It is worth noting how most evaluations of integrated livelihoods approaches in Bangladesh
look at land ownership, land leasing/renting and homestead land ownership as an outcome
of interest.90 Ownership and access to land is positively related to poverty in the rural areas
and is used to select beneficiaries’ livelihoods programmes, with a cap on the size of land
that the beneficiary owns. The asset menu offered to households relies on the assumption
that animal husbandry is the best option for women with very limited access to land.
The evidence so far suggests that households invest in land either by purchasing or renting
it. These results offer some food for thought with regard to the limited options offered to
women in most integrated livelihoods interventions in Bangladesh and shed light on the
potential productive impact of enabling rural women to have access to land, as well as the
need to address institutional and legislative issues associated with this process.
Two other evaluations, both in India, looked at the impact of programme interventions on
land ownership or land access. Bauchet, Morduch and Ravi (2015) found no impact on land
ownership as a result of the SKS-UPP programme, which was part of the Graduation into
Sustainable Livelihoods Programme.91 Prennushi and Gupta (2014) found that a positive
impact of the Indira Kranti Patham (IKP) on land cultivation among the poorest households
(an additional 0.5 acres) when comparing mid-entry cohorts (treated) with non-beneficiaries
(control), but not for other income or entry cohort groups.
In Africa, Dewbre et al. (2015) looked at the impact of the combination of an unconditional
cash transfer, Lesotho’s Child Grant Programme (CGP) and the LFSSP, a food security
programme that distributes vegetable seeds and training on homestead gardening and
nutrition. They found that the combined programmes led to a large increase - over a third of
a hectare - in land cultivated or operated by beneficiary households. However, labour-
unconstrained households drove this result, as their land holdings increased by more than
half a hectare. The authors attributed more of the impact to the three years of cash transfers
of the CGP than to the LSFSSP, since the latter focused primarily on homestead gardening.
Only two evaluations focusing on the overlap of Peru’s CCT programme (Juntos) with a
rural credit programmes and a rural development project (Sierra Sur) looked at cultivated
land as an outcome of interest. Del Pozo (2014) found a 0.64 ha (31 percent) increase in
89 While bull-fattening was the prevalent income-generating activity chosen by 54 percent of beneficiary
women as per the 2011 (midline survey), in 2012 (endline survey), the proportion of treated households
engaged in bull fattening had decreased to 25 percent. This decrease was accompanied by an increase from 17
percent to 43 percent in crop cultivation during the same period. 90 Indicators on land refers to the plots, located not in the immediate surroundings of the main dwelling used
by the households to cultivate major crops, such as rice, maize, etc. While homestead land refers to plots
generally of smaller size located around the farmhouse, used by the household to produce vegetable for its
own-consumption needs. 91 The other evaluations of the CGAP/Ford Foundation Sustainable Livelihoods Programme, at least as reported
in Banerjee et al. (2015), did not specifically look at land ownership/cultivated land/homestead land. Nor did
the asset index created for these six evaluations include any land-related variable.

52
cultivated land over the baseline for the comparison group among farmers benefiting from
both Juntos and rural credit. Larger effects were found if credit was from publicly owned
banks or from microfinance institutions, 0.98 ha and 0.73 ha respectively, rather than from
private commercial banks. This synergistic effect is almost twice the impact of Juntos alone:
0.33 ha (16 percent increase over the baseline cultivated area of the comparison group).
The Aldana, Vásquez and Yancari (2016) assessment of the impact of Sierra Sur on Juntos
beneficiaries found no impact on the value of the land owned by Juntos beneficiaries because
of participating in Sierra Sur.
5.1.2 Investment in productive assets, sustainability and impacts on
production
Overall, the evaluations of SLPs implemented in Asia and Africa show positive impacts
on asset accumulation, including both productive and durable assets, which go beyond
the direct effect of the asset transfer implemented by the programmes. There is also
evidence that these impacts, although observed for all income quintiles, have been higher
for better-off beneficiaries. It is also worth noting that the SLP pilots in Honduras and
Peru had much weaker impacts, particularly on productive assets.92 Strong impacts on
asset accumulation were observed for the Ethiopia pilot where the asset transfer was
combined with the consumption support linked to PSNP. Similar evidence was found in
the evaluations of the Ethiopian CP that brought together PSNP and OFSP/HABP. For
other CPs and even some OPs, there is evidence that agricultural interventions, such as
extension services and access to better technology, are likely to trigger asset accumulation
and adoption of new technologies when combined with cash transfers or public works
programmes. Positive impacts were observed for the IKP in India and the P-135 in
Vietnam as well as for the interaction between the joint implementation of different
productive programmes such as Sierra Sur, rural credit and the programme Haku Winãy
and Juntos in Peru; the CSR and EP in El Salvador; and the Bolsa Familia and PRONAF
in Brazil. However, there is only mixed evidence of the extent to which investments in
productive assets translate into greater productivity and higher business revenue with the
exception of Haku Winãy in Peru.93 The local procurement for school feeding programme
(LEAP) in Burkina Faso seems to have led members of participating farmer’s
organizations to invest more on productive assets and also increased their revenue and
profitability.
As expected, most of the evaluations of SLPs that either rely on the distribution of livestock
or on investment grants to purchase productive assets show a positive impact on livestock
92 These results suggest that, at least, as far as the SLPs are concerned, there may be challenges in implementing
this type of intervention in the LAC region, even on a small scale. 93It is somewhat risky to attribute the less striking results observed in the Latin American evaluations to the
poor implementation of CP interventions, since these evaluations have fewer of the desirable features of a
robust evaluation than those implemented in the case for SLPs (see discussion in Section 4). In addition,
Escobal and Ponce (2016a, 2016b) evaluation of the pilot Haku Wiñay in Peru, a programme that aims to
strengthen the access of Juntos beneficiaries of economic inclusion programmes, for instance, show better
results on productive impacts than other evaluations of CPs in the region, but unlike the other programmes it
was evaluated using an experimental design.

53
ownership. The relevant question is the degree to which these impacts are sustainable in the
longer term and whether beneficiaries expand or diversify their investments beyond the
initial transfers.94 As a result of the CFPR Phase 1, Ahmed et al. (2009) found impacts on
livestock and poultry ownership in the short term. Emran, Robano and Smith (2014) also
found increases in livestock as well as in other productive assets, such as fishing nets,
rickshaws and vans, and big trees, but the latter results did not hold for the poorest people.
To look at CFPR impacts on productive investments, Krishna, Poghosyan and Das (2010)
used an asset value index that included livestock and poultry as well as durable goods (e.g.
chairs, radios, televisions) and other productive assets (e.g. rickshaws and vans). They found
an increase in asset index in the short term (2002-2005); this positive impact, however, was
slightly attenuated in the medium term (2005-2008). Das and Misha (2010) and Raza, Das
and Misha (2012) found positive impacts that seemed to be sustained over the medium term,
particularly for poultry, whose numbers actually increased faster after 2005. As for other
types of livestock, the positive short-term impacts persisted in the long term.
The authors also found short- and medium-term impacts on the ownership of rickshaws and
vans. In the short term, there were no impacts on the ownership of big trees but this increased
over the medium term. Misha et al. (2014) found large increases in livestock holdings in the
short term that faded away in the longer term. CFPR Phase 1 led to an increase in the number
of cows or bulls owned by 1.5 units by 2005, but this effect decreased by 0.5 units in each
of the following survey rounds, with the overall effect to be only 0.4 units by 2011. A similar
pattern was observed for poultry, with a final effect of 0.4 units by 2011. For goats and sheep,
the positive effect observed in the short (0.3 increase) and medium (0.2 increase) term
actually vanished over time. Similar to what was observed with the impact on land access
(purchase or renting), it was the control group catching up with the treated group that
triggered the long-term impact attenuation.
Raza and Ara (2012) found an increase in livestock ownership and in total value of livestock
during CFPR Phase 2. These results were driven by cattle and poultry ownership and value
(both indicators are significant at 5 percent). No impacts were observed for small ruminants
(e.g. sheep/goats). Similarly, there was no short-term impact on ownership or value of
rickshaw/vans or big trees. The increase in livestock ownership was not unexpected, since
the programme includes asset transfers. However, there was no evidence supporting
accumulation of other productive assets in the short term. The assets distributed by the
programme were not depleted after the programme was phased out.
Bandiera et al. (2013) found that households participating in CFPR Phase 2 owned , on
average, one more cow after both two and four years, which corresponds to the average
number of cows transferred by the programme (cattle was the most commonly transferred
asset whose ownership among the targeted poor was negligible at baseline). The number of
poultry and goats also increased in line with average programme transfers by 2.42 for poultry
and 0.74 for goats. However, there was a statistically significant drop in ownership of these
assets between two and four years after the intervention started, suggesting that households
94 See McCord and Slater (2015) on the limits of a strategy that focuses solely on entrepreneurship to achieve
the objectives of sustainable and higher quality employment.

54
adjusted their stocks. Finally, the authors found that the net impact on the value of livestock
ownership reached BDT 9 983 and BDT 10 734 after two and four years respectively. Since
the average asset transfer value was BDT 9 500, the 13 percent increase in the value of
livestock ownership four years after the programme ended suggests that the asset transfer
value was preserved.95 Four years after the beginning of the programme, statistically
significant increases above the initial transfer occurred, presumably through the production
of offspring and acquisition of new livestock.96 Thus, there is some evidence of lasting
effects of productive asset transfers made by the CFPR Phase 2.
HTSPE (2011) found that the average productive asset value for cohorts with longer
participation in the Chars Livelihoods Programme (CLP) Phase 1 was BDT 37 119, above
the threshold of BDT 33 500 established for graduation. For cohorts with a shorter
involvement in the programme, the asset value was below the threshold (BDT 30 831).
Hernandez et al. (2015) found that participation in the ER+ programme in Bangladesh had
a positive effect on the accumulation of farm assets and, to a lesser extent, on non-farm and
durable assets as compared to beneficiaries who only received the “protective ER” - food
and cash for work – and non-beneficiaries. Similarly, BDI (2012) estimated that the FSUP
led to an increase in the ownership of productive assets by households, which translated into
an increase of 0.056 points in the productive asset score. The authors also found an increase
of BDT 20 802 in average household asset value.
The evaluation of the SKS Ultra Poor Program (UPP) in India by Bauchet, Morduch and
Ravi (2015) found an increase of 26pp in the likelihood of owning livestock, including
animals provided by the intervention (e.g. buffaloes and goats). It also found a small impact
on poultry ownership of 2pp, which was not a direct transfer from the intervention and would
only be significant at the 10 percent level. A positive impact on the agriculture asset index97
of 0.35 was also found, but no impact was identified for non-agricultural asset index or for
the ownership of ploughs. Since the agricultural asset index includes livestock, the
programme’s asset transfer probably drove the impact on this indicator. Moreover, the
positive impact on livestock ownership was not to the extent expected by the evaluators,
since many beneficiaries only retained their livestock for short period. In fact, the authors
found that about 43 percent of the beneficiary households had sold their livestock, mostly to
pay debts.
In Banerjee et al. (2015), pooled results for the evaluations of the six pilot Graduation into
Sustainable Livelihoods projects revealed a positive increase by 0.26 standard deviations on
the total asset index (including productive and household assets). This result holds for both
endline 1 and endline 2, showing the sustainable impacts of the programme. However, the
impact on asset growth was much larger for higher quantiles than for lower quantiles:
0.36 standard deviations for the 90th quantiles and 0.04 standard deviation for the tenth
95 According to the authors, all monetary values were deflated to 2007 prices using the Bangladesh Bank’s
rural CPI estimates. 96 Bandiera et al. (2016) explained this result by the total value of cows, which more than compensates for
the fall in the total value of goats, which actually decreased 4 years after the intervention. 97 The agricultural assets index is the principal index of agricultural durable goods and animals owned by the
household (e.g. plough, tractor, pump, livestock).

55
quantile. Breaking down this impact into different categories of assets, the authors show that
there was an increase in both household (durable) and productive assets (including
livestock), but that the increase in the latter was larger. Productive assets increased by 15.1
percent and 13.6 percent compared to the control group means for endline 1 and 2,
respectively. They also show that the impact on asset values owned by treated households at
endline 2 was lower than the cost of the asset originally transferred to them, a result that is
qualitatively similar to that reported by Bauchet, Morduch and Ravi (2015). However,
according to the authors, this relatively minor decline was entirely due to adjustments made
in the short term after the asset transfers and was observed only between baseline and endline
1. Between endline 1 and endline 2 there was no further decline. These results are robust to
country-level analysis except for Honduras, where the programme had a negative significant
impact on the total asset index and no impact on total asset value and productive asset value,
and Peru, which did not show any impact on any of these indices, except for the household
(durable) asset index. In the case of Honduras, the nature of the asset transfers (hens) could
partly explain these results, since there was a disease that killed many hens in the intervention
communities. It is also worth mentioning that, unlike other pilots where consumption support
was based on regular cash transfers, in the case of Honduras it was based on a one-time food
transfer to cover six months. This might also explain why some of the asset transfers may
have been consumed as food by beneficiaries.
The largest impacts on the total asset index, particularly on the productive asset index, were
observed in the Indian and the Ethiopian pilots (Banerjee et al., 2015). The Indian pilot,
according to the authors, is very interesting due to its similarity to the CFPR Phase 2
experimental evaluation results found by Bandiera et al. (2013). The Indian pilot took place
in West Bengal, a region quite similar98 to the intervention area in Bangladesh. Banerjee et
al. (2015) found an increase in non-agricultural, non-livestock income by endline 2,99 which
was unrelated to the economic activities promoted through the intervention. This suggests
again that households can diversify, in the medium term, beyond the assets provided by the
programme. In the case of Bangladesh, the asset diversification was into land cultivation
(see discussion above) rather than into non-agricultural assets as observed in India.
In Ethiopia, a striking feature of the interventions was that both treated and control groups
had access to the consumption support component of the interventions through the cash/food
for work component of the PSNP. Thus, that component could not be solely responsible for
the entire impact of the programme. However, as Ethiopia had the most expensive asset
transfers of all of the six pilots, beneficiaries in theory could sell some of them to compensate
for the lack of consumption support beyond PSNP payments.
Prennushi and Gupta (2014) found that the poorest beneficiaries of the IKP programme in
Andhra Pradesh, India had a higher value of livestock and durable assets than the comparison
group. In addition, the impact of the programme on investments in livestock was also larger
for Scheduled Tribes participants, who tend to be poorer than the general population.
Similarly, IRC (2012) found that P-135 II in Vietnam had a positive impact on both the asset
98 Besides sharing a border, they have the same language and culture. 99 The precise dates for endline 1 and endline 2 vary from pilot to pilot. Generally, endline 1 took place 24
months after the intervention finished and endline 2 a year after the first endline.

56
and durable goods indices for ethnic minorities and on the durable goods index for non-
ethnic minorities.
Gilligan, Hoddinott and Tafesse (2009) did not find that PSNP had any positive impact on
asset growth as measured by changes in the log value of livestock and tools between 2004
and 2006. On the contrary, the estimated impact was negative and statistically significant.
Even for the subsample that participated in both PSNP and OFSP, the impact was not
statistically significant, even though the point estimate was still negative. In any case, the
comparison group largely drove these results, as non-beneficiaries experienced faster asset
growth than the treated group.
The authors offered more evidence of the impact of both interventions on productive
investment. Agricultural interventions under the OFSP (later rebranded as HABP) include
credit, agricultural extension services, irrigation and water harvesting schemes and
technology transfer, which includes advice on food crop production, cash cropping, livestock
production, and soil and water conservation. Gilligan, Hoddinott and Tafesse (2009) found
that, relative to a comparison group that neither benefited from the public work component
of the PSNP nor from the OFSP, beneficiaries of the PNSP/OFSP were more likely to use
improved agricultural technologies, observing a 10.7pp increase in the usage of fertilizers
and a 4.8pp increase in the use of improved seeds. These represent significant effects in
relation to the comparison group, since only 16 percent of households used fertilizer, while
also improved seeds started from a very low base. Further, beneficiaries of the PNSP/OFSP
were also more likely to own any non-farm business (6.7pp increase). Beneficiaries of both
programmes were also more likely to use credit, but had more problems repaying loans and
did not experience faster asset growth as per the aim of the OFSP programme. The authors
also looked at the impact on public work beneficiaries who did not receive the PSNP
combined with the OFSP. For these beneficiaries, there were no impacts on the use of
improved agricultural technology, but there were positive impacts on the ownership of non-
farm businesses. Thus investments on inputs seemed to be mostly driven by the combination
of the PSNP with the OFSP.
Hoddinott et al. (2012) investigated the relative impact of PSNP both alone and jointly with
OFSP/HABP on fertiliser use and agricultural investment by farmers growing cereals in
Ethiopia between 2006 and 2010. They found that high levels of participation in the PNSP
alone had no impact on fertiliser use or on investments in stone terracing or water harvesting
but it did increase the probability of investing in fencing by 17pp. Where the OFSP/HABP
interacted with high levels of PNSP payments (5 years), they found increases in the
probability of using fertiliser and investments in fencing by 21 pp and 29 pp, respectively as
compared to low participation in PNSP and no access to OFSP/HABP. Either adding the
OFSP/HABP for farmers receiving high doses of PSNP (five years of payment for public
work) or increasing public work payments to farmers receiving OFSP/HABP improved the
probability that they would use fertiliser and invest in stone terracing and fencing. The point
estimates do not indicate which combination of public work payments and OFSP/HABP
support is most effective, but it does show that combining agricultural and social protection
interventions can lead to higher levels of investments with potential long-term benefits
(Hoddinott et al., 2015).

57
Hoddinott et al. (2012) also showed that households receiving both OFSP/HABP support
and five years of PSNP payments had significantly higher yields (kg/ha) than OFSP/HABP
beneficiaries with fewer years of PSNP payments. However, households benefiting from
longer periods of PSNP transfers and OFSP/HABP support did not have significantly higher
yields than those who did not benefit from OFSP/ HABP support and received fewer years
of PSNP transfers. This result suggests that OFSP/HABP beneficiaries with more years of
PSNP payments to support increased fertiliser use and agricultural investments were not able
to translate such investments into improvements in yields, as compared to those who only
received PSNP payments. Limitations of the evaluation design may partially explain the
failure in finding positive impacts, which suggests that evaluations should look at how
effectively investments in inputs are translated into higher yields.
Dewbre et al. (2015) found strong impacts on agricultural assets among joint beneficiaries
of the CGP and LFSSP in Lesotho. The use of any kind of agricultural assets increased by
11pp (13pp for hoes, 6pp for sprayers, and 8pp for tractors) among farmers that benefited
from both interventions. The ownership of some of these assets also increased – by 20pp for
hoes, 4.7pp for planters and 4.8pp for cultivators. These impacts were largely absent among
farmers that participated in two years of CGP only, with the exception of ploughs, whose
use increased. There were reductions in the purchase of pesticides corresponding to an
increased use of home-produced pesticides and an increase in the use of seeds, particularly
in labour-constrained households, corresponding with a decrease in seed purchases, since its
distribution was part of the LFSSP. It is interesting to observe that impacts on crops were
larger than the impact on livestock as stocks of the latter had actually been reduced after two
years of the CGP; an additional year of CGP plus LFSSP seems to have somewhat attenuated
this negative effect.
Pace et al. (2016) estimated the impact of benefiting from both the SCTP and the FISP in
Malawi as well as the impacts each programme on its own as compared to a control group
that did not benefit from either. Differences between the total impact (SCTP+FISP) minus
each one of the “single” impact of each one (SCTP or FISP) or the sum of their impact yield
the degree of complementarity (or synergies) between the two programmes. They found that
both programmes increased the probability of having chickens and goat/sheep and the
average numbers of the animals owned by the household. However, the total incremental
effect (synergy) was not statistically significant, except for the number of goats and sheep.100
The synergistic effect was positive for both ownership and quantity of pigeons, doves and
ducks. Similarly, both programmes led to increased expenditures and revenues from these
livestock, but the total incremental effect was not statistically significant, except for in
labour-constrained households. Synergies were not observed for ownership and quantities
used of agricultural inputs. Participation in FISP significantly increased the percentage of
fertilizer users by 47.2pp, increased the quantity of chemical fertilizers used and decreased
the quantity of organic fertilizers used. It also increased the percentage of users of improved
or hybrid seeds by 12.5pp. The joint impact of FISP and SCTP was positive and significant
100 As baseline values are quite low, the synergistic effect had an impact of 93 percent over the baseline level
of the control group (0.074 units) and the total impact of the combined programmes was 221 percent (0.238
units).

58
only for chemical fertilizers. As for production indicators, the authors did not find any
synergies. FISP did help SCTP beneficiaries to produce more maize, but it did so through an
additive rather than a multiplicative process. On its own, FISP increased the percentage of
households engaged in maize production (by 6.7pp) and also the quantity of maize produced,
especially in labour-constrained households. Participation in SCTP alone increased both the
proportion of households growing groundnut and the quantity they produced: the point
estimates are similar to the impact observed for the FISP for both indicators. There was no
positive synergistic effect on the value of total production, but FISP had overall positive and
statistically significant effects (52.2 percent over the baseline level) and the SCTP had
positive effects for labour-unconstrained households (22.3 percent over the baseline level).
Upton et al. (2012) showed that members of famers’ associations that participated in local
procurement for supplying the school feeding programme in Burkina Faso increased their
purchases of small productive assets such as hoes and shovels. Moreover, these farmers
increased their purchases of larger traction assets such as traction animals and vehicles.
According to the authors, these positive impacts on productive asset purchases suggest that
the purchases may have led to improvements in on-farm management practices and
productive efficiency. In addition, the LEAP led to an increase of 25 percent on the average
revenue from farmers from participating organizations.
Aldana, Vásquez and Yancari (2016) showed that rural beneficiaries of the Juntos
programme in Peru who also received the capacity development components of Sierra Sur
were more likely to adopt more productive practices after receiving the treatment, in
particular those practices related to better natural resource management. They also invested
more financial resources in both agriculture and animal husbandry than a matched sample
of Juntos-only beneficiaries did. However, the adoption of better production technologies
and more investment did not lead to a positive impact on net gross income, which was
actually negative and statistically significant. The authors speculate that differences between
treated and comparison areas, where the latter has better market connectivity, may explain
this negative result.101 Moreover, it was not possible to apply difference-in-differences given
the lack of a proper baseline. Thus, the authors relied on propensity score matching single
ex post differences to estimate these impacts.102 In any case, heterogeneity analysis shows
that better-educated households (head and spouse) with a higher initial level of assets
experience larger and statistically significant impacts on both gross and net income.
Looking at the overlap of Juntos and the rural credit programme, Del Pozo’s (2014) findings
suggest that beneficiaries with access to agricultural credit were able to invest more in
poultry. The point estimate suggests an increase of 3.92 units, which represents an impact of
52 percent over the control group at baseline. This impact is similar across different
agricultural credit providers (public banks and microfinance institutions). No impact was
found for other types of animals (cow, sheep, and goats) or other agricultural assets.
101 The authors also cite the results of a qualitative evaluation that seem to suggest that the revenue of the Juntos
beneficiaries improved after they received the capacity building component of Sierra Sur. 102 Note that qualitative interviews also reported in Aldana, Vásquez and Yancari (2016) suggested that the
adoption of the new practices led to an increase in production and household net income. Thus the qualitative
results are at odds with the quantitative results.

59
The author concludes that Juntos beneficiaries that benefit from rural credit are more likely
to invest in more liquid assets such as poultry.
Escobal and Ponce (2016b) found an increase in the number guinea pigs owned by Juntos
beneficiaries who participated in the pilot Haku Wiñay compared to the control group, which
mostly received only Juntos. Although the increase in the number of hens owned was not
statistically significant, there was an increase in egg production, seven times higher than the
baseline values. This increase has been clearly attributed to the new technologies transferred
by the programme. Moreover, there was also an increase in both natural and cultivated
pasture, which was higher for the latter (37pp). This increase in pasture was mostly used to
feed the farm’s own animals instead of selling in the market. The authors also found
increases in the number of new varieties of green leaves, vegetables and fruits as well as
increases in the sales revenues from green leaves and vegetables.
In Colombia, Moya (2016) found that Oportunidades Rurales had a positive impact on
productive and total asset value, but no impact on production, access to financial markets or
farmers’ markets. The interaction between Oportunidades Rurales and the CCT programme
Familias en Acción had a negative impact. The author found evidence that farmers who were
beneficiaries of Familias en Acción at the time they participated in Oportunidades Rurales
experienced a reduction in the value of productive and total assets. According to the author,
three factors can explain these negative results: 1) beneficiaries’ fears that they could lose
their eligibility for the cash transfers if they took part in Oportunidades Rurales and
increased their level of asset ownership; 2) Oportunidades Rurales was designed for
better-off farmers and not the extremely poor who are the beneficiaries of Familias en
Acción; and 3) the fraudulent last minute inclusion of beneficiaries of Famlias en Acción
(SISBEN level 1) in farmers’ organizations so that they could apply for the Oportunidades
Rurales resources.
De Sanfeliú et al. (2016) assessed the impact of the joint implementation of El Salvador’s
CCT programme, Comunidades Solidarias Rurales, and rural development interventions,
which are divided into food and nutritional security (SAN) interventions that targeted the
poorest smallholders and productive value chain (EP) interventions for well-off
smallholders. The authors found that receiving both the CCT and the EP support had positive
impacts as opposed to just receiving EP. Households with both types of support were
between 10 to 15 pp more likely to introduce a new crop or type of animal (livestock or
poultry) compared to similar households that only received the EP. However, no statistically
significant impacts were found for indicators such as asset index (durable and productive),
agricultural income or productivity (value of crop per area). Farmers who received both CCT
and SAN interventions were 13 to 15pp more likely than SAN-only recipients to have access
to formal credit. No other impact on agricultural investment or production was found.
The authors also compared farmers who took part in a SAN intervention after leaving the
CCT programme with former CCT beneficiaries who did not benefit from SAN and found
that the former group had more assets. Overall, the evaluation of the interaction between the
three types of interventions suggests that participating (or having participated) in CCT
programmes enables access to formal credit. Moreover, continuous receipt of the transfers
60
seems to be important in that it allows beneficiaries to adopt new productive assets, possibly
under the influence of the advice and information received through SAN activities.
Garcia, Helfand and Souza (2016) assessed the impact of expanding the coverage of Bolsa
Familia and rural credit for family farmers (PRONAF) at the municipal level in Brazil.
They found that PRONAF had no impact Bolsa Familia had negative impact on agricultural
productivity (value of the production in BRL/ha103). However, the interaction of both
programmes is positive, meaning that participation in both Bolsa Familia and PRONAF
would have a positive impact on agricultural productivity. However, as only 2.6 percent of
family farmers received both programmes at the same time, the positive effect of the
interaction was too small to compensate for the direct negative impact of Bolsa Familia.
Overall these results are robust across regions and different farm sizes (500ha, 100ha, 20ha).
Although there is some minor regional variation between the Northeast and the South of the
country, the estimates for the interaction component are always positive.
The authors also looked at the channels through the two programmes could be affecting the
outcome of interest. They found that growth in PRONAF coverage was associated with
higher expenditures on production, such the purchase of fertilizers, farm machinery and
tractors, reduction in family labour and access to electricity. On the other hand, the expansion
of social protection programmes like Bolsa Familia was associated with a lower value in
production, lower expenditures on production, fewer tractors per farm and less money spent
on fertilizers, but also with a higher proportion of farms using fertilizers, machinery and
technical assistance. Finally, the interaction effect has a positive association with the value
of production, the use of family labour, access to electricity and technical assistance, but a
negative association with machinery, tractors per farm and expenditures on fertilizers.
The authors conclude that these results suggest that the expansion of Bolsa Familia had
negative impacts on productivity possibly due to the reduction in both adult and child labour
caused by the programme. However, they also note some positive productivity impacts, such
as the increase in access to electricity, and greater expenditures on productive inputs such as
fertilizers and machinery.
A clear recommendation from the Garcia, Helfand and Souza (2016) evaluation is to better
integrate the two programmes in order to exploit positive synergies. Notice that unlike other
results, the synergies reported in Garcia, Helfand and Souza (2016) are at the municipal
level, thus capturing the impact of the programme on both beneficiaries and non-
beneficiaries.
103 Brazilian currency (Reals)

61
Table 7 Impacts of combined programmes on productive investments
Indicator Impact Country Combined
programme
(category)
Land ownership,
access to land or
cultivated land
Positive: short term – a year after the programme,
mostly homestead land - Ahmed et al. (2009); Emran,
Robano and Smith (2014)
Positive: medium term, also ownership of cultivable
land - 4 years after end of programme – Raza, Das and
Misha (2012) and Das and Misha (2010)
Positive, but stagnating: long term - no additional
gains after seven years - Misha et al. (2014)
Positive: short term (more rented than owned land) -
Raza and Ara (2012)
Positive: short and medium term (more rented than
owned land, but significant for both) – Bandiera (2013)
No impact: land ownership – Bauchet, Morduch and
Ravi (2015)
Positive: land cultivation by the poorest – Prennushi
and Gupta (2014)
Positive: operated land – Dewbre et al. (2015)
Positive: cultivated land (higher than CCT only) – Del
Pozo (2014)
No impact: land ownership
Bangladesh
Bangladesh
India (Andhra
Pradesh)
India
Lesotho
Peru
Peru
CFPR (Phase 1)
(SLP)
CFPR (Phase 2)
(SLP)
Graduation into
Sustainable
Livelihoods –
SKS (SLP)
IKP (CP)
CGP+LFSSP
(CP)
Juntos and rural
credit (OP)
Juntos and
Sierra Sur (OP)
Productive assets
Positive: short term – livestock and poultry – Ahmed et
al. (2009) and fishing nets, rickshaws and vans and big
trees – Emran, Robano and Smith (2014).
Positive: medium term – asset value index (larger
impact in the short term) – Krishna, Poghosyan and
Das (2010), Das and Misha (2010) and Raza, Das and
Misha (2012) report similar results as Emran, Robano
and Smith (2014) also for the medium term.
Positive, but stagnating: long term - no additional
gains after seven years - Misha et al. (2014)
Positive: short term – livestock ownership (cattle and
poultry) and total value of livestock but not beyond
what has been distributed by the programme – Raza
and Ara (2012)
Positive: medium term – cattle, poultry, and goats.
Value of livestock owned increased over the value of
the initial transfer after four years (by 13 percent) –
Bandiera et al. (2013)
Positive: value of productive assets (e.g. land,
livestock, boat, rickshaw, etc) - HTSPE (2011)
Positive: productive farm assets, non-farm assets and
durable goods – Hernandez et al. (2015)
Bangladesh
Bangladesh
Bangladesh
Bangladesh
Bangladesh
CFPR (Phase 1)
(SLP)
CFPR (Phase 2)
(SLP)
CLP (Phase 1)
(SLP)
ER+ (SLP+CP)
FSUP (SLP)

62
Positive: productive asset ownership– BDI (2012)
Positive: agricultural asset ownership (including
livestock)
No impact: non-agricultural asset index and plough
ownership – Bauchet, Morduch and Ravi (2015)
Positive: value of livestock and durable assets –
Prennushi and Gupta (2014)
Positive: asset index and durable good index for non-
ethnic minorities – IRC (2012)
Negative: value of livestock and tools
Positive: use of improved agricultural technologies
(fertilizers, improved seeds) and ownership of non-
farm businesses – Gilligan, Hoddinott and Tafesse
(2009)
Positive: fertilizer use and investments in fencing and
terracing – Hoddinott et al. (2012)
Positive: use of agricultural assets and ownership of
some of them - Dewbre et al. (2015)
Positive or neutral and no synergistic effect: use of
chemical fertilizers and improved seeds (FISP only) –
Pace et al. (2016)
Positive: increase in purchase of small productive
assets by participating farmer’s association members
and in larger traction assets by those farmers that
participated in the local procurement. – Upton et al.
(2012)
Positive: adoption of more productive practices and
more investments in crop production and animal
husbandry – Aldana, Vásquez and Yancari (2016)
Positive: investment on poultry
No impact on other types of animals or other
agricultural assets – Del Pozo (2014)
Positive: guinea pig
No impact: hens – Escobal and Ponce (2016b)
Negative: value of productive and total assets – Moya
(2016)
Positive: introduction of a new crop or a new type of
animal (CCT and EP)
No impact (synergy) was found for other indicators –
De Sanfeliú et al. (2016)
Positive access to technical assistance and electricity
Negative machinery, tractors per farm and expenditure
on fertilizers – association of the interaction term –
Garcia, Helfand and Souza (2016)
India (Andhra
Pradesh)
India
Vietnam
Ethiopia
Ethiopia
Lesotho
Malawi
Burkina Faso
Peru
Peru
Peru
Colombia
El Salvador
Brazil
6 countries:
Ethiopia,
India,
Pakistan,
Graduation into
Sustainable
Livelihoods –
SKS(SLP)
IKP (CP)
P-135 II (CP)
PSNP and
OFSP (CP)
PSNP and
HABP/OFSP
(CP)
CGP and
LFSSP (CP)
SCTP and FISP
(OP)
LEAP (CP)
Juntos and
Sierra Sur (OP)
Juntos and rural
credit (OP)
Juntos and
Haku Wiñay
(CP)
Más Familias
en Acción and
OR (CP)
CSR and rural
development
interventions
(OP)
Bolsa Familia
and PRONAF

63
Positive total asset index (productive and durable
household assets, but higher for the former) in endline
1 and endline 2 – aggregate results for 6 countries and
individual country evaluations except for Honduras:
Negative impacts on total asset index and
No impact on total asset value and productive asset
value In Peru: No impact on asset indices except for
positive impacts on household durable asset index –
Banerjee et al. (2015)
Ghana, Peru
and Honduras
(rural credit)
(OP)
Graduation into
Sustainable
Livelihoods
(SLP)
Production and
productivity
Mixed: crop productivity (kg/ha) - positive or no
impact depending on control group – Hoddinott et al.
(2012)
Positive but no synergistic effect: total value of
production (particularly for FISP), production of maize
(FISP only), production of groundnuts (both SCTP and
FISP) – Pace et al. (2016)
Positive: increases in revenue and profitability of
farmers from farmers organizations participating in the
local procurement – Upton et al. (2012)
Positive: increase in the number of variety of green
leaves, vegetables, fruits cultivated as well as on the
sale revenue from green leaves and vegetables.
Increases in egg production (in kg); access to
cultivated and natural pasture – Escobal and Ponce
(2016b)
Positive: the interaction effect on agricultural
productivity is positive – Garcia, Helfand and Souza
(2016). Interaction term is positively associated with
value of production, for the use of family labour,
access to electricity and access to technical assistance,
but negatively associated with machinery, tractors per
farm and expenditures on fertilizers
Ethiopia
Malawi
Burkina Faso
Peru
Brazil
PSNP and
OFSP/HABP
(CP)
SCTP and FISP
(OP)
LEAP (CP)
Juntos and
Haku Wiñay
(CP)
Bolsa Familia
and PRONAF
(OP)
Source: Authors’ own elaboration.
5.2 Strengthening risk management
As discussed in the theory of change presented in the introduction to this report, both
agricultural and social protection interventions can help beneficiaries to better manage the
risks they are exposed to, particularly those related to rural livelihoods. Regular and
predictable social transfers, including public works, can prevent the depletion of productive
assets when income shocks occur – a dimension incorporated into the SLP framework by
the consumption support component – while, at the same time, encouraging rural households
to invest more in their livelihoods by diversifying into higher-yield crops and livestock
activities. By the same token, agricultural interventions can provide technical assistance and
extension services on the sustainable management of natural resources, soil and water
conservation practices, forestry and agroforestry, small-scale irrigation schemes, access to
improved seeds and new technologies; such assistance can build resilience to economic as
well as to environmental risks. Many of the evaluations selected for this review look at
outcomes related to strengthening risk management by rural households that have benefited

64
from agricultural and social protection interventions. Some of the interventions had stronger
risk management as a clear objective while others were less ambitious.
Indicators related to access to credit and savings, formal and informal risk-sharing
arrangements, crop diversification and diversification of income sources, and reduction in
negative risk-coping strategies have been used to assess how the combined interventions are
supporting (and improving) the risk management strategies of their beneficiaries.
Table 8 summarizes the main findings, which are discussed below.
5.2.1 Access to credit and savings
Overall, the evaluations of SLPs show positive impacts on savings and access to formal
credit. As mandatory or incentivized savings is a key component of many of the SLP
interventions this result does not come as a surprise. However, impacts seem to be
attenuated when the programme is phased out. The evaluations also show positive impacts
on credit access and/or a shift away from informal towards formal loans. A note of caution
refers to the fact that positive impacts on financial inclusion seem to be restricted to better-
off participants. Evaluations of CPs also show positive impacts on access to credit for
beneficiaries such as in the case of the combination of the PSNP and the OFSP in
Ethiopia. In Peru, Haku Wiñay seems to change the knowledge and perception of
beneficiaries about financial services, but does not seem to have an impact on their usage.
There have been positive impacts even in the context of OPs. For instance, in El Salvador,
participation or having participated in the CCT programme seems to have made it easier
for food and nutritional security project beneficiaries to gain access to credit, particularly
formal credit.
The evaluations of CFPR Phase 1 revealed an increase in cash savings and formal loans and
as well as a decrease in informal loans. Ahmed et al. (2009) showed that at baseline only
eight percent of treated and 13 percent of the control group had cash savings. The difference-
in-differences estimates yield an increase of 71pp in the proportion of CFPR Phase 1
participants with cash savings a year after the end of the intervention. This effect corresponds
to an increase of 446 percent over the baseline level of the control group. Emran, Robano
and Smith (2014) confirm this result, which is robust across different comparison groups and
estimation methods. Krishna, Poghosyan and Das (2010) and Das and Misha (2010) found
that this impact is sustained over the medium term (from 2002 to 2008), but Misha et al.
(2014) showed a smaller impact over the long term (from 2002 to 2011) that was entirely
due to the control group catching up with the treated group. In 2002, about 20 percent of the
control group had cash savings; this proportion had increased to 53 percent by 2011 but was
still far from the 92 percent of former beneficiaries of CFPR Phase 1 that reported cash
savings.
Misha et al. (2014) and Raza, Das and Misha (2012) also assessed the impact of CFPR Phase
1 on the proportion of households with formal and informal loans and the value of these
loans. Misha et al. (2014) revealed a sharp increase of 32.4pp from 2002 to 2005 in the
proportion of beneficiaries with outstanding loans. This increase was somewhat attenuated
in the medium and long term with an impact of 22.7pp (from 2002 to 2008) and 13.2pp (from
2002 to 2011), respectively. The proportion of beneficiary households with formal loans

65
seems to have stabilized slightly above 50 percent, up from a 2002 baseline of 3.6 percent,
while the proportion of control households with formal loans increased since 2008, reaching
42 percent in 2011.
Misha et al. (2014) also showed that the CFPR Phase 1 seems to have led to a reduction in
informal loans of -11.4 pp in 2005, -11 in 2008 and -8.3 in 2011. Raza, Das and Misha (2012)
only reported on the value of outstanding formal and informal loans in the short (2002 to
2005) and medium term (2002 to 2008), but found results that are qualitatively similar to the
ones found in Misha et al. (2014). The impact of the programme on the value of outstanding
loans was positive for formal loans and negative for informal loans, both in the short and the
medium term. The impact on formal loans was smaller in the medium term, BDT 634 in
2008, than in the short term, BDT 806 in 2005. For informal loans, there was no statistically
significant difference between the short and medium term despite the point estimates
suggesting a fall of BDT 118 in 2005 and BDT 188 in 2008. The authors considered these
results encouraging and in line with the programme objectives and argued that the demand
for microfinance loans for working capital is quite elastic, meaning that an incremental
increase in income or savings, as experienced by the beneficiaries of the CFPR Phase 1,
would lead to a reduction in the demand for loans, hence a smaller impact in the medium
term.
Raza and Ara (2012) assessed the short-term impact of CFPR Phase 2 on savings. Their
difference-in-differences estimates with propensity score matching revealed an increase of
BDT 968.5, which represents 273 percent of the baseline level of the comparison group.
Detailed information on the modality of savings suggests that the bulk of this change was
due to the CFPR Phase 2 savings promotion. Bandiera et al. (2013) showed statistically
significant positive impacts on savings both two years (2009) and four years (2011) after the
end of the programme, with point estimates of BDT 983 and BDT 1051, respectively.
The latter represented a ten-fold increase in relation to the baseline level. Bandiera et al.
(2016) also looked at whether the household received loans and gave loans. The authors
found positive impacts for both indicators after two and four years of the intervention – an
increase of 11pp (61 percent increase relative to the baseline) in the proportion of households
receiving loans and of 5 pp (464 percent increase relative to the baseline) on the proportion
of households making loans. The experimental evidence provided by the authors
corroborates the non-experimental evidence from the CFPR Phase 1 and 2 and actually
suggests somewhat stronger impacts.
Hernandez et al. (2015) found that participation in the ER+ programme had a positive effect
on a household’s total savings, with ER+ beneficiaries saving BDT 2 900 more than the
comparison group. This value corresponds to 50 percent of savings at the baseline level for
the overall sample of treated and control group. The authors also found that ER+
beneficiaries were more likely to have savings (from 12pp to 27pp, depending on control
group and estimation methodology) and particularly to save for future investments, estimates
ranging from 17pp to 33pp. No impact on loans or access to credit was noted in the
evaluation paper, although the list of topics covered in the survey questionnaire does include
information on both loans taken and loans made.

66
BDI (2012) difference-in-differences evaluation of the FSUP found an increase of 62pp in
the proportion of beneficiary women with savings. Furthermore, the average level of savings
increased by BDT 2 624, which corresponds to an increase of 83 percent over the baseline
level of the comparison group. As for loans, the authors found a decrease of seven percent
in the proportion of beneficiary women with loans, but an increase in the value of the loan
by BDT 1 283, around 21 percent of the baseline level of the comparison group.
In their analysis of the pooled data for six pilots of the Graduation into Sustainable
Livelihoods project, Banerjee et al. (2015), found very similar results to those reported in
several of the evaluations of the SLP in Bangladesh. Overall, they reported positive impacts
on total savings and the total amount deposited in savings during the previous month.
However, the impacts were stronger in the short term (endline one) than in the medium term
(endline two). There was an increase in total savings of PPP US$151 by endline one that was
halved to PPP US$75 by endline 2.104 Similarly the positive impact on the total amount
deposited in savings in the previous month fell from PPP US$7.25 to PPP US$3.64 during
the same period. The authors note that savings were mandatory during the first year of many
of the pilots assessed, but not afterwards. Thus the increase observed by endline one is not
surprising, however, the positive impact at endline two reveals some sustainability of this
behavioural change, albeit attenuated. Disaggregated impacts by countries at endline 2 show
no impacts on total savings in Honduras, although the point estimate is positive
(PPP US$31.70) and very strong positive results for Ethiopia (PPP US$272). Positive and
statistically significant impacts are reported for Ghana (PPP US$10.5) and Peru (PPP
US$45.1).105 In addition, the impact on the total amount deposited in savings in the previous
month was only statistically significant for Ethiopia (PPP US$8.16), although the point
estimates for all other countries were always positive.106
As for credit indicators, Banerjee et al. (2015) found no impact on the total amount borrowed
over the past 12 months, but this result hides a movement away from informal borrowing
towards formal borrowing that is only observed by endline 2. Whereas the total amount
borrowed from formal sources increased by PPP US$22.7, the total amount borrowed from
informal sources fell by PPP US$41.3. Disaggregated impacts by countries at endline 2 show
increases in the total amount borrowed in the last 12 months for Ethiopia (PPP US$61.3),
India/Bandhan (PPP US$111) and Ghana (PPP US$13.1) and decreases for Pakistan, a fall
of PPP US$193. No impacts were found for Peru or Honduras. As for amounts borrowed
from formal and informal sources, the pattern is not as clear as for the pooled sample.
There were positive impacts on borrowing from informal sources for Ethiopia (PPP
US$24.9), coupled with an even larger increase in borrowing from formal sources (PPP
104 Banerjee et al. (2015) express monetary indicators in international US dollars, i.e. dollars evaluated at the
purchasing power parity (PPP). Using the PPP rate for currency conversions, a given amount of one currency
has the same purchasing power whether used directly to buy a market basket of goods or used to convert at
the PPP rate to another currency and then purchase the same market basket using that currency. PPP
exchange rates help to minimize misleading international comparisons that can arise with the use of market
exchange rates. 105 No indicator for total savings was available for India (Bandhan) and Pakistan. 106 There is no indicator for the amount deposited in savings in the previous month for Ghana.

67
US$36.2). In Pakistan, there was a reduction in informal borrowing of PPP US$203, but with
no impact on formal borrowing (total borrowing was reduced as seen above). In India, there
was an increase in formal borrowing (PPP US$90.4) and no impact on informal borrowing
(although the point estimate is positive). No impacts on either formal or informal borrowing
were found to have occurred in Honduras and Peru.107
The authors looked at possible spillover effects of the intervention on eligible non-
beneficiaries living in the same village, using a financial inclusion index based on formal
borrowing, informal borrowing, total amount deposited into savings, and total savings
balance, and find no evidence of spillovers. This analysis, however, was only possible for
the pooled data from Ghana, Honduras and Peru since two types of randomized control
groups (from the same village and from control villages) were only available for these three
pilots. Using the same index to gauge the overall impact of the interventions on financial
inclusion, the positive impact was not statistically significant for Peru and Pakistan.
Finally, Banerjee et al. (2015) reported on the quantile treatment effects for the financial
inclusion index and found that the positive impacts were driven by the top quantiles (median
and above). Thus it seems that the poorest people covered involved in these programmes
still struggle to gain access to credit and savings, suggesting that there is an income/resource
threshold that has not been reached to enable overcoming that barrier.
Bauchet, Morduch and Ravi (2015), in their analysis of the SKS/UPP pilot of the Graduation
into Sustainable Livelihoods project, failed to find any impact on indicators such as the
proportion of households with savings and total savings balance. It is important to note,
however, that the proportion of households with savings and the balance of their savings
increased between baseline and endline in both treated and control groups. While 65 percent
of the treated group reported having savings at the endline, up from 59 percent, the figure
for the control group was 60 percent, up from 51 percent. Similarly, the per capita savings
balance of the control group almost tripled, while the treated group slightly doubled their
baseline value. The authors comment that positive impacts, not reported in the paper,
were found immediately after the end of the intervention, which had mandatory savings as
one of its components. Moreover, they note that a qualitative study showed that 36 months
after the end of the intervention “almost all participants had withdrawn their savings and
closed the post office account that had been opened for them during the programme”. Such
behaviour may be due to a preference to keep cash savings at home or to use savings to repay
outstanding debts.
Bauchet, Morduch and Ravi (2015) also show that the intervention did not have an impact
on access to credit, based on indicators of the likelihood of having outstanding loans, the
number of outstanding loans and the total amount of loans outstanding. Thus the drop in
debt, which was reported as one of the causes for a lack of impact on savings, does not seem
to be enough to drive any differential trend between treated and control groups as per their
total amount of loans outstanding. Further results related to the sources of loans suggest a
small but statistically significant increase in the use of loans from shopkeepers by treatment
households, but no other statistically significant difference between the two groups was
107 There is no disaggregated indicator for formal and informal borrowing in the case of Ghana.
68
found, not in loans from microfinance institutions or self-help groups, which was a
long-term objective of the graduation strategy.
Blattman et al. (2014) found that participation in savings groups increased, as did the amount
of savings, loans and perceived access to credit as a result of the SLP WINGS programme
in Uganda. These results were observed for female and male beneficiaries. Phase 2 of the
programme focused on the impact of family coaching visits. Total savings were 19 percent
higher among those receiving two follow-up visits and an additional 22 percent higher
among those with five follow-up visits. Additional visits did not have an impact on debt or
on the number of beneficiaries participating in savings groups, but being involved in a
savings group seemed to have a positive impact on both indicators. Higher number of visits
also appeared to contribute positively to perceived access to credit.
Prennushi and Gupta (2014) analyse the impacts of the IKP using three income categories:
very poor, poor and non-poor. They further classify beneficiaries by their entry cohort into
the programme, namely, early cohort which proxies the long-term effects and mid- and late
cohorts that proxy the medium- and short-term effects, respectively. They found that the
intervention had a positive and statistically significant impact on the savings of beneficiary
women from the “very poor” category who belonged to the mid- and late- entry cohorts, 217
percent and 1,231 percent, respectively. However, impacts for the early cohort were small
and not statistically significant, suggesting no long-term impacts for the very poor
beneficiary women. In contrast, for the poor beneficiaries category, a positive and
statistically significant impact was only found for women from the early cohorts, and hence
who were in the programme for a longer period (Rs 3,590 or 62 percent). No impacts were
reported for non-poor beneficiaries. As for credit-related indicators, beneficiary women
borrowed 2.5 times more than non-beneficiaries. The authors found larger impacts for the
very poor beneficiaries who were in the programme for a longer time (early cohort) than for
other income and entry groups. These results were expected as the IKP has savings
promotion as one of the key activities of the self-help groups in India in which the
intervention is based.
Gilligan, Hoddinott and Tafesse (2009) looked at the impact of PSNP both alone and
together with OFSP on credit use and self-reported difficulties in repaying debt in Ethiopia.
They found that PSNP on its own had a positive impact on credit use (7pp), but that this
impact was mostly due to payment delays, which led beneficiaries to borrow against future
payments, showing that reasonable predictable social transfers may facilitate access to credit
for consumption. In addition, they also found a positive impact (12.3pp) on credit use for
beneficiaries of the combined PSNP and OFSP. Such a result is not surprising as production
credit is one of the components of the OFSP, and 40 percent of households in the sample
reported benefiting from both PSNP and OFSP.
Escobal and Ponce’s (2016b) evaluation of the combined Juntos and Haku Wiñay, which has
a strong component of financial literacy, found a positive impact on the knowledge that
beneficiaries had of the financial system as well as an improvement in beneficiaries’ level
of confidence on the financial system. The level of confidence, however, was still very 1.6
on a 10-point scale and the impact of the intervention was of 0.6.

69
Moya (2016) reported that Oportunidades Rurales did not improve the access of
beneficiaries to financial assets. Microinsurance, which is one of the components of the
programme (offered to family farmers with a subsidy), had only a short-term impact and
after the end of the intervention farmers did not renew their policies. Nor was there any effect
on access to formal financial services, which is explained by the low take-up rate of this
component among beneficiaries largely due to the usual barriers faced by family farmers to
access formal credit. In addition, the authors found a negative impact on access to informal
financial services. Access increased during the programme while beneficiaries were closer
to farmers’ organizations. However when the programme ended, the access dropped.
The limited impact on access to markets, which should have been facilitated by the farmers’
organizations, corroborates this finding. Most family farmers (75 percent) take their produce
to the market as independent producers rather than as members of farmers’ organizations or
cooperatives. Overall, the impacts of the programme did not endure beyond its
implementation phase. As for synergies between Oportunidades Rurales and Familias en
Acción, the results reported by Moya (2016) suggest that, if anything, the impacts were even
more negative for smallholders from Oportunidades Rurales who were also Familias en
Acción beneficiaries with regard to access to microinsurance (early cohort) and formal credit
(late cohort).
De Sanfeliú et al. (2016) reported some interesting results arising from the combination of
the CSR CCT programme and SAN (food and nutritional security) projects on financial
inclusion indicators. For example, the proportion of households with access to formal credit
is between 13pp to 15pp higher among households that benefited from both programmes as
compared to those that just benefited from SAN projects. The authors also found that former
CCT beneficiaries who joined a SAN project were more likely to have access to credit (6pp
to 8pp)108 than those who did not. Finally, SAN project beneficiaries who were former CCT
beneficiaries were more likely to have access to formal credit (between 5pp to 8pp) than
those who only had access to SAN projects. These results suggest that participating or having
participated in a CCT programme makes it easier for SAN project beneficiaries to have
access to formal credit.
5.2.2 Diversifying economic activities and sources of income
Overall, the evaluations of the combined programmes show some diversification of
economic activities in agriculture (including homestead gardens and livestock raising),
but also a shift away from agriculture towards non-farm businesses. In many of the SLPs,
programme beneficiaries used part of the livestock revenue to foster high-return crop
production (FSUP). The diversification into non-farm businesses was more common in
programmes with a clear objective to enable vulnerable households to have a non-farm
source of income, such as in Nicaragua (CCT+ investment grant) and Uganda (WINGS).
This type of impact was also found in the combination of PSNP and OFSP in Ethiopia (as
well as for the PSNP only), and in the ER+ in Bangladesh. In the case of some CPs and
OPs, economic diversification was part of the agricultural programme, usually as
extension services and implied the introduction of new crops. In the case of Haku Winãy
108 For the indicator of formal credit or formal current account, the point estimates vary between 8pp and 11pp.

70
in Peru, a typical CP, there has been not only diversification on crops (new fruits and
vegetables), but also increases in both agricultural income and non-agricultural income
and a fall in wage income (led by rural wage). Thus, as in the case of rural SLPs, rural
CPs may lead to a change in the sources of income of households favouring
self-employment sources.
Some of the outcomes reported on the role of combined programmes in supporting
investment and productive asset accumulation also relate to their role in strengthening risk
management. The evaluation of the FSUP in Bangladesh revealed that some beneficiaries
had diversified away from assets handed to them – mostly bulls – into high-return crops
(BDI, 2012). Hernandez et al. (2015) suggest that farmers in the ER+ programme were using
the revenue from livestock production to improve their rice productivity, indicating a
diversification of sources of income that could protect the beneficiaries against shocks.
However, the authors also reported that there were no impacts on non-rice cultivated areas
nor on the total production of non-rice products, implying a lack of diversification within
crop production. De Sanfeliú et al. (2016) found that the SAN projects in El Salvador
combined with CSR led to the introduction of new crops and new livestock, indicating some
diversification, but did not find any impact on agricultural income. Aldana, Vásquez and
Yancari (2016) showed that Juntos beneficiaries who also participated in Sierra Sur
interventions in Peru adopted new production practices, but neither intervention seemed to
have led to higher production levels as reported in the Bangladesh case.
Diversification into non-agricultural businesses could be another strategy to improve risk-
management by rural farmers. In their evaluation of the ER+ in Bangladesh, Hernandez et
al. (2015) found a positive impact on participation in non-farm business. From a baseline of
20 percent participation in non-farm enterprises for the pooled sample of control and treated
groups, there was an increase to 33 percent for ER+ and to 30 percent for the ER-only group
at the endline. Both population average and fixed effect models show that the ER+ led to
higher participation in non-agricultural activities than did the two control groups used in the
analysis. This finding is in line with the impact of ER+ on the decision to save and use the
savings for entrepreneurial purposes as discussed above. The authors argue that these results
are encouraging because they show that even if ER+ beneficiaries do not move out of
poverty, they are at least better able to manage risks. The results held true for the two
comparison groups used in the analysis, which implies that beneficiaries who received only
public works for two years (ER) did not experience the same positive impacts. The authors,
however, did not report the results of ER-only against a comparison group of non-
beneficiaries to assess whether it had some positive impact on these outcomes related to risk
management. Gilligan, Hoddinott and Tafesse (2009) also found that beneficiaries that
participated in both PSNP and OFSP in Ethiopia were more likely to operate non-farm
business activities than were non-beneficiaries. However, they found a similar impact for
those who benefited from PNSP only, unlike in the case of ER.
In Nicaragua, Macours, Premand and Vakis (2012) showed that both of the CCT
complementary programmes, namely the provision of productive investment grants and
71
training vouchers,109 helped to protect CCT beneficiaries against drought shocks, although
the investment grant seemed to have been more effective. Moreover, the productive
investment grant led to significant increases in non-agricultural self-employment, mostly the
production of food products and small commerce, which were larger than those yielded by
the training voucher and by the basic CCT package (transfers only). Overall, CCT
beneficiaries who also received a productive investment grant were 13pp more likely to
engage in non-agricultural self-employment than the comparison group (no intervention),
while the training group and the cash only group were just 4pp more likely. These results
suggest that both complementary interventions and even the cash only intervention helped
households to move to more diverse sources of income, but that the investment grant
produced more robust impacts.
Escobal and Ponce (2016b) revealed that Haku Winãy led to a statistically significant
increase in household income from on-farm activities - 18 percent over baseline values - and
from self-employment non-farm business - 35 percent over baseline levels, and to a decrease
in the household income from rural wage labour – a reduction of 25 percent over baseline
levels.
In Uganda, the Women’s Income Generating Support (WINGS) project also used investment
grants along with business training and planning and regular support visits to stimulate
young rural women in a post-conflict region to diversify their sources of income away from
agriculture. Blattman et al. (2014) showed that the proportion of beneficiaries with non-farm
businesses doubled from 39 percent to 80 percent due to the intervention. The authors were
able to attribute most of the impact to the combination of cash and training; the regular visits
had very low or marginal impacts. However, their evaluation design was not able to
disentangle the individual contribution of “cash only” and “training only” as in most of the
SLP evaluations.
Some evaluations did not explicitly assess the diversification of economic activities and
sources of income. However, by looking at the impacts of the combined programmes on
different incomes, it is possible to have an idea of whether and how the programmes had
such an effect.
Bandiera et al. (2013) found a 8.2 percent reduction in the share of activities with seasonal
earnings four years after the end of the programme (CFPR Phase 2), with a parallel increase
of 17.5pp in the share of activities with regular earnings. This is consistent with the fact that
the asset transferred to the beneficiary women allowed them to have a regular source of
income through self-employment rather than relying on seasonal wage opportunities.
Moreover, there was a 15 percent increase over their baseline level in earnings per hour
(productivity) over the same period.
Banerjee et al. (2015) showed that there was a sustainable increase in monthly livestock
household revenue as well as in monthly agricultural income for the pooled sample of the
109 For more details on the CCT programme Atención a crisis in Nicaragua, see discussion in Section 4 or Table
A.2 in the Appendix.
72
six pilots of the Graduation into Sustainable Livelihoods programmes.110 However, authors
did not observe any impact for monthly non-farm microenterprise household income and
monthly paid labour income. Bauchet, Morduch and Ravi (2015) also showed that the major
impact of the SKS/UPP in India was to increase the livestock income of the treated group as
compared to the control group. However, their results suggest that the gains in livestock
income were accompanied by a fall in agriculture labour income. This rebalance between
the two sources of income rendered the impact on total income null, a result that is at odds
with the ones reported in Banerjee et al. (2015) for other pilots.
In Vietnam, IRC (2012) showed a positive impact of 18.5 percent on agriculture income for
ethnic minority groups – the main target of the programme - as a result of the P135 Phase 2
programme. Non-minority groups did not attain similar impacts even though they lived in
similar areas as the beneficiary groups. The programme did not bring about any change on
income from wages and salaries, which suggests that the increase in agricultural income
(mostly self-employed) did not come at the expense of other sources of income.
5.2.3 Negative coping strategies
There is not much evidence of the impacts of social and agricultural programmes on child
work, particularly for SLPs. The impact of OPs and CPs on child labour seems to be
mixed. Whereas Bolsa Familia in Brazil was associated with a decrease in the engagement
of children in labour activities, rural credit appeared to go into the opposite direction.
However, the interaction between them tended to reduce child work. In Lesotho, the
combination of an unconditional cash transfer (CGP) with homestead gardening support
led to an increase in child labour, particularly for girls. The scarce evidence available for
Bangladesh CFPR showed no impact on child labour, a result similar to what was found
for the combination of a CCT programme with a rural intervention in Colombia. These
results suggest that contextual factors need to be assessed so as to avoid productive support
to families leading to increases in child labour. As for begging and other undesirable
forms of occupation, the evaluation of the CFPR Phase 1 in Bangladesh found reductions
in their prevalence, but with attenuated effects in the long term. Asset depletion seems to
be successfully avoided in SLPs, most likely due to the consumption support component,
although no evaluation has yet disentangled this effect.
With regard to negative coping strategies, most impact studies looked at the engagement of
children in labour activities, begging and distress asset sales. Emran, Robano and Smith
(2014) found no short-term impact of the CFPR on child labour in Bangladesh. Since the
presence of child labour is a criterion for inclusion in the programme, it is clear that the
programme considered it a clear indicator of a family’s vulnerability status. Garcia, Helfand
and Souza (2016) found that Bolsa Familia in Brazil (1996-2006) was associated with lower
incidence of child work, whereas extending rural credit to family farmers was not associated
with child labour in Brazil’s municipalities, despite the positive coefficient. The interaction
term was also positive, although not statistically significant. The authors estimated that an
expansion of the coverage of Bolsa Familia by 10pp would reduce child labour by 7.4
110 An index of income and revenue using all four sources of income/revenue shows an overall positive impact
on income and revenue in each country.

73
percent (about 32 children per 1000 farms). Moya (2016) found no synergistic effect of
Colombia’s Oportunidades Rurales and Familias en Acción on hours worked or time spent
on domestic chores by children aged 12-18 years old. Dewbre et al. (2015) found major
impacts on child work, particularly among girls 14 years that seem to have been driven by
the joint implementation of the LFSSP and the CGP in Lesotho. Younger girls in beneficiary
households were 26pp more likely to spend some time on farm work as well as to increase
the number of days worked (0.10) in non-farm enterprises. Furthermore, both younger girls
and older boys increased the time they spent on non-farm enterprises in terms of hours
worked (0.14 overall) and days worked (0.10 by girls) during the week prior to the survey.
The authors suggest that part of the impact on child labour in home farming activities may
be due to the increased homestead gardening activities (and the LFSSP), while the increase
in child labour in agricultural and non-farm enterprise activities are probably due to the
additional year of CGP benefits.
Begging was seen by CFPR programmes as a strong indicator of extreme poverty and
vulnerability. Das and Misha (2010) and Misha et al. (2014) looked at the impacts of CFPR
Phase 1 on begging. Das and Misha (2010) showed that begging was the main occupation of
3.5 percent of the CFPR beneficiary women in 2002; it decreased to 1.4 percent in 2008,
which was the level of the control group at the baseline. These changes represented around
a 1.5pp change over the short and medium term (2002-2005 and 2002-2008). Misha et al.
(2014) analysed “begging and working as a maid” as a single category and showed that after
an initial move towards entrepreneurship and paid labour, most CFPR Phase 1111
beneficiaries eventually returned to their initial occupations.
Most of the evidence presented in the last section of this report showed that beneficiaries
made some minor downward adjustments in the level of assets owned in the context of SLPs.
However, these small decreases in the total value or total number of assets (e.g. number of
livestock) were not due to the need to cope with negative shocks. Only Bauchet, Morduch
and Ravi (2015) found distress sales as a major explanation for the reduction of livestock
assets in the Indian SKS/UPP programme and the lack of net impacts on income or
consumption indicators. In any case, the most important contextual factor seemed to be the
high levels of debt of the treatment group at the baseline. Most households appeared to have
sold their assets to pay these debts. Moreover, as the labour market was tight during
programme implementation, there were attractive opportunities for the beneficiaries that
made the entrepreneurship alternative less attractive than a lump sum (asset sale) to pay
debts.
111 Raza and Ara (2012) in their evaluation of CFPR Phase 2 merge beggars, maids, students and the
unemployed into a single category, which makes it impossible to understand the impact on the so-called ‘dead-
end’ occupations, begging and working as maid.

74
Table 8 Impacts on risk management indicators
Indicator Impact Country Combined
programme
(category)
Access to credit
and savings
Positive: cash savings – impacts higher in the shorter term
than medium to longer term due to control group catching
up – Ahmed et al. (2009); Emran, Robano and Smith
(2014); Krishna, Poghosyan and Das (2010); Das and
Misha (2010); Misha et al. (2014)
Positive: formal loans (both prevalence and value) – larger
impacts in the short term – Raza, Das and Misha (2012);
Misha et al. (2014)
Negative: informal loans (both prevalence and value) –
larger impacts in the short term – Raza, Das and Misha
(2012); Misha et al. (2014)
Positive: total savings – Raza and Ara (2012) and
Bandiera et al. (2013); also access to loans and loan-
giving – Bandiera et al. (2016)
Positive: total savings (both prevalence and value) - No
information on loans and access to credit – Hernandez et
al. (2015)
Positive: total savings (both prevalence and value)
Negative: proportion receiving loans, but positive on
value of the loans – BDI (2012)
Positive impacts on total savings and on the total amount
deposited in savings in the previous month – larger
impacts on endline 1 than on endline 2 for aggregated
results. Individual countries - Honduras: no impact on
total savings. Stronger results for Ethiopia for most
available savings indicators – Banerjee et al. (2015)
No impacts on total amount borrowed – formal borrowing
has replaced informal borrowing (aggregated results).
Positive impacts on total amount borrowed (Ethiopia,
India and Ghana), Negative for Pakistan and No impact
for Peru and Honduras.
Positive impacts on financial inclusion index was found
only for the top quantiles (median and above) – Banerjee
et al. (2015)
No impacts – on savings (either prevalence or value) and
access to credit based on indicators of the likelihood of
having outstanding loans, the number of outstanding loans
and the total amount of loans outstanding – Bauchet,
Morduch and Ravi (2015)
Positive: participation in savings groups, amount of
savings, amount of loans and perceived access to credit –
Blattman et al. (2014)
Positive: savings amount for the poor women, particularly
those with longer exposure to the programme and for the
very poorest with short and mid- exposure to the
programme. More use of credit by beneficiaries especially
the poorest ones – Prennushi and Gupta (2014).
Bangladesh
Bangladesh
Bangladesh
Bangladesh
Ethiopia,
India,
Pakistan,
Ghana, Peru
and
Honduras
India
(Andhra
Pradesh)
Uganda
India
CFPR (Phase 1) –
(SLP)
CFPR (Phase 2) –
(SLP)
ER+ (SLP/CP)
FSUP (SLP)
Graduation into
Sustainable
Livelihoods (SLP)
Graduation into
Sustainable
Livelihoods – SKS
(SLP)
WINGS (SLP)
IKP (CP)
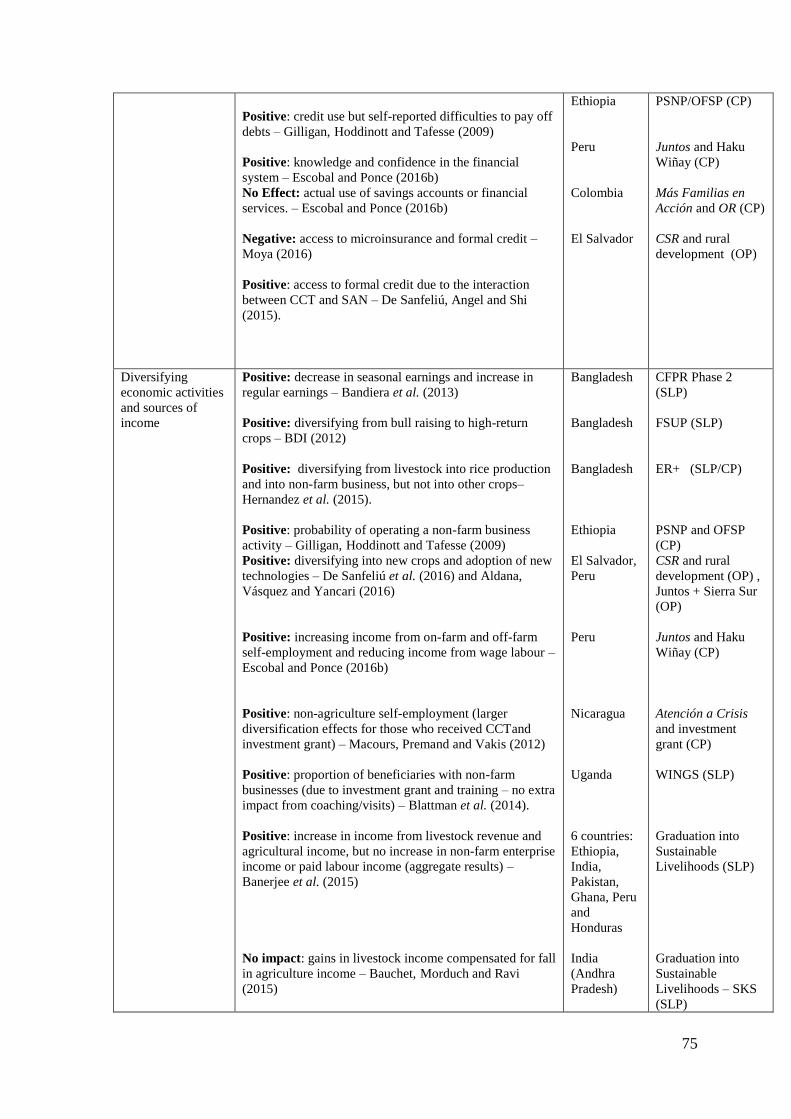
75
Positive: credit use but self-reported difficulties to pay off
debts – Gilligan, Hoddinott and Tafesse (2009)
Positive: knowledge and confidence in the financial
system – Escobal and Ponce (2016b)
No Effect: actual use of savings accounts or financial
services. – Escobal and Ponce (2016b)
Negative: access to microinsurance and formal credit –
Moya (2016)
Positive: access to formal credit due to the interaction
between CCT and SAN – De Sanfeliú, Angel and Shi
(2015).
Ethiopia
Peru
Colombia
El Salvador
PSNP/OFSP (CP)
Juntos and Haku
Wiñay (CP)
Más Familias en
Acción and OR (CP)
CSR and rural
development (OP)
Diversifying
economic activities
and sources of
income
Positive: decrease in seasonal earnings and increase in
regular earnings – Bandiera et al. (2013)
Positive: diversifying from bull raising to high-return
crops – BDI (2012)
Positive: diversifying from livestock into rice production
and into non-farm business, but not into other crops–
Hernandez et al. (2015).
Positive: probability of operating a non-farm business
activity – Gilligan, Hoddinott and Tafesse (2009)
Positive: diversifying into new crops and adoption of new
technologies – De Sanfeliú et al. (2016) and Aldana,
Vásquez and Yancari (2016)
Positive: increasing income from on-farm and off-farm
self-employment and reducing income from wage labour –
Escobal and Ponce (2016b)
Positive: non-agriculture self-employment (larger
diversification effects for those who received CCTand
investment grant) – Macours, Premand and Vakis (2012)
Positive: proportion of beneficiaries with non-farm
businesses (due to investment grant and training – no extra
impact from coaching/visits) – Blattman et al. (2014).
Positive: increase in income from livestock revenue and
agricultural income, but no increase in non-farm enterprise
income or paid labour income (aggregate results) –
Banerjee et al. (2015)
No impact: gains in livestock income compensated for fall
in agriculture income – Bauchet, Morduch and Ravi
(2015)
Bangladesh
Bangladesh
Bangladesh
Ethiopia
El Salvador,
Peru
Peru
Nicaragua
Uganda
6 countries:
Ethiopia,
India,
Pakistan,
Ghana, Peru
and
Honduras
India
(Andhra
Pradesh)
CFPR Phase 2
(SLP)
FSUP (SLP)
ER+ (SLP/CP)
PSNP and OFSP
(CP)
CSR and rural
development (OP) ,
Juntos + Sierra Sur
(OP)
Juntos and Haku
Wiñay (CP)
Atención a Crisis
and investment
grant (CP)
WINGS (SLP)
Graduation into
Sustainable
Livelihoods (SLP)
Graduation into
Sustainable
Livelihoods – SKS
(SLP)

76
Positive: increase in agricultural income (self-employed)
for ethnic minorities and no impact on other sources of
income – IRC (2012)
Vietnam
P-135 II (CP)
Negative coping
Strategies
No impact – prevalence of child labour – Emran, Robano
and Smith (2014)
Positive – reduction in begging – Das and Misha (2010),
but long-term impact not sustained – Misha et al. (2014)
Positive – reduction in the prevalence of child labour –
interaction reduces child labour but it is not statistically
significant. Social protection decreases, but rural credit
increases – Garcia, Helfand and Souza (2016)
No impact – hours worked or time spent on domestic
chores - Moya (2016)
Negative– prevalence of child labour, particularly for girls
under 14 - Dewbre et al. (2015)
Bangladesh
Brazil
Colombia
Lesotho
CFPR Phase I (SLP)
Bolsa Familia and
PRONAF (rural
credit) (OP)
Más Familias en
Acción and OR (CP)
CGP anf LFSSP
(CP)
Source: authors’ own elaboration.
5.3 Shifts in labour allocation
Social cash transfers are feared to have negative effects on labour supply, both at the
extensive (labour force participation) and intensive margins (hours of work/days of work).
Under such circumstances, members of beneficiary households might either withdraw from
the labour force or reduce the days and/or hours when they work. However, cash injections
for credit-constrained rural households with access to land may allow poor farmers both to
dedicate more time to their own farming activities and to reduce the time dedicated to daily
casual labour on better-off farms – often considered an inferior/last resort form of
labour – or to off-farm activities. Likewise, even in a context where cash transfers may have
a negative effect on the wage-labour supply, the joint implementation of an agricultural
intervention may compensate for that unintended negative effect by allowing beneficiaries
to spend more time on their own farming business. In this section of the report, we review
the evidence of how beneficiaries of combined programmes have reallocated their labour
supply as a response to the programme’s incentives. Table 9 summarizes the main findings.
SLP impact evaluations that look at programme impacts on labour force allocation show
increases in the proportion of farm self-employment, particularly among women, who are
the main beneficiaries of the asset transfers. In some cases, increases are also observed in
both farm and non-farm self-employment among men. Most of this increase in farm
self-employment comes at the expense of time spent on wage labour, but the overall
balance does not suggest a reduction in work intensity, but a reallocation in line with
programme objectives. This is also observed among interventions that aim to enable rural
households to diversify their incomes by engaging in non-farm activities, such as in
Uganda (WINGS) and Nicaragua (CCT plus investment grant). However, even in these
cases impact evaluations found some increases in farm self-employment as well, although
to a much lesser degree. Further, evaluations of CPs such as PSNP plus OFSP in Ethiopia

77
and the combination of the LFSSPP with the CGP in Lesotho found similar impacts.
Thus, the results suggest that combined agricultural and social protection programmes do
not generate dependency but instead, tend to stimulate labour force participation among
beneficiaries.
Das and Misha (2010) found that the CFPR Phase 1 led to an increase of 2pp (2002-2005
and 2002-2008) in farm self-employment and of 6.5pp (2002-2005) and 8.8pp (2002-2008)
in non-farm self-employment among working-age men (15-60 years old) in beneficiary
households. This move towards self-employment was accompanied by a fall of 7pp (2002-
2005) and 9.1pp (2002-2008) in day labour and of 3pp in unemployment (during both
periods). Nevertheless, 55 percent of men from beneficiary households have day labour as
their main occupation. As expected, the increase in farm self-employment was much
stronger for working women than for men, increasing by 36pp (2002-2005) and 26 pp (2002-
2008),112 whereas non-farm self-employment increased by a modest 3pp (2002-2005) and
had disappeared by 2008. At baseline, 49 percent of beneficiary women reported household
chores as their main occupation. This share fell sharply to 21 percent by 2005, but increased
again to 31 percent by 2008. The fall of 16.2pp in the proportion of beneficiary women with
household chores as their main occupation – observed in the short term (2002-2005) – was
reversed in the medium term (2008). Thus the adjustment to compensate for the increase in
farm self-employment was borne by day labour, which fell by 14.6pp (2002-2008), and by
working as housemaid, which fell by 7.4pp (2002-2008). In both cases there was a reduction
of more than 50 percent over baseline levels.
Misha et al. (2014) used the same household panel to assess the longer-term effects of CFPR
Phase 1 after the third round of surveys (2011). They estimated an increase of 16pp in the
probability of being self-employed in either the agricultural or non-agricultural sector for the
working-age population (both men and women) in the medium term: 9pp by 2005 and an
additional 7pp by 2008. However, this effect was significantly reduced by 12pp by 2011,
rendering the long-term effect rather limited (4pp). The authors also confirmed a reduction
of 16pp in the probability that households would undertake very low skill occupations, such
as day labour, working as maids or begging as their main source of income, until 2008 (8 pp
by 2005 and an additional 7pp by 2008). However, CFPR Phase I evaluators observed an
attenuation of these effects by 2011. Since there has been no change in the control group
over time, these effects are entirely due to changes in the treated group.
The evaluation results revealed that female-headed households moved away from begging
or working as a maid towards entrepreneurship (14pp increase) by 2005. In addition there
was also 9pp increase in the probability of entrepreneurial activities between 2005 and 2008,
a change largely driven by a move away from day labour. However, between 2008 and 2011,
the probability of entrepreneurship dropped again by 13pp, while the probability of working
as maids or begging increased by 6pp, indicating that some members of female-headed
households reverted back to their original occupation in the longer term. Male-headed
households participating in CFPR Phase 1 were also initially more likely to move to
112 From a negligible 0.2 percent in 2002, farm self-employment was responsible for 44 percent and 37 percent
of beneficiary women’s occupations in 2005 and 2008, respectively.

78
entrepreneurial activities (away from day labour), but the effects were smaller than for
female-headed households, which could explain the smaller short-term income effects on
this group. Similarly, to female-headed households, the trend of increased entrepreneurial
activities was sustained in 2008, but reversed thereafter. By 2011, most households that
started a business had moved back to day labouring or even begging or working as maids.
The authors suggest that intergenerational transfers due to marriage of the beneficiary
offspring and/or the loss of household members that formerly assisted in sustaining the
business (e.g. through marriage, death, migration) could explain why beneficiaries might
lose control over their assets and revert to their original occupation. Based on these results,
the authors raised the question of whether one big push could be sufficient to alleviate ultra-
poverty across the board or whether more frequent support sustained over a longer time
period might have a more long-lasting impact and attenuate the effect of intergenerational
transfers.
As for CFPR Phase 2, Raza and Ara (2012) assessed the impact of CFPR Phase 2 on
employment at the intensive margin. Among working-age women, they found an increase in
the time spent on agricultural activities of 391 hours per year (a 104 percent increase over
the control group’s baseline level) and a decrease in hours spent as on day labour of 100
hours. Similarly, the hours per year spent as housemaids also fell by 91 hours. The authors
did not find any change in the hours spent on household chores and other activities. Among
working-age men, they only found an increase of 15 hours per year spent on household
chores and a drop of 47 hours for other activities. Thus, as opposed to CFPR Phase 1
evaluation results discussed above, male occupation does not seem to have been affected by
Phase 2. Bandiera et al. (2013) found a reduction in the share of women specialized in wage
employment (extensive margin) by 17 pp (65 percent of the baseline mean) after four years
of the programme. Over the same period, the share of women specialized in self-employment
increased by 15 pp and those engaged in both types of occupation increased by 8pp. These
changes in the extensive margin of occupational choice correspond to 50 percent and 31
percent increase from their baseline values, respectively. After four years, eligible women
work 170 fewer hours per year in wage employment (a 26 percent reduction relative to the
baseline)113 and 388 more hours in self-employment (a 92 percent increase relative to the
baseline).114 Hence, total annual labour supply increased by an additional 218 hours, which
represents an increment of 19 percent relative to the baseline. With respect to the
occupational choices of other household members, there were small increases in the number
of hours devoted to self-employment (presumably spent helping out the main beneficiary)
but no effect on wage employment, indicating that the programme did not reduce the wage
employment of other household members.
113 Bandiera et al. (2016) showed that this impact after four years was particularly led by a reduction of 117
hours working as maids (domestic servants) – a fall of 36 percent relative to the baseline. There was also a
reduction in annual working hours for agricultural labour (minus 46 hours per year), but this was not
statistically significant. According to the authors, the higher wages in agricultural work compared to domestic
servants’ earnings may explain this difference. 114 Bandiera et al. (2016) showed that livestock rearing utterly drove this increase: 415 more hours per year,
an increase of 125 percent relative to the baseline.
79
Banerjee et al. (2015) found that for the pooled sample of the six pilots of the CGAP/Ford
Foundation graduation project, adult labour supply increased by 17.5 minutes per adult per
day at endline 1 (representing a 10.4 percent increase over control households) and by 11.2
minutes at endline 2 (a 6.1 percent increase over control households). Livestock and
agricultural activities mostly drove the increase in working time, consistent with the assets
supplied by the interventions in most countries. Country-level estimates confirmed the lack
of negative impacts on adult labour supply even though the positive impacts were much
more nuanced in this case, particularly for endline 2. For instance, consistent with the results
for the asset index, only the Ethiopian and Indian (West Bengal) pilots showed a positive
impact on time spent on productive activities, mostly tending livestock.115 However, there
was no such impact in any of the other four pilots at endline 2.116 It is worth noting that ‘time
spent working’117 also includes time spent on paid work, which, as seen in other evaluations
discussed here, tends to decrease somewhat with the increase in time spent on agricultural
self-employment activities. Its inclusion on the catch-all variable time spent working may
explain the lack of results for the other pilots.
In studying another pilot of the CGAP/Ford Foundation Sustainable Livelihoods project, the
SKS UPP, Bauchet, Morduch and Ravi (2015) found no impact on ‘productive time’, as the
increase in time spent tending livestock of 18 minutes per day was compensated by a
reduction of 42 minutes per day spent on agricultural labour. Whereas the former seems to
be a direct effect of the programme on the treated group, the latter seems to be driven by the
control group profiting from a higher demand for paid labour.
Blattman et al. (2014) found an increase in the proportion of men and women involved in
any non-farm business in Uganda because of the WINGS programme. For women, the
increase was 96 percent (39.1pp) and for men, 40 percent (41pp). The increase in reported
positive hours in petty trade followed the same pattern, but was much stronger for male
beneficiaries (276 percent) than for female beneficiaries (94 percent). The creation of new
enterprises since the baseline was the major driver of results, with 47.3pp increase for women
and 59.5pp for men. Working hours per week increased for agricultural and non-agricultural
activities in both male and female samples. However, the increase in hours per week spent
on non-agricultural activities was much greater. For female beneficiaries, there was an
increase of 4.83 hours spent on non-agricultural activities as compared to 2.34 on agricultural
activities. For male beneficiaries, the increase was 10 hours for agricultural and 9 hours for
non-agricultural activities, but the baseline for the latter was much lower, revealing a much
stronger impact on non-agricultural activities. Number of hours spent on household chores
did not change because of the programme.
115 For Ethiopia, there was also an increase in minutes spent on agriculture on the day before the survey
interview. 116 For endline 1, there were also positive impacts for Pakistan, Ghana and Honduras as well as Ethiopia and
India. 117 Total time spent working, disaggregated by time spent on agriculture, livestock, business and paid work
(Banerjee et al., 2015).
80
Gilligan, Hoddinott and Tafesse (2009) found evidence that access to the public works
component in the combined PSNP and OFSP reduced entry into the wage labour market and
increased non-farm business activities. The effect was greater for beneficiaries who received
larger amounts of transfers from public works, which is a proxy for the number of days they
worked on them. Non-farm business activities increased by 6.5pp, while entry into the wage
labour market fell by 11pp.118 The authors argue that these results suggest that the public
works component of the PSNP crowded out employment in the private market, which put
pressure on wages. A lack of information on the total number of hours worked by households
in the sample prevented them from presenting clear conclusions. However, for the sample
of beneficiaries with access to both PNSP and OFSP, there was no evidence of the crowding-
out effect as the prevalence of non-farm activities did not come at the expense of wage
employment. In any case, the authors did not look at the time spent on agricultural work to
assess whether access to OFSP would have allowed beneficiaries to invest more time on
their own farm and whether this could be a possible source of crowding out, as suggested in
most of the social cash transfer evaluations.
In Lesotho, Dewbre et al. (2015) found a significant 15pp increase in the proportion of
households allocating labour to crop farming, a result mostly driven by labour-constrained
households. The authors suggested that there was a movement away from wage labour (10pp
reduction) to on-farm activities. Based on an average baseline value of around 60 percent,
this corresponds to a 25 percent increase in the indicator of having at least one member of a
beneficiary household spending time on their farm. The authors also highlighted that this
shift did not happen for the group that only received two years of CGP benefits. Additional
resources provided by the CGP and LFSSP led to a 33pp increase in on-farm activities for
the labour unconstrained and a reduction in temporary wage work. The authors consider this
shift from occasional agricultural wage labour to working on one’s own farm as welfare
enhancing.
As discussed previously, Macours, Premand and Vakis (2012) found positive impacts of the
CCT programme and the CCT programme combined with investment grants and training on
non-agriculture self-employment. However, the authors also found that the combination of
CCT and investment grants had a much larger impact (12.6pp) as compared to the
combination of CCT and training or to CCT only, which yielded an impact of 4pp.
The combination CCT and investment grants led to an increase of almost 11pp in services
and 6.3pp in processing primary products; the combination CCT and training had impacts
on services (3.4pp); and CCT only sample had impacts on services (3.25pp) and commerce
(3pp). No impact was found on non-agriculture wage employment for any of the subjects of
the evaluation.
Fernandez et al. (2016) found no impact on labour force participation, neither for the full
sample nor for women, who are the main beneficiaries of the CCT programme in Chile.
There was no impact on the interaction term for participation in both IEF and FOSIS
productive support programmes.
118 For male beneficiaries receiving lower amounts of PSNP transfers, these estimates were 5.2pp and 3pp,
respectively.

81
Moya (2016) reported that one of the few results in line with the expected outcomes of
Oportunidades Rurales in Colombia was a small increase in the use of family workers, both
at the intensive and extensive margins, with an increase in hours worked per day (0.42 hour)
and in the number of family members working on the farm (0.28). Both impacts were
observed for the cohort of farmers that entered the programme in 2008-2009. For the more
recent cohort (2012-2013), there was an increase, at the extensive margin, of 0.41 family
workers. However, the interaction term between Oportunidades Rurales and Familias en
Acción was small and not statistically significant.

82
Table 9 Impacts on labour supply and occupation
Indicator Impact Country Combined
programmes
(category)
Labour supply
and occupation
Positive: increase in prevalence of on-farm self-employment,
particularly for women, sizable effects in both short and
medium term, but much smaller effects in the long term – Das
and Misha (2010) and Misha et al. (2014)
Positive: increased hours in agricultural self-employment and
fewer hours in day labour – Raza and Ara (2012). More
women are self-employed (prevalence and hours). Results
largely driven by livestock rearing. Total hours not reduced
by beneficiary women nor other members – Bandiera et al.
(2013, 2016)
Positive: increase in adult working hours due to livestock and
agricultural activities. Results driven by Ethiopia and India.
For other countries in the pilot there is no impact on total
hours in endline 2
Positive: increase in on-farm work (tending animals) and
decrease in day labour. But No impact on overall labour
supply (extensive margin) – Bauchet, Morduch and Ravi
(2015)
Positive: increase in working hours on agricultural and non-
agricultural activities for both men and women – Blattman et
al. (2014)
Positive: on nonfarm business activities and no reduction in
wage employment – Gilligan, Hoddinott and Tafesse (2009)
Positive: reallocation from wage labour to own farm activities
– Dewbre et al. (2015)
Positive: impact on self-employment and no impact on wage
employment – Macours, Premand and Vakis (2012)
No impact: on labour force participation – Fernandez et al.
(2016)
No impact: hours worked per day and family members
working on the farm – interaction positive but not significant
- Moya (2016)
Bangladesh
Bangladesh
Ethiopia,
India,
Pakistan,
Ghana, Peru
and
Honduras
India
(Andhra
Pradesh)
Uganda
Ethiopia
Lesotho
Nicaragua
Chile
Colombia
CFPR Phase 1
(SLP)
CFPR Phase 2
(SLP)
Graduation
into
Sustainable
Livelihoods
(SLP)
Graduation
into
Sustainable
Livelihoods –
SKS (SLP)
WINGS (SLP)
PSNP and
OFSP (CP)
CGP and
LFSSP (CP)
Atención a
Crisis and
investment
grants (CP)
IEF and FOSIS
productive
support
Más Familias
en Acción and
OR (CP)
Source: authors’ own elaboration.

83
5.4 Impact on consumption, expenditure, income, poverty and
food security
In this section of the report, we review the evidence for the impact of combined agricultural
and social protection interventions on income, expenditures, consumption, poverty and food
security indicators. Table 10 summarizes the main results.
The impact evaluations show that combined agricultural and social protection
interventions are likely to have a positive impact on income, total expenditure and total
and per capita food expenditure. The latter seems linked to improvements in food security
as reported in many of the impact evaluations discussed here. SLPs and CPs, mainly in
Asia and in Africa, showed very positive impact in all these dimensions. In Latin America,
the results were more mixed with some combinations failing to improve incomes (Sierra
Sur and Juntos) and/or food security (Familias en Acción and Oportunidades Rurales),
whereas others showed positive impacts on per capita income (Bolsa Familia and
PRONAF) or total income (Juntos and Haku Wiñay) and for some food security indicators
(CCT plus investment grants in Nicaragua,CCT plus rural development in El Salvador
and Haku Wiñay in Peru).
Ahmed et al. (2009) found an increase of BDT 173 (49 percent of the control group’s
baseline level) and BDT 126 (36 percent of the control group’s baseline level) in the per
capita monthly food expenditure of the beneficiaries of the CFPR Phase 1, between 2004-
2002 (short term) and 2006-2002 (medium term). These positive impacts on expenditures
translated into an increase of 358 (20 percent of the control group’s baseline level) and 403
(23 percent of the control group’s baseline level) daily per capita caloric (kcal) consumption
for these two periods, respectively. These results are in line with a net reduction of 33pp in
the perceived food deficit situation of beneficiaries of the programme and suggest that the
CFPR programme had both short- and medium-term impacts on food purchases, calorie
intake and self-reported food security.
Emran, Robano and Smith (2014) found positive impacts on per capita income, food
availability and the proportion of beneficiaries who had two meals per day between 2002
and 2005. Per capita income increased around 40 percent over the baseline level of the
overall sample (comparison and control groups) for the selected ultra-poor (SUP) beneficiary
group. For the poorest of the poor (SB1) beneficiary group, the impact was even higher at
50 percent of the baseline level. As for food availability, the food access score, which ranges
from one to four increased by 43 percent for both treated groups. The proportion of
households that could afford two meals per day during most of the previous year increased
by 62 percent in both treatment groups over a baseline level of 0.60. These results suggest
that the programme had strong impacts on extreme poverty reduction and food security.
Das and Misha (2010) and Raza, Das and Misha (2012) also found that participation in CFPR
Phase 1 increased per capita income in both the short (2002-2005) and the medium term
(2002-2009).119 Das and Misha (2010) estimated an impact of 35 percent in the short term
119 Raza, Das and Misha (2012) and Das and Misha (2010) used the same survey data, but the former used
propensity score matching combined with difference-in-differences while the latter only used difference-in-
differences to estimate the impacts of CFPR Phase 1.

84
and 65 percent in the medium term over the baseline level for the per capita income of the
control group (NSUP). Raza, Das and Misha (2012) find smaller but still impressive impacts
around 29 percent and 59 percent, respectively, over the short and medium term. Das and
Misha (2010) estimated an increase in food expenditure of 38 percent over the control
group’s baseline level between 2002 and 2005, which flattened by 2008 (28 percent over the
control group’s baseline level). Similarly, Raza, Das and Misha (2012) found a 33 percent
increase in food expenditures between 2002 and 2005, but according to their analysis, this
impact persisted in the medium term (2008), an increase of 39 percent over the control
group’s baseline level. In line with these results, the authors also showed an increase in per
capita calorie intake of 14 percent and 20 percent over the 2002 baseline level of the control
group in the short and medium term, respectively.
Misha et al. (2014) found an increase of 33 percent in per capita income in the short term
(by 2005), 60 percent in the medium term (by 2008) and 52 percent in the long term
(by 2011) over the baseline level of the matched control group. They also showed that the
probability of having two meals a day increased by 14 pp in 2005 (27 percent of the baseline
level of the matched control group). By 2008, however, the effect was reduced by 6 pp
(16 percent) and almost disappeared by 2011 (0.23pp or 5 percent of the baseline level of
the matched control group) since close to 90 percent of households in both the treated and
comparison groups were able to manage two meals a day by 2011. The authors attributed
the lack of impact on this food security indicator to a catching-up by the comparison group.
It is interesting to observe, however, that the improvements observed in the food security
indicator for the control group cannot be fully attributed to similar increases in their per
capita income.
With regard to the CFPR Phase 2 in Bangladesh, Raza and Ara (2012) found positive impacts
on per capita income of 16 percent of the baseline level of the control group. They also
indicated that the programme had a similar positive impact on per capita food expenditure.
They claimed that although beneficiaries suffered the effects of the cyclone Sidr, the
reduction in per capita food expenditure was actually higher for non-beneficiaries, so that
programme participants fared significantly better than their counterparts did in 2009.
However, impact estimates on food expenditure were not presented in the study and Figure
4 (p. 44) actually shows beneficiaries faring worse than the control group, contradicting what
is written in the text.
Bandiera et al. (2013) found an increase in total annual earnings both two and four years
after programme implementation. After two years, beneficiary earnings had increased by 34
percent relative to baseline levels and after four years, the impact was 38 percent.120
This increase is largely due to higher earnings from livestock, but it also reached the ultra-
poor who still resorted to casual labour in agriculture or as maids. There was an increase in
120 Bandiera et al. (2013) also looked at the heterogeneity of the impact of CFPR Phase 2 on earnings and
expenditures. The impact on earnings showed that four years after the implementation of the programme
impacts were much larger at the top deciles of the earnings distribution. The positive impact on the first decile
corresponds to one tenth of the impact observed for the 9th decile. Similarly, impacts on the per capita
consumption at the 10th decile is ten times higher than for the first decile of the per capita consumption
distribution. Actually, for the first two deciles the positive impact on per capita consumption was not
statistically significant four years after the programme intervention.

85
earnings of 16 and 29 percent after four years, possibly driven by a fall in the number of
people willing to take on this last resort type of occupation (Bandiera et al., 2016).
The authors also reported increases of 15 percent over baseline levels in productivity
(earnings per hour) four years after the programme had finished. This happened in tandem
with a positive impact on per capita food expenditures, namely, 17 and 48 percent over the
baseline level two and four years after the end of the programme. These positive impacts on
food security were further confirmed by an increase in the proportion of households able to
afford two meals a day in most days. The point estimate increased by 18pp after two years,
and 8pp after four years of programme implementation, corresponding to a 39 percent and
18 percent increase from the baseline, respectively. Bandiera et al. (2016) also showed a fall
in the poverty headcount rate by 8.4pp (15 percent of the baseline level) after four years of
intervention. This happened alongside an increase of 5 and 10 percent in the consumption
expenditure per adult equivalent.121
Using the same data as Bandiera et al. (2013, 2016), Raza and Van de Poel (2016) showed
that the weight-for-height z-scores for children under 5 years in communities participating
in CFPR Phase 2 increased by 0.78 SD (a 60 percent increase over the baseline average),
leading to a reduction of 8pp on wasting. Similarly, the proportion of underweight children
decreased by 19pp due to an increase of 0.52 standard deviations (SD) (25 percent over the
baseline value) in the weight-for-age score. Stunting or the height-for age score did not
change because of the programme. A greater reduction in the number of underweight
children was observed in female-headed households. No differential impact by sex of the
children was identified. For individuals between 9 and 19 years, the body mass index (BMI)
increased by 0.36 SD (27 percent over the baseline average) leading to a reduction of 11pp
in the probability of being thin. Underweight prevalence decreased by 10pp. No impact was
observed for stunting and impacts were larger in female-headed households. For the adult
population above 19 years, the BMI increased by 0.57 SD and moderate thinness decreased
by 11pp and severe thinness by 8pp. The authors found an increase in the duration of
exclusive breastfeeding by 75 percent over baseline levels (more than 73 days) and a 26pp
increase in the probability that a child receives a Vitamin A supplement. This suggested that
the health component of the programme was directly responsible for improving the
nutritional status of beneficiary households.
Smith et al. (2013) was the only other evaluation that looked at the impact of combined
programmes on anthropometric measures. Indeed, assessing the impact of combined
programmes on child malnutrition was the sole purpose of the evaluation of the
SHOUHARDO project in Bangladesh. Children between the ages of six and 24 months from
the project area experienced a reduction of 15.7pp in stunting between the baseline and
follow-up surveys (2006-2009) as compared to a national trajectory that actually was very
stable over this period. At baseline, stunting rates were higher than the national average,
while at the follow-up survey they were lower. Further, a subsample of households from
regions neighbouring the project area witnessed a reduction of 5pp in stunting. This suggests
some degree of spillover effect, but was nowhere near the project area reduction. Smith et
121 However this result is only statistically significant at 11 percent of significance, above the standard values
of 1, 5 and 10 percent.

86
al. (2013) also looked at synergies between the maternal child health nutrition (MCHN)
component of the SHOUHARDO project and the other interventions concerned with
sanitation, women’s empowerment and poverty and food security (e.g. support to homestead
gardens and income-generating activities and participation in public works). They found
significant synergies in stunting reduction when MCHN was combined with poverty and
food security interventions and smaller impacts of each programme in isolation.
Complementary sanitation and women’s empowerment interventions obtained similar
results.
With regard to the Chars Livelihoods Programme Phase 1 in Bangladesh, HTSPE (2011)
reported that the average income for earlier cohorts in the programme, ATP 3 and ATP 2,
were respectively 19.1 and 35.8 percent higher than for the new cohort ATP 4.122 This result
suggests that there were sustained improvements in income that can be attributed to CLP
Phase 1. This process led to a fall in the (income) poverty headcount by 24.1pp for the ATP
2 cohort and 18.4pp for the ATP 3 cohort (using the ATP 4 cohort as the control group).
Similarly, participation in the ER+ programme in Bangladesh increased food expenditure,
but point estimates were somewhat smaller that under the CFPR. Hernandez et al. (2015)
found that ER+ participation increased per capita monthly food expenditure by BDT 50 (5
percent over the baseline level for the overall sample). Total per capita monthly food
expenditure also increased with point estimates varying from BDT 55 to 70 – six percent
over the baseline level for the overall sample (Hernandez et al., 2015).
BDI (2012) reported that the Food Security for the Ultra-Poor (FSUP) programme led to a
1.5 increase in the number of income sources, which translated into an increase of about
BDT 2 072 to the average monthly household income and of BDT 497 to the average per
capita monthly household income. These increases correspond, respectively, to 114 and 103
percent over the baseline levels of the control group. Moreover, there was an increase of
15pp in the proportion of women earning income and an increase of BDT 1 054 in their
average monthly earnings, which resulted in an increase of 9.3pp in their contribution to total
household income. Poverty headcount was reduced as measured by a variety of poverty lines.
For the dollar-a-day poverty line, there was a fall of 34.7pp (35 percent over the control
group’s baseline level), and for the lower national poverty line the reduction was 22.8pp
(25 percent over the control group’s baseline level). In addition, the proportion of households
reaching at least the graduation threshold of the programme was 18.6pp higher for the treated
group (an increase of 78 percent over the control group’s baseline level).
As for food security indicators, the average number of full meals eaten by household
members per day increased by 0.06 (a 20 percent increase over the baseline level of the
control group at 2.5). The percentage of women consuming three full meals a day increased
by 15pp (a 40 percent increase over the baseline level of the control group at 38 percent).
122 The estimated impacts on per capita income for the oldest cohort (ATP 1) was actually negative. However,
CFPR Phase 2 at that stage was still going through adjustments, with a prevalence of cheaper asset transfers
(goats instead of cattle) and a small coverage of 5.7 percent of the target population of 55 000 households (3
174). For these reasons, the authors preferred to focus on the results for cohorts ATP 2 and ATP 3.

87
The average food consumption score123 increased by 12 points and the number of food
types124 consumed in the previous week increased by two (a 30 percent increase over the
baseline level of the control group at 6.7). The per capita monthly expenditure on food
increased by BDT 267 (a 52 percent over the control group’s baseline level), but there was
no change in the share of total expenditure since the increase in total expenditures was larger.
The authors also found a 27pp decrease in the households having (at best) a borderline food
consumption level alongside an increase in the group with an acceptably high food
consumption level. Programme evaluators also documented an increased frequency of
animal-based food intake and expenses on animal-based food (i.e., protein). Between 2010
and 2012, household expenditures on animal-based food increased by BDT 501.
Self-reported food-insecure households decreased by 37pp, which was compensated by an
increase of 16pp in the proportion of those self-reported as being food sufficient and of 19pp
on the proportion of those who had food surpluses. Finally, the authors showed that there
was a reduction of 31pp in the people reporting declining food consumption during the lean
season. Altogether, the results of the impact evaluations of SLP programmes in Bangladesh
reveal an excellent performance in terms of poverty reduction and improvement of the food
security of their beneficiaries.
According to Banerjee et al. (2015)’s pooled evaluation of the six pilots of the CGAP/Ford
Foundation Graduation into Sustainable Livelihoods programme, food consumption
increased more than non-food consumption, both in absolute value and in relative terms.
Food consumption increased by 7.5 percent over the control group’s mean of PPP US$51.60,
and non-food consumption increased by 2.4 percent over the control group’s mean of PPP
US$25.30. The elasticity of food consumption to overall expenditure appears to be greater
than one. Because of the increase in food expenditures, food security indicators also
improved.125 Looking at the distributional outcomes of some of these results, the authors
found larger improvements in food security indicators mostly in the bottom percentiles of
the distribution of the outcome, since the poorest people were the most food insecure at the
baseline. This is in contrast with the positive impacts on financial inclusion and asset
accumulation that are observed at higher percentiles of the distribution. Similar to what
Bandiera et al. (2013) reported on CFPR Phase 2, while effects on consumption and income
for the pooled sample have been observed for all percentiles, they are larger for those at the
top of the distribution.
Looking at the individual countries’ results and focusing on endline 2, Banerjee et al. (2015)
also found positive impacts on monthly total per capita consumption for all countries except
Honduras and Peru. As for food per capita consumption, impacts were also found for almost
123 According to the authors, the food consumption score is based on nine food groups as per WFP
methodology. Four groups are formed based on the food consumption score: 1) poor consumption: equal or
below 28; 2) borderline consumption: 42 ≥ score > 28; 3) acceptable low 52 ≥ score>42; 4) acceptable high
score>52. 124 They used 16 food types or groups (consumed over the past seven days). 125 Various indicators on food security reported positive and significant impacts in endline 2. Among others,
Banerjee et al. (2015) based the food security index on a range of yes/no indicators such as “household gets
enough food”, “no adults skipped meal”, “no adults went the whole day without food”, “no children skipped
meals”, and “everyone gets two meals every day”. For the pooled sample, all of these indicators also showed
positive impacts.

88
all countries (including Honduras and Peru), but not for Ethiopia. As for food security
indicators, India (Bandhan) observed robust results for all indicators and, to a lesser extent,
so did Ethiopia; for Honduras, Peru and Ghana authors did not find any impact. In Pakistan,
the only significant positive impact was on the proportion of households where children did
not skip a meal.
Reporting on the SKS/UPP pilot in India, Bauchet, Morduch and Ravi (2015) found no
positive impact on total household income. The lack of impact was due to the fact that the
income of both treated and comparison groups increased in tandem. For the control group,
this increase was entirely driven by labour income, whereas in the case of the treated group
the increase was driven by both livestock and labour income. The authors raise the issue of
the substitution effect that SLPs may cause when implemented in areas with a tight labour
market. The authors looked at five food security indicators: 1) adults cut portion size or skip
meals; 2) adults do not eat for an entire day; 3) children under 16 cut portion size or skip
meals; 4) all household members have enough food every day, all year; and 5) everyone in
household eats two meals per day. Positive impacts were only found for “children under 16
cut size or skip meals” in a fall in its prevalence of 7pp.
Blattman et al. (2014) found that WINGS in Uganda increased monthly cash earnings by 92
percent for women and 74 percent for men. However, they did not report any indicator on
food security. As for the Indira Kranti Patham (IKP) programme, Prennushi and Gupta
(2014) reported a positive impact on total expenditures of 44 percent for the poorest
beneficiaries and 187 percent for the Schedule Tribes (over the baseline of the comparison
group). The authors also looked at the various impacts of the IKP on total expenditures
according to the level of exposure to the NREGA employment guarantee schemes. They
found that the impact of the IKP on total expenditures by poorest households was higher
where NREGA had been active longer. In districts where NREGA had only been operating
for a few months at the time of the follow-up survey, the impacts of the IKP were positive
but not statistically significant.
IRC (2012) found that the P135 Phase 2 in Vietnam led to an increase of 14 percent on the
per capita income of minorities as compared to the baseline level for the control group, which
translated into a decrease of 10pp on the poverty headcount (a 24 percent fall over the
baseline poverty headcount for the control group). No impacts were found for non-minority
groups.
In Ethiopia, Gilligan, Hoddinott and Tafesse (2009) found that mean caloric availability is
almost 10 percent higher for households that benefit from both the PSNP and OFSP as
compared to households that had access to neither programme. Similarly, PSNP-OFSP
caused a 0.36 increase in the number of months in which households were food secure.
Further, the severity of the food gap was reduced in households that benefited from both
programmes as shown by the negative and statistically significant impact on the change in
the square of the food gap. An important question is whether the larger impacts for
households that received PSNP and OFSP (and not just the public work component of the
PSNP) were due entirely to the incremental effect of OFSP or to a greater involvement in
public works as well. Greater impacts were found for joint PSNP-OFSP participation, which

89
is also partially due to higher transfers from public works to households in this subgroup.
However, given the relative difference in the size of impacts for PSNP-OFSP beneficiaries
compared to PSNP beneficiaries alone, it is unlikely that most of this effect is due to a
difference in PSNP payments only. No impact was found on household per capita
expenditure.
Nega et al. (2010) found that the Food Security Programme (FSP) in Ethiopia decreased
total and chronic poverty by 18 and 13 percent, respectively, but had no impact on transient
poverty. There was no impact of the Food for Work programme (FFW) on any of the three
poverty measures used in this evaluation (total, transient and chronic). However, tertile
regression results do show positive impacts of the FFW for the upper tertile in terms of
reducing both total and chronic poverty.
Pace et al. (2016) found positive and significant synergies between the SCTP and FISP
programmes on per capital total expenditures in labour-unconstrained households. For the
overall sample, the impact of the SCTP alone was positive, whereas the FISP did not seem
to affect this indicator. The impact on per capita food expenditure was only statistically
significant for the group that benefited from both programmes. The authors also looked at
food security indicators, namely, share of households worried about lack of food, number of
meals per day and caloric intake in the past seven days. They found that while the stand-
alone impact of SCTP on food security was positive and significant across indicators, the
stand-alone impact of FISP was statistically significant only for the share of households
worried about lack of food and only for the subsample of labour- unconstrained households.
Authors did not identify any synergistic effect for any of the food security indicators.
In Nicaragua, Macours, Premand and Vakis (2012) reported that two years after the end of
the intervention based on a CCT plus complementary programmes, and at average levels of
shocks, households that were eligible for productive investment grants had higher
consumption levels than households eligible for the training, but both were equally protected
against the negative impact of drought shocks on consumption. The authors also found that,
the basic CCT package without the complementary programmes did not offer protection
against the negative effect of shocks two years after the end of the intervention. The authors
also showed that two years after the end of the intervention, and at average levels of shocks,
food consumption of households receiving the basic CCT package and the training package
was also higher than in the control group. However, the impact of both the basic and the
training package was very similar in magnitude. Higher impacts were observed for those
eligible for the investment grant.
Garcia, Helfand and Souza (2016) found that joint Bolsa Familia and PRONAF coverage
had positive synergistic impacts on agriculture income per family worker. The authors
showed that expanding the coverage of Bolsa Familia programme was actually associated
with a reduction in agricultural income per family worker (20 percent fall over the average
agricultural per capita income in 1996), whereas the expansion of PRONAF had no effect
on this variable. However, the combined increase of the proportion of rural households
covered by both programmes led to an increase of 45 percent on agriculture income per
family worker.

90
As for other evaluations in Latin America, Escobal and Ponce (2016b) found positive
impacts of the pilot Haku Wiñay programme in Peru on household total income, a 7.8 percent
increase over the baseline value. Qualitative perceptions of well-being confirm the result of
improved household income after two years of programme implementation (24.4pp higher
among the treated group compared to the control group). More interestingly, the treated
group was 38.1pp more likely to acknowledge that the income of their village had increased
in the last two years than the control group. However, the increased household income
results seems to be largely driven by and much more robust for the higher tertile of the
intensity of the treatment – measured as the monetized value of the interventions received.
Actually, the positive impact on household total income is not statistically significant for the
lower tertile of treatment intensity. However, even among households in the lower tertile
there is a statistically significant perception (in comparison to similar control households in
non-treated villages) that both their own income as well as the village’s income have
improved in the last two years.
Escobal and Ponce (2016b) also reported positive and statistically significant impacts on the
frequency of consumption for different food groups, including cereals, roots and vegetable,
green leaves, beef and eggs. A dietary diversity index (Herfindahl indicator) confirms that
dietary diversity increased by 2.5pp. It is worth noting that these positive results on
household food security are directly linked to the programmes’ productive interventions that
succeeded in improving on-farm and family production of vegetables, fruits and eggs,
leading to a reduction in monetary expenditure with food items.
In contrast with the results reported by Escobal and Ponce (2016b) for the Haku Wiñay
intervention, Aldana, Vásquez and Yancari (2016) found a negative impact on both gross
and net income of the Sierra Sur programme among Juntos beneficiaries in Peru. However,
when the authors look at the heterogeneity of these impacts, they find that they turn out to
be positive and statistically significant for household couples (head and/or spouse) with
higher levels of education and a higher initial asset endowment. De Sanfeliú et al. (2016)
did not find significant impacts on income for the beneficiaries of the CCT and rural
development programmes in El Salvador. However, the authors did find that former
beneficiaries of the CCT programme who later participated in rural development
programmes had improved their dietary diversity – a proxy for food security. Fernandez et
al. (2016) found no synergistic impact of participating in both the IEF and FOSIS productive
support programmes on per capita autonomous income. Moya (2016) did not find that
Oportunidades Rurales in Colombia had an impact on food consumption, total consumption
and the food security index.126 The interaction between Oportunidades Rurales and Familias
en Acción actually led to a reduction in total consumption for the earlier cohort. No impact
was found for other indicators, neither for the earlier nor for the later cohorts. Similarly,
Oportunidades Rurales seemed to have had a negative impact on the SISBEN score and on
the subjective well-being indicator. The former result was observed in the later cohort, a
reduction of 15 percent over the average score and the latter was observed for the earlier
126 The author does not provide information on the methodology applied to calculate the food security index.
In any case, since an ordered probit model was used to estimate the impacts, one can assume that the analysis
is based on categories related to different levels of food security.

91
cohort (-0.18). No interaction between Oportunidades Rurales and Familias en Acción was
identified.
Finally, Naude et al. (2016) assessed the impact of Oportunidades and Procampo and their
interaction on a vulnerability index, on asset poverty, capability poverty and food poverty.127
Although none of the estimated coefficients were statistically significant, the point estimates
suggest that Oportunidades, if anything, was more likely to have a negative impact on
capability poverty and food poverty indicators than on asset poverty and vulnerability,
whereas Procampo had a negative (but not significant) impact on all four indicators.
Similarly, the coefficient of the interaction between Oportunidades and Procampo was also
negative for all four indicators, but not statistically significant. The authors noted the
difference between their results and earlier evaluations that showed strong impacts of
Oportunidades on poverty indicators. According to them, the differences in results can be
explained by: a) different data sources used in the evaluations - in their case the ENHRUM
sample was limited to small villages with 500 to 2 499 inhabitants; b) some of the eligible
beneficiaries in the sample did not receive the transfers from the two programmes,
particularly in the case of Procampo; c) the fact that their evaluation covers a more recent
period than the others,128 which may capture diluting effects of the programme over time;
and d) differences in the outcomes analysed.
Table 10 Impacts on income, expenditure, consumption and food security
Indicator Impact Country Combined
programmes
(category)
Income, expediture
and consumption
Positive: increase in per capita monthly food
expenditure both medium- and short-term – Ahmed et
al. (2009)
Positive: increase in per capita income – Emran,
Robano and Smith (2014), Das and Misha (2010) and
Raza, Das and Misha (2012)
Positive: increase in per capita income – Raza and Ara
(2012) and increase in total annual earnings, earnings
per hour and per capita food expenditure – Bandiera et
al. (2013).
Positive: increase in average income and fall in poverty
headcount - HTSPE (2011)
Bangladesh
Bangladesh
Bangladesh
Bangladesh
CFPR Phase 1
(SLP)
CFPR Phase 2
(SLP)
CLP – Phase 1
(SLP)
ER+ (SLP and
CP)
127 Naude et al. (2016) also simulated and compared the impacts of phasing out Procampo and Oportunidades
on net rural income using a social account matrix model to take into account the indirect effects of the
programme. Phasing-out Oportunidades would lead to a fall of 1.3 percent in the net income of rural
households (both beneficiary and non-beneficiary households). Since the income from Oportunidades
accounted for just 1.2 percent of the total net income of rural households, it is not surprising that the multiplier
effect of Oportunidades was quite low, thus its elimination would not lead to strong indirect impacts on income.
As for the direct impact phasing out of Oportunidades on beneficiaries, the fall in net income would be 6.6
percent, with regional variations between 5.5 and 7.9 percent. The elimination of PROCAMPO would lead to
a reduction of 0.1 percent in rural incomes, which reflects the lower amount of PROCAMPO transfers
compared to Oportunidades as well as the small indirect effects of the programme. Among beneficiaries, the
fall in income would be 0.9 percent, varying between 0.4 and 2.3 percent according to the region. 128 Actually the most challenging feature of the evaluation is the lack of a clear baseline. The two waves of the
panel ENHRUM (2002 and 2007) were merged for the analysis.

92
Positive: increase in per capita monthly food
expenditure and in total per capita monthly expenditure
– Hernandez et al. (2015)
Positive: increase in average monthly household
income, average per capita monthly household income,
per capita monthly expenditure on food; fall in poverty
headcount – BDI (2012).
Positive: food consumption increased more than non-
food consumption and monthly total per capita
consumption (the latter except for Ethiopia) – Banerjee
et al. (2015)
No impact: on total household income – Bauchet,
Morduch and Ravi (2015)
Positive: increase in monthly cash earnings – Blattman
et al. (2014)
Positive: increase in total expenditures by the poorest –
Prennushi and Gupta (2014)
Positive: increase inper capita income and fall in
poverty headcount for ethnic minorities– IRC (2012)
No impact: on household per capita expenditure –
Gilligan, Hoddinott and Tafesse (2009) or on transient
poverty – Nega et al. (2010)
Positive: negative impact on chronic poverty – Nega et
al. (2010)
Positive: SCTP increase per capita total expenditure
not affected by FISP and synergistic effects were found
for labour-unconstrained households – Pace et al.
(2016)
Positive: interaction effect on agriculture income per
family worker – Garcia, Helfand and Souza (2016)
Negative: gross and net income, except for better
educated and wealthier people – Aldana, Vásquez and
Yancari (2016)
Positive: increase in total family income and
perception of improved income at household and
village level. Increase in frequency of consumption of
different food groups and in diet diversity largely
driven by own production – Escobal and Ponce
(2016b)
No impact: on income – De Sanfeliú et al. (2016)
Bangladesh
Ethiopia,
India,
Pakistan,
Ghana, Peru
and
Honduras
India (Andhra
Pradesh)
Uganda
India
Vietnam
Ethiopia
Malawi
Brazil
Peru
Peru
El Salvador
Chile
Colombia
Mexico
FSUP (SLP)
Graduation into
Sustainable
Livelihoods
(SLP)
Graduation into
Sustainable
Livelihoods –
SKS (SLP)
WINGS (SLP)
IKP (CP)
P-135 II (CP)
PSNP and OFSP
(CP)
SCTP+FISP
(OP)
Bolsa Familia
and PRONAF
(OP)
Juntos and rural
credit (OP)
Juntos and
Waku Wiñay
(CP)
CSR and rural
development
(OP)

93
No impact: on per capita autonomous income –
Fernandez et al. (2016)
Negative: reduction in total consumption for earlier
cohorts – Moya (2016)
No impact on SISBEN score and on subjective well-
being indicator
No impact: on vulnerability index, on asset poverty, on
capability poverty and on food poverty (negative, but
not significant) – Naude et al. (2016)
IEF and FOSIS
productive
support
(CP)
Más Familias en
Acción and OR
(CP)
Oportunidades
and
PROCAMPO
(OP)
Food security Positive: increase in daily per capita caloric (kcal)
consumption and reduction of perceived food deficit –
Ahmed et al. (2009); increase in food availability and
the proportion of beneficiaries who have two meals per
day – Emran, Robano and Smith (2014). Long-term
impact on number of meals per day is almost non-
existent due to catching-up by the control group –
Misha et al. (2014)
Positive: increase in the proportion of households that
can afford two meals a day on most days – Bandiera et
al. (2013), fall in wasting and underweight for children
under 5, improvement in BMI for those aged 5-19 and
above 19 and a fall in thinness for the same adult
population – Raza and Van de Poel (2016).
Positive: increase in the average number of full meals
eaten by household members per day, the percentage
of women consuming three full meals a day, in the
average food consumption score, the number of food
types consumed in the last week and a decrease in self-
reported food-insecure households – BDI (2012)
Positive: increase in food security index and each of its
components – “household gets enough food”, “no
adults skip meals”, “no adults go the whole day without
food”, “no children skip meals”, and “everyone gets
two meals every day. Individual countries: impacts are
robust across indicators for India (Bandhan) and to a
lesser extent in Ethiopia, and no impacts were found in
Honduras, Peru, and Ghana. Impacts are larger at
bottom quantiles – Banerjee et al. (2015)
No impact: on whether adults cut portion size or skip
meals; whether adults do not eat for whole day;
whether all household members have enough food
every day, all year; whether everyone in household eats
two meals per day.
Positive: reduction in percentage of children under 16
that cut portion size or skip meals – Bauchet, Morduch
and Ravi (2015)
Positive: increase in mean caloric availability and in
the number of months in which the household was food
secure and a decrease in the severity of the food gap –
Gilligan, Hoddinott and Tafesse (2009)
Bangladesh
Bangladesh
Bangladesh
Ethiopia,
India,
Pakistan,
Ghana, Peru
and Honduras
India (Andhra
Pradesh)
Ethiopia
Malawi
CFPR Phase 1
(SLP)
CFPR Phase 2
(SLP)
FSUP (SLP)
Graduation into
Sustainable
Livelihoods
(SLP)
Graduation into
Sustainable
Livelihoods –
SKS (SLP)
PSNP and OFSP
(CP)

94
Positive but no synergistic effect: SCTP improves
food security across two indicators, FISP is mostly
moot and synergistic effects are not observed.
Positive: increase in food consumption – Macours,
Premand and Vakis (2012)
Positive: Increase in frequency of consumption of
different food groups and in diet diversity largely
driven by own production – Escobal and Ponce
(2016b)
Positive: impact on dietary diversity (CCT and rural
development) – De Sanfeliú et al. (2016)
No impact: on food consumption and the food security
index – Moya (2016)
Positive: reduction in children’s stunting (6-24 months)
Nicaragua
Peru
El Salvador
Colombia
Bangladesh
SCTP and FISP
(OP)
Atención a
Crisis and
investment grant
(CP)
CSR and rural
development
(OP)
Juntos and Haku
Wiñay
CSR and rural
development
(OP)
Más Familias en
Acción and OR
(CP)
SHOUHARDO
(CP)
Source: authors’ own elaboration.
5.5 Strengthening participation in community networks and
stimulating local economies
As discussed in the introduction and in Section 4 of this report, almost all of the impact
evaluations selected for review focus on household/individual level outcomes. Community
and local level impacts are at best marginalized in the analysis and are mostly referred to
when estimating spillover effects on the eligible households/individuals that have been
randomized out of the programme, particularly when the randomization is implemented at
both village and household levels. Alternatively, one can look at the impact of the combined
programmes on community-related outcomes by looking at spillover effects on non-
beneficiaries as well as indicators on how the involvement of beneficiaries in community
networks has been affected by the interventions. The scarce evidence on these dimensions is
the focus of this section and is summarized in Table 11.
5.5.1 Spillover impacts
Only seven of the 37 evaluations looked at spillover effects. Among them only the
evaluation of Sierra Sur plus Juntos in Peru and two evaluations of CFPR Phase II in
Bangladesh showed spillover effects from the agricultural interventions to
non-beneficiaries in treated areas. The other four evaluations were undertaken in the
context of small-scale pilots and did not find any evidence of spillover effects on the
eligible, but non-treated in population in treated areas. A lack of information on
spillover effects, particularly the non-eligible populations, is a clear gap in the impact
evaluation literature of both isolated and combined programmes

95
Banerjee et al. (2015) did not find any spillover effects in the treated villages of Peru,
Honduras and Ghana, for which a sample of eligible non-treated households exists.
These findings are at odds with other evaluations, particularly of larger programmes that do
show significant spillover effects on eligible non-beneficiaries. One possible explanation
might be the small size of some of the pilots. Unsurprisingly, one of the policy
recommendations coming out of the paper is that the intervention should be scaled up by
disseminating it to other villages rather than simply including more beneficiaries in the
programme. This recommendation raises issues of horizontal equity, particularly for
programmes where the cash transfer (consumption smoothing component) relies on
medium- to long-term human development objectives that go well beyond immediate
productive impacts (e.g. CCT programmes in LAC or long-term food security interventions
such as the PSNP in Ethiopia).
Bandiera et al. (2016) and Raza and Van de Poel (2016) looked at spillover effects on
non-eligible populations and did find a spillover for a couple of dimensions, particularly for
the non-eligible poor. Bandiera et al. (2016) have shown that there have been general
equilibrium effects on the labour market as the agricultural labour and maid wages for
ineligible women increased. They also found an increase in the value of other business assets
(livestock sheds, rickshaw, vans and pumps – excluding land) for the near-poor and the
middle class, but the value of these assets is negligible compared with the impacts observed
in livestock and land value for beneficiaries, thus it does not seem to lead to a considerable
indirect effect of the programme. Moreover, no spillover effect was found on poverty rates
or consumption expenditure per equivalent adult nor in the value of household assets held
by ineligible households. Raza and Van de Poel (2016) found spillover effects from the same
CFPR – Phase 2 programme on nutritional indicators (e.g. wasting and underweight), which
are on average half of those identified in the eligible population. Similar finds for older
population groups also show reductions in the probability of thinness for the non-eligible,
however, these results seem to be restricted to the near-poor as compared to the non-poor,
which suggests that social networks may be the main driver through which the health
messages and interventions of the programme ‘trickle-up’ to the neighbours of the eligible
participants.
Blattman et al. (2014) also looked at the spillover effects of Uganda’s WINGS on non-
beneficiaries in treated villages129 and found no impact on average income. This result
however hides a small reduction in income among pre-existing traders and an increase in
income among non-traders. The authors also found a slight shift towards agricultural work
among the non-beneficiaries. No impacts on prices were identified, which suggests that
markets in these villages are well integrated.
Aldana, Vásquez and Yancari (2016) show that non-beneficiaries of Sierra Sur who reside
in districts where the programme was implemented were more likely to adopt improved
129 Blattman et al. (2014) also looked at spillover effects on control treated, using the proximity to treated
villages as a proxy to ‘treatment’. Their results showed a reduction in ‘petty trade’ in these villages, which may
suggest some crowding out between treated and control villages.

96
agriculture practices than a similar group in non-intervention areas, showing how
agricultural interventions may have indirect effects on non-beneficiaries.
5.5.2 Impacts on social and economic links with the community
networks
Another important dimension of the community-level impacts of combined programmes
is how the interventions change the way beneficiaries interact with their communities.
This interaction can be captured by their reliance on and support to other members and/or
institutions. A variety of indicators have been used in different contexts to capture this
dimension. The evaluations that looked at this dimension found that SLPs and CPs that
include components aiming at fostering self-help groups and associations were more likely
to increase interactions between beneficiaries and their social networks, reducing social
exclusion and increasing access to public services and community support.
Looking at the interaction between beneficiaries and their communities, Das and Misha
(2010) reported that CFPR Phase 1 in Bangladesh had an impact on the social capital of their
beneficiaries. Four years after the intervention, beneficiaries were 10pp more likely to
receive an invitation from a non-relative neighbour and 6pp more likely to get some help
from them. In addition, there was an increase of 22pp in the proportion of beneficiaries who
believed that someone would lease land to them. Misha et al. (2014) found that by 2011 the
effect of getting an invitation from a non-relative neighbour had disappeared largely due to
a catch up by the control group.130
Banerjee et al. (2015) found that the beneficiaries of the six pilots of the Graduation into
Sustainable Livelihoods project, who were often marginalized in political and community
processes, became more likely to be informed about the political life of their communities.131
The results from individual countries suggest that there was no impact in Peru and Honduras
on any of the available indicators for these countries. Blattman et al. (2014) found significant
increases in several aspects of community involvement for both men and women due to the
WINGS programme in Uganda. These included social support, community participation and
community leadership.132
Prennushi and Gupta (2014) found that IKP beneficiaries were more likely to participate in
government social programmes, such as NREGA, mid-day meals, housing and integrated
child development services (ICDS). In contrast, Bauchet, Morduch and Ravi (2015) found
that beneficiaries of the SKS/UPP were not more likely to benefit from government
programmes, such as NREGA, pensions, government assets, government training,
130 The authors reported very similar results to those found in Das and Misha (2010) for the medium term
(2008-2002). 131 Using the pooled sample of the six pilots, the authors showed positive impacts of being member of a political
party, attending community meetings, meeting with village leaders to talk about village concerns and overall
political index. 132 All these variables are based on a set of questions that are summarized by z-scores. Larger z-scores values
mean better results for the outcome of interest.

97
subsidised loans and the purchase of goods with a PDS card.133 They were however more
likely to have access to housing programmes.
De Sanfeliú et al. (2016) found an increase of 3pp in the probability of taking part in farmers’
associations among households that had simultaneous access to CCT and rural development
programmes in El Salvador as compared to having access only to rural development
programmes. Aldana, Vásquez and Yancari (2016) found no positive impact of Sierra Sur
among Juntos beneficiaries with regard to the proportion of beneficiaries that are actively
involved in farmers’ associations or organizations. If anything, the impacts were negative.
In qualitative interviews, Sierra Sur beneficiaries reported that they had formed
organizations to be able to take part in the programme’s interventions, but once the
intervention ended they had no incentives to keep the organization running. These results
raise the question of what forms of interventions or incentives are more likely to foster
lasting forms of association and cooperation that could sustainably bring together poor
family farmers in the Peruvian context.
Table 11 Spillover effects and impacts on participation in community
networks
Indicator Impact Country Combined
programme
(category)
Spillover effects
and/or general
equilibrium
effects
No impact: on any of the relevant indicators reported
in Banerjee et al. (2015) – spillover analysis restricted
to Honduras, Ghana and Peru.
Positive or neutral: wage increases for non-eligible
women, increases in the value of other business assets
and no negative effect on other dimensions – Bandiera
et al. (2016). Nutritional status (anthropometric
measures) of the non-eligible near-poor also improved,
but to a lesser extent than did the eligible poor – Raza
and Van de Poel (2016)
Negative: reduction in petty trade among those on
waiting list in control villages
No impact: on average incomes of the non-treated in
treated villages, but a fall in income among pre-
existing traders and an increase among traders in line
with a shift of non-treated towards agriculture.
Positive: new technology adopted by non-treated in
treated areas – Aldana, Vásquez and Yancari (2016)
Ghana, Peru
and Honduras
Bangladesh
Uganda
Peru
Graduation into
Sustainable
Livelihoods
(SLP)
CFPR Phase 2
(SLP)
WINGS (SLP)
Juntos and
Sierra Sur (OP)
133 PDS stands for Public Distribution System. A PDS card ensures access to essential goods (mostly food),
which can be purchased at subsidized prices.

98
Participation in
community
networks
Positive: social capital – beneficiaries receive an
invitation from a non-relative neighbour and/or get
some help from them; believe that someone would
lease land to them – Das and Misha (2010) – but Misha
et al. (2014) found vanishing long-term impacts on
invitation from non-relative neighbour.
Positive: beneficiaries more likely to be informed
about the political life of their communities (member
of a political party, attending community meetings,
meeting with village leaders to talk about village
concerns). Country specific results similar to
aggregate. But no impacts were found for Honduras
and Peru – Banerjee et al. (2015)
Positive: beneficiaries participate in government social
programmes such as NREGA, mid-day meals, housing
and integrated child development services – Prennushi
and Gupta (2014)
No impact: on participation in government
programmes such as NREGA, pension, government
assets, government training, subsidized loans, use of
PDS, but positive for access to housing programmes –
Bauchet, Morduch and Ravi (2015)
Positive: social support, community participation and
community leadership – Blatman et al. (2014)
Positive: participation in farmers’associations (CCT
and RD) – De Sanfeliú et al. (2016).
No impact: participaton in farmers’s associations –
Aldana, Vásquez and Yancari (2016)
Bangladesh
Ethiopia,
India,
Pakistan,
Ghana, Peru
and Honduras
India
India (Andhra
Pradesh)
Uganda
El Salvador
Peru
CFPR Phase 1
(SLP)
Graduation into
Sustainable
Livelihoods
(SLP)
IKP (CP)
Graduation into
Sustainable
Livelihoods –
SKS (SLP)
WINGS (SLP)
CSR and rural
development
(OP)
Juntos and
Sierra Sur (OP)

99
6. Conclusion: What has been learned so far
The evaluations of the agricultural and social protection programmes selected for this review
reveal the existence of a considerable amount of evidence that combined programmes can
have positive impacts that go beyond the impact of a standalone intervention. However, most
evaluations fail to assess whether there is a multiplicative effect or a simple additive effect
due to the coherent implementation of combined programmes.134 Overall, the positive
impacts reported in the evaluations from all three categories of combined programmes (SLP,
OP and CP) show promising results on the following dimensions:135
Investment in productive assets;
Savings and access to formal credit;
Diversifying sources of income towards more stable, permanent and profitable
sources;
Shift towards self-employment, particularly for women, and/or shift towards more
profitable and decent employment;
Food security;
Income, consumption and expenditure levels; and
Poverty reduction.
Some issues related to joint programmes with different objectives have not been sufficiently
investigated and/or evaluation results have revealed some trade-offs and limitations:
Impact on child labour;
Direction and scale of spillover effects over non-beneficiaries;
Sustainability of the positive results in the long term when programmes are scaled-
up.
Investment in productive assets and financial inclusion were either larger for or
restricted to the better-off beneficiaries. Reaching the poorest of the poor is still
challenging even within the context of SLPs;
The extent to which greater investment leads to long-term productivity and income
gains, particularly for CP programmes in Latin America;
134 Pace et al. (2016) was one of the few evaluations to clearly distinguish between synergistic and additive
effects and to show which dimension profits most from the joint implementation of programmes (the
“incremental effect). Thus, although in many cases one fails to find synergistic effects, it is possible to show
that for some programmes to have an effect on some indicators, it must be complemented by another category
of programme. Thus, the fact that the sum of isolated impacts of standalone programmes is the same as their
joint implementation does not mean that improving their coherence will not assist beneficiaries. 135 These impacts were considered as welfare-enhancing in the context where they took place. Note however
that a move away from wage labour or the diversification of sources of income are not a positive outcome per
se. One can think of situation in which wage labour and specialization in some commodity crops coupled with
insurance could be preferable (or more welfare-enhancing) than a low-return self-employed activity or
diversification among subsistence crops only.

100
Adequacy of standard agricultural extension services for the target population of
social assistance programmes;
Over-reliance on self-employment alternatives, overlooking better quality wage
employment in the context of sustainable local development strategies;
The following section summarizes the main findings of the review and the limitations of the
different categories of combined programmes. The final section singles out three major gaps
in the literature that were identified in this review.
6.1 Findings and limitations by category of combined
programmes
The evaluations of SLPs suggest that, in general, they have had strong positive impacts
across a variety of outcomes. In particular, they have enabled households to make productive
investments beyond the asset transfers they received, increased their income and
consumption levels, fostered both on-farm and non-farm self-employment, especially among
beneficiary women, facilitated access to credit, promoted savings and improved food
security.136 However, Misha et al. (2014) raised the question of whether the ‘big push’
promoted by the SLP, at least in the case of the CFPR Phase 1, would be enough to bring
the poorest of the poor out of extreme poverty in the long term. The authors found that many
of the programme impacts tended to have reduced seven years after the intervention. In some
cases, this was largely due to catch up by the comparison group, which ended up having
access to similar interventions, but in other cases it was mostly because the treated group fell
back into harmful coping strategies. Continuous support from social protection interventions
and/or access to programmes to support productive activities might be necessary to ensure
that the investments made during the limited duration of an SLP and its impact are not wiped
away when households face negative shocks years after the intervention. Measures are
needed to ensure that former beneficiaries are included in the mainstream of agricultural
services (credit, extension services, access to new technologies, etc.). A transition from an
SLP towards a CP could be the desirable graduation path for beneficiaries of an SLP, was
and this was actually the rationale for the design and implementation of the CFPR Phase 1.
Implementation and design challenges can also hinder SLP impacts. Bauchet, Morduch and
Ravi (2015) pointed out contextual factors that led the SKS/UPP intervention in India to
have much weaker impacts than other pilots of the Graduation into Sustainable Livelihoods
project in Asia. In particular, they argued that the impact of the SLP can be negatively
affected in a context of high household indebtedness, which leads beneficiaries to sell their
assets to pay off debts. They also discussed the pertinence of an SLP in a context where
labour markets are tight and the programme incentivizes a shift towards self-employment.
136 Although the distributional analyses of impacts have shown, in general, positive impacts on asset ownership,
income and consumption for all deciles of the outcome distribution, impacts were much greater in the highest
deciles. Moreover, impacts on outcomes related to financial inclusion were statistically significant only in the
upper deciles (above the median). Both sets of results suggest that further measures may be necessary to ensure
that the poorest of the poor can profit from these interventions as much as people who are slightly better off. It
is interesting to note that for food security indicators, impacts are larger and significant only in the lowest
deciles (Banerjee et al., 2015).

101
Another contextual factor that was discussed in the SLP evaluations relates to the cost of
some SLP components in middle-income countries and the technical capacities required for
implementing integrated interventions. The cost of coaching, which involves regular visits
by trainers is likely to be much higher in countries such as Peru and Honduras as compared
to Pakistan and India137 (Banerjee et al., 2015).
Another aspect is the need to unbundle the contribution of each of the SLP components,
since most of them tend to focus on aggregate results.138 A rare exception was the
experimental evaluation of the WINGS programme in Uganda by Blattman et al. (2014),
whose results suggested that more ‘coaching’ visits did not lead to a higher income, but
instead resulted in higher investment levels by beneficiary households. Unpacking the
various elements of an SLP is important for informing the replication of these interventions
as well as deciding which could be the most important components to be prioritized also in
the context of CP and even OP.
Finally, there is the issue of scaling-up SLPs. Banerjee et al. (2015) argued that expanding
an SLP across villages, while continuing coverage in treated villages, is likely to avoid
negative spillovers or general equilibrium effects (e.g. wage and price inflation) that could
minimize the intervention’s impact.139 Such an approach may raise issues of horizontal
equity: how to justify leaving segments of the eligible population out of the programme.
But it also touches upon the feasibility of a livelihoods-based programme that relies solely
on self-employment as a way out of extreme poverty, overlooking issues related to fostering
different employment possibilities for the poor and vulnerable as highlighted by McCord
and Slater (2015).
The evidence gathered in this review covers a broad spectrum of programmes with different
levels of integration between agricultural and social protection programmes. Almost no
evaluation of complementary programmes had an experimental design,140 the only exception
being Macours, Premand and Vakis (2012)’s study of the complementarities between CCTs
137 Peru had the lowest internal rate of return of the five countries with higher benefits than costs. Note that in
Honduras the benefits were not higher than costs (Banerjee et al., 2015). 138 None of the evaluations disentangled the impact of the cash transfer from other programme components. It
would be interesting to learn more about the role of consumption support in preventing asset depletion. This
could offer some hints, especially looking at the long run, as to how social transfers could be better
complemented by productive interventions beyond the limited objective of graduating families from social
cash transfers. 139 It is worth noting however that larger scale SLP interventions whose impact evaluations were also discussed
in this review, such as the ER+ and the FSUP and even the CFPR Phases 1 and 2, also had impacts similar to
the ones reported in Banerjee et al. (2015), which were based in very small pilots. 140 A limitation in the Latin American evaluations selected for this review is precisely the lack of experimental
or quasi-experimental design. Except for Macours, Premand and Vakis (2012) and the two evaluations of the
CGAP/Ford foundation pilots for Honduras and Peru, all other evaluations covering Latin American countries
relied either on secondary data or on ex post surveys to gauge the impact of the programmes. This limited the
set of outcomes one can look at in the evaluations as well as forcing evaluators to work with second-best
methodologies. These constraints are particularly worrying as many governments in the regions are
implementing economic or productive inclusion programmes without having a clear notion of what works and
what does not.
102
and investment grants and CCTs and training in Nicaragua.141 That evaluation showed the
very strong impacts of the combination of CCTs and investment grants implemented to
ensure that rural households could diversify their sources of income away from agriculture.
Escobal and Ponce (2016b) reported similar positive impacts in their evaluation Haku Wiñay
programme in Peru, where beneficiaries of Juntos with access to Haku Wiñay, had much
better results than those without. Similarly, Aldana, Vásquez and Yancari (2016) showed
that beneficiaries of Juntos that also participated in Sierra Sur rural development initiatives
were more likely to adopt new productive practices and invest more in their businesses142
than those who did not participate. However, these investments only translated into more
income for farmers with higher levels of education and assets, which again raises the issue
about the capacity of less-endowed households to profit from combined programmes.143
Del Pozo (2014) only looked at asset accumulation but showed that overlapping rural credit
and Juntos enabled rural households to invest more in assets, particularly in cultivated land
area and poultry, than those who received Juntos only.
Other CPs such as the IKP in Andhra Pradesh in India and the P135 Phase 2 in Vietnam also
seem to have had important positive impacts on asset accumulation, investment, income and
expenditures and poverty reduction; these impacts were particularly strong for the poorest
of the poor and minority groups. As in the case of the SLP evaluations, the evaluation designs
adopted by Prennushi and Gupta (2014) and IRC (2012) did not to disentangle the impact of
the different components of the interventions as much as in the case of the SLP. Smith et al.
(2013)’s evaluation is an example of how one could try to disentangle programme effects
and measure the synergistic aspects, at least for the key components of CPs based on multiple
interventions and implemented by different agencies.
Gilligan, Hoddinott and Tafesse (2009) and Hoddinott et al. (2012) showed how the
progressive integration of PSNP and OFSP/HASP (CPs) in Ethiopia seemed to have
overcome some of the previous constraints to generating synergistic effects. However, as in
the case of Peru’s OPs Juntos and Sierra Sur, synergies between the two programmes seem
to be much stronger on the input side, as illustrated by the higher levels of investment in
inputs and the adoption of new technologies, than on the outcome side, since positive impacts
on productivity were not as strongly attributable to the interaction of the programmes as were
impacts on investment. In any case, it is important to highlight that limitations of the
evaluation designs may have biased the results.
141 In the case of OPs, the possibility of using experimental design is much reduced as the programmes are not
designed to be jointly implemented or to complement each other. Thus evaluations are usually based on
secondary data designed for other purposes, which limits the issues that can be assessed in the evaluations and
their scope. 142 Likewise De Sanfeliú et al. (2016) also showed that beneficiaries of both CCT and rural development
programmes in El Salvador were more likely to adopt new crops and to have access to financial markets than
people who just received the rural development programmes. 143 Tiwari et al. (2015), in their evaluation of the impact of Zambia’s Child Grant (CG) model of the Social
Cash Transfer (SCT) on the technical efficiency of agricultural households, only found small improvements in
technical efficiency for well-off CGP beneficiaries. This result suggests: 1) the insufficiency of investment in
inputs to ensure improvements in technical efficiency; and 2) the need for extension programmes able to
increase technical efficiency among farm households in all income groups.
103
Garcia, Helfand and Souza (2016) showed that the joint expansion of Bolsa Familia and
subsidised rural credit for family farmers in Brazil can have an aggregate positive impact on
agricultural productivity. Their analysis also showed that higher levels of Bolsa Familia
coverage were associated with lower incidence of child labour. But again, given the
challenges involved in the evaluation OPs, the authors were very cautions about attributing
a causal relationship and preferred to emphasise the association between these variables.
To add some nuance to the overwhelmingly positive impacts that have been summarized in
this paper, the evaluations reported in Moya (2016) for Colombia and in Fernandez et al.
(2016) for Chile failed to find positive impacts on income and consumption.
Both evaluations looked at synergies between CCT programmes and programmes that
support the productive capacity of farmers (Colombia) and individuals (Chile). In the case
of Colombia, Oportunidades Rurales had clear positive impacts on productive and total asset
value, but Familias en Acción beneficiaries actually fared worse than non-beneficiaries,
suggesting that the interaction between the programmes was negative for these outcomes.
Based on a qualitative assessment, Moya (2016) largely blamed a fear of losing the CCT
benefit and the inadequacy of the tools used in rural extension services for this negative
interaction. This was in contrast with most pilots of the SLP interventions, which suggests
that the Asian livelihoods interventions were more successfully adapted to poor and
vulnerable populations than were programmes in Latin America. Evaluating the efficacy of
rural extension services for poor and vulnerable family farmers should be done before
scaling-up traditional agricultural models for structurally distinct farmers. In addition,
contextual factors that may need other types of interventions, such as the infrastructure to
ensure that they have access to markets, must be factored in.
The evaluations from Latin America also show that CPs and OPs were not very successful
in supporting collective mechanisms to deal with risk-sharing. Aldana, Vásquez and Yancari
(2016) found that increases in the level of organization of farmers were short-lived and aimed
only at eligibility for the programme interventions. Similarly, Moya (2016) commented on
how farmers’ organizations included Familias en Acción beneficiaries seeking to become
eligible for the Oportunidades Rurales interventions, but failed to support the latter.
Also, the impact on microinsurance lasted only for the duration of the Oportunidades
Rurales programme, since family farmers did not contract microinsurance with their own
resources after the subsidy was terminated. These short-lived impacts raise the question of
how effective is the design of these interventions, particularly those meant to change
behaviour and preferences, when implemented for a short period only.
Overall, it seems that determining which combination works best is very context-specific,
requiring a specific theory of change. Decisions on how to combine, align and/or integrate
different programmes can be informed by cost-benefit and cost-effective analysis, but
priorities and policies may differ in different settings and countries. Finally, it seems clear
from the evaluation results reported in this review that the poor and extreme poor, even those
in labour-constrained households, do engage, to some extent, in income-generating
activities. However, expecting them to graduate from social protection programmes seems a
misplaced objective, as it overlooks the fact that social protection programmes are for all
those who face risks and vulnerabilities, not only for the poor. Thus even if they move above

104
the programme’s eligibility line and are graduated from it, they will still need other types of
social protection (e.g. social security) to be able to face the risks associated with the life
cycle and the productive life of individuals and families. In addition, some beneficiaries may
never be able to graduate – given their demographic profile – and others may fall back into
poverty and will still need social assistance programmes to support them.
6.2 Methodological gaps and areas for further investigation
The gaps identified in the literature selected for this review can be classified into three areas.
The first area includes gaps in the analysis of individual/household-level outcomes. As we
have seen, there are few impact evaluations with a robust evaluation design to assess CPs.
Using experimental designs or good quasi-experimental designs requires initiatives to
mainstream them into the policy-making process, making sure that they are incorporated into
the design phase of the integration of programmes. As for SLPs, the challenge is to better
assess the role of each component and determine how impacts vary across different contexts,
particularly for limited-coverage pilots, and to understand how the SLP will link to more
structural and permanent government social protection programmes beyond short-term
consumption support. For both CPs and SLPs, it is necessary to do more research on spillover
effects to better gauge the overall impact of the programmes, even though this might imply
more data requirements and evaluations that are more expensive. It will be critical to look at
spillover effects on the non-eligible as well as eligible populations in programme areas as
seen in Bandiera et al. (2016) and Raza and Van de Poel (2016). Thus, it seems relevant for
future evaluations to focus on productive impacts of both agricultural and social protection
interventions, looking also at spillover effects on non-eligible households.
The second area goes beyond household/individual-level outcomes to look at the impact of
combined interventions on the community and local markets. For example, in the context of
an exogenous injection of cash from social cash transfers, it would be important to know
whether parallel agricultural interventions targeting better-off farmers, such as input
subsidies144 and/or rural credit, were able to support the increase in supply necessary to keep
inflation down and to explain possible spillover effects captured in household-level analysis.
Methodologies such as the LEWIE models (Taylor et al., 2013) discussed in the introduction
could be applied to better assess combined interventions that do not necessarily target the
same populations and estimate the local general equilibrium effects of these combined
programmes.
Finally, the third gap in current knowledge is due to the lack of impact evaluations of
programmes that combine food-based social protection programmes and purchases from
family farmers.145 For example, in the search protocol we were unable to find rigourous
evaluations of the impact of Bangladesh’s subsidised paddy/wheat purchases from family
farmers, which are distributed through food-based social protection policies/programmes
such as the Open Market Sales, Food for Work, and Vulnerable Group Feeding.
144 Costly input subsidy programmes could be evaluated in tandem with cash transfers for possible
complementarities as pioneered by Pace et al. (2016). 145 In this review, only one paper looked at his issue. Upton et al. (2012) exploit a natural experiment in a
very interesting way, but given the absence of a baseline and a stronger evaluation design many relevant
outcomes of interest were left out of their analysis.

105
Similarly, there has been no robust impact evaluation of the Brazilian Food Procurement
Programme (PAA), in which purchases from family farmers support food-insecure and
vulnerable groups. Finally, as mentioned in the Introduction there are almost no robust
impact evaluations looking at home grown school feeding programmes (supply and demand
side), which seems to be particularly important in sub-Saharan Africa.146 All available
evidence focuses on education and nutrition outcomes,147 148 overlooking the impact of the
purchase of food on the livelihoods of vulnerable farmers, Upton et al. (2012) seems to be
the only exception.
146 See Gelli and Espejo (2012) about the weakness of the monitoring and evaluation of school feeding
programmes in sub-Saharan Africa. 147 It is worth noting that nutrition outcomes, in particular anthropometric indicators, have been overlooked in
most evaluations reviewed in this paper. Only Smith et al. (2013) and Raza and Van de Poel (2016) looked at
these indicators. 148 See Alderman, Gilligan and Lehrer (2008) for an assessment of evidence around school feeding
programmes.
106
References
Ahmed, A. U., Rabanni, M., Sulaiman, M. & Das, N. C. 2009. The impact of asset
transfer on livelihoods of the ultra poor in Bangladesh. Research Monograph Series N. 39.
Research and Evaluation Division, BRAC.
Aldana, U., Vásquez, T. & Yancari, J. 2016. Sierra Sur y Juntos: Un análisis a partir
de la implementación conjunta de ambos programas en Chumbivilcas, Cusco, Perú. In
Protección, producción, promoción: explorando sinergias entre protección social y fomento
productivo rural en América Latina. J.H. Maldonado, R.d.P. Moreno-Sánchez, J.A. Gómez
& V.L. Jurado, eds. Bogotá, Universidad de los Andes, Facultad de Economía. CEDE,
Ediciones Uniandes. Available online at: https://economia.uniandes.edu.co/
images/archivos/pdfs/Web_proyectos/Fida/Libro_sinergias_rurales.pdf.
Alderman, H., Gilligan, D. & Lehrer, K. 2008. How effective are food for education
programs? A critical assessment of the evidence from developing countries. Food Policy
Review #9. Washington, DC, International Food Policy Research Institute.
Bandiera, O., Burgess, R., Gulesci, S., Rasul, I. & Sulaiman, M. 2013. Can
entrepreneurship programs transform the economic lives of the poor? LSE Working Paper.
Available online at: sticerd.lse.ac.uk/dps/ eopp/eopp43.pdf.
Bandiera, O., Burgess, R., Gulesci, S., Das, N., Gulesci, S., Rasul, I. & Sulaiman, M.
2016. Labor markets and poverty in village economies? LSE Working Paper. Available
online at: sticerd.lse.ac.uk/dps/ eopp/eopp58.pdf).
Banerjee, A., Duflo, E., Goldberg, N., Karlan, D., Osei, R., Parienté, W., Shapiro, J.,
Thuysbaert, B. & Udry, C. 2015. A multifaceted program causes lasting progress for the
very poor: Evidence from six countries. Science, 348 (6236), DOI:
10.1126/science.1260799.
Banerjee, A.; Duflo, E.; Chattopadhyay, R. & Shapiro, J. 2011. Targeting the Hard-
Core Poor: An Impact Assessment. Unpublished manuscript.
Barret, A., Hanna, M. & Alam, Z. 2014. The impact of sustainability of CLP’s food
security interventions. Chars Livelihoods Programme. (mimeo).
Available online at http://clp-bangladesh.org/wp-content/uploads/2014/12/2014-10-23-
Food-Security-and-Stability-Study_resized+Mat+SK.compressed1.pdf.
Barrientos, A. 2012. Social transfers and growth: What do we know? What do we
need to find out? World Development, 40(1): 11-20.
Bauchet, J., Morduch, J. & Ravi, S. 2015. Failure vs displacement: Why an
innovative anti-poverty program showed no net impact in South India. Journal of
Development Economics, 116: 1-16.
BRAC Development Institute (BDI). 2012. WFP Food Security for the Ultra Poor
(FSUP) – Outcome survey report. (mimeo). Available online at:
http://documents.wfp.org/stellent/groups/public/documents/newsroom/wfp262341.pdf.

107
Blattman, C., Jamison, J., Green, E. P. & Annan, J. 2014. The returns to cash and
microenterprise support among the ultra-poor: A field experiment. Quarterly Journal of
Economics. 129: 697–752, DOI: 10.1093/qje/qjt057
Covarrubias, K., Davis, B. & Winters, P. 2012. From Protection to Production:
Productive Impacts of the Malawi Social Cash Transfer Scheme,Journal of Development
Effectiveness, vol. 4(1): 50-77.
Das, N. C. & Misha, F. A. 2010. Addressing extreme poverty in a sustainable
manner: Evidence from CFPR Programme. CFPR Working Paper N. 19. Research and
Evaluation Division, BRAC.
Daidone, S., Davis, B., Handa, S. & Winters, P. 2016. The household and individual-
level economic impacts of cash transfer programmes in Sub-Saharan Africa. Synthesis
report, forthcoming. Report prepared for the PtoP project. Rome, FAO.
Davis, B. 2015. The impact of social cash transfers on livelihoods and labour market
outcomes: The evidence from sub-Saharan Africa. Policy in Focus, 12(2): 8-9.
De Sanfeliú, M. B., Angel, A. & Shi, M. A. 2016. Transferencias monetarias
condicionadas y desarrollo rural en El Salvador. In Protección, producción, promoción:
explorando sinergias entre protección social y fomento productivo rural en América Latina.
J.H. Maldonado, R.d.P. Moreno-Sánchez, J.A. Gómez & V.L. Jurado, eds. Bogotá,
Universidad de los Andes, Facultad de Economía. CEDE, Ediciones Uniandes. Available
online at: https://economia.uniandes.edu.co/images/archivos/pdfs/Web_proyectos/Fida/
Libro_sinergias_rurales.pdf.
Del Pozo, C. 2014. Impacto de la articulación entre las transferencias monetarias
condicionadas y el crédito agropecuario en la acumulación de activos production de
hogares rurales en el Peru (mimeo). Consorcio de Investigación Económica y Social.
Dercon, S. 1996. Risk, crop choice and savings: Evidence from Tanzania. Economic
Development and Cultural Change, 44(3): 485-513.
Devereux, S. 2009. Social protection for agricultural growth in Africa. FAC
Working Paper No. SP06. Brighton, UK, IDS.
Devereux, S. & Sabates-Wheeler, R. 2004. Transformative social protection. IDS
Working Paper No. 232. Brighton, UK, IDS.
Devereux, S. & Guenther, B. 2007. Social Protection and Agriculture in Ethiopia.
Rome, FAO. Available online at: http://www.fao.org/fileadmin/templates/esa/
Workshop_reports/Social_protection_2008/workshop_0108_ethiopia.pdf.
Dewbre, J., Daidone, S., Davis, B., Miguelez, B., Niang, O. & Pellerano, L. 2015.
Linking food security to social protection programme. Report prepared for the PtoP project.
Rome, FAO. Available online at: http://bit.ly/1G678CM.
Dorward, A. Sabates-Wheeler, R., MacAuslan, I., Buckley, C., Kydd, J. & Chirwa,
E. 2006. Promoting agriculture for social protection or social protection for agriculture:
Strategic policy and research issues. FAC Discussion Paper 004. Brighton: FAC.

108
Emran, M. S., Robano, V. & Smith, S. C. 2014. Assessing the frontiers of
ultrapoverty reduction: Evidence from Challenging the Frontiers of Poverty
Reduction/Targeting the Ultra-poor, an innovative program in Bangladesh. Economic
Development and Cultural Change. 62 (2): 339-380.
Emran, M. S., Robano, V. & Smith, S. C. 2009. Assessing the frontiers of ultra-
poverty Reduction: Evidence from Challenging the Frontiers of Poverty
Reduction/Targeting the Ultra-poor, an innovative program in Bangladesh (mimeo).
Washington, DC, Department of Economics, George Washington University.
Escobal, J. & Ponce, C. 2015. Combining social protection with economic
opportunities in rural Peru: Haky Wiñay. Policy in Focus. 12(2): 22-25.
Escobal, J. & Ponce, C. 2016a. Metodología Cuantitativa de la Evaluácion de
Impacto In Combinando protección social con generación de oportunidades económicas:
una evaluación de los avances del programa Haku Wiñay / Javier Escobal y Carmen Ponce
(Eds.). Lima: GRADE, 2016.
Escobal, J. & Ponce, C. 2016b. Impactos del Proyecto desde una Aproximación
Cuantitativa. Combinando protección social con generación de oportunidades económicas:
una evaluación de los avances del programa Haku Wiñay / Javier Escobal y Carmen Ponce
(Eds.). Lima: GRADE, 2016.
FAO. 2015. The State of Food and Agriculture: Social protection and agriculture:
breaking the cycle of rural poverty. Rome.
Fernández, M. I., Leiva, M. F., Ortega, J. & Weason, M. 2016. Efectos sinérgicos
entre en Ingreso Ético Familiar (IEF) y los programas de apoyo al emprendimiento en Chile,
2012-2014. In J.H. Maldonando, R.d.P. Moreno-Sánchez, J.A. Gómez & V.L. Jurado, eds.
Protección, producción, promoción: explorando sinergias entre protección social y fomento
productivo rural en América Latina. Bogotá: Facultad de Economía, Universidad de los
Andes. CEDE, Ediciones Uniandes. Available online at: https://economia.uniandes.edu.co/
images/archivos/pdfs/Web_proyectos/Fida/Libro_sinergias_rurales.pdf).
Garcia, F.; Helfand, S. M. & Souza, A. P. 2016. Transferencias Monetarias
condicionadas y desarrollo rural en Brasil: Posibles sinergias entre Bolsa Familia y
PRONAF. In J.H. Maldonando, R.d.P. Moreno-Sánchez, J.A. Gómez & V.L. Jurado, eds.
Protección, producción, promoción: explorando sinergias entre protección social y fomento
productivo rural en América Latina. Bogotá, Facultad de Economía, Universidad de los
Andes. CEDE, Ediciones Uniandes. Available online at:
https://economia.uniandes.edu.co/images/
archivos/pdfs/Web_proyectos/Fida/Libro_sinergias_rurales.pdf.
Gavrilovic, M., Knowles, M., Davis, B., Pozarny, P., Calcagnini, G. & Sabates-
Wheeler, R. 2016. Strengthening Coherence between Agriculture and Social Protection to
Combat Poverty and Hunger in Africa: Framework for Analysis and Action. Rome, FAO.
Available online at http://www.fao.org/3/a-i5386e.pdf.
Gelli, A. & Espejo, F. 2012. School feeding, moving from practice to policy:
Reflections on building sustainable monitoring and evaluation systems. Public Health and
Nutrition, 16(6):995-9, DOI:10.1017/S1368980012003989.

109
Gertler, P., Martinez, S. & Rubio-Codina, M. 2012. Investing cash transfers to raise
long-term living standards. American Economic Journal: Applied Economics, 4(1): 164-92
Gilligan, D. O., Hoddinott, J. & Tafesse, A. S. 2009. The impact of Ethiopia's
productive safety net programme and its linkages. The Journal of Development Studies.
45(10): 1684-1706.
Harou, A.P., Upton. J.B., Lentz, E.C., Barret, C.B. & Gómez, M.I. 2013. Trade-offs
or Synergies? Assessing Local and Regional Food Aid Procurement through Case Studies
in Burkina Faso and Guatemala. World Development. (49):44-57.
http://dx.doi.org/10.1016/j.worlddev.2013.01.020
Hernandez, R.; Ahmed, A. U., Akter, A., Hossain, N. Z., Choudhury, S. & Malek,
M. 2015. An Evaluation of the programme on enhancing resilience to natural disasters and
the effects of climate change in Bangladesh. (mimeo). Washington, DC, IFPRI.
Hirano, K. & Imbens, G.W. 2004. The propensity score with continuous treatments.
In Applied Bayesian Modeling and Causal Inference from Incomplete-Data Perspectives,
Gelman, A. & Meng, X. (Eds.), chapter 7: pp. 73–84.
Hoddinott, J., Berhane, G., Gilligan, D., Kumar, N. & Taffesse, A. S. 2012. The
impact of Ethiopia’s productive safety net programme and related transfers on agricultural
productivity. Journal of African Economies, 21(5): 761–786.
Hoddinott, J., Berhane, G., Gilligan, D. O., Kumar, N. & Tafesse, A. S. 2015. Linking
social protection to agriculture: Evidence from Ethiopia. Policy in Focus. 1 (1):10-11.
Available online at: http://www.ipc-undp.org/pub/eng/PIF31_The_Impact_of_Cash_
Transfers_on_Local_Economies.pdf.
HTPSE Limited. 2011. Independent impact assessment of the Chars Livelihood
Programme – Phase 1. Final report. Available online at: https://www.gov.uk/government/
uploads/system/uploads/attachment_data/file/204635/Evaluation-chars-livelihoods-prog-
bangladesh.pdf.
Indochina Research and Consulting (IRC). 2012. Impact of Program 135 – Phase II
through the lens of baseline and endline Surveys (mimeo).
Kagin, J., Taylor, E., Alfani, F. & Davis, B. 2014. Local Economy-wide Impact
Evaluation (LEWIE) of Ethiopia’s social cash transfer pilot programme. Report prepared
for the PtoP project. Rome, FAO. Available online at: http://www.fao.org/3/a-i3815e.pdf.
Krishna, A., Poghosyan, M. & Das, N. 2010. How much can asset transfers help the
poorest? The five Cs of community-level development and BRAC’s Ultra-Poor Programme.
Brooks World Poverty Institute Working Paper 130.
Levy, S. & Robinson, S. 2014. Can cash transfers promote the local economy? A
case study for Cambodia. IFPRI Discussion Paper 1334. Washington, DC, International
Food Policy Research Institute.
Macours, K., Premand, P. & Vakis, R. 2012. Transfers, diversification and household
risk strategies – Experimental evidence with lessons for climate change adaptation. World
Bank Policy Research Working Paper 6053. Washington, DC, the World Bank.

110
Martinez, S. 2004. Pensions, poverty and household investments in Bolivia. Doctoral
dissertation, University of California at Berkeley, USA.
McCord, A. & Slater, R. 2015. Social protection and graduation through sustainable
employment. IDS Bulletin, 46: 134–144.
Misha, F. A., Raza, W., Ara, J. & Van de Poel, E. 2014. How far does a big push
really push? Mitigating ultra-poverty in Bangladesh. Working Paper 594. The Hague,
International Institute of Social Studies.
Moya, A. 2016. Programas para la reducción de la pobreza: Una evaluación de las
sinergias entre Oportunidades Rurales y Familias en Acción. In J.H. Maldonando, R.d.P.
Moreno-Sánchez, J.A. Gómez & V.L. Jurado, eds. Protección, producción, promoción:
explorando sinergias entre protección social y fomento productivo rural en América Latina.
Bogotá, Facultad de Economía, Universidad de los Andes. CEDE, Ediciones Uniandes.
Available online at: https://economia.uniandes.edu.co/images/archivos/pdfs/
Web_proyectos/Fida/Libro_sinergias_rurales.pdf.
Naude, A.Y., Leal, G. D., Ramirez, F. R. & Aranda, O. S. 2016. El programa de
combate a la pobreza y las políticas de desarrollo rural en Mexico: evaluación de impactos
y opciones de políticas alternativas. In J.H. Maldonando, R.d.P. Moreno-Sánchez, J.A.
Gómez & V.L. Jurado, eds. Protección, producción, promoción: explorando sinergias entre
protección social y fomento productivo rural en América Latina. Bogotá, Facultad de
Economía, Universidad de los Andes. CEDE, Ediciones Uniandes. Available online at:
https://economia.uniandes.edu.co/images/archivos/pdfs/Web_proyectos/Fida/Libro_sinergi
as_rurales.pdf.
Nega, F., Mathijs, F., Deckers, J., Haile, M., Nyssen, J. & Tollens, E. 2010. Rural
poverty dynamics and impact of intervention programs upon chronic and transitory poverty
in Northern Ethiopia. African Development Review, 22(1): 92–114.
Pace, N., Daidone, S., Davis, B., Handa, S., Knowles, M. & Pickmans, R. 2017. The
Social Cash Transfer Programme and Farm Input Subsidy Programme in Malawi:
complementary instruments for increasing consumption and productive activities? Rome,
FAO.
Prennushi, G. & Gupta, A. 2014. Impacts of Andhra Pradesh rural poverty reduction
program. World Bank Policy Research Working Paper Series 6841 (mimeo).
Raza, W. A. & Ara, J. 2012. Grant based approach to poverty reduction: Evidence
from Bangladesh. OIDA International Journal of Sustainable Development 3(6): 37-54. (
available at: http://www.ssrn.com/link/OIDA-Intl-Journal-Sustainable-Dev.html).
Raza, W. A.; Das, N. & Misha, F. A. 2012. Can ultra poverty be sustainably
improved? Evidence from BRAC in Bangladesh. Journal of Development Effectiveness,
4(2): 257-276.
Raza, W. A & Van de Poel, E. 2016. Impact and spillover effects of an asset transfer
programme on malnutrition – Evidence from a randomized control trial in Bangladesh.
BRAC Research Monograph Series 64.
111
Scott, L. & Rahman, M. 2015. Strengthening coherence between agriculture and
social protection: Bangladesh case study (mimeo) London, Overseas Development Institute.
Singh, I., Squire, L. & Strauss, J., eds. 1986. Agricultural household models:
Extension, application and policy. Baltimore, MD, Johns Hopkins University Press.
Slater, R., Harman, L., Ulrichs, M., Scott, L. & Wiggins, S. 2016. Strengthening
Coherence Between Agriculture and Social Protection: Synthesis of Six Country Case
Studies. PtoP Working Paper.
Smith, L.C., Khan, F., Frankenberger, T.R., Wadud, A.K.M. Abdul. 2013.
Admissible Evidence in the Court of Development Evaluation? The Impact of CARE’s
SHOUHARDO Project on Child Stunting in Bangladesh. World Development, vol. 41: 196-
216.
Soares, F. V., Ribas, R. P & Hirata, G.I. 2010. Impact evaluation of a rural
conditional cash transfer programme on outcomes beyond health and education. Journal of
Development Effectiveness, vol. 2(1): 138-157.
Taylor, E., Kagin, J., Filipski, M. & Thome, K. 2013. Evaluating the General
Equilibrium Impacts of Kenya’s Cash Transfer Programme for Orphans and Vulnerable
Children (CT-OVC). Report prepared for the PtoP project, Rome, FAO. Available online at:
http://www.fao.org/fileadmin/user_upload/p2p/Publications/Kenya_LEWIE_2013.pdf.
Taylor, J. E., Thome, K., Davis, B. & Filipski, M. 2014a. Productive spillovers of social
cash transfers in Africa: A Local Economy-wide Impact Evaluation (LEWIE) approach.
IPC-IG One Pager 254
Available online at: http://www.ipc-undp.org/pub/eng/OP256_Productive_Spillovers
_of_Social_Cash_Transfers_in_Africa.pdf.
Taylor, E., Thome, K. & Filipski, M. 2014b. Evaluating Local General Equilibrium
Effects of Lesotho’s Child Grants Programme. Report prepared for the PtoP project, Rome,
FAO. Available online at: http://www.fao.org/docrep/019/i3691e/i3691e.pdf.
Taylor, J. E.; Thome, K., Davis, B., Seidenfeld, D. & Handa, S. 2014c. Evaluating
local general equilibrium impacts of Zimbabwe’s Harmonized Social Cash Transfer
Programme (HSCT). Report prepared for the PtoP project, Rome, FAO. Available online at:
http://www.fao.org/3/a-i4187e.pdf.
Thome, K., Taylor, E., Kagin, J., Davis, B., Osei, R. D. & Osei-Akoto, I. 2014. Local
Economy-wide Impact Evaluation (LEWIE) of Ghana’s Livelihood Empowerment Against
Poverty (LEAP) programme. Report prepared for the PtoP project, Rome, FAO. Available
online at: http://www.fao.org/3/a-i3814e.pdf.
Thome, K., Taylor, E., Tsoka, M., Mvula, P., Davis, B. & Handa, S. 2015. Local
Economy-wide Impact Evaluation (LEWIE) of Malawi’s Social Cash Transfers (SCT)
Programme. Report prepared for the PtoP project, Rome, FAO. Available online at:
http://www.fao.org/3/a-i4458e.pdf.

112
Thome, K., Taylor, J.E., Filipski, M., Davis, B. & Handa, S. 2016. The local economy
impacts of social cash transfers - A comparative analysis of seven sub-Saharan countries,
Report prepared for the PtoP project, Rome, FAO. Available online at:
http://bit.ly/1VLs7xY.
Tirivayi, N., Knowles, M. & Davis, B. 2013. The interaction between social
protection and agriculture: A review of evidence. Report prepared for the PtoP project,
Rome, FAO. Available online at: http://bit.ly/1mqYZwL.
Tiwari, S., Daidone, S. & Davis, B. 2015. Impact of Cash transfers on technical
efficiency of agricultural households in Zambia: A stochastic frontier analysis. Unpublished
manuscript.
Upton, J. B., Lentz, E. C., Barrett, C.B. & Garg, T. 2012. Local Food for Local
Schools: An analysis of the impact of local procurement for a school feeding programme in
Burkina Faso. Mimeo. Available online at http://barrett.dyson.cornell.edu/Papers/
Upton%20et%20al%20Feb%202012.pdf).

113
Appendix
Table A.0. Search strings used per geographical coverage, types of
programmes and outcomes of interest
Population Social protection and agricultural
interventions
Outcome of interest
Rural poor and vulnerable
populations living in Latin
America, Africa, Asia and
Eastern Europe
Social protection and agricultural
interventions
Hunger, malnutrition and
poverty
Social protection:
Social assistance
Cash transfer
Social cash transfer / social grant
Basic income/ minimum income
Conditional cash transfer
Financial transfer / monetary transfer
Child grant / benefit / allowance
Disability grant / benefit
Old age grant / benefit / pension / social
pension / non-contributory pension
Food transfer
Asset transfers (+)
Cash for work/ food for work
Public works / employment guarantee
Schemes / public employment programmes
Microfinance
Home grown school feeding programme
(including take home rations)
Fee waivers (health and education)
Weather-based crop insurance
Agriculture interventions:
Seed transfers
Improved seed transfers
Agricultural asset transfers
Fertilizer subsidies (vouchers)
Extension services: market information,
farmer field schools, technical advice on
climate-smart agriculture
Subsidized credit
Investment grants (+)
Low-cost farming equipment
Input technology
Inputs for work
Institutional procurement/demand
Homestead gardening
Minimum price
Price hedging
Savings
Financial literacy
Basic entrepreneurship
Income
Earnings
Expenditure
Spending
Consumption
Food consumption
Purchase
FGT
Poverty headcount
Poverty gap
Poverty depth
Poverty severity
Benefit incidence
Expenditures on agricultural
inputs
Inputs
Fertiliser
Seed
Investment
Disinvestment
Income generating activities
Coping strategy
Productivity
Production
Own production
Off-farm labour
Risk
Yield
Asset
Livestock
Smallstock
Housing
Property
Land
Tools
Equipment
Vehicle
Bicycle
Savings
Borrowing
Loans

114
Land titling
Land reform
Rural infrastructure
Soil and water conservation
Irrigation
Market arrangements
Cooperatives
Debt
Credit
Business / trade
Income-generating activity
Employment
Labour supply
Labour demand
Hiring
Jobs
Work
Workforce
Labour market
Labour participation
Labour allocation
Number of hours worked
Informal
Formalization
Migration
Time allocation
Child care
Child labour
Wage
Salary
Diversification of income
sources
Income multiplier
Spillovers
Price levels
Social networks
Private transfers
Remittances
Food security/ food
insecurity
Food access
Food diversity
Dietary diversity
Food variety
Vitamins
Micronutrients
Diet
Food intake
Nutrition*
Calories
Nutritional supplements +
Stunting
Wasting
Malnutrition
(+) depending on the design, can be classified as social protection or agricultural interventions.

115
Table A.1 Evaluation papers dates
Year Frequency. %
2009 2 5
2010 2 5
2011 1 3
2012 7 19
2013 1 3
2014 5 14
2015/6 19 51
Total 37 100

116
Table A.2 Main features of the interventions149
Programme Country Social
Protection
intervention
Agricultural Intervention
and others Typolog
y Coordin
ation Target population
Number of
Beneficiarie
s Implementer Ministries
CFPR (Phase 1) 2002-2006
Bangladesh Cash transfer (weekly stipend) to
avoid depletion of
assets. Nutritional supplements and
access to BRAC’s
doctors free of charge during the
24 months of the
programme.
Productive asset transfer jointly with continuous and intensive training
sessions, both in-class and hands-on as
well as follow-up coaching visits. Supported business activities (9
options): goat-rearing, cow-rearing,
livestock (a combination of cow-rearing and goat-rearing), Black
Bengal goat-rearing (special farm),
cow and poultry rearing, vegetable cultivation, horticulture nursery, non-
farm activities and poultry for egg
production.
Sustainable livelihoods
approach
Fully coordinated
Ultra-poor women. The ultra-poor population is the
lower subset of the
extremely poor, earning less than $0.60-$0.70 per
day. Selected through
wealth ranking plus inclusion and exclusion
criteria.
About 100 000 households in
15 districts in
Northern Bangladesh.
BRAC -
CFPR (Phase 2)
2007 – 2011
Same as CFPR 1, but intensity of coverage and
diversity in support
packages were strengthened
Bangladesh
Cash transfers
(weekly stipend) to
avoid depletion of assets. Nutritional
supplements and
access to BRAC’s doctors free of
charge during the
24 months of the programme.
Productive asset transfer jointly with
continuous and intensive training
sessions, both in-class and hands-on as well as follow-up coaching visits
Supported business activities (9
options): goat-rearing, cow-rearing, livestock (a combination of cow-
rearing and goat-rearing), Black
Bengal goat-rearing (special farm), cow and poultry rearing, vegetable
cultivation, horticulture nursery, non-
farm activities and poultry for egg production.
Sustainable livelihoods
approach
Fully
coordinated Ultra-poor women – same
criteria as CFPR (Phase 1) 370 300
households BRAC -
ER+ (2011-2012)
Bangladesh
Public works (ER) and cash transfer in
the 3rd year (2013)
- 500 BDT per month.
Group-based entrepreneurial skills
training to select income-generating
activity. After business plan is prepared: investment grant of 12 000
BDT if successful and then regular
coaching takes place.
Sustainable
livelihoods
approach (compleme
ntary
approach)
Fully coordinated
Beneficiary women and/or spouse of beneficiary men.
ER+: 18 000
women and ER: 80,000
workers/trainees
for food/cash for work and
training.
Government of Bangladesh,
community
members and NGOs, WFP.
Ministry of Local Government,
Rural Development and
Cooperatives
149 Note that the classification of the agricultural and social protection interventions used in Table A.2. does not allow cross-cutting components such as those presented
in Section 3. As the agricultural interventions column here allows for ‘others’, the cross-cutting components were, in general, placed jointly with agricultural
interventions.
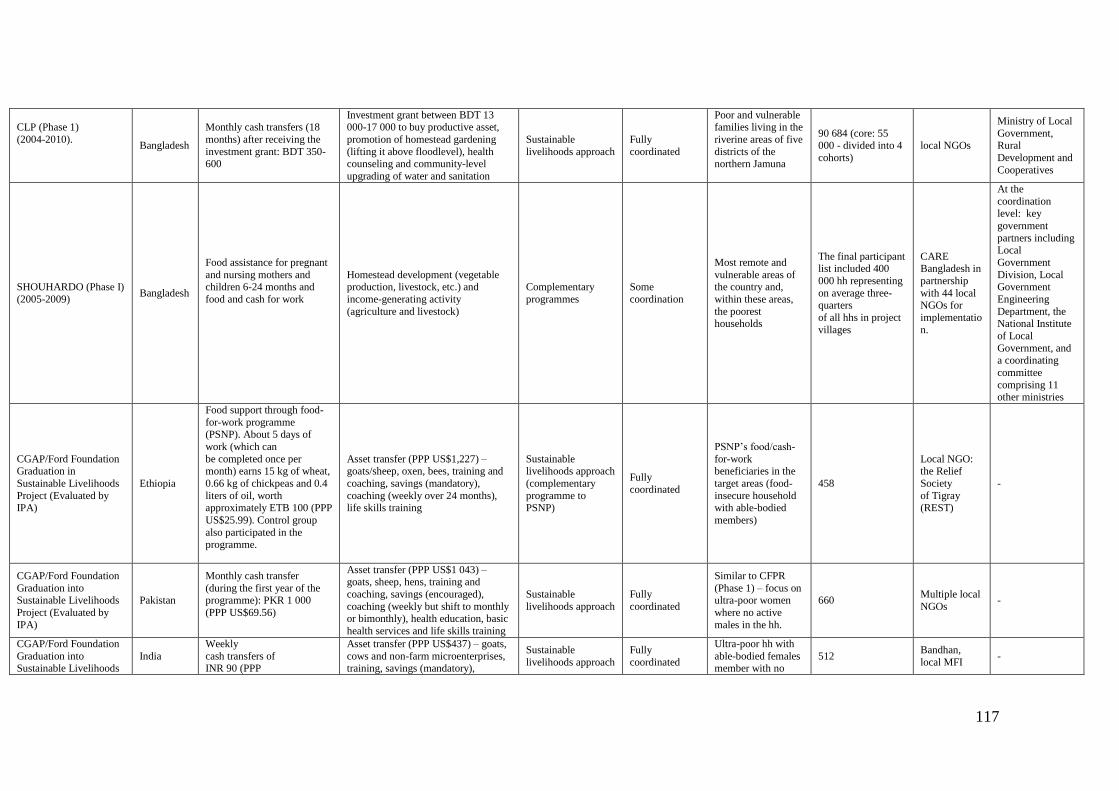
117
CLP (Phase 1)
(2004-2010).
Bangladesh
Monthly cash transfers (18
months) after receiving the
investment grant: BDT 350-600
Investment grant between BDT 13 000-17 000 to buy productive asset,
promotion of homestead gardening
(lifting it above floodlevel), health counseling and community-level
upgrading of water and sanitation
Sustainable
livelihoods approach
Fully
coordinated
Poor and vulnerable families living in the
riverine areas of five
districts of the northern Jamuna
90 684 (core: 55 000 - divided into 4
cohorts)
local NGOs
Ministry of Local
Government, Rural
Development and
Cooperatives
SHOUHARDO (Phase I)
(2005-2009) Bangladesh
Food assistance for pregnant
and nursing mothers and children 6-24 months and
food and cash for work
Homestead development (vegetable production, livestock, etc.) and
income-generating activity
(agriculture and livestock)
Complementary
programmes
Some
coordination
Most remote and
vulnerable areas of the country and,
within these areas,
the poorest households
The final participant list included 400
000 hh representing
on average three-quarters
of all hhs in project
villages
CARE Bangladesh in
partnership
with 44 local NGOs for
implementatio
n.
At the
coordination level: key
government
partners including Local
Government
Division, Local Government
Engineering
Department, the National Institute
of Local
Government, and a coordinating
committee
comprising 11 other ministries
CGAP/Ford Foundation Graduation in
Sustainable Livelihoods
Project (Evaluated by IPA)
Ethiopia
Food support through food-
for-work programme (PSNP). About 5 days of
work (which can
be completed once per month) earns 15 kg of wheat,
0.66 kg of chickpeas and 0.4
liters of oil, worth approximately ETB 100 (PPP
US$25.99). Control group
also participated in the programme.
Asset transfer (PPP US$1,227) – goats/sheep, oxen, bees, training and
coaching, savings (mandatory),
coaching (weekly over 24 months), life skills training
Sustainable livelihoods approach
(complementary
programme to PSNP)
Fully coordinated
PSNP’s food/cash-
for-work beneficiaries in the
target areas (food-
insecure household with able-bodied
members)
458
Local NGO: the Relief
Society
of Tigray (REST)
-
CGAP/Ford Foundation
Graduation into Sustainable Livelihoods
Project (Evaluated by
IPA)
Pakistan
Monthly cash transfer
(during the first year of the programme): PKR 1 000
(PPP US$69.56)
Asset transfer (PPP US$1 043) – goats, sheep, hens, training and
coaching, savings (encouraged),
coaching (weekly but shift to monthly or bimonthly), health education, basic
health services and life skills training
Sustainable
livelihoods approach
Fully
coordinated
Similar to CFPR
(Phase 1) – focus on ultra-poor women
where no active
males in the hh.
660 Multiple local
NGOs -
CGAP/Ford Foundation
Graduation into Sustainable Livelihoods
India
Weekly
cash transfers of INR 90 (PPP
Asset transfer (PPP US$437) – goats,
cows and non-farm microenterprises, training, savings (mandatory),
Sustainable
livelihoods approach
Fully
coordinated
Ultra-poor hh with
able-bodied females member with no
512 Bandhan,
local MFI -

118
Project (Evaluated by
IPA)
US$8.76) for about 13 to 40
weeks depending on asset chosen.
coaching (weekly over 18 months),
health education, basic health services and life skills training and support
from village assistance committees.
active male in the
hh.
CGAP/Ford Foundation Graduation into
Sustainable Livelihoods
Project (Evaluated by IPA)
Honduras
One-time food transfer (to cover 6 months, PPP
US$217). Selection criterion
does not exclude those
benefiting from CCT, but
excludes beneficiaries from
other development programmes.
Asset transfer (PPP US$537) – hens,
pigs and fish; training, savings (mandatory with incentives), coaching
(weekly for 24 months), health
education, basic health services and life skills training, support from
village assistance committees
Sustainable
livelihoods approach
Fully
coordinated
Ultra-poor
households with
children not
participating in other
programmes except
for CCT
800
Local and
international
NGOs: PLAN
and Arariwa
(microfinance
)
-
CGAP/Ford Foundation Graduation into
Sustainable Livelihoods
Project (Evaluated by
IPA)
Peru
Treatment households that
were not enrolled in the government CCT programme
(Juntos) received monthly
cash transfers of PEN 100 (PPP US$71.96).
Treatment and control
households enrolled in Juntos
received bimonthly cash
transfers of PEN 200 (PPP
US$143.33). About 57 percent of the control group
also received Juntos.
Asset transfer (PPP US$854) – guinea
pigs, hens, cattle; training, savings
(encouraged), coaching (every six weeks over 24 months), health
education, basic health services and
life skills training
Sustainable
livelihoods approach
(complementary programme to
Juntos for some
beneficiaries)
Fully coordinated
Ultra poor, able-
bodied, children in
the household; no formal employment
for head or spouse.
Programme does not
have a clear focus
on women unlike
others.
785
Local and
international
NGOs: PLAN and OEDF
(microfinance
)
-
CGAP/Ford Foundation
Graduation into
Sustainable Livelihoods Project (Evaluated by
IPA)
Ghana
Weekly cash transfers of
GHS 4 to 6 (PPP
US$6.02 to 9.03) during the lean season - amount variable
with household size
Asset transfer ((PPP US$451.38) -
goats and hens, goats and maize inputs, shea nuts and hens, training,
savings (mandatory for 50 percent of
beneficiaries with saving accounts), coaching (weekly over 24 months),
health education, basic health services
and life skills training, and support from village assistance committees.
Sustainable
livelihoods approach
Fully
coordinated
Ultra poor – able
bodied and presence of women in the hh
666
Local NGO: Presbyterian
Agricultural
Services
-
SKS Ultra Poor
Programme (SKS-UPP) (CGAP/Ford
Foundation)
India
Cash transfer on a per need
basis (US$12 – given per demand over 18 months).
Social development: building
safety nets and connecting participants to existing public
safety nets.
Asset transfer (US$195.61) - buffaloes, training, cash stipend for
working capital, mandatory savings,
essential health care and financial literacy.
Sustainable livelihoods approach
Fully coordinated
Ultra poor 426 Local NGO: SKS
-
Women's Income Generation Support –
WINGS
(2009-2011)
Uganda
No income/consumption support, but cash support for
working capital (similar non-
depletion function for asset)
Investment grant (PPP US$375) after 5 days of business skills training,
regular follow-up by trained
community workers (four to five visits
Sustainable
livelihoods approach
Fully
coordinated
Young ultra poor –
75 percent women.
1 800 (divided into two cohorts of
approximately 900
each)
Local NGO:
AVSI -

119
over 6 months), and self-help group
for some of treated households. Field workers encouraged clients to
consider high cash flow activities that
would diversify their income sources. They strongly encouraged petty trade
(buying items in the city and
reselling) over investing the grant in
alcohol brewing or livestock. Business
plan need to be approved. About 95
percent of clients made business plans for buying and selling
goods – generally produce or some assortment of food and small
household
items.
Indira Kranti Patham +
NREGA
(2004-2008 – Phase 1)
India
Self-help group participants
access existing programmes.
It also overlaps with NREGA
– employment guarantee
schemes in some areas –
heterogeneity of impacts is evaluated.
Formation of self-help groups (SHG),
investment/seed funds, access to low-cost credit (links groups to banks),
savings, training in social and
economic skills, as well as livelihoods. Savings and investment
fund were the most accessible
interventions.
Complementary
programmes plus
sustainable
livelihoods
component
Some coordination
and overlap
with
employment
guarantee
schemes and other social
programmes
Poor women in rural
areas
Large numbers, but
unclear from paper.
District Rural
Development
Agencies (DRDAs)
Department of
Rural
Development,
Government of
Andhra Pradesh
P135-II Vietnam Access to public services
Infrastructure development, capacity-building, access to basic services and
agricultural support: skills and
training of ethnic minorities for improved livelihoods. Includes
extension services, demonstration
models and distribution of agricultural
inputs
Community-level intervention,
complementary
programmes and livelihoods approach
Some coordination (at
geographical
not household level)
Poor ethnic
minorities in remote
areas.
Large numbers, but unclear
Decentralized
- local
government
Committee for
Ethnic Minority
Affairs (CEMA)
PSNP and OFSP/HASP Ethiopia
Public works (labour-
unconstrained households)
and cash transfers (labour- constrained households)
Agricultural extension services, technology transfer (advice on food
crop production, cash cropping,
livestock production and soil and water conservation) and irrigation and
water harvesting schemes
Complementary
programme
Some
coordination
(HASP built on OFSP but it was
meant to
improve coordination
and access for PNSP
beneficiaries)
Chronically food
insecure who are able-bodied and
self-select for cash/food for work
7 million Government
of Ethiopia
Government of
Ethiopia
FFW and FSP Ethiopia Public works Credit/loans (food security package).
The household level FSP intends to
Combined
programme
Some level of
coordination
Chronically food-
insecure who are 7 million
Government
of Ethiopia
Government of
Ethiopia

120
diversify the income base of the poor
through provision of resources (credit) for a range of activities in a
package. Identifying the basic interest
of the rural poor and providing the required resources, technical
assistance and training to engage in
their choice of activities so as to
secure food at household level and
sustain income over time is the prime
concern of the FSP programme.
(more
geographical)
able-bodied and
self-select for cash/food for wor
Social Cash Transfer Programme (SCTP) and
Farm Input Subsidy
Programme (FISP)
Malawi Social cash transfer Input subsidy Overlapping
programmes
No coordination
(overlapping)
SCTP: ultra-poor
households, defined
as households unable to meet their
most basic urgent
needs, including food and essential
non-food items and
labour-constrained
households
FISP: smallholder
farmers who are resource-poor but
own a piece of land
SCTP: 100 000 hha (by April 2015)
FISP: 1.5 million
farmers
Government
of Malawi
SCTP: Ministry of
Gender, Children
and Social Welfare
(MGCSW) and
Ministry of Finance,
Economic
Development and
Planning
(MFEDP)
FISP: Ministry of Agriculture and
Food Security
Local Education Assistance and
Procument (LEAP)
project
Burkina
Faso School Feeding Programme
Local Procurement from smallholder
farmers Complementary
Programmes
Fully
coordinated
Local farmers
organisations from
poor areas and schools in poor
areas
368 schools in 8 departments –
58,127 students
received 20 daily rations per month.
22
Farmers’organizatio
ns - average from
10 to 58 members.
Catholic
Relief
Services (USAID
funds)
Not clear
Atención a Crisis (CCT)
plus investiment grant and vocational training.
Nicaragua CCT (one-year pilot)
Vocational training and investment
grants (different groups received each component)
Complementary
programme
Fully
coordinated
Extreme poor in drought prone area
(proxy means
testing)
3 000 families Ministry of
the Family
Ministry of the
Family
Juntos plus Rural credit Peru CCT (families with children) Rural credit (different types) Overlapping programmes
No coordination (overlapping)
Extremely poor
families in rural
areas
737 144 families (Juntos in 2015).
Rural credit (2012
agricultural census): only 8 percent of
Ministry of
Social
Inclusion and Development
(Juntos) and
credit
Ministry of Social Inclusion and
Development
(Juntos) and credit institutions

121
rural households
have obtained some kind of
productive credit
(186 491 households
nationwide)
institutions
(public and private)
(public and
private)
Bolsa Familia plus
PRONAF Brazil CCT (monthly cash transfers) Rural credit
Overlapping
programmes No coordination
Poor families (Bolsa
Familia) and family farmers (PRONAF)
13.9 million
families (Bolsa Familia in 2015)
2006 agricultural
census: 14.3 percent of the family farms
had access to
PRONAF subsidized credit
Ministry of
Social
Development
and Fight against
Hunger (MDS
- CCT) and Ministry of
Agrarian
Development and Ministry
of Finance
(rural credit)
Ministry of Social
Development and
Fight against Hunger (MDS -
CCT) and
Ministry of Agrarian
Development and
Ministry of Finance (rural
credit)
Juntos plus Sierra Sur Peru CCT (bimonthly cash
transfers)
Natural resources management and access to market components.
Including productive technical
assistance for producers associations and cooperatives hired by the
associations with resources from the
project
Overlapping
programmes
No coordination
(overlapping)
Extremely poor
families in rural areas.
737 144 families
(Juntos in 2015)
Ministry of
Social
Inclusion and Development
(Juntos) and
Ministry of Agriculture
and Irrigation
Ministry of Social Inclusion and
Development
(Juntos) and Ministry of
Agriculture and
Irrigation
Juntos plus Haku Wiñay Peru CCT (bimonthly cash
transfers)
Development of productive and
entrepreneurial skills to help households strengthen their income
generation and diversification
strategies. Four components: 1) family production systems, designed
to help households adopt simple and
low-cost technological innovations and to enhance food security.The
programme provides productive
assets, technical assistance and training; 2) healthy housing, aimed at
promoting healthy daily living practices by implementing safe
kitchens and fostering access to safe
water and efficient solid waste
management; 3) inclusive rural
Overlapping
programmes
Some level of coordination,
particularly, for
component 4, financial
literacy, which
is exclusively for Juntos
beneficiaries.
Extremely poor families in rural
areas
737 144 families (Juntos in 2015)
Haku Wiñay: The project was first
piloted in two
districts, Vinchos and Chuschi, and
benefited 930
family farmers. It was later expanded
and by March 2014 had reached 91 124
hh across 732
rural villages.
Ministry of
Social
Inclusion and Development
(Juntos) –
including FONCODES.
Ministry of Social Inclusion and
Development
(Juntos) – including
FONCODES.

122
businesses, designed to promote
business initiatives and entrepreneurship by funding and
organizing grant competitions and
helping those interested in participating to organize and prepare
business plans to pursue those grants.
(This component encourages
participants to associate with others
to approach local markets more
efficiently – the grants fund technical assistance and training); and 4)
financial education, involving training and assistance to promote
formal savings, especially among
those who receive cash transfers from Juntos.
Prospera/Oportunidades
plus PROCAMPO Mexico CCT
Financial compensation for the North
American Free Trade Agreement
Overlapping
programmes
No coordination
(overlapping)
Poor families with
children (CCT)
About 6 million
families (Prospera
in 2015)
SEDESOL
(Prospera/Op
ortunidades)
and ASERCA
for
PROCAMPO -
SEDESOL
(Prospera/Oportunidades) and
ASERCA for
PROCAMPO -
Comunidades Solidarias
Rurales plus rural
development interventions
El Salvador CCT
Extension services to improve
production, homestead gardens,
natural resources management and access to markets
Overlapping
programmes
No coordination
(overlapping)
Poor families with children (CCT) and
the rural poor
80 222 in 2013 CSR (max 105 824 in
2009)
FISDL (CSR)
and Ministry of Agriculture
and Livestock
(RD)
FISDL (CSR) and
Ministry of
Agriculture and Livestock (RD)
Ingreso Etico Familia plus Productive Support
from FOSIS
programmes.
Chile CCT Business support (credit and training)
Complementary
programme (priority access)
Coordinated but
low coverage
Extreme poor
families (IEF)
179 539 households
in 2015
MDS and
FOSIS MDS and FOSIS
Familias en Acción plus
Oportunidades Rurales Colombia CCT
Financial support for farmer's
organizations to purchase extension services
Complementary
programme (priority access)
Designed to be integrated
(incentive-
based). But overlap (40
percent) was
low due to fraud
Extreme poor
families (FA) and
farmers organization with beneficiary of
Familias en Acción
2,561,059 households in 2015
(Más Familias en
Acción)
Social
Prosperity
Department (FA) and
Ministry of
Agriculture and Livestock
(OR)
Presidency of the Republic (FA)
and Ministry of
Agriculture (OR)
Child Grant Programme plus Linking Food
Security and Social
Protection
Lesotho UCT
Homestead gardening (seeds) and
food preservation training and nutrition training
Complementary
programme
Fully
coordinated
Extreme poor
families with children
20 000 families
Ministry of Social
Development
(CGP) and
Ministry of Social
Development (CGP)

123
Table A.3 Evaluation Report/Papers main features
FAO,
Catholic Relief
Services
(CRS) and the Rural Self-
Help
Development
Association
(RSDA) for
LFSSP
Evaluation
paper/report Country Interventions Survey and data Methodology Control group Outcomes
Ahmed et al.
(2009) Bangladesh
CFPR (Phase
1)
Baseline survey: June to August 2002 (before the
intervention was implemented). The sample size was 5 626 households of which 2 633 were treated
and 2 993 were control. Follow-up survey: In 2005
(one year after the end of the intervention), about 5 228 households were resurveyed, including 278
new households. Treated group: 2 474 and control
group: 2 754. A subsample of households replied to a food
consumption module in 2002 (400 hh) and later in
2004 (373 hh) and 2006 (365 hh). The 2006 survey was used to assess sustainability of impacts two
years after programme had finished. Sample drawn
from three districts (Rangpur, Kurigram and Nilphamari) in Northern Bangladesh
that entered the programme in 2002. Programme
was later expanded to 15 districts (See Table 4).
Quasi-experimental: propensity score matching with difference-
in-differences. Matching done
using local linear regression method with a tricube kernel
(using Stata’s psmatch2).
Standard errors of the impact estimates are calculated by
bootstrap using
500 replications for each estimate.
Rationale: treated group was
poorer than control group.
Non-selected ultra-poor – non-
compliance with
some of the programme eligibility
criteria (inclusion,
exclusion criteria) despite being ranked
as ultra-poor
Assets: own cultivable land (in decimal); rented-in land (in decimal); # cows; # goats; #
poultry.
Savings: % cash savings Education: net primary school enrolment (6-
11 years old)
Food security: perceived food deficit (always, some, none, surplus).
Health and sanitation: hh has a sanitary latrine
Clothing ownership : # saris; % winter clothes; % shoes for all hh members:
Food consumption: monthly per capita food
expenditure (in BDT); energy consumption (kcal per person per day)
Erman, Robano
and Smith (2014)
and Emran, Robano and Smith
(2009).
Same authors and
almost the same
paper. Earlier working paper
version has a
Bangladesh CFPR (Phase
1)
Same data as in Ahmed et al. (2009). The final matched panel used in analysis contained 5 067
households.
Quasi-experimental: Four
methods were used: simple,
difference-in-differences, standard propensity score
matching with difference-in-
differences, MB-IPW (inverse-probability weighting –
regression framework) and Klein-
Vella Heteroskedasticity-based Identification.
Two comparison
groups were used: the
non-selected ultra poor (as in most
studies of the CFPR
1) and eligible households (matching
all requirements) that
did not received the programme. Unlike
the non-selected, the
Assets: total land owned (in decimal); % own
homestead land; # cows; # goats; # poultry; #
fishing nets; # big trees; # rickshaw/vans; # bicycles; # chairs/tables; # radios/tvs; #
quilts/blankets; # tube-wells
Income: per capita income (in BDT) Savings: % cash savings
Food security: food availability (perceived
food deficit); % meals twice a day. Clothing: # saris; # of lungis; % shoes for all
hh members.

124
quantile analysis
of impacts on income.
group of eligible but
not receiving the programme is more
similar to the treated
group.
Female empowerment: ratio #saris/# lungis;
% girls working; % girls that can read and write a letter; years of schooling of female
children
Housing condition: % roof made of tin Health: health status (subjective); health
improvement (compared to last year -
subjective)
Child labour: % of children working.
Das and Misha (2010) and Raza, Das and Misha
(2012)
Similar authors,
different methodologies.
Das and Misha
(2010) looked at
more outcomes.
Bangladesh CFPR (Phase 1)
Panel data from three rounds of survey (2002, 2005
and 2008). The data for 2002 and 2005 is the same as used in Ahmed et al. (2009). Follow up survey
in 2008 (four years after intervention finished for
the treated group) – 4 549 hh were resurveyed: 2 251 treated and 2 298 control. Attrition rate: 7
percent in 2005-2002 and 19 percent in 2008-2002.
Data on food expenditure used in Ahmed et al. (2009) for 2002-2004-2006 is reexamined in these
two papers.
Quasi-experimental:
Das and Misha (2010):
difference-in-differences in a multivariate regression analysis.
Raza, Das and Misha (2012): propensity score matching with
difference-in-differences – similar
procedure as in Ahmed et al.
(2009).
Non-selected
ultrapoor – non-compliance with
some of the
programme eligibility criteria despite being
ranked as ulta-poor
Income and assets: per capita real income (in
BDT); own homestead land (in decimal); own
cultivable land (in decimal); rented land (in decimal); # cows; # goats; #poultry; #big
trees; # radios; # beds; # rickshaws/vans;
market value of the house (in BDT). Credit: outstanding credit from formal source
(in BDT); outstanding credit from formal
source (in BDT)
Food consumption: per capita food
expenditure (in BDT); per capita calorie
intake (per day)
For Das and Misha (2010) only:
Primary occupation of the working age (15-60
years) men and women separately: % farm self-employment; % day labour; % non-farm
self-employment; % begging; % work as
servant; % student; % unemployed. Assets: # of chair (besides all others
indicators reported in Raza, Das and Misha
(2012).
Savings: % cash savings
Credit: outstanding loans (% and BDT)
outstanding lending (% and BDT) Social asset/capital:% got invitation from
non-relative neighbour; % helped by non-
relative neighbour; % anybody taken advice; % believed that someone would lease land.
Health: % prevalence of illness; % sick members paid for treatment; medical
expenditure (in BDT); % sick members who
lost working days due to illness; working days lost.

125
Education: Net primary enrollment and net
secondary enrollment rate for boys and girls separately.
Housing conditions: % roof made of tin; %
own house; type of house; Water and sanitation: % drink water from
tube-well; % use water from tube-well to
cook; % have sanitary latrine; % all hh
member use saldals while in toilet.
Food security: % perceived food deficit
(always, some, nor deficit nor surplus, surplus).
Crisis incidence and expenditures to cope with it: house damaged; illness; marriage;
death of livestock; death of hh member; death
of hen. Graduation: # of indicators satisfied.
Krishna, Poghosyan and
Das (2010)
Bangladesh CFPR (Phase 1)
Panel data from three rounds of survey (2002, 2005
and 2008). The data for 2002, 2005 and 2008 is the
same as used in Das and Misha (2010) and Raza, Das and Misha (2012) – see above. Reported attrition rate: 6 percent in 2005-2002 and 14
percent in 2008-2005. Data on food expenditure
used in Ahmed et al. (2009) for 2002-2004-2006 is reexamined in these two papers.
Quasi-experimental: difference-
in-differences in a multivariate
regression analysis.
Non-selected
ultrapoor – non-compliance with
some of the
programme eligibility criteria despite being
ranked as ulta-poor
Asset: asset index (excluding land
ownership); owned land (decimals); cultivable land (decimals).
Income: per capita income
Savings: % cash savings. Health: self-reported health status and health
improvements of household heads.
Misha et al. (2014)
Bangladesh CFPR (Phase 1)
Same dataset as previous studies but added a final wave in 2011 in which 4 144 hh of the original
sample were reinterviewed (7 years after the treated
group received the treatment). Attrition rate: 28 percent - but none of the baseline characteristics
were good predictors of the attrition later in the
panel.
Quasi-experimental: difference-in-differences with propensity
score matching (DID-IPW).
Robustness checks use non-
parametric PSM (5-NN)
combined with DID.
Rationale: authors noted that the
inclusion and exclusion criteria are not implemented very strictly
so that regression discontinuity
analysis cannot be applied. Although three quarters of the
participants fall within the poorest
quartile. Emran, Robano and
Smith (2014) also confirm there
are a considerable number of
Non-selected
ultrapoor – non-compliance with
some of the
programme eligibility criteria despite being
ranked as ulta-poor
Assets: % own homestead land; % owns any
cultivable land; # cows; #goats; # poultry; #
big trees; % rickshaw/vans; # radios/tvs;
Income: annual per capita income (in BDT)
Food security: % all member eat at least 2 meals per day.
Savings: % cash savings
Credit: % formal loans; % informal loans Occupation: % entrepreneur; % begging or
maid; % day labourer; % employed
Housing: % roof made of tin Social capital: % invited to non-relative home

126
households who met all the
selection criteria but were excluded from the program and
vice-versa.
Raza and Ara (2012)
Bangladesh CFPR (Phase 2)
A baseline survey was carried out from June to
August in 2007 in the 50 branches in 5 districts
covered by the programme (STUP2 package) in 2007. Baseline survey: 3 685 hhs ( 778 treated and
2 907 control). Follow-up survey conducted in
2009: 3 387 hh (693 treated and 2 783 control). The total attrition rate: 8.08 percent. For the analysis of
food security indicators, a smaller subsample
consisting of a total of 2739 hh was used.
Quasi-experimental: propensity score matching with difference-
in-differences. Nearest Neighbour
matching technique using pscore Stata command.
Non-selected ultra-
poor – non-
compliance with some of the
programme eligibility
criteria (inclusion, exclusion criteria)
despite being ranked
as ultra-poor.
Assets: own cultivable land (in decimal); homestead land (in decimal); rented land (in
decimal); # and value in BDT of cows,
poultry, goat, rickshaw/van; big trees; # of
radio, tv, fan, mobile phone, bicycle, chair,
table, bed, mosquito net; value of house; cost
of housing structural improvement Income: per capita income (*only reported in
text and figure is incomplete; results missing
in Tables) Savings: savings at home; at bank/PO; at
BRAC; with NGOs and total savings (in
BDT) Occupation (15-65 years): hours per year
spent on: agricultural self-employment; day
labourer; household chores;
housemaid/household aid; others (salary,
students, begging, unemployed) determined
separately for men and women.
Bandiera et al.
(2013) Bangladesh
CFPR (Phase 2)
(CGAP/Ford
Foundation)
The evaluation sample covered 1 409 rural communities located in the 13 poorest districts of
Bangladesh, half of which were treated in 2007 and
the rest kept as controls until 2011. There were three surveys: baseline (2007), midline (2009) and
endline (2011). One or two subdistricts (upazilas)
from each district were randomly selected. In each
of the 20 subdistricts one BRAC office was
randomly assigned to treatment (to receive the
program in 2007) and another to control (to receive the program in 2011). Using BRAC branches rather
than communities as the unit of randomization
minimized the risk of contamination. At baseline, the evaluation sample contained: 7 953 eligible
women in 1 409 communities in 40 BRAC
branches and an additional 19 012 households from all other wealth classes – including poor but non-
eligible and a 10 percent sample of higher wealth
classes.
Experimental: Randomized control trial (experimental
evaluation) with difference-in-
differences. Unit of randomization: BRAC branches.
Only balanced sample: 6 732
eligible beneficiaries and 16 297
households from other wealth
classes. Subdistricts (upazilas)
were used for stratification, then fixed effects for subdistricts were
used. As there are differences in
baseline for occupational allocation between treated and
control groups the analysis also
controlled for that. Quantile treatment effect is also
estimated.
Cost-benefit analysis
Eligible hh whose
BRAC office was randomized out and
will only start the
programme 4 years later.
Assets: % rent land for cultivation; %own
land for cultivation; # cows; #poultry; # goat, value of all livestock (in BDT);
Savings: household total savings (in BDT)
Expenditures: per capita non-food expenditure and per capita food expenditure
(adult equivalent).
Food security: % hh in which all member eat
2 meals a day.
Occupation choice (eligible women only): %
specialized in wage employment; % specialized in self-employment; % engaged in
both occupations; hours in wage employment;
hours in self-employment; Seasonality and earnings: share of economic
activities held regularly; share of activities
with seasonal earnings; total annual earnings (in BDT); earnings per hour (in BDT).
Well-being: % satisfied with life; %
experience anxiety.

127
Bandiera et al. (2016)
Bangladesh
CFPR (Phase
2) (CGAP/Ford
Foundation)
Same as above
Experimental: Randomized
control trial (experimental evaluation) with difference-in-
differences. Unit of
randomization: BRAC branches.
Only balanced sample: 6 732
eligible beneficiaries and 16 297
households from other wealth classes. Subdistricts (upazilas)
were used for stratification, then fixed effects for subdistricts were
used. As there are differences in
the baseline for occupational allocation between treated and
control groups, the analysis also
controls for that. Quantile treatment effect was also
estimated.
Spillover effect on non-eligible. Cost-benefit analysis
of 7-year effect using treated
controls (quantile treatment effect)
Eligible hh whose BRAC office was
randomized out and will only start the
programme after four
years.
Assets: value of household assets – durable
goods (in BDT); asset index Productive assets: value of cows, value of
goats, rents land, owns land, value of land
owned, value of other business assets. Savings and financial assets: household cash
savings (in BDT), household receives loans,
household gives loans, financial inclusion
index.
Poverty and consumption: below poverty line
(%), consumption expenditure (per adult equivalent – in BDT), total per capita
expenditure (standardized) Food security: % hh in which all member all 2
meals a day, food security index.
Occupation: hours and days by livestock, agriculture, maid, total ; and total time spent
working by main woman (standardized), total
time spend by both respondents pooled (standardized)
Earnings: earnings in livestock, wage and
earning in agriculture, wage and earning as maid, earning in all 3 activities (in BDT);
income and revenue index.
Health: physical health index, mental health index.
Participation: political awareness index,
women’s empowerment index.
Raza and Van de Poel (2016)
Bangladesh
CFPR (Phase
2) (CGAP/Ford
Foundation)
Same as above Savm as above Same as above
Nutrition: a) under 5 years: weight for height
(z-scores), wasting%, height for age (z-score),
stunting %, weight for age (z-score), and
underweight %. b) 6-19 years: body mass
index (in SD), thinness (<2SD) %, height for
age (z-score), stunting %, weight for age (z-score), underweight %, c) 19 years or more:
body mass index (absolute), moderate
thinness (<18.5) %; severe thinness (<17).
Hernandez et al.
(2015) Bangladesh ER+
Baseline survey: March 2013 and follow-up
survey: March 2014.
Out of the 14 upazilas included in the survey, seven were selected as participants in the ER+ program,
and seven were selected as control 1, since ER
participants in those upazilas were not going to be
part of the ER+ programme. Survey participants
comprised three groups: a) treated: ER+
Quasi-experimental:
Difference-in-differences using panel data modelling. For
continuous outcome variables:
fixed effects and random effects
models. For binary response
outcome variables: probit models
Two control groups
were used: a) control 1 – just 2 years of
ER; b) control 1 plus
control 2 (non ER
beneficiaries)
Assets: total value of assets; value of durable
assets; value of non-farm assets; value of farm assets; rice area (decimal); non-rice area
(decimal); rice (kg); non-rice (kg).
Expenditure: per capita food expenditure;
total per capita expenditure;

128
participants; b) control 1: ER participants, but not
ER+; c) non-ER participants who are similar to participants. A three-stage stratified sampling
procedure was followed: (1) selection of upazilas,
(2) selection of primary sampling units (PSUs) in each upazila, and (3) selection of households in
each PSU. The samples were drawn in two ways:
(1) selected ER+ and control 1 sample from a list of
ER programme participants in the 14 selected
upazilas; and (2) selected control 2 sample through
a rapid enumeration of non-ER participants in the same locations. Baseline - Sample size: 2 397 hh
(800 ER+, 797 ER households as control 1, and 800 non-ER households as control 2) and Follow
up survey – 2 337 households (786 ER+, 781
control 1, and 770 control 2). Attrition: 2.5 percent.
with population-averaged effects
and random effects models.
Savings: total amount of savings. %
household with savings; % hh savings for buying assets and future investments.
Occupation: % hh has non-agricultural
enterprise
BDI (2012) Bangladesh
Food Security
for the Ultra Poor (FSUP)
Three rounds of survey. Baseline: February 2010
(before programme started, but after selection of participants); Midline: February/March 2011;
endline: May/June 2012. At the upazila level, all 1
260 ultra-poor participating households interviewed were randomly selected from the first cycle’s 5 000
households and compared with 647 households
belonging to the control group (not-participating
villages, but a comparison group selected using
same criteria). During the 2012 survey, 1 190
participating households and 647 non-participating households were surveyed. Attrition rate: 3.7
percent.
Quasi-experimental: simple difference-in-differences.
Comparison group
was selected using the same set of
criteria that was used
to select project participants. A census
was carried out in
randomly selected non-participating
villages to identify
households/ individuals that met
the project’s
inclusion and exclusion criteria.
The list of admissible
households/ individuals was then
used to randomly select non-
participants (control
group).
Income: hh total monthly income (average and median); hh per capita monthly income;
hh total monthly expenditure; # of income
sources
Assets: asset score; productive asset score;
non-productive asset score; value of assets;
Women : % women with income; share of income from women
Savings: % women with savings; value of
women’s savings (BDT); Credit: % women with loans; value of loans
(BDT).
Food security: # of meals per day; % women having 3 full meals a day; food consumption
score; number of food types consumed in last
week; per capita food expenditure (BDT);
share of food expenditure in total expenditure;
% of hh with borderline or poor food
consumption levels (based on FCS) Disaster and loss: % women facing loss due
to disaster; value of the loss (BDT); coping
strategy index score Health: % hh with a member sick in past
month; % hh that have lost a member due to illness; health expenditure last year (those
with ill member); cost of death
Sanitation: % hh with a latrine; % women who know about sanitary latrines; % male
member using latrine; % female members
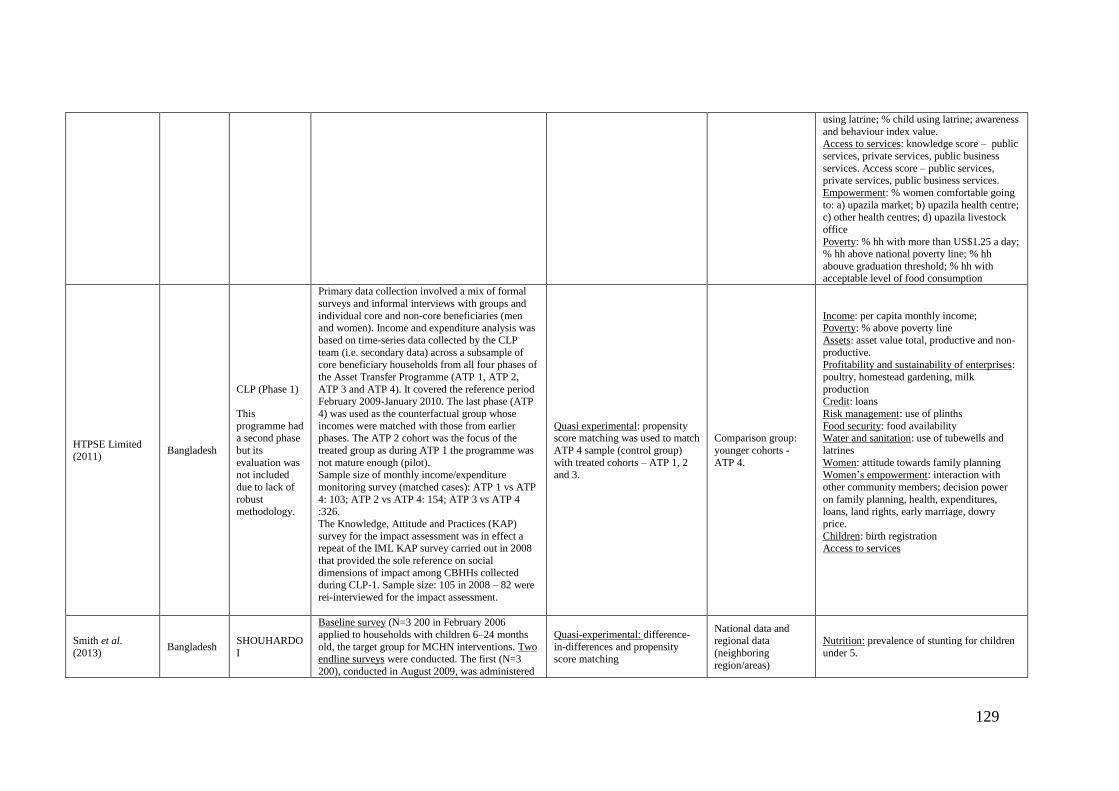
129
using latrine; % child using latrine; awareness
and behaviour index value. Access to services: knowledge score – public
services, private services, public business
services. Access score – public services, private services, public business services.
Empowerment: % women comfortable going
to: a) upazila market; b) upazila health centre;
c) other health centres; d) upazila livestock
office
Poverty: % hh with more than US$1.25 a day; % hh above national poverty line; % hh
abouve graduation threshold; % hh with acceptable level of food consumption
HTPSE Limited (2011)
Bangladesh
CLP (Phase 1)
This
programme had a second phase
but its
evaluation was not included
due to lack of
robust
methodology.
Primary data collection involved a mix of formal
surveys and informal interviews with groups and
individual core and non-core beneficiaries (men and women). Income and expenditure analysis was
based on time-series data collected by the CLP
team (i.e. secondary data) across a subsample of
core beneficiary households from all four phases of
the Asset Transfer Programme (ATP 1, ATP 2,
ATP 3 and ATP 4). It covered the reference period February 2009-January 2010. The last phase (ATP
4) was used as the counterfactual group whose
incomes were matched with those from earlier phases. The ATP 2 cohort was the focus of the
treated group as during ATP 1 the programme was
not mature enough (pilot). Sample size of monthly income/expenditure
monitoring survey (matched cases): ATP 1 vs ATP
4: 103; ATP 2 vs ATP 4: 154; ATP 3 vs ATP 4
:326.
The Knowledge, Attitude and Practices (KAP)
survey for the impact assessment was in effect a repeat of the IML KAP survey carried out in 2008
that provided the sole reference on social
dimensions of impact among CBHHs collected during CLP-1. Sample size: 105 in 2008 – 82 were
rei-interviewed for the impact assessment.
Quasi experimental: propensity score matching was used to match
ATP 4 sample (control group)
with treated cohorts – ATP 1, 2 and 3.
Comparison group:
younger cohorts -
ATP 4.
Income: per capita monthly income; Poverty: % above poverty line
Assets: asset value total, productive and non-
productive.
Profitability and sustainability of enterprises:
poultry, homestead gardening, milk
production Credit: loans
Risk management: use of plinths
Food security: food availability Water and sanitation: use of tubewells and
latrines
Women: attitude towards family planning Women’s empowerment: interaction with
other community members; decision power
on family planning, health, expenditures,
loans, land rights, early marriage, dowry
price.
Children: birth registration Access to services
Smith et al.
(2013) Bangladesh
SHOUHARDO
I
Baseline survey (N=3 200 in February 2006
applied to households with children 6–24 months
old, the target group for MCHN interventions. Two
endline surveys were conducted. The first (N=3
200), conducted in August 2009, was administered
Quasi-experimental: difference-
in-differences and propensity
score matching
National data and regional data
(neighboring
region/areas)
Nutrition: prevalence of stunting for children
under 5.

130
to households with children 48–59 months old in
the same villages as the baseline to help investigate whether the project had long-term nutritional
benefits. The surveyed children used in the analysis
would have been 6–18 months at the time of the baseline survey as those between 18 and 24 would
be older than 59 months in the first endline survey.
Only nutritional data were collected. The second
endline survey (N=3 356) was conducted in
November 2009 from a newly-drawn random
sample of project households with children 6–24 months old. In addition to nutritional data, data
were collected on a large number of household characteristics and outcomes as well as on the
interventions. All surveys were conducted using a
two-stage, stratified random sampling design, where the four project areas were the strata and
villages the primary sampling units.
Banerjee et al.
(2015)
Ethiopia
CGAP/Ford
Foundation
Graduation into Sustainable
Livelihoods
project (evaluated by
IPA)
Sample size: 925. Treated group: 458hh – 100
percent take-up rate. No spillover design or multiple treatment arm. Surveys: baseline (6
months before asset transfers), midline, endline 1
(21 months after asset transfer) and endline 2 (13 months after endline 1)
Experimental: randomization at household level and difference-
in-differences.
Intent-to-treat effects (ITT).
Similar households in
same tabia.
Consumption: per capita consumption; per
capita food consumption; per capita non-food
consumption; per capita durable good
consumption Food security: food security index; household
gets enough food; no adults skipped a meal;
no adult went a whole day without food; no children skipped a meal; everyone gets two
meals every day.
Assets: total asset index; total asset value; productive asset index; productive asset
value; household asset index; household asset
value
Finance: total amount borrowed; amount
borrowed formal; amount borrowed informal;
total savings; amount deposited in savings Time use: total time spent working; time
spent working in agriculture; time spent
working in livestock; time spent working in microenterprise; time spent working in paid
labour. Income and revenues: livestock revenue;
agricultural income; microenterprise income;
paid labour income; perception of economic status.

131
Physical health: physical health index; has not
missed work due to illness; activities of daily living score; perception of health status
Mental health: mental health index;
perception of status in life; lack of stress index; has not experienced worry
Political involvement: political index; voted
in last election; member of political party;
attended community meeting; met with local
leader
Women’s decision making: women’s decision making index; major say in food
expenditures; major say in education expenditures; major say in health
expenditures; major say in home
improvements expenditures; major say in business management
Banerjee et al.
(2015) Pakistan
CGAP/Ford
Foundation
Graduation into
Sustainable
Livelihoods
project (evaluated by
IPA)
Sample size: 1 299 (660 treated – 100 percent take-
up rate). No spillover design or multiple treatment
arm. Surveys: baseline (11 months before asset transfers), midline, endline1 (25 months after asset
transfer), and endline 2 (7 months after endline 1)
Experimental: randomization at
household level and difference-
in-differences.
Intent-to-treat effects (ITT).
Similar households in
same village Same as above
Banerjee et al. (2015)
India
CGAP/Ford Foundation
Graduation into
Sustainable Livelihoods
project
(evaluated by
IPA)
Sample size: 978 (treated 512 – take-up rate: 52
percent - just 266 actually accepted treatment). No
spillover design or multiple treatment arm. Surveys: baseline (0 months before asset transfers),
midline, endline1 (23 months after asset transfer),
and endline 2 (15 months after endline 1)
Experimental: randomization at
household level and difference-in-differences.
Intent-to-treat effects (ITT).
Similar household in same village
Same as above
Banerjee et al.
(2015) Honduras
CGAP/Ford
Foundation
Graduation into Sustainable
Livelihoods
project (evaluated by
IPA)
Sample size: 2 403 (800 treated – 100 percent take-
up rate). Spillover design and no multiple treatment
arm. Surveys: baseline (15 months before asset transfers), midline, endline1 (25 months after asset
transfer), and endline 2 (13 months after endline 1)
Experimental: randomization at
village followed by
randomization at household level and difference-in-differences.
Intent-to-treat effects (ITT).
Similar households in treated villages and
similar households in
untreated villages (randomized out) –
allowing spillover assessment.
Same as above
Banerjee et al.
(2015) Peru
CGAP/Ford Foundation
Graduation into
Sustainable
Sample size: 2 284 (785 treated – 100 percent take-
up rate). Spillover design and no multiple treatment arm. Surveys: baseline (7 months before asset
Experimental: randomization at village followed by
randomization at household level
and difference-in-differences.
Similar households in treated villages and
similar households in
untreated villages
Same as above

132
Livelihoods
project (evaluated by
IPA)
transfers), midline, endline1 (29 months after asset
transfer), and endline 2 (12 months after endline 1)
Intent-to-treat effects (ITT). (randomized out) –
allowing spillover assessment.
Banerjee et al.
(2015) Ghana
CGAP/Ford Foundation
Graduation into
Sustainable
Livelihoods
project
(evaluated by IPA))
Sample size: 2 606 (666 treated – 100 percent take-up rate). Spillover design and multiple treatment
arm: savings, no savings, matched savings
(incentivised), unmatched savings (non-
incentivised), Asset only.
Surveys: baseline (10 months before asset
transfers), midline, endline1 (18 months after asset transfer), and endline 2 (12 months after endline 1)
Experimental: randomization at village level followed by
randomization at household level
and difference-in-differences. Intent-to-treat effects (ITT).
Similar households in
treated villages and similar households in
untreated villages
(randomized out) – allowing spillover
assessment.
Same as above
Bauchet, Morduch
and Ravi (2015) India
SKS plus UPP
(CGAP/Ford Foundation)
Sample size: 3 484 individuals, living in 1 063 households across 198 villages in Medak District,
in three waves of surveys between 2007 and 2010.
Baseline: August to October, 2007. After baseline 102 villages were randomly assigned to treatment
and 95 to control group. Out of the 575 household
assigned to the treatment group, 70 percent (404 households) participated. The other 30 percent (171
households) is counted as part of the treatment
group in the analysis (yielding intent-to-treat estimates). The most common reasons for not
participating in the program were lack of interest in
taking asset (52 percent), migration (33 percent) and having access to microfinance loans (11
percent).
Midline survey: April/September 2009. Endline survey: October/November 2010: 1 011
households. Attrition: 5 percent. But being assigned
to the treatment group does not significantly predict long-term attrition.
Baseline data seems to have errors: consumption too large and implausible compared with income
data and other sources. Low take-up and high drop-
out rate – 70 percent take-up rate and only 43 percent of beneficiaries still kept the asset at
endline – animals were sold to pay debts.
Experimental: randomization at village difference-in-differences.
Intent-to-treat effects (ITT).
As some hh level variable did not balance at baseline they are
included in the regression
analysis.
Treated group:
similar household in control villages.
Asset accumulation: % own house; # acres of
land; non-agriculture asset index; agriculture asset index; % hh own livestock; % hh own
poultry; % hh own plow.
Income: monthly per capita income: total; agriculture self-employment; agricultural
labour; non-agricultural labour; salaried
employment; livestock; other sources.
Time use: productive time – agricultural
labour; tending animals; tending animals if
owns animals; leisure time; time doing chores;
Expenditures: monthly per capita expenditure:
total, food, non-food (energy, tobacco/alcohol, medical, education, others)
Food security: adults cut the size of meals or
skip them; adults did not eat for a whole day; children under 16 cut the size of meals or
skipped them; all households have enough
food every day, all year; everyone in the
household eats at least two meals per day.
Savings: % outstanding loans; # of loans
outstanding; value of loans outstanding; % household saves; total savings balance;
sources of loan
Health: whether physical health improved in the last year; the number of days that
household members were unable to work due
to illness; whether any member went to the doctor or hospital in the last year.
Access to safety nets: work from Employment
Guarantee Schemes, pension, government
housing, government assets, government

133
training, subsidized loans; goods from PDS
cards; % has Below the Poverty Line card.
Blattman et al. (2014)
Uganda
No
income/consum
ption support
Community meetings were held to describe the
programme, during which 20 of the most
marginalized villagers were listed, 75 percent of
them were women ages 14 to 30. From February to
April 2009, AVSI staff interviewed each nominee
and selected 10 to 17 clients per village, excluding relatives of leaders and the least poor. After a
baseline survey of all 1 800 candidates between
April and June 2009, village names were drawn from a basket without replacement until all were
assigned to either immediate treatment of training,
cash and follow-up (Phase 1) – 896 people – or the waitlist (Phase 2) – 904 people, that would receive
the programme in roughly 20 months. In addition,
30 of the 60 Phase 1 villages were randomized to
receive group dynamics training (self-help groups).
In the first follow-up survey: 861 from Phase 1
were interviewed and 870 from Phase 2 (October 2010 – February 2011). To distinguish the effects
of supervision and accountability from advice, the
900 Phase 2 clients all received training and cash (in a single tranche) but were randomly assigned to
a) no return to visit them in future – 318 people; b)
follow up once or twice to confirm implementation of the business plan but not provide substantive
advice – 300 people (Final follow up: 868 out of
904 of Phase 2 were reinterviewed in 06-08/2012);
or c) follow up to five times – 286 people – to
provide accountability but also substantive advice
on business management and household bargaining. The objective was to evaluate the
marginal impact of the highest cost component
(coaching).
Experimental: randomizing
villages to select the group for
immediate versus delayed treatment 20 months later. Partial
factorial design to evaluate the
marginal effects of several programme components. Among
the immediately treated villages,
a group was randomized to receive group dynamics training.
In the second phase, when the
delayed treatment group received the programme, people were
randomized into an unsupervised
grant, one to two supervisory visits (to provide accountability
to invest), or multiple visits for
both supervision and substantive business advice. None of the
other components could not be
randomized, thus the evaluation could not separate the effects of
cash from basic training and
framing. ITT estimates.
Control group phase
1: randomized out villages. Phase 2 –
randomized into
different types of ‘treatment’
Results were reported separately for women
and men.
Occupation: report positive hours in petty
trading; any non-farm self-employment; started enterprise since baseline; average
employment hours per week (agricultural and
non-agricultural); average hours of chores per
week; no employment hours in past month
Income: index of income measures (z-score);
monthly cash earnings (in UGX); Durable asset (z-score); non-durable consumption (z-
score); total earnings from last harvest.
Savings: member of a savings group; savings (in UGX)
Credit: perceived access to credit (z-score)
Access to services: access to business advice (z-score)
Self-reported autonomy and empowerment:
divorced since baseline; autonomy/influence
on purchases (z-score); can decide how to use
pocket money; can use earnings to buy
clothes without asking permission; have a say in purchase of a large asset; experienced any
physical or emotional abuse in the past eight
months (z-core); threatened harm; humiliated in front of others; beaten; kicked or hit;
cannot refuse sex; marital control (z-score),
partner tries to limit contact outside the home; requires permission to transact in the market;
partner has refused money for household
needs; have to give earnings to partners;
partner takes money against your will;
partners accuses of you of being unfaithful;
relationship quality (z-score); self-rating of relationship health; feel partner treats you
well; feel free to express your opinion.
Expenditures: total weekly expenditures (UGX); proportion of total expenditures on
health and education spent on woman and girls; proportion of children in school
(biological and non-biological)
Social engagement: quality of family relationships; social support received;
community participation; community
leadership activities.

134
Grant use and group activity: effect of
programme and group dynamics.
Prennushi and
Gupta (2014) India
Indira Kranti Patham
(heterogeneous
effect measured for
NREGA
beneficiaries)
Analysis based on a panel data for 4 250 households (balanced sample - there was a 6
percent attrition rate) from two rounds of a survey
conducted in 2004 and 2008 in five districts. In each village, ten households were randomly
selected from a list stratified by poverty category –
poorest, poor, not-so-poor, and not poor – as determined through a survey- and community-
based ‘participatory identification of the poor’
exercise conducted in 2001.
Quasi-experimental: propensity
score matching was used to construct control groups.
Difference-in-differences used to
estimate the impact on outcomes. Three treated groups: early
joiners (2004), mid-joiners (2004-
2006), late joiners (2007-2008). One comparison group: never
joined. Matching was done
separately for each category of poor.
Control groups –
identified from the survey using PSM.
Savings: total savings (in Rs);
Credit: total loans (male and female) in Rs. Assets: land owned (acres); value of land
owned (Rs); land cultivated (acres); value of
land cultivated (acres), # livestock; value of
livestock (Rs); Farm assets (Rs); non-farm
assets (Rs); durable goods (Rs);
Expenditure: monthly per capita expenditure (total, food, non-food, health, education).
Education: share of school-age children that
have ever attended school; share of school-age girls that have ever attended school; share
of school-age children currently attending
school. Access to government programmes: National
Rural Employment Guarantee Schemes -
NREGS; Midday meal; hostels; housing;
ICDS (integrated child development services)
Health: assisted delivery; immunization cards,
breastfeeding; knowledge of diarrhoea treatments; modern treatment methods; family
planning visit.
Empowerment: % set money aside for personal use; % not afraid to disagree with
their husbands; % can go out alone without
permission; % participate in village meetings always or frequently;
IRC (2012) Vietnam P135-II
The Committee for Ethnic Minorities (CEM)
conducted a baseline survey in 2007 (BLS 2007)
and an endline survey in 2012 (ELS 2012).
From the list of 1 632 communes in P135‐II provided by CEM, 266 treatment communes were
randomly drawn.
The large sample size (6,000 households in 400 communes in 42 provinces).
Treated communes: 266
Control communes: 134 Baseline: 2007
Follow-up: 2012
Household sampling: 15 hh from each selected village (commune)
Quasi-experimental: fixed effects
estimation was implemented via
the xtreg command in STATA; estimation accounted for the
complex sample design
(stratification, clustering and weighting). Results were reported
separately for ethnic and non-
ethnic minorities.
Control communes
were selected using
propensity score matching at the
commune level: 134
communes that did not take part in P135-
II and were most
similar to the treated ones were selected to
take part in the
survey. There were no differences at
baseline between the
two groups
Assets: asset index, durables index, house
quality index.
Productive impacts: rice productivity (Kg/m2 and VND/m2) – physical and value; corn
productivity (Kg/m2 and VND/m2) – physical
and value; industrial crop productivity (Kg/m2 and VND/m2) – physical and value;
share of land devoted to industrial crops
Income: total per capita income; total income, income from wages and salaries; income from
agriculture; income from business
Education: primary enrollment; lower secondary enrollment; upper secondary
enrollment
Health: travel time to health facility

135
Gilligan, Hoddinott and
Tafesse (2009)
Ethiopia PSNP plus OFSP
Quantitative household and community survey
fielded between late June and early August 2006 in the four principal regions served by the PSNP. In
these regions, a sample of food-insecure woredas
were selected with probability proportional to size (PPS) based on the estimated chronically food-
insecure population (beneficiaries). In total, 68 out
of 190 woredas were selected. Enumeration areas
(EAs) where the PSNP was active were identified
in the woredas. About 25 hhs were randomly
selected from each EA. Using separate lists of PSNP beneficiary and non-beneficiary households,
15 PSNP beneficiary households and 10 non-beneficiary households were selected using simple
random sampling. This yielded a sample of 900
households each in Amhara and Tigray and 950 households each in Oromiya and SNNPR, giving a
sample size of 3 700.
Limitation: there was no baseline survey, just a follow-up survey. Used retrospective questions to
reconstruct baseline data. Period of reference for
retrospective questions was two years prior to the survey (that is, six months before the PSNP began),
making it possible to recreate pre-baseline
conditions for beneficiary and non-beneficiary households.
Quasi-experimental – use of propensity score matching (and
applying common support) and
when possible coupled with difference-in-differences
estimates. Estimates for different
treated groups: a) household received any payment for
undertaking work on PSNP-
supported public works; b) household received at least 90
birr per person, or food equivalent in value to 90 birr, for
undertaking work on PSNP-
supported public works; c) household received any payment
for undertaking work on PSNP-
supported public works and
during this period, it received
access to any component of the
OFSP.
Control observations from the woredas
where the programme
was implemented. Comparison
household were non-
PSNP participants or, while listed as a
PSNP participant, did not receive any
payments for public
works activities and did not have access to
any component of the
OFSP
Food security: caloric acquisition was less
than 1 800 kcal/day/capita in last 7 days; daily
per capita caloric acquisition in last 7 days, Change in months of food security, 2004-
2006; change in the square of the food gap,
2004–2006; Number of children’s meals/day; hungry season,
Consumption: per capita total expenditure
Credit: any credit use; problem repaying any loan
Improved agriculture technology: use of
fertilizer; use of improved seeds Occupation: any non-farm own business
activity in past 12 months; entry into non-farm own business in past two years; any
wage employment by males in past 12
months; any wage employment by females in past 12 months, Entry by males into wage
employment in past 2 years, Entry by females
into wage employment in past 2 years.
Assets: Change in log value of livestock and
tools, 2004–2006
Transfers and remittances: Any positive net transfers received from others, Value of net
transfers received from others
Hoddinott et al.
(2012) Ethiopia
PSNP plus
HASP
Detailed household panel survey data were collected in 2006 (see Gilligan, Hoddinott and
Tafesse (2009) above, 2008 and 2010. These data
include PSNP beneficiaries, OFSP/HABP beneficiaries as well as some households that did
not receive any related transfers or services.
A balanced sample of 3 140 households appeared in all rounds, yielding an attrition rate of 14.8
percent over 5 years, or just under 3 percent per
year. The effective sample of households for analysis
was all those households for which there is complete data on baseline household characteristics
to be used in the dose–response models: 3 038
households
Quasi-experimental: generalized
propensity score (dose-reponse
models of Hirano and Imbens, 2004). Objective: to measure the
relative impact of PSNP transfers
alone and joint transfers from the
PSNP and OFSP/HABP on
agricultural output, yields,
fertilizer use and agricultural investment for farmers growing
cereals in Ethiopia from 2006 to
2010. Dose is the number of years a household received PSNP
payments and the response is the impact of each level of transfers
on the outcomes of interest.
Comparison between different cells: the
two PSNP dose–
response models (low
1 year of PSNP and
high 5 years of
PSNP) estimated on the OFSP/HABP
non-beneficiary
sample and the OFSP/HABP
beneficiary sample
Agricultural production and productivity:
change in production (kg); change in area
(ha), change in productivity (kg/ha).
Fertiliser use and investment: probability of
fertiliser use, probability of investing in water harvesting, probability of investing in fencing,
probability of investing in stone terracing.
Nega et al. (2010) Ethiopia
Food for
work/PSNP
plus credit
Panel survey: 2004, 2005 and 2006 applied in four
tabias in northern Ethiopia using a two-stage
sampling design. The PSU were tabias. Sampled
tabias were selected on the basis of secondary
Non-experimental:
propensity score matching (tertile
regression)
Non-beneficiaries of
FSP and non-
beneficiaries of FFW
programme.
Poverty: total, chronic and transient
(the focus of the paper was on poverty
transition)

136
information collected from all woredas. In selecting
the sample tabias, factors that affected socioeconomic conditions, such as distance to
market, geographical location, the availability of
both rain-fed agriculture and irrigation and size of tabia based on population, were considered. A total
of four tabias, namely Ruba Feleg, Tsenkaniet,
Arato and Siye, were selected for the survey. The
selected tabias were representative of the three
agroecological zones of the Tigray region identified
on the basis of altitude. The survey questionnaire was administered to 100 households randomly
selected from each tabia. A total of 400 households were selected for the survey. Only nine households
were lost in the second round and six more
households in the third round. The attrition rate over the three years was nearly 4 percent.
Beneficiaries of FFW
and FSP were matched separately.
Macours, Premand and
Vakis (2012)
Nicaragua RPS plus Atención a
Crisis
All communities in the six municipalities of the
pilot programme were grouped in blocks based on
microclimates, crop mix, similarity in road access
and infrastructure. Through a lottery, 44 blocks
were selected and half of the communities in each
block were randomly assigned to treatment and the other half to control.
Baseline data were then collected in the 56
treatment and 50 control communities. These data were used to define households’
eligibility for the programme based on a proxy
means test. Around ten percent of the households in treatment
and control communities were ineligible for the
programme because their estimated baseline
expenditures, as determined by the proxy means,
were above the pre-defined threshold.
This process resulted in the identification of 3 002 households to participate in the programme. In a
next step, 3.7 percent of the households that had
originally been deemed eligible by the proxy means were reclassified as ineligible after a process of
consultation with community leaders, and a corresponding 3.7 percent that had originally been
deemed ineligible were reclassified as eligible.
Baseline data for the evaluation were collected in April-May 2005. The sample included the 3 002
eligible households in the treatment communities,
Experimental: intent-to-treat household-level regressions
(difference-in-differences).
Similar households
selected from
randomized-out
communities.
Consumption and income: per capita total
consumption; per capita total income; per
capita food consumption; per capita non-food consumption; non-agricultural wage income;
profit of non-agriculture business; expected
increase in profits in 12 months. Assets: value livestock sold or self-consumed;
value business assets.
Occupation: non-agricultural wage employment; non-agricultural wage self-
employment (elaboration, manufacturing,
trade and services).

137
and a random sample of 1 019 eligible households
in the control communities. A follow-up survey was conducted between
August 2008 and May 2009 (henceforth referred to
as 2008). Low attrition: 2.4 percent.
Del Pozo (2014) Peru Juntos plus
rural credit
Agricultural census: 1994 and 2012. It was possible
to identify whether the district was covered by
Juntos and if the household: a) never applied for
credit; b) applied and did not get it; c) applied and
got it.
Propensity score matching was used to match treated and non-treated districts using the 1994
agricultural census.
Sample size: 377 236 (108 971 control households – no beneficiaries in non-Juntos districts and 268
265 – beneficiaries in Juntos districts.
Non-experimental: PSM used to build pseudo panel and then
difference-in-differences
(controlling for fixed effects).
Similar districts and
similar households identified using PSM.
Robustness check
using instrumental variables.
Productive assets: cultivated land (ha and %);
irrigated cultivated land (ha and %); # cows, #
calves # sheep/goats, #guinea pigs and rabbits, # poultry, % poultry shelter; % use of
plough; % barn.
Garcia, Helfand
and Souza
(2016)
Brazil
Bolsa Familia
(CCT) plus
PRONAF
Agricultural census (1995-6 and 2006). Unit of observation: municipality. Treatment variable:
coverage of Bolsa Familia (CCT) and PRONAF
(subsidized rural credit for family farmers) for
farmers with less than 500 ha.
Baseline: 1995-6
Follow-up: 2006. Out of 4 270 comparable units of observation, 4
251 had enough observations and were included in
the analysis PRONAF Coverage: baseline: 0, follow-up: 12.3
percent.
Bolsa Familia Coverage: baseline: 0; follow-up: 14 percent.
Joint coverage (intersection): baseline: 0; follow-
up: 2.4 percent.
Non-experimental: difference-in-
differences with fixed effects. Weighed regressions
(weight=average number of
farmers in a municipality) and standard errors are clustered at
municipality level
Comparison group:
no pure control group – impact identified by
the different speeds
of expansion of Bolsa Familia and
PRONAF.
Land productivity: real value of the agricultural production per ha.
Income: income per family worker
Child labour: # of under 14 years old who work in the farm.
Aldana, Vásquez
and Yancari (2016)
Peru Juntos plus Sierra Sur
Survey date: end of 2013 and beginning of 2014.
Treatment from the district of Chumbilvicas -
poorest of the districts in the Sierra Sur. Sample was informally stratified with high, median and low
income.
Treated group: Juntos beneficiaries that took part in Sierra Sur
Comparison group: Juntos beneficiaries from a district where Sierra Sur was not implemented –
categorized into different groups: a) willing to
participate in Sierra Sur; b) median or high
propensity to pay for Sierra Sur-type of projects; c)
Non-experimental: single
difference with propensity score matching
Comparison groups
were found using
matching. However, it was slightly better-
off than the treated
group; in particular, it had better access to
roads and the climatic conditions were also
better than in the
treated region in the
period just before the
Adoption of new productive practices:
vaccine, medicines, vegetable granders, barns,
soil conservation, water harvest, etc. Social capital: # membership to organization;
# participation in activities implemented by
organization. Assets: value of total assets; value of land;
value of livestock; value of business; value of agricultural assets.
Income: gross income, net income, working
capital.

138
high propensity to pay for Sierra Sur projects.
Notice that b) and c) are subsets of a). Sample size: treated: 382; control: a) 402, b) 221,
c) 125.
Sample size after matching: treated: 320; control: a) 374; b) 209; c) 117.
survey. The
comparison groups had to be selected
using questions to
assess the demand for the type of
programme the
treated group had
access to as well as
their willingness to
pay for some of it. Three comparison
groups were built based on these
responses.
Escobal et Ponce (2016a, 2016b)
Peru Haku Wiñay + Juntos
Escobal and Ponce (2016a) used a sample of
428 households (207 treated and 221 control)
issued from 36 villages (centros poblados)
from the department of Cajamarca, Huánuco
and Huancavelica in their analysis. The
original sample used at the baseline survey
was of 447 households (219 treated and 228
control) which gives an attrition rate of 4.3
percent. The randomization intro treated and
control groups took place at the village level
(18 pairs) using pairwise randomization in
which the pairs were matched according to
their similarity taking into account their
socioeconomic features. Due to the small
sample size, the randomization was not very
successful and propensity score weights were
calculated to balance the sample of treated
and control households. Although this
evaluation only looked at the impacts of Haku
Wiñay, more than 80 percent of the sample
were also beneficiary of the Juntos CCT
programme. The sample of potential
beneficiaries of Haku Wiñay had a take up
rate of 86 percent
Experimental: difference-in-
differences with sample adjusted
by propensity score matching
Households in
randomized out
villages
Income: Total family income; income from
agriculture; income from livestock; income from processed crops or animal products; new
business (handicraft, commerce services),
wage labour: agricultural and non-
agricultural; Juntos transfers, other sources of
income.
Expenditure: food expenditure; Perceptions: improved income (household
and village levels); ability to increase income,
make more effort, resist to climatic shocks, resist to non-climatic shocks; double income;
to do business and negotiate; knowledge of its
own business. Assets: # guinea pigs, # hens
Production: new vegetables,
Health and nutrition: use of wood for
cooking; improved kitchen; water treatment;
hygiene practices; subjective perception of
improvements in health and nutrition; incidence of respiratory problems, incidence
of diarrhoea.
Production: new crops (specially fruit and vegetables); revenue; eggs; natural and
cultivated pasture Food security/intake: consumption of
different food groups: animal protein, fruits
and vegetables, cereals; diet diversity. Financial literacy: knowledge of financial
issues; confidence in the financial system.

139
Naude et al.
(2016) Mexico
Prospera/Oportunidades plus
PROCAMPO
Data from ENHRUM 2002 and 2007. Pooled data
to increase statistic power. Panel data (attrition rate 13 percent). Coverage of communes with 500 to 2
499 inhabitants.
Sample size: 3 290 (merged 2002 and 2007 samples).
http://das-ac.mx/comunidad-enhrum/enhrum-ii-
2007/
Non-experimental: PSM
(generalized propensity score due to multiple treatment and
overlapping of treatment) - AIPW
using Stata 13 and SAM (Social Accounting Matrix) for
simulations (elimination of the
programmes as counterfactual).
Four groups: non-beneficiary
(47.4 percent); Oportunidades
beneficiaries only (29 percent); PROCAMPO beneficiaries only
(12.9 percent); beneficiary of both programmes (10.8 percent).
Estimation undertaken using
pooled 2002 and 2007 sample and fixed effects.
Caveat: it would be better to have
a proxy of time of exposition to the programme (dosage model).
Comparison group –
matched through
propensity scores. For the SAM –
counterfactual is the
elimination of each programme.
Vulnerability: vulnerability index
Poverty: food poverty; capability poverty;
asset poverty. Education: hh average years of schooling
De Sanfeliú et al.
(2016) El Salvador
CCT – Comunidades
Solidaria
Rurales – plus
productive
programmes
and rural development
interventions
Out of 100 municipalities in which the CCT
programme CSR was implemented, 77 have some
rural development project (18 CSR plus support to value chains (EP); 28 CSR plus food and
nutritional security (SAN); and 31 CSR plus EP
plus SAN) and 23 CSR only. Most beneficiaries of SAN projects (87 percent) were also in CSR
municipalities, whereas only 37 percent EP
beneficiaries were from CSR municipalities.
Sampling frame: FISDL baseline census in the 100
CSR municipalities (between 2005-2009 depending
on the year the programme started being
implemented in the municipality) updated in 2014
(listing): 211 166 hh. Around: 69 698 were still receiving CSR transfers;
35 422 had exited the programme and 106 046
never received participated (updated). List of SAN and EP project participants between
2010-2013: 48 307 were from the 100 municipalities.
Merging the three sources of information, it was
possible to identify: 14184 hh that participated in the SAN and EP projects and were also in the
FISDL census.
Quasi-experimental: Simple
cross-section difference between
treated and control using PSM and RD (age of the child/CSR
eligibility). Four comparisons of
interest: a) A (CSR + DR) versus C (DR) - extra effect of CSR; b)
AC (ExCSR+DR) Versus C (DR)
- isolate the monetary effect of CSR comparing to 1); c) A
(CSR+DR) versus AC
(ExCSR+DR) - isolate of monetary effect of CSR; d) AC
(ExCSR+DR) versus BD
(ExCSR) - effect of DR after receiving CSR. EP is only
evaluated in a). due to lack of sample (see survey data
discussion). Parameter: ITT
(using the administrative data instead of self-reported
information).
Several comparison
groups are used to assess the impact of
receiving both type of
programmes, CCT plus different
modalities of Rural
Development (DR)
interventions.
Comparison is always
between just one programme versus
two programmes.
There is no evaluation of having
a single programme.
Production: new animals or new crops were introduced? (%); productivity
(USD/manzana)
Income: agricultural income (USD); yearly total income (USD).
Asset: asset index
Food security: lack of dietary diversity (%); savings or asset depletion to buy food (%)
Financial inclusion: bank accounts (%);
formal credit (%); Social participation: % participate in
producers’ association; % participate in
community associations Empowerment: general empowerment;
productive empowerment (separately for men and women)

140
Out of 211 116 hh from the FIDSL census, 137 034
complied with the conditions to be part of the treated and comparison groups: a) a single family
group; b) hh with a child 2 years above or below
the eligibility age for the CSR and attending primary school; c) hh that benefited from SAN
(2012) and/or EP (2011 and 2012); d) inactive CSR
beneficiaries that left the programme in 2012, e) hh
in municipalities where EP and SAM projects were
developed. Hh that participated in RD (SAN and
EP) projects were classified into A, AC and C and those who did not participate were classified into
B, BD, D - depending on whether they were active CSR, inactive CSR or never beneficiaries of CSR.
Those who did not benefit from RD projects
(separately for SAN and EP) were matched to those who participated in each group of CSR status -
excluding those outside the common support. It
was only possible to find matches for EP for groups A and C; for SAR it was not possible to find
matches for groups B and D. The sampling frame
ended up with 6 176 hh. Random sampling led to a sample size of 1 301 hh spread over the six groups:
EP (A: CSR+EP, 239; C: EP, 152); SAN (A:
CSR+SAN, 241; C: SAN, 213; AC: ex CSR+SAN, 230; BD: ExCSR, 226).
Fernandez et al.
(2016) Chile
Ingreso Etico
Familiar (CCT) plus
productive
support
Panel survey 2012-2014: beneficiaries and non-
beneficiaries of the Ingreso Etico Familiar (IEF).
About 20 percent of the sample are IEF
beneficiaries. Questions about participation in
FOSIS productive support programmes were also asked. Overlapping between two programmes:
2012 – 3 percent and 2014 - 4.7 percent.
Sample size: 2 308 households (balanced sample)
Quasi-experimental: Fixed effect
model combined with propensity
score matching. Logit for each
programme effect and multinomial to measure the
synergies.
Comparison group:
non-beneficiaries and
beneficiaries of only one programme.
Outcomes of interest:
For IEF (only):
Human capital: participation in training courses; participation in adult education
courses; school attendance 7-18 years; school
attendance for 6 year olds
For FOSIS productive support only:
Income and occupation:
per capita autonomous income (net of benefit); total women's work force
participation; participation in training courses;
Human capital: participation in adult education courses; school attendance at 6
years. For synergies:
the outcomes of both groups
Moya (2016) Colombia
CCT (Familias
en Acción) plus
Oportunidades
Rurales (OR)
Sample size: 729 beneficiary households of
Oportunidades Rurales (OR) from 59 treated
farmers’ organizations (FOs) (between 2008 and
2013).
Quasi-experimental: Due to lack
of a clear comparison group for
OR. Time of exposure to the
programme was used.
There was no
information on the
FOs that applied but
were not selected –
OR impacts:
Production: amount invested; land cultivated
(% over total land area); production increased
over 2008 (0/1)

141
Initially 68 FOs were selected using a stratified
sample by entry year, activity and region and CREAR score (an index that assesses the quality of
the organization). Afterwards, random sampling
was adopted to select the individual households. Nine FOs were not interviewed during the field
work between January-June 2014. They had closed
down.
Households that entered the
programme in 2008, 2009 and 2012 were compared to
households that entered the
programme in 2013. As for the FA, the treated group was
comprised of those who were
already FA beneficiaries when
joined OR and those who became
FA beneficiaries after joining OR
(also time of exposition). The short-term impact was measured
comparing the 2012 (treated) and 2013 (control) groups and the
medium-term impact comparing
the 2008/2009 group (treated) and the 2013 group (control). 44
percent and 19 percent of the
treated group from 2008-9 were treated twice and three times,
respectively, while the 2012 and
2013 sample was treated only once.
ideal control group
according to the author. Thus, newer
cohorts of FOs
entering the programme were
used to assess the
impact of the
programme on older
cohorts.
Regression framework.
Occupation/employment: daily hours of work;
#daily labour; #family workers. Financial services: microinsurance (%);
access to formal financial services (%), access
to informal financial services (%) Assets: value of productive assets; value of
total assets; asset index
Consumption: food consumption; total
consumption
Food security: food security index.
Poverty: SISBEN score (proxy means test -PMT used to target social policies); subjective
well-being.
Synergies between OR and FA:
All the above plus: Impact on children (12-18 years):
school attendance; education
underachievement; hours of work; hours in school; hours of chores
Dewbre et al.
(2015) Lesotho
Child Grant
Programme
plus Linking
Food Security with Social
Protection.
The impact evaluation strategy made use of a
randomized control design for the impacts of the
CGP. CGP beneficiary households (treatment group) and eligible non-beneficiary households
(control group1) were interviewed in June/July
2001 (baseline) and June/July 2013 (follow-up survey). At the time of the latter, supplemental
information on homestead gardening was collected
to constitute a baseline for the LFSSP. The same
households were visited again in June/July 2014
and a similar survey was readministered. Important:
LFSSP was not randomized. The sample from Leribe district involved 307 households, which
were interviewed in 2013 and were again targeted
for data collection efforts in June 2014. In the district, 316 households were reached: 299 were
successfully interviewed in 2013 and 17 had been interviewed in 2011, but not in 2013. In the sample,
165 households and 934 individuals were enrolled
in the CGP. Since both CGP and non-CGP households received the LFSSP, the final sample
included 299 households and 1 571 individuals.
Double difference. Treated group: CGP+LFSSP and comparison
group: LFSSP. As there is no
‘CGP only’ after 3 years, the
strategy was to compare two
years of CGP only with three
years of CGP plus one year of LFSSP (cross-section estimate for
this aspect of the evaluation as
there was no baseline for gardening activities back in
2011).
The objective of this
evaluation was to
compare outcomes that were attainable
after two years of
CGP only, versus impacts that occurred
after an additional
year of CGP
assistance combined
with the LFSSP,
compared to those in the CGP control
group that only
received the LFSSP in the last year.
Analysis was disaggreated by
labour-constrained
and labour-unconstrained
households
Homestead gardening: hh harvest last year – spinach, Florida broad leaf, English rape,
onions, carrots, beetroots, cabbage, peppers,
peas, tomatoes, green beans, others; # of vegetables produced; hh harvests in spring; hh
harvests in winter; hh harvests in summer;
HH harvests in autumn; # of seasons harvested
Technology adoption: Household uses any:
drying, vegetable canning, fruit canning, keyhole, trench garden, rain water;
conservation: home produced; compost:
purchased fertilizer; home-produced pesticide; control: frost protection, kraal
manure; hh expanded garden; reasons for not expanding: lack of cash, lack of space, lack of
labour, lack of market, inputs not available,
not needed, other Land operation: hh had home garden plot; hh
cultivated/owned land; # non-homestead
plots; owned land (ha); operated land (ha).

142
Agricultural assets: hh used any: hoe, sprayer,
plough, plander, tractor, cultivator, scotch cart, yokes.
Crop inputs: input usage and purchase,
separately: seed, pesticides, organic fertilizer, inorganic fertilizer, livestock inputs, feed,
fodder, veterinary services
Livestock: hh owned livestock – sheep, goats,
chicken, pig, cattle (% and #).
Consumption from own production (last 7
days): cereal, meat, dairy goods, fats, vegetables, other foods.
Consumption from purchases (last 7 days): cereal, meat, dairy goods, fats, vegetables,
other foods
Labour allocation (male, females and children, separately):
past 12 months: any work; non-farm-
employment; own-crop, own-livestock; wage labour;
past 7 days: any non-farm-employment, own-
farm, wage labour Permanent, temporary, occasional
Pace et al. (2016) Malawi
Social Cash
Transfer Programme
(SCTP) plus
Farm Input Subsidy
Programme (FISP)
The study used data from the RCT to evaluate the impacts of the SCTP. Four traditional authorities
from the districts of Salima and Mangochi were
chosen randomly by a lottery. Then, eligible households were identified through a mix of proxy
means test and community-based targeting in all
Village Clusters (VCs) - VCs are village groups
with between 800 and 1 500 households each - that
were formed within these four Traditional
Authorities for the purpose of implementing the programme. The targeting was done by the six
members of the Community Social Support
Committee (CSSC) chosen from different geographical locations in the VCs under the
oversight of the District Commissioner’s Office and the District Social Welfare Office. A baseline
survey for eligible households was completed in
July/August 2013 covering 3 500 households in all four TAs. Just after the baseline survey, half of the
VCs were randomly assigned to a treatment group
and entered the programme immediately, while the
Difference-in-differences with propensity score matching (IPW).
Authors looked at heterogeneous
impacts (labour-constrained households versus labour-
unconstrained households).
The sample of 3 214
observations (both baseline and follow-
up) was divided into
four groups: a) control households
that neither received
the SCTP nor the FISP; b) households
treated exclusively
under the SCTP; c) households treated
exclusively under the FISP; and d)
households treated
under both programmes
simultaneously
(respectively, 38.33,
30.18, 14.87, and
Expenditures: per capita expenditure, per capita food expenditure, per capita health
expenditure, per capita education expenditure,
per capita clothing expenditure, per capita alcohol and tobacco expenditure, per capita
housing and utilities expenditure, per capita
furnishing expenditure, per capita transport
expenditure
Food security: worry about lack of food (%),
number of meals per day, per capita calories, per capita calories from purchased food, per
capita calories from home production.
Production: value of production (MKW), engaging in maize production (%) and
amount, groundnut production (%) and amount, pigeon pea production (%) and
amount, Nkhwani production (%) and
amount, rice production (%) and amount. Input use: improved and hybrid seeds (%) and
amount, organic fertilizers (%) and amount,
pesticides (%) and amount.

143
Source: authors’ own elaboration
other half served as a control group in order to
measure the impact of the programme and were supposed to enter the programme at the end of the
evaluation period. To assess the impact of FISP, the
sample was reduced from 6 708 hhs to 3 214hh as hh that benefit from FISP on the baseline were
dropped from the analysis.
16.6 percent of the
study sample).
Productive assets: agricultural assets – hoe,
axe, panga knfe, sickle (%) and amount. Livestock: chicken, goat and sheep, other
poultry (%) and amount of expenditure
Upton et al. (2012) – Results
also published in
Harou et al. (2013)
Burkina Faso
Local Education
Assistance
Procurement (LEAP)
The authors use three different cross-section
evaluation surveys with retrospective questions to
estimate the impact of local procurement for the school feeding programme (LEAP) on both food
recipient satisfaction and suppliers/farmers. For the
latter, the survey was restricted to cowpea producers focusing on personal and production characteristics.
For the food recipients the surveys covered head
school cook and then the school director. Thus, no survey look directly and school age children and/or
their households. Ex-post survey with retrospective
questions. Sample of 20 farmers from the list of all
farmers association members in each of the eight LEAP departments, yielding a sample of 160
farmers. Farmers association close to the MYAP
(control) schools yielded a random sample of 150 farmers.
Schools were stratified by department and 15 of
them were selected from each of the 8 departments,
a total of 120 schools, and then the same number of
schools from the MYAP four departments was
matched to them. Sampling weights were used in the analysis for both producer and school data.
Difference-in-differences (using
retrospective questions) with
random and fixed effects
Famers and schools
from neighboring
villages.
Farmers’outcomes:
Quality Knowledge: number of quality
criteria from the programme that were acknowledge by the farmers; conservation
practices
Asset investments: small investment; Traction investments
Production: sales prices. Profitability and
revenue Transaction costs: Travel time to markets (in
min) and Distance travelled (in km)
Recipients outcomes:
Commodity preference: taste, ration size,
texture, appearance, cleanliness, storability, nutrition, general satistaction.
Preparation requirements: time, effort, cost,
fuel use, water use and oil use.

Food and Agriculture Organization of the United Nations (FAO)
Viale delle Terme di Caracalla 00153 Rome, Italy FAO, together with its partners, is generating evidence on the impacts
of social protection on poverty reduction, food security, nutrition and resilience and is using this to provide related policy, programming and
capacity development support to governments and other actors.
Countries include Kyrgyzstan, Lebanon, Lesotho, Malawi, Rwanda, Senegal, Zambia, Zimbabwe.
For more information, please visit FAO’s social protection website: www.fao.org/social-protection


![MURDOCH RESEARCH REPOSITORY · 2015-09-03 · Cameroon, Lesotho, Madagascar, Nigeria, Rwanda, Senegal, South Africa, and Zimbabwe [17, 28, 35, 36]. The oil crisis in the 1970s, along](https://img.pdfslide.us/doc/110x75/5f4720d8cd9b71715624b505/murdoch-research-repository-2015-09-03-cameroon-lesotho-madagascar-nigeria.jpg)