Embed Size (px)
Citation preview
204 IEEE TRANSACTIONS ON SPEECH AND AUDIO PROCESSING, VOL. 11, NO. 3, MAY 2003
Combined Approach of Array Processing andIndependent Component Analysis for Blind
Separation of Acoustic SignalsFutoshi Asano, Member, IEEE, Shiro Ikeda, Member, IEEE, Michiaki Ogawa, Hideki Asoh, Member, IEEE, and
Nobuhiko Kitawaki, Member, IEEE
Abstract—In this paper, two array signal processing techniquesare combined with independent component analysis (ICA) toenhance the performance of blind separation of acoustic signalsin a reflective environment. The first technique is the subspacemethod which reduces the effect of room reflection when thesystem is used in a room. Room reflection is one of the biggestproblems in blind source separation (BSS) in acoustic environ-ments. The second technique is a method of solving permutation.For employing the subspace method, ICA must be used in thefrequency domain, and precise permutation is necessary for allfrequencies. In this method, a physical property of the mixingmatrix, i.e., the coherency in adjacent frequencies, is utilized tosolve the permutation. The experiments in a meeting room showedthat the subspace method improved the rate of automatic speechrecognition from 50% to 68% and that the method of solvingpermutation achieves performance that closely approaches that ofthe correct permutation, differing by only 4% in recognition rate.
Index Terms—Array signal processing, blind signal separation,independent component analysis, permutation, room reflection.
I. INTRODUCTION
I T IS indispensable to separate acoustic signals and to pick upsignals of interest for applications such as automatic speech
recognition (ASR) when they are used in a real environment.The framework of blind source separation (BSS) based on inde-pendent component analysis (ICA) is attractive since it can beused to separate multiple signals without any previous knowl-edge of the sound sources and sound environment such as theconfiguration of microphones (e.g., [1]) that is necessary in con-ventional microphone-array signal processing (e.g., [2]). How-ever, when applying BSS to an acoustical mixture problem suchas a number of people talking in a room, the performance of theBSS system is greatly reduced by the effect of the room reflec-tions/reverberations and ambient noise [3].
One method of reducing the effect of room reflections isto employ directional microphones in the BSS framework[4]. In this method, however, the system cannot track the
Manuscript received January 20, 2002; revised August 13, 2002. This workwas supported by the IEEE. The associate editor coordinating the review of thismanuscript and approving it for publication was Prof. Hsaio-Chuan Wang.
F. Asano and H. Asoh are with the National Institute of Advanced Indus-trial Science and Technology, Tsukuba, Japan (e-mail: [email protected];[email protected]).
S. Ikeda is with Kyushu Institute of Technology, Japan (e-mail:[email protected]).
M. Ogawa and N. Kitawaki are with Tsukuba University, Tsukuba, Japan(e-mail: [email protected]).
Digital Object Identifier 10.1109/TSA.2003.809191
movement of the sound sources. Another way to reduce theeffect of room reflections is to employ an acoustic beamformersuch as delay-and-sum (DS) beamformer (e.g., [5]). However,for designing the beamformer, an array response databaseconsisting of transfer functions from possible source locationsto microphones or, at least, the configuration of the micro-phone-array is required. This information is not available in theBSS framework.
The authors previously proposed an alternative approach, thesubspace method, for reducing the effect of room reflections andambient noise [6]. In this method, room reflections are separatedfrom direct components in the eigenvalue domain of the spatialcorrelation matrix based on the spatial extent of the acoustic sig-nals. Then, the eigenvectors corresponding to the eigenvalues ofthe direct components are used as a filter which selects the sub-space in which the direct components lie and discards the sub-space filled with the energy of reflections. As described in thispaper, the subspace method works as a self-organizing beam-former focusing on the target sources and does not require anyprevious knowledge of the array or sound field. Therefore, thesubspace method can be used in the framework of BSS. Thisis understood from the fact that the subspace method is a spe-cial case of principal component analysis (PCA) with ,where and denote the number of nodes (channels) of theinput and the output of PCA, respectively [7]. PCA is knownas a method of unsupervised learning which does not requireany previous knowledge. In this paper, a combined approach ofthe subspace method and ICA is proposed. In this method, thesubspace method is utilized as a pre-processor of ICA which re-duces room reflections in advance, the remaining direct soundsthen being separated by ICA.
For combining the subspace method with ICA, the fre-quency-domain ICA [8], [9] must be employed, since thesubspace method works in the frequency-domain. The biggestobstacle in the frequency-domain ICA is the permutation andscaling problem. In the frequency-domain ICA, the input signalis first transformed into the frequency domain by the Fouriertransform. By using this transformation, a convolutive mixtureproblem is reduced to a complex but instantaneous mixtureproblem. This instantaneous mixture problem is then solvedat each frequency independently. In usual instantaneous ICA,arbitrary permutation and scaling of the output is allowed.However, in the frequency-domain processing for a convolutivemixture such as that employed in this paper, different permu-tations at different frequencies lead to re-mixing of signals in
1063-6676/03$17.00 © 2003 IEEE

ASANO et al.: COMBINED APPROACH OF ARRAY PROCESSING AND INDEPENDENT COMPONENT ANALYSIS 205
the final output. Also, different scaling at different frequenciesleads to distortion of the frequency spectrum of the outputsignal.
For the scaling problem, the method proposed by [9], inwhich the separated output is filtered by the inverse of theseparation filter, shows good performance. On the other hand,for the permutation problem, a method using the correlationbetween the spectral envelope at different frequencies (denotedas Inter-frequency Spectral Envelope Correlation (IFSEC),hereafter in this paper. See Appendix I for a brief explanation.)has been proposed [9], but has been reported to sometimesfail when the input signals have similar envelopes [3]. In thispaper, a new approach for solving the permutation problem isproposed. This method utilizes thecoherencyof the mixingmatrices in several adjacent frequencies and is thus denoted asInter-Frequency Coherency (IFC) in this paper.
This paper is organized as follows: In Section II, the modelof the sound environment treated in this paper is described. InSection III, an outline of the proposed BSS system is presented.Moreover, some portions of the system which were proposed inthe previous studies but which are necessary for understandingthe following sections are briefly described. In Section IV, thesubspace method for reducing room reflections is detailed. InSection V, a new method for solving the permutation is pro-posed. In Section VI, results of experiments using real data toevaluate the proposed system are reported.
II. M ODEL OF SIGNAL
Let us consider the case when there aresound sources inthe environment. By observing this sound field with micro-phones and taking the short-term Fourier transform (STFT) ofthe microphone inputs, we obtain the input vector
(1)
Here, is STFT of the input signal in theth time frameat the th microphone. The symbol denotes the transpose. Inthis paper, the input signal is assumed to be modeled as
(2)
Matrix is termed the mixing matrix, its element,, being the transfer function from theth source to the
th microphone as
(3)
The symbol is the magnitude of the transfer func-tion. The symbol denotes the propagation time from the
th source to the th microphone. Vector consists ofthe source spectra as , where
denotes the spectrum of theth source. The first term,, expresses the directional components in .
On the other hand, the second term, , is a mixture ofless-directional components, which includes room reflectionsand ambient noise.
TABLE IOUTLINE OF THE ENTIRE BSS SYSTEM
Fig. 1. Proposed BSS filter network.
Fig. 2. Typical eigenvalue distribution.
Fig. 3. Relation of vectors.
III. BSS SYSTEM
A. Entire System
The flow of the proposed BSS system is summarized inTable I, which lists each stage of the system, the obtained filtermatrices at each stage and the corresponding section in thispaper. A block diagram of the system is depicted in Fig. 1.

206 IEEE TRANSACTIONS ON SPEECH AND AUDIO PROCESSING, VOL. 11, NO. 3, MAY 2003
Fig. 4. Rotation of the location vector. (a) Correct permutation and (b) incorrect permutation.
First, STFT of the multichannel input signal, , is ob-tained with an appropriate time shift and window function. OnceSTFT is obtained, the Fourier coefficients at each frequency aretreated as a complex time series. By doing this, the convolutivemixture problem is reduced to a complex but instantaneous mix-ture problem [9].
Next, the subspace method is applied to the input vectorto obtain the subspace filter . In this stage, room
reflections and ambient noise are reduced in advance of theapplication of ICA. It should be noted that the node of the filternetwork is reduced from to in this stage as depicted inFig. 1.
The instantaneous ICA is then applied to the output of thesubspace stage, to obtain the filter matrix . Forthe sake of convenience, the product of and
(4)
is termed the separation filter, hereafter.After obtaining this separation filter, the permutation and the
scaling problem must be solved. In this stage, the output of theseparation filter is processed with the permutation matrixand the scaling matrix .
Finally, the filter matrices obtained in the above stages aretransformed into the time domain, and the input signal is pro-cessed with this time-domain filter network.
B. ICA Algorithm
In this subsection, the ICA algorithm used in this paper isbriefly described. In this paper, the Infomax algorithm withfeed-forward architecture [10], [11] extended to complex data[8] is used. In this stage, the input signal (the output of thesubspace filter) is processed with the filter matrix
as
(5)
The learning rule is written as
(6)
where the score function for the complex data is definedas [12]
(7)
(8)
Fig. 5. Configuration of microphone array and sound sources.
TABLE IIPARAMETERS OFASR
TABLE IIIPARAMETERS OF THEBSS SYSTEM
The symbol is the th element of the vector . The ma-trix is an identity matrix. The symbol denotes the Hermi-tian transpose. The constantis termed the learning rate. The
ASANO et al.: COMBINED APPROACH OF ARRAY PROCESSING AND INDEPENDENT COMPONENT ANALYSIS 207
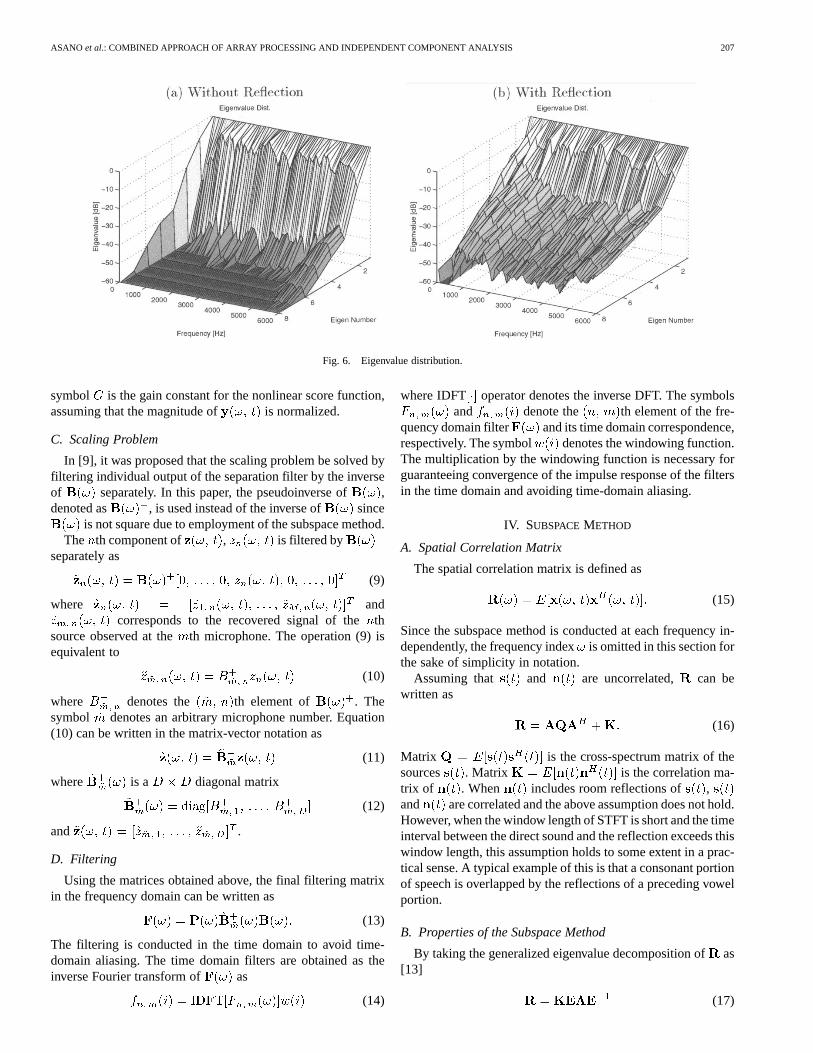
Fig. 6. Eigenvalue distribution.
symbol is the gain constant for the nonlinear score function,assuming that the magnitude of is normalized.
C. Scaling Problem
In [9], it was proposed that the scaling problem be solved byfiltering individual output of the separation filter by the inverseof separately. In this paper, the pseudoinverse of ,denoted as , is used instead of the inverse of since
is not square due to employment of the subspace method.The th component of , is filtered by
separately as
(9)
where andcorresponds to the recovered signal of theth
source observed at theth microphone. The operation (9) isequivalent to
(10)
where denotes the th element of . Thesymbol denotes an arbitrary microphone number. Equation(10) can be written in the matrix-vector notation as
(11)
where is a diagonal matrix
(12)
and .
D. Filtering
Using the matrices obtained above, the final filtering matrixin the frequency domain can be written as
(13)
The filtering is conducted in the time domain to avoid time-domain aliasing. The time domain filters are obtained as theinverse Fourier transform of as
(14)
where IDFT operator denotes the inverse DFT. The symbolsand denote the th element of the fre-
quency domain filter and its time domain correspondence,respectively. The symbol denotes the windowing function.The multiplication by the windowing function is necessary forguaranteeing convergence of the impulse response of the filtersin the time domain and avoiding time-domain aliasing.
IV. SUBSPACEMETHOD
A. Spatial Correlation Matrix
The spatial correlation matrix is defined as
(15)
Since the subspace method is conducted at each frequency in-dependently, the frequency indexis omitted in this section forthe sake of simplicity in notation.
Assuming that and are uncorrelated, can bewritten as
(16)
Matrix is the cross-spectrum matrix of thesources . Matrix is the correlation ma-trix of . When includes room reflections of ,and are correlated and the above assumption does not hold.However, when the window length of STFT is short and the timeinterval between the direct sound and the reflection exceeds thiswindow length, this assumption holds to some extent in a prac-tical sense. A typical example of this is that a consonant portionof speech is overlapped by the reflections of a preceding vowelportion.
B. Properties of the Subspace Method
By taking the generalized eigenvalue decomposition ofas[13]
(17)

208 IEEE TRANSACTIONS ON SPEECH AND AUDIO PROCESSING, VOL. 11, NO. 3, MAY 2003
Fig. 7. Directivity pattern obtained by the subspace method. (a), (b): Whole frequency range and (c), (d): a slice of (a) and (b) at 1200 and 2000 Hz.
we have the eigenvector matrix and theeigenvalue matrix , where and
are the eigenvector and the eigenvalue, respectively. Asdescribed in Section II, the noise includes the reflection/re-verberation of the signals and, thus, the correlation matrix ofthe noise, , cannot be observed separately. Therefore, inthis paper, is assumed. This assumption is equivalentto the case in which the standard eigenvalue decomposition,
, is employed in the subspace method. In aphysical sense, this corresponds to the assumption thatisspatially white (e.g., [5]).
Based on the structure of and the assumptions describedabove, the eigenvalues and eigenvectors have the followingproperties [6], [13], [14].
Property1) The energy of the directional signals isconcentrated on the dominant eigenvalues.
Property2) The energy of is equally spread over alleigenvalues.
Property3) , where de-notes the eigenvectors corresponding to thedominanteigenvalues.
Property4) , wheredenotes the eigen-
vectors corresponding to the other eigenvalues.
The notation denotes the space spanned by thecolumn vectors of , i.e.,
. The notation denotes the orthog-onal complement of . The subspaces andare termed signal subspace and noise subspace, respectively.The vectors and become thebasis of the signal subspace and the noise subspace, respec-tively. A typical eigenvalue distribution and the correspondingenergy distribution that reflects Properties 1 and 2 are depictedin Fig. 2 ( and is assumed). The relation ofvectors that reflects Properties 3 and 4 is depicted in Fig. 3
and is assumed).
C. Subspace Filter
In the subspace method, the input signal is processed as
(18)

ASANO et al.: COMBINED APPROACH OF ARRAY PROCESSING AND INDEPENDENT COMPONENT ANALYSIS 209
Fig. 8. Relative spectra of direct sound/reflection at the input/output of the system. (a) Source #1, direct sound; (b) Source #2, direct sound; (c) Source #1,reflection; and (d) Source #2, reflection. Regarding the output spectra (ICA and ICA+ SS), the spectra at the output channel #2 are shown. SS: subspace method.
where the subspace filter is defined as
(19)
where . The term is a normal-ization factor, the same as that used in PCA [1]. The termplays a main role in the subspace filter that reduces the energyof in the noise subspace as described in Appendix II.
V. PERMUTATION
A. Structure of Mixing Matrix
When the mixing matrix has the form of the modelshown in (3), the th column vector (location vector of thethsource) in the mixing matrix at the frequencyand that at theadjacent frequency are written as
......
(20)
Here, in (3) is assumed for the sake of sim-plicity. From (20), it can be seen that the location vector is
which is rotated by the angle as depicted in Fig. 4(a).Based on this relation (coherency) of the location vectors at theadjacent frequencies, the relation of the mixing matrix can bewritten as [15], [16]
(21)
where the matrix is the rotation matrix. When thedifference in frequency (frequency resolution of STFT) issufficiently small
(22)
and the angle between the location vectors atand , , issmall. Based on this, is expected to be the smallest for thecorrect permutation as depicted in Fig. 4.
B. Method for Solving Permutation
Based on the above discussion, permutation is solved so thatthe sum of the angles between the location vec-
210 IEEE TRANSACTIONS ON SPEECH AND AUDIO PROCESSING, VOL. 11, NO. 3, MAY 2003
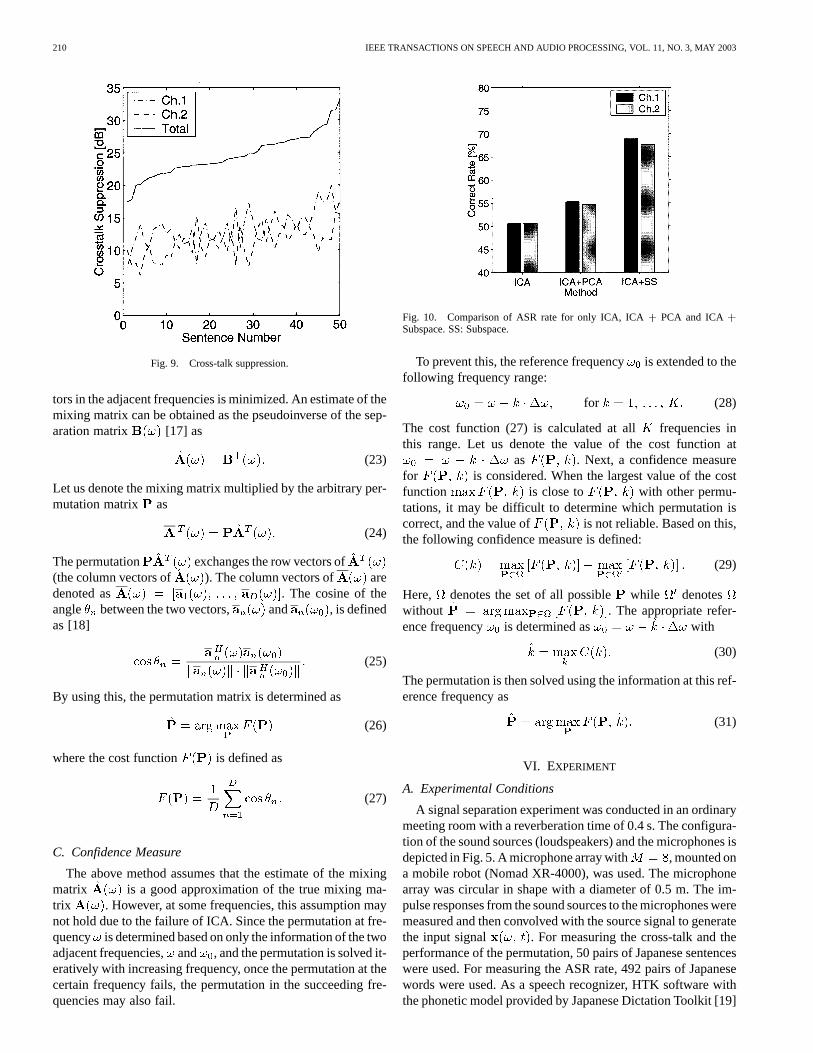
Fig. 9. Cross-talk suppression.
tors in the adjacent frequencies is minimized. An estimate of themixing matrix can be obtained as the pseudoinverse of the sep-aration matrix [17] as
(23)
Let us denote the mixing matrix multiplied by the arbitrary per-mutation matrix as
(24)
The permutation exchanges the row vectors of(the column vectors of ). The column vectors of aredenoted as . The cosine of theangle between the two vectors, and , is definedas [18]
(25)
By using this, the permutation matrix is determined as
(26)
where the cost function is defined as
(27)
C. Confidence Measure
The above method assumes that the estimate of the mixingmatrix is a good approximation of the true mixing ma-trix . However, at some frequencies, this assumption maynot hold due to the failure of ICA. Since the permutation at fre-quency is determined based on only the information of the twoadjacent frequencies,and , and the permutation is solved it-eratively with increasing frequency, once the permutation at thecertain frequency fails, the permutation in the succeeding fre-quencies may also fail.
Fig. 10. Comparison of ASR rate for only ICA, ICA+ PCA and ICA+Subspace. SS: Subspace.
To prevent this, the reference frequencyis extended to thefollowing frequency range:
for (28)
The cost function (27) is calculated at all frequencies inthis range. Let us denote the value of the cost function at
as . Next, a confidence measurefor is considered. When the largest value of the costfunction is close to with other permu-tations, it may be difficult to determine which permutation iscorrect, and the value of is not reliable. Based on this,the following confidence measure is defined:
(29)
Here, denotes the set of all possible while denoteswithout . The appropriate refer-ence frequency is determined as with
(30)
The permutation is then solved using the information at this ref-erence frequency as
(31)
VI. EXPERIMENT
A. Experimental Conditions
A signal separation experiment was conducted in an ordinarymeeting room with a reverberation time of 0.4 s. The configura-tion of the sound sources (loudspeakers) and the microphones isdepicted in Fig. 5. A microphone array with , mounted ona mobile robot (Nomad XR-4000), was used. The microphonearray was circular in shape with a diameter of 0.5 m. The im-pulse responses from the sound sources to the microphones weremeasured and then convolved with the source signal to generatethe input signal . For measuring the cross-talk and theperformance of the permutation, 50 pairs of Japanese sentenceswere used. For measuring the ASR rate, 492 pairs of Japanesewords were used. As a speech recognizer, HTK software withthe phonetic model provided by Japanese Dictation Toolkit [19]

ASANO et al.: COMBINED APPROACH OF ARRAY PROCESSING AND INDEPENDENT COMPONENT ANALYSIS 211
Fig. 11. Theoretical value of the cost functionF (P; k) and the confidence measureC(k) for k = 1.
Fig. 12. Measured value of the cost functionF (P; k) and the confidence measureC(k) for k = 1.
was employed. The parameters of the ASR system are shown inTable II. The parameters of the BSS system are summarized inTable III.
B. Effect of Subspace Method
For constructing the subspace filter (19), the number ofsources, , is assumed to be known. The permutation in thissection is solved by using the cross correlation between theoutput spectrogram and the source spectrogram (unknown inreal situation) as “correct permutation” for evaluating onlythe effect of the subspace method. This method is denoted assource-output correlation (SOC) hereafter.
Fig. 6 shows the eigenvalue distribution of . For the sakeof comparison, the eigenvalue distribution without reflection isalso shown. The eigenvalue distribution without reflection wasobtained by eliminating the reflections in the impulse responseusing a window function. By comparing these, it can be seen thatthe energy of the direct sound is concentrated on the two dom-inant eigenvalues while the energy of the reflections is spread
over the other eigenvalues. Therefore, Properties 1-4 in Sec-tion IV-B hold in a practical sense and the subspace method isapplicable. However, it should be noted that the eigenvalue dis-tribution for the noise in Fig. 6 was not perfectly flat comparedwith the ideal case depicted in Fig. 2. This is because the noiseis spatially colored to some extent and, thus the assumption,
, did not perfectly hold in the real situation. This mis-match may result in the performance of the subspace filter beinglower compared with the case with the spatially white noise.
Fig. 7 shows the directivity pattern of the subspace filter.From this figure, although it is not as clear as that of analyt-ically designed beamformers, it can be seen that two acousticbeams, which are complementary in channel 1 and 2, appear inthe directions of the sources, i.e., 0and 60 . From this, it isunderstood that the subspace filter works as a self-organizingbeamformer.
Fig. 8 shows the spectra of the direct sound and the reflectionof Source #1 and #2 at the input/output of the system separately.For ease of viewing, the spectra were normalized by their inputspectrum. For comparison, the case of BSS without the subspacemethod (only ICA) is also shown. In this case, the number of
212 IEEE TRANSACTIONS ON SPEECH AND AUDIO PROCESSING, VOL. 11, NO. 3, MAY 2003
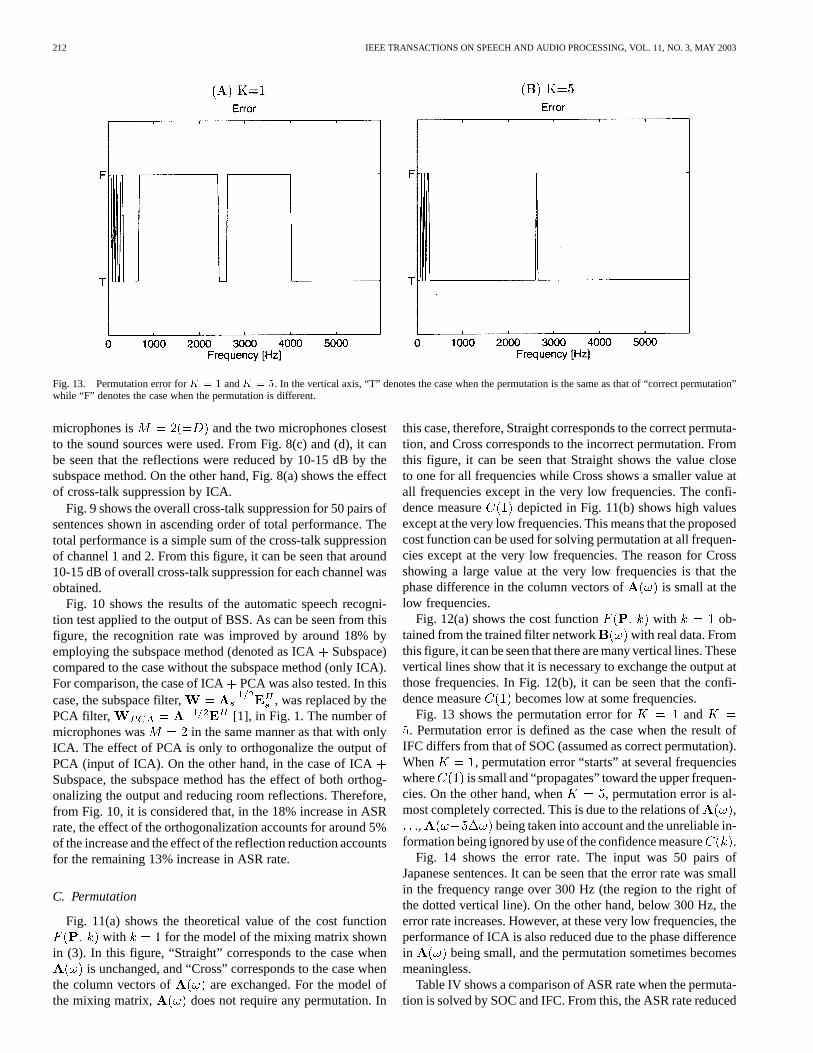
Fig. 13. Permutation error forK = 1 andK = 5. In the vertical axis, “T” denotes the case when the permutation is the same as that of “correct permutation”while “F” denotes the case when the permutation is different.
microphones is and the two microphones closestto the sound sources were used. From Fig. 8(c) and (d), it canbe seen that the reflections were reduced by 10-15 dB by thesubspace method. On the other hand, Fig. 8(a) shows the effectof cross-talk suppression by ICA.
Fig. 9 shows the overall cross-talk suppression for 50 pairs ofsentences shown in ascending order of total performance. Thetotal performance is a simple sum of the cross-talk suppressionof channel 1 and 2. From this figure, it can be seen that around10-15 dB of overall cross-talk suppression for each channel wasobtained.
Fig. 10 shows the results of the automatic speech recogni-tion test applied to the output of BSS. As can be seen from thisfigure, the recognition rate was improved by around 18% byemploying the subspace method (denoted as ICASubspace)compared to the case without the subspace method (only ICA).For comparison, the case of ICAPCA was also tested. In thiscase, the subspace filter, , was replaced by thePCA filter, [1], in Fig. 1. The number ofmicrophones was in the same manner as that with onlyICA. The effect of PCA is only to orthogonalize the output ofPCA (input of ICA). On the other hand, in the case of ICASubspace, the subspace method has the effect of both orthog-onalizing the output and reducing room reflections. Therefore,from Fig. 10, it is considered that, in the 18% increase in ASRrate, the effect of the orthogonalization accounts for around 5%of the increase and the effect of the reflection reduction accountsfor the remaining 13% increase in ASR rate.
C. Permutation
Fig. 11(a) shows the theoretical value of the cost functionwith for the model of the mixing matrix shown
in (3). In this figure, “Straight” corresponds to the case whenis unchanged, and “Cross” corresponds to the case when
the column vectors of are exchanged. For the model ofthe mixing matrix, does not require any permutation. In
this case, therefore, Straight corresponds to the correct permuta-tion, and Cross corresponds to the incorrect permutation. Fromthis figure, it can be seen that Straight shows the value closeto one for all frequencies while Cross shows a smaller value atall frequencies except in the very low frequencies. The confi-dence measure depicted in Fig. 11(b) shows high valuesexcept at the very low frequencies. This means that the proposedcost function can be used for solving permutation at all frequen-cies except at the very low frequencies. The reason for Crossshowing a large value at the very low frequencies is that thephase difference in the column vectors of is small at thelow frequencies.
Fig. 12(a) shows the cost function with ob-tained from the trained filter network with real data. Fromthis figure, it can be seen that there are many vertical lines. Thesevertical lines show that it is necessary to exchange the output atthose frequencies. In Fig. 12(b), it can be seen that the confi-dence measure becomes low at some frequencies.
Fig. 13 shows the permutation error for and. Permutation error is defined as the case when the result of
IFC differs from that of SOC (assumed as correct permutation).When , permutation error “starts” at several frequencieswhere is small and “propagates” toward the upper frequen-cies. On the other hand, when , permutation error is al-most completely corrected. This is due to the relations of ,
, being taken into account and the unreliable in-formation being ignored by use of the confidence measure.
Fig. 14 shows the error rate. The input was 50 pairs ofJapanese sentences. It can be seen that the error rate was smallin the frequency range over 300 Hz (the region to the right ofthe dotted vertical line). On the other hand, below 300 Hz, theerror rate increases. However, at these very low frequencies, theperformance of ICA is also reduced due to the phase differencein being small, and the permutation sometimes becomesmeaningless.
Table IV shows a comparison of ASR rate when the permuta-tion is solved by SOC and IFC. From this, the ASR rate reduced

ASANO et al.: COMBINED APPROACH OF ARRAY PROCESSING AND INDEPENDENT COMPONENT ANALYSIS 213
Fig. 14. Error rate in solving permutation. The error rate is plotted with “x”below 300 Hz and with a solid line over 300 Hz.
TABLE IVASR RATE FOR DIFFERENTPERMUTATION METHODS[%]
by employing IFC is small (around 4%) compared with the errorrate for IFSEC reported in [3] (around 18%). In the applicationof ASR, the contribution of the lower frequency component issmall due to the pre-emphasis [20]. Therefore, the permutationerror at very low frequencies is considered to be small.
VII. CONCLUSION
In this paper, an approach combining array processing andICA for the blind separation of acoustic signals in a reflectiveenvironment was proposed. Two array processing techniqueswere employed for pre- and post-processing of ICA.
As a pre-processor, the subspace method was employed to re-duce the effect of room reflections. As shown in this paper, thesubspace method functions as a self-organizing beamformer fo-cusing on the target sources and is suitable for the frameworkof the blind separation. From the results of the experiments,it was shown that the subspace method reduced the power ofthe reflections by around 10 dB and improved the ASR rate byaround 18% for the array and the sound environment used in theexperiment.
The performance of the subspace method depends on boththe array configuration and the sound environment. Regardingthe array configuration, the subspace method is analogous to theconventional DS beamformer since the subspace method has thesame noise reduction mechanism as that of the DS beamformer.As for the sound environment, the directivity of reflections is as-sumed to be small. This assumption holds when reflections arecoming from many directions and the coherency of the reflec-tions between the microphones is reduced. The sound environ-ment used in the experiment where the microphone array wasplaced at some distance from the walls of the room meets this
condition. When there is a strong reflection with high directivitysuch as when the microphone-array is placed close to a hardwall, this assumption may not hold. In this case, some modifi-cation may be required for the subspace method [21]. This casemust be treated in a future study.
As a post-processor, a new method for solving the permuta-tion problem was proposed. This method utilizes the coherency(continuity) of the mixing matrix at adjacent frequencies, aphysical property peculiar to acoustic problems. By employingthis method, the permutation error was reduced to 4% in termsof the ASR rate. An advantage of this method is that, unlikeIFSEC, the performance of IFC is independent of sourcespectra. Another advantage over IFSEC is that IFC does notrequire a large memory space, such as that required for IFSEC,to store the output spectrogram (see Appendix I), a desirablefeature for implementation in small-sized hardware such asDSP (digital signal processor).
In this paper, the conventional ICA algorithm was employedto combine the proposed pre- and post-array processing.However, the recent progress of the ICA algorithm will lead tothe further improvement of the performance of the proposedsystem.
APPENDIX IIFSEC
As indicated in (25) and (27), the cost function of the pro-posed method for solving permutation is written as
(32)
On the other hand, the cost function of IFSEC is written as
(33)
In IFSEC, this cost function is maximized in a manner similarto that of the proposed method to solve the permutation. Thevector is the th column vector of the following matrix in amanner similar to (24)
(34)
The matrix has the estimated spectral envelope (theoutput of BSS smoothed by the moving-average) as a columnvector as
(35)
where
(36)
The symbol denotes the estimated spectral envelope atthe th channel, frequency, and the th time frame. The sym-bols, , denote the period of spectrogram used for solvingthe permutation.
As indicated in (32) and (33), the essential difference of theproposed IFC and the conventional IFSEC is the vectors usedin their cost functions. The dimension of the vector in IFC isalways (8 in this paper), while that of IFSEC is dependent
214 IEEE TRANSACTIONS ON SPEECH AND AUDIO PROCESSING, VOL. 11, NO. 3, MAY 2003
on the length of the spectrogram to be used for solving the per-mutation. For example, when using 1 s of spectrogram with a16-point frame shift, the dimension of the vector is 1000 forIFSEC. From this, it can be known that the proposed IFC con-sumes less memory space and computational load. It should benoted that, for the sake of simplicity in explanation, IFSEC de-scribed above was simplified. For further details, see [9].
APPENDIX IIAN ASPECT OF THESUBSPACE METHOD AS A
SELF-ORGANIZING BEAMFORMER
According to Properties 1 and 3, the directional componentcan be expanded with the subset of the basis vectors,
, as
(37)
where is the projection coefficient of onto the basisvector . On the other hand, due to Property 2, is expandedusing all the basis vectors, , as
(38)
where is a projection coefficient of onto the basisvector . Equations (37) and (38) can be written in a matrix-vector notation as
(39)
(40)
where and. Equation (40) can be split as
(41)
where
(42)
(43)
and and. From (42) and (43),
and . Applying the subspacefilter to these components in (39), (42) and (43) and using theproperties of the eigenvectors, and ,we obtain
(44)
(45)
(46)
From these, it can be seen that, by applying the subspace filter,the components in the signal subspace and are pre-served while the component in the noise subspace is can-celled. When the number of microphones is considerablylarger than that of the number of sources, it is expected thata large portion of can be cancelled by this subspace filter.
On the other hand, the DS beamformer in the frequency do-main that focuses on theth target source can be expressed as[22]
(47)
where
(48)
For the sake of simplicity, it is assumed thatin (3). By using the vector notation, (48) can be
written as
(49)
where denotes theth column vector of . The denominator,, is employed as a normalization factor. By extending (47)
and (49) so that the target sources are focused, the DS beam-former becomes
(50)
where
(51)
Applying the DS beamformer to
(52)
This is because, due to Property 4, .According to the above discussion, the subspace filterand
the DS beamformer have the same noise reduction mech-anism, i.e., a mechanism which cancels the component in thenoise subspace, . The essential difference in the subspacemethod and the DS beamformer is that, in the DS beamformer,knowledge of the mixing matrix is required in the design ofthe beamformer as shown in (51) while, in the subspace method,no previous knowledge is required. In this sense, the subspacefilter can be considered as a self-organizing beamformer.
REFERENCES
[1] T.-W. Lee, Independent Component Analysis. Norwell, MA: Kluwer,1998.
[2] O. Hoshuyama, A. Sugiyama, and A. Hirano, “A robust adaptive beam-former for microphone arrays with a blocking matrix using constrainedadaptive filters,”IEEE Trans. Signal Processing, vol. 47, pp. 2677–2684,Oct. 1999.
[3] F. Asano and S. Ikeda, “Evaluation and real-time implementation ofblind source separation system using time-delayed decorrelation,” inProc. ICA2000, June 2000, pp. 411–415.
[4] M. Kawamoto, A. Barros, K. Matsuoka, and N. Ohnishi, “A methodof real-world blind separation implementation in frequency domain,” inProc. ICA 2000, June 2000, pp. 267–272.
[5] D. H. Johnson and D. E. Dudgeon,Array Signal Pro-cessing. Englewood Cliffs, NJ: Prentice-Hall, 1993.
[6] F. Asano, S. Hayamizu, T. Yamada, and S. Nakamura, “Speech enhance-ment based on the subspace method,”IEEE Trans. Speech, Audio Pro-cessing, vol. 8, pp. 497–507, Sept. 2000.
[7] F. Asano, Y. Motomura, H. Asoh, and T. Matsui, “Effect of pca filter inblind source separation,” inProc. ICA2000, June 2000, pp. 57–62.
[8] S. Ikeda and N. Murata, “A method of ica in time-frequency domain,”in Proc. ICA’99, Jan. 1999, pp. 365–371.

ASANO et al.: COMBINED APPROACH OF ARRAY PROCESSING AND INDEPENDENT COMPONENT ANALYSIS 215
[9] N. Murata, S. Ikeda, and A. Ziehe, “An approach to blind source separa-tion based on temporal structure of speech signals,”Neurocomput., vol.41, pp. 1–24, 2001.
[10] A. Bell and T. Sejnowski, “An information-maximization approach toblind separation and blind deconvolution,”Neural Comput., vol. 7, pp.1129–1159, 1995.
[11] S. Amari, T. Chen, and A. Cichocki, “Stability analysis of learning al-gorithms for blind source separation,”Neural Networks, vol. 10, no. 8,pp. 1345–1351, 1997.
[12] P. Smaragdis, “Blind separation of convolved mixtures in the frequencydomain,” inProc. Int. Workshop on Independence and Artificial NeuralNetworks, 1998.
[13] R. Roy and T. Kailath, “Esprit—Estimation of signal parameters viarotational invariance techniques,”IEEE Trans. Acoust., Speech, SignalProcessing, vol. 37, pp. 984–995, July 1989.
[14] A. Cantoni and L. C. Godara, “Resolving the direction of sources in acorrelated field incident on an array,”J. Acoust. Soc. Amer., vol. 67, pp.1247–1255, 1981.
[15] H. Hung and M. Kaveh, “Focussing matrices for coherent signal-sub-space processing,”IEEE Trans. Acoust., Speech, Signal Processing, vol.36, no. 8, pp. 1272–1281, 1988.
[16] , “Coherent signal-subspace processing for the detection and esti-mation of angles of arrival of multiple wide-band sources,”IEEE Trans.Acoust., Speech, Signal Processing, vol. ASSP-33, no. 4, pp. 823–831,1985.
[17] A. Belouchrani, K. Abed-Meraim, J.-F. Cardoso, and E. Moulines, “Ablind source separation technique using second-order statistics,”IEEETrans. Signal Processing, vol. 45, pp. 434–443, Feb. 1997.
[18] G. Strang,Linear Algebra and Its Application. Orlando, FL: HarcourtBrace Jovanovich, 1988.
[19] T. Kawahara, T. Kobayashi, K. Takeda, N. Minematsu, K. Itou, M. Ya-mamoto, A. Yamada, T. Utsuro, and K. Shikano, “Japanese dictationtoolkit: Plug-and-play framework for speech recognition r&d,” inProc.ICASSP’99, Mar. 1999, pp. I–393.
[20] L. R. Rabiner and B.-H. Juang,Fundamentals of Speech Recogni-tion. Englewood Cliffs, NJ: Prentice-Hall, 1993.
[21] T. Shan, M. wax, and T. Kailath, “On spatial smoothing for direction-of-arrival estimation of coherent signals,”IEEE Trans. Acoust., Speech,Signal Processing, vol. ASSP-33, pp. 806–811, Aug. 1985.
[22] S. U. Pillai, Array Signal Processing. New York: Springer-Verlag,1989.
Futoshi Asano (M’95) received the B.S. degreein electrical engineering, and the M.S. and Ph.D.degrees in electrical and communication engineeringfrom Tohoku University, Sendai, Japan, in 1986,1988 and 1991, respectively.
From 1991 to 1995, he was a Research Associateat R.I.E.C., Tohoku University. From 1993 to 1994,he was a Visiting Researcher at A.R.L., PennsylvaniaState University. From 1995 to 2001, he was withthe Electrotechnical Laboratory, Tsukuba, Japan.Currently, he is a Group Leader in National Institute
of Advanced Industrial Science and Technology, Tsukuba. His researchinterests include array signal processing, adaptive signal processing, neuralnetwork, statistical signal processing, and speech recognition.
Shiro Ikeda (M’95) received the B.Eng., M.Eng.,and Dr.Eng. in mathematical engineering andinformation physics from University of Tokyo,Japan, in 1991, 1993, and 1995, respectively.
He has been an Associate Professor with the BrainScience and Engineering Department at the KyushuInstitute of Technology, Japan, since April 2001.His research interests include information geometry,signal processing, and machine learning.
Michiaki Ogawa was born in Fukui, Japan, on Feb-ruary 26, 1977. He received the Bachelor of Libraryand Information Science degree from University ofLibrary and Information Science, Japan, in 1999 andthe M.E. degree from University of Tsukuba, Japan,in 2001.
Hideki Asoh (M’90) received the M.Eng. degreein information engineering from the University ofTokyo, Japan, in 1983.
In April 1983, he joined the ElectrotechnicalLaboratory as a Researcher. From 1990 to 2001,he was a Senior Researcher. From 1990 to 1991,he was with the German National Research Centerfor Information Technology as a Visiting ResearchScientist. Since April 2001, he has been a SeniorResearch Scientist of Information TechnologyInstitute, National Institute of Advanced Industrial
Science and Technology, Japan. His research interests are in machine learningand man–machine interaction.
Nobuhiko Kitawaki (M’87) was born in Aichi,Japan, on September 27, 1946. He received the B.E.,M.E., and Dr.Eng. degrees from Tohoku University,Japan, in 1969, 1971, and 1981, respectively.
From 1971 to 1997, he was engaged in researchon speech and acoustics information processing atthe Laboratories of Nippon Telegraph and TelephoneCorporation, Japan. From 1993 to 1997, he wasExecutive Manager of the Speech and AcousticsLaboratory. He currently serves as Professor of theInstitute of Information Sciences and Electronics,
and Dean of the College of International Studies, University of Tsukuba, Japan.He contributed to ITU-T Study Group 12 from 1981 to 2000, and has served asa Rapporteur since 1985.
Dr. Kitawaki is a Fellow of the Institute of Electronics, Information, and Com-munication Engineers of Japan (IEICEJ) and a member of the Acoustical So-ciety of Japan, and the Information Processing Society of Japan. He receivedPaper Awards from IEICEJ in 1979 and 1984.