Embed Size (px)
Citation preview

Authority: 9382 Alberta Conference of 7th Day Adventist Church
Page 1
Combined 3-Year Education Plan and Annual Education Results Report (AERR) for School
Authorities
Seventh-day Adventist Schools in Alberta Jurisdiction #9382
Prepared by: Gary Hodder, Chairperson Janet Griffith, Superintendent of Education Janet Hall, Associate Superintendent of Education

Authority: 9382 Alberta Conference of 7th Day Adventist Church
Page 2
Message from the Board Chair (optional) The head office for the Seventh-day Adventist Schools in Alberta is located at the Alberta Conference of the Seventh-day Adventist Church Headquarters, 5816 Highway 2A, Lacombe, Alberta. An electronic copy of this document will be at each school site, as well as a hard copy at central office and posted on the Office of Education website at http://albertasdaedu.org. Specific financial information and the Audited Financial Statement may be accessed through Corene Glover or [email protected]
Authority: 9382 Alberta Conference of 7th Day Adventist Church
Page 3
Accountability Statement
The Annual Education Results Report for the 2016-17 school year and the Education Plan for the three years commencing September 1, 2017 for the Seventh-day Adventist Schools in Alberta was prepared under the direction of the Board of Directors in accordance with the responsibilities under the Private Schools Regulation and the Education Grants Regulation. This document was developed in the context of the provincial government’s business and fiscal plans. The Board has used the results reported in the document, to the best of its abilities, to develop the Education Plan and is committed to implementing the strategies contained within the Education Plan to improve student learning and results. The Board approved this combined Annual Education Results Report for the 2016-17 school year and the Three- Year Education Plan for 2017-2020 on November 29, 2017.
Authority: 9382 Alberta Conference of 7th Day Adventist Church
Page 4
Foundation Statements (optional) • Vision
Our vision of the Seventh-day Adventist Schools in Alberta includes provision for a safe, Christian learning environment, spanning the school experience K-12 that has a variety of learning experiences appropriate to the needs of each individual which will assist students in becoming lifelong learners through:
o Accepting God and His Word
Discovering the great principles of God’s Word and accepting those principles as the basis for all decision- making and the development of values.
o Loyalty to the church Desiring to know and live out the tenets of the Seventh-day Adventist Church and to enjoy service, outreach and witnessing.
o Concept and Skill Development Acquiring optimum individual competency in language/communication, mathematics, the natural and social sciences, all within the Seventh-day Adventist Christian context.
o Thinking Skills Adopting a systematic, logical approach to problem solving emphasizing the development of critical thinking skills and creativity.
o Proficiency in Technology Acquiring knowledge and skills in the use of technology to communicate and facilitate learning and living.
o Aesthetic Appreciation Developing an appreciation of the beauty both in God’s creation and in human artistic expression while nurturing individual ability.
o Healthy Balanced Living Accepting personal responsibility for achieving and maintaining optimum health through balanced living.
o Responsible Citizenship Developing a sense of self-worth, historical heritage, and a working knowledge of governmental processes while affirming a belief in the dignity and worth of others and responsibility for one’s global, community, and natural environments.
o Family and Interpersonal Relationships Developing skills in interpersonal relationships needed for meeting the responsibilities of family membership and responding to the needs of others.
o Career and Mission Developing a strong work ethic and an appreciation of the dignity of service along with involvement in the mission of the church.
• Mission
The education program of the Seventh-day Adventist Schools in Alberta is predicated on the belief that each student is unique and of inestimable value and on the importance of the development of the whole person. Students are guided into developing a meaningful relationship with God, their church, their country, their community, their family and themselves.
• Principles
1. Integration of Faith with learning in all subject areas taught 2. Outdoor Education program 3. Outreach and community service program emphasis in all schools 4. Best Teaching Practices 5. Coaching
• Beliefs
1. The most important task of education is “to restore in man the image of his Maker, to bring him back to the perfection in which he was created, to promote the development of body and soul, which the divine purpose of His creation might be realized—this was to be the work of redemption. This is the object of education, the great object of life.” (Education, pp. 15-16)
2. Students are entitled to a safe, secure and caring learning environment where each individual is respected and valued.
3. All students can learn and experience success. 4. High learning expectations challenge all students to learn and achieve.
Authority: 9382 Alberta Conference of 7th Day Adventist Church
Page 5
5. The success of students is the shared responsibility of students, home, school and constituent churches of the community.
6. Quality educational programs develop the whole person—spiritual, physical, intellectual and emotional dimensions.
7. The development of character and revealing to the youth knowledge of God, Creator and of Christ, the Redeemer (as revealed in the sacred Word) is of primary importance.
8. Emphasis to the principle of service of God and man prepares students for a life of service to their church and community.
9. Teachers must be active members of the Seventh-day Adventist Church in good standing and be committed to the program of the church.
10. Education is an essential building block to our church’s future and society in which we live. 11. Parents and church members have opportunities for meaningful involvement in important decisions
about their children’s education. 12. Access to Adventist Education is open to all students of any race, colour, nationality, and ethnic origin
who wish to receive an education that integrates faith with learning 13. All students must have adequate accessibility to superior achievement in the basic skill areas of
reading, writing, and mathematics in order to participate and contribute as members of society. 14. Divine wisdom and guidance through sincere prayer, Bible study and reflection enhances the
education experience and character development of each student.

Authority: 9382 Alberta Conference of 7th Day Adventist Church
Page 6
A Profile of the School Authority (optional) SCHOOL NAME. ADDRESS CONTACT INFO. Chinook Winds Adventist Academy (K-12)
10101-2nd Ave, SW Calgary, AB T3B 5T2
403-286-5686 [email protected] www.cwaa.net
College Heights Christian School (K-9)
5201 College Avenue Lacombe, AB T4L 1Z6
403-782-6212 [email protected] www.collegeheightschristianschool.ca Coralwood Adventist
Academy (K-12)
12218-135 St. NW Edmonton, AB T5L 1X1
780-454-2173 [email protected] www.coralwood.org
Higher Ground Christian School (K-9)
1 Shirley Street Medicine Hat, AB T1A 8N5
403-527-2714 [email protected] www.highergroundchristianschool.ca Mamawi Atosketan Native
School (K-12)
RR 2 Ponoka, AB T4J 1R2
403-783-4362 [email protected]
www.mamawiatosketan.ca Peace Hills Adventist
School (K-9)
RR 3 Wetaskiwin, AB T9A 1X1
403-780-352-8555 [email protected] www.peacehillsadventistschool.ca South Side Christian
School (K-9)
Box 219 Red Deer, AB T4N 5E8
403-886-2266 [email protected] www.southsidechristianschool.ca
Sylvan Meadows Adventist School (K-9)
RR 1, Box 1006B Sylvan Lake, AB T4X 1X6
403-887-5766 [email protected] www.sylvanmeadowsadventistschool.ca
Woodlands Adventist School (K-9)
RR 3, Site 2, Box 6 Ponoka, AB T4J 1R3
403-783-2640 [email protected] www.woodlandsadventistschool.ca
Prairie Adventist Christian e-School (K-12)
5816 Highway 2A Lacombe, AB T4L 2G5
403-392-3906 [email protected] www.pacescanada.org
Most of the schools listed have operated continuously for at least twenty years or more (except PACeS for ten years) and therefore offer opportunity for a Christian education for Adventist families and other interested families of these communities and surrounding areas. Since the majority of the students attending the schools are Adventist, enrolment is usually a reflection of the number of students who live in the area and the commitment level towards the philosophy and goals of Adventist education. The enrolment will vary from year to year, although data indicates in the last seven years a steady increase in enrolment.
Authority: 9382 Alberta Conference of 7th Day Adventist Church
Page 7
Trends and Issues (optional) Factors unique to this jurisdiction that tend to impact the progress and achievement (i.e. relating to the PAT’s) of the jurisdiction is as follows:
1. 50% of the schools in Jurisdiction #9382 have multi-grade classrooms in the elementary grades. 2. On-line PATing would be advantageous especially for the on-line school. These students are already
used to doing work virtually, so for them to participate in a paper pencil test is not helping them achieve as well as they could. PACeS has increased in enrollment and we anticipate the trend continuing. Therefore, PACeS is becoming one of our “larger” schools which will significantly impact numbers and results on the PAT’s. Some of the Grade 12 students are completing the diploma exams on-line and the process is working quite well.
3. The Grade 5/6 Outdoor School, Grade 7-8 Lake Expedition and Grade 9 Outdoor Education programs continue to be successful.
4. All teachers have SDA certification or are working towards SDA Denominational Certification. This is achieved through a process of academic credits and professional activity participation required to be submitted every year. Certificates are issued upon completion of the requirements. Once the certificate is given, teachers need to continue upgrading to keep certification current.
5. The urban schools seem to be increasing in immigrant and ESL student enrollment which is challenging in the classroom for instruction and impacts the PAT’s and Diploma Exams.
6. The Learning Coach continues to assist teachers in making improvements in classroom management and lesson delivery, in IPP writing, and in identifying where student accommodations are needed for writing PAT’s and Diploma Exams.

Authority: 9382 Alberta Conference of 7th Day Adventist Church
Page 8
Summary of Accomplishments (optional) • The school authority’s accomplishments – impact of major activities/strategies
Highlights for the previous school year of the school authority (impact of major activities/strategies), including programs and results of specific populations of students, such as special needs, ESL, FNMI, home education, as applicable.
1. School evaluations and teacher evaluations continue with an emphasis in best teaching practices and yearly/unit planning in compliance with the TQS. 2. Professional Development continues jurisdiction wide. All teachers and administrators were a part of a Google Summit. All elementary teachers have been in serviced for the new Bible curriculum which includes current pedagogy shifts to inquiry based learning. The jurisdiction continues to work towards a standard based reporting system through Power School.
3. The Learning Coach continues to train teachers on inclusion in the classroom, best teaching practices, and assessing and writing IPP’s for special needs students.
4. This is the tenth full year of operation for Prairie Adventist Christian e-School. This is a K-12 distance learning school where students and teachers meet on-line in a virtual classroom (Zoom) on a regular basis for instruction. PACeS is made available for all SDA students who may or may not have access to a SDA school. Students from the public or other faith based backgrounds are welcome to apply to PACeS if this format fits the needs of the student. Enrollment continues to increase as parents see this is a viable education option for them.
5. Home education students are part of PACeS. Traditional home education is being offered, as well as a blended program. PACeS is the only school where homeschool education is offered in our jurisdiction. Home visits are completed twice per school year which includes a standard based evaluation.
6. The annual Principal’s Retreat took place in October, 2016.
7. The Kindergarten teachers continue to meet on a quarterly basis to support and collaborate with each other professionally.
8. This is the fourth year of using Power School as the student information system. Training continues for administrators and teachers as needed.
9. The Principals have formed a Principal Professional Learning Community where they meet face to face three times per year to share ideas, problem solve, learn professionally and support each other in the day to day operations of a school.
10. There is a Facebook page where teachers across Canada can share ideas and best teaching practices. TRIBES trained teachers develop learning communities in their classrooms/schools where learning becomes the responsibility of the students and where inclusion is a common goal for the learning community. There is an Encounter Facebook page where teachers can submit activities, pictures, resources, and other ideas regarding the new North American Division Bible program which all schools are requested to adopt.
Authority: 9382 Alberta Conference of 7th Day Adventist Church
Page 9
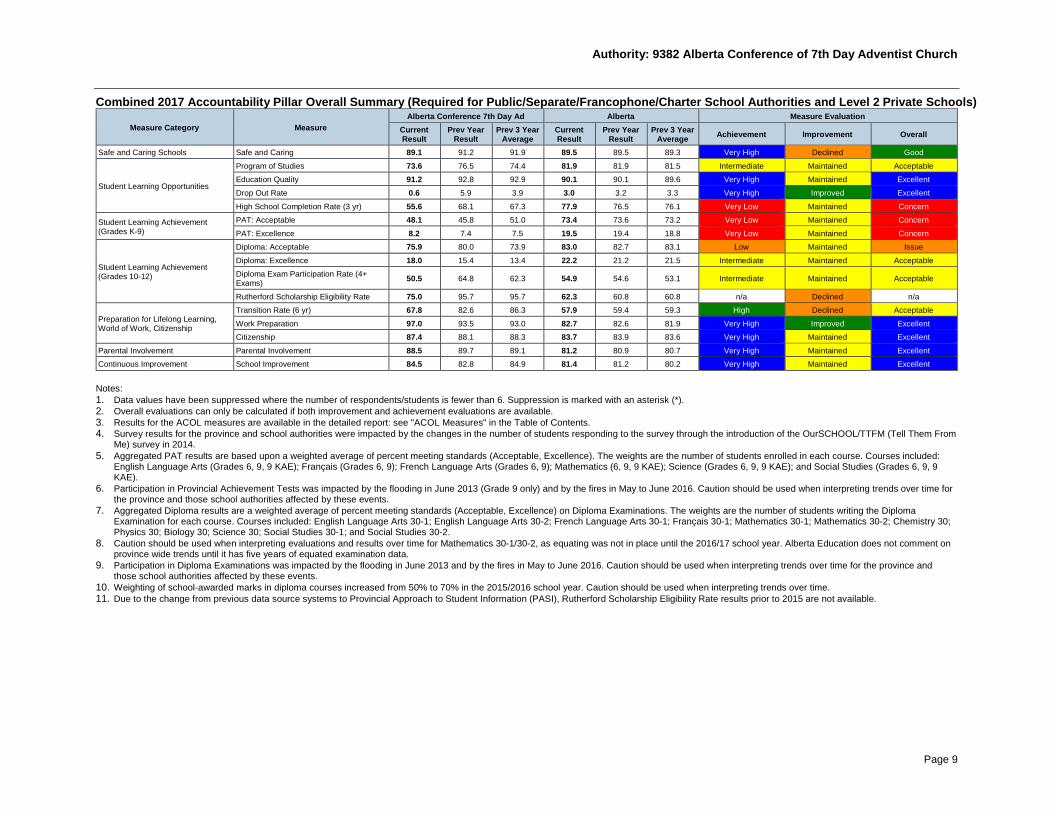
Combined 2017 Accountability Pillar Overall Summary (Required for Public/Separate/Francophone/Charter School Authorities and Level 2 Private Schools)
Measure Category Measure Alberta Conference 7th Day Ad Alberta Measure Evaluation
Current Result Prev Year
Result Prev 3 Year Average Current
Result Prev Year Result Prev 3 Year
Average Achievement Improvement Overall Safe and Caring Schools Safe and Caring 89.1 91.2 91.9 89.5 89.5 89.3 Very High Declined Good
Student Learning Opportunities Program of Studies 73.6 76.5 74.4 81.9 81.9 81.5 Intermediate Maintained Acceptable Education Quality 91.2 92.8 92.9 90.1 90.1 89.6 Very High Maintained Excellent Drop Out Rate 0.6 5.9 3.9 3.0 3.2 3.3 Very High Improved Excellent High School Completion Rate (3 yr) 55.6 68.1 67.3 77.9 76.5 76.1 Very Low Maintained Concern
Student Learning Achievement (Grades K-9)
PAT: Acceptable 48.1 45.8 51.0 73.4 73.6 73.2 Very Low Maintained Concern PAT: Excellence 8.2 7.4 7.5 19.5 19.4 18.8 Very Low Maintained Concern
Student Learning Achievement (Grades 10-12)
Diploma: Acceptable 75.9 80.0 73.9 83.0 82.7 83.1 Low Maintained Issue Diploma: Excellence 18.0 15.4 13.4 22.2 21.2 21.5 Intermediate Maintained Acceptable Diploma Exam Participation Rate (4+ Exams) 50.5 64.8 62.3 54.9 54.6 53.1 Intermediate Maintained Acceptable Rutherford Scholarship Eligibility Rate 75.0 95.7 95.7 62.3 60.8 60.8 n/a Declined n/a
Preparation for Lifelong Learning, World of Work, Citizenship
Transition Rate (6 yr) 67.8 82.6 86.3 57.9 59.4 59.3 High Declined Acceptable Work Preparation 97.0 93.5 93.0 82.7 82.6 81.9 Very High Improved Excellent Citizenship 87.4 88.1 88.3 83.7 83.9 83.6 Very High Maintained Excellent
Parental Involvement Parental Involvement 88.5 89.7 89.1 81.2 80.9 80.7 Very High Maintained Excellent Continuous Improvement School Improvement 84.5 82.8 84.9 81.4 81.2 80.2 Very High Maintained Excellent Notes: 1. Data values have been suppressed where the number of respondents/students is fewer than 6. Suppression is marked with an asterisk (*). 2. Overall evaluations can only be calculated if both improvement and achievement evaluations are available. 3. Results for the ACOL measures are available in the detailed report: see "ACOL Measures" in the Table of Contents. 4. Survey results for the province and school authorities were impacted by the changes in the number of students responding to the survey through the introduction of the OurSCHOOL/TTFM (Tell Them From
Me) survey in 2014. 5. Aggregated PAT results are based upon a weighted average of percent meeting standards (Acceptable, Excellence). The weights are the number of students enrolled in each course. Courses included:
English Language Arts (Grades 6, 9, 9 KAE); Français (Grades 6, 9); French Language Arts (Grades 6, 9); Mathematics (6, 9, 9 KAE); Science (Grades 6, 9, 9 KAE); and Social Studies (Grades 6, 9, 9 KAE).
6. Participation in Provincial Achievement Tests was impacted by the flooding in June 2013 (Grade 9 only) and by the fires in May to June 2016. Caution should be used when interpreting trends over time for the province and those school authorities affected by these events.
7. Aggregated Diploma results are a weighted average of percent meeting standards (Acceptable, Excellence) on Diploma Examinations. The weights are the number of students writing the Diploma Examination for each course. Courses included: English Language Arts 30-1; English Language Arts 30-2; French Language Arts 30-1; Français 30-1; Mathematics 30-1; Mathematics 30-2; Chemistry 30; Physics 30; Biology 30; Science 30; Social Studies 30-1; and Social Studies 30-2.
8. Caution should be used when interpreting evaluations and results over time for Mathematics 30-1/30-2, as equating was not in place until the 2016/17 school year. Alberta Education does not comment on province wide trends until it has five years of equated examination data.
9. Participation in Diploma Examinations was impacted by the flooding in June 2013 and by the fires in May to June 2016. Caution should be used when interpreting trends over time for the province and those school authorities affected by these events.
10. Weighting of school-awarded marks in diploma courses increased from 50% to 70% in the 2015/2016 school year. Caution should be used when interpreting trends over time. 11. Due to the change from previous data source systems to Provincial Approach to Student Information (PASI), Rutherford Scholarship Eligibility Rate results prior to 2015 are not available.
Authority: 9382 Alberta Conference of 7th Day Adventist Church
Page 10
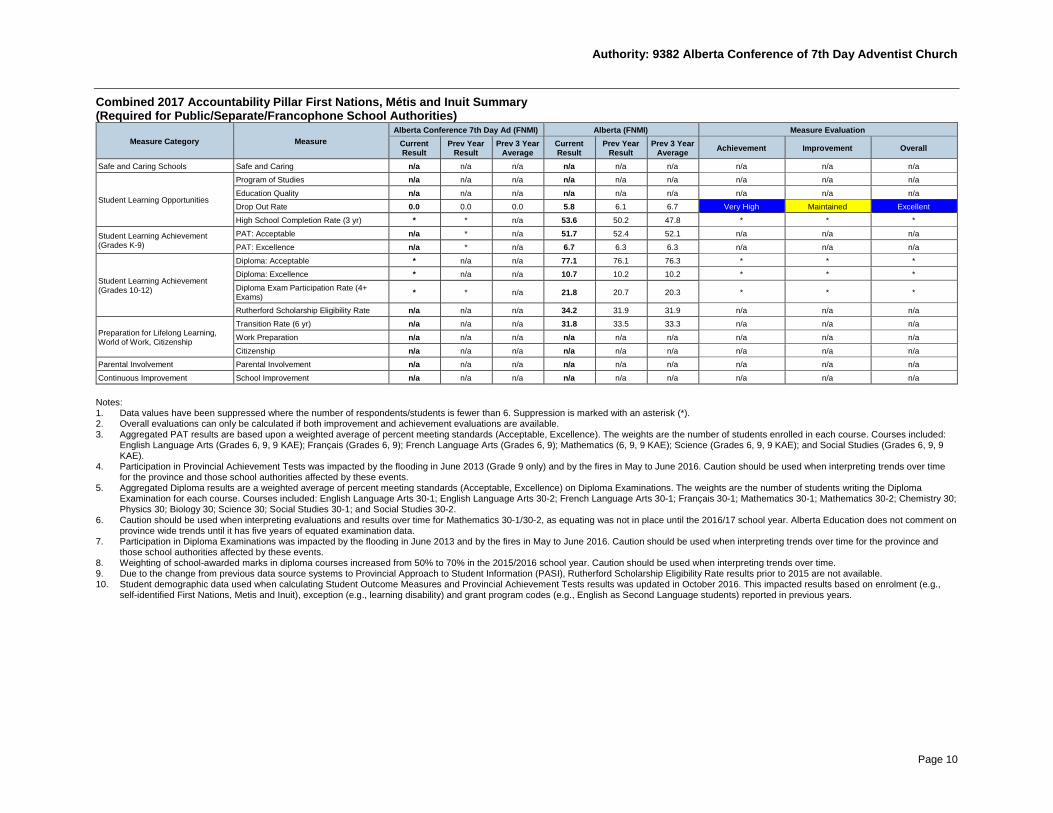
Combined 2017 Accountability Pillar First Nations, Métis and Inuit Summary (Required for Public/Separate/Francophone School Authorities)
Measure Category Measure Alberta Conference 7th Day Ad (FNMI) Alberta (FNMI) Measure Evaluation
Current Result Prev Year
Result Prev 3 Year Average Current
Result Prev Year Result Prev 3 Year
Average Achievement Improvement Overall Safe and Caring Schools Safe and Caring n/a n/a n/a n/a n/a n/a n/a n/a n/a
Student Learning Opportunities Program of Studies n/a n/a n/a n/a n/a n/a n/a n/a n/a Education Quality n/a n/a n/a n/a n/a n/a n/a n/a n/a Drop Out Rate 0.0 0.0 0.0 5.8 6.1 6.7 Very High Maintained Excellent High School Completion Rate (3 yr) * * n/a 53.6 50.2 47.8 * * *
Student Learning Achievement (Grades K-9)
PAT: Acceptable n/a * n/a 51.7 52.4 52.1 n/a n/a n/a PAT: Excellence n/a * n/a 6.7 6.3 6.3 n/a n/a n/a
Student Learning Achievement (Grades 10-12)
Diploma: Acceptable * n/a n/a 77.1 76.1 76.3 * * * Diploma: Excellence * n/a n/a 10.7 10.2 10.2 * * * Diploma Exam Participation Rate (4+ Exams) * * n/a 21.8 20.7 20.3 * * * Rutherford Scholarship Eligibility Rate n/a n/a n/a 34.2 31.9 31.9 n/a n/a n/a
Preparation for Lifelong Learning, World of Work, Citizenship
Transition Rate (6 yr) n/a n/a n/a 31.8 33.5 33.3 n/a n/a n/a Work Preparation n/a n/a n/a n/a n/a n/a n/a n/a n/a Citizenship n/a n/a n/a n/a n/a n/a n/a n/a n/a
Parental Involvement Parental Involvement n/a n/a n/a n/a n/a n/a n/a n/a n/a Continuous Improvement School Improvement n/a n/a n/a n/a n/a n/a n/a n/a n/a Notes: 1. Data values have been suppressed where the number of respondents/students is fewer than 6. Suppression is marked with an asterisk (*). 2. Overall evaluations can only be calculated if both improvement and achievement evaluations are available. 3. Aggregated PAT results are based upon a weighted average of percent meeting standards (Acceptable, Excellence). The weights are the number of students enrolled in each course. Courses included:
English Language Arts (Grades 6, 9, 9 KAE); Français (Grades 6, 9); French Language Arts (Grades 6, 9); Mathematics (6, 9, 9 KAE); Science (Grades 6, 9, 9 KAE); and Social Studies (Grades 6, 9, 9 KAE).
4. Participation in Provincial Achievement Tests was impacted by the flooding in June 2013 (Grade 9 only) and by the fires in May to June 2016. Caution should be used when interpreting trends over time for the province and those school authorities affected by these events.
5. Aggregated Diploma results are a weighted average of percent meeting standards (Acceptable, Excellence) on Diploma Examinations. The weights are the number of students writing the Diploma Examination for each course. Courses included: English Language Arts 30-1; English Language Arts 30-2; French Language Arts 30-1; Français 30-1; Mathematics 30-1; Mathematics 30-2; Chemistry 30; Physics 30; Biology 30; Science 30; Social Studies 30-1; and Social Studies 30-2.
6. Caution should be used when interpreting evaluations and results over time for Mathematics 30-1/30-2, as equating was not in place until the 2016/17 school year. Alberta Education does not comment on province wide trends until it has five years of equated examination data.
7. Participation in Diploma Examinations was impacted by the flooding in June 2013 and by the fires in May to June 2016. Caution should be used when interpreting trends over time for the province and those school authorities affected by these events.
8. Weighting of school-awarded marks in diploma courses increased from 50% to 70% in the 2015/2016 school year. Caution should be used when interpreting trends over time. 9. Due to the change from previous data source systems to Provincial Approach to Student Information (PASI), Rutherford Scholarship Eligibility Rate results prior to 2015 are not available. 10. Student demographic data used when calculating Student Outcome Measures and Provincial Achievement Tests results was updated in October 2016. This impacted results based on enrolment (e.g.,
self-identified First Nations, Metis and Inuit), exception (e.g., learning disability) and grant program codes (e.g., English as Second Language students) reported in previous years.
Authority: 9382 Alberta Conference of 7th Day Adventist Church
Page 11
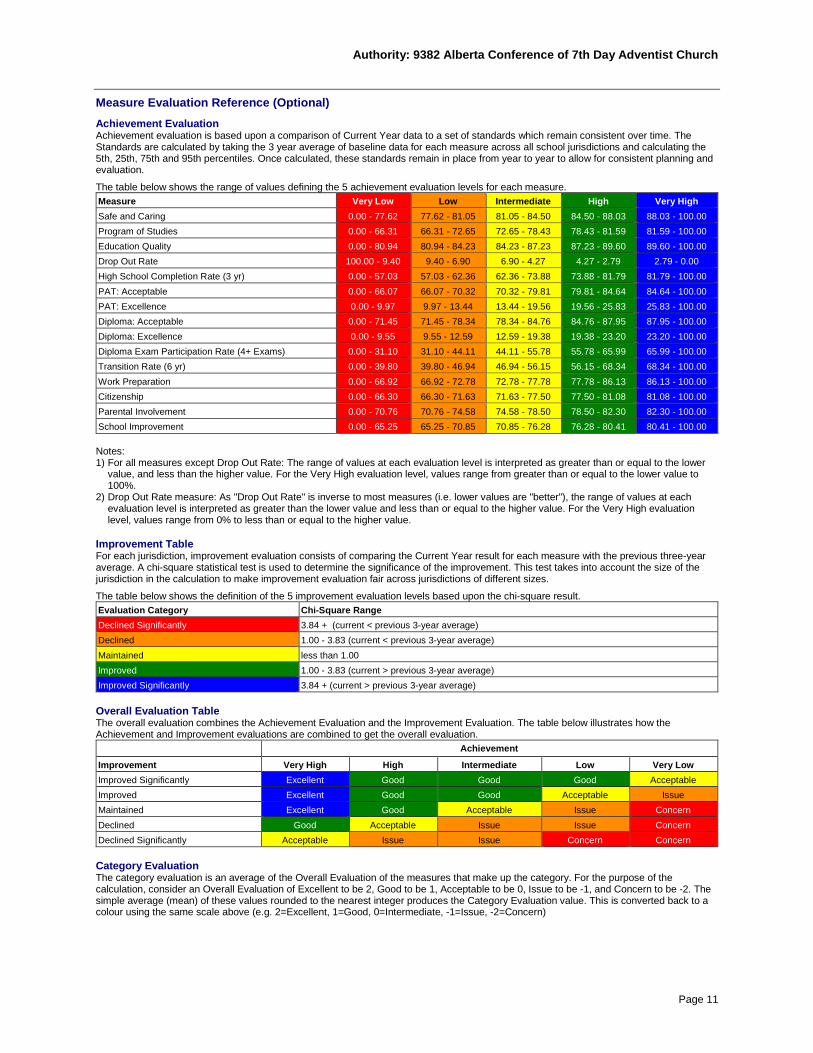
Measure Evaluation Reference (Optional) Achievement Evaluation Achievement evaluation is based upon a comparison of Current Year data to a set of standards which remain consistent over time. The Standards are calculated by taking the 3 year average of baseline data for each measure across all school jurisdictions and calculating the 5th, 25th, 75th and 95th percentiles. Once calculated, these standards remain in place from year to year to allow for consistent planning and evaluation. The table below shows the range of values defining the 5 achievement evaluation levels for each measure. Measure Very Low Low Intermediate High Very High Safe and Caring 0.00 - 77.62 77.62 - 81.05 81.05 - 84.50 84.50 - 88.03 88.03 - 100.00 Program of Studies 0.00 - 66.31 66.31 - 72.65 72.65 - 78.43 78.43 - 81.59 81.59 - 100.00 Education Quality 0.00 - 80.94 80.94 - 84.23 84.23 - 87.23 87.23 - 89.60 89.60 - 100.00 Drop Out Rate 100.00 - 9.40 9.40 - 6.90 6.90 - 4.27 4.27 - 2.79 2.79 - 0.00 High School Completion Rate (3 yr) 0.00 - 57.03 57.03 - 62.36 62.36 - 73.88 73.88 - 81.79 81.79 - 100.00 PAT: Acceptable 0.00 - 66.07 66.07 - 70.32 70.32 - 79.81 79.81 - 84.64 84.64 - 100.00 PAT: Excellence 0.00 - 9.97 9.97 - 13.44 13.44 - 19.56 19.56 - 25.83 25.83 - 100.00 Diploma: Acceptable 0.00 - 71.45 71.45 - 78.34 78.34 - 84.76 84.76 - 87.95 87.95 - 100.00 Diploma: Excellence 0.00 - 9.55 9.55 - 12.59 12.59 - 19.38 19.38 - 23.20 23.20 - 100.00 Diploma Exam Participation Rate (4+ Exams) 0.00 - 31.10 31.10 - 44.11 44.11 - 55.78 55.78 - 65.99 65.99 - 100.00 Transition Rate (6 yr) 0.00 - 39.80 39.80 - 46.94 46.94 - 56.15 56.15 - 68.34 68.34 - 100.00 Work Preparation 0.00 - 66.92 66.92 - 72.78 72.78 - 77.78 77.78 - 86.13 86.13 - 100.00 Citizenship 0.00 - 66.30 66.30 - 71.63 71.63 - 77.50 77.50 - 81.08 81.08 - 100.00 Parental Involvement 0.00 - 70.76 70.76 - 74.58 74.58 - 78.50 78.50 - 82.30 82.30 - 100.00 School Improvement 0.00 - 65.25 65.25 - 70.85 70.85 - 76.28 76.28 - 80.41 80.41 - 100.00 Notes: 1) For all measures except Drop Out Rate: The range of values at each evaluation level is interpreted as greater than or equal to the lower
value, and less than the higher value. For the Very High evaluation level, values range from greater than or equal to the lower value to 100%.
2) Drop Out Rate measure: As "Drop Out Rate" is inverse to most measures (i.e. lower values are "better"), the range of values at each evaluation level is interpreted as greater than the lower value and less than or equal to the higher value. For the Very High evaluation level, values range from 0% to less than or equal to the higher value.
Improvement Table For each jurisdiction, improvement evaluation consists of comparing the Current Year result for each measure with the previous three-year average. A chi-square statistical test is used to determine the significance of the improvement. This test takes into account the size of the jurisdiction in the calculation to make improvement evaluation fair across jurisdictions of different sizes. The table below shows the definition of the 5 improvement evaluation levels based upon the chi-square result. Evaluation Category Chi-Square Range Declined Significantly 3.84 + (current < previous 3-year average) Declined 1.00 - 3.83 (current < previous 3-year average) Maintained less than 1.00 Improved 1.00 - 3.83 (current > previous 3-year average) Improved Significantly 3.84 + (current > previous 3-year average) Overall Evaluation Table The overall evaluation combines the Achievement Evaluation and the Improvement Evaluation. The table below illustrates how the Achievement and Improvement evaluations are combined to get the overall evaluation. Achievement Improvement Very High High Intermediate Low Very Low Improved Significantly Excellent Good Good Good Acceptable Improved Excellent Good Good Acceptable Issue Maintained Excellent Good Acceptable Issue Concern Declined Good Acceptable Issue Issue Concern Declined Significantly Acceptable Issue Issue Concern Concern Category Evaluation The category evaluation is an average of the Overall Evaluation of the measures that make up the category. For the purpose of the calculation, consider an Overall Evaluation of Excellent to be 2, Good to be 1, Acceptable to be 0, Issue to be -1, and Concern to be -2. The simple average (mean) of these values rounded to the nearest integer produces the Category Evaluation value. This is converted back to a colour using the same scale above (e.g. 2=Excellent, 1=Good, 0=Intermediate, -1=Issue, -2=Concern)
Authority: 9382 Alberta Conference of 7th Day Adventist Church
Page 12
Charter Goal: (For Charter Schools Only) Outcome: (Charter Outcome)
• Charter Goals, Outcomes and Performance Measures (locally determined, consistent with Section 35 of the School Act, per the charter school’s ministerial approved charter agreement.)
Performance Measures Results (in percentages) Target* Targets 2013 2014 2015 2016 2017 2017 2018 2019 2020
Locally Determined Performance Measure(s) Comment on Results (OPTIONAL) Commentary on results, such as contextual information, factors affecting performance or actions taken by the jurisdiction that may have contributed to evaluations of “Improved” or “Improved significantly” on Accountability Pillar measures, may be included. Strategies For each outcome, charter schools must develop and include strategies (at least one strategy for each outcome) in the plan. * Target set for 2016/17 in the three year education plan 2016/17 – 2018/19.
Authority: 9382 Alberta Conference of 7th Day Adventist Church
Page 13
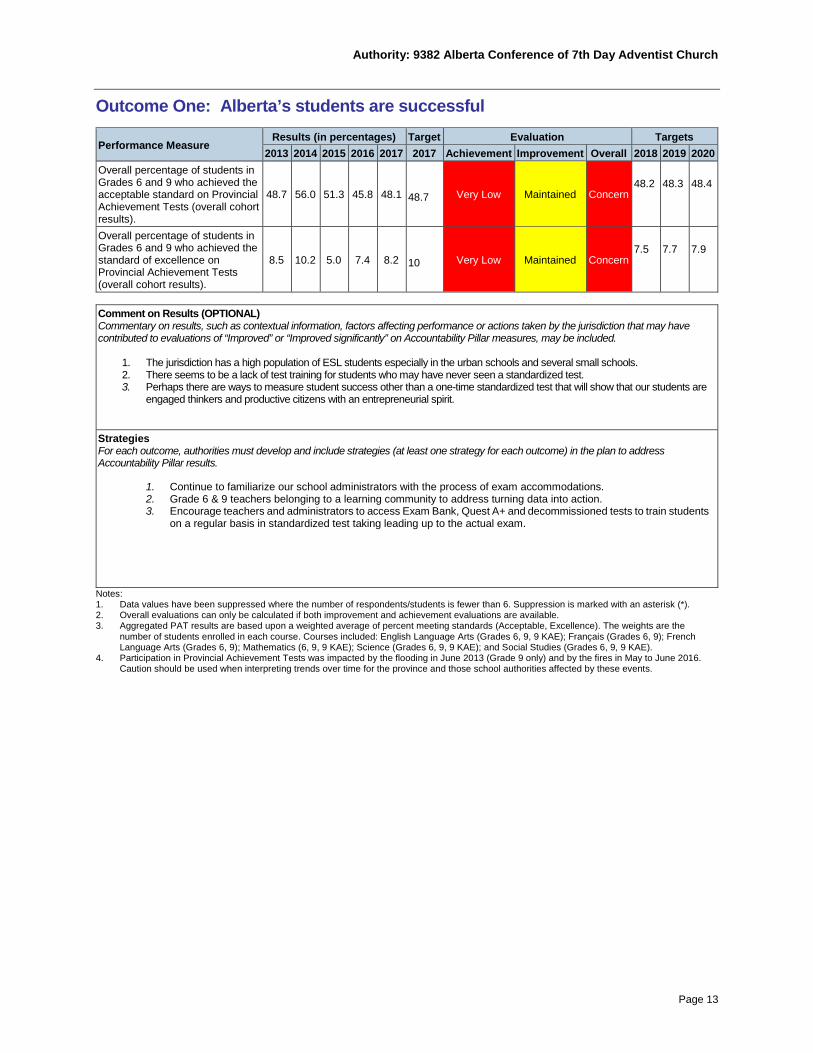
Outcome One: Alberta’s students are successful
Performance Measure Results (in percentages) Target Evaluation Targets 2013 2014 2015 2016 2017 2017 Achievement Improvement Overall 2018 2019 2020
Overall percentage of students in Grades 6 and 9 who achieved the acceptable standard on Provincial Achievement Tests (overall cohort results).
48.7 56.0 51.3 45.8 48.1 48.7 Very Low Maintained Concern
48.2
48.3
48.4
Overall percentage of students in Grades 6 and 9 who achieved the standard of excellence on Provincial Achievement Tests (overall cohort results).
8.5 10.2 5.0 7.4 8.2 10 Very Low Maintained Concern
7.5
7.7
7.9
Comment on Results (OPTIONAL) Commentary on results, such as contextual information, factors affecting performance or actions taken by the jurisdiction that may have contributed to evaluations of “Improved” or “Improved significantly” on Accountability Pillar measures, may be included.
1. The jurisdiction has a high population of ESL students especially in the urban schools and several small schools. 2. There seems to be a lack of test training for students who may have never seen a standardized test. 3. Perhaps there are ways to measure student success other than a one-time standardized test that will show that our students are
engaged thinkers and productive citizens with an entrepreneurial spirit. Strategies For each outcome, authorities must develop and include strategies (at least one strategy for each outcome) in the plan to address Accountability Pillar results.
1. Continue to familiarize our school administrators with the process of exam accommodations. 2. Grade 6 & 9 teachers belonging to a learning community to address turning data into action. 3. Encourage teachers and administrators to access Exam Bank, Quest A+ and decommissioned tests to train students
on a regular basis in standardized test taking leading up to the actual exam.
Notes: 1. Data values have been suppressed where the number of respondents/students is fewer than 6. Suppression is marked with an asterisk (*). 2. Overall evaluations can only be calculated if both improvement and achievement evaluations are available. 3. Aggregated PAT results are based upon a weighted average of percent meeting standards (Acceptable, Excellence). The weights are the
number of students enrolled in each course. Courses included: English Language Arts (Grades 6, 9, 9 KAE); Français (Grades 6, 9); French Language Arts (Grades 6, 9); Mathematics (6, 9, 9 KAE); Science (Grades 6, 9, 9 KAE); and Social Studies (Grades 6, 9, 9 KAE).
4. Participation in Provincial Achievement Tests was impacted by the flooding in June 2013 (Grade 9 only) and by the fires in May to June 2016. Caution should be used when interpreting trends over time for the province and those school authorities affected by these events.
Authority: 9382 Alberta Conference of 7th Day Adventist Church
Page 14
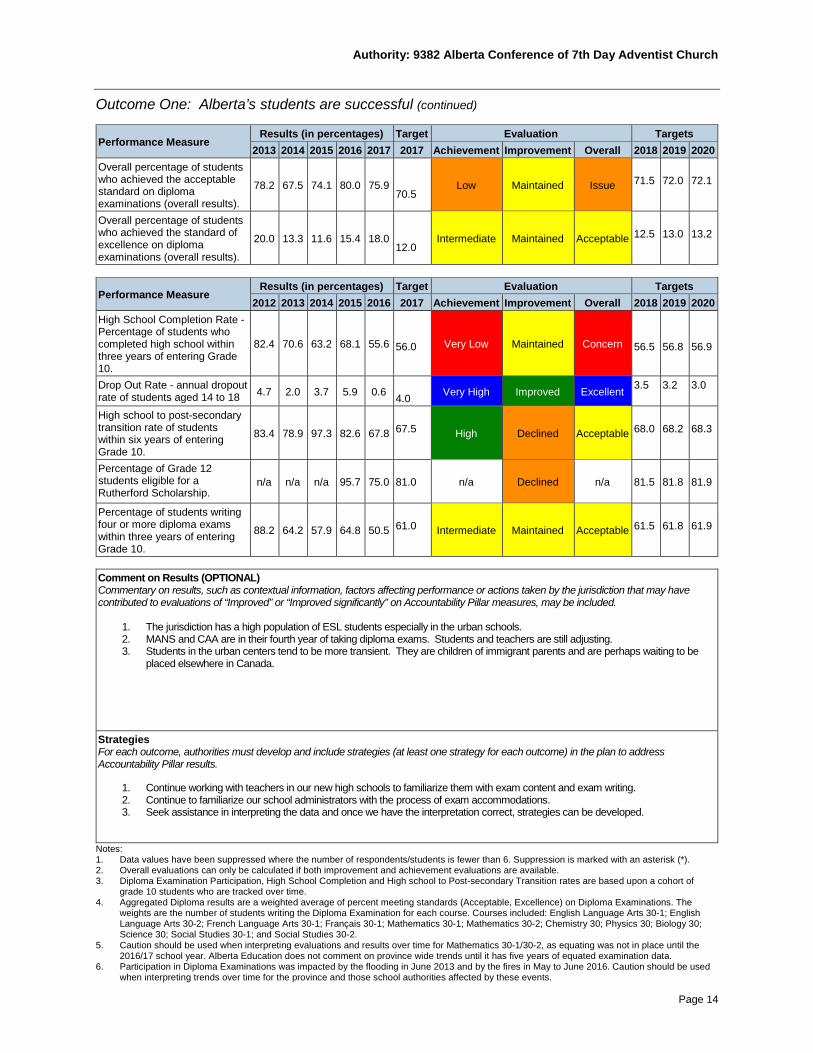
Outcome One: Alberta’s students are successful (continued)
Performance Measure Results (in percentages) Target Evaluation Targets 2013 2014 2015 2016 2017 2017 Achievement Improvement Overall 2018 2019 2020
Overall percentage of students who achieved the acceptable standard on diploma examinations (overall results).
78.2 67.5 74.1 80.0 75.9 70.5
Low Maintained Issue 71.5
72.0
72.1
Overall percentage of students who achieved the standard of excellence on diploma examinations (overall results).
20.0 13.3 11.6 15.4 18.0 12.0
Intermediate Maintained Acceptable 12.5
13.0
13.2
Performance Measure Results (in percentages) Target Evaluation Targets 2012 2013 2014 2015 2016 2017 Achievement Improvement Overall 2018 2019 2020
High School Completion Rate - Percentage of students who completed high school within three years of entering Grade 10.
82.4 70.6 63.2 68.1 55.6 56.0 Very Low Maintained Concern
56.5
56.8
56.9
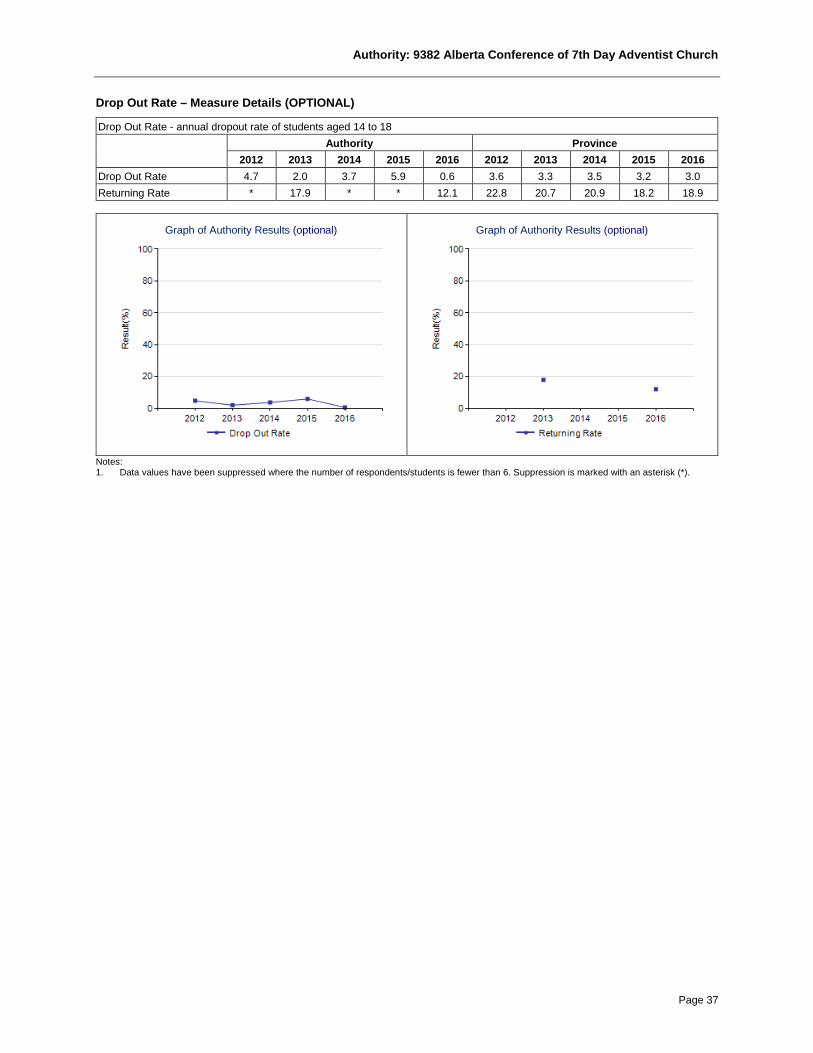
Drop Out Rate - annual dropout rate of students aged 14 to 18 4.7 2.0 3.7 5.9 0.6
4.0 Very High Improved Excellent 3.5 3.2 3.0
High school to post-secondary transition rate of students within six years of entering Grade 10.
83.4 78.9 97.3 82.6 67.8 67.5 High Declined Acceptable
68.0
68.2
68.3
Percentage of Grade 12 students eligible for a Rutherford Scholarship.
n/a n/a n/a 95.7 75.0 81.0 n/a Declined n/a
81.5
81.8
81.9
Percentage of students writing four or more diploma exams within three years of entering Grade 10.
88.2 64.2 57.9 64.8 50.5 61.0 Intermediate Maintained Acceptable
61.5
61.8
61.9
Comment on Results (OPTIONAL) Commentary on results, such as contextual information, factors affecting performance or actions taken by the jurisdiction that may have contributed to evaluations of “Improved” or “Improved significantly” on Accountability Pillar measures, may be included.
1. The jurisdiction has a high population of ESL students especially in the urban schools. 2. MANS and CAA are in their fourth year of taking diploma exams. Students and teachers are still adjusting. 3. Students in the urban centers tend to be more transient. They are children of immigrant parents and are perhaps waiting to be
placed elsewhere in Canada. Strategies For each outcome, authorities must develop and include strategies (at least one strategy for each outcome) in the plan to address Accountability Pillar results.
1. Continue working with teachers in our new high schools to familiarize them with exam content and exam writing. 2. Continue to familiarize our school administrators with the process of exam accommodations. 3. Seek assistance in interpreting the data and once we have the interpretation correct, strategies can be developed.
Notes: 1. Data values have been suppressed where the number of respondents/students is fewer than 6. Suppression is marked with an asterisk (*). 2. Overall evaluations can only be calculated if both improvement and achievement evaluations are available. 3. Diploma Examination Participation, High School Completion and High school to Post-secondary Transition rates are based upon a cohort of
grade 10 students who are tracked over time. 4. Aggregated Diploma results are a weighted average of percent meeting standards (Acceptable, Excellence) on Diploma Examinations. The
weights are the number of students writing the Diploma Examination for each course. Courses included: English Language Arts 30-1; English Language Arts 30-2; French Language Arts 30-1; Français 30-1; Mathematics 30-1; Mathematics 30-2; Chemistry 30; Physics 30; Biology 30; Science 30; Social Studies 30-1; and Social Studies 30-2.
5. Caution should be used when interpreting evaluations and results over time for Mathematics 30-1/30-2, as equating was not in place until the 2016/17 school year. Alberta Education does not comment on province wide trends until it has five years of equated examination data.
6. Participation in Diploma Examinations was impacted by the flooding in June 2013 and by the fires in May to June 2016. Caution should be used when interpreting trends over time for the province and those school authorities affected by these events.

Authority: 9382 Alberta Conference of 7th Day Adventist Church
Page 15
7. Weighting of school-awarded marks in diploma courses increased from 50% to 70% in the 2015/2016 school year. Caution should be used when interpreting trends over time.
8. Due to the change from previous data source systems to Provincial Approach to Student Information (PASI), Rutherford Scholarship Eligibility Rate results prior to 2015 are not available.
Authority: 9382 Alberta Conference of 7th Day Adventist Church
Page 16
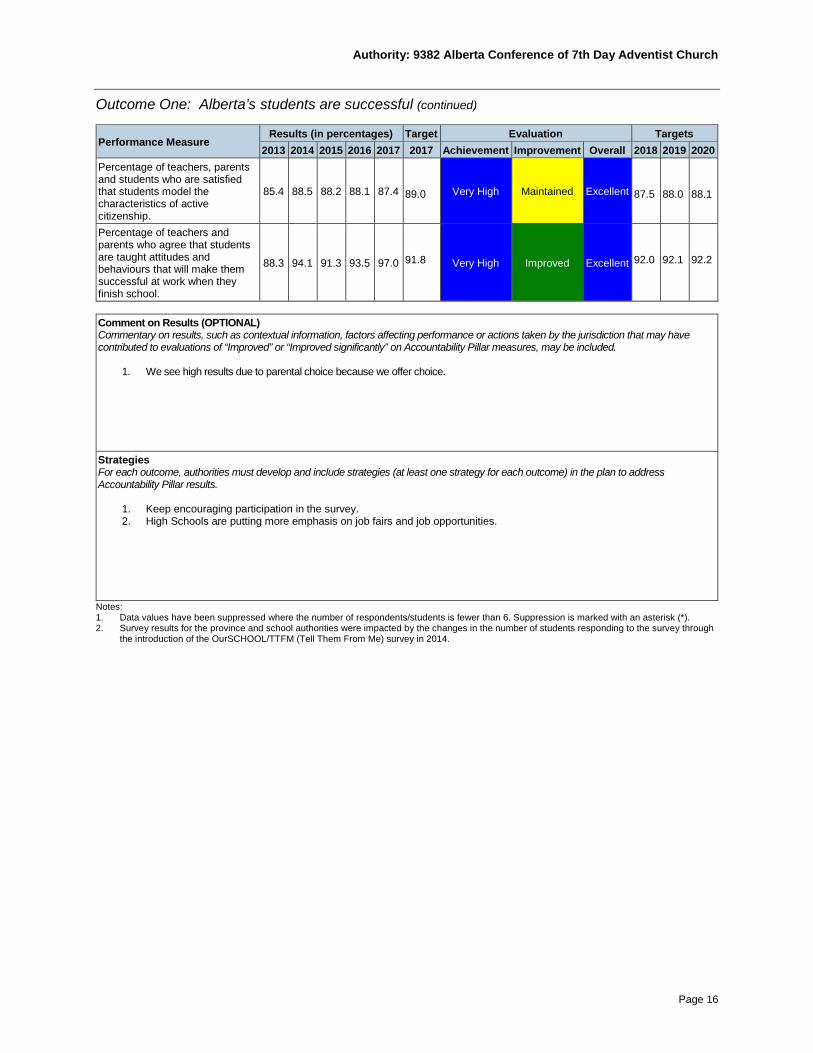
Outcome One: Alberta’s students are successful (continued)
Performance Measure Results (in percentages) Target Evaluation Targets 2013 2014 2015 2016 2017 2017 Achievement Improvement Overall 2018 2019 2020
Percentage of teachers, parents and students who are satisfied that students model the characteristics of active citizenship.
85.4 88.5 88.2 88.1 87.4 89.0 Very High Maintained Excellent
87.5
88.0
88.1
Percentage of teachers and parents who agree that students are taught attitudes and behaviours that will make them successful at work when they finish school.
88.3 94.1 91.3 93.5 97.0
91.8 Very High Improved Excellent
92.0
92.1
92.2
Comment on Results (OPTIONAL) Commentary on results, such as contextual information, factors affecting performance or actions taken by the jurisdiction that may have contributed to evaluations of “Improved” or “Improved significantly” on Accountability Pillar measures, may be included.
1. We see high results due to parental choice because we offer choice. Strategies For each outcome, authorities must develop and include strategies (at least one strategy for each outcome) in the plan to address Accountability Pillar results.
1. Keep encouraging participation in the survey. 2. High Schools are putting more emphasis on job fairs and job opportunities.
Notes: 1. Data values have been suppressed where the number of respondents/students is fewer than 6. Suppression is marked with an asterisk (*). 2. Survey results for the province and school authorities were impacted by the changes in the number of students responding to the survey through
the introduction of the OurSCHOOL/TTFM (Tell Them From Me) survey in 2014.

Authority: 9382 Alberta Conference of 7th Day Adventist Church
Page 17
Outcome One: Alberta’s students are successful (continued)
Performance Measure Results (in percentages) Target Evaluation Targets 2013 2014 2015 2016 2017 2017 Achievement Improvement Overall 2018 2019 2020
Percentage of teacher and parent satisfaction that students demonstrate the knowledge, skills and attitudes necessary for lifelong learning.(This measure is required for charter and private school authorities with only K-9 schools)
76.3 79.4 81.5 77.5 81.8
80.7 n/a n/a n/a
80.9
81.0
91.1
Comment on Results (OPTIONAL) Commentary on results, such as contextual information, factors affecting performance or actions taken by the jurisdiction that may have contributed to evaluations of “Improved” or “Improved significantly” on Accountability Pillar measures, may be included.
1. We have a combination of schools --four K-12 schools (including an on-line school); six K-9 schools (including five multi grade; 2-3 teacher schools)
Strategies
1. Keep encouraging teachers to demonstrate life-long learning to the students. Notes: 1. Data values have been suppressed where the number of respondents/students is fewer than 6. Suppression is marked with an asterisk (*). 2. Survey results for the province and school authorities were impacted by the changes in the number of students responding to the survey through
the introduction of the OurSCHOOL/TTFM (Tell Them From Me) survey in 2014.
Authority: 9382 Alberta Conference of 7th Day Adventist Church
Page 18
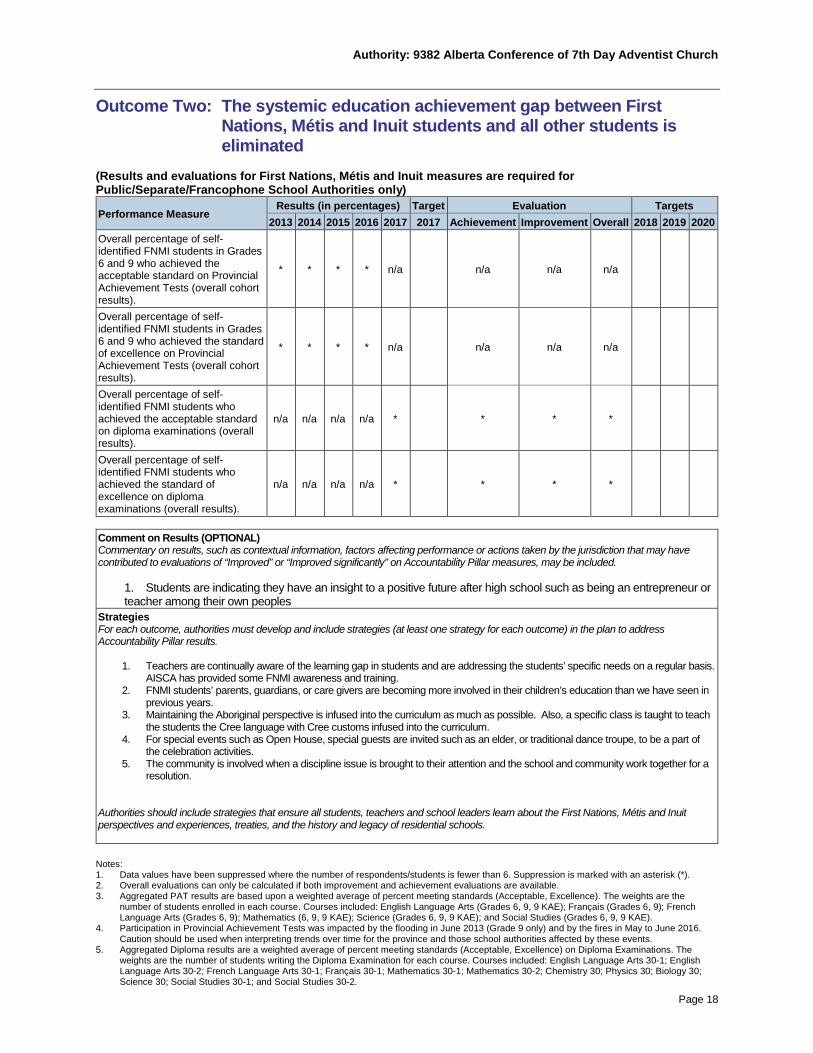
Outcome Two: The systemic education achievement gap between First Nations, Métis and Inuit students and all other students is eliminated
(Results and evaluations for First Nations, Métis and Inuit measures are required for Public/Separate/Francophone School Authorities only)
Performance Measure Results (in percentages) Target Evaluation Targets 2013 2014 2015 2016 2017 2017 Achievement Improvement Overall 2018 2019 2020
Overall percentage of self-identified FNMI students in Grades 6 and 9 who achieved the acceptable standard on Provincial Achievement Tests (overall cohort results).
* * * * n/a
n/a n/a n/a
Overall percentage of self-identified FNMI students in Grades 6 and 9 who achieved the standard of excellence on Provincial Achievement Tests (overall cohort results).
* * * * n/a
n/a n/a n/a
Overall percentage of self-identified FNMI students who achieved the acceptable standard on diploma examinations (overall results).
n/a n/a n/a n/a * * * *
Overall percentage of self-identified FNMI students who achieved the standard of excellence on diploma examinations (overall results).
n/a n/a n/a n/a *
* * *
Comment on Results (OPTIONAL) Commentary on results, such as contextual information, factors affecting performance or actions taken by the jurisdiction that may have contributed to evaluations of “Improved” or “Improved significantly” on Accountability Pillar measures, may be included.
1. 1. Students are indicating they have an insight to a positive future after high school such as being an entrepreneur or teacher among their own peoples
Strategies For each outcome, authorities must develop and include strategies (at least one strategy for each outcome) in the plan to address Accountability Pillar results.
1. Teachers are continually aware of the learning gap in students and are addressing the students’ specific needs on a regular basis. AISCA has provided some FNMI awareness and training.
2. FNMI students’ parents, guardians, or care givers are becoming more involved in their children’s education than we have seen in previous years.
3. Maintaining the Aboriginal perspective is infused into the curriculum as much as possible. Also, a specific class is taught to teach the students the Cree language with Cree customs infused into the curriculum.
4. For special events such as Open House, special guests are invited such as an elder, or traditional dance troupe, to be a part of the celebration activities.
5. The community is involved when a discipline issue is brought to their attention and the school and community work together for a resolution.
Authorities should include strategies that ensure all students, teachers and school leaders learn about the First Nations, Métis and Inuit perspectives and experiences, treaties, and the history and legacy of residential schools. Notes: 1. Data values have been suppressed where the number of respondents/students is fewer than 6. Suppression is marked with an asterisk (*). 2. Overall evaluations can only be calculated if both improvement and achievement evaluations are available. 3. Aggregated PAT results are based upon a weighted average of percent meeting standards (Acceptable, Excellence). The weights are the
number of students enrolled in each course. Courses included: English Language Arts (Grades 6, 9, 9 KAE); Français (Grades 6, 9); French Language Arts (Grades 6, 9); Mathematics (6, 9, 9 KAE); Science (Grades 6, 9, 9 KAE); and Social Studies (Grades 6, 9, 9 KAE).
4. Participation in Provincial Achievement Tests was impacted by the flooding in June 2013 (Grade 9 only) and by the fires in May to June 2016. Caution should be used when interpreting trends over time for the province and those school authorities affected by these events.
5. Aggregated Diploma results are a weighted average of percent meeting standards (Acceptable, Excellence) on Diploma Examinations. The weights are the number of students writing the Diploma Examination for each course. Courses included: English Language Arts 30-1; English Language Arts 30-2; French Language Arts 30-1; Français 30-1; Mathematics 30-1; Mathematics 30-2; Chemistry 30; Physics 30; Biology 30; Science 30; Social Studies 30-1; and Social Studies 30-2.

Authority: 9382 Alberta Conference of 7th Day Adventist Church
Page 19
6. Caution should be used when interpreting evaluations and results over time for Mathematics 30-1/30-2, as equating was not in place until the 2016/17 school year. Alberta Education does not comment on province wide trends until it has five years of equated examination data.
7. Participation in Diploma Examinations was impacted by the flooding in June 2013 and by the fires in May to June 2016. Caution should be used when interpreting trends over time for the province and those school authorities affected by these events.
8. Weighting of school-awarded marks in diploma courses increased from 50% to 70% in the 2015/2016 school year. Caution should be used when interpreting trends over time.

Authority: 9382 Alberta Conference of 7th Day Adventist Church
Page 20
Outcome Two: The systemic education achievement gap between First Nations, Métis and Inuit students and all other students is eliminated (continued)
Performance Measure Results (in percentages) Target Evaluation Targets 2012 2013 2014 2015 2016 2017 Achievement Improvement Overall 2018 2019 2020
High School Completion Rate - Percentage of self-identified FNMI students who completed high school within three years of entering Grade 10.
n/a n/a n/a * *
* * *
Drop Out Rate - annual dropout rate of self-identified FNMI students aged 14 to 18
* 0.0 * 0.0 0.0
Very High Maintained Excellent
High school to post-secondary transition rate of self-identified FNMI students within six years of entering Grade 10.
n/a * n/a n/a n/a
n/a n/a n/a
Percentage of Grade 12 self-identified FNMI students eligible for a Rutherford Scholarship.
n/a n/a n/a n/a n/a
n/a n/a n/a
Percentage of self-identified FNMI students writing four or more diploma exams within three years of entering Grade 10.
n/a n/a n/a * *
* * *
Comment on Results (OPTIONAL) Commentary on results, such as contextual information, factors affecting performance or actions taken by the jurisdiction that may have contributed to evaluations of “Improved” or “Improved significantly” on Accountability Pillar measures, may be included. Strategies For each outcome, authorities must develop and include strategies (at least one strategy for each outcome) in the plan to address Accountability Pillar results.
1. Jurisdiction authority has attended AISCA training on familiarizing us on history and resources available for First Nation students.
Authorities should include strategies that ensure all students, teachers and school leaders learn about the First Nations, Métis and Inuit perspectives and experiences, treaties, and the history and legacy of residential schools. Notes: 1. Data values have been suppressed where the number of respondents/students is fewer than 6. Suppression is marked with an asterisk (*). 2. Overall evaluations can only be calculated if both improvement and achievement evaluations are available. 3. Diploma Examination Participation, High School Completion and High school to Post-secondary Transition rates are based upon a cohort of
grade 10 students who are tracked over time. 4. Weighting of school-awarded marks in diploma courses increased from 50% to 70% in the 2015/2016 school year. Caution should be used when
interpreting trends over time. 5. Due to the change from previous data source systems to Provincial Approach to Student Information (PASI), Rutherford Scholarship Eligibility
Rate results prior to 2015 are not available. 6. Student demographic data used when calculating Student Outcome Measures and Provincial Achievement Tests results was updated in October
2016. This impacted results based on enrolment (e.g., self-identified First Nations, Métis and Inuit), exception (e.g., learning disability) and grant program codes (e.g., English as Second Language students) reported in previous years.

Authority: 9382 Alberta Conference of 7th Day Adventist Church
Page 21
Outcome Three: Alberta’s education system is inclusive
Performance Measure Results (in percentages) Target Evaluation Targets 2013 2014 2015 2016 2017 2017 Achievement Improvement Overall 2018 2019 2020
Percentage of teacher, parent and student agreement that: students are safe at school, are learning the importance of caring for others, are learning respect for others and are treated fairly in school.
89.4 92.4 92.3 91.2 89.1
92.5 Very High Declined Good
89.5
89.7
89.9
Comment on Results (OPTIONAL) Commentary on results, such as contextual information, factors affecting performance or actions taken by the jurisdiction that may have contributed to evaluations of “Improved” or “Improved significantly” on Accountability Pillar measures, may be included.
1. Teachers are collaborating more by participating in professional learning cohorts at the local school and jurisdiction level. 2. Principals, teachers and staff work at creating a safe and caring environment in each classroom and school building. 3. Schools are implementing school-wide guidelines to create a safe environment.
Strategies For each outcome, authorities must develop and include strategies (at least one strategy for each outcome) in the plan to address Accountability Pillar results.
1. By differentiating instruction in the classroom, students are learning respect for differences, care for each other, and thus are being treated fairly resulting in less conflict in the classroom.
2. Training teachers in TRIBES that is all inclusive in creating a safe and caring classroom/school environment. 3. The jurisdiction is still waiting for the result of submitted policy related to safe and caring schools
Authorities should describe the strategies implemented to ensure that all children and students have access to meaningful and relevant learning experiences that include appropriate instructional supports to demonstrate that the jurisdiction is meeting its obligations as stated in the Inclusive Education Policy. For further information and resources, visit https://education.alberta.ca/inclusive-education/what-is-inclusion/. Notes: 1. Data values have been suppressed where the number of respondents/students is fewer than 6. Suppression is marked with an asterisk (*). 2. Survey results for the province and school authorities were impacted by the changes in the number of students responding to the survey through
the introduction of the OurSCHOOL/TTFM (Tell Them From Me) survey in 2014.
Authority: 9382 Alberta Conference of 7th Day Adventist Church
Page 22
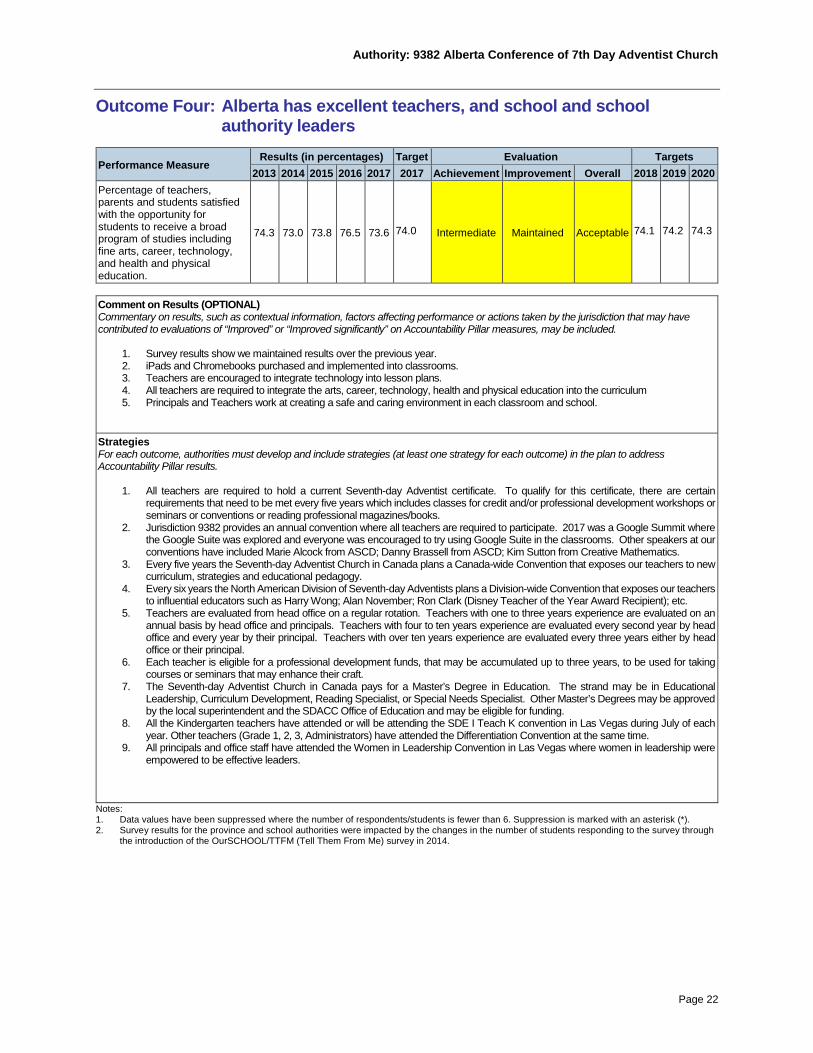
Outcome Four: Alberta has excellent teachers, and school and school authority leaders
Performance Measure Results (in percentages) Target Evaluation Targets 2013 2014 2015 2016 2017 2017 Achievement Improvement Overall 2018 2019 2020
Percentage of teachers, parents and students satisfied with the opportunity for students to receive a broad program of studies including fine arts, career, technology, and health and physical education.
74.3 73.0 73.8 76.5 73.6
74.0 Intermediate Maintained Acceptable
74.1
74.2
74.3
Comment on Results (OPTIONAL) Commentary on results, such as contextual information, factors affecting performance or actions taken by the jurisdiction that may have contributed to evaluations of “Improved” or “Improved significantly” on Accountability Pillar measures, may be included.
1. Survey results show we maintained results over the previous year. 2. iPads and Chromebooks purchased and implemented into classrooms. 3. Teachers are encouraged to integrate technology into lesson plans. 4. All teachers are required to integrate the arts, career, technology, health and physical education into the curriculum 5. Principals and Teachers work at creating a safe and caring environment in each classroom and school.
Strategies For each outcome, authorities must develop and include strategies (at least one strategy for each outcome) in the plan to address Accountability Pillar results.
1. All teachers are required to hold a current Seventh-day Adventist certificate. To qualify for this certificate, there are certain requirements that need to be met every five years which includes classes for credit and/or professional development workshops or seminars or conventions or reading professional magazines/books.
2. Jurisdiction 9382 provides an annual convention where all teachers are required to participate. 2017 was a Google Summit where the Google Suite was explored and everyone was encouraged to try using Google Suite in the classrooms. Other speakers at our conventions have included Marie Alcock from ASCD; Danny Brassell from ASCD; Kim Sutton from Creative Mathematics.
3. Every five years the Seventh-day Adventist Church in Canada plans a Canada-wide Convention that exposes our teachers to new curriculum, strategies and educational pedagogy.
4. Every six years the North American Division of Seventh-day Adventists plans a Division-wide Convention that exposes our teachers to influential educators such as Harry Wong; Alan November; Ron Clark (Disney Teacher of the Year Award Recipient); etc.
5. Teachers are evaluated from head office on a regular rotation. Teachers with one to three years experience are evaluated on an annual basis by head office and principals. Teachers with four to ten years experience are evaluated every second year by head office and every year by their principal. Teachers with over ten years experience are evaluated every three years either by head office or their principal.
6. Each teacher is eligible for a professional development funds, that may be accumulated up to three years, to be used for taking courses or seminars that may enhance their craft.
7. The Seventh-day Adventist Church in Canada pays for a Master’s Degree in Education. The strand may be in Educational Leadership, Curriculum Development, Reading Specialist, or Special Needs Specialist. Other Master’s Degrees may be approved by the local superintendent and the SDACC Office of Education and may be eligible for funding.
8. All the Kindergarten teachers have attended or will be attending the SDE I Teach K convention in Las Vegas during July of each year. Other teachers (Grade 1, 2, 3, Administrators) have attended the Differentiation Convention at the same time.
9. All principals and office staff have attended the Women in Leadership Convention in Las Vegas where women in leadership were empowered to be effective leaders.
Notes: 1. Data values have been suppressed where the number of respondents/students is fewer than 6. Suppression is marked with an asterisk (*). 2. Survey results for the province and school authorities were impacted by the changes in the number of students responding to the survey through
the introduction of the OurSCHOOL/TTFM (Tell Them From Me) survey in 2014.
Authority: 9382 Alberta Conference of 7th Day Adventist Church
Page 23
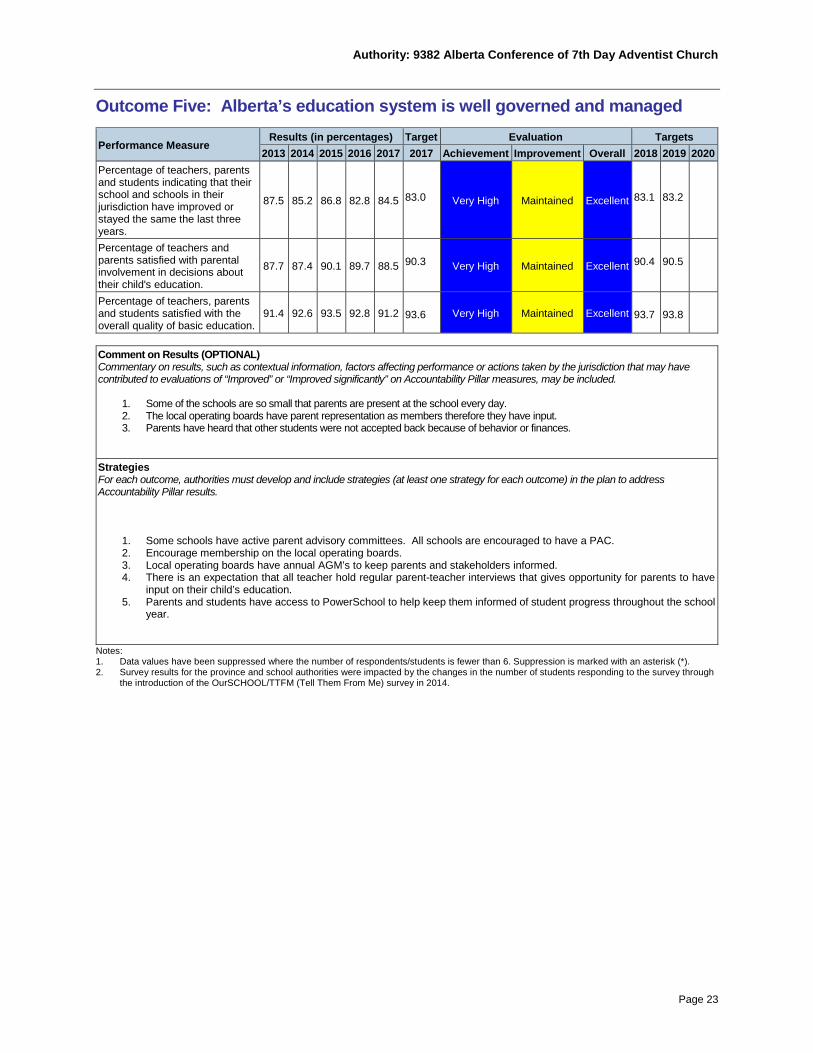
Outcome Five: Alberta’s education system is well governed and managed
Performance Measure Results (in percentages) Target Evaluation Targets 2013 2014 2015 2016 2017 2017 Achievement Improvement Overall 2018 2019 2020
Percentage of teachers, parents and students indicating that their school and schools in their jurisdiction have improved or stayed the same the last three years.
87.5 85.2 86.8 82.8 84.5
83.0 Very High Maintained Excellent
83.1
83.2
Percentage of teachers and parents satisfied with parental involvement in decisions about their child's education.
87.7 87.4 90.1 89.7 88.5 90.3 Very High Maintained Excellent
90.4
90.5
Percentage of teachers, parents and students satisfied with the overall quality of basic education.
91.4 92.6 93.5 92.8 91.2 93.6 Very High Maintained Excellent
93.7
93.8
Comment on Results (OPTIONAL) Commentary on results, such as contextual information, factors affecting performance or actions taken by the jurisdiction that may have contributed to evaluations of “Improved” or “Improved significantly” on Accountability Pillar measures, may be included.
1. Some of the schools are so small that parents are present at the school every day. 2. The local operating boards have parent representation as members therefore they have input. 3. Parents have heard that other students were not accepted back because of behavior or finances.
Strategies For each outcome, authorities must develop and include strategies (at least one strategy for each outcome) in the plan to address Accountability Pillar results.
1. Some schools have active parent advisory committees. All schools are encouraged to have a PAC. 2. Encourage membership on the local operating boards. 3. Local operating boards have annual AGM’s to keep parents and stakeholders informed. 4. There is an expectation that all teacher hold regular parent-teacher interviews that gives opportunity for parents to have
input on their child’s education. 5. Parents and students have access to PowerSchool to help keep them informed of student progress throughout the school
year. Notes: 1. Data values have been suppressed where the number of respondents/students is fewer than 6. Suppression is marked with an asterisk (*). 2. Survey results for the province and school authorities were impacted by the changes in the number of students responding to the survey through
the introduction of the OurSCHOOL/TTFM (Tell Them From Me) survey in 2014.
Authority: 9382 Alberta Conference of 7th Day Adventist Church
Page 24
Note:
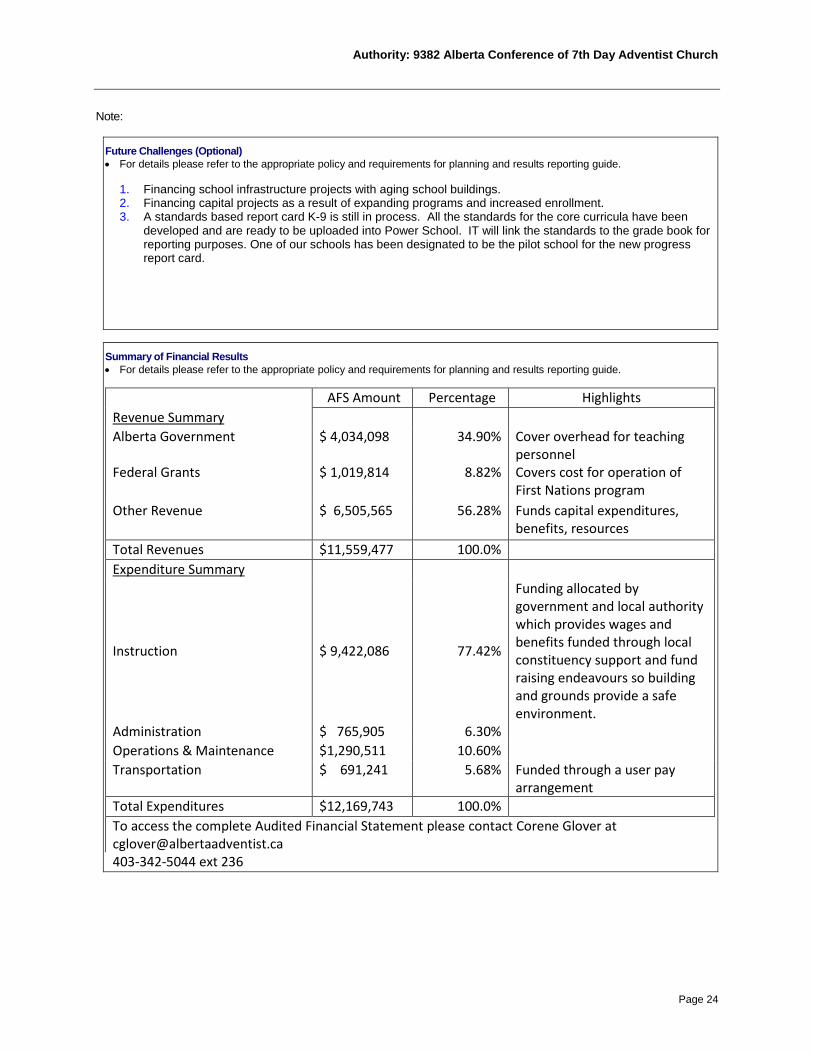
Future Challenges (Optional) • For details please refer to the appropriate policy and requirements for planning and results reporting guide.
1. Financing school infrastructure projects with aging school buildings. 2. Financing capital projects as a result of expanding programs and increased enrollment. 3. A standards based report card K-9 is still in process. All the standards for the core curricula have been
developed and are ready to be uploaded into Power School. IT will link the standards to the grade book for reporting purposes. One of our schools has been designated to be the pilot school for the new progress report card.
Summary of Financial Results • For details please refer to the appropriate policy and requirements for planning and results reporting guide.
AFS Amount Percentage Highlights Revenue Summary Alberta Government $ 4,034,098 34.90% Cover overhead for teaching
personnel Federal Grants $ 1,019,814 8.82% Covers cost for operation of
First Nations program Other Revenue $ 6,505,565 56.28% Funds capital expenditures,
benefits, resources Total Revenues $11,559,477 100.0% Expenditure Summary
Instruction $ 9,422,086 77.42%
Funding allocated by government and local authority which provides wages and benefits funded through local constituency support and fund raising endeavours so building and grounds provide a safe environment.
Administration $ 765,905 6.30% Operations & Maintenance $1,290,511 10.60%
Transportation $ 691,241 5.68% Funded through a user pay arrangement
Total Expenditures $12,169,743 100.0% To access the complete Audited Financial Statement please contact Corene Glover at [email protected] 403-342-5044 ext 236

Authority: 9382 Alberta Conference of 7th Day Adventist Church
Page 25
Budget Summary
Private School Authority Code: 9382
School Code:
BUDGETED STATEMENT OF REVENUES AND EXPENSES for the Year Ending August 31
(in dollars) Budget 2017 / 2018 REVENUES Alberta Education (excluding Home Education) $3,755,798 Alberta Education - Home Education $83,541
Total Alberta Education Revenues $3,,839,339
Federal Government and/or First Nations $1,021,146 Other Alberta school authorities $0 Instruction fees / Tuition fees $1,849,186 Non-instructional (O&M, Transportation, Admin fees, etc.) $212,030 Other sales and services $14,062 Interest on investments $4,500 Gifts and donations $560,765 Gross school generated funds $32,750 Amortization of capital allocations (where applicable) $19,921
Other (specify): AB Conference Subsidy/Fundraise for Operations $2,640,424
TOTAL REVENUES $10,254,123 $10,254,123 EXPENSES Certificated salaries (excluding Home Education) $5,194,302 Certificated benefits (excluding Home Education) $1,298,939 Non-certificated salaries and wages (excluding Home Education) $895,916 Non-certificated Benefits (excluding Home Education) $84,469 Services, contracts and supplies (excluding Home Ed.) $2,159,145 Leases - Other $0 Severe Disabilities / Program Unit (excluding Home Ed.) $55,040 Early Literacy (excluding Home Education) $9,759 English as a Second Language (excluding Home Ed.) $18,204 Home Education Certificated salaries $31,457 Certificated benefits $7,719
Payments to the parents who are providing home education programs to students $41,800
Services and Supplies $11,000 Gross school generated funds $32,750 Capital and debt services Amortization of capital assets From restricted funds $19,921
Authority: 9382 Alberta Conference of 7th Day Adventist Church
Page 26
* Although the Alberta Conference of the SDA School Jurisdiction experienced a loss for the year ended August 31, 2017, we’re anticipating a surplus for the 2017-18 year given a 5.99% increase in enrollment. We will also be receiving a one-time operating subsidy of $375,000 from private sources.
Capital and Facilities Projects • For details please refer to the appropriate policy and requirements for planning and results reporting guide.
1. At Mamawi Atosketan Native School the high school construction is nearing completion. Finish date to be early 2018. 2. Mamawi Atosketan Native School had a break in and as a result new flooring was installed throughout the hallways; 3. Woodlands Adventist School installed new shingles; plans for new siding on building 4. Coralwood Adventist Academy installed new flooring in the foyer and classrooms. 5. Peace Hills Adventist School finished installing their playground. 6. College Heights Christian school installed new student lockers.
All these projects were locally funded by stakeholders
Summary of Facility and Capital Plans • For details please refer to the appropriate policy and requirements for planning and results reporting guide.
1. The biggest project is the continuation of raising funds and completion of the Mamawi Atosketan Native School high school building and Industrial Arts Center. Occupancy date is tentatively set for Spring 2018. Grand opening scheduled for Fall, 2018.
2. Woodlands Adventist School anticipates new siding on their facility within the year.
Parental Involvement • For details please refer to the appropriate policy and requirements for planning and results reporting guide.
1. All parents are members of the Home and School Association or Parent Advisory Committee. 2. The local operating boards have parent representation. 3. Parents are included in the student education planning for special needs. 4. Parents are regularly communicated with through student agendas, school newsletters, websites, PowerSchool and
personal contact
Authority: 9382 Alberta Conference of 7th Day Adventist Church
Page 27
Timelines and Communication • For details please refer to the appropriate policy and requirements for planning and results reporting guide. • AERR and Three-Year Education Plan may be found at www.albertasdaedu.org • All will have a link to the above website and all schools will be sent an electronic copy. • For more information or clarification please contact Janet Griffith at [email protected] • For more information or clarification please contact Corene Glover at [email protected]
Whistleblower Protection • For details please refer to the appropriate policy and requirements for planning and results reporting guide. There have been no disclosures to our knowledge for the 2016-17 school year.
Authority: 9382 Alberta Conference of 7th Day Adventist Church
Page 28
APPENDIX – Measure Details (OPTIONAL)
The following pages include tables and graphs that provide detailed data for the performance measures. Authorities may include these under each measure/outcome to provide context and help in interpreting the results.

Authority: 9382 Alberta Conference of 7th Day Adventist Church
Page 29
Diploma Examination Results – Measure Details (OPTIONAL) Diploma Exam Course by Course Results by Students Writing. Results (in percentages) Target
2013 2014 2015 2016 2017 2017 A E A E A E A E A E A E
English Lang Arts 30-1 Authority 87.5 25.0 60.0 20.0 88.9 11.1 90.9 9.1 75.0 0.0 Province 85.9 10.4 87.6 11.8 86.5 11.4 86.8 10.7 86.5 11.7
English Lang Arts 30-2 Authority * * 66.7 0.0 83.3 0.0 * * * * Province 89.4 10.9 89.8 13.1 88.6 11.2 89.1 12.3 89.5 11.4
French Lang Arts 30-1 Authority n/a n/a n/a n/a n/a n/a n/a n/a n/a n/a Province 95.4 12.4 96.6 14.6 95.5 9.9 93.8 8.7 94.7 9.4
Français 30-1 Authority n/a n/a n/a n/a n/a n/a n/a n/a n/a n/a Province 96.8 18.2 99.3 29.2 95.3 17.1 99.3 20.3 98.1 18.6
Pure Mathematics 30 Authority n/a n/a n/a n/a n/a n/a n/a n/a n/a n/a Province 59.0 11.4 * * n/a n/a n/a n/a n/a n/a
Applied Mathematics 30 Authority n/a n/a n/a n/a n/a n/a n/a n/a n/a n/a Province 71.4 17.9 n/a n/a n/a n/a n/a n/a n/a n/a
Mathematics 30-1 Authority 81.8 45.5 70.0 20.0 57.1 14.3 66.7 11.1 77.8 27.8 Province 80.9 35.9 75.1 27.9 76.1 31.6 70.7 25.9 73.1 30.7
Mathematics 30-2 Authority n/a n/a * * 85.7 14.3 * * 50.0 0.0 Province 69.5 9.7 71.3 15.0 73.9 15.5 75.4 16.8 74.7 15.9
Social Studies 30-1 Authority 100.0 0.0 77.8 11.1 88.2 11.8 87.5 25.0 80.8 11.5 Province 85.4 15.2 85.6 14.2 87.1 16.2 84.9 14.3 86.0 14.8
Social Studies 30-2 Authority * * 75.0 0.0 57.1 0.0 66.7 0.0 * * Province 82.2 13.7 83.9 14.8 81.3 12.5 81.1 13.1 80.6 12.6
Biology 30 Authority 60.0 20.0 60.0 20.0 77.8 22.2 66.7 33.3 75.0 35.0 Province 84.4 32.2 85.2 31.8 85.8 33.0 85.1 32.4 84.2 32.3
Chemistry 30 Authority 60.0 10.0 61.5 15.4 66.7 16.7 77.8 11.1 88.2 29.4 Province 78.8 31.8 81.5 35.2 82.1 34.2 81.5 34.5 83.1 38.6
Physics 30 Authority n/a n/a 66.7 11.1 53.8 0.0 100.0 14.3 76.9 23.1 Province 81.5 30.4 83.2 34.3 83.9 35.8 85.8 39.8 85.7 41.8
Science 30 Authority n/a n/a n/a n/a n/a n/a n/a n/a n/a n/a Province 84.1 25.8 85.0 25.4 83.9 26.6 84.4 27.6 84.9 28.4
Notes: 1. Data values have been suppressed where the number of respondents/students is fewer than 6. Suppression is marked with an asterisk (*). 2. “A” = Acceptable; “E” = Excellence — the percentages achieving the acceptable standard include the percentages achieving the standard of
excellence. 3. Caution should be used when interpreting evaluations and results over time for Mathematics 30-1/30-2, as equating was not in place until the
2016/17 school year. Alberta Education does not comment on province wide trends until it has five years of equated examination data. 4. Participation in Diploma Examinations was impacted by the flooding in June 2013 and by the fires in May to June 2016. Caution should be used
when interpreting trends over time for the province and those school authorities affected by these events.

Authority: 9382 Alberta Conference of 7th Day Adventist Church
Page 30
Graph of Diploma Examination Results – Overall (optional)
Notes: 1. Data values have been suppressed where the number of respondents/students is fewer than 6. Suppression is marked with an asterisk (*). 2. Caution should be used when interpreting evaluations and results over time for Mathematics 30-1/30-2, as equating was not in place until the
2016/17 school year. Alberta Education does not comment on province wide trends until it has five years of equated examination data. 3. Participation in Diploma Examinations was impacted by the flooding in June 2013 and by the fires in May to June 2016. Caution should be used
when interpreting trends over time for the province and those school authorities affected by these events.

Authority: 9382 Alberta Conference of 7th Day Adventist Church
Page 31
Diploma Examination Results by Course (optional)
[No Data for French Lang Arts 30-1]
[No Data for Français 30]
Notes:
1. Data values have been suppressed where the number of respondents/students is fewer than 6. Suppression is marked with an asterisk (*). 2. Caution should be used when interpreting evaluations and results over time for Mathematics 30-1/30-2, as equating was not in place until the
2016/17 school year. Alberta Education does not comment on province wide trends until it has five years of equated examination data. 3. Participation in Diploma Examinations was impacted by the flooding in June 2013 and by the fires in May to June 2016. Caution should be used
when interpreting trends over time for the province and those school authorities affected by these events.

Authority: 9382 Alberta Conference of 7th Day Adventist Church
Page 32
Diploma Examination Results by Course (optional)
[No Data for Science 30]
Notes: 1. Data values have been suppressed where the number of respondents/students is fewer than 6. Suppression is marked with an asterisk (*). 2. Participation in Diploma Examinations was impacted by the flooding in June 2013 and by the fires in May to June 2016. Caution should be used
when interpreting trends over time for the province and those school authorities affected by these events.

Authority: 9382 Alberta Conference of 7th Day Adventist Church
Page 33
Diploma Examination Results Course By Course Summary With Measure Evaluation (optional)
Alberta Conference 7th Day Ad Alberta
Achievement Improvement Overall 2017 Prev 3 Year Average 2017 Prev 3 Year Average Course Measure N % N % N % N %
English Lang Arts 30-1 Acceptable Standard Very Low Maintained Concern 28 75.0 13 79.9 30,150 86.5 28,895 87.0 Standard of Excellence Very Low Declined Significantly Concern 28 0.0 13 13.4 30,150 11.7 28,895 11.3
English Lang Arts 30-2 Acceptable Standard * * * 1 * 6 75.0 16,797 89.5 16,361 89.2 Standard of Excellence * * * 1 * 6 0.0 16,797 11.4 16,361 12.2
French Lang Arts 30-1 Acceptable Standard n/a n/a n/a n/a n/a n/a n/a 1,375 94.7 1,256 95.3 Standard of Excellence n/a n/a n/a n/a n/a n/a n/a 1,375 9.4 1,256 11.0
Français 30-1 Acceptable Standard n/a n/a n/a n/a n/a n/a n/a 156 98.1 140 98.0 Standard of Excellence n/a n/a n/a n/a n/a n/a n/a 156 18.6 140 22.2
Mathematics 30-1 Acceptable Standard n/a n/a n/a 18 77.8 11 64.6 20,371 73.1 20,934 74.0 Standard of Excellence n/a n/a n/a 18 27.8 11 15.1 20,371 30.7 20,934 28.5
Mathematics 30-2 Acceptable Standard n/a n/a n/a 6 50.0 7 85.7 14,327 74.7 12,738 73.6 Standard of Excellence n/a n/a n/a 6 0.0 7 14.3 14,327 15.9 12,738 15.8
Social Studies 30-1 Acceptable Standard Intermediate Maintained Acceptable 26 80.8 11 84.5 22,249 86.0 21,875 85.9 Standard of Excellence Intermediate Maintained Acceptable 26 11.5 11 16.0 22,249 14.8 21,875 14.9
Social Studies 30-2 Acceptable Standard * * * 4 * 7 66.3 20,054 80.6 19,579 82.1 Standard of Excellence * * * 4 * 7 0.0 20,054 12.6 19,579 13.5
Biology 30 Acceptable Standard Low Maintained Issue 20 75.0 15 68.1 22,993 84.2 21,843 85.4 Standard of Excellence Very High Maintained Excellent 20 35.0 15 25.2 22,993 32.3 21,843 32.4
Chemistry 30 Acceptable Standard Very High Improved Excellent 17 88.2 11 68.7 18,751 83.1 19,161 81.7 Standard of Excellence Intermediate Maintained Acceptable 17 29.4 11 14.4 18,751 38.6 19,161 34.6
Physics 30 Acceptable Standard Intermediate Maintained Acceptable 13 76.9 10 73.5 9,952 85.7 10,553 84.3 Standard of Excellence Intermediate Maintained Acceptable 13 23.1 10 8.5 9,952 41.8 10,553 36.6
Science 30 Acceptable Standard n/a n/a n/a n/a n/a n/a n/a 9,323 84.9 7,914 84.4 Standard of Excellence n/a n/a n/a n/a n/a n/a n/a 9,323 28.4 7,914 26.6
Notes: 1. Data values have been suppressed where the number of respondents/students is fewer than 6. Suppression is marked with an asterisk (*). 2. Achievement Evaluation is not calculated for courses that do not have sufficient data available, either due to too few jurisdictions offering the
course or because of changes in examinations. 3. Caution should be used when interpreting evaluations and results over time for Mathematics 30-1/30-2, as equating was not in place until the
2016/17 school year. Alberta Education does not comment on province wide trends until it has five years of equated examination data. 4. Participation in Diploma Examinations was impacted by the flooding in June 2013 and by the fires in May to June 2016. Caution should be used
when interpreting trends over time for the province and those school authorities affected by these events.
Authority: 9382 Alberta Conference of 7th Day Adventist Church
Page 34
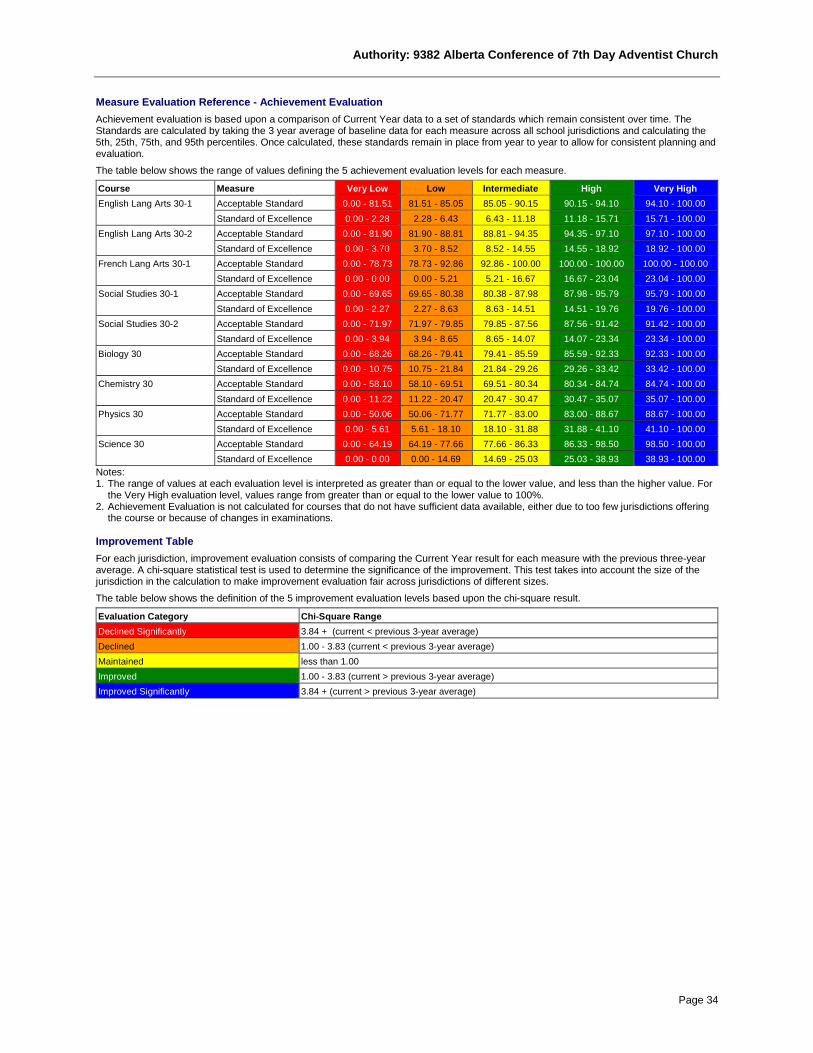
Measure Evaluation Reference - Achievement Evaluation Achievement evaluation is based upon a comparison of Current Year data to a set of standards which remain consistent over time. The Standards are calculated by taking the 3 year average of baseline data for each measure across all school jurisdictions and calculating the 5th, 25th, 75th, and 95th percentiles. Once calculated, these standards remain in place from year to year to allow for consistent planning and evaluation. The table below shows the range of values defining the 5 achievement evaluation levels for each measure.
Course Measure Very Low Low Intermediate High Very High English Lang Arts 30-1 Acceptable Standard 0.00 - 81.51 81.51 - 85.05 85.05 - 90.15 90.15 - 94.10 94.10 - 100.00
Standard of Excellence 0.00 - 2.28 2.28 - 6.43 6.43 - 11.18 11.18 - 15.71 15.71 - 100.00 English Lang Arts 30-2 Acceptable Standard 0.00 - 81.90 81.90 - 88.81 88.81 - 94.35 94.35 - 97.10 97.10 - 100.00
Standard of Excellence 0.00 - 3.70 3.70 - 8.52 8.52 - 14.55 14.55 - 18.92 18.92 - 100.00 French Lang Arts 30-1 Acceptable Standard 0.00 - 78.73 78.73 - 92.86 92.86 - 100.00 100.00 - 100.00 100.00 - 100.00
Standard of Excellence 0.00 - 0.00 0.00 - 5.21 5.21 - 16.67 16.67 - 23.04 23.04 - 100.00 Social Studies 30-1 Acceptable Standard 0.00 - 69.65 69.65 - 80.38 80.38 - 87.98 87.98 - 95.79 95.79 - 100.00
Standard of Excellence 0.00 - 2.27 2.27 - 8.63 8.63 - 14.51 14.51 - 19.76 19.76 - 100.00 Social Studies 30-2 Acceptable Standard 0.00 - 71.97 71.97 - 79.85 79.85 - 87.56 87.56 - 91.42 91.42 - 100.00
Standard of Excellence 0.00 - 3.94 3.94 - 8.65 8.65 - 14.07 14.07 - 23.34 23.34 - 100.00 Biology 30 Acceptable Standard 0.00 - 68.26 68.26 - 79.41 79.41 - 85.59 85.59 - 92.33 92.33 - 100.00
Standard of Excellence 0.00 - 10.75 10.75 - 21.84 21.84 - 29.26 29.26 - 33.42 33.42 - 100.00 Chemistry 30 Acceptable Standard 0.00 - 58.10 58.10 - 69.51 69.51 - 80.34 80.34 - 84.74 84.74 - 100.00
Standard of Excellence 0.00 - 11.22 11.22 - 20.47 20.47 - 30.47 30.47 - 35.07 35.07 - 100.00 Physics 30 Acceptable Standard 0.00 - 50.06 50.06 - 71.77 71.77 - 83.00 83.00 - 88.67 88.67 - 100.00
Standard of Excellence 0.00 - 5.61 5.61 - 18.10 18.10 - 31.88 31.88 - 41.10 41.10 - 100.00 Science 30 Acceptable Standard 0.00 - 64.19 64.19 - 77.66 77.66 - 86.33 86.33 - 98.50 98.50 - 100.00
Standard of Excellence 0.00 - 0.00 0.00 - 14.69 14.69 - 25.03 25.03 - 38.93 38.93 - 100.00 Notes: 1. The range of values at each evaluation level is interpreted as greater than or equal to the lower value, and less than the higher value. For
the Very High evaluation level, values range from greater than or equal to the lower value to 100%. 2. Achievement Evaluation is not calculated for courses that do not have sufficient data available, either due to too few jurisdictions offering
the course or because of changes in examinations. Improvement Table For each jurisdiction, improvement evaluation consists of comparing the Current Year result for each measure with the previous three-year average. A chi-square statistical test is used to determine the significance of the improvement. This test takes into account the size of the jurisdiction in the calculation to make improvement evaluation fair across jurisdictions of different sizes. The table below shows the definition of the 5 improvement evaluation levels based upon the chi-square result.
Evaluation Category Chi-Square Range Declined Significantly 3.84 + (current < previous 3-year average) Declined 1.00 - 3.83 (current < previous 3-year average) Maintained less than 1.00 Improved 1.00 - 3.83 (current > previous 3-year average) Improved Significantly 3.84 + (current > previous 3-year average)

Authority: 9382 Alberta Conference of 7th Day Adventist Church
Page 35
Overall Evaluation Table The overall evaluation combines the Achievement Evaluation and the Improvement Evaluation. The table below illustrates how the Achievement and Improvement evaluations are combined to get the overall evaluation.
Achievement Very High High Intermediate Low Very Low Improved Significantly Excellent Good Good Good Acceptable Improved Excellent Good Good Acceptable Issue Maintained Excellent Good Acceptable Issue Concern Declined Good Acceptable Issue Issue Concern Declined Significantly Acceptable Issue Issue Concern Concern
Authority: 9382 Alberta Conference of 7th Day Adventist Church
Page 36
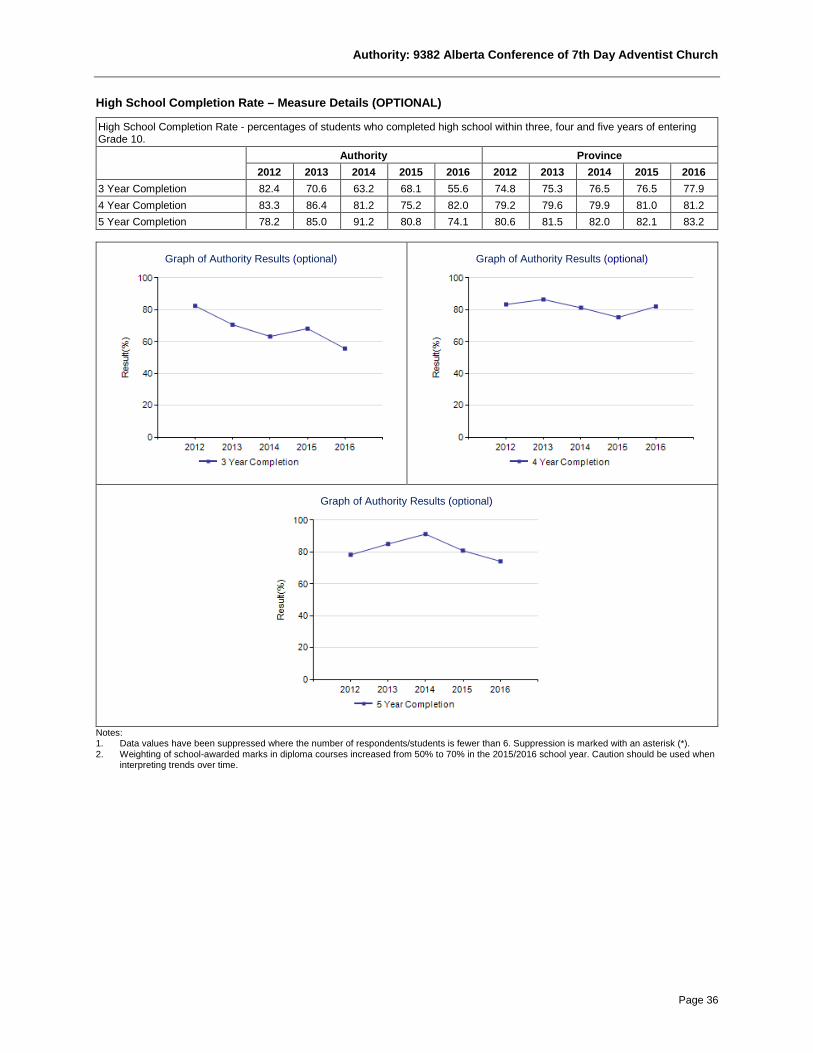
High School Completion Rate – Measure Details (OPTIONAL)
High School Completion Rate - percentages of students who completed high school within three, four and five years of entering Grade 10. Authority Province
2012 2013 2014 2015 2016 2012 2013 2014 2015 2016 3 Year Completion 82.4 70.6 63.2 68.1 55.6 74.8 75.3 76.5 76.5 77.9 4 Year Completion 83.3 86.4 81.2 75.2 82.0 79.2 79.6 79.9 81.0 81.2 5 Year Completion 78.2 85.0 91.2 80.8 74.1 80.6 81.5 82.0 82.1 83.2
Graph of Authority Results (optional)
Graph of Authority Results (optional)
Graph of Authority Results (optional)
Notes: 1. Data values have been suppressed where the number of respondents/students is fewer than 6. Suppression is marked with an asterisk (*). 2. Weighting of school-awarded marks in diploma courses increased from 50% to 70% in the 2015/2016 school year. Caution should be used when
interpreting trends over time.
Authority: 9382 Alberta Conference of 7th Day Adventist Church
Page 37
Drop Out Rate – Measure Details (OPTIONAL)
Drop Out Rate - annual dropout rate of students aged 14 to 18 Authority Province
2012 2013 2014 2015 2016 2012 2013 2014 2015 2016 Drop Out Rate 4.7 2.0 3.7 5.9 0.6 3.6 3.3 3.5 3.2 3.0 Returning Rate * 17.9 * * 12.1 22.8 20.7 20.9 18.2 18.9
Graph of Authority Results (optional)
Graph of Authority Results (optional)
Notes: 1. Data values have been suppressed where the number of respondents/students is fewer than 6. Suppression is marked with an asterisk (*).

Authority: 9382 Alberta Conference of 7th Day Adventist Church
Page 38
High School to Post-secondary Transition Rate – Measure Details (OPTIONAL)
High school to post-secondary transition rate of students within four and six years of entering Grade 10. Authority Province
2012 2013 2014 2015 2016 2012 2013 2014 2015 2016 4 Year Rate 77.8 73.9 49.4 41.3 58.2 39.4 39.7 38.3 37.0 37.0 6 Year Rate 83.4 78.9 97.3 82.6 67.8 59.3 59.0 59.7 59.4 57.9
Graph of Authority Results (optional)
Graph of Authority Results (optional)
Notes: 1. Data values have been suppressed where the number of respondents/students is fewer than 6. Suppression is marked with an asterisk (*).

Authority: 9382 Alberta Conference of 7th Day Adventist Church
Page 39
Rutherford Eligibility Rate – Measure Details (OPTIONAL)
Percentage of Grade 12 students eligible for a Rutherford Scholarship. Authority Province
2012 2013 2014 2015 2016 2012 2013 2014 2015 2016 Rutherford Scholarship Eligibility Rate n/a n/a n/a 95.7 75.0 n/a n/a n/a 60.8 62.3 Rutherford eligibility rate details.
Reporting School Year
Total Students
Grade 10 Rutherford Grade 11 Rutherford Grade 12 Rutherford Overall Number of Students Eligible
Percent of Students Eligible
Number of Students Eligible
Percent of Students Eligible
Number of Students Eligible
Percent of Students Eligible
Number of Students Eligible
Percent of Students Eligible
2012 n/a n/a n/a n/a n/a n/a n/a n/a n/a 2013 n/a n/a n/a n/a n/a n/a n/a n/a n/a 2014 n/a n/a n/a n/a n/a n/a n/a n/a n/a 2015 23 18 78.3 20 87.0 12 52.2 22 95.7 2016 12 9 75.0 9 75.0 6 50.0 9 75.0
Graph of Authority Results (optional)
Notes: 1. Data values have been suppressed where the number of respondents/students is fewer than 6. Suppression is marked with an asterisk (*). 2. Weighting of school-awarded marks in diploma courses increased from 50% to 70% in the 2015/2016 school year. Caution should be used when
interpreting trends over time. 3. Due to the change from previous data source systems to Provincial Approach to Student Information (PASI), historical Rutherford Scholarship
Eligibility Rate results are not available.
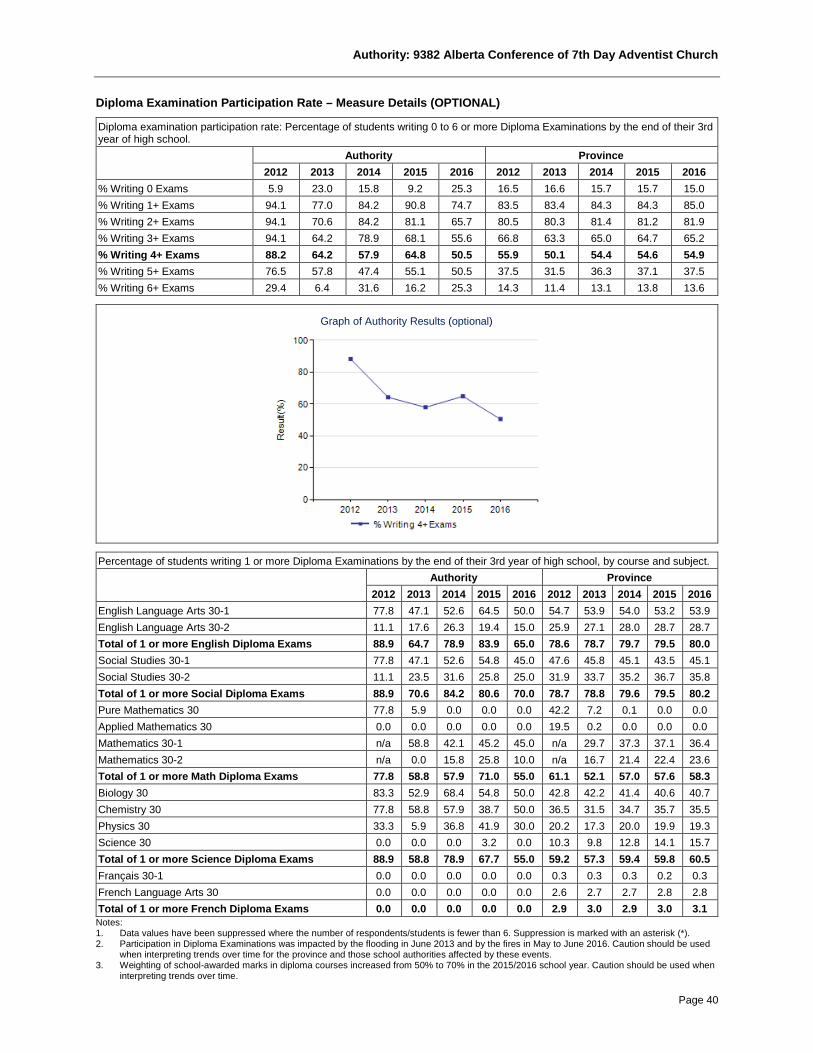
Authority: 9382 Alberta Conference of 7th Day Adventist Church
Page 40
Diploma Examination Participation Rate – Measure Details (OPTIONAL)
Diploma examination participation rate: Percentage of students writing 0 to 6 or more Diploma Examinations by the end of their 3rd year of high school. Authority Province
2012 2013 2014 2015 2016 2012 2013 2014 2015 2016 % Writing 0 Exams 5.9 23.0 15.8 9.2 25.3 16.5 16.6 15.7 15.7 15.0 % Writing 1+ Exams 94.1 77.0 84.2 90.8 74.7 83.5 83.4 84.3 84.3 85.0 % Writing 2+ Exams 94.1 70.6 84.2 81.1 65.7 80.5 80.3 81.4 81.2 81.9 % Writing 3+ Exams 94.1 64.2 78.9 68.1 55.6 66.8 63.3 65.0 64.7 65.2 % Writing 4+ Exams 88.2 64.2 57.9 64.8 50.5 55.9 50.1 54.4 54.6 54.9 % Writing 5+ Exams 76.5 57.8 47.4 55.1 50.5 37.5 31.5 36.3 37.1 37.5 % Writing 6+ Exams 29.4 6.4 31.6 16.2 25.3 14.3 11.4 13.1 13.8 13.6
Graph of Authority Results (optional)
Percentage of students writing 1 or more Diploma Examinations by the end of their 3rd year of high school, by course and subject. Authority Province
2012 2013 2014 2015 2016 2012 2013 2014 2015 2016 English Language Arts 30-1 77.8 47.1 52.6 64.5 50.0 54.7 53.9 54.0 53.2 53.9 English Language Arts 30-2 11.1 17.6 26.3 19.4 15.0 25.9 27.1 28.0 28.7 28.7 Total of 1 or more English Diploma Exams 88.9 64.7 78.9 83.9 65.0 78.6 78.7 79.7 79.5 80.0 Social Studies 30-1 77.8 47.1 52.6 54.8 45.0 47.6 45.8 45.1 43.5 45.1 Social Studies 30-2 11.1 23.5 31.6 25.8 25.0 31.9 33.7 35.2 36.7 35.8 Total of 1 or more Social Diploma Exams 88.9 70.6 84.2 80.6 70.0 78.7 78.8 79.6 79.5 80.2 Pure Mathematics 30 77.8 5.9 0.0 0.0 0.0 42.2 7.2 0.1 0.0 0.0 Applied Mathematics 30 0.0 0.0 0.0 0.0 0.0 19.5 0.2 0.0 0.0 0.0 Mathematics 30-1 n/a 58.8 42.1 45.2 45.0 n/a 29.7 37.3 37.1 36.4 Mathematics 30-2 n/a 0.0 15.8 25.8 10.0 n/a 16.7 21.4 22.4 23.6 Total of 1 or more Math Diploma Exams 77.8 58.8 57.9 71.0 55.0 61.1 52.1 57.0 57.6 58.3 Biology 30 83.3 52.9 68.4 54.8 50.0 42.8 42.2 41.4 40.6 40.7 Chemistry 30 77.8 58.8 57.9 38.7 50.0 36.5 31.5 34.7 35.7 35.5 Physics 30 33.3 5.9 36.8 41.9 30.0 20.2 17.3 20.0 19.9 19.3 Science 30 0.0 0.0 0.0 3.2 0.0 10.3 9.8 12.8 14.1 15.7 Total of 1 or more Science Diploma Exams 88.9 58.8 78.9 67.7 55.0 59.2 57.3 59.4 59.8 60.5 Français 30-1 0.0 0.0 0.0 0.0 0.0 0.3 0.3 0.3 0.2 0.3 French Language Arts 30 0.0 0.0 0.0 0.0 0.0 2.6 2.7 2.7 2.8 2.8 Total of 1 or more French Diploma Exams 0.0 0.0 0.0 0.0 0.0 2.9 3.0 2.9 3.0 3.1 Notes: 1. Data values have been suppressed where the number of respondents/students is fewer than 6. Suppression is marked with an asterisk (*). 2. Participation in Diploma Examinations was impacted by the flooding in June 2013 and by the fires in May to June 2016. Caution should be used
when interpreting trends over time for the province and those school authorities affected by these events. 3. Weighting of school-awarded marks in diploma courses increased from 50% to 70% in the 2015/2016 school year. Caution should be used when
interpreting trends over time.

Authority: 9382 Alberta Conference of 7th Day Adventist Church
Page 41
Citizenship – Measure Details (OPTIONAL)
Percentage of teachers, parents and students who are satisfied that students model the characteristics of active citizenship. Authority Province 2013 2014 2015 2016 2017 2013 2014 2015 2016 2017 Overall 85.4 88.5 88.2 88.1 87.4 83.4 83.4 83.5 83.9 83.7 Teacher 92.6 96.8 98.3 97.4 93.7 93.6 93.8 94.2 94.5 94.0 Parent 88.1 92.0 91.8 95.1 97.2 80.3 81.9 82.1 82.9 82.7 Student 75.4 76.6 74.5 71.9 71.2 76.2 74.5 74.2 74.5 74.4
Graph of Overall Authority Results (optional)
Graph of Detailed Authority Results (optional)
Notes: 1. Data values have been suppressed where the number of respondents/students is fewer than 6. Suppression is marked with an asterisk (*). 2. Survey results for the province and school authorities were impacted by the changes in the number of students responding to the survey through the
introduction of the OurSCHOOL/TTFM (Tell Them From Me) survey in 2014.
Work Preparation – Measure Details (OPTIONAL)
Percentage of teachers and parents who agree that students are taught attitudes and behaviours that will make them successful at work when they finish school. Authority Province 2013 2014 2015 2016 2017 2013 2014 2015 2016 2017 Overall 88.3 94.1 91.3 93.5 97.0 80.3 81.2 82.0 82.6 82.7 Teacher 92.7 100.0 97.8 95.6 97.1 89.4 89.3 89.7 90.5 90.4 Parent 83.9 88.2 84.7 91.5 96.8 71.1 73.1 74.2 74.8 75.1
Graph of Overall Authority Results (optional)
Graph of Detailed Authority Results (optional)
Notes: 1. Data values have been suppressed where the number of respondents/students is fewer than 6. Suppression is marked with an asterisk (*).

Authority: 9382 Alberta Conference of 7th Day Adventist Church
Page 42
Lifelong Learning – Measure Details (OPTIONAL)
Percentage of teacher and parent satisfaction that students demonstrate the knowledge, skills and attitudes necessary for lifelong learning. Authority Province 2013 2014 2015 2016 2017 2013 2014 2015 2016 2017 Overall 76.3 79.4 81.5 77.5 81.8 68.5 69.5 70.0 70.7 71.0 Teacher 81.5 81.1 83.5 75.6 81.4 75.7 76.0 76.0 77.3 77.3 Parent 71.2 77.8 79.4 79.4 82.1 61.2 63.0 64.0 64.2 64.8
Graph of Overall Authority Results (optional)
Graph of Detailed Authority Results (optional)
Notes: 1. Data values have been suppressed where the number of respondents/students is fewer than 6. Suppression is marked with an asterisk (*).
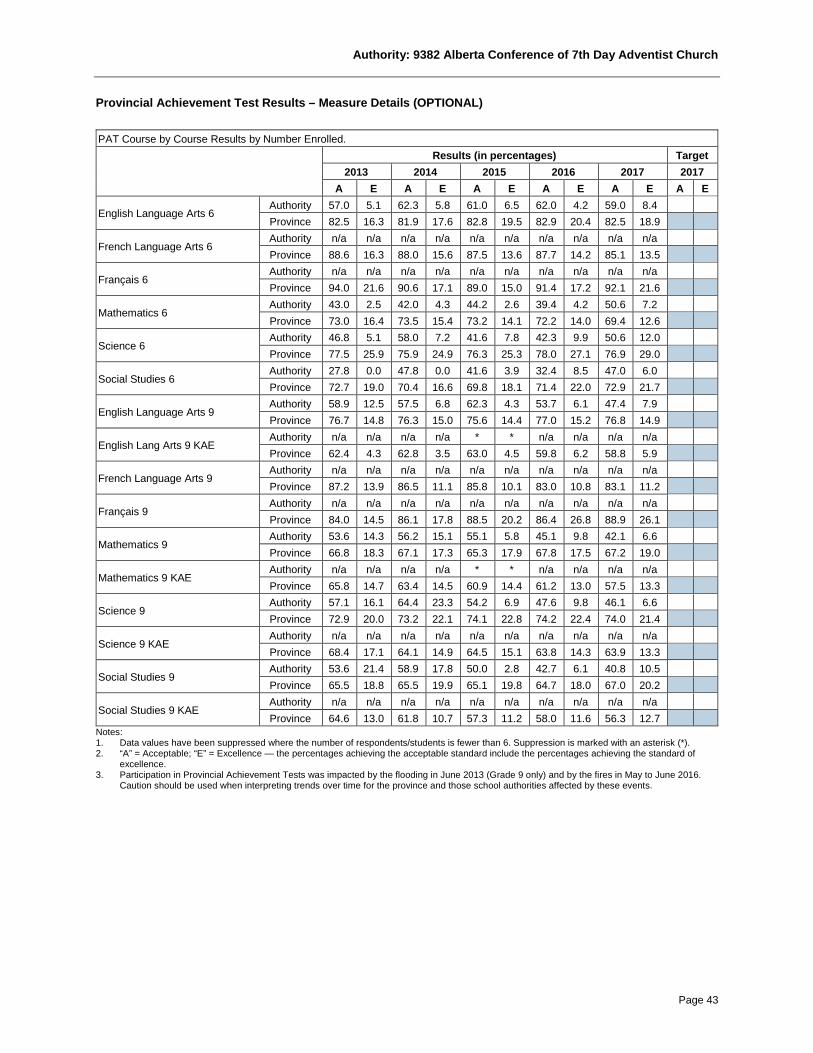
Authority: 9382 Alberta Conference of 7th Day Adventist Church
Page 43
Provincial Achievement Test Results – Measure Details (OPTIONAL) PAT Course by Course Results by Number Enrolled. Results (in percentages) Target
2013 2014 2015 2016 2017 2017 A E A E A E A E A E A E
English Language Arts 6 Authority 57.0 5.1 62.3 5.8 61.0 6.5 62.0 4.2 59.0 8.4 Province 82.5 16.3 81.9 17.6 82.8 19.5 82.9 20.4 82.5 18.9
French Language Arts 6 Authority n/a n/a n/a n/a n/a n/a n/a n/a n/a n/a Province 88.6 16.3 88.0 15.6 87.5 13.6 87.7 14.2 85.1 13.5
Français 6 Authority n/a n/a n/a n/a n/a n/a n/a n/a n/a n/a Province 94.0 21.6 90.6 17.1 89.0 15.0 91.4 17.2 92.1 21.6
Mathematics 6 Authority 43.0 2.5 42.0 4.3 44.2 2.6 39.4 4.2 50.6 7.2 Province 73.0 16.4 73.5 15.4 73.2 14.1 72.2 14.0 69.4 12.6
Science 6 Authority 46.8 5.1 58.0 7.2 41.6 7.8 42.3 9.9 50.6 12.0 Province 77.5 25.9 75.9 24.9 76.3 25.3 78.0 27.1 76.9 29.0
Social Studies 6 Authority 27.8 0.0 47.8 0.0 41.6 3.9 32.4 8.5 47.0 6.0 Province 72.7 19.0 70.4 16.6 69.8 18.1 71.4 22.0 72.9 21.7
English Language Arts 9 Authority 58.9 12.5 57.5 6.8 62.3 4.3 53.7 6.1 47.4 7.9 Province 76.7 14.8 76.3 15.0 75.6 14.4 77.0 15.2 76.8 14.9
English Lang Arts 9 KAE Authority n/a n/a n/a n/a * * n/a n/a n/a n/a Province 62.4 4.3 62.8 3.5 63.0 4.5 59.8 6.2 58.8 5.9
French Language Arts 9 Authority n/a n/a n/a n/a n/a n/a n/a n/a n/a n/a Province 87.2 13.9 86.5 11.1 85.8 10.1 83.0 10.8 83.1 11.2
Français 9 Authority n/a n/a n/a n/a n/a n/a n/a n/a n/a n/a Province 84.0 14.5 86.1 17.8 88.5 20.2 86.4 26.8 88.9 26.1
Mathematics 9 Authority 53.6 14.3 56.2 15.1 55.1 5.8 45.1 9.8 42.1 6.6 Province 66.8 18.3 67.1 17.3 65.3 17.9 67.8 17.5 67.2 19.0
Mathematics 9 KAE Authority n/a n/a n/a n/a * * n/a n/a n/a n/a Province 65.8 14.7 63.4 14.5 60.9 14.4 61.2 13.0 57.5 13.3
Science 9 Authority 57.1 16.1 64.4 23.3 54.2 6.9 47.6 9.8 46.1 6.6 Province 72.9 20.0 73.2 22.1 74.1 22.8 74.2 22.4 74.0 21.4
Science 9 KAE Authority n/a n/a n/a n/a n/a n/a n/a n/a n/a n/a Province 68.4 17.1 64.1 14.9 64.5 15.1 63.8 14.3 63.9 13.3
Social Studies 9 Authority 53.6 21.4 58.9 17.8 50.0 2.8 42.7 6.1 40.8 10.5 Province 65.5 18.8 65.5 19.9 65.1 19.8 64.7 18.0 67.0 20.2
Social Studies 9 KAE Authority n/a n/a n/a n/a n/a n/a n/a n/a n/a n/a Province 64.6 13.0 61.8 10.7 57.3 11.2 58.0 11.6 56.3 12.7
Notes: 1. Data values have been suppressed where the number of respondents/students is fewer than 6. Suppression is marked with an asterisk (*). 2. “A” = Acceptable; “E” = Excellence — the percentages achieving the acceptable standard include the percentages achieving the standard of
excellence. 3. Participation in Provincial Achievement Tests was impacted by the flooding in June 2013 (Grade 9 only) and by the fires in May to June 2016.
Caution should be used when interpreting trends over time for the province and those school authorities affected by these events.

Authority: 9382 Alberta Conference of 7th Day Adventist Church
Page 44
Graph of Overall Provincial Achievement Test Results (optional)
Notes: 1. Data values have been suppressed where the number of respondents/students is fewer than 6. Suppression is marked with an asterisk (*). 2. Participation in Provincial Achievement Tests was impacted by the flooding in June 2013 (Grade 9 only) and by the fires in May to June 2016.
Caution should be used when interpreting trends over time for the province and those school authorities affected by these events.
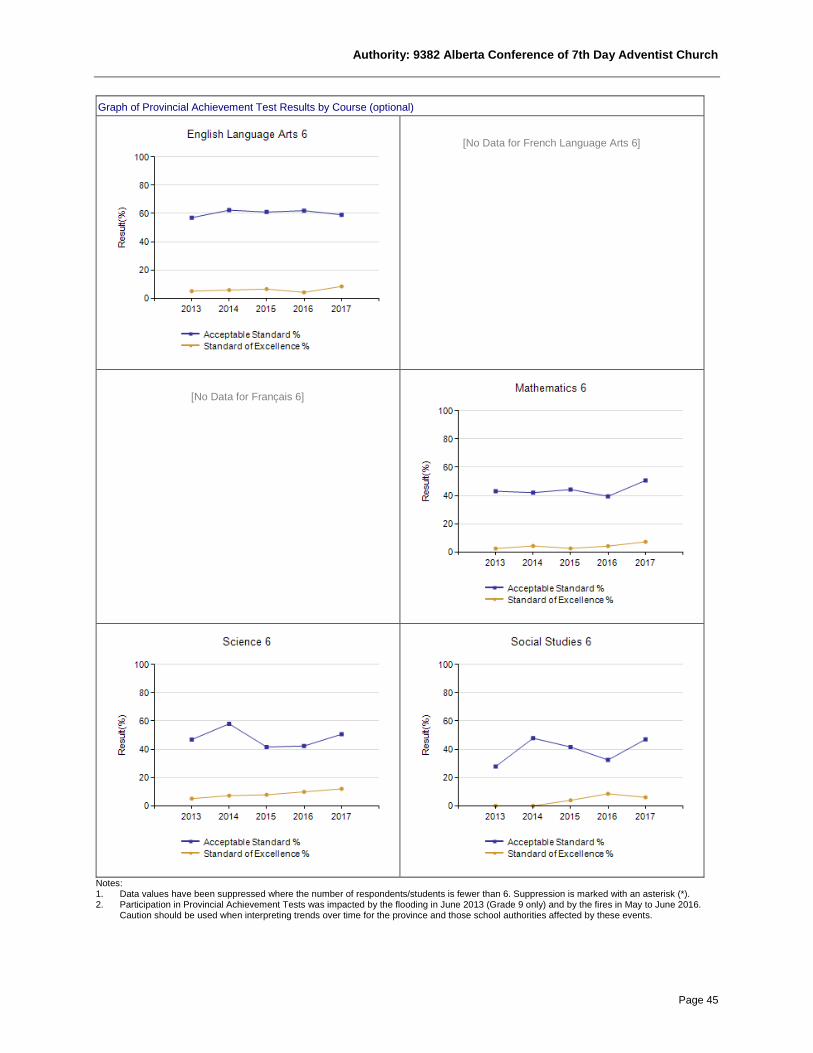
Authority: 9382 Alberta Conference of 7th Day Adventist Church
Page 45
Graph of Provincial Achievement Test Results by Course (optional)
[No Data for French Language Arts 6]
[No Data for Français 6]
Notes: 1. Data values have been suppressed where the number of respondents/students is fewer than 6. Suppression is marked with an asterisk (*). 2. Participation in Provincial Achievement Tests was impacted by the flooding in June 2013 (Grade 9 only) and by the fires in May to June 2016.
Caution should be used when interpreting trends over time for the province and those school authorities affected by these events.

Authority: 9382 Alberta Conference of 7th Day Adventist Church
Page 46
Graph of Provincial Achievement Test Results by Course (optional)
[No Data for English Lang Arts 9 KAE]
[No Data for French Language Arts 9]
[No Data for Français 9]
[No Data for Mathematics 9 KAE]
Notes: 1. Data values have been suppressed where the number of respondents/students is fewer than 6. Suppression is marked with an asterisk (*). 2. Participation in Provincial Achievement Tests was impacted by the flooding in June 2013 (Grade 9 only) and by the fires in May to June 2016.
Caution should be used when interpreting trends over time for the province and those school authorities affected by these events.

Authority: 9382 Alberta Conference of 7th Day Adventist Church
Page 47
Graph of Provincial Achievement Test Results by Course (optional)
[No Data for Science 9 KAE]
[No Data for Social Studies 9 KAE]
Notes: 1. Data values have been suppressed where the number of respondents/students is fewer than 6. Suppression is marked with an asterisk (*). 2. Participation in Provincial Achievement Tests was impacted by the flooding in June 2013 (Grade 9 only) and by the fires in May to June 2016.
Caution should be used when interpreting trends over time for the province and those school authorities affected by these events.
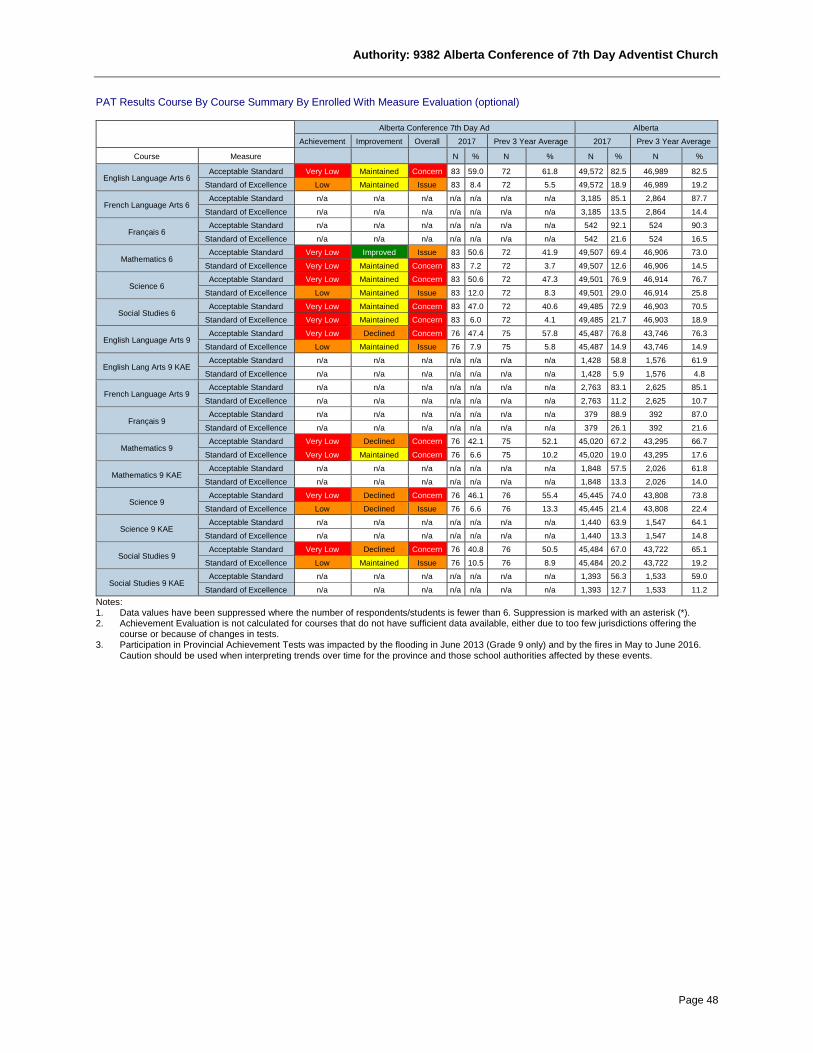
Authority: 9382 Alberta Conference of 7th Day Adventist Church
Page 48
PAT Results Course By Course Summary By Enrolled With Measure Evaluation (optional)
Alberta Conference 7th Day Ad Alberta
Achievement Improvement Overall 2017 Prev 3 Year Average 2017 Prev 3 Year Average Course Measure N % N % N % N %
English Language Arts 6 Acceptable Standard Very Low Maintained Concern 83 59.0 72 61.8 49,572 82.5 46,989 82.5 Standard of Excellence Low Maintained Issue 83 8.4 72 5.5 49,572 18.9 46,989 19.2
French Language Arts 6 Acceptable Standard n/a n/a n/a n/a n/a n/a n/a 3,185 85.1 2,864 87.7 Standard of Excellence n/a n/a n/a n/a n/a n/a n/a 3,185 13.5 2,864 14.4
Français 6 Acceptable Standard n/a n/a n/a n/a n/a n/a n/a 542 92.1 524 90.3 Standard of Excellence n/a n/a n/a n/a n/a n/a n/a 542 21.6 524 16.5
Mathematics 6 Acceptable Standard Very Low Improved Issue 83 50.6 72 41.9 49,507 69.4 46,906 73.0 Standard of Excellence Very Low Maintained Concern 83 7.2 72 3.7 49,507 12.6 46,906 14.5
Science 6 Acceptable Standard Very Low Maintained Concern 83 50.6 72 47.3 49,501 76.9 46,914 76.7 Standard of Excellence Low Maintained Issue 83 12.0 72 8.3 49,501 29.0 46,914 25.8
Social Studies 6 Acceptable Standard Very Low Maintained Concern 83 47.0 72 40.6 49,485 72.9 46,903 70.5 Standard of Excellence Very Low Maintained Concern 83 6.0 72 4.1 49,485 21.7 46,903 18.9
English Language Arts 9 Acceptable Standard Very Low Declined Concern 76 47.4 75 57.8 45,487 76.8 43,746 76.3 Standard of Excellence Low Maintained Issue 76 7.9 75 5.8 45,487 14.9 43,746 14.9
English Lang Arts 9 KAE Acceptable Standard n/a n/a n/a n/a n/a n/a n/a 1,428 58.8 1,576 61.9 Standard of Excellence n/a n/a n/a n/a n/a n/a n/a 1,428 5.9 1,576 4.8
French Language Arts 9 Acceptable Standard n/a n/a n/a n/a n/a n/a n/a 2,763 83.1 2,625 85.1 Standard of Excellence n/a n/a n/a n/a n/a n/a n/a 2,763 11.2 2,625 10.7
Français 9 Acceptable Standard n/a n/a n/a n/a n/a n/a n/a 379 88.9 392 87.0 Standard of Excellence n/a n/a n/a n/a n/a n/a n/a 379 26.1 392 21.6
Mathematics 9 Acceptable Standard Very Low Declined Concern 76 42.1 75 52.1 45,020 67.2 43,295 66.7 Standard of Excellence Very Low Maintained Concern 76 6.6 75 10.2 45,020 19.0 43,295 17.6
Mathematics 9 KAE Acceptable Standard n/a n/a n/a n/a n/a n/a n/a 1,848 57.5 2,026 61.8 Standard of Excellence n/a n/a n/a n/a n/a n/a n/a 1,848 13.3 2,026 14.0
Science 9 Acceptable Standard Very Low Declined Concern 76 46.1 76 55.4 45,445 74.0 43,808 73.8 Standard of Excellence Low Declined Issue 76 6.6 76 13.3 45,445 21.4 43,808 22.4
Science 9 KAE Acceptable Standard n/a n/a n/a n/a n/a n/a n/a 1,440 63.9 1,547 64.1 Standard of Excellence n/a n/a n/a n/a n/a n/a n/a 1,440 13.3 1,547 14.8
Social Studies 9 Acceptable Standard Very Low Declined Concern 76 40.8 76 50.5 45,484 67.0 43,722 65.1 Standard of Excellence Low Maintained Issue 76 10.5 76 8.9 45,484 20.2 43,722 19.2
Social Studies 9 KAE Acceptable Standard n/a n/a n/a n/a n/a n/a n/a 1,393 56.3 1,533 59.0 Standard of Excellence n/a n/a n/a n/a n/a n/a n/a 1,393 12.7 1,533 11.2
Notes: 1. Data values have been suppressed where the number of respondents/students is fewer than 6. Suppression is marked with an asterisk (*). 2. Achievement Evaluation is not calculated for courses that do not have sufficient data available, either due to too few jurisdictions offering the
course or because of changes in tests. 3. Participation in Provincial Achievement Tests was impacted by the flooding in June 2013 (Grade 9 only) and by the fires in May to June 2016.
Caution should be used when interpreting trends over time for the province and those school authorities affected by these events.

Authority: 9382 Alberta Conference of 7th Day Adventist Church
Page 49
Measure Evaluation Reference - Achievement Evaluation Achievement evaluation is based upon a comparison of Current Year data to a set of standards which remain consistent over time. The Standards are calculated by taking the 3 year average of baseline data for each measure across all school jurisdictions and calculating the 5th, 25th, 75th, and 95th percentiles. Once calculated, these standards remain in place from year to year to allow for consistent planning and evaluation. The table below shows the range of values defining the 5 achievement evaluation levels for each measure.
Course Measure Very Low Low Intermediate High Very High English Language Arts 6 Acceptable Standard 0.00 - 67.95 67.95 - 78.40 78.40 - 86.09 86.09 - 91.37 91.37 - 100.00
Standard of Excellence 0.00 - 6.83 6.83 - 11.65 11.65 - 17.36 17.36 - 22.46 22.46 - 100.00 French Language Arts 6 Acceptable Standard 0.00 - 41.69 41.69 - 73.54 73.54 - 92.32 92.32 - 97.93 97.93 - 100.00
Standard of Excellence 0.00 - 2.72 2.72 - 8.13 8.13 - 15.29 15.29 - 23.86 23.86 - 100.00 Mathematics 6 Acceptable Standard 0.00 - 63.91 63.91 - 70.73 70.73 - 79.61 79.61 - 88.67 88.67 - 100.00
Standard of Excellence 0.00 - 8.53 8.53 - 11.31 11.31 - 18.13 18.13 - 25.17 25.17 - 100.00 Science 6 Acceptable Standard 0.00 - 60.36 60.36 - 78.51 78.51 - 86.46 86.46 - 90.64 90.64 - 100.00
Standard of Excellence 0.00 - 11.74 11.74 - 17.42 17.42 - 25.34 25.34 - 34.31 34.31 - 100.00 Social Studies 6 Acceptable Standard 0.00 - 58.97 58.97 - 68.15 68.15 - 76.62 76.62 - 83.55 83.55 - 100.00
Standard of Excellence 0.00 - 7.30 7.30 - 12.45 12.45 - 19.08 19.08 - 30.09 30.09 - 100.00 English Language Arts 9 Acceptable Standard 0.00 - 63.55 63.55 - 75.66 75.66 - 83.70 83.70 - 90.27 90.27 - 100.00
Standard of Excellence 0.00 - 5.96 5.96 - 9.43 9.43 - 14.72 14.72 - 20.46 20.46 - 100.00 English Lang Arts 9 KAE Acceptable Standard 0.00 - 29.97 29.97 - 53.86 53.86 - 76.19 76.19 - 91.85 91.85 - 100.00
Standard of Excellence 0.00 - 0.00 0.00 - 0.30 0.30 - 10.00 10.00 - 20.31 20.31 - 100.00 French Language Arts 9 Acceptable Standard 0.00 - 67.59 67.59 - 81.33 81.33 - 92.06 92.06 - 97.26 97.26 - 100.00
Standard of Excellence 0.00 - 1.67 1.67 - 6.81 6.81 - 17.11 17.11 - 28.68 28.68 - 100.00 Mathematics 9 Acceptable Standard 0.00 - 52.42 52.42 - 60.73 60.73 - 73.88 73.88 - 78.00 78.00 - 100.00
Standard of Excellence 0.00 - 8.18 8.18 - 12.49 12.49 - 18.10 18.10 - 24.07 24.07 - 100.00 Mathematics 9 KAE Acceptable Standard 0.00 - 28.14 28.14 - 53.85 53.85 - 75.83 75.83 - 94.44 94.44 - 100.00
Standard of Excellence 0.00 - 0.00 0.00 - 6.07 6.07 - 20.43 20.43 - 31.67 31.67 - 100.00 Science 9 Acceptable Standard 0.00 - 50.57 50.57 - 60.14 60.14 - 72.50 72.50 - 76.89 76.89 - 100.00
Standard of Excellence 0.00 - 3.39 3.39 - 6.71 6.71 - 11.81 11.81 - 15.85 15.85 - 100.00 Science 9 KAE Acceptable Standard 0.00 - 38.75 38.75 - 59.30 59.30 - 78.33 78.33 - 87.58 87.58 - 100.00
Standard of Excellence 0.00 - 0.00 0.00 - 7.47 7.47 - 21.41 21.41 - 40.82 40.82 - 100.00 Social Studies 9 Acceptable Standard 0.00 - 56.26 56.26 - 62.27 62.27 - 74.04 74.04 - 79.85 79.85 - 100.00
Standard of Excellence 0.00 - 10.03 10.03 - 12.78 12.78 - 19.76 19.76 - 24.03 24.03 - 100.00 Social Studies 9 KAE Acceptable Standard 0.00 - 38.79 38.79 - 53.82 53.82 - 72.42 72.42 - 84.88 84.88 - 100.00
Standard of Excellence 0.00 - 0.00 0.00 - 5.71 5.71 - 17.19 17.19 - 36.26 36.26 - 100.00 Notes: 1. The range of values at each evaluation level is interpreted as greater than or equal to the lower value, and less than the higher value. For the
Very High evaluation level, values range from greater than or equal to the lower value to 100%. 2. Participation in Provincial Achievement Tests was impacted by the flooding in June 2013 (Grade 9 only) and by the fires in May to June 2016.
Caution should be used when interpreting trends over time for the province and those school authorities affected by these events. 3. Achievement Evaluation is not calculated for courses that do not have sufficient data available, either due to too few jurisdictions offering the
course or because of changes in tests. Improvement Table For each jurisdiction, improvement evaluation consists of comparing the Current Year result for each measure with the previous three-year average. A chi-square statistical test is used to determine the significance of the improvement. This test takes into account the size of the jurisdiction in the calculation to make improvement evaluation fair across jurisdictions of different sizes. The table below shows the definition of the 5 improvement evaluation levels based upon the chi-square result.
Evaluation Category Chi-Square Range Declined Significantly 3.84 + (current < previous 3-year average) Declined 1.00 - 3.83 (current < previous 3-year average) Maintained less than 1.00 Improved 1.00 - 3.83 (current > previous 3-year average) Improved Significantly 3.84 + (current > previous 3-year average)
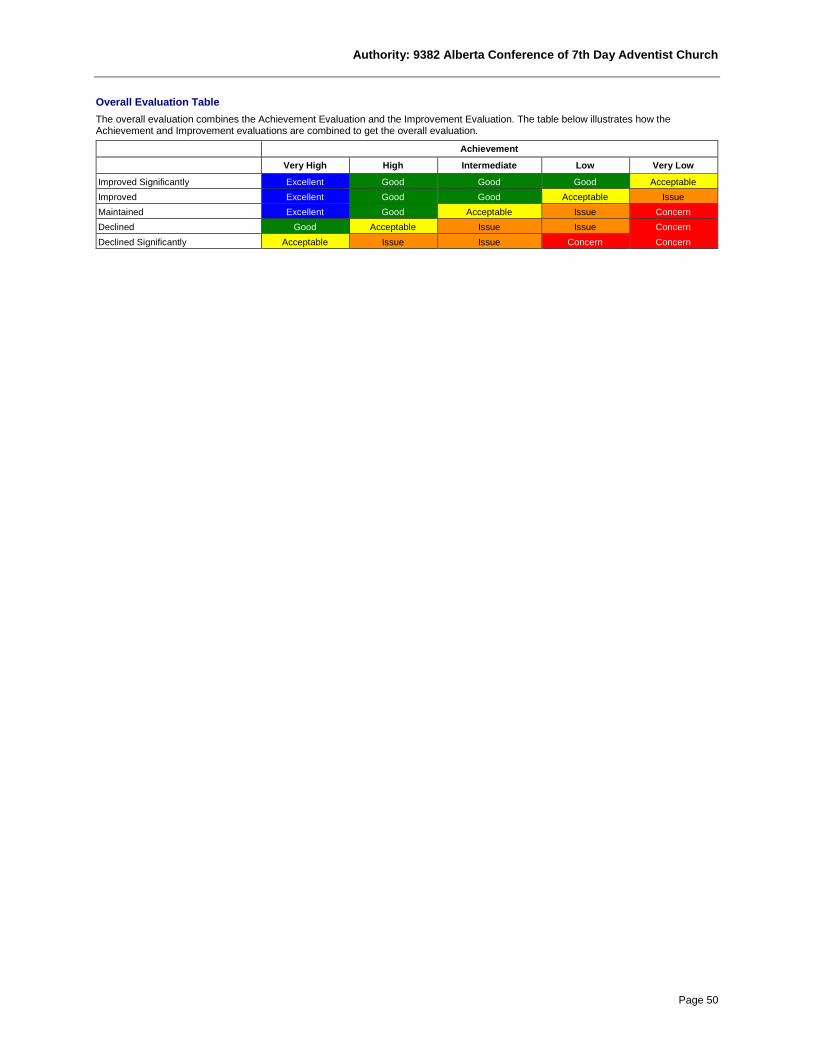
Authority: 9382 Alberta Conference of 7th Day Adventist Church
Page 50
Overall Evaluation Table The overall evaluation combines the Achievement Evaluation and the Improvement Evaluation. The table below illustrates how the Achievement and Improvement evaluations are combined to get the overall evaluation.
Achievement Very High High Intermediate Low Very Low Improved Significantly Excellent Good Good Good Acceptable Improved Excellent Good Good Acceptable Issue Maintained Excellent Good Acceptable Issue Concern Declined Good Acceptable Issue Issue Concern Declined Significantly Acceptable Issue Issue Concern Concern

Authority: 9382 Alberta Conference of 7th Day Adventist Church
Page 51
Program of Studies – Measure Details (OPTIONAL)
Percentage of teachers, parents and students satisfied with the opportunity for students to receive a broad program of studies including fine arts, career, technology, and health and physical education. Authority Province 2013 2014 2015 2016 2017 2013 2014 2015 2016 2017 Overall 74.3 73.0 73.8 76.5 73.6 81.5 81.3 81.3 81.9 81.9 Teacher 77.5 77.6 76.4 80.2 75.0 87.9 87.5 87.2 88.1 88.0 Parent 79.4 84.1 82.8 85.9 84.5 78.9 79.9 79.9 80.1 80.1 Student 65.9 57.4 62.2 63.2 61.3 77.8 76.6 76.9 77.5 77.7
Graph of Overall Authority Results (optional)
Graph of Detailed Authority Results (optional)
Notes: 1. Data values have been suppressed where the number of respondents/students is fewer than 6. Suppression is marked with an asterisk (*). 2. Survey results for the province and school authorities were impacted by the changes in the number of students responding to the survey through the
introduction of the OurSCHOOL/TTFM (Tell Them From Me) survey in 2014.
Parental Involvement – Measure Details (OPTIONAL)
Percentage of teachers and parents satisfied with parental involvement in decisions about their child's education. Authority Province 2013 2014 2015 2016 2017 2013 2014 2015 2016 2017 Overall 87.7 87.4 90.1 89.7 88.5 80.3 80.6 80.7 80.9 81.2 Teacher 85.4 88.4 87.9 92.2 86.1 88.5 88.0 88.1 88.4 88.5 Parent 90.0 86.5 92.2 87.3 90.8 72.2 73.1 73.4 73.5 73.9
Graph of Overall Authority Results (optional)
Graph of Detailed Authority Results (optional)
Notes: 1. Data values have been suppressed where the number of respondents/students is fewer than 6. Suppression is marked with an asterisk (*).
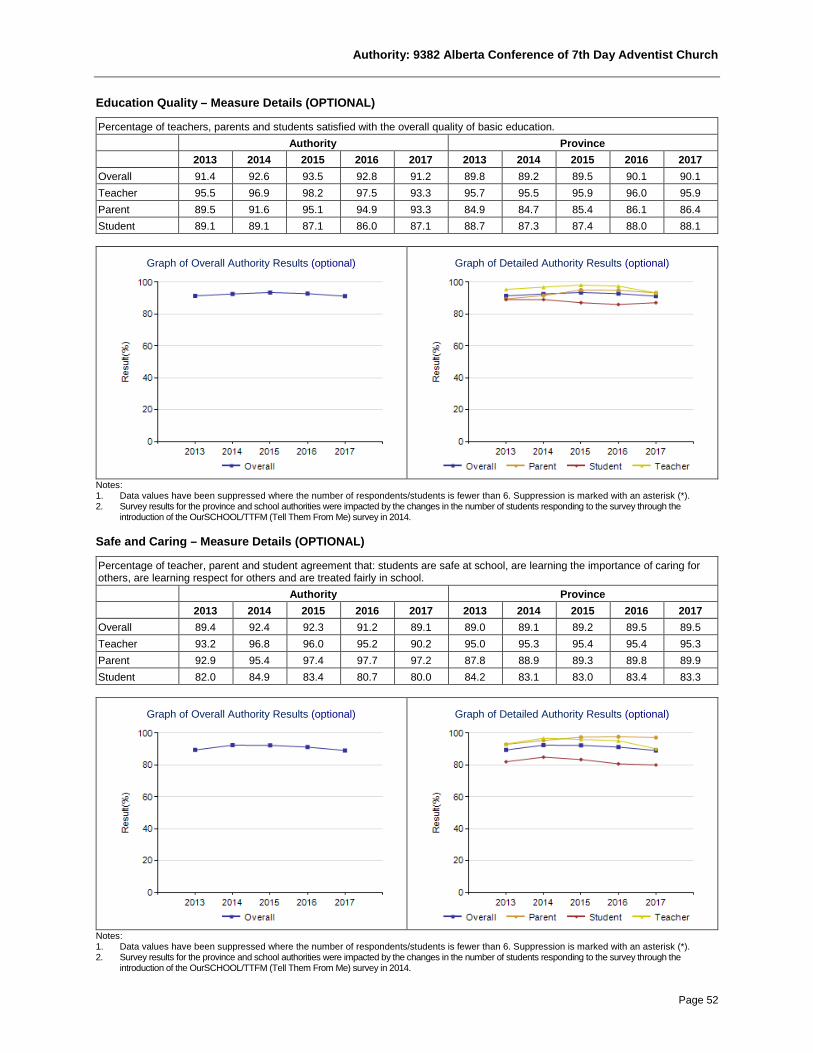
Authority: 9382 Alberta Conference of 7th Day Adventist Church
Page 52
Education Quality – Measure Details (OPTIONAL)
Percentage of teachers, parents and students satisfied with the overall quality of basic education. Authority Province 2013 2014 2015 2016 2017 2013 2014 2015 2016 2017 Overall 91.4 92.6 93.5 92.8 91.2 89.8 89.2 89.5 90.1 90.1 Teacher 95.5 96.9 98.2 97.5 93.3 95.7 95.5 95.9 96.0 95.9 Parent 89.5 91.6 95.1 94.9 93.3 84.9 84.7 85.4 86.1 86.4 Student 89.1 89.1 87.1 86.0 87.1 88.7 87.3 87.4 88.0 88.1
Graph of Overall Authority Results (optional)
Graph of Detailed Authority Results (optional)
Notes: 1. Data values have been suppressed where the number of respondents/students is fewer than 6. Suppression is marked with an asterisk (*). 2. Survey results for the province and school authorities were impacted by the changes in the number of students responding to the survey through the
introduction of the OurSCHOOL/TTFM (Tell Them From Me) survey in 2014.
Safe and Caring – Measure Details (OPTIONAL)
Percentage of teacher, parent and student agreement that: students are safe at school, are learning the importance of caring for others, are learning respect for others and are treated fairly in school. Authority Province 2013 2014 2015 2016 2017 2013 2014 2015 2016 2017 Overall 89.4 92.4 92.3 91.2 89.1 89.0 89.1 89.2 89.5 89.5 Teacher 93.2 96.8 96.0 95.2 90.2 95.0 95.3 95.4 95.4 95.3 Parent 92.9 95.4 97.4 97.7 97.2 87.8 88.9 89.3 89.8 89.9 Student 82.0 84.9 83.4 80.7 80.0 84.2 83.1 83.0 83.4 83.3
Graph of Overall Authority Results (optional)
Graph of Detailed Authority Results (optional)
Notes: 1. Data values have been suppressed where the number of respondents/students is fewer than 6. Suppression is marked with an asterisk (*). 2. Survey results for the province and school authorities were impacted by the changes in the number of students responding to the survey through the
introduction of the OurSCHOOL/TTFM (Tell Them From Me) survey in 2014.
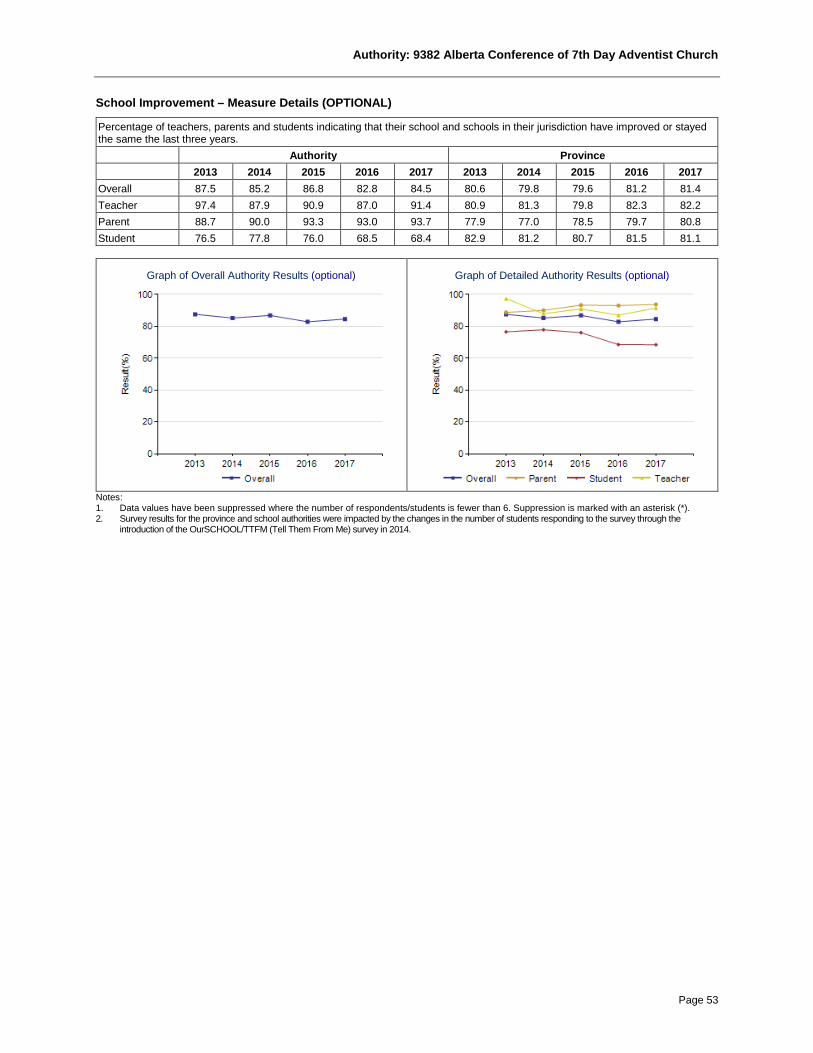
Authority: 9382 Alberta Conference of 7th Day Adventist Church
Page 53
School Improvement – Measure Details (OPTIONAL)
Percentage of teachers, parents and students indicating that their school and schools in their jurisdiction have improved or stayed the same the last three years. Authority Province 2013 2014 2015 2016 2017 2013 2014 2015 2016 2017 Overall 87.5 85.2 86.8 82.8 84.5 80.6 79.8 79.6 81.2 81.4 Teacher 97.4 87.9 90.9 87.0 91.4 80.9 81.3 79.8 82.3 82.2 Parent 88.7 90.0 93.3 93.0 93.7 77.9 77.0 78.5 79.7 80.8 Student 76.5 77.8 76.0 68.5 68.4 82.9 81.2 80.7 81.5 81.1
Graph of Overall Authority Results (optional)
Graph of Detailed Authority Results (optional)
Notes: 1. Data values have been suppressed where the number of respondents/students is fewer than 6. Suppression is marked with an asterisk (*). 2. Survey results for the province and school authorities were impacted by the changes in the number of students responding to the survey through the
introduction of the OurSCHOOL/TTFM (Tell Them From Me) survey in 2014.